8/2/2019 Inc Inert Or Project Final
http://slidepdf.com/reader/full/inc-inert-or-project-final 1/53
Is Energy Recovery from Waste
Incineration the Best Option for Waste
Management in Cornwall? A Quantitative Study of the Proposed Energy from
Waste Plant in Cornwall
By
Nicholas M J Entwistle
5/1/2010
FdSc Renewable Energy Technologies (2008)Supervised by
Michael Hunt
8/2/2019 Inc Inert Or Project Final
http://slidepdf.com/reader/full/inc-inert-or-project-final 2/53
Is Energy Recovery from Waste Incineration the Best Option for Waste Management in Cornwall?
Nicholas M J Entwistle
2 | P a g e
ABSTRACT
This project attempts to quantify claims made of the performance and energy
available to the energy recovery plant proposed by Sita, as the replacement to land
filling for waste management in Cornwall. This is done through collection of data
from documents produced on behalf of Sita by its environmental consultant
Environmental Resource Management, as part of its planning and environmental
permit applications. Data is also collected from papers produced in a study of
Cornwalls‟ waste streams carried out by Measurement Evaluation and Learning on
behalf of Cornwall County Council. This is done in order to evaluate the amount of
energy in the waste, the energy output from the plant and the efficiency of the
plant. This report concludes that ERM have overstated the amount of energy that
there is available in the waste and thus the amount of energy the plant will generate
annually. It is also concluded that the plant does not meet the levels of efficiency
required by the EU to be considered a recovery plant.

8/2/2019 Inc Inert Or Project Final
http://slidepdf.com/reader/full/inc-inert-or-project-final 3/53
Is Energy Recovery from Waste Incineration the Best Option for Waste Management in Cornwall?
Nicholas M J Entwistle
3 | P a g e
1 CONTENTS
1. INTRODUCTION.......................................................................................................................... 4
1.1 Literature Review ................................................................................................................ 5
1.2 Questions Raised ................................................................................................................ 7
1.3 Limitations of Study ........................................................................................................... 9
2 METHODS.................................................................................................................................. 11
2.1 Is the ERM NCV figure Accurate? ................................................................................... 11
2.2 Hydrogen Content Calculations ........................................ Error! Bookmark not defined.
2.3 ERM NCV Calculation....................................................................................................... 15
2.4 What is the NCV for the CCC Waste Composition?..................................................... 16
2.5 What is the efficiency of the CERC? ............................................................................... 16
2.6 What affect do differing CV‟s have on the energy output of the plant? .................. 21
3 RESULTS..................................................................................................................................... 22
3.1 NCV Calculation for ERM and CCC Compostions. ....................................................... 22
3.2 What is the efficiency of the CERC? ............................................................................... 25
3.3 What affect do differing CV‟s have on the energy output of the plant? .................. 26
3.4 Summary of Results.......................................................................................................... 26
4 DISCUSSION.............................................................................................................................. 26
4.1 Is the ERM NCV figure Accurate? ................................................................................... 28
4.2 Possible Source of ERM NCV figure............................................................................... 29
4.2.1 Implication of Increased net GHG emissions ............................................................ 31
4.3 What is the efficiency of the CERC? Does the efficiency meet EU requirements for
recovery?........................................................................................................................................ 32
4.4 Method Improvements .................................................................................................... 34
4.5 Suggestions for Future Study ......................................................................................... 35
5 THE CONCLUSION.................................................................................................................... 38
6 GLOSSARY ................................................................................................................................. 40
7 BIBLIOGRAPHY.......................................................................................................................... 41
APPENDIX 1....................................................................................................................................... 43
8/2/2019 Inc Inert Or Project Final
http://slidepdf.com/reader/full/inc-inert-or-project-final 4/53
Is Energy Recovery from Waste Incineration the Best Option for Waste Management in Cornwall?
Nicholas M J Entwistle
4 | P a g e
1. INTRODUCTION
It has been widely recognised that the available landfill in Cornwall is rapidly
becoming exhausted, of the two operational landfill sites in Cornwall one (United
Mines) is due to cease operation in October 2010, the other site (Connon Bridge) is
due to reach its consented capacity by 2014. However, an extension to the
consented capacity at Connon Bridge could allow the site to operate until 2017
(Sita, 2009). In addition to the impending exhaustion of available landfill, the taxes
for landfill are due to rise drastically in the coming years to encourage methods of
waste management which do not result in the waste being land filled. These taxes,
which are currently set at £48 per tonne from the 1st of April 2010, are due to rise to
£72 per tonne by 2013 (Sita, 2009). Therefore, the need to find an alternative
solution to waste management in Cornwall is an urgent issue.
Sita are a waste management company who from 2006 hold a 30 year contract with
Cornwall County Council (CCC) for the management of its waste. In order to
manage the aforementioned issues Sita have proposed the construction of the
Cornish Energy Recovery Centre (CERC,) an energy from waste (EfW) incinerator to
deal with the county‟s waste whilst recovering useful electricity and heat from the
combustion of the waste.
In this report the author will quantify claims made by Sita of the proposed CERC, in
respect to its suitability as a successor to majority landfill in Cornwall. A
retrospective calculation will be made in order to ascertain whether the amount of
energy in the input waste (Calorific Value, CV), stated as 9.8GJ/tonne by ERM, is
accurate using their own waste composition breakdown and hence questioning its
proposed energy output. The nature of the composition of Cornish waste will also
be investigated and compared to the composition given by Environmental Resource
Management (ERM) on behalf of Sita. The aim of this comparison will be to find out
how the nature of the composition of the waste locally, and its associated differing
8/2/2019 Inc Inert Or Project Final
http://slidepdf.com/reader/full/inc-inert-or-project-final 5/53
Is Energy Recovery from Waste Incineration the Best Option for Waste Management in Cornwall?
Nicholas M J Entwistle
5 | P a g e
CV‟s will affect the potential energy output of the Incinerator, production a more
realistic figure and again questioning ERM‟s proposals.
Although Sita and ERM make no claims about the proposed plants efficiency, they
do provide sufficient information in their Environment Agency permit application
document (ERM, 2008) to be able calculate it. Within this document they do make
claims as to the calorific value (CV) of the waste which is to become the feedstock of
the incinerator and hence energy produced by the incinerator. These claims are in-
substantiated in the document, however they do give a breakdown of the waste
that they are basing their calculations on, which quote national sources for the
information. The generation figures which they give are based on this national CV,
although the figure that they give is at odds with a figure for the CV of municipal
solid waste (MSW), given by the Digest of UK Energy Statistics (DUKES) which gives
an estimated net CV figure of 6.7 GJ per tonne (DUKES, 2008), ERM give a figure of
9.8 GJ per tonne in their documentation (ERM, 2008).
1.1 Literature Review
The contention surrounding the proposed CERC has reached a fever pitch in spring
2010 with the commencement of the appeals process by which Sita hope to
overturn the previously refused planning permission for the plant.
One reason for objecting to the plant is that it results in the destruction of the
waste, much of which is an important reusable or recyclable resource. Broadhurst
states that incineration is fundamentally wrong” (Broadhurst, 2010) because it is a
waste of resources in a world where resource depletion is an increasing problem.
A further reason for objection to the incinerator is that suitable plant efficiency can
only be achieved through the operation of one large plant for the whole of Cornwall
which “precludes localised operation” (Broadhurst, 2010). The problem with one large
plant is that road transport of waste from the whole of Cornwall, compared to
8/2/2019 Inc Inert Or Project Final
http://slidepdf.com/reader/full/inc-inert-or-project-final 6/53
Is Energy Recovery from Waste Incineration the Best Option for Waste Management in Cornwall?
Nicholas M J Entwistle
6 | P a g e
alternative distributed recovery and recycling systems, produces over double the
amount of CO2 emissions for road transport alone (Broadhurst, 2010). This
objection is highlighted by Charmian Larke of Atlantic Energy, who has given figures
of 6671tpa of CO2 emissions for centralised systems vs. 3000tpa for decentralised
recovery systems, See figure 1 below (Larke, February 2009). Alongside increased
road transport, Larke points out that the operation of the incinerator will increase
CO2 equivalent (eq) emissions; “ The incinerator releases 3 million tonnes extra CO 2
eq over 25 years from its operations, and compared to the landfill option releases an
e xtra 3.6 million tonnes CO2 e over the same period.” (Larke, February 2009)
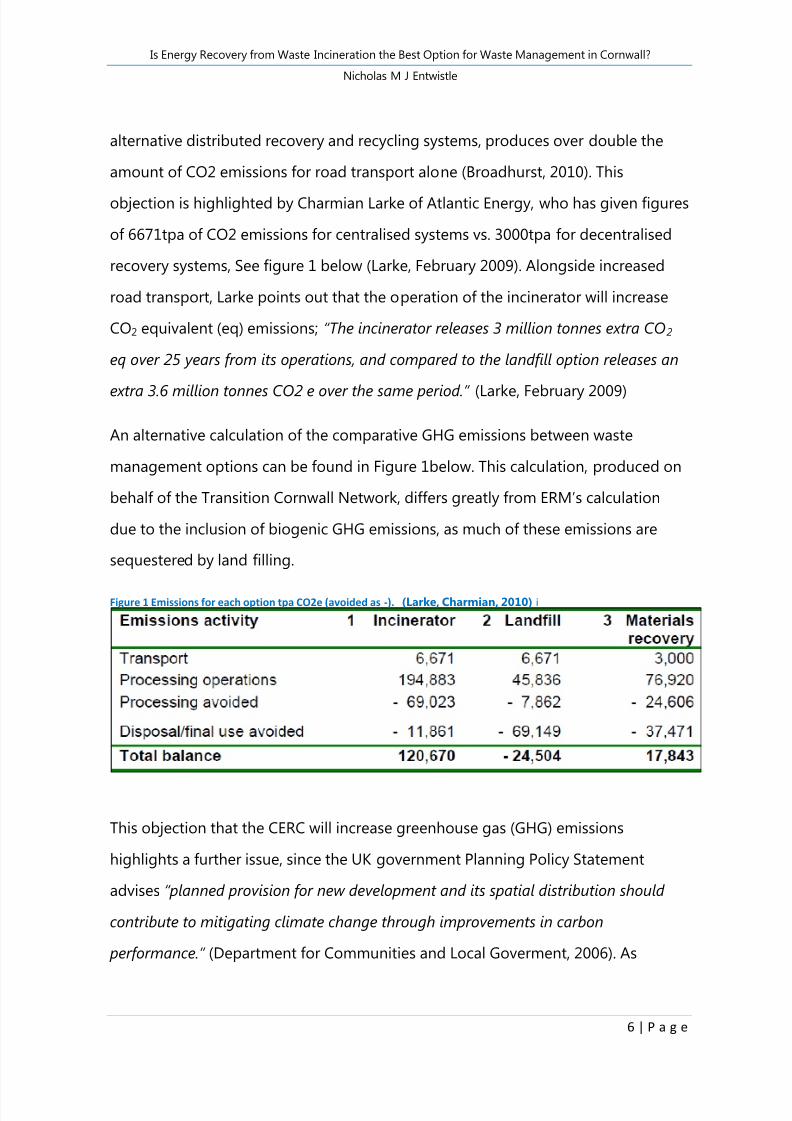
An alternative calculation of the comparative GHG emissions between waste
management options can be found in Figure 1below. This calculation, produced on
behalf of the Transition Cornwall Network, differs greatly from ERM‟s calculation
due to the inclusion of biogenic GHG emissions, as much of these emissions are
sequestered by land filling.
Figure 1 Emissions for each option tpa CO2e (avoided as -). (Larke, Charmian, 2010) i
This objection that the CERC will increase greenhouse gas (GHG) emissions
highlights a further issue, since the UK government Planning Policy Statement
advises “ planned provision for new development and its spatial distribution should
contribute to mitigating climate change through improvements in carbon
performance.” (Department for Communities and Local Goverment, 2006). As

8/2/2019 Inc Inert Or Project Final
http://slidepdf.com/reader/full/inc-inert-or-project-final 7/53
Is Energy Recovery from Waste Incineration the Best Option for Waste Management in Cornwall?
Nicholas M J Entwistle
7 | P a g e
pointed out in the previous paragraphs above by both Larke and Broadhurst
“improvements in carbon performance” are challenged.
A key consideration to which the CERC
development must adhere, is that they must
meet efficiency targets in order to be classed as
„recovery‟ rather than „disposal‟ on the waste
hierarchy (Figure 2). The proposal given by the
„Directive of the European Parliament and of the
Council on Waste‟ states that the “settling of
difficult distinctions via the setting of efficiency
criteria” (Commision of European Communities, 2005) will help in the definition of a
disposal or recovery operation. The efficiencies stated by the commission to
distinguish energy recovery from disposal are “ 0.60 for installations in operation and
permitted in accordance with applicable Community legislation before 1 January
2009 and 0.65 for installations permitted after 31 December 2008” (Commision of
European Communities, 2005). The importance of this is supported by the UK
government in its Planning Policy Statement 10, where it is stated that it intends to
improve waste management in the UK “Through more sustainable waste
management, moving the management of waste up the „waste hierarchy‟ of
reduction, reuse, recycling and composting, using waste as a source of energy, and
only disposing as a last resort” (Office of the Deputy Prime Minister, 2005). This
political intention enshrines the requirement for the CERC to move up the waste
hierarchy in UK planning policy to permit its implementation.
1.2 Questions Raised
Through an investigation of the literature four important questions have become
apparent in order to allow an appraisal of the CERC. These are the questions on
Figure 2 (DEFRA, 2007)
8/2/2019 Inc Inert Or Project Final
http://slidepdf.com/reader/full/inc-inert-or-project-final 8/53
Is Energy Recovery from Waste Incineration the Best Option for Waste Management in Cornwall?
Nicholas M J Entwistle
8 | P a g e
which this report will be focused and they are:
1. Is the ERM NCV figure Accurate?
This will be investigated by retrospectively calculating the NCV for ERM
waste composition and Gross Calorific Values (GCV).
2. What is the NCV for the CCC Waste Composition?
This will be calculated similarly to above though using the CCC waste
composition as its basis. This will allow a comparison between the NCV of
local waste with the national waste breakdown given by ERM.
3. What is the efficiency of the CERC?
Through calculating the efficiency of the plant for both the CCC and the ERM
input values a conclusion can be reached regarding the efficiency of the
CERC incinerator and whether it reaches the EU requirements for recovery
4. What affect do differing CV’s have on the energy output of the plant?
Once the CV‟s calculated from ERM and CCC waste compositions are
available it will be possible to make predictions as to their effect on the
energy output of the CERC.

8/2/2019 Inc Inert Or Project Final
http://slidepdf.com/reader/full/inc-inert-or-project-final 9/53
Is Energy Recovery from Waste Incineration the Best Option for Waste Management in Cornwall?
Nicholas M J Entwistle
9 | P a g e
1.3
Limitations of StudyAlthough this study seeks to answer the questions raised in Section 1.2 as
thoroughly and as accurately as possible, there are a few limiting factors which must
be considered. The study will be limited to the use of secondary source data in
order to produce figures comparable with those given by ERM. This limitation is
because the time and resources required to carry out a detailed investigation into
the composition of Cornish waste streams, are not available to this study. Similarly,
to ascertain the CV‟s of waste through primary techniques is not a feasible for this
study. This means that the same data for GCV of the fractions of the waste
composition will be used in each case (ERM and CCC) to calculate net CV in order to
produce comparable results.
In order to calculate the efficiency of the plant it is only feasible that the author can
do so through data available on technical papers provided by ERM. No primarystudy can be carried out in this respect as the plant is only in the planning phase
and time and resources do not permit this.
Due to time constraints, detailed calculations regarding the comparable CO2 eq
outputs will not be calculated although previous studies in this area will be
referenced in section 4.2.2. In this section there is also a simple calculation of the
effect of differing CV‟s on avoided emissions, but no detailed modelling of the GHG
emissions of the plant are included due to time constraints.
This report is a basis for a comparison with alternative waste management
technologies and techniques. This report quantifies the credentials of the CERC,
however the comparisons are not contained in this report due to time constraints
and the emphasis is placed on quantifying the CERC for the use in future
comparisons

8/2/2019 Inc Inert Or Project Final
http://slidepdf.com/reader/full/inc-inert-or-project-final 10/53
Is Energy Recovery from Waste Incineration the Best Option for Waste Management in Cornwall?
Nicholas M J Entwistle
10 | P a g e
Consequently, having reviewed the literature, raised the questions regarding the
validity of the CERC proposed incinerator and highlighted the limitations of this
study the remainder of this document will describe the methods used and results
found.

8/2/2019 Inc Inert Or Project Final
http://slidepdf.com/reader/full/inc-inert-or-project-final 11/53
Is Energy Recovery from Waste Incineration the Best Option for Waste Management in Cornwall?
Nicholas M J Entwistle
11 | P a g e
2 METHODS
2.1 Is the ERM NCV figure Accurate?
ERM documentation gives a figure of 9.8GJ per tonne for the waste feed stock for
the CERC. This figure is an average net CV figure based on the individual gross CV‟s
of the various fractions of the waste. See Table 1 below for each of the fractions of
waste as specified by ERM in their „Cornwall Energy Recovery Centre‟ document
(ERM, 2008). Net calorific value is the gross calorific value less the latent heat of
evaporation of the water that formed during combustion of the fuel.
Table 1
Waste Composition
Paper and card
Plastic film
Dense plastic
Textiles
Combustibles (Inc absorbent hygiene
products)
Non-combustibles
GlassOrganic (inc wood)
Ferrous metal
Non-ferrous metal
Fine material
WEEE
Hazardous household waste
In order to ascertain whether the NCV value is true, the waste compositions whichrepresent the feedstock from which the CERC will be generating energy were

8/2/2019 Inc Inert Or Project Final
http://slidepdf.com/reader/full/inc-inert-or-project-final 12/53
Is Energy Recovery from Waste Incineration the Best Option for Waste Management in Cornwall?
Nicholas M J Entwistle
12 | P a g e
obtained. These waste compositions are made available in the ERM document
„Assessment of Number of Facilities – Final Report‟ and can be found in Table 1 of
Appendix 1. The formula used to calculate the NCV of each fraction of waste was
retrieved from the Department for Energy and Climate Change guidance notes on
combined heat and power stations (CHPQA) (Department of Energy and Climate
Change, 2008) and was:
Where:
GCVdry = gross calorific value, MJ/kg taken from „Carbon Balances and The
Energy Impacts of the Management of UK Waste‟. (ERM & DEFRA, 2006)
NCVdry = net calorific value, MJ/kg
H = hydrogen content, weight %. See section 2.2.
2.442 = latent heat of vaporisation of water at 25°C, MJ/kg
8.936 = kg of water formed by combustion 1-kg of hydrogen
See the spreadsheet in Appendix 2 for the calculations for the NCV‟s of each
fraction
2.2 Hydrogen Content Calculations
In the formula above the hydrogen content of each fraction had to be calculated
prior to calculating the NCV. It was calculated from data given by a paper entitled
“ water content measurements in household waste using neutron probe; experiences
from field digestion cell and laboratory” (Bergund, 1999) see Table 2 below.

8/2/2019 Inc Inert Or Project Final
http://slidepdf.com/reader/full/inc-inert-or-project-final 13/53
Is Energy Recovery from Waste Incineration the Best Option for Waste Management in Cornwall?
Nicholas M J Entwistle
13 | P a g e
Table 2 H2 content of MSW
The hydrogen contents available did not fit exactly the same waste breakdown
categories as ERM‟s own waste breakdown structure so some approximate
calculations were made as to the hydrogen contents.
For “Paper and Card” H2 contents for paper and cardboard were separately
available from Bergund (1999). In order to calculate the H2 content of “paper
and card” the subdivisions of the category given in Table 1 in Appendix 1, as
given by ERM, were sorted into paper or card. It was calculated that 77.5% of
“paper and card” was paper with 5% H2 content while 22.5% was card with
9.4%H2 content (see Table 3). Overall H2 content of the category was
calculated by:
Where:
Paperc = Paper % composition of paper and card category
Paperh2 = Paper % H2 content
Cardc = Card % of composition of paper and card category
Cardh2 = Card % H2 content.

8/2/2019 Inc Inert Or Project Final
http://slidepdf.com/reader/full/inc-inert-or-project-final 14/53
Is Energy Recovery from Waste Incineration the Best Option for Waste Management in Cornwall?
Nicholas M J Entwistle
14 | P a g e
Table 3 H2 content from Paper and Card Composition
Plastic film, dense plastic and textiles: H2 contents for these fractions of
the waste were taken directly from Table 2 above as the Bergund and ERM
categories matched.
Non Combustibles, Glass, ferrous and non-ferrous metals: H2 contents for
these fractions of the waste were unnecessary as they contribute very little to
the combustion process as they have very low or no calorific value, see Table
3 Appendix1.
Organic (Inc Wood): H2 content was calculated using the same technique as
the “paper and card” fraction, see Table 4 below, allowing Bergunds
categories of Wood and Food Waste to be accumulated under the ERM
heading of Organic (inc Wood).
Table 4 Organic (inc Wood) H2 Content
Combustibles: As the breakdown of the waste category “combustibles”
was made up of very vague sub categories; “unspecified combustibles”
and “other combustibles” and “furniture”, it was not within the resourcesand time available to this study to produce an accurate H2 content for the

8/2/2019 Inc Inert Or Project Final
http://slidepdf.com/reader/full/inc-inert-or-project-final 15/53
Is Energy Recovery from Waste Incineration the Best Option for Waste Management in Cornwall?
Nicholas M J Entwistle
15 | P a g e
combustibles fraction. As all the categories in H2 content table (Table 2)
were combustible, a figure for the average of all these H2 contents was
taken and used as the H2 content for combustibles.
Unclassified Fine Material: Is generally unidentified and so without
primary study of the composition of miscellaneous fine material an
accurate H2 content cannot be calculated. In order to obtain H2 content
for this study the CV‟s of all the fractions were compared and the most
similar to miscellaneous fines was assumed to have similar values for H2
content. Therefore unclassified fine material has been modelled as
“organic kitchen waste” with an H2 content of 4.7%.
Waste Electrical and Electronic Equipment (WEEE): similarly to fines
was difficult to classify. The fraction of the waste was small and for the
purpose of this study the effect of the net CV of WEEE is negligible and
therefore it is acceptable to estimate it this way. Therefore WEEE has been
modelled as textiles with an H2 content of 3.3%
Hazardous Household waste: Again the HHW H2 content was not
available from Bergund and its value was omitted, since the effect that
the omission of a value on the CV calculation is negligible to the accuracy
required by this study this was considered acceptable.
2.3 ERM NCV Calculation
In order to check ERM‟s NCV of 9.8GJ/tonne, the NCV for each fraction needed to
be weighted according to its percentage of the composition and its percentage dry
matter (obtained from the ERM CERC Carbon balances document (Table 2,
Appendix 1)).The moisture content of the waste does not contribute to the
combustion and the, therefore it was important to calculate the % composition of
each waste fraction adjusted for its moisture content using;
(Table 5).

8/2/2019 Inc Inert Or Project Final
http://slidepdf.com/reader/full/inc-inert-or-project-final 16/53
Is Energy Recovery from Waste Incineration the Best Option for Waste Management in Cornwall?
Nicholas M J Entwistle
16 | P a g e
Table 5 Waste Composition – Moisture content
ERM ERM
Waste Composition Composition % % Dry Matter (3) % dry matter of wastePaper and card 13.9% 76.0% 10.6%
Plastic film 3.4% 71.5% 2.4%
Dense plastic 4.0% 89.5% 3.6%
Textiles 3.6% 80.9% 2.9%
Combustibles (Inc absorbent hygiene products) 11.5% 70.0% 8.1%
Non-combustibles 17.1% 94.4% 16.1%
Glass 5.4% 98.2% 5.3%
Organic (inc wood) 27.2% 49.3% 13.4%
Ferrous metal 1.8% 89.0% 1.6%
Non-ferrous metal 0.3% 84.6% 0.3%
Fine material 4.9% 59.0% 2.9%
WEEE 3.6% 89.9% 3.2%
Hazardous household waste 3.3% 89.6% 3.0%
The NCVs were subsequently calculated for each fraction and weighted according
to dry matter and composition, see Appendix 2.
These weighted NCV figures were then summed and the overall NCV of the wastewas obtained. The sum of the weighted NCV‟s discounted the non combustible
fractions of the waste which do not contribute to the production of energy. This
enabled me to calculate an overall NCV for the ERM waste composition and thus
answer question 1 in section 1.1.
2.4 What is the NCV for the CCC Waste Composition?
In order to answer Question 2 raised in Section 1.2, CCC data regarding the
composition of waste in Cornwall was used to calculate a NCV for the local waste,
based on the waste categories defined by ERM and shown in Table 1. The CCC data
was obtained from a study carried out on behalf of the Council by Measurement
Evaluation and Learning (MEL, 2007) and can be found in Appendix 1.
The study of Cornwall‟s waste took into account waste from every economic
demographic category and was divided into 2 phases, phase 1 and 2. The phases

8/2/2019 Inc Inert Or Project Final
http://slidepdf.com/reader/full/inc-inert-or-project-final 17/53
Is Energy Recovery from Waste Incineration the Best Option for Waste Management in Cornwall?
Nicholas M J Entwistle
17 | P a g e
represented the year split into 2, the winter months (phase 1) and the summer
months (phase 2). In order to produce a fair representation of the composition of
the waste it was important to take an average figure for the composition between
these 2 phases.
Where the CCC waste categories did not exactly match the ERM categories,
categories were amalgamated and weighted according to each fraction percentage.
These amalgamated categories were matched in both the ERM and CCC waste
breakdown so that a direct comparison could be made. For example, the organic
waste in the CCC study was named “Putrescibles” and included wood. In the ERM
composition, wood was separate to organic matter so the categories could not be
directly compared. Therefore, the “wood” category in the ERM breakdown was
added to the organic category.
Once the waste breakdown was obtained the same procedure was applied to
determine the NCV for CCC as with ERM in Section 2.1 above. The same figures for; % dry matter, H2 content, and GCV were used, meaning that any differences
highlighted by the comparison was purely due to variation in composition.
2.5 What is the efficiency of the CERC?
In order to calculate the CERCs efficiency and position in the Waste Hierarchy
efficiency calculation, in accordance with EU directives, was carried out using thestated figures for energy input and output given by ERM in their documentation.
The formula used in the calculation was taken from the „Directive of the European
Parliament and of the Council on Waste‟ (Commision of European Communities,
2005) and was:
( )
( )
Where:
8/2/2019 Inc Inert Or Project Final
http://slidepdf.com/reader/full/inc-inert-or-project-final 18/53
Is Energy Recovery from Waste Incineration the Best Option for Waste Management in Cornwall?
Nicholas M J Entwistle
18 | P a g e
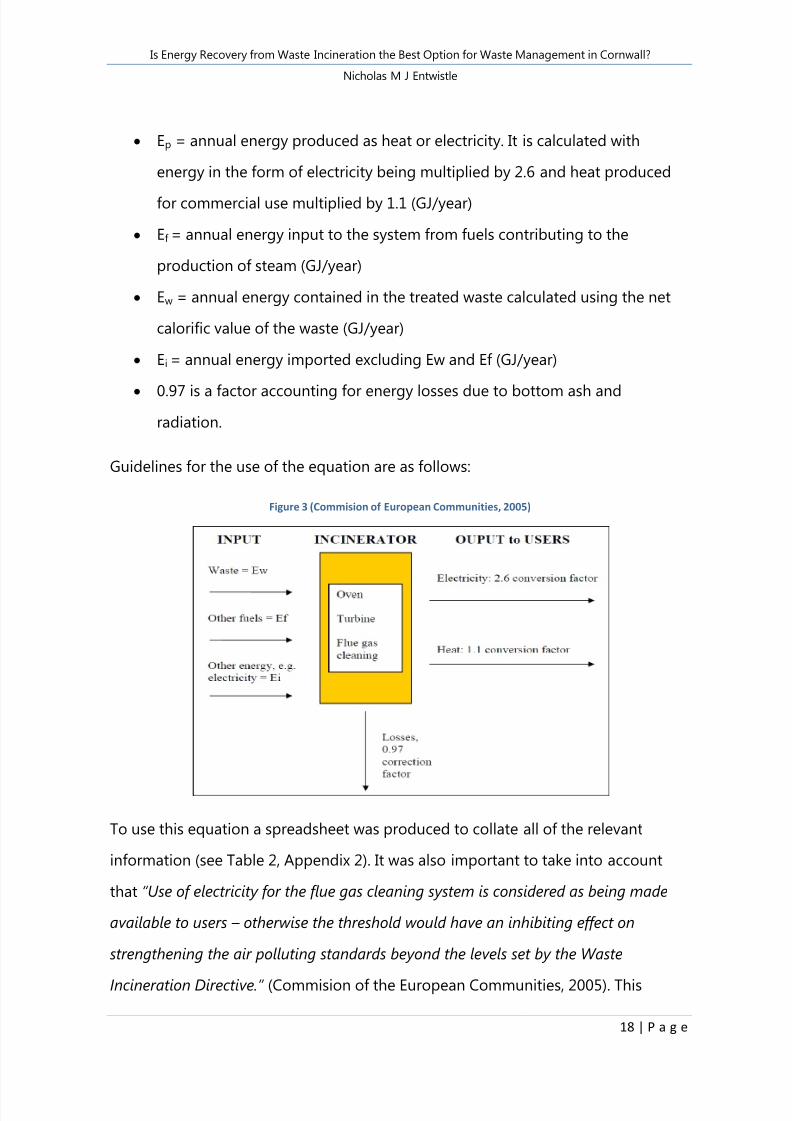
Ep = annual energy produced as heat or electricity. It is calculated with
energy in the form of electricity being multiplied by 2.6 and heat produced
for commercial use multiplied by 1.1 (GJ/year)
Ef = annual energy input to the system from fuels contributing to the
production of steam (GJ/year)
Ew = annual energy contained in the treated waste calculated using the net
calorific value of the waste (GJ/year)
Ei = annual energy imported excluding Ew and Ef (GJ/year)
0.97 is a factor accounting for energy losses due to bottom ash and
radiation.
Guidelines for the use of the equation are as follows: Figure 3 (Commision of European Communities, 2005)
To use this equation a spreadsheet was produced to collate all of the relevant
information (see Table 2, Appendix 2). It was also important to take into account
that “ Use of electricity for the flue gas cleaning system is considered as being made
available to users – otherwise the threshold would have an inhibiting effect on
strengthening the air polluting standards beyond the levels set by the Waste
Incineration Directive.” (Commision of the European Communities, 2005). This

8/2/2019 Inc Inert Or Project Final
http://slidepdf.com/reader/full/inc-inert-or-project-final 19/53
Is Energy Recovery from Waste Incineration the Best Option for Waste Management in Cornwall?
Nicholas M J Entwistle
19 | P a g e
means that the grid electricity used for flue gas treatment (FGT) was considered to
be part of the energy produced (Ep). Other parasitic loads and losses, such as
electricity used on site for administration (lighting etc), are taken into account in the
0.97 “correction factor” in the equation. The factors contributing to the efficiency
calculation were assembled as follows:
Ew was taken from Table 5 below and checked against ERM annual waste
through put of 240000tpa at 9.8 MJ using
= 653333MWh/yr (ERM,
2008)
Ef was taken from Table 5 below. Taking note of the fact that only half of the
oil used contributes to the generation of electricity only half the given oil
consumption figure was used
MWh/yr
Ep was calculated using 125,110MWh/yr taken from Table 5 plus the
electricity used in FGT taken from Table 6, all multiplied by 2.6 as per EU
guidelines. The heat was taken from Table 5 as 35800 MWh/yr and multiplied
by 1.1 as per the guidelines. The resulting equation was: ( ) MWh/yr
Ei Was taken as the annual parasitic imported MWh from Table 6 below and
was 650 MWh/yr
8/2/2019 Inc Inert Or Project Final
http://slidepdf.com/reader/full/inc-inert-or-project-final 20/53
Is Energy Recovery from Waste Incineration the Best Option for Waste Management in Cornwall?
Nicholas M J Entwistle
20 | P a g e
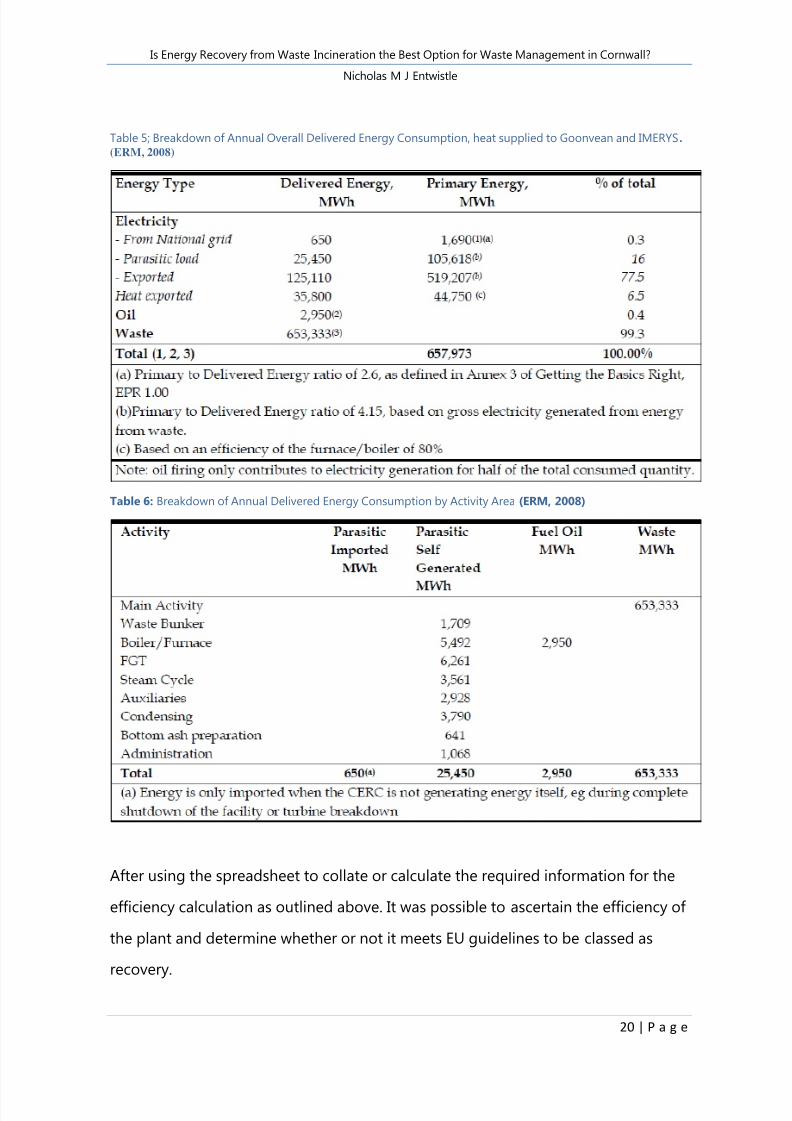
Table 5; Breakdown of Annual Overall Delivered Energy Consumption, heat supplied to Goonvean and IMERYS.
(ERM, 2008)
Table 6: Breakdown of Annual Delivered Energy Consumption by Activity Area (ERM, 2008)
After using the spreadsheet to collate or calculate the required information for the
efficiency calculation as outlined above. It was possible to ascertain the efficiency of
the plant and determine whether or not it meets EU guidelines to be classed as
recovery.
8/2/2019 Inc Inert Or Project Final
http://slidepdf.com/reader/full/inc-inert-or-project-final 21/53
Is Energy Recovery from Waste Incineration the Best Option for Waste Management in Cornwall?
Nicholas M J Entwistle
21 | P a g e
2.6 What affect do differing CV’s have on the energy output of the plant?
To calculate the potential output of the plant based on the ERM and the CCC NCV‟s,
its efficiency was a constant in order demonstrate of the effect of changing the NCV
(see Section 4.5)
Each factor in the efficiency calculation was calculated as a percentage of the total
energy in the waste, for example for the electricity produce it would be:
as a percentage, or
showing that electricity
produced is 19.09% of the total feedstock value of 653333MWh.
It was then assumed that for every initial amount of energy in the waste, that
electricity would make up 19.09% of the total. This assumes that the efficiency of
the plant remains the same even at differing calorific values which is unrealistic and
a limitation of this research. This proportion was calculated for every part of the
efficiency calculation.
This was then the basis of the breakdown of the differing energies available under
differing NCV‟s. The total energy in the waste was calculated as 240000tpa (annual
waste throughput) multiplied by the NCV (divided by 3.6 to convert to MWh). Then
each factor of the efficiency calculation was calculated using their percentage of the
total energy in the waste for that NCV.
Through the use of the methods outlined above, the intention was to gain the
results required to allow the author to tackle the questions raised in Section 1.2. The
results gained from these methods are outlined below in the Results chapter and
followed by a discussion which summarizes the meanings and consequences of the
results obtained.
8/2/2019 Inc Inert Or Project Final
http://slidepdf.com/reader/full/inc-inert-or-project-final 22/53
Is Energy Recovery from Waste Incineration the Best Option for Waste Management in Cornwall?
Nicholas M J Entwistle
22 | P a g e
3 RESULTS
3.1 NCV Calculation for ERM and CCC Compositions.
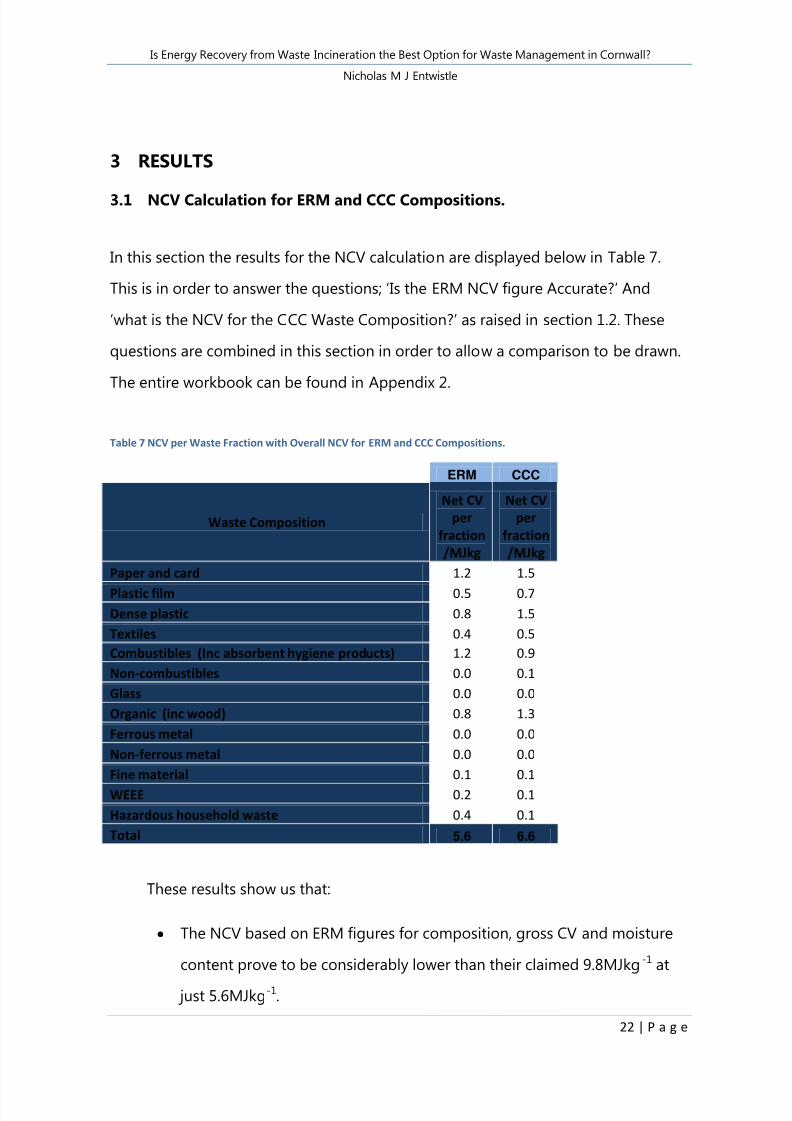
In this section the results for the NCV calculation are displayed below in Table 7.
This is in order to answer the questions; „Is the ERM NCV figure Accurate?‟ And
„what is the NCV for the CCC Waste Composition?‟ as raised in section 1.2. These
questions are combined in this section in order to allow a comparison to be drawn.
The entire workbook can be found in Appendix 2.
Table 7 NCV per Waste Fraction with Overall NCV for ERM and CCC Compositions.
ERM CCC
Waste Composition
Net CV
per
fraction
/MJkg
Net CV
per
fraction
/MJkg
Paper and card 1.2 1.5
Plastic film 0.5 0.7
Dense plastic 0.8 1.5
Textiles 0.4 0.5
Combustibles (Inc absorbent hygiene products) 1.2 0.9
Non-combustibles 0.0 0.1
Glass 0.0 0.0
Organic (inc wood) 0.8 1.3
Ferrous metal 0.0 0.0
Non-ferrous metal 0.0 0.0
Fine material 0.1 0.1WEEE 0.2 0.1
Hazardous household waste 0.4 0.1
Total 5.6 6.6
These results show us that:
The NCV based on ERM figures for composition, gross CV and moisture
content prove to be considerably lower than their claimed 9.8MJkg-1
at just 5.6MJkg-1.

8/2/2019 Inc Inert Or Project Final
http://slidepdf.com/reader/full/inc-inert-or-project-final 23/53
Is Energy Recovery from Waste Incineration the Best Option for Waste Management in Cornwall?
Nicholas M J Entwistle
23 | P a g e
The NCV value based on the CCC figures for composition and ERM
figures for moisture content and GCV is higher than the NCV based on
ERM composition figures. However it is still lower than the stated 9.8MJ
figure at 6.6MJkg-1
The results also show the calorific breakdown of the overall NCV,
indicating which fractions of the waste composition differ between ERM
and CCC. This is indicated in Figure 3 below.
Figure 4 Comparative NCV per Waste Fraction
From Figure 3 it is evident that the CCC composition contains higher NCV‟s for,
most notably, dense plastic and organic (including wood). The ERM composition
contains higher NCV‟s for Combustibles, Fines, WEEE and HHW. However, since the
GCV, H2 content and moisture contents remained constant for the ERM and CCC,
0.0
0.2
0.4
0.6
0.8
1.0
1.2
1.4
1.6
ERM Net CV per fraction /MJkg-1 CCC Net CV per fraction /MJkg-1

8/2/2019 Inc Inert Or Project Final
http://slidepdf.com/reader/full/inc-inert-or-project-final 24/53
Is Energy Recovery from Waste Incineration the Best Option for Waste Management in Cornwall?
Nicholas M J Entwistle
24 | P a g e
the varying NCV‟s are indicative of the varying percentage compositions of each
fraction.
8/2/2019 Inc Inert Or Project Final
http://slidepdf.com/reader/full/inc-inert-or-project-final 25/53
Is Energy Recovery from Waste Incineration the Best Option for Waste Management in Cornwall?
Nicholas M J Entwistle
25 | P a g e
3.2 What is the efficiency of the CERC?
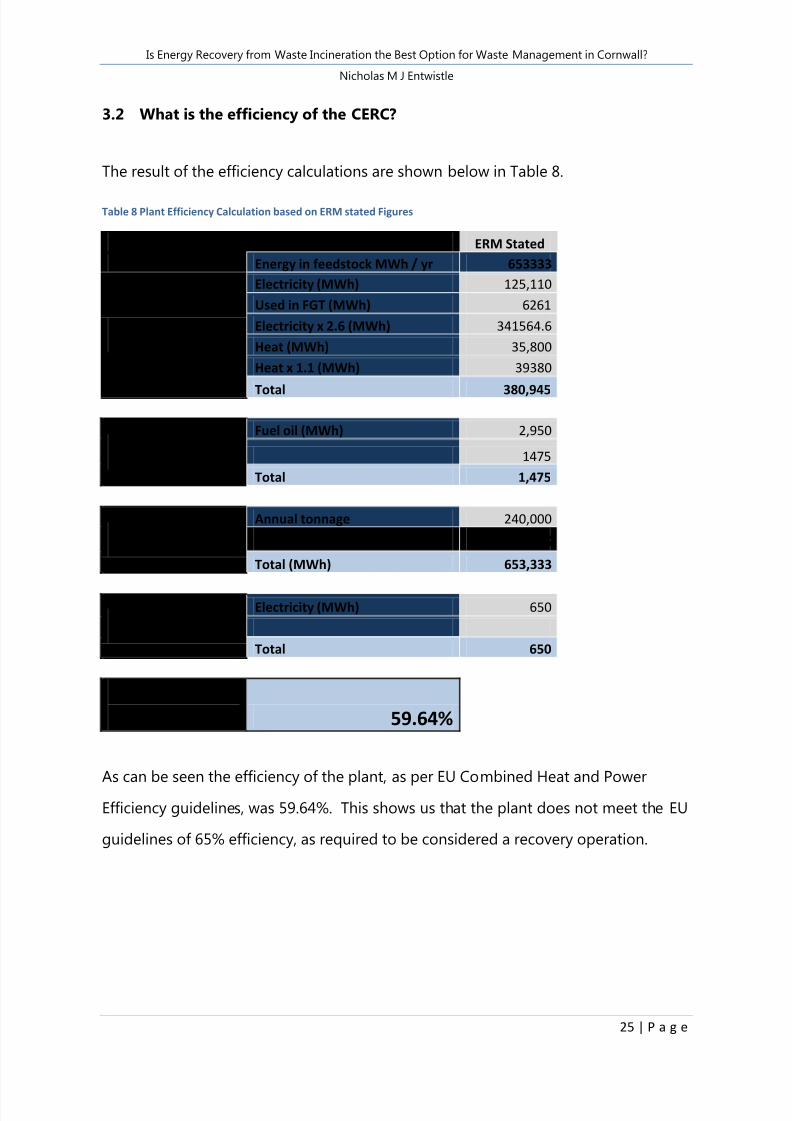
The result of the efficiency calculations are shown below in Table 8.
Table 8 Plant Efficiency Calculation based on ERM stated Figures
Energy efficiency = (Ep - (Ef + Ei))/(0.97 × (Ew + Ef)) ERM Stated
Energy in feedstock MWh / yr 653333
Ep
Electricity (MWh) 125,110
Used in FGT (MWh) 6261
Electricity x 2.6 (MWh) 341564.6
Heat (MWh) 35,800
Heat x 1.1 (MWh) 39380
Total 380,945
Ef Fuel oil (MWh) 2,950
1475
Total 1,475
Ew Annual tonnage 240,000
waste net CV GJ/tonne 9.8
Total (MWh) 653,333
Ei Electricity (MWh) 650
Total 650
System
Efficiency 59.64%
As can be seen the efficiency of the plant, as per EU Combined Heat and Power
Efficiency guidelines, was 59.64%. This shows us that the plant does not meet the EU
guidelines of 65% efficiency, as required to be considered a recovery operation.
8/2/2019 Inc Inert Or Project Final
http://slidepdf.com/reader/full/inc-inert-or-project-final 26/53
Is Energy Recovery from Waste Incineration the Best Option for Waste Management in Cornwall?
Nicholas M J Entwistle
26 | P a g e
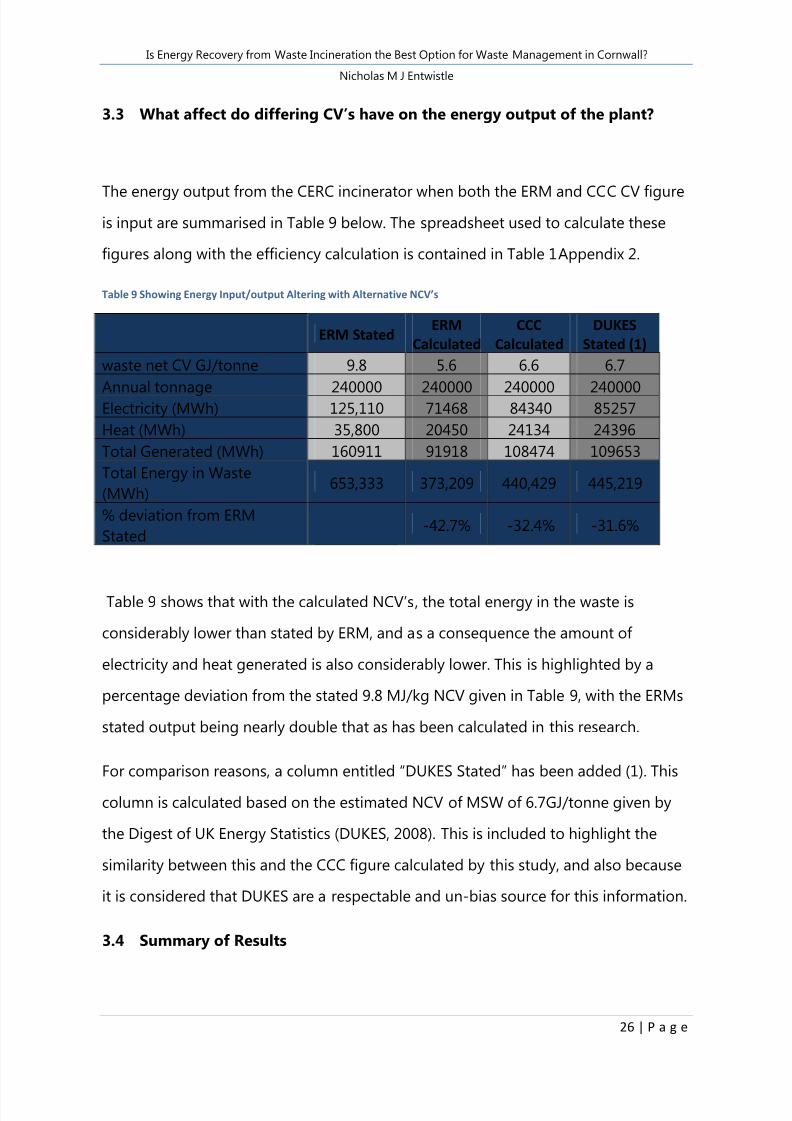
3.3 What affect do differing CV’s have on the energy output of the plant?
The energy output from the CERC incinerator when both the ERM and CCC CV figure
is input are summarised in Table 9 below. The spreadsheet used to calculate these
figures along with the efficiency calculation is contained in Table 1Appendix 2.
Table 9 Showing Energy Input/output Altering with Alternative NCV’s
ERM StatedERM
Calculated
CCC
Calculated
DUKES
Stated (1)
waste net CV GJ/tonne 9.8 5.6 6.6 6.7
Annual tonnage 240000 240000 240000 240000Electricity (MWh) 125,110 71468 84340 85257
Heat (MWh) 35,800 20450 24134 24396
Total Generated (MWh) 160911 91918 108474 109653
Total Energy in Waste
(MWh)653,333 373,209 440,429 445,219
% deviation from ERM
Stated-42.7% -32.4% -31.6%
Table 9 shows that with the calculated NCV‟s, the total energy in the waste is
considerably lower than stated by ERM, and as a consequence the amount of
electricity and heat generated is also considerably lower. This is highlighted by a
percentage deviation from the stated 9.8 MJ/kg NCV given in Table 9, with the ERMs
stated output being nearly double that as has been calculated in this research.
For comparison reasons, a column entitled “DUKES Stated” has been added (1). This
column is calculated based on the estimated NCV of MSW of 6.7GJ/tonne given by
the Digest of UK Energy Statistics (DUKES, 2008). This is included to highlight the
similarity between this and the CCC figure calculated by this study, and also because
it is considered that DUKES are a respectable and un-bias source for this information.
3.4 Summary of Results
8/2/2019 Inc Inert Or Project Final
http://slidepdf.com/reader/full/inc-inert-or-project-final 27/53
Is Energy Recovery from Waste Incineration the Best Option for Waste Management in Cornwall?
Nicholas M J Entwistle
27 | P a g e
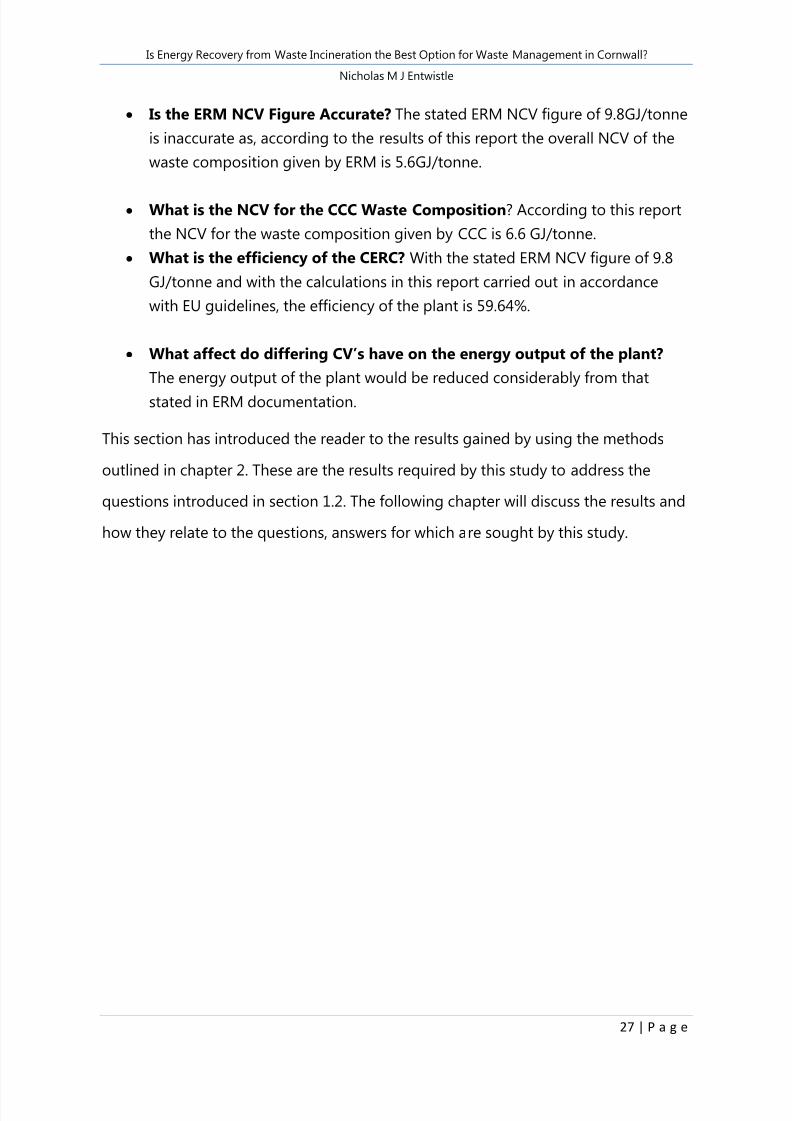
Is the ERM NCV Figure Accurate? The stated ERM NCV figure of 9.8GJ/tonne
is inaccurate as, according to the results of this report the overall NCV of the
waste composition given by ERM is 5.6GJ/tonne.
What is the NCV for the CCC Waste Composition? According to this report
the NCV for the waste composition given by CCC is 6.6 GJ/tonne.
What is the efficiency of the CERC? With the stated ERM NCV figure of 9.8
GJ/tonne and with the calculations in this report carried out in accordance
with EU guidelines, the efficiency of the plant is 59.64%.
What affect do differing CV’s have on the energy output of the plant?
The energy output of the plant would be reduced considerably from that
stated in ERM documentation.
This section has introduced the reader to the results gained by using the methods
outlined in chapter 2. These are the results required by this study to address the
questions introduced in section 1.2. The following chapter will discuss the results and
how they relate to the questions, answers for which are sought by this study.

8/2/2019 Inc Inert Or Project Final
http://slidepdf.com/reader/full/inc-inert-or-project-final 28/53
Is Energy Recovery from Waste Incineration the Best Option for Waste Management in Cornwall?
Nicholas M J Entwistle
28 | P a g e
4 DISCUSSION
In this section the results of the study will be analysed and the consequences of the
results found will be discussed. The impact of the lower CV‟s, reduction in the energy
output from the plant and the plants efficiency will be discussed in terms of their
effects on the suitability of the CERC as a replacement for land filling in Cornwall.
The impacts will also be discussed in terms of their effect on the position within the
waste hierarchy that the CERC will occupy. Conclusions will be drawn as to whether
the CERC is the best option and some comparisons will be made with alternative
options in terms of their comparative global warming potential and position on the
waste hierarchy and feasibility for Cornwall.
4.1 Is the ERM NCV figure Accurate?
The results of this report have shown that the ERM NCV figure is inaccurate. In this
section the possible reasons behind this inaccuracy are discussed.
The fact that the NCV calculated from ERM data is much lower than that provided by
ERM could be indicative of a few things;
Over Estimation of NCV of MSW by ERM on behalf of Sita; it may be case that
ERM and Sita have overestimated the amount of recoverable energy in the
available waste deliberately in order to increase the energy outputs of the
proposed plant (see Section 4.1.2). This seems unlikely though as it is a
dangerous strategy for an application which is so clearly going to meet with
much contention and scrutiny.
ERM figure was not based on waste composition; it is possible that ERM have
not based their figure directly on the waste composition. The author has
drawn this conclusion because the GCV is not made available in any of the
CERC related documents or composition tables, nor any indication of where

8/2/2019 Inc Inert Or Project Final
http://slidepdf.com/reader/full/inc-inert-or-project-final 29/53
Is Energy Recovery from Waste Incineration the Best Option for Waste Management in Cornwall?
Nicholas M J Entwistle
29 | P a g e
the 9.8MJ/kg figure comes from is given. The GCV‟s used in this study were
taken from a previous study by ERM and DEFRA not relating to the CERC (ERM
& DEFRA, 2006)
Error within the study; The guidelines provided by the CHPQA (Department of
Energy and Climate Change, 2008) document have provided a firm basis for
the calculation of NCV‟s for combined heat and power, leading to the authors
confidence in the results achieved. When the results achieved are compared
with the estimated NCV stated by DUKES they stand up favourably with the
DUKES figure standing at 6.7MJkg-1 compared with 6.6MJkg-1 resulting from
local waste composition from this study.
4.2 Possible Source of ERM NCV figure
Where did the ERM NCV figure of 9.8GJ/tonne come from? It is possible that ERM
calculated their overall feedstock NCV retrospectively from plant output and volumesof waste input. ERM state that their method for calculating the electrical output of
the plant is based on an extrapolation of electrical outputs from 3 plants of differing
size (AEA, 2007). These figures can then be used to calculate the overall NCV as
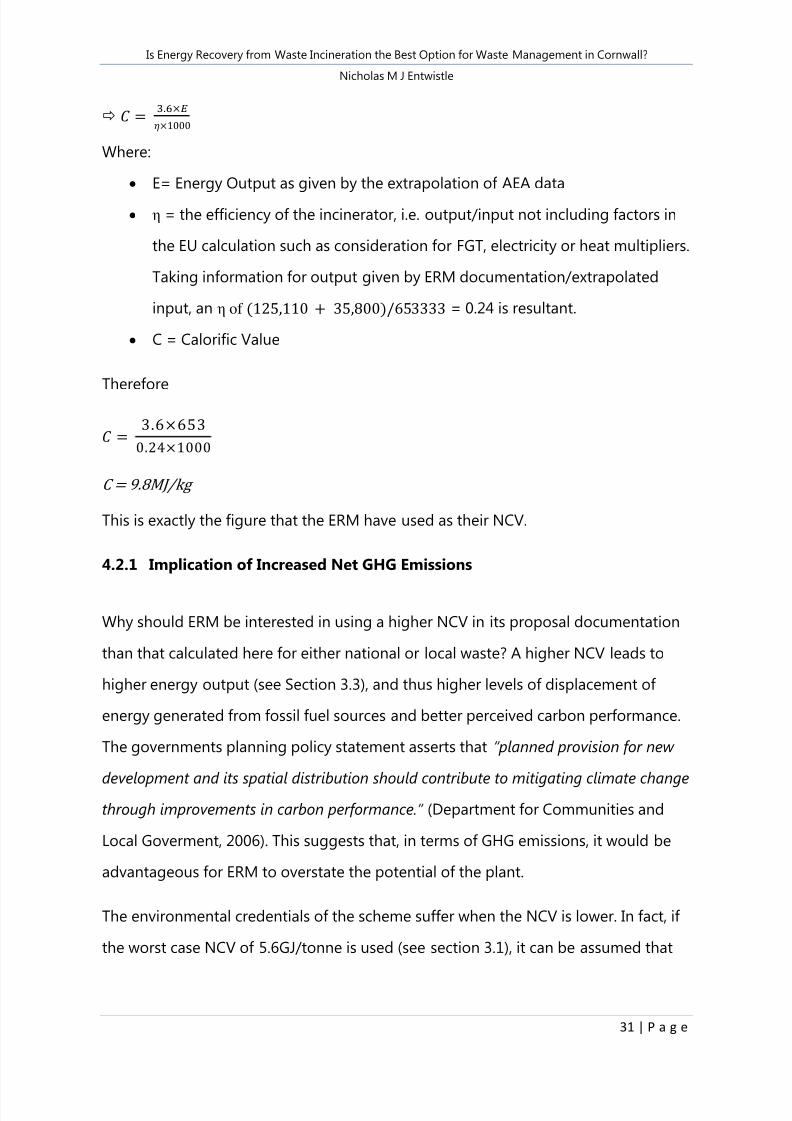
described below. This extrapolation could be interpreted as an erroneous calculation
by ERM, being based on only 3 data points. If the curve represented by the data is
recreated (Figure 6 below), and extrapolated using trend lines, the fit is good.
However, it is clear that this model is not perfect because it shows a plant with 0 tpa
capacity generating 360kwh/t, which is impossible.
8/2/2019 Inc Inert Or Project Final
http://slidepdf.com/reader/full/inc-inert-or-project-final 30/53
Is Energy Recovery from Waste Incineration the Best Option for Waste Management in Cornwall?
Nicholas M J Entwistle
30 | P a g e
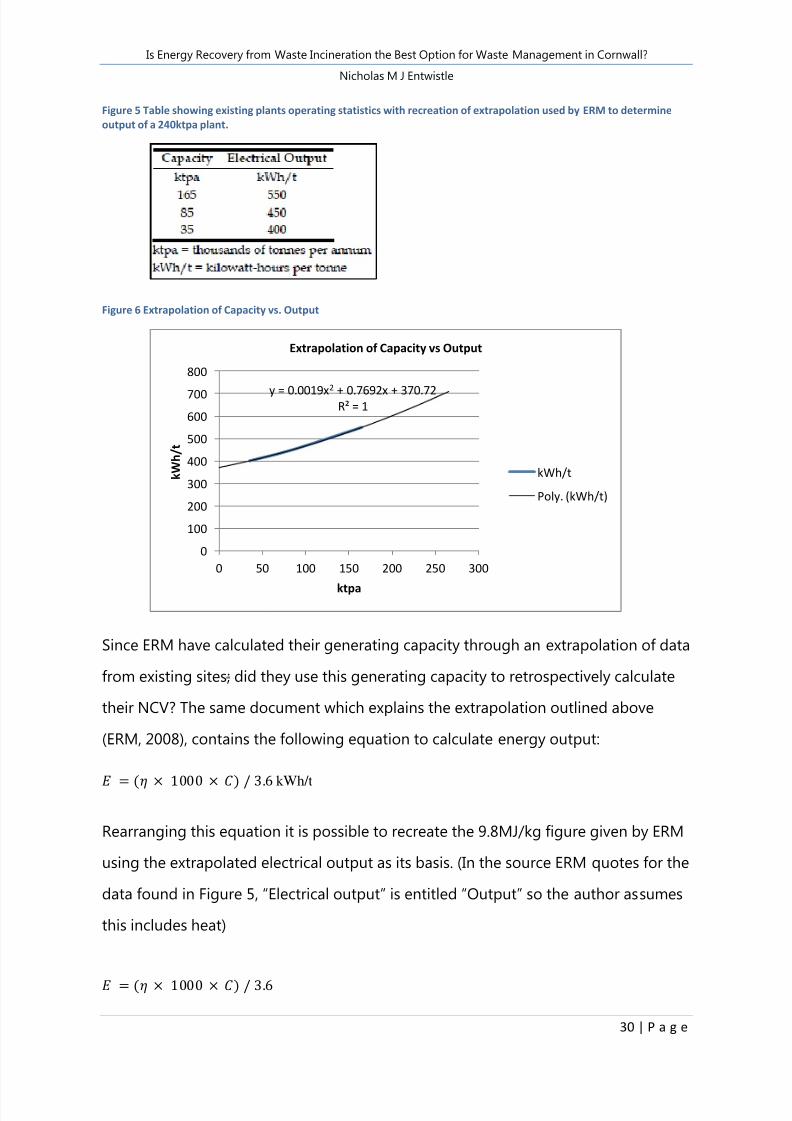
Figure 5 Table showing existing plants operating statistics with recreation of extrapolation used by ERM to determine
output of a 240ktpa plant.
Figure 6 Extrapolation of Capacity vs. Output
Since ERM have calculated their generating capacity through an extrapolation of data
from existing sites; did they use this generating capacity to retrospectively calculate
their NCV? The same document which explains the extrapolation outlined above
(ERM, 2008), contains the following equation to calculate energy output:
kWh/t
Rearranging this equation it is possible to recreate the 9.8MJ/kg figure given by ERM
using the extrapolated electrical output as its basis. (In the source ERM quotes for the
data found in Figure 5, “Electrical output” is entitled “Output” so the author assumes
this includes heat)
y = 0.0019x2 + 0.7692x + 370.72R² = 1
0
100
200
300
400
500
600
700
800
0 50 100 150 200 250 300
k W h / t
ktpa
Extrapolation of Capacity vs Output
kWh/t
Poly. (kWh/t)
8/2/2019 Inc Inert Or Project Final
http://slidepdf.com/reader/full/inc-inert-or-project-final 31/53
Is Energy Recovery from Waste Incineration the Best Option for Waste Management in Cornwall?
Nicholas M J Entwistle
31 | P a g e
Where:
E= Energy Output as given by the extrapolation of AEA data
η = the efficiency of the incinerator, i.e. output/input not including factors in
the EU calculation such as consideration for FGT, electricity or heat multipliers.
Taking information for output given by ERM documentation/extrapolated
input, an η of = 0.24 is resultant. C = Calorific Value
Therefore
C = 9.8MJ/kg
This is exactly the figure that the ERM have used as their NCV.
4.2.1 Implication of Increased Net GHG Emissions
Why should ERM be interested in using a higher NCV in its proposal documentation
than that calculated here for either national or local waste? A higher NCV leads to
higher energy output (see Section 3.3), and thus higher levels of displacement of
energy generated from fossil fuel sources and better perceived carbon performance.
The governments planning policy statement asserts that “ planned provision for new
development and its spatial distribution should contribute to mitigating climate change
through improvements in carbon performance.” (Department for Communities and
Local Goverment, 2006). This suggests that, in terms of GHG emissions, it would be
advantageous for ERM to overstate the potential of the plant.
The environmental credentials of the scheme suffer when the NCV is lower. In fact, if
the worst case NCV of 5.6GJ/tonne is used (see section 3.1), it can be assumed that

8/2/2019 Inc Inert Or Project Final
http://slidepdf.com/reader/full/inc-inert-or-project-final 32/53
Is Energy Recovery from Waste Incineration the Best Option for Waste Management in Cornwall?
Nicholas M J Entwistle
32 | P a g e
the percentage reduction in annual energy produced equates to the percentage
increase in avoided emissions. This effect of this is shown in Table 11.
Table 11 Consequences of lower NCV on Net GHG Emissions
9.8MJ/kg (1) 5.6MJ/kg
Energy in feedstock MWh / yr 653333 374422
percentage difference 42.70%
Mobilisation emissions tpa CO2 eq 3298 3298
Process Emissions tpa CO2 eq 54130 54130
Disposal Emissions tpa CO2 eq 808 808
Avoided Emissions tpa CO2 eq -94847 -54347.33
total tpa CO2 eq -36611 3889
(1) Taken from (ERM, 2008)
This report shows that with the generating capacity 42.7% less than the ERM has
proposed (worst case); the net GHG emissions are positive at 3888.7 tonnes per
annum compared to ERMs stated negative 36611 tonnes per annum.
The author acknowledges that this is a very simplified representation of the effects
on GHG emissions and is intended only as an indication of the effects on GHG
emissions from reduced output.
In summary, the ERM propose that the CERC will be a negative emitter of -36611tpa
of CO2 eq, however using the figure for NCV calculated by this study sees the CERC
as a positive emitter of 3889tpa CO2 eq. This, alongside the arguments in the
literature given by Larke (Larke, Charmian, 2010) and Broadhurst (Broadhurst, 2010)
(Section 1.1) against the incinerator due to increased GHG, reduce its
appropriateness as a new development since it certainly does not mitigate “climate
change through improvements in carbon performance” as requested by the
(Department for Communities and Local Goverment, 2006)
4.3 What is the efficiency of the CERC? Does the efficiency meet EU
requirements for recovery?

8/2/2019 Inc Inert Or Project Final
http://slidepdf.com/reader/full/inc-inert-or-project-final 33/53
Is Energy Recovery from Waste Incineration the Best Option for Waste Management in Cornwall?
Nicholas M J Entwistle
33 | P a g e
The efficiency was calculated using EU guidelines as outlined in section 2.2. The same
guidelines suggest that in order to qualify as a recovery operation, a CHP plant using
MSW for feedstock must meet certain efficiency targets: “0.60 for installations in
operation and permitted in accordance with applicable Community legislation before 1
January 2009 and 0.65 for installations permitted after 31 December 2008” .
(Commision of European Communities, 2005). The calculation carried out by this
study shows that the proposed plant does not meet these guidelines, with an
efficiency of 0.58 (section 3.2, Table 8).
This means that the plant must be classified as disposal and not recovery and
therefore occupies the same level on the waste hierarchy as the existing system of
land filling. This indicates that according to EU guidelines, the CERC will not provide
any environmental advantages when compared to the existing system. This backs up
the argument of Broadhurst when he states that “incineration is fundamentally
wrong” (Broadhurst, 2010) because it is a waste of resources in a world where
resource depletion is an increasing problem. This should seen as a negative for the
implementation of the CERC since in an Environment Agency guidance note entitled
„Your Waste, Your Responsibility‟ which seeks to offer guidance to industry on the
issues of waste and waste management, it is stated that “ You should also consider
government policy. The Government wants the management of waste to „move up the
waste hierarchy ” (Environment Agency, 2007). This guidance from the EA seems
especially applicable, as the information required to calculate the efficiency of the
system was taken from the ERM environmental permit application, which are issued
by the EA.
However, it would be unfair not to point out that the proposal for defining recovery
or disposal operation from efficiency are just that, a proposal. The difficulty with the
equation is that it would apply to plants in the whole of Europe but contains no
provision for variation in localised climactic conditions or weather, which would affect
the efficiency (Commision of the European Communities, 2005). It is possible that if
8/2/2019 Inc Inert Or Project Final
http://slidepdf.com/reader/full/inc-inert-or-project-final 34/53
Is Energy Recovery from Waste Incineration the Best Option for Waste Management in Cornwall?
Nicholas M J Entwistle
34 | P a g e
the CERC efficiency were modelled taking climactic conditions into account it could
lie within the 65% efficiency target.
A further argument, which could define the CERC as a recovery operation, is found in
the UK Governments Waste Framework Directive (WFD) which defines an operation
as recovery if “its principal objective is to ensure that the waste serves a useful purpose
by replacing other substances which would have had to be used for that purpose
(thereby conserving natural resources) (DEFRA, 2009). By displacing fossil fuel
generation, the proposed CERC plant satisfies this guideline and should under the
UK‟s WFD be defined as recovery. This shows that current government policy is in
fact in support of the energy from waste despite the EU recommending that
efficiency restrictions should be applied.
4.4 What is the NCV for the CCC Waste Composition?
The NCV calculated for the CCC waste composition was 6.6GJ/tonne. This figure is
higher than that achieved by calculating it using ERM‟s waste composition. It is also
very close to the figure for the NCV of MSW given by dukes which was 6.7GJ/tonne.
It is still considerably lower than the figure of 9.8GJ/tonne stated by ERM. The flaw in
this result however is that this figure does not include the C&IW portion of the
feedstock and so does require further refinement to more accurately represent the
NCV of the feedstock.
4.5 Method Improvements
The author of this report has confidence in these results and subsequent discussion.
However, given more time and resources some parts of the methodology could
benefit from refinements. These include:

8/2/2019 Inc Inert Or Project Final
http://slidepdf.com/reader/full/inc-inert-or-project-final 35/53
Is Energy Recovery from Waste Incineration the Best Option for Waste Management in Cornwall?
Nicholas M J Entwistle
35 | P a g e
The accuracy of the H2 contents. The H2 content has some effect on NCV and
therefore is an important consideration. However, for the purposes of this
study, with the result being sought in GJ, the H2 content used serves the
purpose adequately. If any more depth and accuracy is required the H2
content would need to be ascertained through experiment.
The adequacy of the waste breakdown structures may need some review. The
breakdown given by ERM is somewhat ambiguous due to being an average
nationwide figure compiled from multiple sources. The Cornish waste
breakdown, although more relevant, does not include Commercial and
industrial Waste (C&IW) which would alter the resultant CV somewhat. A study
into the actual feedstock destined for the CERC would be required to alleviate
these concerns.
The equation used to calculate NCV from GCV is not 100% accurate. However
with the accuracy being sought in MJ the equation is perfectly adequate.
Should the NCV be required with any more accuracy it would be necessary to
determine it through experiment on waste samples.
The alternatives for the energy generation output from the plant hinged on
the calculated efficiency. This meant that the outputs with lower CV‟s are
actually more generous than would be the case as a lower NCV would lead to
a lower overall plant efficiency. However, this discrepancy is not to the
advantage of the arguments made by this report and therefore cannot be
considered deceitful. Given more time it would be possible to produce anefficiency value for each NCV value, which would further concrete the points
made in this report.
4.6 Suggestions for Future Study
The scope allowed to this project by the time and resources available have meant
that there are matters, which pertain to this study, which it would be prudent to
8/2/2019 Inc Inert Or Project Final
http://slidepdf.com/reader/full/inc-inert-or-project-final 36/53
Is Energy Recovery from Waste Incineration the Best Option for Waste Management in Cornwall?
Nicholas M J Entwistle
36 | P a g e
consider for future study. The report itself has raised questions that it is not within
the timeframe available to comment on.
One of these tasks for future study would be to determine more accurately the
average NCV of the waste feedstock, as would be provided to the plant and
therefore the estimated output from the plant. This would require the determination
of an average tonne of waste and compilation of said waste. The task from there
would be to test, under lab conditions, the actual calorific value of the waste.
Another way in which the results of the NCV calculation could be further honed
would be in the study of the actual hydrogen contents of a sample from each of the
fractions of waste. This should provide a more accurate figure for the calculation of
the NCV but without the need to compile and test an average sample of the waste as
described above.
Another avenue for further investigation would be to request from ERM the details of
how they calculated the 9.8MJ figure and whether or not it was based on a
retrospective calculations carried out on output estimates extrapolated from the
outputs of existing plants, as suggested in section 4.2.1. It is unexpected however
that this area of future study should turn up much more information as the author
believes, thanks to correspondence with professionals involved with the public
enquiry, that ERM would not be forthcoming with any more data while the enquiry is
underway.
Another important avenue for further study, which would put this report in context,
would be a comparatives study of alternative waste management systems which are
available. The main factors for comparison would be the bankability of the
comparatives systems, and their relative environmental impact in terms of depletion
of resources and global warming potential (GWP). Possible systems to study would
be; increased recycling and re-use using autoclaves for waste treatment and sorting,
or anaerobic digestion to generate energy in the forms of both electricity and heat.

8/2/2019 Inc Inert Or Project Final
http://slidepdf.com/reader/full/inc-inert-or-project-final 37/53
Is Energy Recovery from Waste Incineration the Best Option for Waste Management in Cornwall?
Nicholas M J Entwistle
37 | P a g e
In order to carry out comparative studies it would be important to carry out a GWP
appraisal of the CERC based on actual output which is calculated from the actual
NCV of the feedstock waste. It would also be important to carry out an economic
study of the CERC based on new figures for NCV and output. This would enable a
financial comparison to be made with other alternatives
8/2/2019 Inc Inert Or Project Final
http://slidepdf.com/reader/full/inc-inert-or-project-final 38/53
Is Energy Recovery from Waste Incineration the Best Option for Waste Management in Cornwall?
Nicholas M J Entwistle
38 | P a g e
5 CONCLUSION
In order to evaluate the suitability of the CERC 4 questions were posed which have
been answered throughout this report and are summarised below.
Is the ERM NCV Figure Accurate?
This report has shown that there is discrepancy within the data provided by ERM. The
conclusion is based on the NCV resultant from calculations carried out using their
own data, and techniques recommended by the UK Government. This is of vast
important as the implications of getting the levels of energy available in the waste
wrong undermine the environmental and economic credentials of the CERC.
What is the NCV for the CCC Waste Composition?
The data regarding the output of the plant is based on extrapolations of data, rather
than detailed study of the local feedstock, this damages the respectability of the
proposed plant before it is built. The feedstock data is compiled from national
reports, which don‟t represent the actual Cornish waste composition or moisture
content. This is done despite the fact that respectable and reliable studies into the
Cornish MSW composition have been carried out at the “black bag” level and are
readily available. The NCV calculated from these sources was shown to be lower than
that stated by ERM but higher than that calculated from ERM‟s waste composition.
What is the efficiency of the CERC? Does the efficiency meet EU requirements
for recovery?
The efficiency of the plant is not within proposals made by the EU to be classed as
recovery, this show a disregard of the future, on the part of ERM and Sita. Sita are
hoping to get their plant constructed to a technological level which experts in the EU
consider inadequate to be classed as energy recovery. However, the definition of
recovery was raised as an issue and SITA could argue this.

8/2/2019 Inc Inert Or Project Final
http://slidepdf.com/reader/full/inc-inert-or-project-final 39/53
Is Energy Recovery from Waste Incineration the Best Option for Waste Management in Cornwall?
Nicholas M J Entwistle
39 | P a g e
What affect do differing CV’s have on the energy output of the plant?
The proposed NCV leads to the highest energy output as desired, consequently the
actual lower NCV leads to a lower output. The higher NCV that the ERM proposed
leads to an increase in the avoided emission which could potentially balance the
extra GHG‟s expected from the extra road transport a single large plant demands.
Perhaps ERM have deliberately used a higher than actual NCV in order to maintain
the relatively low GWP of a single large plant despite the extra road transport it
represents. Sita have a vested interest in promoting a single large plant as it is the
best way to achieve the higher efficiencies required to make the plant bankable.
The author of this study is willing to concede that the hydrogen contents used in the
calculation of the NCV may not be as precise as is desirable in a perfect world and
lab work is required to rectify this. However the H2 content in the equation used, acts
to reduce the final NCV and the omission of H2 altogether from the calculation still
results in a NCV much lower than that presented by ERM.
In conclusion, is energy recovery from waste incineration the best option for waste
management in Cornwall? No, planning permission should not be granted for the
plant due to the carelessness of the studies seeking to justify it. The information
provided, to argue for the incinerator by Sita, is built on arbitrary and deficient
foundations.

8/2/2019 Inc Inert Or Project Final
http://slidepdf.com/reader/full/inc-inert-or-project-final 40/53
Is Energy Recovery from Waste Incineration the Best Option for Waste Management in Cornwall?
Nicholas M J Entwistle
40 | P a g e
6 GLOSSARY
CCC – Cornwall County Council
CERC – Cornwall Energy Recovery Centre
CHPQA – Combined Heat and Power Quality Assured
CO2 eq – Carbon dioxide equivalent gasses
CV – Calorific Value
DUKES – Digest of UK Energy Statistics
EfW – Energy from Waste
ERM – Environmental Resource Management
EU – European Union
FGT – Flue Gas Treatment
GCV – Gross Calorific Value
GHG – Greenhouse Gasses
GJ – Giga Joule
GWP – Global Warming Potential
HHW – Hazardous Household Waste
MEL – Measurement Evaluation and Learning
MJ – Mega Joule
MSW – Municipal Solid Waste
Tpa – Tonnes Per Annum
WFD – Waste Framework Directive
WEE – Waste Energy and Electrical

8/2/2019 Inc Inert Or Project Final
http://slidepdf.com/reader/full/inc-inert-or-project-final 41/53
Is Energy Recovery from Waste Incineration the Best Option for Waste Management in Cornwall?
Nicholas M J Entwistle
41 | P a g e
7 BIBLIOGRAPHY
AEA. (2007, May). An assessment of costs and Environmental Impacts of Single and Multiple
Facilities. Retrieved from www.cornwall.gov.uk:
www.cornwall.gov.uk/m_pdf/8_f_AEA_May2007.pdf
Bergund, C. (1999). Water Content Measurments in Houshold Waste using Neutron Probe;
Experience from Field Digestion Cell and Laboratory. Department of Civil and Environmental
Engineering, Division of Hydraulic Engineering, Royal Institute of , 101.
BERR. (2006). Carbon dioxide emissions and energy consumption in the UK. Retrieved fromwww.berr.gov.uk/files/file43947.pdf
Broadhurst, M. (2010). Power of Cornwall Document WS5 Witness Statement. Power of Cornwall Ltd.
Commision of European Communities. (2005). Directive of the European Parliament and of the
Council on Waste. Retrieved from
www.environ.ie/en/Publications/Environment/Waste/WasteManagement
Commision of the European Communities. (2005). Non-paper on the background of the
development of the Commission proposal on the distinction between energy recovery and disposal
of waste in municipal incinerators. 2.
DEFRA. (2009, October). Environmental Permitting Guidance - The Waste Framework Directive.
Retrieved from www.defra.gov.uk/environment/policy/permits/documents/wfd-guidance.pdf
DEFRA. (2007). Waste Strategy for England. The Stationery Office.
Department for Communities and Local Goverment. (2006, December). Planning Policy Statement:
Planning and Climate Change. Retrieved from www.communities.gov.uk.
Department of Energy and Climate Change. (2008). Combined Heat and Power - Quality Assured;
Guidance Note 29 Alternative Fuels Energy Inputs. CHPQA programme , 4.
DUKES. (2008). Estimated average calorific values of fuels (DUKES A.1-A.3). Department of Energy
and Climate Change.
Environment Agency. (2007, May). Your Waste, You Responsibility - Guidance Notes. Retrieved from
environment-agency.co.uk: www.environment-
agency.co.uk/static/documents/NetRegs/GEHO0507BMQS-e-e.pdf
ERM & DEFRA. (2006, December). Carbon Balances and Energy Impacts of the Managment of UK
Wastes - Defra R&D Project WRT 237. p. 18.
8/2/2019 Inc Inert Or Project Final
http://slidepdf.com/reader/full/inc-inert-or-project-final 42/53
Is Energy Recovery from Waste Incineration the Best Option for Waste Management in Cornwall?
Nicholas M J Entwistle
42 | P a g e
ERM. (2008, March). Assesment of Number of Facilities - Final Report. p. 7.
ERM. (2008, March). CERC Carbon Balance - Final Report. p. 9.
ERM. (2008). Cornwall Energy Recovery: Environmental Permit Application. Cornwall: Sita.
Larke, C. (February 2009). TCN Incinerator Objection. Atlantic Energy.
Larke, Charmian. (2010). Transition Cornwall Networ Proof of Evidence Proposed Incinerator
Restorwrack Farm.
MEL. (2007). Cornwall County Council Waste Compostion Study - Comparison Report – Ref 07048.
Office of the Deputy Prime Minister. (2005). PPS10: Planning for Sustainable Waste Managment .
The Stationary Office.
Sita. (2009). Cornwall Energy Recovery Centre Appeal - FAQ. SVEZ Environment.

8/2/2019 Inc Inert Or Project Final
http://slidepdf.com/reader/full/inc-inert-or-project-final 43/53
Is Energy Recovery from Waste Incineration the Best Option for Waste Management in Cornwall?
Nicholas M J Entwistle
43 | P a g e
APPENDIX 1

8/2/2019 Inc Inert Or Project Final
http://slidepdf.com/reader/full/inc-inert-or-project-final 44/53
Is Energy Recovery from Waste Incineration the Best Option for Waste Management in Cornwall?
Nicholas M J Entwistle
44 | P a g e
Table 1 Waste Compositions Modelled (weights in tonnes, for year 2020) (ERM, 2008)

8/2/2019 Inc Inert Or Project Final
http://slidepdf.com/reader/full/inc-inert-or-project-final 45/53
Is Energy Recovery from Waste Incineration the Best Option for Waste Management in Cornwall?
Nicholas M J Entwistle
45 | P a g e Table 2 Moisture & Carbon Content (ERM, 2008)

8/2/2019 Inc Inert Or Project Final
http://slidepdf.com/reader/full/inc-inert-or-project-final 46/53
Is Energy Recovery from Waste Incineration the Best Option for Waste Management in Cornwall?
Nicholas M J Entwistle
46 | P a g e
Table 3 Waste Screening Matrix (ERM & DEFRA, 2006)
8/2/2019 Inc Inert Or Project Final
http://slidepdf.com/reader/full/inc-inert-or-project-final 47/53
Is Energy Recovery from Waste Incineration the Best Option for Waste Management in Cornwall?
Nicholas M J Entwistle
47 | P a g e
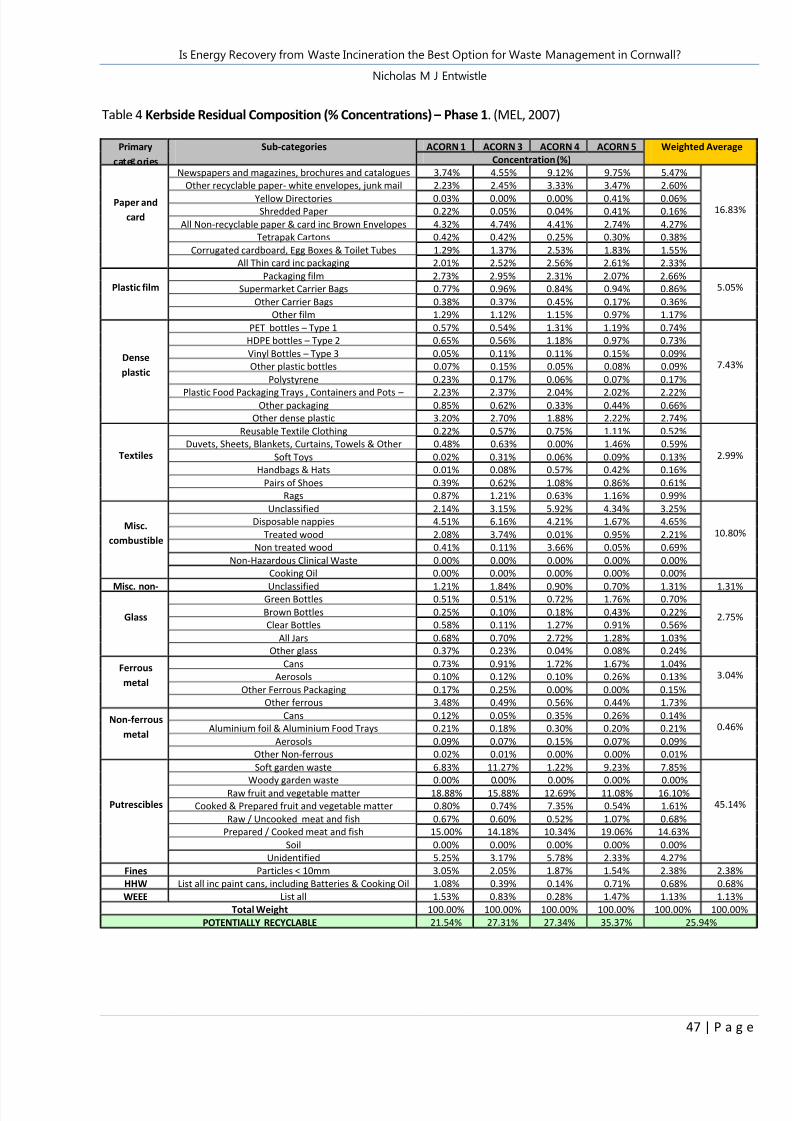
Table 4 Kerbside Residual Composition (% Concentrations) – Phase 1. (MEL, 2007)
Primary
cate ories
Sub-categories ACORN 1 ACORN 3 ACORN 4 ACORN 5 Weighted Average
Concentration (%)
Paper and
card
Newspapers and magazines, brochures and catalogues 3.74% 4.55% 9.12% 9.75% 5.47%
16.83%
Other recyclable paper- white envelopes, junk mail 2.23% 2.45% 3.33% 3.47% 2.60%
Yellow Directories 0.03% 0.00% 0.00% 0.41% 0.06%
Shredded Paper 0.22% 0.05% 0.04% 0.41% 0.16%
All Non-recyclable paper & card inc Brown Envelopes 4.32% 4.74% 4.41% 2.74% 4.27%
Tetrapak Cartons 0.42% 0.42% 0.25% 0.30% 0.38%
Corrugated cardboard, Egg Boxes & Toilet Tubes 1.29% 1.37% 2.53% 1.83% 1.55%
All Thin card inc packaging 2.01% 2.52% 2.56% 2.61% 2.33%
Plastic filmPackaging film 2.73% 2.95% 2.31% 2.07% 2.66%
5.05%Supermarket Carrier Bags 0.77% 0.96% 0.84% 0.94% 0.86%
Other Carrier Bags 0.38% 0.37% 0.45% 0.17% 0.36%
Other film 1.29% 1.12% 1.15% 0.97% 1.17%
Dense
plastic
PET bottles – Type 1 0.57% 0.54% 1.31% 1.19% 0.74%
7.43%
HDPE bottles – Type 2 0.65% 0.56% 1.18% 0.97% 0.73%
Vinyl Bottles – Type 3 0.05% 0.11% 0.11% 0.15% 0.09%
Other plastic bottles 0.07% 0.15% 0.05% 0.08% 0.09%
Polystyrene 0.23% 0.17% 0.06% 0.07% 0.17%
Plastic Food Packaging Trays , Containers and Pots –
2.23% 2.37% 2.04% 2.02% 2.22%
Other packaging 0.85% 0.62% 0.33% 0.44% 0.66%
Other dense plastic 3.20% 2.70% 1.88% 2.22% 2.74%
Textiles
Reusable Textile Clothing 0.22% 0.57% 0.75% 1.11% 0.52%
2.99%Duvets, Sheets, Blankets, Curtains, Towels & Other 0.48% 0.63% 0.00% 1.46% 0.59%
Soft Toys 0.02% 0.31% 0.06% 0.09% 0.13%
Handbags & Hats 0.01% 0.08% 0.57% 0.42% 0.16%
Pairs of Shoes 0.39% 0.62% 1.08% 0.86% 0.61%
Rags 0.87% 1.21% 0.63% 1.16% 0.99%
Misc.
combustible
Unclassified 2.14% 3.15% 5.92% 4.34% 3.25%
10.80%Disposable nappies 4.51% 6.16% 4.21% 1.67% 4.65%
Treated wood 2.08% 3.74% 0.01% 0.95% 2.21%
Non treated wood 0.41% 0.11% 3.66% 0.05% 0.69%
Non-Hazardous Clinical Waste 0.00% 0.00% 0.00% 0.00% 0.00%
Cooking Oil 0.00% 0.00% 0.00% 0.00% 0.00%
Misc. non-
Unclassified 1.21% 1.84% 0.90% 0.70% 1.31% 1.31%
Glass
Green Bottles 0.51% 0.51% 0.72% 1.76% 0.70%
2.75%Brown Bottles 0.25% 0.10% 0.18% 0.43% 0.22%
Clear Bottles 0.58% 0.11% 1.27% 0.91% 0.56%
All Jars 0.68% 0.70% 2.72% 1.28% 1.03%
Other glass 0.37% 0.23% 0.04% 0.08% 0.24%
Ferrous
metal
Cans 0.73% 0.91% 1.72% 1.67% 1.04%3.04%Aerosols 0.10% 0.12% 0.10% 0.26% 0.13%
Other Ferrous Packaging 0.17% 0.25% 0.00% 0.00% 0.15%
Other ferrous 3.48% 0.49% 0.56% 0.44% 1.73%
Non-ferrous
metal
Cans 0.12% 0.05% 0.35% 0.26% 0.14%0.46%Aluminium foil & Aluminium Food Trays 0.21% 0.18% 0.30% 0.20% 0.21%
Aerosols 0.09% 0.07% 0.15% 0.07% 0.09%
Other Non-ferrous 0.02% 0.01% 0.00% 0.00% 0.01%
Putrescibles
Soft garden waste 6.83% 11.27% 1.22% 9.23% 7.85%
45.14%
Woody garden waste 0.00% 0.00% 0.00% 0.00% 0.00%
Raw fruit and vegetable matter 18.88% 15.88% 12.69% 11.08% 16.10%
Cooked & Prepared fruit and vegetable matter 0.80% 0.74% 7.35% 0.54% 1.61%
Raw / Uncooked meat and fish 0.67% 0.60% 0.52% 1.07% 0.68%
Prepared / Cooked meat and fish 15.00% 14.18% 10.34% 19.06% 14.63%
Soil 0.00% 0.00% 0.00% 0.00% 0.00%
Unidentified 5.25% 3.17% 5.78% 2.33% 4.27%
Fines Particles < 10mm 3.05% 2.05% 1.87% 1.54% 2.38% 2.38%
HHW List all inc paint cans, including Batteries & Cooking Oil 1.08% 0.39% 0.14% 0.71% 0.68% 0.68%
WEEE List all 1.53% 0.83% 0.28% 1.47% 1.13% 1.13%
Total Weight 100.00% 100.00% 100.00% 100.00% 100.00% 100.00%
POTENTIALLY RECYCLABLE 21.54% 27.31% 27.34% 35.37% 25.94%

8/2/2019 Inc Inert Or Project Final
http://slidepdf.com/reader/full/inc-inert-or-project-final 48/53
Is Energy Recovery from Waste Incineration the Best Option for Waste Management in Cornwall?
Nicholas M J Entwistle
48 | P a g e
Table 5 Kerbside Residual Composition (% Concentrations) – Phase 2. (MEL, 2007)
Primary
categoriesSub-categories ACORN 1 ACORN 3 ACORN 4 ACORN 5 Weighted Average
Concentration (%)
Paper and
card
Newspapers and magazines, brochures and 3.33% 4.67% 6.83% 8.98% 4.94%
17.88%
Other recyclable paper- white envelopes, junk mail 1.89% 2.33% 2.31% 7.04% 2.74%Yellow Directories 0.00% 0.06% 0.00% 0.00% 0.02%
Shredded Paper 0.20% 0.07% 0.11% 0.00% 0.12%
All Non-recyclable paper & card inc Brown Envelopes 6.10% 4.66% 5.05% 4.32% 5.26%
Tetrapak Cartons 0.43% 0.44% 0.27% 0.37% 0.40%
Corrugated cardboard, Egg Boxes & Toilet Tubes 1.22% 2.12% 2.10% 5.53% 2.18%
All Thin card inc packaging 2.05% 2.08% 2.30% 3.00% 2.21%
Plastic filmPackaging film 2.39% 2.51% 2.38% 2.09% 2.39%
4.49%Supermarket Carrier Bags 0.48% 0.60% 0.44% 0.53% 0.52%
Other Carrier Bags 0.47% 0.45% 0.30% 0.43% 0.43%
Other film 1.32% 1.11% 0.87% 1.01% 1.15%
Dense
plastic
PET bottles – Type 1 0.44% 0.33% 0.72% 1.09% 0.52%
6.77%
HDPE bottles – Type 2 0.49% 0.50% 0.96% 0.80% 0.59%
Vinyl Bottles – Type 3 0.00% 0.00% 0.06% 0.00% 0.01%
Other plastic bottles 0.07% 0.18% 0.08% 0.14% 0.12%
Polystyrene 0.21% 0.17% 0.05% 0.16% 0.17%Plastic Food Packaging Trays , Containers and Pots – 2.00% 2.15% 2.04% 1.64% 2.01%
Other packaging 1.02% 1.03% 0.45% 0.64% 0.90%
Other dense plastic 2.41% 2.23% 3.01% 2.57% 2.45%
Textiles
Reusable Textile Clothing 1.95% 0.23% 0.75% 2.42% 1.29%
4.34%Duvets, Sheets, Blankets, Curtains, Towels & Other 1.44% 0.17% 1.48% 0.26% 0.88%
Soft Toys 0.01% 0.01% 0.03% 0.00% 0.01%
Handbags & Hats 0.30% 0.11% 0.62% 0.75% 0.34%
Pairs of Shoes 0.26% 0.50% 0.27% 1.75% 0.53%
Rags 1.17% 1.26% 1.56% 1.47% 1.29%
Misc.
combustible
Unclassified 0.99% 1.20% 0.70% 0.24% 0.93%
6.21%Disposable nappies 4.42% 5.53% 6.13% 0.21% 4.48%
Treated wood 0.50% 1.10% 0.67% 0.74% 0.75%
Non treated wood 0.00% 0.17% 0.00% 0.00% 0.05%
Non-Hazardous Clinical Waste 0.00% 0.00% 0.00% 0.00% 0.00%
Cooking Oil 0.00% 0.00% 0.00% 0.00% 0.00%Misc. non-
Unclassified 2.75% 3.55% 2.74% 1.63% 2.87% 2.87%
Glass
Green Bottles 0.90% 0.72% 0.72% 0.72% 0.80%
3.49%Brown Bottles 0.08% 0.54% 0.00% 0.35% 0.26%
Clear Bottles 0.53% 1.80% 1.29% 1.02% 1.11%
All Jars 0.68% 0.75% 0.60% 1.09% 0.74%
Other glass 0.69% 0.64% 0.10% 0.59% 0.58%
Ferrous
metal
Cans 0.96% 0.81% 1.82% 2.49% 1.21%2.79%Aerosols 0.28% 0.14% 0.21% 0.07% 0.20%
Other Ferrous Packaging 0.15% 0.13% 0.25% 0.20% 0.16%
Other ferrous 0.97% 2.09% 0.72% 0.28% 1.22%
Non-ferrous
metal
Cans 0.17% 0.23% 0.13% 0.19% 0.19%0.59%Aluminium foil & Aluminium Food Trays 0.27% 0.31% 0.30% 0.22% 0.28%
Aerosols 0.02% 0.07% 0.03% 0.06% 0.04%
Other Non-ferrous 0.13% 0.04% 0.06% 0.03% 0.08%
Putrescibles
Soft garden waste 2.24% 1.44% 1.80% 0.90% 1.75%
45.11%
Woody garden waste 0.00% 0.00% 0.00% 0.00% 0.00%
Raw fruit and vegetable matter 13.60% 13.72% 13.97% 8.88% 13.09%
Cooked & Prepared fruit and vegetable matter 4.85% 4.11% 4.84% 4.32% 4.54%
Raw / Uncooked meat and fish 1.10% 0.69% 0.28% 0.54% 0.79%
Prepared / Cooked meat and fish 15.10% 16.70% 17.72% 14.80% 15.93%
Soil 0.00% 0.00% 0.00% 0.00% 0.00%
Unidentified 12.48% 9.47% 3.89% 1.78% 9.01%
Fines Particles < 10mm 2.89% 2.44% 3.50% 1.48% 2.65% 2.65%
HHW List all inc paint cans, including Batteries & Cooking 0.30% 0.64% 0.91% 0.54% 0.52% 0.52%
WEEE List all 1.31% 1.00% 1.58% 9.65% 2.29% 2.29%
Total Weight 100.00% 100.00% 100.00% 100.00% 100.00% 100.00%
POTENTIALLY RECYCLABLE 19.29% 19.13% 22.53% 27.41% 20.69%

8/2/2019 Inc Inert Or Project Final
http://slidepdf.com/reader/full/inc-inert-or-project-final 49/53
Is Energy Recovery from Waste Incineration the Best Option for Waste Management in Cornwall?
Nicholas M J Entwistle
49 | P a g e
APPENDIX 2

8/2/2019 Inc Inert Or Project Final
http://slidepdf.com/reader/full/inc-inert-or-project-final 50/53
Is Energy Recovery from Waste Incineration the Best Option for Waste Management in Cornwall?
Nicholas M J Entwistle
50 | P a g e
Table 1: Spreadsheet used to Calculate Efficiency and Energy Outputs
ERM Stated % of total ERM Calculated CCC Calculated DUKES Stated
Energy in feedstock MWh / yr 653333 374422 441861 446667
Ep
Electricity (MWh) 125,110 19.09% 71468 84340 85257
Used in FGT (MWh) 6261 0.96% 3577 4221 4267
Electricity x 2.6 (MWh) 341564.6 52.11% 195115 230257 232762Heat (MWh) 35,800 5.46% 20450 24134 24396
Heat x 1.1 (MWh) 39380 6.01% 22495 26547 26836
Total 380,945 58.12% 217,610 256,804 259,597
% difference from stated value 42.7% 32.4% 31.6%
Ef Fuel oil (MWh) 2,950 0.45% 1685 1989 2010
1475 0.23%
Total 1,475 0.23% 843 994 1,005
0
Ew Annual tonnage 240,000 36.62% 240000 240000 240000
waste net CV GJ/tonne 9.8 5.6 6.6 6.7Total (MWh) 653,333 99.68% 373,209 440,429 445,219
Total Input (Ef + Ew + Ei) 655,458 100.00% 374,422 441,861 446,667
Ei Electricity (MWh) 650 0.10% 371 438 443
0.00% 0
Total 650 0.10% 371 438 443
S stem Efficienc 59.64%
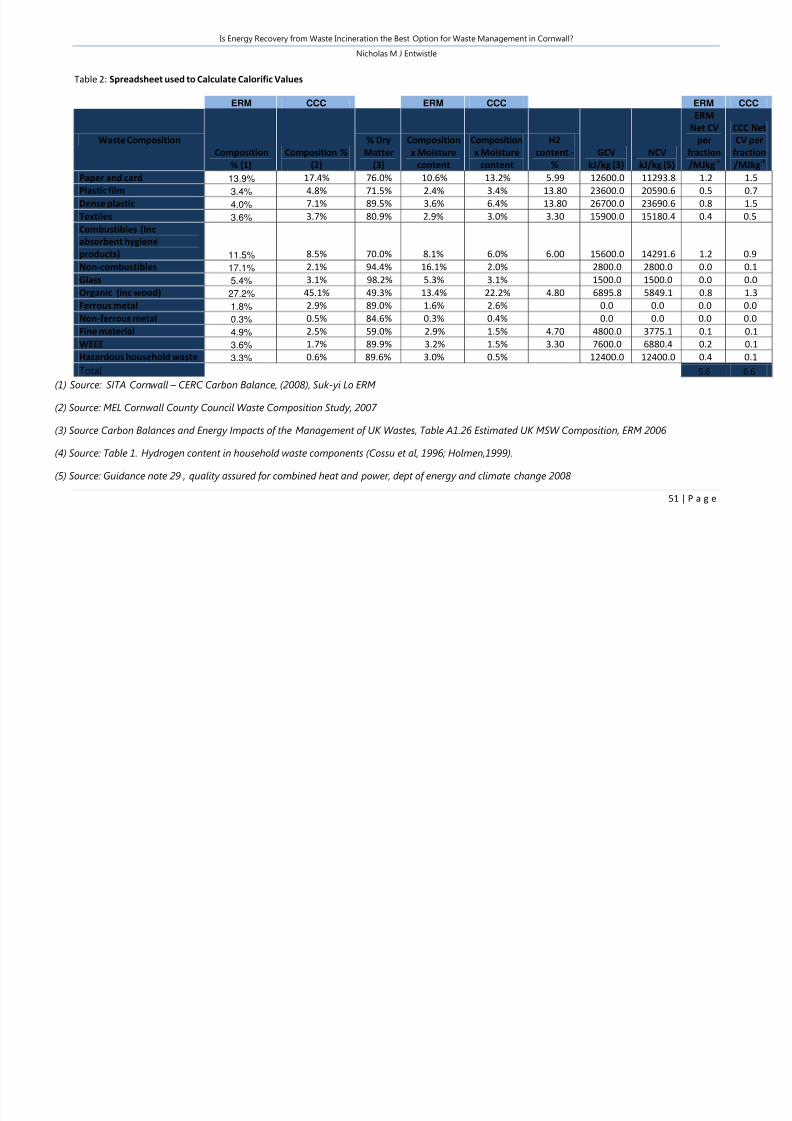
8/2/2019 Inc Inert Or Project Final
http://slidepdf.com/reader/full/inc-inert-or-project-final 51/53
Is Energy Recovery from Waste Incineration the Best Option for Waste Management in Cornwall?
Nicholas M J Entwistle
51 | P a g e
Table 2: Spreadsheet used to Calculate Calorific Values
ERM CCC ERM CCC ERM CCC
Waste Composition
Composition
% (1)
Composition %
(2)
% Dry
Matter
(3)
Composition
x Moisture
content
Composition
x Moisture
content
H2
content -
%
GCV
kJ/kg (3)
NCV
kJ/kg (5)
ERM
Net CV
per
fraction
/MJkg-1
CCC Net
CV per
fraction
/MJkg-1
Paper and card 13.9% 17.4% 76.0% 10.6% 13.2% 5.99 12600.0 11293.8 1.2 1.5
Plastic film 3.4% 4.8% 71.5% 2.4% 3.4% 13.80 23600.0 20590.6 0.5 0.7Dense plastic 4.0% 7.1% 89.5% 3.6% 6.4% 13.80 26700.0 23690.6 0.8 1.5
Textiles 3.6% 3.7% 80.9% 2.9% 3.0% 3.30 15900.0 15180.4 0.4 0.5
Combustibles (Inc
absorbent hygiene
products) 11.5% 8.5% 70.0% 8.1% 6.0% 6.00 15600.0 14291.6 1.2 0.9
Non-combustibles 17.1% 2.1% 94.4% 16.1% 2.0% 2800.0 2800.0 0.0 0.1
Glass 5.4% 3.1% 98.2% 5.3% 3.1% 1500.0 1500.0 0.0 0.0
Organic (inc wood) 27.2% 45.1% 49.3% 13.4% 22.2% 4.80 6895.8 5849.1 0.8 1.3
Ferrous metal 1.8% 2.9% 89.0% 1.6% 2.6% 0.0 0.0 0.0 0.0
Non-ferrous metal 0.3% 0.5% 84.6% 0.3% 0.4% 0.0 0.0 0.0 0.0
Fine material 4.9% 2.5% 59.0% 2.9% 1.5% 4.70 4800.0 3775.1 0.1 0.1
WEEE 3.6% 1.7% 89.9% 3.2% 1.5% 3.30 7600.0 6880.4 0.2 0.1
Hazardous household waste 3.3% 0.6% 89.6% 3.0% 0.5% 12400.0 12400.0 0.4 0.1
Total 5.6 6.6
(1) Source: SITA Cornwall – CERC Carbon Balance, (2008), Suk-yi Lo ERM
(2) Source: MEL Cornwall County Council Waste Composition Study, 2007
(3) Source Carbon Balances and Energy Impacts of the Management of UK Wastes, Table A1.26 Estimated UK MSW Composition, ERM 2006
(4) Source: Table 1. Hydrogen content in household waste components (Cossu et al, 1996; Holmen,1999).
(5) Source: Guidance note 29 , quality assured for combined heat and power, dept of energy and climate change 2008

8/2/2019 Inc Inert Or Project Final
http://slidepdf.com/reader/full/inc-inert-or-project-final 52/53
Is Energy Recovery from Waste Incineration the Best Option for Waste Management in Cornwall?
Nicholas M J Entwistle
52 | P a g e
(6) Source Pushpa Iyengar, East point college of Engineering, Bangalore, fuel

8/2/2019 Inc Inert Or Project Final
http://slidepdf.com/reader/full/inc-inert-or-project-final 53/53
Is Energy Recovery from Waste Incineration the Best Option for Waste Management in Cornwall?
Nicholas M J Entwistle
Recommended