Industrial Energy Management with Visual MESA at BP Lingen refinery
Availability Department – BP Lingen refinery
Soteica
ERTC Annual Meeting – Vienna ‐ 2012

Outline
• Introduction– BP Lingen refinery– Visual MESA
• Energy system description• Project objectives• Project schedule and model summary• Benefits• Conclusions
Introduction (I)
• BP Lingen refinery– One of the most complex refineries in the world– Located in North West Germany– Considered one of Europe's leading conversion refineries– In keeping with efforts to protect the environment, all of the gasoline
and diesel fuel products are essentially free of sulphur– Refining capacity of 93 thousand barrels per day of crude oil
• Visual MESA energy management system implemented
Introduction (II)
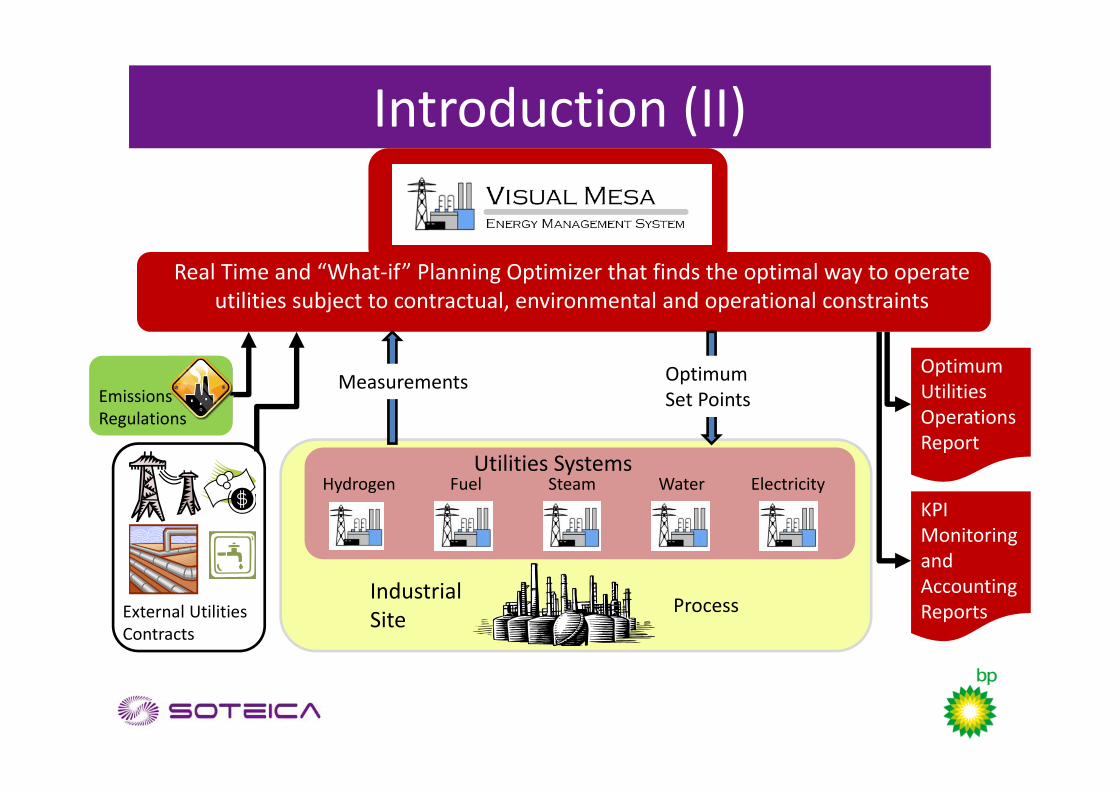
Hydrogen Fuel Steam Water ElectricityUtilities Systems
External Utilities Contracts
Emissions Regulations
ProcessIndustrialSite
Real Time and “What‐if” Planning Optimizer that finds the optimal way to operate utilities subject to contractual, environmental and operational constraints
OptimumUtilitiesOperationsReport
Measurements OptimumSet Points
KPI Monitoringand AccountingReports
Introduction (III)• Visual MESA is a 1st Principles Modeling and Optimization (SQP
MINLP) program for fuels, steam, BFW, condensate, hydrogen and electrical systems, including emissions
• Fields of application:– Real Time Optimization– Monitoring, Auditing and Accounting– Engineering– Planning– Real Time Validated Energy and Emissions KPI Calculation Server
• Currently in use in more than 70 refineries and petrochemical sites
Energy system description
• Set of fired boilers and process furnaces burning fuel gas• Steam network with three steam pressure levels• Set of steam turbogenerators• Two cogeneration units
– Production of 50 MW of electricity from two natural gas powered gas turbines, for use on site and for sale of the excess energy
– The gas turbines have steam injection and heat recovery steam generator with postcombustion
• Different economic trade‐offs (among electricity, steam and fuel networks)
• Many challenges to operate the energy system at minimum cost, within the constraints (e.g. emissions)
Project Objectives
• Monitoring and reduction of the refinery's total energy costs
• Monitoring equipment performance• Balancing the various energy costs• Developing "What if" studies
Project Schedule
• Data collection• Software installation (August 2010)• Functional Design Specifications• Model building and optimization configuration• Training (January 2011)• Model review• Burning period• Project and model documentation (July 2011)
Model scope
• Steam, fuels, emissions, boiler feed water, condensates and electricity system
• Optimization Objective function:Total Energy costs = Fuels + Electricity + Other costs
(Fuel Oil/Natural Gas/LPG (Propane/Butane)/ Electricity/Water)
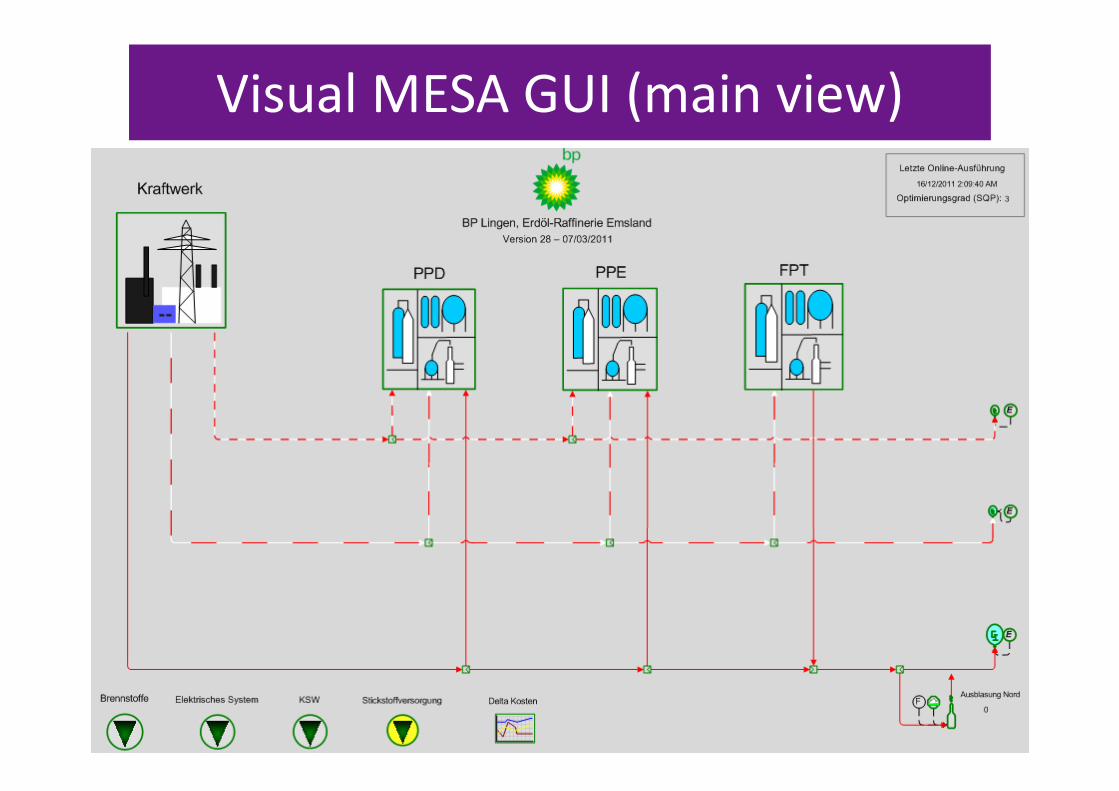
Visual MESA GUI (main view)
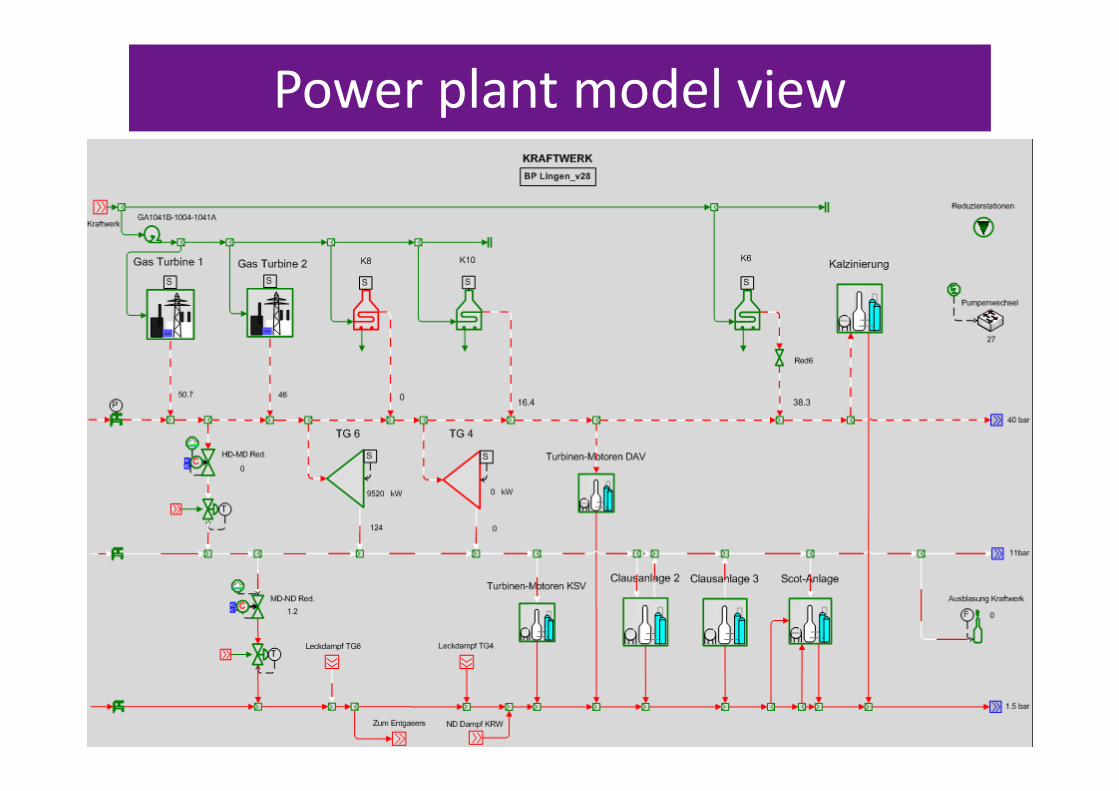
Power plant model view
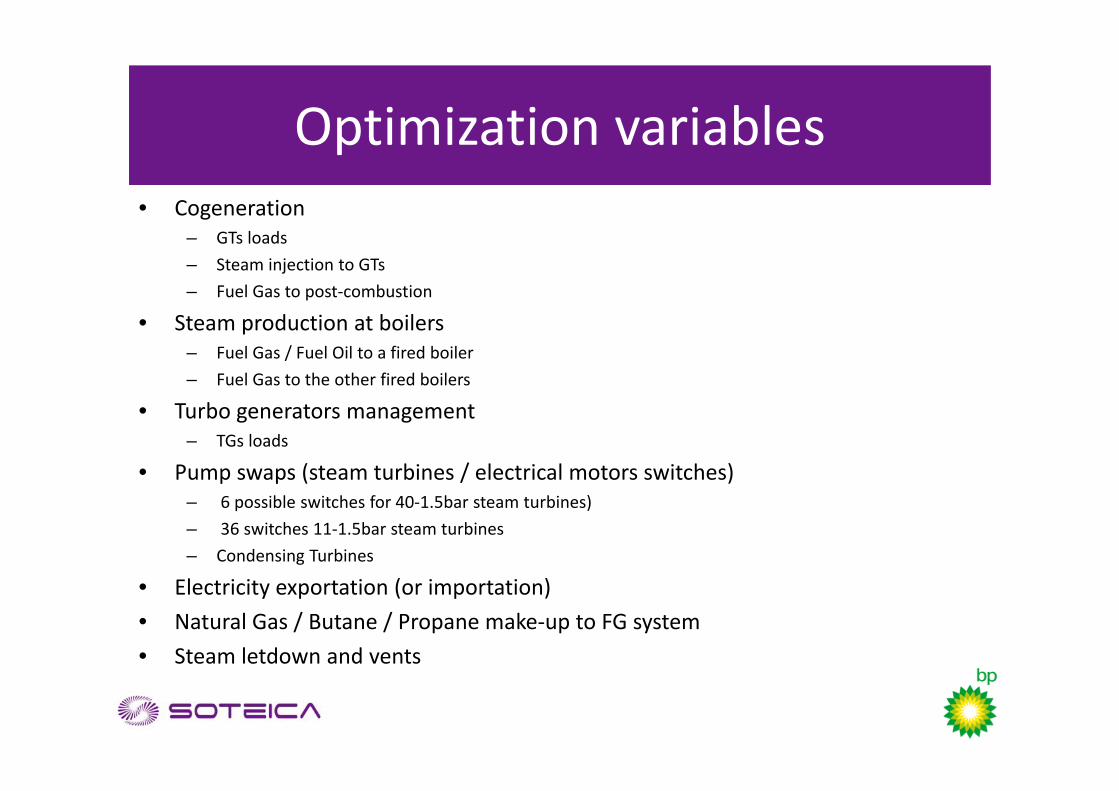
Optimization variables• Cogeneration
– GTs loads– Steam injection to GTs– Fuel Gas to post‐combustion
• Steam production at boilers– Fuel Gas / Fuel Oil to a fired boiler– Fuel Gas to the other fired boilers
• Turbo generators management– TGs loads
• Pump swaps (steam turbines / electrical motors switches)– 6 possible switches for 40‐1.5bar steam turbines)– 36 switches 11‐1.5bar steam turbines– Condensing Turbines
• Electricity exportation (or importation)• Natural Gas / Butane / Propane make‐up to FG system• Steam letdown and vents
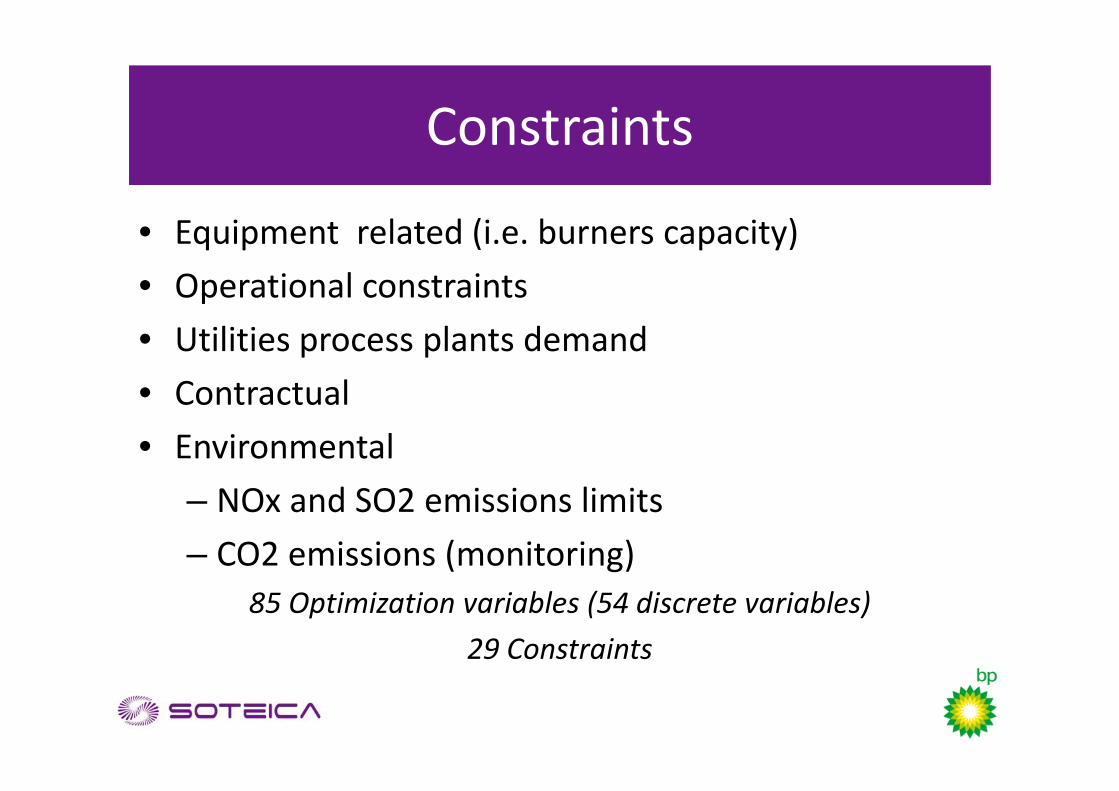
Constraints
• Equipment related (i.e. burners capacity)• Operational constraints• Utilities process plants demand• Contractual • Environmental
– NOx and SO2 emissions limits– CO2 emissions (monitoring)
85 Optimization variables (54 discrete variables)29 Constraints

Benefits
Day to Day Optimization• Steam production balance • Gas Turbines loads and steam injection• Turbogenerators loads• Natural Gas / Butane / Propane make‐up to FG network
• Pump swaps• The remaining variables (for example, steam let down flow
rates) are consequences of the changes mentioned before, being manipulated automatically by the control system
Energy costs reduction examples
• Natural Gas / Butane / Propane addition to FG network
• Gas Turbine loads• Pump swaps
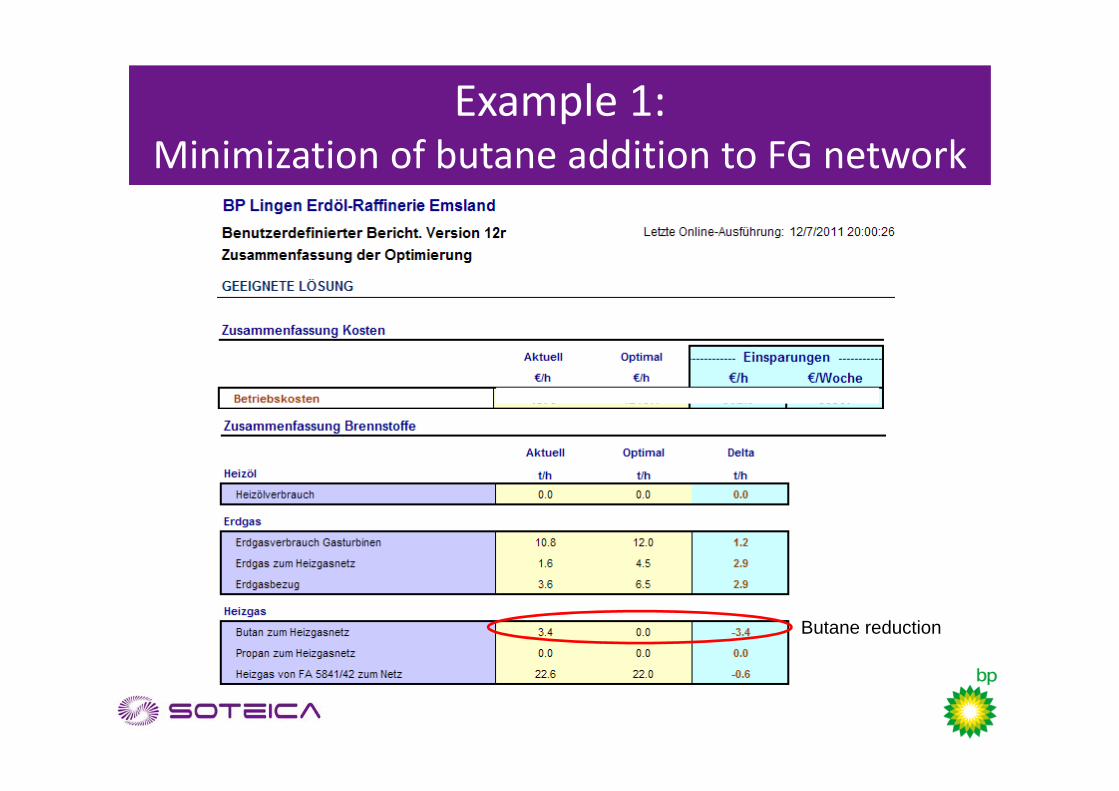
Example 1: Minimization of butane addition to FG network
Butane reduction

Example 1 (cont): Minimization of butane addition to FG network
Energy cost reductionaround 5% on total energy cost
Butane reductionto FG networkaround 3 t/h
Delta Cost (Current minus Optimized)
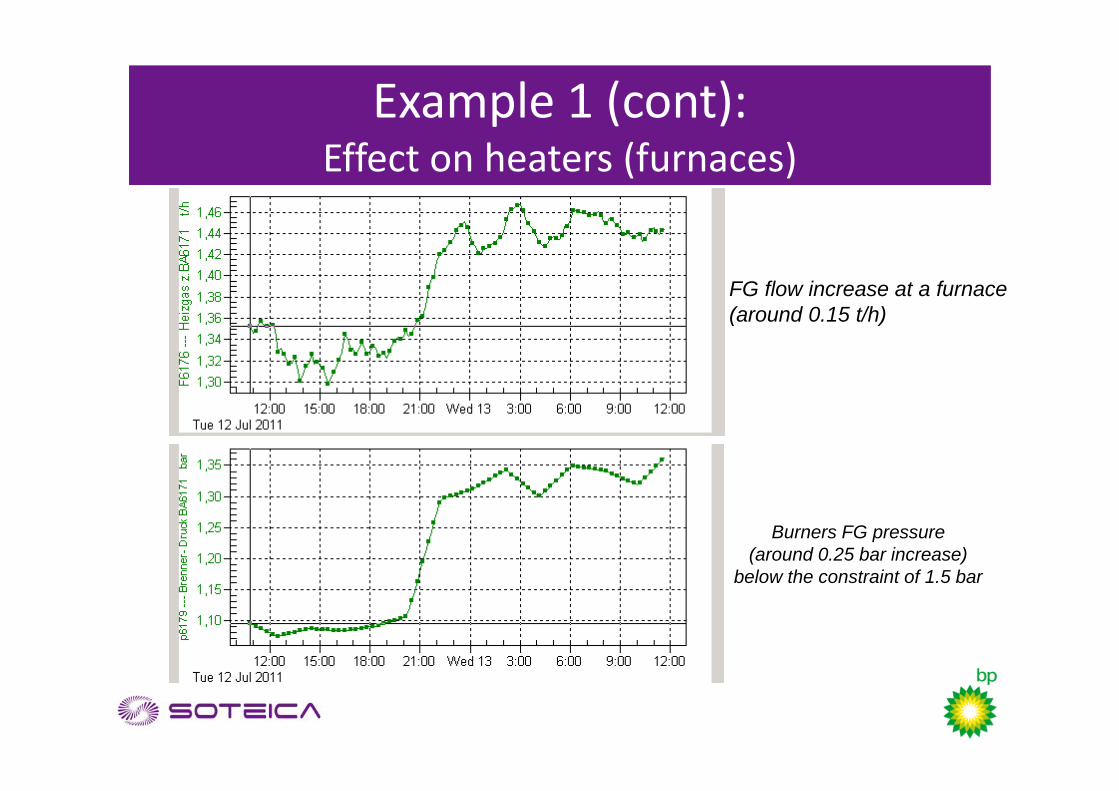
Example 1 (cont): Effect on heaters (furnaces)
FG flow increase at a furnace(around 0.15 t/h)
Burners FG pressure(around 0.25 bar increase)
below the constraint of 1.5 bar

Example 2: Optimization of Gas Turbines loads
Although electricity exportation penalty increase
Gas turbine load increase operating at higher efficiency

Example 3: Optimization of Pump swaps
Steam vent eliminated
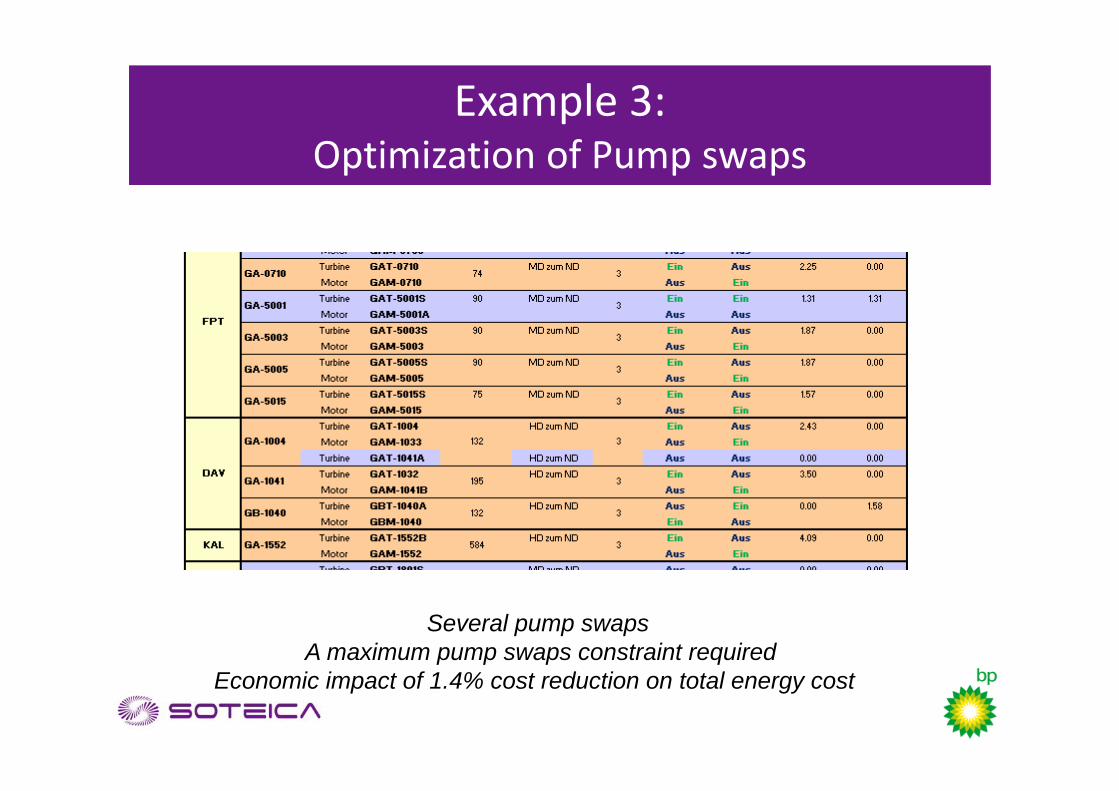
Example 3: Optimization of Pump swaps
Several pump swapsA maximum pump swaps constraint required
Economic impact of 1.4% cost reduction on total energy cost
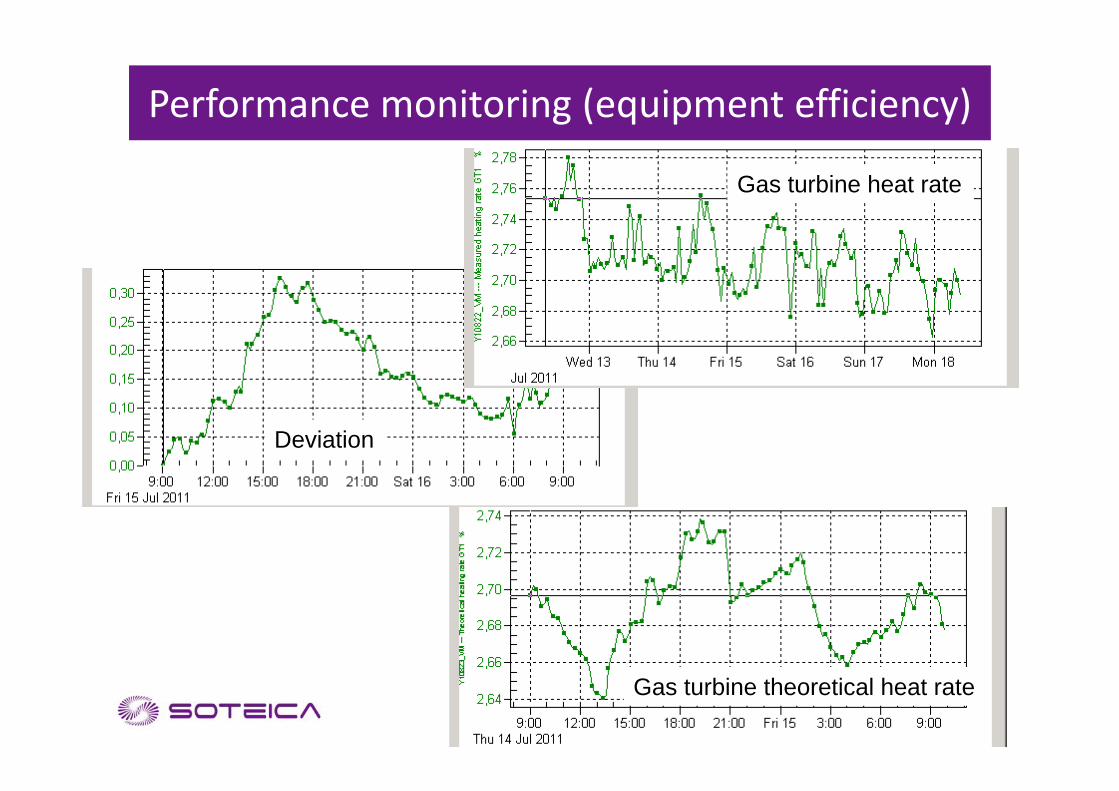
Performance monitoring (equipment efficiency)
Gas turbine heat rate
Deviation
Gas turbine theoretical heat rate

Performance monitoring (equipment efficiency)
Fired boiler efficiency
Turbogenerator efficiency
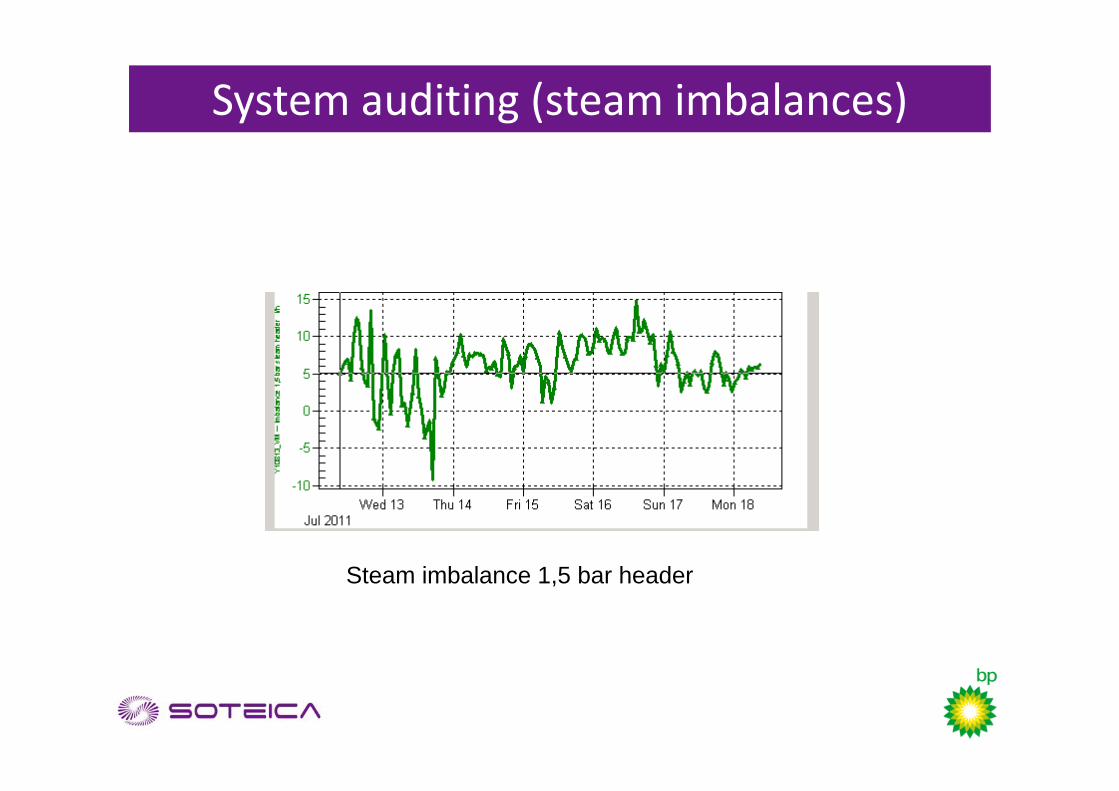
System auditing (steam imbalances)
Steam imbalance 1,5 bar header

Case studies
• Gas Turbine Off‐line washing evaluation• Effect of start/stop of equipment:
– Fired boilers– Turbo‐generators– Large steam condensing turbines
• Use of NG lines in fired boilers
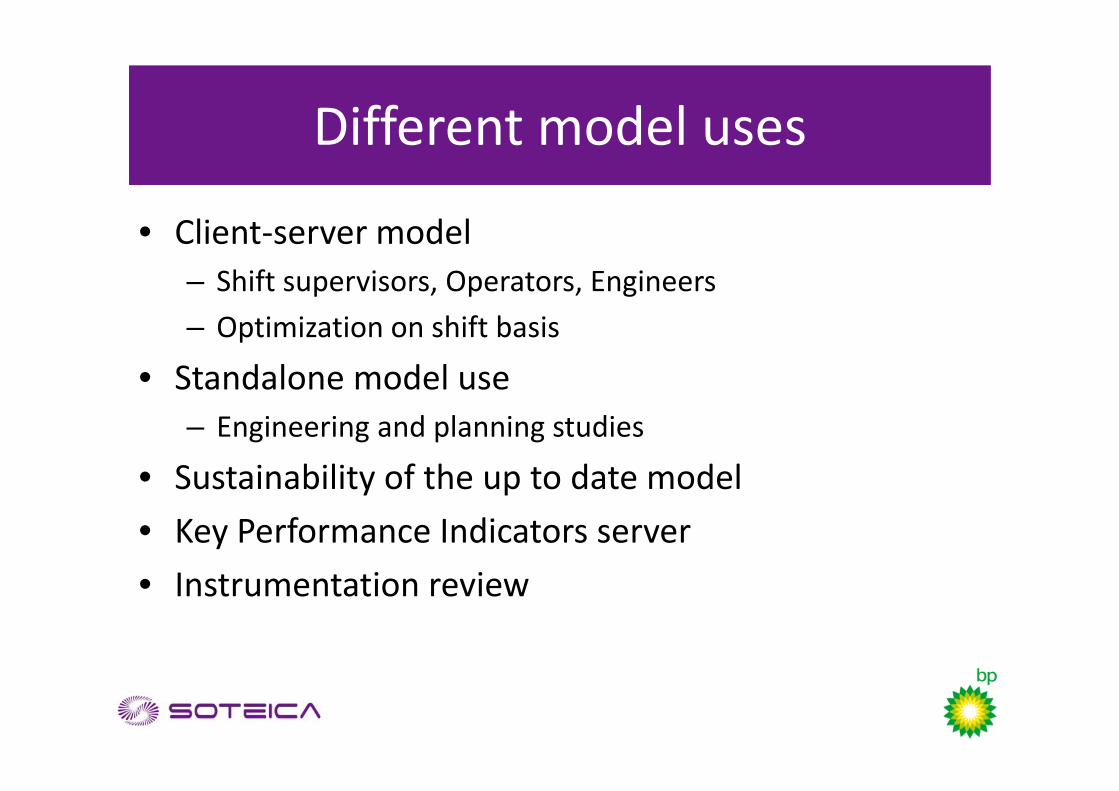
Different model uses
• Client‐server model– Shift supervisors, Operators, Engineers– Optimization on shift basis
• Standalone model use– Engineering and planning studies
• Sustainability of the up to date model• Key Performance Indicators server• Instrumentation review

Conclusions
• Visual MESA implemented at BP Lingen refinery• As a result of the project, a better knowledge of utilities
system interactions has been acquired, understanding all decision variables and the associated constraints which sometimes are hidden
• Ability to react on line to capture business opportunities to reduce energy costs and improve emissions management, getting significant energy savings
Recommended