Inequality and participative democracy. A self-reinforcing mechanism
I. Theodossiou and A. Zangelidis
Abstract During the last three decades, a notable increase in economic inequality is observed, accompanied by a decline in people's engagement in politics and electoral participation. This is an unsatisfactory phenomenon as it undermines the legitimacy of democratic representation. This negative association is produced by a complex salient mechanism. This study aims at investigating this issue. Using data from a panel of 28 OECD and European countries, this paper identifies the two-way causal relationship between inequality and political participation. The results show that greater income inequality alienates and discourages people from engaging with common affairs, thus leading to lower political participation. Yet, lower electoral participation leads towards a less equitable distribution of income. Hence, this study reveals a self-reinforcing mechanism where the unequal distribution of income leads to political exclusion, which in turn leads to more inequality. Keywords: Income inequality, Political participation, Redistribution JEL: D31, D70, E60, H00
Note We are grateful to the editor and two anonymous referees for constructive comments and suggestions. We also thank the seminar participants at the University of Aberdeen and the University of Dundee for valuable comments on an earlier version of the paper. All remaining errors are ours.
Economics, Centre for European Labour Market Research, Edward Wright Building, University of Aberdeen, AB24 3QY, UK. Email: [email protected] Economics, Centre for European Labour Market Research, Edward Wright Building, University of Aberdeen, AB24 3QY, UK. Email: [email protected] Tel: +44 (0) 1224 273122 (corresponding author)

1
Inequality and participative democracy. A self-reinforcing
mechanism
“So long as the people do not care to exercise their freedom, those who wish to tyrannize will do so;
for tyrants are active and ardent, and will devote themselves in the name of any number of gods,
religious and otherwise, to put shackles upon sleeping men.”
Voltaire
Introduction
The shape of the income distribution has changed markedly since 1980, with
substantial gains in real income at the top outpacing much more modest gains among
middle income earners. The economic models of Romer (1975), Roberts (1977) and
Meltzer and Richard (1981) suggest that rising economic inequality leads those at the
lower rungs of the income ladder to demand greater redistribution. Hence, it would be
expected that governments, responding to the increased political pressure, would
increase social transfers and welfare provisions with the aim to achieve a more egalitarian
distribution of income. However, their prediction that inequality should induce higher
welfare spending and higher redistribution is not supported by empirical evidence
(Perotti 1993; 1996; Ramcharan 2010). Indeed, it has been well documented that
economic inequality is increasing dramatically among citizens in many advanced
countries (Piketty 2014), while welfare generosity has been steadily declining.
One strand of the literature explains why increasing economic inequality is not
accompanied by policies of greater redistribution (Barth and Moene 2012; Benabou
2000; Moene and Wallerstein 2001). This literature assumes that public opinion plays a

2
key role in the formulation of welfare policies. Thus, opinions of the public are found to
be homogeneous and to follow a similar path over time. Furthermore, policy preferences
of those at the lower and upper part of the income distribution are found to be highly
correlated (Soroka and Wlezien 2008; Ura and Ellis 2008). Building on this, Kelly and
Enns (2010) show that economic inequality is self-reinforcing because both the rich and
poor become more conservative as inequality is rising. They argue that people in the top
of the income distribution prefer lower redistribution, but with increasing inequality
poor people also become discontented and less willing to pay higher taxes to finance a
more generous welfare state. The homogeneity assumption in people’s response among
different rungs of the income ladder and the conservative shift in preferences as
economic inequality widens can help explain why inequality has been steadily rising since
the 1980s. Furthermore as Barth, Finseraas and Moene (2015) suggest, it is not only
public sentiment that shifts to more conservativism in response to rising inequality, but
also party politics on welfare issues have moved to the right, strengthening the impact of
inequality. Both their theoretical model and empirical findings highlight that left-wing
political parties shift their political manifestos to the right and to less generous welfare
spending.
A parallel to the above strand of the literature highlights that unequal democratic
representation and a class bias in the political agenda favours the preferences of the
individuals in the highest rungs of income distribution (Bartels 2008; Gilens 2005;
2011). Bartels (2008) proposes that economic inequality becomes self-reinforcing as
“increasing economic inequality may produce increasing inequality in political
responsiveness, which in turn produces public policies that are increasingly detrimental
to the interests of poor citizens, which in turn produces even greater inequality, and so
3
on.” (p. 286). Gaventa (1980) and Lukes ([1974] 2005) argue persuasively that inequality
induces frustration with the political process and thence apathy for those at the lower
rungs of the income distribution. Hence, if economic inequality affects who votes, then
elections outcomes may produce a biased sample of preferences towards those who vote,
namely the higher rungs of the income distribution. “Democracy, thus constituted, does
not even attain its ostensible object, that of giving the powers of government in all cases
to the numerical majority. It does something very different: it gives them to a majority of
the majority; who may be, and often are, but a minority of the whole.” (Mill 1861;
pp.124)
This highlights that economic inequality is related to political participation and
therefore to the democratic legitimacy. This is an outcome of the fact that the increasingly
unequal distribution of income and wealth is hindering the democratic system since
economic inequality produces political inequality which, in turn, increases further the
unequal distribution of income. Interestingly since 1980, the period of time where
economic inequality has been steadily increasing, political participation has been
declining, as reflected in the electoral participation. Franklin (2004) has observed that
between the 1970s and the late 1990s participation rates have declined by an average of
4.4 percent for a number of democratic states. Furthermore, recent evidence from the
Comparative Political Data Set suggests a more significant reduction of voters’ turnout
in parliamentary elections of roughly 13.5 percent from 1990 to 20111.
1 Authors’ calculations based on the Comparative Political Data Set III (1990-2011).
4
In light of the declining electoral participation and growing evidence on the inequities
in the democratic system, this paper investigates the mechanism of the self-reinforcing
nature of economic inequality. Specifically, the paper explores whether there is a
interrelationship between economic and political exclusion in a unified framework.
Using data from 28 OECD and EU-member countries over the period 1990-2011, the
statistical analysis suggests that although wider political participation reduces economic
inequality, economic inequality leads to political inactivity which, in turn, breeds further
economic inequality. The findings offer an alternative explanation to that of Kelly and
Enns (2010) and Barth, Finseraas and Moene (2015) by highlighting a mechanism
through which economic inequality is self-reinforcing, as it propels political exclusion of
the lower rungs of the income distribution.
The relationship of economic equality and political participation
A detailed review of the political theory regarding the effects of economic inequality
and political participation is beyond the scope of this study. However, a brief literature
review is presented below to highlight the relevant issues. From a theoretical perspective
there are three competing theories on the relationship between economic inequality and
political engagement and electoral participation.
Conflict theory assumes that in democracy all individuals have the same political skills
and power to influence the political agenda. The political outcomes are the product of
the majority (Meltzer and Richard 1981) and therefore people’s preferences over the
extent of redistribution depend on their individual financial circumstances. The poor
want to redistribute wealth while the rich do not. Thus the extent of redistribution
depends on the median voter’s preference, which is the decisive voter. Conflict theory

5
suggests that higher economic inequality leads to greater electoral participation because
the conflict between the preferences of the rich and the poor will increase.
Meltzer and Richard (1981) propose that with more democracy there is a shift in policy
to reforms that favour the less well-off, increase redistribution and reduce inequality. The
extension of political power to poorer segments of society can be perceived as a credible
commitment to future redistribution favouring the less well-off (Acemoglu and
Robinson, 2000). This might be viewed as a strategic decision by the political elites to
defuse social unrest.
Nevertheless, the relationship between democracy, redistribution and inequality is a
complex one. (Acemoglu, Naidu, Restrepo, and Robinson, 2015). Thus, different
theoretical models are developed to capture the mechanisms through which the
broadening of political power is related to inequality (Acemoglu and Robinson, 2006,
2008, Acemoglu, Robinson and Santos, 2013; Acemoglu, Robinson and Torvik, 2013).
Relative power theory argues that it is rational for the poor to abstain from voting,
since they already know they have a very low probability of influencing the political
process (Goodin and Dryzek 1980; Lukes 2005). The political landscape is mainly shaped
by the interests of the wealthier rungs of the society (Solt 2008). Hence, the poor lose
interest in politics and refrain from participating. As a result there is a negative
association between inequality and voter turnout.
Overall, the literature (Schattschneider 1960; Goodin and Drysek 1980; Dahl 2006;
Solt 2008) suggests that economic inequality reduces electoral participation. Goodin and
Drysek (1980) point out that political power is highly determined by economic power
thus the relatively poor are alienated from political participation. Nevertheless, recent
studies (Brady 2004; Oliver 2007) argue that higher social inequality should be expected

6
to increase political participation, because inequality entrenches the policy preferences
of the poor and rich and therefore both groups become more militant than when
inequality is moderate. Political theory suggests several mechanisms through which
inequality pose an obstacle to political participation.
Furthermore, Alesina and La Ferrara (2002) suggest that inequality tends to affect the
public’s trust. Trust in others is an implication of economic equality. When resources
are distributed unequally, people at the different rungs of the economic ladder perceive
that they do not share the same fate and therefore, trust between people of different
backgrounds is severely curtailed. Hence, people who are distrustful of others tend to be
less likely to participate in a wide range of activities including civic participation and
political engagement (Boeckmann and Tyler 2002; Uslaner and Brown 2005).
Furthermore, Marsden (1987), McPherson, Smith-Lovin, and Cook (2001) point out that
in fragmented societies individuals tend to associate with those who are similar to them.
Hence, income inequality tends to work against political discourse since makes it difficult
for groups of individuals from different rungs of social strata to come into contact
(Huckfeldt, Mendez, and Osborn 2004; Leighley 1990). Finally, as inequality is associated
with social exclusion, socially excluded groups are less likely to be mobilized than others.
In addition, resource theory that suggests that the level of political engagement and
electoral participation depends on the resources, money and political skills, people have
(Verba, Lehman Schlozman, and Brady 1995). Hence, a priori, changes in inequality
would not necessarily have an impact on turnout. An increase in economic inequality
may lead to an increase or decrease of turnout, depending on the income changes in
absolute terms. Specifically, if all income groups are getting richer in absolute terms, then

7
electoral participation will increase due to more resources, even if the poorest are getting
poorer in relative terms, so inequality increases.
Contrary to the conflicting predictions of the above theories there appears to be some
consensus in the empirical literature which highlights that economic inequality have an
adverse effect on electoral participation. Political participation increases with income, so
higher-income individuals are more likely to participate in the electoral process
(Rosenstone and Hansen 1993). Furthermore, the political weight may not necessarily
be a function of absolute income, but rather of voter’s rank in the income distribution
(Bénabou 2000). Thus, Goodin and Drysek (1980) point out that political power is highly
determined by economic power, and thus the relatively poor are alienated from political
participation. They further show that across countries, the Gini coefficient is inversely
related to voter turnout. This finding is further supported by a number of studies where
inequality is found to be associated with declining electoral participation within a
country, or across regions or advanced industrialized countries (Boix 2003; Dahl 2006;
Mahler 2002; Merrifield 1993; Lister 2007). More recently, Solt (2008) uses individual
level survey data for several Western countries to conclude that individuals living in more
unequal societies are less likely to vote and, importantly, he shows that aggregate
inequality affect the electoral participation of the poor far more than that of the rich.
However, an important implication of the above is that declining electoral
participation should be expected to feedback to the level of inequality. One should
consider that a key characteristic of a democracy is that the government should respond
to the preferences of the citizens who are considered as political equals (Dahl 1971).
However, all citizens are not considered as political equals by policy-makers. It is by now
well established (Wolfinger and Rosenstone 1980; Verba, Lehman Schlozman, and Brady

8
1995) that there is a disparity in political participation based on the position of the
individual or group in the economic strata and that inequality in political activity is
associated with inequalities in the responsiveness of the political establishment. It
appears that the political process evolves in ways that on the one hand favors those at the
higher rungs of the income distribution and, on the other, disfavor the interests of those
with more modest means. Low-income citizens receive considerably worse representation
of their preferences (Bartels 2008; Flavin 2012; Gilens 2012; Gilens and Page 2014;
Rigby and Wright 2013). First, lobbying activities by corporations and business and
professional organizations outperform public interest groups and trade unions, the
membership of which has sharply declined over the past several decades. Second,
notwithstanding that wealthier and well-educated individuals are more likely to have
more well-formulated and well-informed preferences compared to the poor and the less-
educated; the poor are also less likely to turn out to vote or to participate in the political
process. Hence, disparities in political capital and action downgrade the value of the
social groups at the lower rungs of income distribution for the political establishment.
In effect, the higher the inequality, the less the voting turnout is. This causes a
reduction of the ability of those at the lower segments of the income distribution to
promote their economic interests. This, in turn, further increases inequality. Hence,
“rising economic inequality will solidify longstanding disparities in political voice and
influence, and perhaps exacerbate such disparities” (Task Force on Inequality and
American Democracy 2004, pp. 662).
A number of studies have investigated how electoral participation affects government
policies related to welfare and redistribution. This literature reveals that average electoral
turnout is positively related to government redistribution in developed democracies (Hill,
9
Leighley, and Hinton-Andersson 1995; Brady 2009; Iversen 2005; Kenworthy and
Pontusson 2005; Lupu and Pontusson 2011; Mahler 2008), and it is associated with a
more equal distribution of income (Mueller and Stratmann 2003). Importantly, studies
highlight that it is not only average turnout that matters, but also who votes. Thus,
although overall larger electoral participation reduces inequality and increases
redistribution, there is a marked income bias in voter turnout. A greater income bias in
turnout, i.e. greater electoral participation of the higher income compared to the lower
income groups, is negatively related to transfer redistribution (Mahler, Jesuit and
Paradowski 2015) and positively related to income inequality (Avery 2015).
Data
To explore the relationship between electoral participation and inequality, country-
level data with information on the political and institutional arrangements, the economic
policies pursued and the level of inequality is required. The Comparative Political Data
Set III (CPDS III) 1990-2011 is a collection of political and institutional data (Armingeon
et al., 2013). This data set consists of annual data for a group of 35 OECD and/or EU-
member countries for the period 1990-2011. CPDS III contains information on the
political system and institutions, the level of electoral participation in the parliamentary
elections, and fiscal and social policies adopted in each country. The key variable of
interest is electoral participation defined as the voter turnout in the parliamentary
election (lower house), as a percentages of the electorate.

10
Data on income inequality are obtained from OECD 2 , where four alternative
measures are selected. These are the Gini coefficient, the P90/P10 ratio, the P50/P10
ratio and the Palma ratio 3 . The Gini coefficient measures the extent to which the
distribution of income among individuals or households within an economy deviates
from a perfectly equal distribution, based on the comparison of cumulative proportions
of the population against cumulative proportions of income they receive. It ranges
between 0 in the case of perfect equality and 100 in the case of perfect inequality.
The Gini coefficient is perhaps the most widely used measure of inequality. It
describes overall inequality within a particular society and can be readily used to make
comparisons across different societies. However, it does not provide any information
about the origin of inequality; whether it is due to the upper, middle or bottom part of
the distribution. Hence, two societies with very similar Gini coefficients can still have
very different income distributions. Hence, inequality measures based on income ratios
are also used, which may be more insightful about the origin of inequality. In contrast to
the Gini coefficient, income ratios do not describe the whole income distribution, but
capture two points of that distribution. The P90/P10 ratio is the ratio of the upper bound
value of the ninth decile (the 10% of people with highest income) to that of the upper
bound value of the first decile, and the P50/10 is defined respectively. Both selected
income ratios refer to the bottom of the income ladder, the poorest 10%. Finally, the
2 Source: http://stats.oecd.org/Index.aspx?DataSetCode=IDD
3 This study utilises inequality indicators but it draws no conclusions regarding the social welfare function.
Hence, the measures of inequality used in this study do not satisfy the Pigou-Dalton condition of social
welfare function. This states that all other things being equal a transfer of utility from the rich to the poor
is desired, as long as it does not bring the rich to a poorer situation than the poor.

11
Palma ratio is the share of all income received by the 10% people with highest disposable
income divided by the share of all income received by the 40% people with the lowest
disposable income. It focuses on the middle 50% that tends to capture around 50% of
Gross Net Income (Palma 2011). Descriptive statistics of the four inequality measures are
provided in Table 1. The variables of interest are not available for all 35 countries in
CPDS III, and so the sample includes 28 countries4.
{Table 1 here}
Figures 1-4 provide plots of the country average of each measure of income inequality
used in this paper. All four figures reveal that the Scandinavian countries have the most
egalitarian distribution of income, in contrast to the USA, Japan and the UK with the
highest level of income inequality. Income inequality is also high for Greece, Spain and
Portugal, countries most severely hit by the repercussions of the austerity policies after
the 2008 Great Recession.
{Figures 1-4 here}
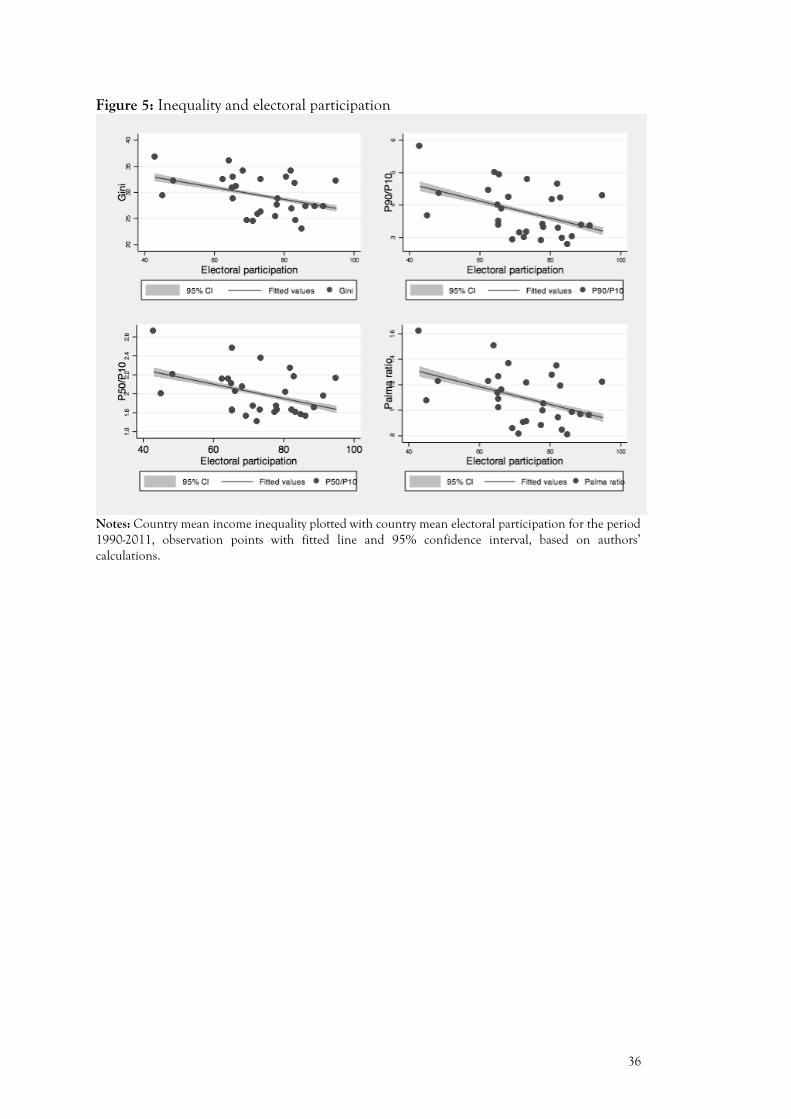
In Figure 5, the country average of each of the four measures of inequality is plotted
against the country average of electoral participation covering the elections during the
period 1990-2011, along with a fitted line and the 95% confidence interval. Regardless
to which measure of inequality is used, the raw data suggest a negative relationship
between the two variables.
4 Data are available for the following 28 countries: Australia, Austria, Belgium, Canada, Czech Republic,
Denmark, Estonia, Finland, France, Germany, Greece, Hungary, Iceland, Ireland, Italy, Japan,
Luxembourg, Netherlands, New Zealand, Norway, Poland, Portugal, Slovakia, Slovenia, Spain, Sweden,
UK and USA.
12
{Figure 5 here}
Empirical Strategy
The aim of the study is to identify the mechanisms driving the negative correlation
between income inequality and political participation, as depicted in Figure 5. The a
priori expectation is that individuals’ participation in parliamentary elections affects
political outcomes, and consequently, directly or indirectly, it influences policies that are
related to the distribution of income within the society. In addition, existing levels of
income inequality affect people’s decision to vote. Therefore, there is a two-way
relationship between income inequality and political participation. However, one
idiosyncratic feature of this relationship is that the realization of electoral participation
is assessed at a specific point in time, namely during the elections, while income
inequality manifests itself over a period of time after the elections take place, implying
an unspecified and staggered lagged effect. Similarly, the effects of inequality on the next
rounds of political participation as reflected on the electoral outcome may also take an
unspecified and staggered fashion to manifest itself. This complication becomes far more
complex when this relationship is examined in a cross country framework. Hence, this
simultaneous nature of the evolution of the electoral participation – income inequality
interrelationship cannot be modeled within the conventional simultaneous equations
statistical context.
To circumvent this difficulty this paper specifies two independent equations: one
describing the effect of electoral participation on inequality for the years following an
election and one examining the effect of past inequality on political participation at the
time of the elections. Therefore, the inequality equation can be described as

13
𝐼i𝑡 = 𝛼 + 𝛽𝑃𝑖𝑒 + 𝑿𝑖𝑡𝛾 + 𝑣𝑖𝑡 (1)
where 𝐼 refers to inequality for country 𝑖 in period 𝑡 , 𝑃 is the level of electoral
participation in the latest parliamentary elections that took place in period 𝑒, where 𝑡 >
𝑒 , and 𝑿 is a vector of other covariates that captures labor market institutional
arrangements, overall economic conditions and redistributive polices. The inequality
equation is estimated for the years after a parliamentary election, without considering
the year of the election5. The term, 𝑣, is the error term that consists of two components,
an unobserved country specific and time-invariant component, 𝜃𝑖, and a random error
component, 휀𝑖𝑡.
The electoral participation equation is described by
𝑃𝑖𝑒 = 𝛿 + 𝜅𝐼𝑖𝑒−1 + 𝒀𝑖𝑒−1휁 + 𝑧𝑖𝑒 (2)
where 𝒀 is a vector of other covariates including electoral rules, and economic conditions
prior to the year of the election. Similar to 𝑣 in equation (1), the error term, 𝑧, contains
an unobserved time-invariant country-specific component, 𝜙𝑖 and a random error
component, 𝜔𝑖𝑒. The explanatory variables in the electoral participation are measured
the year before the election took place and the equation is estimated only for the years
where a parliamentary election took place. The simultaneous relationships between
5 The year of the election is not considered since the income inequality measure may be calculated before
or after the election, and thus it is more difficult to discuss about causality in the election years.

14
electoral participation and economic inequality are empirically investigated using four
alternative estimation procedures.
A candidate estimator for equations (1) and (2) is a fixed-effects estimator that has the
intuitive appeal of controlling for unobserved country-specific characteristics, especially
when there is a concern that the between-group variation is contaminated with
unobserved heterogeneity. However, one main limitation is that fixed-effects estimation
assumes that the country effect is fixed over time, an assumption that unlikely to be
satisfied over the period of 22 years covered in the data. Furthermore, if most of the true
variation in the variables of interest, economic inequality and electoral participation, is
cross-sectional, the fixed-effects estimator removes the true variation, leaving mainly
variations in possible measurement errors (Griliches and Hausman 1986). Therefore, a
potential limitation of fixed-effects regression is that it cannot capture the effects of
variables that have little within-group variation. Further, the fixed-effects approach uses
only the within-group variation. Hence, any time-invariant observable characteristics also
difference out, so that their coefficients cannot be identified, with the effects of invariant
factors simply combined into a single fixed-effect. Furthermore, a further shortcoming of
the fixed-effects estimator is that it cannot remove the resulting biases from omitted
relevant time-varying factors, simultaneous responses to idiosyncratic shocks, or
measurement errors.
An alternative estimator that addresses some of the potential limitations of fixed-
effects is the instrumental variables approach. This method relies on the identification
of valid instruments. The exclusion restriction conditions for valid instruments require
instrumental variables to be correlated with the causal (suspected to be endogenous)
variable and uncorrelated with any other determinant of the dependent variable.
15
However, it is often difficult to find convincing instruments that satisfy these two
requirements. In addition, the regression outcome can be severely biased if the chosen
instruments are weakly correlated with the endogenous variable. A further issue is that
the instrumental variables method assumes monotonicity that implies that the direction
of the effect of the instrument on the endogenous variable is the same for everyone in
the sample. Therefore, while the instrument may have no effect on a sub-group of the
sample, “non-takers” and “always-takers”, all those who are affected, “compliers”, are
affected in the same way. An implication of this assumption is that the estimated effect
is the average treatment for those whose treatment status changed by the instruments
(the compliers), which is called the “local average treatment effect”. Hence the
instrumental variable regression may not be informative about treatment effects on the
never-takers or always-takers.
In view of the above, a third estimator this paper employs is the Mundlak (1978)
methodology. Greene (2008) argues that Mundlak formulation retains the random
effects specification but it also appropriately deals with the problem of any correlation
between the unobserved effects and the regressors. In effect, the Mundlak specification
provides a fixed-effect estimator (Greene 2008, pp. 209-10; Hsiao 1989, p. 45). In
addition, Egger and Pfaffermayr (2002) demonstrate using Monte Carlo simulations that
the Mundlak model provides an approximation of the temporary and permanent effects,
when inference a dynamic model is not feasible. Using Mundlak’s decomposition one
can assume that a subset of the country characteristics, electoral participation and
inequality in equations (1) and (2) respectively, are correlated with a part of the country
random effect. This correlation operates through the mean value of the time-varying set
of variables over the sample lifetime. The Mundlak methodology retains the
16
econometrically ‘correct’ fixed-effect structure through the inclusion of the mean values
of the regressors that are fixed for each country over time. This circumvents the problem
of correlations between unobserved state-specific effects and the regressors. Indeed, the
Mundlak methodology offers an economically interpretable fixed-effect, since changes in
this “fixed-effect” correspond to changes in average of the variables of interest. In view
of the above, the equations to be estimated are:
𝐼𝑖𝑡 = 𝛼 + 𝛽𝑃𝑖𝑒 + �̅��̅�𝑖 + 𝑿𝑖𝑡𝛾 + �̅�𝑖�̅� + 𝜃𝑖 + 휀𝑖𝑡 (3)
and
𝑃𝑖𝑒 = 𝛿 + 𝜅𝐼𝑖𝑒−1 + �̅�𝐼�̅� + 𝒀𝑖𝑒−1휁 + �̅�𝑖휁̅ + 𝜙𝑖 + 𝜔𝑖𝑒 (4)
where �̅�, 𝐼 ,̅ �̅� and �̅� are the country averages over the sample period. The estimated
coefficients of the level variables represent the within-groups effects, whilst the between-
groups effects are identified by the coefficients of the mean variables.
The available longitudinal data allows the decomposition of the estimated effects to
country permanent differences in the explanatory variables and country transitory
changes. The permanent–transitory decomposition using the Mundlak methodology is
appealing especially if the impact of electoral participation (inequality) on inequality
(electoral participation) is not contemporaneous and may take a long time to manifest
itself. The transitory and permanent effects can be identified by using the variable
transformation, suggested by van Praag, Frijters and Ferrer-i-Carbonell (2003) and Ferrer-
i-Carbonell (2005), which transforms equations (3) and (4) to:
𝐼𝑖𝑡 = 𝛼 + 𝛽(𝑃𝑖𝑒 − �̅�𝑖) + (𝛽 + �̅�)�̅�𝑖 + (𝑿𝑖𝑡 − �̅�𝑖)𝛾 + �̅�𝑖(𝛾 + �̅�) + 𝜃𝑖 + 휀𝑖𝑡 (5)
17
and
𝑃𝑖𝑒 = 𝛿 + 𝜅(𝐼𝑖𝑒−1 − 𝐼�̅�) + (𝜅 + �̅�)𝐼�̅� + (𝒀𝑖𝑒−1 − �̅�𝑖)휁 + �̅�𝑖(휁 + 휁)̅ + 𝜙𝑖 + 𝜔𝑖𝑒 (6)
The coefficients 𝛽 , 𝛾 , 𝜅 and 휁 reflect the transitory effects and the coefficients
(𝛽 + �̅�) , (𝛾 + �̅�) , (𝜅 + �̅�) and (휁 + 휁)̅ the corresponding permanent effects.
Equations (5) and (6) are estimated by random effects.
One potential issue with the Mundlak methodology is that there may still be concerns
of endogeneity bias in the estimates if some independent variables, in our case electoral
participation in equation (5) and inequality in equation (6), may correlate with the
country-level random effect. Hausman and Taylor (1981) show that in cases where there
are both time-variant and time-invariant variables of interest, consistent estimation of the
coefficients of interest is possible, if not all of the time-varying coefficients are correlated
with the unobserved heterogeneity. The basic idea is to use the group means of the time-
varying variables that are uncorrelated with the unobserved heterogeneity as instruments
for the time-invariant variables to obtain consistent estimates of their coefficients, while
consistent estimates of the time-varying variable coefficients can be obtained using
standard fixed-effects estimation. This requires that there are at least as many
uncorrelated, exogenous, time-varying variables as correlated time-invariant variables and
also that there is suitable correlation between these. Therefore, in order to deal with the
potential bias, the Hausman-Taylor approach is used on a specification very similar to
the Mundlak specification to test whether the results are robust to this type of
endogeneity.

18
Results and discussion
The effect of electoral participation on inequality
The effect of electoral participation on income inequality is investigated empirically
using the four identification strategies proposed above, a fixed-effects regression, an
instrumental variable with fixed-effects estimator, a random effects Mundlak approach
with a transitory-permanent decomposition, and a Hausman-Taylor estimator using the
same transitory-permanent framework. The regression specification used for the electoral
participation includes controls for union membership, union density, employment
protection strictness, unemployment rate, GDP and population growth. Governments
can affect the distribution of income through taxation and transfers. Thus, tax revenue
of social security funds (as a percentage of GDP), social benefits other than social
transfers in kind (as a percentage of GDP), and total tax revenues (as a percentage of
GDP) are included6 to explain the distribution of income in a country, as measured by
the inequality measure. Similar explanatory variables are used routinely as control
variables in the literature (e.g. Mueller and Stratmann 2003). The results are summarized
in Table 2.
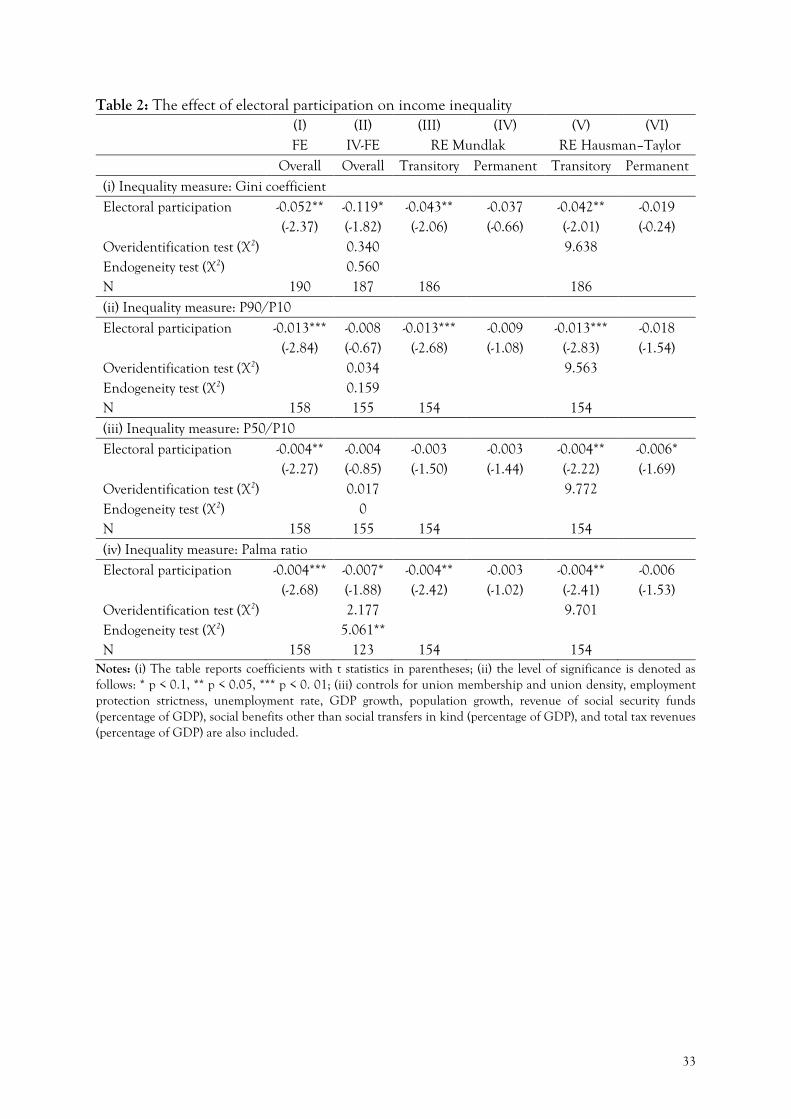
The estimates from the fixed-effects regression and the instrumental variables with
fixed-effects regression are presented in the first two columns. Columns (III) and (IV)
refer to the random effects with Mundlak terms, where there are two coefficients
reported, one on the transitory effect of electoral participation and one on the permanent
effect, 𝛽 and 𝛽 + �̅� using the notation above. The last two columns, (V) and (VI),
present the results from the Hausman-Taylor estimator that address the issue of potential
6 The full set of estimates is available upon request from the authors.
19
endogeneity bias. Table 2 is divided into four panels, one for each income inequality
measure. Therefore, the dependent variable in panel (i) is the Gini coefficient, whereas
the P90/P10 ratio is in panel (ii), the P50/P10 ratio in panel (iii), and the Palma ratio in
panel (iv).
{Table 2 here}
The results from the fixed-effect regression suggest that electoral participation has a
negative effect on all four measures of economic inequality considered. A wider
participation in parliamentary elections is found to reduce inequality, a result that is
consistent with the limited empirical evidence on the effect of political participation on
economic welfare (Mueller and Stratmann 2003). Specifically, the estimates suggest that
an increase in electoral participation by one standard deviation leads to a reduction in
all four measures of inequality of around twenty percent of a standard deviation.
To address some of the limitations of the fixed-effects estimates, the equations are re-
estimated using an instrumental variables regression. For the first three measures of
income inequality, the instruments used for political participation are an index of
electoral fractionalization of the party-system, and a variable that indicates whether it is
a parliamentary, semi-presidential, presidential or hybrid system. The instruments used
for the Palma ratio equation are an index of electoral fractionalization of the party-system,
a variable for consensus democracy based on Lijphart’s first dimension “Parties-
executives”, and an indicator regarding the proportionality of the electoral system.
The exogeneity of the instruments in an exactly identified model cannot be tested.
Hence, the exclusion restrictions, required for identification, are assumed to be valid.
However, when the model is overidentified, as in this case, it is possible to perform a test
for the validity of the overidentifying restrictions using the Sargan-Hansen test. The

20
Sargan-Hansen test assumes that there are enough valid instruments for the model to be
identified and tests whether the remaining instruments are also valid. The Sargan-
Hansen test of overidentifying restrictions, presented in Table 2, provides evidence on
the validity of the overidentifying instruments. The joint null hypothesis is that the
overidentifying instruments are uncorrelated with the error term. A rejection would cast
doubt on their validity. The estimated effect of electoral participation on economic
inequality retains its negative sign, although the effect is statistically significant only when
the inequality is measured by the Gini coefficient or the Palma ratio7. This result may be
an outcome of the inevitable efficiency loss associated with the instrumental variables
estimator and the resulting larger standard errors. Hence, it is always useful to statistically
assess whether the instrumental variables estimation is required. To test this under the
null hypothesis that the specified endogenous regressors can be treated as exogenous, a
Durbin-Wu-Hausman test of endogeneity of regressors is performed and presented in
Table 2. The results for the equations using the Gini coefficient, the P90/P10 ratio and
the P50/P10 ratio do not provide any evidence that electoral participation is endogenous.
It is only when economic inequality is measured by the Palma ratio that the electoral
participation appears to be endogenous. Therefore, although the chosen exclusion
restrictions appear to be valid instruments, there is very limited evidence that the
instrumental variables approach is required. These findings may also be taken to reflect
the complicated nature of the estimated relationship discussed above.
7 The difference in the magnitude of the estimated effects between the instrumental variables and the fixed-
effects regression may be attributed to the fact that the former estimator identifies local average treatment
effects that correspond to the group of “compliers” only.

21
The estimates based on random effects with Mundlak transitory and permanent
decomposition terms, presented in columns (III) and (IV), indicate that electoral
participation has a transitory negative effect on income inequality, which is of similar
magnitude to that estimated with fixed-effects regression. Yet no permanent effects turn
out to be statistically significant. This may be taken to imply that that since elections
normally take place at frequent intervals, it is voters’ participation at the most recent
elections that have the most significant impact. For robustness purposes, the model is re-
estimated using the Hausman-Taylor approach that controls for potential endogeneity
bias in the estimated coefficients of interest. The results remain the same, with the
evidence suggesting the existence of a transitory effect of voters’ participation on income
inequality. The over-identification test also reported in Table 2 provides support to the
exogeneity hypothesis of the generated instruments by the Hausman-Taylor method. The
results from the four alternative estimation strategies employed are remarkably robust
and suggest that larger electoral participation may lead to more egalitarian distribution
of income in the society.
The effect of inequality on electoral participation
The results regarding the effect of inequality on electoral participation are summarized
in Table 3 which has the same structure as Table 2. The specification of the estimated
regression equation is comparable to models commonly used in the literature (e.g.
Mueller and Stratmann 2003; Fumagalli and Narciso 2012). Electoral rules and
constitutions might affect voters’ participation, thus controls for the parliamentary

22
system, compulsory voting legislation8, federalism, and proportional representation are
included. In addition, the population growth is also included since countries with
growing population have a relatively higher incidence of younger voters who, as literature
shows, are expected to have lower participation (Mueller and Stratmann 2003).
Furthermore, GDP growth and the unemployment rate are also included in the
regressions to capture the level of economic activity for the year of the elections.
The fixed-effects results, column (I) in Table 3, suggest that individuals participate less
in the electoral process when there is higher income inequality. Regardless of which
measure of income inequality is considered, an increase in income inequality by one
standard deviation results in a reduction in political participation by around 4 units, one
third of a standard deviation.
The results are confirmed by the instrumental variables estimates, column (II) in Table
3. Voter turnout is lower in countries with more unequal distribution of income. The
instruments used for the Gini coefficient are the social benefits other than social transfers
in kind (as a percentage of GDP), the percentage of women in parliaments, and total tax
revenues (as a percentage of GDP). For the other three measures of income inequality
the chosen instruments are the total tax revenues (as a percentage of GDP) and the
annual deficit (as a percentage of GDP). The Sargan-Hansen overidentification test
supports the exclusion restriction conditions of the instruments and supports the
assumption that they are uncorrelated with the error term. The endogeneity tests
performed do not suggest that any of the four measures of income inequality is
8 Source: http://www.idea.int/uid/fieldview.cfm?field=300
23
endogenous in the estimated electoral participation equation. This, in turn, suggests that
the use of instrumental variables is not statistically supported.
The transitory and permanent effects of inequality on electoral participation are
explored with the use of random effects regression with Mundlak terms, columns (III)
and (IV). The estimates reveal that income inequality has a negative transitory effect on
electoral participation of similar magnitude to that estimated by fixed-effects. In addition,
there also appears to be a negative permanent inequality effect.
As a robustness check, the model using the Hausman-Taylor approach is estimated
(last two columns). Although income inequality does not appear to exhibit any
permanent effect on the electoral participation, the negative transitory effect is
statistically significant. In addition, the over-identification test supports the exogeneity
hypothesis of the identifying restrictions.
{Table 3 here}
Therefore, the empirical evidence offered in this paper suggests that when there is
higher income inequality, there is lower electoral participation (Table 3). Lower electoral
participation is found to increase income inequality (Table 2). The above results from
both the estimated equations taken together reveal that there is a vicious cycle where
unequal distribution of income leads to more inequality through reducing the electoral
participation of the poorer groups in a society. As the estimates suggest, an increase in
income inequality by a standard deviation will trigger a reduction to electoral
participation by one third of a standard deviation which itself will lead to a further
increase in income inequality of around 10 percent of a standard deviation. This
highlights John Stuart Mill’s argument (1861) that unless there is a proportional
24
representation of all people, the government will serve the interests of a privileged
minority.
Conclusion
Over the last three decades there has been a notable increase in economic inequality
accompanied by a decline in political participation in many advanced countries. A
number of studies in the economics and politics literature explore this negative
association between inequality and political participation. This paper explores whether
there is mechanism of self-reinforcing economic inequality through the political
inactivity and exclusion of people from the democratic processes, as proposed by Bartels
(2008). The evidence suggests that although wider participation in parliamentary
elections reduces economic inequality, a more disperse distribution of income has an
adverse effect on electoral participation. The empirical results, therefore, imply that there
is an interrelationship where economic inequality leads to lower political participation,
which subsequently leads to greater inequality. This study contributes to the recent
literature on the self-reinforcing nature of economic inequality (Kelly and Enns, 2010;
Barth, Finseraas, and Moene 2015) by highlighting a mechanism linking income
inequality and electoral participation, that of political exclusion. Democratic processes
are fundamental for the existence of egalitarian societies. However, unless there is wide
participation in the political process from all the segments of the society and all rungs of
the socio-economic ladder, inequitable distribution of income will perpetuate.
25
References
Acemoglu, D. and J. A. Robinson, “Why Did the West Extend the Franchise?” Quarterly
Journal of Economics, 115, 1167-1199, 2000.
---, Economic Origins of Dictatorship and Democracy, New York: Cambridge University
Press, 2006.
---, “Persistence of Power, Elites and Institutions,” American Economic Review, 98, 267-
291, 2008.
Acemoglu, D., J. A Robinson, and R. J. Santos, “The Monopoly of Violence: Evidence
from Colombia,” Journal of the European Economic Association, 11(S1), 5-44, 2013.
Acemoglu, D., J. A. Robinson and R. Torvik, “Why Do Voters Dismantle Checks and
Balances?,” Review of Economic Studies, 80, 845-875, 2013.
Acemoglu, D., S. Naidu, P. Restrepo, and J. A. Robinson, “Democracy, Redistribution,
and Inequality,” In Handbook of Income Distribution, 2, 1885-1966, 2015.
Alesina, A. and E. La Ferrara, “Who Trusts Others?” Journal of Public Economics, 85, 207-
234, 2002.
APSA Task Force. “American Democracy in an Age of Rising Inequality,” Perspectives on
Politics, 2, 651–666, 2004.
Armingeon, K., R. Careja, D. Weisstanner, S. Engler, P. Potolidis, and M. Gerber,
“Comparative Political Data Set III 1990-2011,” Bern: Institute of Political Science,
University of Berne, 2013.
Avery, J.M., "Does Who Votes Matter? Income Bias in Voter Turnout and Economic
Inequality in the American States from 1980 to 2010," Political Behavior, 37, 955-976,
2015.

26
Bartels, L.M., Unequal Democracy: The Political Economy of a New Gilded Age, Princeton,
NJ: Princeton University Press, 2008.
Barth, E., H. Finseraas, and K.O. Moene, “Political Reinforcement: How Rising
Inequality Curbs Manifested Welfare Generosity,” American Journal of Political Science,
59, 565-577, 2015.
Barth, E., and K.O. Moene, “The Equality Multiplier,” IZA Discussion Paper No. 6494,
2012.
Bénabou, R., “Unequal Societies: Income Distribution and the Social Contract,”
American Economic Review, 90, 96–129, 2000.
Boeckmann, R.J. and T.R. Tyler, “Trust, Respect, and the Psychology of Political
Engagement,” Journal of Applied Social Psychology, 32, 2067-2088, 2002.
Boix, C., Democracy and Redistribution, New York: Cambridge University Press, 2003.
Brady, H.E., “An Analytical Perspective on Participatory Inequality and Income
Inequality,” Social Inequality, ed, Kathryn. M. Neckerman, New York: Russell Sage
Foundation: 667–702, 2004.
Brady, D., Rich Democracies, Poor People: How Politics Explain Poverty. New York: Oxford
University Press, 2009.
Dahl, R.A., Polyarchy: Participation and Opposition, New Haven, CT: Yale University Press,
1971.
---, On political equality, New Haven, CT: Yale University Press, 2006.
Egger, P. and M. Pfaffermayr, Long Run and Short Run Effects in Static Panel Models, a paper
provided by International Conferences on Panel Data in its series 10th International
Conference on Panel Data, Berlin, July 5-6, 2002.
http://econpapers.repec.org/cpd/2002/44_Pfaffermayer.pdf

27
Ferrer-i-Carbonell, A., “Income and Well-being: An Empirical Analysis of the
Comparison Income Effect,” Journal of Public Economics, 89, 997-1019, 2005.
Flavin, P., “Income Inequality and Policy Representation in the American States.”
American Politics Research, 40, 29–59, 2012.
Franklin, M.N., Voter Turnout and the Dynamics of Electoral Competition in Established
Democracies since 1945, Cambridge: Cambridge University Press, 2004.
Fumagalli, E. and G. Narciso. “Political Institutions, Voter Turnout, and Policy
Outcomes,” European Journal of Political Economy, 28, 162-173, 2012.
Gaventa, J., Power and Powerlessness: Quiescence and Rebellion in an Appalachian Valley,
Urbana: University of Illinois Press, 1980.
Gilens, M., “Inequality and Democratic Responsiveness.” Public Opinion Quarterly, 69,
778–796, 2005.
---, “Policy Consequences of Representational Inequality.” In P. K. Enns and C. Wlezien,
ed., Who Gets Represented?, New York: Russell Sage Foundation, 2011.
---, Affluence and influence: Economic inequality and political power in America, Princeton:
Princeton University Press, 2012.
Gilens, M. and B.I. Page, “Testing Theories of American Politics: Elites, Interest Groups,
and Average Citizens,” Perspectives on Politics, 12, 564–581, 2014.
Goodin, R. and J. Dryzek, “Rational Participation: The politics of Power,” British Journal
of Political Science, 10, 273-290, 1980.
Greene, W.H. Econometric Analysis, 6th edn. Upper Saddle River, NJ: Prentice Hall,
2008.
Griliches, Z. and J.A. Hausman, “Errors in Variables in Panel Data,” Journal of
Econometrics, 31, 93-118, 1986.
28
Hausman, J.A., and W.E. Taylor, “Panel Data and Unobservable Individual Effects.”
Econometrica, 49: 1377–1398, 1981.
Hill, K.Q., J.E. Leighley, and A. Hinton-Andersson, “Lower-Class Mobilization and
Policy Linkage in the U.S. States.” American Journal of Political Science, 39, 75–86, 1995.
Hsiao, C., Analysis of Panel Data, Econometric Society Monographs, Cambridge, UK:
Cambridge University Press, 1989.
Huckfeldt, R., J. Morehouse Mendez, and T. Osborn, “Disagreement, Ambivalence, and
Engagement: The political Consequences of Heterogeneous Networks,” Political
Psychology, 25, 65-95, 2004.
Iversen, T., Capitalism, Democracy, and Welfare. Cambridge: Cambridge University Press,
2005.
Kelly, N.J., and P.K. Enns, “Inequality and the Dynamics of Public Opinion: The Self-
reinforcing Link between Economic Inequality and Mass Preferences,” American Journal
of Political Science, 54, 855–870, 2010.
Kenworthy, L., and J. Pontusson, “Rising Inequality and the Politics of Redistribution in
Affluent Countries,” Perspectives on Politics, 3, 449-471, 2005.
Leighley, J.E., “Social Interaction and Contextual Influences on Political Participation.”
American Politics Quarterly, 18, 459-475, 1990.
Lister, M., “Institutions, Inequality and Social Norms: Explaining Variations in
Participation,” British Journal of Politics, 9, 20-35, 2007.
Lukes, S., Power: A Radical View, London: Palgrave Macmillan, [1974], 2005.
Lupu, N. and J. Pontusson, “The Structure of Inequality and the Politics of
Redistribution,” American Political Science Review, 105, 316-336, 2011.

29
Mahler, V.A., “Explaining the Subnational Dimensions of Income Inequality: An
Analysis of the Relationship between Inequality and Turnout in the Developed
Countries,” International Studies Quarterly, 46, 117-142, 2002.
---, “Electoral Turnout and Income Redistribution by the State: A Cross-National
Analysis of the Developed Democracies,” European Journal of Political Research, 47, 161-
183, 2008.
Mahler, V.A., D.K. Jesuit, and P.R. Paradowski, “Electoral Turnout and State
Redistribution: A Cross-National Study of 14 Developed Countries,” LIS Working
Paper Series, No. 633, 2015. http://www.lisdatacenter.org/wps/liswps/633.pdf
Marsden, P.V., “Core Discussion Networks of Americans.” American Sociological Review,
52, 122-131, 1987.
McPherson, M., L. Smith-Lovin, and J.M. Cook, “Birds of a Feather: Homophily in
Social Networks,” Annual Review of Sociology, 27: 415-444, 2001.
Meltzer, A.H., and S.F. Richard, “A Rational Theory of the Size of Government.” Journal
of Political Economy, 89, 914–927, 1981.
Merrifield, J., “The Institutional and Political Factors that Influence Voter Turnout,”
Public Choice, 77, 657-667, 1993.
Mill, J.S., Considerations of a Representative Government, London: Parker, Son, & Bourn,
1861. Retrieved 27 January 2015. via Google Books
Moene, K.O., and M. Wallerstein, “Inequality, Social Insurance, and Redistribution.”
American Political Science Review, 95, 859–874, 2001.
Mueller, D.C. and T. Stratmann, “The Economic Effects of Democratic Participation.”
Journal of Public Economics, 87, 2129-2155, 2003.

30
Mundlak, Y., “On the Pooling of Time-Series and Cross-Section Data.” Econometrica, 46,
69-85, 1978.
Oliver, J. E., Democracy in Suburbia, Princeton, N.J.: Princeton University Press, 2001.
Palma, J.G., "Homogeneous Middles vs. Heterogeneous Tails, and the End of the
‘Inverted-U’: the Share of the Rich is What it's All About." Cambridge Working Papers
in Economics 1111, Faculty of Economics, University of Cambridge, 2011.
http://www.econ.cam.ac.uk/dae/repec/cam/pdf/cwpe1111.pdf
Perotti, R., "Political Equilibrium, Income Distribution and Growth." Review of Economic
Studies, 60, 755-776, 1993.
---, "Growth, Income Distribution and Democracy: What the Data Say," Journal of
Economic Growth, 1, 149-188, 1996.
Piketty, T., Capital in the Twenty-first Century, Harvard University Press, 2014.
Ramcharan, R., "Inequality and Redistribution: Evidence from U.S. Counties and States,
1890-1930," Review of Economics and Statistics, 92, 729-744, 2010.
Rigby, E. and G.C. Wright, “Political Parties and Representation of the Poor in the
American States,” American Journal of Political Science, 57, 552–565, 2013.
Roberts, K.W.S., “Voting over Income Tax Schedules.” Journal of Public Economics, 8,
329–340, 1977.
Romer, T., “Individual Welfare, Majority Voting, and the Properties of a Linear Income
Tax,” Journal of Public Economics, 14, 163–85, 1975.
Rosenstone, S.J. and J.M. Hansen, Mobilization, Participation and Democracy in America,
New York: MacMillan, 1993.
Schattschneider, E.E., The Semi-Sovereign People: A Realist's View of Democracy in America,
New York: Holt, Rinehart, and Winston, 1960.
31
Solt, F., “Economic Inequality and Democratic Political Engagement’, American Journal
of Political Science, 52, 48-60, 2008.
Soroka, S.N., and C. Wlezien, “On the Limits of Inequality in Representation,” Political
Science and Politics, 41, 319–327, 2008.
Ura, J.D. and C.R. Ellis, “Income, Preferences, and the Dynamics of Policy
Responsiveness,” Political Science and Politics, 41, 785–794, 2008.
Uslaner, E.M. and M. Brown, “Inequality, Trust, and Civic Engagement,” American
Politics Research, 33, 868-94, 2005.
Van Praag, B., P. Frijters, and A. Ferrer-i-Carbonell, “The Anatomy of Subjective Well-
Being,” Journal of Economic Behavior and Organization, 51, 29-49, 2003.
Verba, S., K.L. Schlozman, and H.E. Brady, Voice and Equality: Civic Voluntarism in
American Politics, Cambridge, Mass.: Harvard University Press, 1995.
Wolfinger, R.E., and S.J. Rosenstone, Who Votes?, New Haven: Yale University Press,
1980.

32
Tables and figures Table1: Descriptive statistics
Mean (SD) Definition
Gini 29.427 (4.228)
The Gini coefficient is based on the comparison of cumulative proportions of the population against cumulative proportions of income they receive, and it ranges between 0 in the case of perfect equality and 100 in the case of perfect inequality
P90/P10 3.744 (0.778)
The P90/P10 ratio is the ratio of the upper bound value of the ninth decile (i.e. the 10% of people with highest income) to that of the upper bound value of the first decile
P50/P10 1.991 (0.241)
The P50/P10 ratio is the ratio of the median income to that of the upper bound value of the first decile
Palma ratio 1.090 (0.223)
The Palma ratio is the share of all income received by the 10% people with highest disposable income divided by the share of all income received by the 40% people with the lowest disposable income
Electoral participation 69.904 (13.101)
Voter turnout in the latest parliamentary election
33
Table 2: The effect of electoral participation on income inequality (I) (II) (III) (IV) (V) (VI)
FE IV-FE RE Mundlak RE Hausman–Taylor Overall Overall Transitory Permanent Transitory Permanent
(i) Inequality measure: Gini coefficient Electoral participation -0.052** -0.119* -0.043** -0.037 -0.042** -0.019 (-2.37) (-1.82) (-2.06) (-0.66) (-2.01) (-0.24) Overidentification test (X2) 0.340 9.638
Endogeneity test (X2) 0.560
N 190 187 186 186
(ii) Inequality measure: P90/P10 Electoral participation -0.013*** -0.008 -0.013*** -0.009 -0.013*** -0.018 (-2.84) (-0.67) (-2.68) (-1.08) (-2.83) (-1.54) Overidentification test (X2) 0.034 9.563
Endogeneity test (X2) 0.159
N 158 155 154 154
(iii) Inequality measure: P50/P10 Electoral participation -0.004** -0.004 -0.003 -0.003 -0.004** -0.006* (-2.27) (-0.85) (-1.50) (-1.44) (-2.22) (-1.69) Overidentification test (X2) 0.017 9.772
Endogeneity test (X2) 0
N 158 155 154 154
(iv) Inequality measure: Palma ratio Electoral participation -0.004*** -0.007* -0.004** -0.003 -0.004** -0.006 (-2.68) (-1.88) (-2.42) (-1.02) (-2.41) (-1.53) Overidentification test (X2) 2.177 9.701
Endogeneity test (X2) 5.061**
N 158 123 154 154
Notes: (i) The table reports coefficients with t statistics in parentheses; (ii) the level of significance is denoted as follows: * p < 0.1, ** p < 0.05, *** p < 0. 01; (iii) controls for union membership and union density, employment protection strictness, unemployment rate, GDP growth, population growth, revenue of social security funds (percentage of GDP), social benefits other than social transfers in kind (percentage of GDP), and total tax revenues (percentage of GDP) are also included.

34
Table 3: The effect of income inequality on electoral participation (I) (II) (III) (IV) (V) (VI)
FE IV-FE RE Mundlak RE Hausman–Taylor Overall Overall Transitory Permanent Transitory Permanent (i) Electoral Participation Gini(t-1) -1.065*** -1.524*** -1.025*** -1.315** -1.030*** -1.22 (-2.72) (-2.61) (-2.79) (-2.58) (-2.60) (-1.12) Overidentification test (X2)
1.77 2.809
Endogeneity test (X2)
0.645
N 84 79 84 84
(ii) Electoral Participation
P90/P10(t-1) -5.073*** -6.246*** -4.963*** -7.605*** -4.923*** -3.743 (-3.52) (-3.11) (-3.59) (-3.36) (-3.30) (-0.80) Overidentification test (X2)
0.226 2.701
Endogeneity test (X2)
0.64
N 68 63 68 68
(iii) Electoral Participation P50/P10(t-1) -12.68*** -17.53*** -12.72*** -25.04*** -12.43*** -7.351 (-3.18) (-3.01) (-3.32) (-3.44) (-2.93) (-0.38) Overidentification test (X2)
0.138 2.587
Endogeneity test (X2)
0.7102
N 68 63 68 68
(iv) Electoral Participation Palma ratio(t-1) -17.668*** -20.337** -17.430*** -25.745*** -17.287*** -17.857 (-3.74) (-2.83) (-3.92) (-2.93) (-3.58) (-1.10) Overidentification test (X2)
2.295 2.235
Endogeneity test (X2)
0.225
N 68 63 68 68
Notes: (i) The table reports coefficients with t statistics in parentheses; (ii) the level of significance is denoted as follows: * p < 0.1, ** p < 0.05, *** p < 0.01; (iii) controls for parliamentary system, compulsory voting legislation, federalism, proportional representation, unemployment rate (at t-1), GDP growth (at t-1), and population growth (at t-1) are also included.

35
Figure 1: Gini coefficient
Notes: Country averages of Gini coefficient for the period 1990-2011, based on authors’ calculations.
Figure 3: P50/P10 ratio
Notes: Country averages of P50/P10 ratio for the period 1990-2011, based on authors’ calculations.
Figure 2: P90/P10 ratio
Notes: Country averages of P90/P10 ratio for the period 1990-2011, based on authors’ calculations.
Figure 4: Palma ratio
Notes: Country averages of Palma ratio for the period 1990-2011, based on authors’ calculations.
36
Figure 5: Inequality and electoral participation
Notes: Country mean income inequality plotted with country mean electoral participation for the period 1990-2011, observation points with fitted line and 95% confidence interval, based on authors’ calculations.
Recommended