World Bank – Poverty and Economic Management Network (PREM), South Sudan, 2012 P a g e | 1
Inflation in South Sudan 1. Background & Summary South Sudan’s current macroeconomic performance is being significantly affected
by the closure of oil production. In this context, understanding the dynamics of
last year’s sharp price increases appears particularly relevant, as high inflation
harms the economy, complicates policy making, can create political instability,
and also has a significant negative impact on the poor. For more than a year,
South Sudan has been facing high levels of inflation. As of early 2012, the price level
is twice as high as it was before the referendum in January 2011. A weakening
currency, as a result of the stop in oil exports in January 2012, is likely to fuel
further price increases. Such fast rising prices render economic transactions and
trade challenging. Moreover, effective policy formulation and economic planning
becomes difficult with high inflation. Most importantly, rising prices impact
people’s welfare through reduced purchasing power and tend to cause increased
food insecurity and poverty, even among rural populations not directly involved in
the modern cash economy. Such welfare effects can easily become another source
of tension in an already fragile context. Neighboring countries, such as Kenya,
Uganda and Sudan have in recent months seen social unrest and political upheaval
over much lower rates of inflation than what South Sudan currently is facing.
Addressing inflation is therefore not only important from an economic perspective,
but also vital to ensure political stability and security in South Sudan.
This note identifies a number of factors that, combined, have contributed to
South Sudan’s high level of inflation. A key driver of inflation is the significant
weakening of the currency, which has led to higher prices of imported food. In
addition to the effects from the weaker currency, prices of imports have also picked
up because of supply constraints related to border restrictions with Sudan and
import bottlenecks along the southern border with Uganda and Kenya. South
Sudan’s rapidly expanding aggregate demand, combined with logistics constraints
for imports, has also contributed to bringing prices up across the economy.
Although global and regional price trends have had a clear impact on prices in South
Sudan in previous years, such external factors cannot explain the level of price
increases seen over the past year.
Although inflation has eased in December 2011 and January 2012 because of the
relative strengthening of the South Sudanese Pound (SSP), the shutdown in oil
production could lead to further price hikes because of a weakened currency.
Without exporting oil, South Sudan’s foreign currency earnings will be highly
diminished. Unless foreign currency earnings are re-established, further
depreciation of the SSP seems inevitable. A depreciation of the currency will make
imports more expensive and lead to higher prices. This effect is likely to be
particularly severe in the coming months, with the country entering the lean season
during which most of the country depends on imported food. In addition to
currency effects, policies aimed at reducing the fiscal gap resulting from lack of oil
revenues, such as sales taxes, import duties, and printing money, would also fuel
domestic inflation. Unless the fiscal and currency challenges are tackled, the
economy is likely to experience stagflation – the combination of a deep contraction
in output and high inflation.
World Bank
South Sudan Economic Brief
Issue No.1, April 2012
This is the first in a series of
briefs on economic policy, public
expenditure management and
current development challenges
in South Sudan, published by the
World Bank.
Acknowledgements: The note relies on two main data
sources: the National Bureau of Statistics
(NBS) official price data and indices, as
well as food price and food security data
from the World Food Program (WFP)
VAM and CFSAM. The World Bank is
grateful for data and assistance provided
by these institutions in drafting of this
note. Moreover, the World Bank is
grateful for the comments and
suggestions provided by attendees at the
Juba Technical Economist Working Group
on March 1st.
This note was prepared principally by
Espen B Prydz ([email protected]),
under the direction of the Task Team
Leaders and the Lead Economist.
Task Team Leaders: Jane Kiringai
([email protected]) ; Gabriel
Demombynes
Lead Economist: Paolo Zacchia
Sector Manager: Humberto Lopez
Comments should be submitted to
Pub
lic D
iscl
osur
e A
utho
rized
Pub
lic D
iscl
osur
e A
utho
rized
Pub
lic D
iscl
osur
e A
utho
rized
Pub
lic D
iscl
osur
e A
utho
rized
Pub
lic D
iscl
osur
e A
utho
rized
Pub
lic D
iscl
osur
e A
utho
rized
Pub
lic D
iscl
osur
e A
utho
rized
Pub
lic D
iscl
osur
e A
utho
rized
World Bank – Poverty and Economic Management Network (PREM), South Sudan, 2012 P a g e | 2
Figure 1: The price level increased rapidly during 2011
Figure 2: High year-on-year inflation rates in 2011
Figure 3: Month-to-month inflation has been variable
Figure 4: High inflation in all categories of goods
Figure 5: Food contributed the most to the price increases
Figure 6: Price increases lower in Juba than elsewhere
Dec
-09
Jan
-10
Feb
-10
Mar
-10
Ap
r-10
May
-10
Jun
-10
Jul-
10
Au
g-10
Sep
-10
Oct
-10
No
v-10
Dec
-10
Jan
-11
Feb
-11
Mar
-11
Ap
r-11
May
-11
Jun
-11
Jul-
11
Au
g-11
Sep
-11
Oct
-11
No
v-11
Dec
-11
Jan
-12
60
70
80
90
100
110
120
130
140
Co
nsu
me
r P
rice
Ind
ex
(CP
I) J
un
e 2
01
1=1
00
Dec
-09
Jan
-10
Feb
-10
Mar
-10
Ap
r-10
May
-10
Jun
-10
Jul-
10
Au
g-10
Sep
-10
Oct
-10
No
v-10
Dec
-10
Jan
-11
Feb
-11
Mar
-11
Ap
r-11
May
-11
Jun
-11
Jul-
11
Au
g-11
Sep
-11
Oct
-11
No
v-11
Dec
-11
Jan
-12
0%
10%
20%
30%
40%
50%
60%
70%
80%
90%
Co
nsu
me
r P
rice
Ind
ex
(CP
I) J
un
e 2
01
1=1
00
-10.0%
-5.0%
0.0%
5.0%
10.0%
15.0%
20.0%
Dec
-10
Jan
-11
Feb
-11
Mar
-11
Ap
r-1
1
May
-11
Jun
-11
Jul-
11
Au
g-1
1
Sep
-11
Oct
-11
No
v-1
1
Dec
-11
Jan
-12
Monthly inflation Montly inflation food
30%
32%
32%
41%
44%
44%
111%
205%
0% 50% 100% 150% 200% 250%
Miscellaneous
Restaurants and hotels
Housing, water and fuel
Food and drinks
Recreation and culture
Transport
Furnishings, household
Alcoholic beverages
Annual inflation (Jan 2011 - Jan 2012)
-10
0
10
20
30
40
50
60
70
80
Ap
r-0
8
Jul-
08
Oct
-08
Jan
-09
Ap
r-0
9
Jul-
09
Oct
-09
Jan
-10
Ap
r-1
0
Jul-
10
Oct
-10
Jan
-11
Ap
r-1
1
Jul-
11
Oct
-11
Jan
-12
Food and drinks Housing, water and fuel Other
100.0
120.0
140.0
160.0
180.0
200.0
220.0
June 2011
July 2011
Aug 2011
Sep 2011
Oct 2011
Nov 2011
Dec 2011
Jan 2012
CP
I (P
irce
leve
l)
Juba Malakal Wau All
World Bank – Poverty and Economic Management Network (PREM), South Sudan, 2012 P a g e | 3
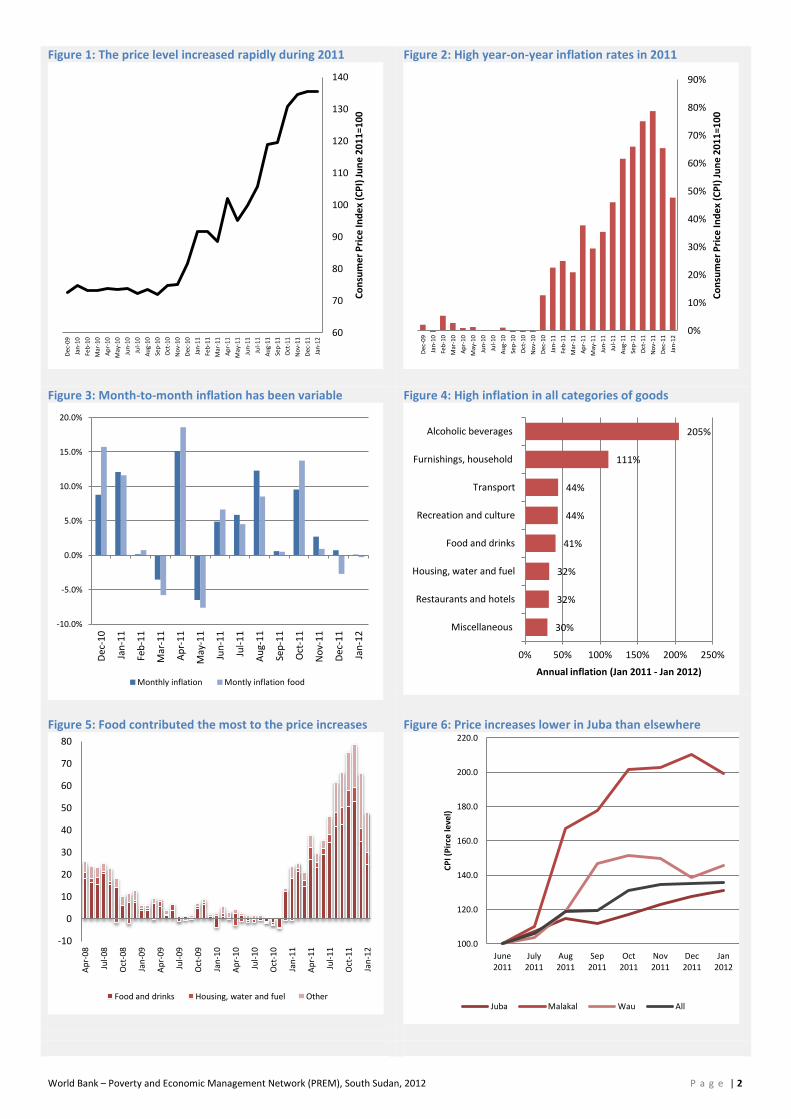
2. Recent trends in prices in South Sudan Prices in South Sudan started climbing fast in the 2nd half of 2010 and had nearly doubled by the end of 2011.
Figure 1 shows the development of the consumer price indices (CPI) in South Sudan over the past two years. The CPI
measures the price of representative basket of goods typically consumed by South Sudanese households and is
therefore a measure of the overall price level faced by South Sudanese consumers. As shown in Figure 1, the price
level in South Sudan was relatively stable until the end of 2010, but then increased dramatically during most of 2011.
Price increases slowed down in the last two months of 2011 and early 2012.
The annual headline inflation rate (Figure 2), which is the percentage change in the price level over a 12 month
period, reached a high of 79% in November 2011. In January 2012, the annual inflation rate was down to 48%. The
relatively large fall in the annual headline inflation figure from 79% in November 2011 to 48% in January 2012 does
however not imply that the overall price level has fallen, but just that prices have stabilized in December 2011 and
January 2012. Even with stable prices, it would take 12 months for the year-on-year inflation rate to fall to zero.
Monthly price changes, which are a more intuitive indicator to understand short term price changes, have been
variable throughout 2011. As seen in Figure 3, the months of November, December and January showed a distinct
slowing down in monthly price increases.
Inflation has been high, but variable, across all categories of goods and services. Figure 4 breaks down annual price
increases in broad categories of goods collected in the monthly price surveys conducted by the National Bureau of
Statistics. Particularly concerning is the high increase in food prices seen over the past year, since food inflation
typically hurts the poor disproportionately, due to the higher share of food in the poor’s consumption basket. With
a national poverty headcount at 51%, such high food price inflation can be critical in the case of South Sudan.
Although some poor rural households may be net producers of food (producing more than they consume), and thus
less impacted by the high food inflation, the very limited agricultural sector in South Sudan and the unusually high
reliance of imported food suggest that the poor are also dependent on foreign imports, which have been severely
affected by inflation. For more details on how inflation is affecting the poor in South Sudan, please see Box 1.
The increases in prices have varied throughout the country and have been much lower in Juba than in other areas.
Figure 6 shows separate CPIs for the three locations where NBS has collected price statistics from June 2011: Wau,
Malakal and Juba. In Malakal, the prices have more than doubled in just half a year, while in Juba the increase has
been close to 30 % over the same period. NBS calculates the national CPI using 15% weights for Wau and Malakal
and 70% for Juba. Since the price developments have been so different across the country, it is important to consider
this significant geographic variation when analyzing drivers and impacts of the price changes.
During 2011, the high level of inflation has mainly been due to increases in imported and local food products.
Although price increases have been large in other categories, food products account for about three-quarters of the
basket of goods used in South Sudan’s Consumer Price Index (CPI), and have therefore been the main contributor to
high levels of overall inflation. Figure 5 shows the relative contribution to CPI-inflation of different categories of
products. It shows that food is the most important category, responsible for 70-90% of inflation over most of the
past 12 months, with a declining share in recent months.
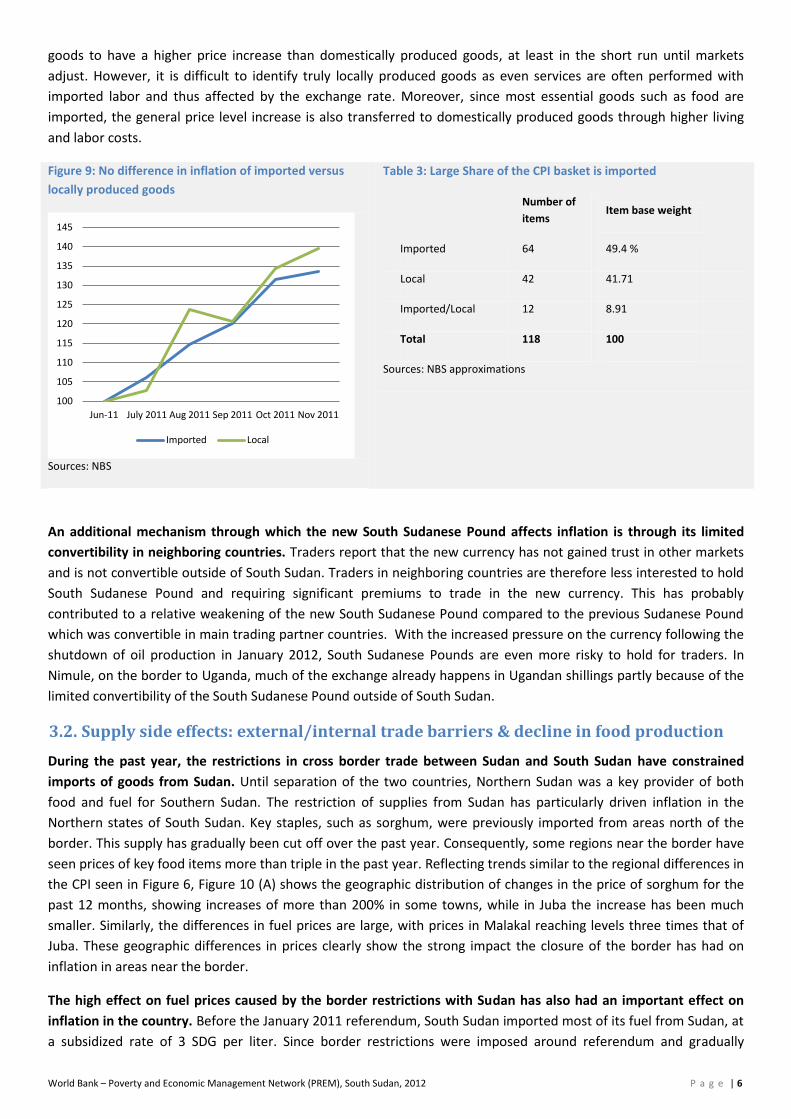
Key staple food products have contributed most to the increases in cost of living for the average South Sudanese
consumer. Table 1 ranks the ten items which have contributed most to inflation over the last half of 2011. Notably,
important food products such as sorghum (both grain and flour) and sugar are the most important drivers of
inflation, seeing large price changes and also constituting a large share of the typical consumption basket. Both
mainly imported and mainly locally produced goods are among these key drivers of inflation. This table reflects the
drivers of inflation more accurately than the categorical breakdown in Figure 4, as it takes the weights (share of
household expenditure on each of the goods) into account.
World Bank – Poverty and Economic Management Network (PREM), South Sudan, 2012 P a g e | 4
Key political developments in South Sudan over the past year seem to be associated with the two accelerations of
inflation in South Sudan seen over the past year. As illustrated in Figure 7, at the end of 2010, the initial pickup of
inflation took place leading up to the referendum, a period with political tensions during which border restrictions
with the North were imposed. The second acceleration happened at independence in July 2011, when South Sudan
issued its own currency and the border between Sudan and South Sudan was closed.
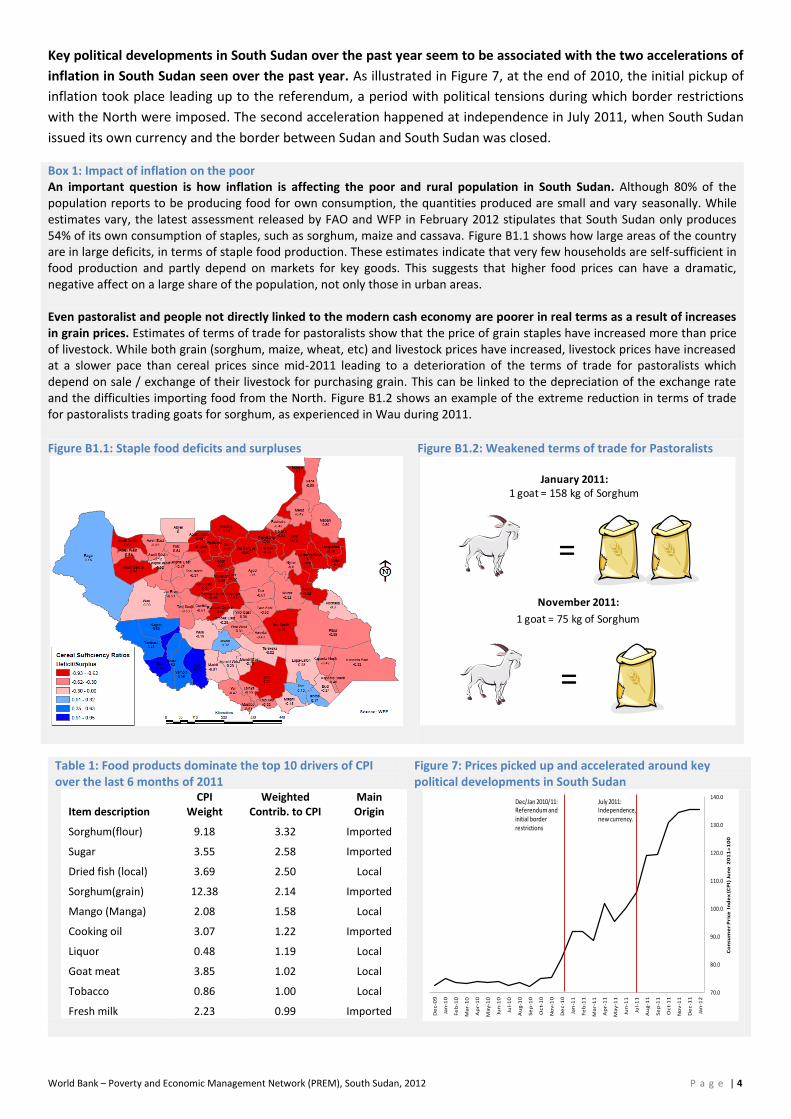
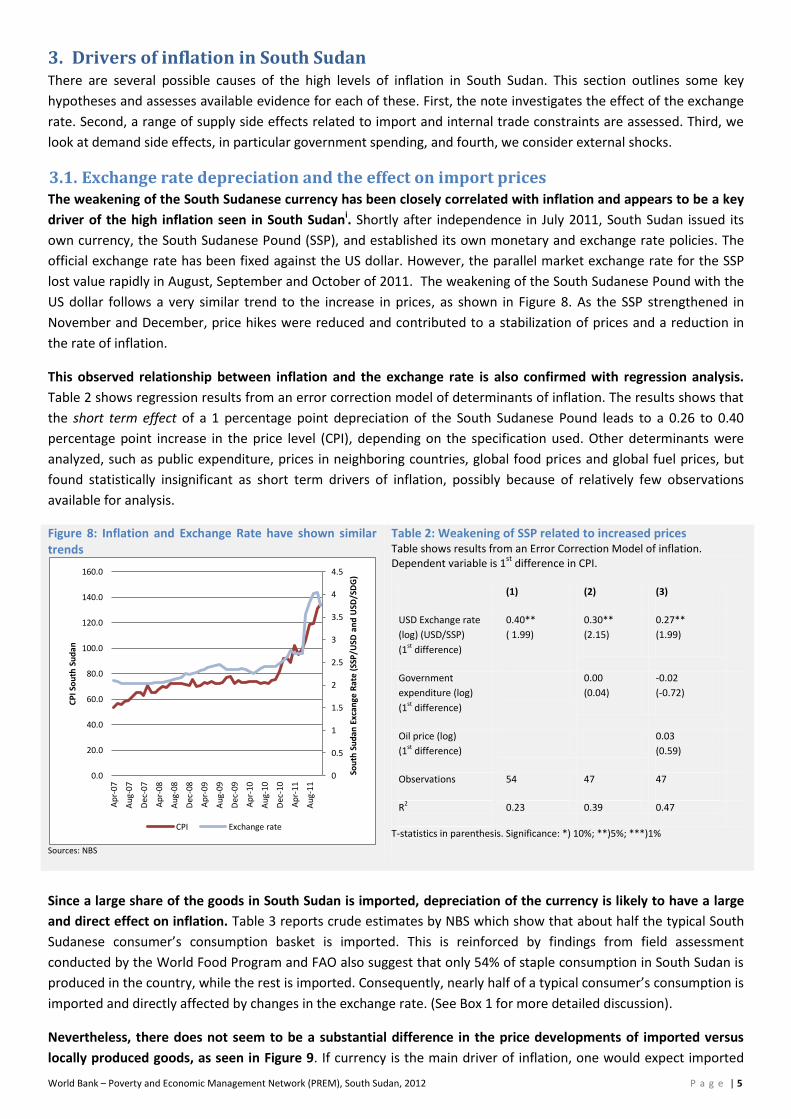
Box 1: Impact of inflation on the poor An important question is how inflation is affecting the poor and rural population in South Sudan. Although 80% of the population reports to be producing food for own consumption, the quantities produced are small and vary seasonally. While estimates vary, the latest assessment released by FAO and WFP in February 2012 stipulates that South Sudan only produces 54% of its own consumption of staples, such as sorghum, maize and cassava. Figure B1.1 shows how large areas of the country are in large deficits, in terms of staple food production. These estimates indicate that very few households are self-sufficient in food production and partly depend on markets for key goods. This suggests that higher food prices can have a dramatic, negative affect on a large share of the population, not only those in urban areas. Even pastoralist and people not directly linked to the modern cash economy are poorer in real terms as a result of increases in grain prices. Estimates of terms of trade for pastoralists show that the price of grain staples have increased more than price of livestock. While both grain (sorghum, maize, wheat, etc) and livestock prices have increased, livestock prices have increased at a slower pace than cereal prices since mid-2011 leading to a deterioration of the terms of trade for pastoralists which depend on sale / exchange of their livestock for purchasing grain. This can be linked to the depreciation of the exchange rate and the difficulties importing food from the North. Figure B1.2 shows an example of the extreme reduction in terms of trade for pastoralists trading goats for sorghum, as experienced in Wau during 2011.
Figure B1.1: Staple food deficits and surpluses
Figure B1.2: Weakened terms of trade for Pastoralists
Table 1: Food products dominate the top 10 drivers of CPI over the last 6 months of 2011
Figure 7: Prices picked up and accelerated around key political developments in South Sudan
Item description CPI
Weight Weighted
Contrib. to CPI Main Origin
Sorghum(flour) 9.18 3.32 Imported
Sugar 3.55 2.58 Imported
Dried fish (local) 3.69 2.50 Local
Sorghum(grain) 12.38 2.14 Imported
Mango (Manga) 2.08 1.58 Local
Cooking oil 3.07 1.22 Imported
Liquor 0.48 1.19 Local
Goat meat 3.85 1.02 Local
Tobacco 0.86 1.00 Local
Fresh milk 2.23 0.99 Imported
November 2011:
1 goat = 75 kg of Sorghum
January 2011: 1 goat = 158 kg of Sorghum
=
=
De
c-0
9
Jan
-10
Fe
b-1
0
Ma
r-1
0
Ap
r-1
0
Ma
y-1
0
Jun
-10
Jul-
10
Au
g-1
0
Se
p-1
0
Oc
t-1
0
No
v-1
0
De
c-1
0
Jan
-11
Fe
b-1
1
Ma
r-1
1
Ap
r-1
1
Ma
y-1
1
Jun
-11
Jul-
11
Au
g-1
1
Se
p-1
1
Oc
t-1
1
No
v-1
1
De
c-1
1
Jan
-12
70.0
80.0
90.0
100.0
110.0
120.0
130.0
140.0
Co
nsu
me
r P
rice
In
de
x (
CP
I) J
un
e 2
01
1=
10
0
Dec/Jan 2010/11: Referendum and initial border restrictions
July 2011: Independence, new currency.
World Bank – Poverty and Economic Management Network (PREM), South Sudan, 2012 P a g e | 5
3. Drivers of inflation in South Sudan There are several possible causes of the high levels of inflation in South Sudan. This section outlines some key
hypotheses and assesses available evidence for each of these. First, the note investigates the effect of the exchange
rate. Second, a range of supply side effects related to import and internal trade constraints are assessed. Third, we
look at demand side effects, in particular government spending, and fourth, we consider external shocks.
3.1. Exchange rate depreciation and the effect on import prices The weakening of the South Sudanese currency has been closely correlated with inflation and appears to be a key
driver of the high inflation seen in South Sudani. Shortly after independence in July 2011, South Sudan issued its
own currency, the South Sudanese Pound (SSP), and established its own monetary and exchange rate policies. The
official exchange rate has been fixed against the US dollar. However, the parallel market exchange rate for the SSP
lost value rapidly in August, September and October of 2011. The weakening of the South Sudanese Pound with the
US dollar follows a very similar trend to the increase in prices, as shown in Figure 8. As the SSP strengthened in
November and December, price hikes were reduced and contributed to a stabilization of prices and a reduction in
the rate of inflation.
This observed relationship between inflation and the exchange rate is also confirmed with regression analysis.
Table 2 shows regression results from an error correction model of determinants of inflation. The results shows that
the short term effect of a 1 percentage point depreciation of the South Sudanese Pound leads to a 0.26 to 0.40
percentage point increase in the price level (CPI), depending on the specification used. Other determinants were
analyzed, such as public expenditure, prices in neighboring countries, global food prices and global fuel prices, but
found statistically insignificant as short term drivers of inflation, possibly because of relatively few observations
available for analysis.
Figure 8: Inflation and Exchange Rate have shown similar trends
Sources: NBS
Table 2: Weakening of SSP related to increased prices Table shows results from an Error Correction Model of inflation. Dependent variable is 1
st difference in CPI.
(1) (2) (3)
USD Exchange rate
(log) (USD/SSP)
(1st difference)
0.40**
( 1.99)
0.30**
(2.15)
0.27**
(1.99)
Government
expenditure (log)
(1st difference)
0.00
(0.04)
-0.02
(-0.72)
Oil price (log)
(1st difference)
0.03
(0.59)
Observations 54 47 47
R2
0.23 0.39 0.47
T-statistics in parenthesis. Significance: *) 10%; **)5%; ***)1%
Since a large share of the goods in South Sudan is imported, depreciation of the currency is likely to have a large
and direct effect on inflation. Table 3 reports crude estimates by NBS which show that about half the typical South
Sudanese consumer’s consumption basket is imported. This is reinforced by findings from field assessment
conducted by the World Food Program and FAO also suggest that only 54% of staple consumption in South Sudan is
produced in the country, while the rest is imported. Consequently, nearly half of a typical consumer’s consumption is
imported and directly affected by changes in the exchange rate. (See Box 1 for more detailed discussion).
Nevertheless, there does not seem to be a substantial difference in the price developments of imported versus
locally produced goods, as seen in Figure 9. If currency is the main driver of inflation, one would expect imported
0
0.5
1
1.5
2
2.5
3
3.5
4
4.5
0.0
20.0
40.0
60.0
80.0
100.0
120.0
140.0
160.0
Ap
r-0
7
Au
g-0
7
Dec
-07
Ap
r-0
8
Au
g-0
8
Dec
-08
Ap
r-0
9
Au
g-0
9
Dec
-09
Ap
r-1
0
Au
g-1
0
Dec
-10
Ap
r-1
1
Au
g-1
1
Sou
th S
ud
an E
xcan
ge R
ate
(SSP
/USD
an
d U
SD/S
DG
)
CP
I So
uth
Su
dan
CPI Exchange rate
World Bank – Poverty and Economic Management Network (PREM), South Sudan, 2012 P a g e | 6
goods to have a higher price increase than domestically produced goods, at least in the short run until markets
adjust. However, it is difficult to identify truly locally produced goods as even services are often performed with
imported labor and thus affected by the exchange rate. Moreover, since most essential goods such as food are
imported, the general price level increase is also transferred to domestically produced goods through higher living
and labor costs.
Figure 9: No difference in inflation of imported versus
locally produced goods
Sources: NBS
Table 3: Large Share of the CPI basket is imported
Number of
items Item base weight
Imported 64 49.4 %
Local 42 41.71
Imported/Local 12 8.91
Total 118 100
Sources: NBS approximations
An additional mechanism through which the new South Sudanese Pound affects inflation is through its limited
convertibility in neighboring countries. Traders report that the new currency has not gained trust in other markets
and is not convertible outside of South Sudan. Traders in neighboring countries are therefore less interested to hold
South Sudanese Pound and requiring significant premiums to trade in the new currency. This has probably
contributed to a relative weakening of the new South Sudanese Pound compared to the previous Sudanese Pound
which was convertible in main trading partner countries. With the increased pressure on the currency following the
shutdown of oil production in January 2012, South Sudanese Pounds are even more risky to hold for traders. In
Nimule, on the border to Uganda, much of the exchange already happens in Ugandan shillings partly because of the
limited convertibility of the South Sudanese Pound outside of South Sudan.
3.2. Supply side effects: external/internal trade barriers & decline in food production
During the past year, the restrictions in cross border trade between Sudan and South Sudan have constrained
imports of goods from Sudan. Until separation of the two countries, Northern Sudan was a key provider of both
food and fuel for Southern Sudan. The restriction of supplies from Sudan has particularly driven inflation in the
Northern states of South Sudan. Key staples, such as sorghum, were previously imported from areas north of the
border. This supply has gradually been cut off over the past year. Consequently, some regions near the border have
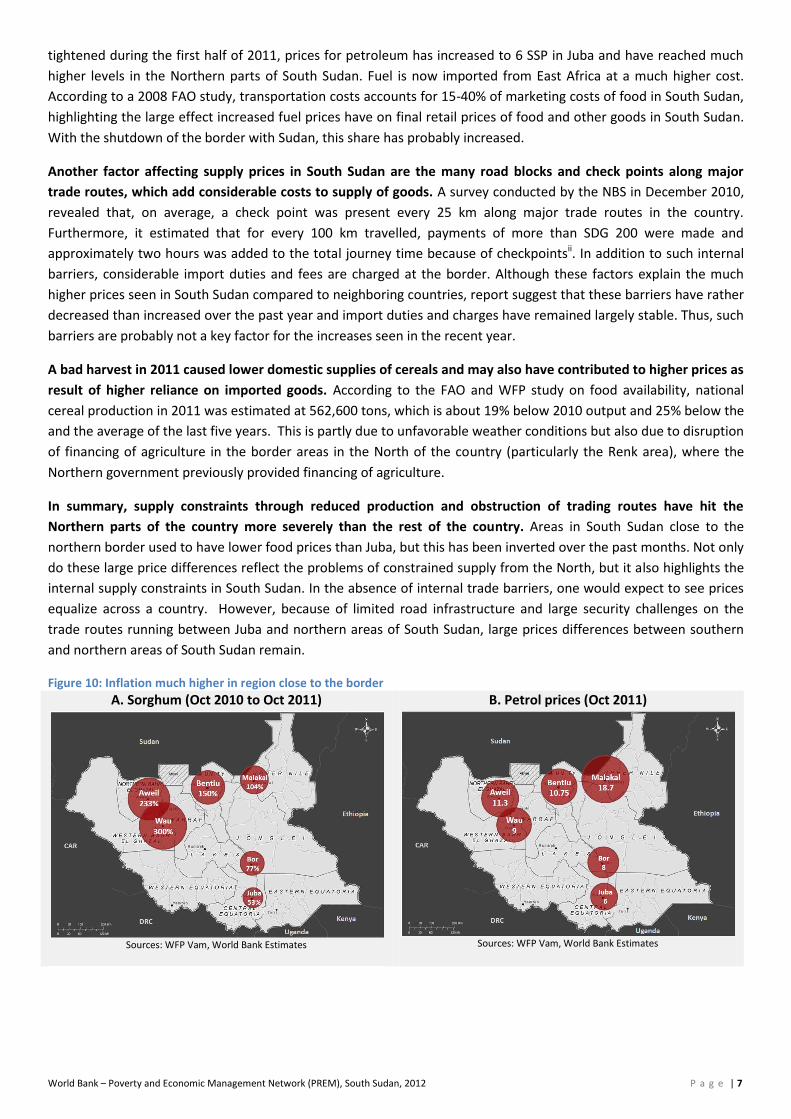
seen prices of key food items more than triple in the past year. Reflecting trends similar to the regional differences in
the CPI seen in Figure 6, Figure 10 (A) shows the geographic distribution of changes in the price of sorghum for the
past 12 months, showing increases of more than 200% in some towns, while in Juba the increase has been much
smaller. Similarly, the differences in fuel prices are large, with prices in Malakal reaching levels three times that of
Juba. These geographic differences in prices clearly show the strong impact the closure of the border has had on
inflation in areas near the border.
The high effect on fuel prices caused by the border restrictions with Sudan has also had an important effect on
inflation in the country. Before the January 2011 referendum, South Sudan imported most of its fuel from Sudan, at
a subsidized rate of 3 SDG per liter. Since border restrictions were imposed around referendum and gradually
100
105
110
115
120
125
130
135
140
145
Jun-11 July 2011 Aug 2011 Sep 2011 Oct 2011 Nov 2011
Imported Local
World Bank – Poverty and Economic Management Network (PREM), South Sudan, 2012 P a g e | 7
tightened during the first half of 2011, prices for petroleum has increased to 6 SSP in Juba and have reached much
higher levels in the Northern parts of South Sudan. Fuel is now imported from East Africa at a much higher cost.
According to a 2008 FAO study, transportation costs accounts for 15-40% of marketing costs of food in South Sudan,
highlighting the large effect increased fuel prices have on final retail prices of food and other goods in South Sudan.
With the shutdown of the border with Sudan, this share has probably increased.
Another factor affecting supply prices in South Sudan are the many road blocks and check points along major
trade routes, which add considerable costs to supply of goods. A survey conducted by the NBS in December 2010,
revealed that, on average, a check point was present every 25 km along major trade routes in the country.
Furthermore, it estimated that for every 100 km travelled, payments of more than SDG 200 were made and
approximately two hours was added to the total journey time because of checkpointsii. In addition to such internal
barriers, considerable import duties and fees are charged at the border. Although these factors explain the much
higher prices seen in South Sudan compared to neighboring countries, report suggest that these barriers have rather
decreased than increased over the past year and import duties and charges have remained largely stable. Thus, such
barriers are probably not a key factor for the increases seen in the recent year.
A bad harvest in 2011 caused lower domestic supplies of cereals and may also have contributed to higher prices as
result of higher reliance on imported goods. According to the FAO and WFP study on food availability, national
cereal production in 2011 was estimated at 562,600 tons, which is about 19% below 2010 output and 25% below the
and the average of the last five years. This is partly due to unfavorable weather conditions but also due to disruption
of financing of agriculture in the border areas in the North of the country (particularly the Renk area), where the
Northern government previously provided financing of agriculture.
In summary, supply constraints through reduced production and obstruction of trading routes have hit the
Northern parts of the country more severely than the rest of the country. Areas in South Sudan close to the
northern border used to have lower food prices than Juba, but this has been inverted over the past months. Not only
do these large price differences reflect the problems of constrained supply from the North, but it also highlights the
internal supply constraints in South Sudan. In the absence of internal trade barriers, one would expect to see prices
equalize across a country. However, because of limited road infrastructure and large security challenges on the
trade routes running between Juba and northern areas of South Sudan, large prices differences between southern
and northern areas of South Sudan remain.
Figure 10: Inflation much higher in region close to the border
A. Sorghum (Oct 2010 to Oct 2011)
Sources: WFP Vam, World Bank Estimates
B. Petrol prices (Oct 2011)
Sources: WFP Vam, World Bank Estimates
World Bank – Poverty and Economic Management Network (PREM), South Sudan, 2012 P a g e | 8
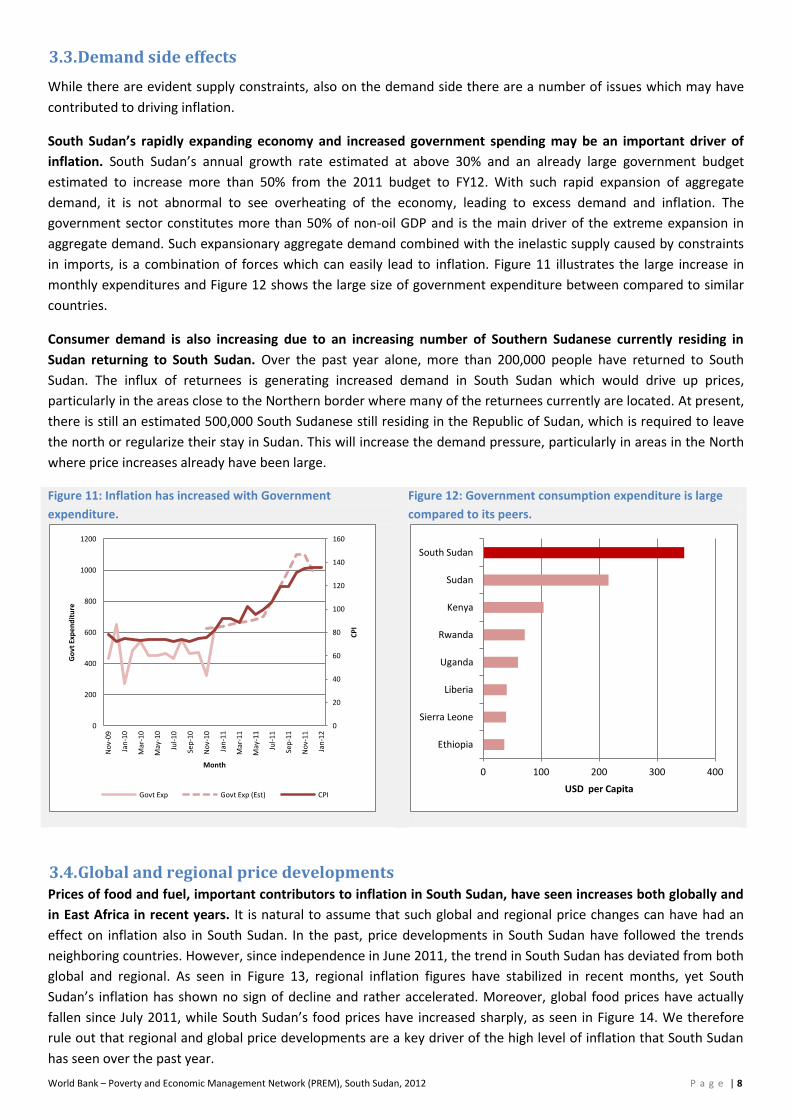
3.3. Demand side effects
While there are evident supply constraints, also on the demand side there are a number of issues which may have
contributed to driving inflation.
South Sudan’s rapidly expanding economy and increased government spending may be an important driver of
inflation. South Sudan’s annual growth rate estimated at above 30% and an already large government budget
estimated to increase more than 50% from the 2011 budget to FY12. With such rapid expansion of aggregate
demand, it is not abnormal to see overheating of the economy, leading to excess demand and inflation. The
government sector constitutes more than 50% of non-oil GDP and is the main driver of the extreme expansion in
aggregate demand. Such expansionary aggregate demand combined with the inelastic supply caused by constraints
in imports, is a combination of forces which can easily lead to inflation. Figure 11 illustrates the large increase in
monthly expenditures and Figure 12 shows the large size of government expenditure between compared to similar
countries.
Consumer demand is also increasing due to an increasing number of Southern Sudanese currently residing in
Sudan returning to South Sudan. Over the past year alone, more than 200,000 people have returned to South
Sudan. The influx of returnees is generating increased demand in South Sudan which would drive up prices,
particularly in the areas close to the Northern border where many of the returnees currently are located. At present,
there is still an estimated 500,000 South Sudanese still residing in the Republic of Sudan, which is required to leave
the north or regularize their stay in Sudan. This will increase the demand pressure, particularly in areas in the North
where price increases already have been large.
Figure 11: Inflation has increased with Government
expenditure.
Figure 12: Government consumption expenditure is large
compared to its peers.
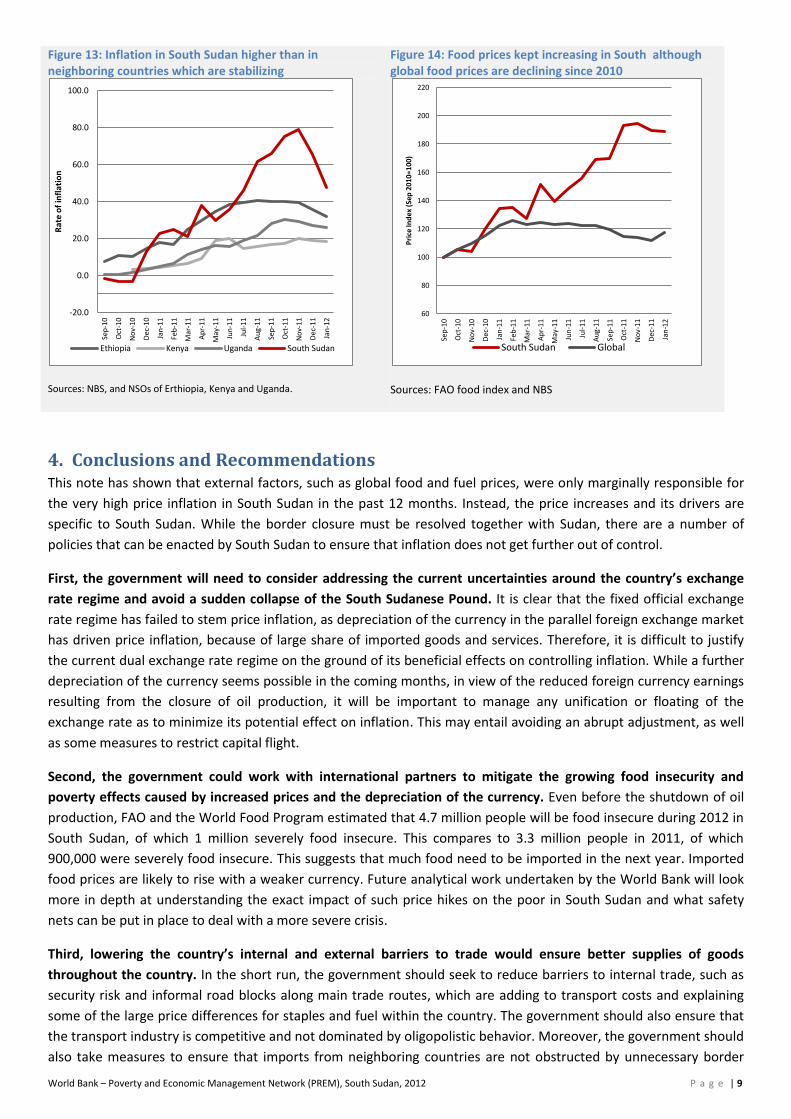
3.4. Global and regional price developments Prices of food and fuel, important contributors to inflation in South Sudan, have seen increases both globally and
in East Africa in recent years. It is natural to assume that such global and regional price changes can have had an
effect on inflation also in South Sudan. In the past, price developments in South Sudan have followed the trends
neighboring countries. However, since independence in June 2011, the trend in South Sudan has deviated from both
global and regional. As seen in Figure 13, regional inflation figures have stabilized in recent months, yet South
Sudan’s inflation has shown no sign of decline and rather accelerated. Moreover, global food prices have actually
fallen since July 2011, while South Sudan’s food prices have increased sharply, as seen in Figure 14. We therefore
rule out that regional and global price developments are a key driver of the high level of inflation that South Sudan
has seen over the past year.
0
20
40
60
80
100
120
140
160
0
200
400
600
800
1000
1200
No
v-09
Jan
-10
Mar
-10
May
-10
Jul-
10
Sep
-10
No
v-10
Jan
-11
Mar
-11
May
-11
Jul-
11
Sep
-11
No
v-11
Jan
-12
CP
I
Go
vt E
xpen
dit
ure
Month
Govt Exp Govt Exp (Est) CPI
0 100 200 300 400
Ethiopia
Sierra Leone
Liberia
Uganda
Rwanda
Kenya
Sudan
South Sudan
USD per Capita
World Bank – Poverty and Economic Management Network (PREM), South Sudan, 2012 P a g e | 9
Figure 13: Inflation in South Sudan higher than in neighboring countries which are stabilizing
Sources: NBS, and NSOs of Erthiopia, Kenya and Uganda.
Figure 14: Food prices kept increasing in South although global food prices are declining since 2010
Sources: FAO food index and NBS
4. Conclusions and Recommendations This note has shown that external factors, such as global food and fuel prices, were only marginally responsible for
the very high price inflation in South Sudan in the past 12 months. Instead, the price increases and its drivers are
specific to South Sudan. While the border closure must be resolved together with Sudan, there are a number of
policies that can be enacted by South Sudan to ensure that inflation does not get further out of control.
First, the government will need to consider addressing the current uncertainties around the country’s exchange
rate regime and avoid a sudden collapse of the South Sudanese Pound. It is clear that the fixed official exchange
rate regime has failed to stem price inflation, as depreciation of the currency in the parallel foreign exchange market
has driven price inflation, because of large share of imported goods and services. Therefore, it is difficult to justify
the current dual exchange rate regime on the ground of its beneficial effects on controlling inflation. While a further
depreciation of the currency seems possible in the coming months, in view of the reduced foreign currency earnings
resulting from the closure of oil production, it will be important to manage any unification or floating of the
exchange rate as to minimize its potential effect on inflation. This may entail avoiding an abrupt adjustment, as well
as some measures to restrict capital flight.
Second, the government could work with international partners to mitigate the growing food insecurity and
poverty effects caused by increased prices and the depreciation of the currency. Even before the shutdown of oil
production, FAO and the World Food Program estimated that 4.7 million people will be food insecure during 2012 in
South Sudan, of which 1 million severely food insecure. This compares to 3.3 million people in 2011, of which
900,000 were severely food insecure. This suggests that much food need to be imported in the next year. Imported
food prices are likely to rise with a weaker currency. Future analytical work undertaken by the World Bank will look
more in depth at understanding the exact impact of such price hikes on the poor in South Sudan and what safety
nets can be put in place to deal with a more severe crisis.
Third, lowering the country’s internal and external barriers to trade would ensure better supplies of goods
throughout the country. In the short run, the government should seek to reduce barriers to internal trade, such as
security risk and informal road blocks along main trade routes, which are adding to transport costs and explaining
some of the large price differences for staples and fuel within the country. The government should also ensure that
the transport industry is competitive and not dominated by oligopolistic behavior. Moreover, the government should
also take measures to ensure that imports from neighboring countries are not obstructed by unnecessary border
-20.0
0.0
20.0
40.0
60.0
80.0
100.0
Sep
-10
Oct
-10
No
v-10
Dec
-10
Jan
-11
Feb
-11
Mar
-11
Ap
r-11
May
-11
Jun
-11
Jul-
11
Au
g-11
Sep
-11
Oct
-11
No
v-11
Dec
-11
Jan
-12
Rat
e o
f in
flat
ion
Ethiopia Kenya Uganda South Sudan
60
80
100
120
140
160
180
200
220
Sep
-10
Oct
-10
No
v-10
Dec
-10
Jan
-11
Feb
-11
Mar
-11
Ap
r-11
May
-11
Jun
-11
Jul-
11
Au
g-11
Sep
-11
Oct
-11
No
v-11
Dec
-11
Jan
-12
Pri
ce In
dex
(Se
p 2
010=
100
)
South Sudan Global
World Bank – Poverty and Economic Management Network (PREM), South Sudan, 2012 P a g e | 10
procedures, as to reduce the large cross-border price differential. In the medium term, the government should work
to resolve the border closure with the North which has affected prices in the North with particular severity and
invest in better road infrastructure throughout the country.
Fourth, the government will need to consider the effect of rapid government expansion on aggregate demand and
how this is affecting price levels. With the rapid expansion of government expenditure and also the private
construction sector, and limited import capacity, prices will continue to be driven up. Over the past two years, the
government sector, which constitutes more than half of the non-oil economy, has more than doubled its size. South
Sudan’s Government consumption per capita (excluding capital expenditure) is more than twice that of its peers.
Fifth, the government will have to be careful not start subsidizing food and fuel directly, as this will be a hugely
inefficient way to address the problem of inflation. An extensive body of evidence shows that although politically
attractive, food and fuel subsidies are very regressive (i.e. the poor benefit relatively little while the rich receive most
of the subsidies), and are costly and difficult to reverse when circumstances change. In dealing with growing political
dissatisfaction, the government should rather consider targeted social assistance to vulnerable groups.
Last, the fast increasing prices also highlights the importance of diversifying the economy to being less dependent
on oil revenues to fund imports of food. In particular, leveraging the vast potential in South Sudan’s agricultural
sector would largely improve food supply, thus contributing to reduced prices and increased food security.
End Notes:
i South Sudanese Pounds (SSP) and Sudanese Pounds (SDG) can be treated as a continuous data series as upon introduction of the SDG the currency was traded 1-to-1 with the new SSP. ii NBS, South Sudan Cost-to-Market Report: An Analysis of Check-points, 2011.
Recommended