IJAAR 6 (2018) 101-115 ISSN 2053-1265
Influence of rhizobial inoculation and crop variety on dry matter accumulation of crops in maize-soybean
intercropping system
Shenghui Yang1,3, Wenhao Chen1,2, Wenfeng Chen1*, Changfu Tian1, Xinhua Sui1 and Wenxin Chen1
1State Key Laboratory of Agrobiotechnology, Beijing 100193; College of Biological Sciences and Rhizobium Research
Center, China Agricultural University, Beijing 100193, China. 2College of Life Science and Food Engineering, Yibin University, Yibin 644000, Sichuan Province, China.
3Shandong Aifudi Biotech. Co., LTD, Jining 272063, Shandong Province, China.
Article History ABSTRACT Received 09 August, 2018 Received in revised form 14 September, 2018 Accepted 18 September, 2018 Keywords: Rhizobial inoculation, Variety, Dry matter accumulation (DMA), Intercropping, Soybean, Maize. Article Type: Full Length Research Article
The aim of this study was to assess the best crop variety combination of maize and soybean plants grown in monocropping and intercropping systems. Moreover, the influence of rhizobial inoculation on growth and yield of soybeans plants grown under both cropping systems was also evaluated. Three varieties of soybean (inoculated with rhizobium or not) and three varieties of maize plants were grown in monocropping and in intercropping systems (8 rows soybean, 2 rows maize). Dry matter accumulation (DMA) of plant shoots (maize and soybean) was higher in monocropping than that in intercropping. Rhizobial inoculation increased the yield of soybean in both cropping systems. For the three soybean varieties, no significant difference of the average 100-grain filling rate per day (Va) was found between the inoculated and non-inoculated plants in both cropping systems. However, significant increases of the Va were found in the monocropping soybeans than those in the intercropping systems. For the three maize varieties, the highest Va values were found only in the monocropping treatments. Slight increases of the Va were observed in maize intercropped with inoculated soybean (MIR) than the maize intercropped with non-inoculated soybean (MI). All the land equivalent ratio (LER) values under intercropping were 1.5 higher than those under monocropping, reflecting the advantage of the intercropping systems. The highest productive value ($5130.7 ha
-1) was obtained
in the intercropping combination of maize variety Zhengdan 958 and inoculated soybean variety Xudou 18.
©2018 BluePen Journals Ltd. All rights reserved
INTRODUCTION The increases in crop yield during the last century were mainly (Sadras and Lawson, 2011) related to the increases of the yield of a crop per unit area of land cultivation. In intercropping systems, two crops are grown simultaneously in the same field and their vegetative and *Corresponding author. E-mail: [email protected].
reproductive stages overlap (Echarte et al., 2011; Lithourgidis et al., 2011). Appropriate intercropping may benefit from the intercropped crops on the use of light, heat, physical space, water and soil nutrients (Midmore, 1993; Tang et al., 2005; Xiao et al., 2005; Javanmard et al., 2009), resulting in improving the land equivalent rate (LER) (Tariah and Wahua, 1985) and total crop production (Chen and Pang, 2000; Su et al., 2005). Benefits of the intercropping system may also arise from increased soil N

uptake, dry matter yield and greater N2 fixation efficiency (Kurdali et al., 2009). The intercropping of maize (Zea mays L.) with soybean (Glycine max Merrill) is one of the most common system and represents the most important pattern of cereal-legume interactions. While the combination of varieties of these two crops, spatial arrangements (Issahaku, 2010), row ratios (Zhang et al., 2015) should be optimum and matched so that they can avoid the negative effects from each other when they are grown together in the same plot.
Crop growth, grain filling and the final yield could be affected significantly by the genotype of the crop (Hanway and Weber, 1971a), fertilization (Olsen et al., 1954; Hanway and Weber, 1971b), irrigation (Wahed et al., 2001) and other field managements. The optimum combination of soybean and maize varieties in the intercropping system will decrease the nitrogen inputs, increase land productivity and avert environmental pollution (Chen et al., 2017). Photosynthetic efficiency of soybean was significantly affected by leaves of intercropped maize at different time in one day (Yao et al., 2017). Dynamic determination of the dry matter accumulation (DMA) of the crop shoot and of the filling grain in different growth stages can reflect the growth status of the crops in the intercropping system. However, few studies have focused on the DMA of different maize and soybean varieties in intercropping system (Ren et al., 2015). In addition, little is known about how inoculation with rhizobia affect the DMA and grain filling of soybean in intercropping system (Zhong et al., 2002; Zhang et al., 2011), although rhizobial inoculation of legumes has been studied and widely practiced for a long time (Chen et al., 2002).
With the desire to reduce the usage of chemical nitrogen fertilizer, to improve the LER and to increase the total crop yields, enhancing the symbiotic nitrogen fixation by rhizobial inoculation to legumes and legume-cereal intercropping are vital agricultural measures. The aim of the present study was to assess the optimum variety combination of soybean and maize by dynamically determining the DMA of the crop shoot and of the filling grain of three varieties of soybean and three varieties of maize in intercropping system. Response of three soybean varieties to rhizobial inoculation under in intercropping system was evaluated. Logistic equation (or logistic growth curve) was used to fit the crop growth and grain filling affected by variety combination, rhizobial inoculation and crop growth stages. The economic benefits of intercropping and rhizobial inoculation were also estimated. MATERIALS AND METHODS Site description and soil properties The experiment was carried out at the Shandong Shofine
Int. J. Adv. Agric. Res. 102 Academician Workstation (N 35°24', E 116°20', altitude 39 m), Jiaxiang County, Jining City, Shandong Province of China. This region has a temperate continental monsoon climate with annual average temperature of 12.8–13.9°C and precipitation of 648.17 mm. Soil was sampled from a depth of 0–20 cm before sowing for chemical analyses. The physicochemical properties of the soil (kg
-1) were
determined as follows: organic matter, 15.30 g; TN, 1.50 g; available phosphorus, 19.03 mg; exchangeable potassium, 133.51 mg; NH4
+-N, 1.62 mg; NO3
¯-N, 4.89
mg. The soil pH was 8.96 and the electrical conductivity (EC) was 107.52 μs·cm
-1.
Crop variety and rhizobial inoculation The soybean varieties, Xudou 18, Heihe 43 and Nansheng 270 were used (Yang et al., 2018). The characterization and planting areas of these three soybean varieties were described in our previous publication (Yang et al., 2018). Three independent hybrid varieties of maize, Zhengdan 958, Xianyu 335 and Jinshengyu 567 were selected.
Sinorhizobium fredii strain S6 isolated in our previous study (Ji et al., 2014) was used as the rhizobial inoculant to the seeds of the three above varieties of soybean (Yang et al., 2018). This rhizobial species (S. fredii) is the dominant microsymbiont for soybean in alkaline–saline soils in the current experimental site (Zhang et al., 2011; Ji et al., 2014; Yang et al., 2018). Field procedures and treatments The experimental design was a split plot in a randomized complete block design. Field experiments were carried out in 20 m × 10 m plots in triplicate for each of the following seven treatments: MM, Maize monocropping; SM, soybean monocropping; MI, maize intercropping; MIR, maize in intercropping with rhizobial inoculation of soybean; SI, soybean intercropping; SMR, soybean in monocropping with rhizobial inoculation; SIR, soybean intercropping with rhizobial inoculation. Two rows of maize and eight rows of soybean were grown according to the local farmers’ practices in the intercropping system. In the monocropping system, the inter-row and intra-row spaces were 60 cm and 26.6 cm, respectively for maize; and 50 and 10 cm, respectively for soybean. In the intercropping system, the inter-row spacing was 40 cm, with maize intra-row spacing of 8 cm, and the soybean intra-row spacing was 10 cm. The crop density was 6.25 × 10
4
plants ha−1
for maize and 2 × 10⁵ plants ha
−1 for soybean
in both the monocropping and intercropping systems. The experimental field was ploughed and compound
fertilizer (N:P2O5:K2O = 15:15:15) as base fertilizer was applied at the rate of 750 and 225 kg ha
-1 for maize and

Yang et al. 103 soybean, respectively. Maize and soybean seeds were sown simultaneously on the same day on June 16, 2014. The amount of chemical fertilizer applied was far lower than the amount (300-450 kg ha
−1 N) routinely applied to
soybean by local farmers. The plots were irrigated three times with field sprinkler and each irrigation lasted for 2 h. The grasses were weeded manually twice (on June 26 and July 10) during the whole growing period of crops. Shoot dry matter accumulation The shoots of both crops were cut at different stages, dried at 105 °C for 30 min, and then dried at 65°C for 48 h to constant weight, finally the dry weight (that is, DMA) of shoots was obtained. For maize, shoot was cut at the jointing (July 10), bell-mouthed (July 18), silking (July 29), milk (September 2) and mature stages (October 6) respectively from three plants randomly chosen from the rows (neighboring to soybean) in each plot. For soybean, shoot was cut at the flower-bud differentiating (July 12), flowering (August 1), fruiting (August 16), grain-filling (September 5) and mature stages (October 8) respectively, from 10 plants randomly chosen from the second and third rows neighboring to maize in each plot. Grain fillingand seed dry weight During the grain filling stage, 18 days after silking (July 19) for maize and 20 days after flowering (August 1) for soybean respectively, 100 grains were sampled every 6 days and were dried and weighted. For maize, five ears were randomly selected and were divided into three parts: apical (3–10 rings from the ear upper), middle (13–22 rings from the bottom of the ear) and basal (8–12 rings from the bottom of the ear) (Xie et al., 2001). For soybean, eight plants were randomly sampled from each row and were separated into three parts according to their positions in the shoot: apical (11–15 knots from the base), middle (6–10 knots from the base) and basal parts (1–5 knots from the base) (Xie et al., 2001). All grains from the apical, middle and basal parts of the maize ear were mixed together and 100 seeds were randomly selected out. The 100 grains obtained were then deactivated at 105°C for 30 min, followed by being dried at 80°C for 24 h to get a constant weight. The dry weight of 100 grains was obtained accordingly. Yield and yield components An area of 10 m
2 (4 m length by 2.5 m width) crops from
each treatment was harvested for seed yield determination. In intercropping systems, 8 rows of soybean and 2 rows of corn neighboring to soybean were
harvested. In monocropping systems, the edge rows of each plot were not included and the middle 8 rows were harvested. Moisture content (MC) of seed was measured at the time of measurement. The unadjusted yield was converted into adjusted yield (kg ha
-1) using formula
indicated by Solomon et al. (2012) based on the standard moisture content of 14% for maize and 13.5% for soybean, respectively, and the MC of seed.
The yield components of the soybean plants were evaluated by determination of 100-seed weight, number of filled pods per plant and number of seeds per plant. For maize plants, the yield components included 100-seed weight, number of normal ears per hectare and number of kernels per ear. Assessment of the intercropping system effectiveness The LER was used for estimating the efficiency of intercropping relative to monocropping (Mead and Willy, 1980) and was calculated according to the equation described by Oforiet al. (1987): LER = Yij/Yii + Yji/Yjj where, Yij and Yji are intercropped yields of the component crops i (soybean) and j (maize), and Yii and Yjj are sole crop yields of soybean and maize, respectively. If LER value is greater than 1.0, there is a yield advantage by intercropping compared with monocropping.
Yield value of maize and soybean, 0.33 and 0.76$ kg-1
, respectively, were calculated based on the market purchase price of the local government in that year. Statistical analysis Data obtained in current study were statistically analyzed using Excel 2010, Math Type 6.7, Curve Expert 1.3 and DPS 7.05. The growth and yield data among the treatments were compared using Duncan's new multiple range test.
The DMA of shoots was determined and fitted to obtain the logistic growth equation using the Curve Expert software (ver. 1.3): y = W0/(1+A·e
-B·x), where y is the DMA
of shoot, x is the duration days, W0 estimates the maximum DMA, B is the crop growth rate, and A is a parameter related to both the duration and of crop growth rate (Darroch and Baker, 1990).
The DMA of the vegetative and reproductive stages was calculated respectively in these two stages. The DMA of 100 seeds were used to fit the logistic equation for the grain filling using the Curve Expert software (ver. 1.3): y = W0/(1+A·e
-B·x), where y is the dry weight of 100 seeds, x is
the grain filling days, W0 estimates the maximum DMA of 100 seeds, B is the grain filling rate, and A is a parameter related to both the duration and of grain filling rate (Darroch and Baker, 1990).
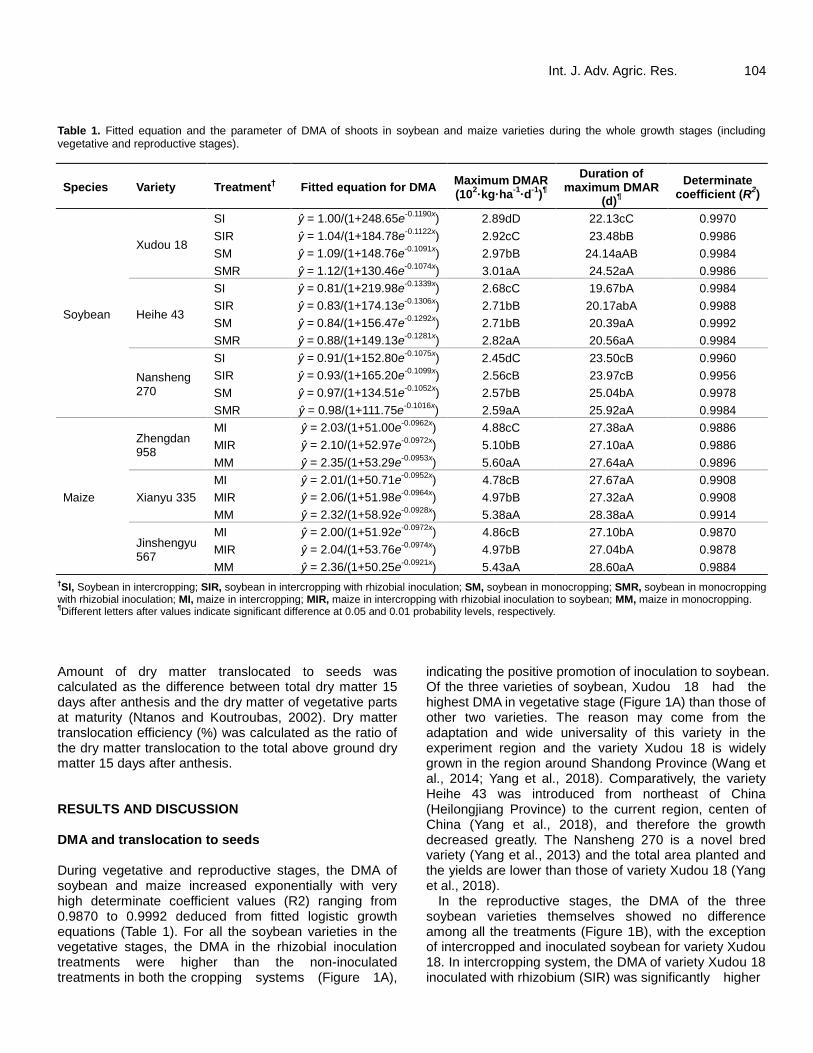
Int. J. Adv. Agric. Res. 104 Table 1. Fitted equation and the parameter of DMA of shoots in soybean and maize varieties during the whole growth stages (including vegetative and reproductive stages).
Species Variety Treatment† Fitted equation for DMA
Maximum DMAR (10
2·kg·ha
-1·d
-1)¶
Duration of maximum DMAR
(d)¶
Determinate coefficient (R
2)
Soybean
Xudou 18
SI ŷ = 1.00/(1+248.65e-0.1190x
) 2.89dD 22.13cC 0.9970
SIR ŷ = 1.04/(1+184.78e-0.1122x
) 2.92cC 23.48bB 0.9986
SM ŷ = 1.09/(1+148.76e-0.1091x
) 2.97bB 24.14aAB 0.9984
SMR ŷ = 1.12/(1+130.46e-0.1074x
) 3.01aA 24.52aA 0.9986
Heihe 43
SI ŷ = 0.81/(1+219.98e-0.1339x
) 2.68cC 19.67bA 0.9984
SIR ŷ = 0.83/(1+174.13e-0.1306x
) 2.71bB 20.17abA 0.9988
SM ŷ = 0.84/(1+156.47e-0.1292x
) 2.71bB 20.39aA 0.9992
SMR ŷ = 0.88/(1+149.13e-0.1281x
) 2.82aA 20.56aA 0.9984
Nansheng 270
SI ŷ = 0.91/(1+152.80e-0.1075x
) 2.45dC 23.50cB 0.9960
SIR ŷ = 0.93/(1+165.20e-0.1099x
) 2.56cB 23.97cB 0.9956
SM ŷ = 0.97/(1+134.51e-0.1052x
) 2.57bB 25.04bA 0.9978
SMR ŷ = 0.98/(1+111.75e-0.1016x
) 2.59aA 25.92aA 0.9984
Maize
Zhengdan 958
MI ŷ = 2.03/(1+51.00e-0.0962x
) 4.88cC 27.38aA 0.9886
MIR ŷ = 2.10/(1+52.97e-0.0972x
) 5.10bB 27.10aA 0.9886
MM ŷ = 2.35/(1+53.29e-0.0953x
) 5.60aA 27.64aA 0.9896
Xianyu 335
MI ŷ = 2.01/(1+50.71e-0.0952x
) 4.78cB 27.67aA 0.9908
MIR ŷ = 2.06/(1+51.98e-0.0964x
) 4.97bB 27.32aA 0.9908
MM ŷ = 2.32/(1+58.92e-0.0928x
) 5.38aA 28.38aA 0.9914
Jinshengyu 567
MI ŷ = 2.00/(1+51.92e-0.0972x
) 4.86cB 27.10bA 0.9870
MIR ŷ = 2.04/(1+53.76e-0.0974x
) 4.97bB 27.04bA 0.9878
MM ŷ = 2.36/(1+50.25e-0.0921x
) 5.43aA 28.60aA 0.9884 †SI, Soybean in intercropping; SIR, soybean in intercropping with rhizobial inoculation; SM, soybean in monocropping; SMR, soybean in monocropping
with rhizobial inoculation; MI, maize in intercropping; MIR, maize in intercropping with rhizobial inoculation to soybean; MM, maize in monocropping.
¶Different letters after values indicate significant difference at 0.05 and 0.01 probability levels, respectively. Amount of dry matter translocated to seeds was calculated as the difference between total dry matter 15 days after anthesis and the dry matter of vegetative parts at maturity (Ntanos and Koutroubas, 2002). Dry matter translocation efficiency (%) was calculated as the ratio of the dry matter translocation to the total above ground dry matter 15 days after anthesis. RESULTS AND DISCUSSION DMA and translocation to seeds During vegetative and reproductive stages, the DMA of soybean and maize increased exponentially with very high determinate coefficient values (R2) ranging from 0.9870 to 0.9992 deduced from fitted logistic growth equations (Table 1). For all the soybean varieties in the vegetative stages, the DMA in the rhizobial inoculation treatments were higher than the non-inoculated treatments in both the cropping systems (Figure 1A),
indicating the positive promotion of inoculation to soybean. Of the three varieties of soybean, Xudou 18 had the highest DMA in vegetative stage (Figure 1A) than those of other two varieties. The reason may come from the adaptation and wide universality of this variety in the experiment region and the variety Xudou 18 is widely grown in the region around Shandong Province (Wang et al., 2014; Yang et al., 2018). Comparatively, the variety Heihe 43 was introduced from northeast of China (Heilongjiang Province) to the current region, centen of China (Yang et al., 2018), and therefore the growth decreased greatly. The Nansheng 270 is a novel bred variety (Yang et al., 2013) and the total area planted and the yields are lower than those of variety Xudou 18 (Yang et al., 2018).
In the reproductive stages, the DMA of the three soybean varieties themselves showed no difference among all the treatments (Figure 1B), with the exception of intercropped and inoculated soybean for variety Xudou 18. In intercropping system, the DMA of variety Xudou 18 inoculated with rhizobium (SIR) was significantly higher

Yang et al. 105
Figure 1. DMA of soybean. A, DMA during the vegetative stage; B, DMA during the reproductive stage; SI, Soybean in intercropping; SIR, soybean in intercropping with rhizobial inoculation; SM, soybean in monocropping; SMR, soybean in monocropping with rhizobial inoculation. Values followed by different letters are significantly different at p<0.05.
Figure 2. DMA of maize. A, DMA during the vegetative stage; B, DMA during the reproductive stage; MI, maize in intercropping; MIR, maize in intercropping with rhizobial inoculation to soybean; MM, maize in monocropping. Values followed by different letters are significantly different at p<0.05.
(p<0.01) than the non-inoculated treatment (SI) in reproductive stage (Figure 1B). Therefore, rhizobial inoculation can significantly enhance the DMA of variety Xudou 18 in the whole growth stage in intercropping systems (Figure 1).
For all the three soybean varieties, the maximum dry matter accumulation rate (DMAR) was found in all the rhizobial inoculation treatments either in monocropping or in intercropping systems (SMR and SIR) (p<0.01) (Table 1), implying that the inoculation of soybeans with an effective rhizobial strain is vitally important to soybean growth and development. In addition, the duration of
maximum DMARs were significantly longer in the all the SMR treatments than those in other respective treatments for the three soybean varieties. Rhizobial inoculation of soybean variety Xudou 18 in intercropped system (SIR) extended significantly the duration of maximum DMAR, indicating the longer lifespan of rhizobium-soybean symbiotic relationship and the better compatibility between this soybean variety and the three varieties of maize in the intercropping system.
Of the three maize varieties, the maximum DMA was found in all the monocropping treatment (MM) (Figure 2) as compared to the intercropping treatments (MI
Int. J. Adv. Agric. Res. 106
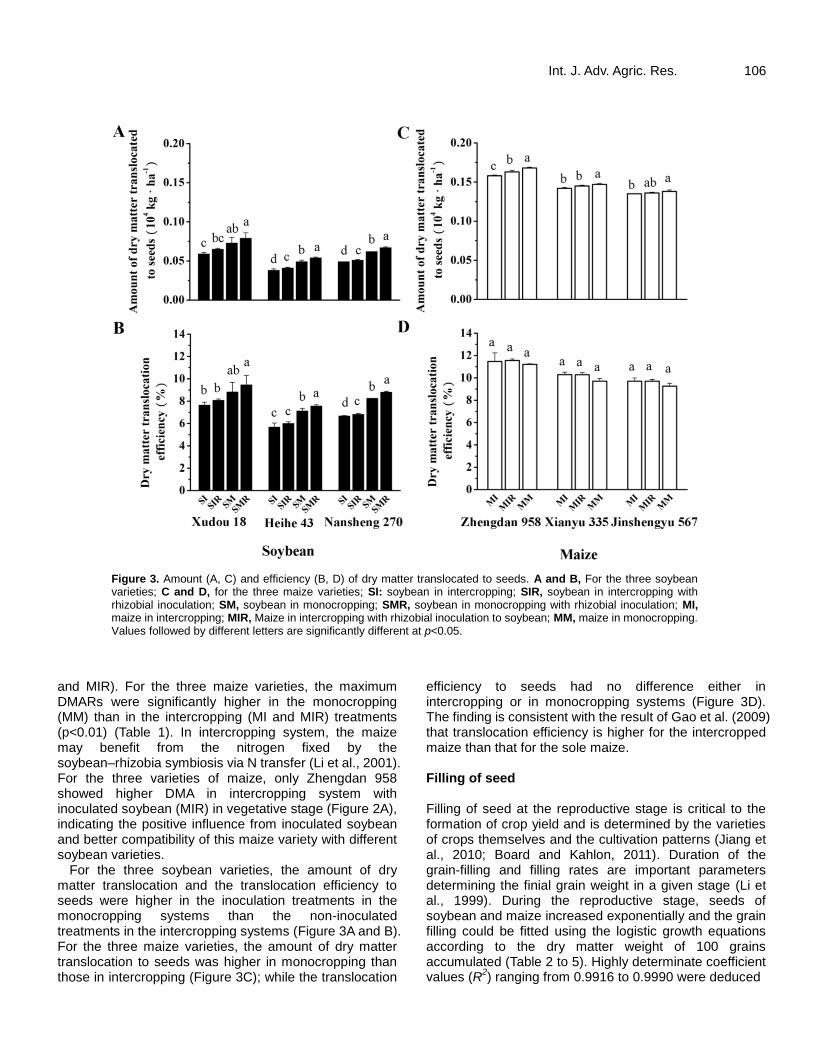
Figure 3. Amount (A, C) and efficiency (B, D) of dry matter translocated to seeds. A and B, For the three soybean varieties; C and D, for the three maize varieties; SI: soybean in intercropping; SIR, soybean in intercropping with rhizobial inoculation; SM, soybean in monocropping; SMR, soybean in monocropping with rhizobial inoculation; MI, maize in intercropping; MIR, Maize in intercropping with rhizobial inoculation to soybean; MM, maize in monocropping. Values followed by different letters are significantly different at p<0.05.
and MIR). For the three maize varieties, the maximum DMARs were significantly higher in the monocropping (MM) than in the intercropping (MI and MIR) treatments (p<0.01) (Table 1). In intercropping system, the maize may benefit from the nitrogen fixed by the soybean–rhizobia symbiosis via N transfer (Li et al., 2001). For the three varieties of maize, only Zhengdan 958 showed higher DMA in intercropping system with inoculated soybean (MIR) in vegetative stage (Figure 2A), indicating the positive influence from inoculated soybean and better compatibility of this maize variety with different soybean varieties.
For the three soybean varieties, the amount of dry matter translocation and the translocation efficiency to seeds were higher in the inoculation treatments in the monocropping systems than the non-inoculated treatments in the intercropping systems (Figure 3A and B). For the three maize varieties, the amount of dry matter translocation to seeds was higher in monocropping than those in intercropping (Figure 3C); while the translocation
efficiency to seeds had no difference either in intercropping or in monocropping systems (Figure 3D). The finding is consistent with the result of Gao et al. (2009) that translocation efficiency is higher for the intercropped maize than that for the sole maize. Filling of seed Filling of seed at the reproductive stage is critical to the formation of crop yield and is determined by the varieties of crops themselves and the cultivation patterns (Jiang et al., 2010; Board and Kahlon, 2011). Duration of the grain-filling and filling rates are important parameters determining the finial grain weight in a given stage (Li et al., 1999). During the reproductive stage, seeds of soybean and maize increased exponentially and the grain filling could be fitted using the logistic growth equations according to the dry matter weight of 100 grains accumulated (Table 2 to 5). Highly determinate coefficient values (R
2) ranging from 0.9916 to 0.9990 were deduced

Yang et al. 107 Table 2. Dry matter weight of soybean grain after flowering for various soybean varieties, the fitted logistic equation and determinate coefficient.
Soybean variety
Treatment† Grainposition¶ Dry matter weight (y, g) of soybean grain (100 seeds) after x days of flowering Fitted equation
[y= W0/(1+A·e-B·x)] § Determinate
coefficient (R2) 20 days 27days 34days 41 days 48 days 55 days 62days
Xudou 18
SI
Apical 1.09 3.32 6.34 11.54 17.01 20.86 21.57 y= 23.02/(1+316.73e-0.1416x) 0.9988
Middle 1.26 3.79 7.68 13.24 18.91 22.27 22.63 y= 23.87/(1+308.45e-0.1466x) 0.9988
Basal 1.16 3.61 6.87 12.57 18.13 21.76 22.16 y= 23.48/(1+339.65e-0.1466x) 0.9986
Average 1.17±0.09 3.57±0.24 6.96±0.67 12.45±0.86 18.02±0.96 21.63±0.71 22.12±0.53 y= 23.45/(1+318.73e-0.1447x) 0.9988
SIR
Apical 1.17 3.56 6.72 11.53 17.34 20.96 22.19 y= 23.78/(1+245.99e-0.1344x) 0.9988
Middle 1.3 3.77 7.64 13.25 18.93 22.49 23.11 y= 24.40/(1+289.98e-0.1436x) 0.9990
Basal 1.16 3.63 6.91 12.46 18.19 21.78 22.38 y= 23.73/(1+320.89e-0.1444x) 0.9984
Average 1.21±0.08 3.65±0.11 7.09±0.49 12.41±0.86 18.15±0.80 21.74±0.77 22.56±0.49 y= 23.95/(1+282.34e-0.1407x) 0.9988
SM
Apical 1.17 3.66 6.88 12.61 19.33 22.38 23.25 y= 24.50/(1+402.22e-0.1498x) 0.9982
Middle 1.39 3.86 7.56 13.82 20.45 23.99 24.18 y= 25.58/(1+408.79e-0.1524x) 0.9980
Basal 1.34 3.69 7.13 13.26 19.98 22.96 23.27 y= 24.52/(1+466.92e-0.1560x) 0.9978
Average 1.30±0.12 3.74±0.11 7.19±0.34 13.23±0.61 19.92±0.56 23.11±0.82 23.57±0.53 y= 24.86/(1+423.51e-0.1526x) 0.9974
SMR
Apical 1.21 3.74 6.94 12.57 19.02 22.52 23.43 y= 24.85/(1+337.04e-0.1443x) 0.9986
Middle 1.37 3.79 7.58 13.98 20.59 24.16 24.35 y= 25.71/(1+434.90e-0.1540x) 0.9978
Basal 1.33 3.8 7.12 13.49 20.15 23.26 23.61 y= 24.87/(1+461.01e-0.1555x) 0.9972
Average 1.30±0.08 3.78±0.03 7.21±0.33 13.35±0.72 19.92±0.81 23.31±0.82 23.80±0.49 y= 25.13/(1+406.13e-0.1512x) 0.9978
Nansheng 270
SI
Apical 0.81 2.03 4.13 7.32 10.83 12.58 12.66 y= 13.39/(1+382.07e-0.1517x) 0.9974
Middle 0.87 2.32 4.49 8.01 11.75 13.73 14.25 y= 15.04/(1+308.38e-0.1444x) 0.9988
Basal 0.99 2.41 4.61 8.56 12.52 14.51 14.92 y= 15.71/(1+361.79e-0.1493x) 0.9982
Average 0.89±0.09 2.25±0.20 4.41±0.25 7.96±0.62 11.70±0.85 13.61±0.97 13.94±1.16 y= 14.70/(1+348.32e-0.1484x) 0.9982
SIR
Apical 0.88 2.18 4.19 7.31 10.85 12.52 12.87 y= 13.62/(1+297.85e-0.1446x) 0.9978
Middle 0.96 2.47 4.52 7.89 11.71 13.76 14.31 y= 15.24/(1+252.02e-0.1384x) 0.9980
Basal 1.03 2.53 4.63 8.77 12.68 14.65 14.96 y= 15.76/(1+363.57e-0.1503x) 0.9976
Average 0.96±0.08 2.39±0.19 4.45±0.23 7.99±0.74 11.75±0.92 13.64±1.07 14.05±1.07 y= 14.86/(1+300.69e-0.1444x) 0.9980
SM
Apical 0.97 2.61 4.58 8.19 12.25 14.31 14.74 y= 15.70/(1+280.10e-0.1415x) 0.9970
Middle 1.06 2.66 5.04 8.84 13.07 15.19 15.74 y= 16.67/(1+280.11e-0.1422x) 0.9982
Basal 1.11 2.89 5.18 9.81 13.87 16.16 16.49 y= 17.37/(1+329.26e-0.1482x) 0.9978
Average 1.05±0.07 2.72±0.15 4.93±0.31 8.95±0.82 13.06±0.81 15.22±0.93 15.66±0.88 y= 16.58/(1+295.48e-0.1440x) 0.9978
SMR
Apical 1.10 2.62 4.63 8.32 12.45 14.76 15.26 y= 16.33/(1+262.97e-0.1385x) 0.9974
Middle 1.11 2.70 5.03 8.89 13.31 15.69 16.27 y= 17.34/(1+276.28e-0.1402x) 0.9980
Basal 1.13 2.92 5.14 9.73 14.03 16.56 16.71 y= 17.75/(1+336.04e-0.1476x) 0.9968
Average 1.11±0.02 2.75±0.16 4.93±0.27 8.98±0.71 13.26±0.79 15.67±0.90 16.08±0.74 y= 17.13/(1+290.34e-0.1422x) 0.9974
Heihe 43
SI
Apical 0.88 2.56 5.01 10.03 15.12 15.42 – y= 16.79/(1+209.49e-0.1765x) 0.9916 Middle 0.92 2.97 5.56 10.88 16.11 16.63 – y= 18.14/(1+167.44e-0.1696x) 0.9926 Basal 0.95 2.96 5.85 11.04 16.43 16.92 – y= 18.45/(1+160.95e-0.1687x) 0.9932 Average 0.92±0.04 2.83±0.23 5.47±0.43 10.65±0.54 15.89±0.68 16.32±0.80 – y= 17.80/(1+176.60e-0.1713x) 0.9924
SIR
Apical 0.94 2.57 4.70 10.55 15.43 16.02 – y= 17.26/(1+274.27e-0.1845x) 0.9922
Middle 0.99 3.01 5.79 11.39 16.48 17.06 – y= 18.49/(1+170.80e-0.1716x) 0.9938
Basal 0.99 3.08 5.87 11.60 16.61 17.41 – y= 18.84/(1+163.61e-0.1699x) 0.9950
Average 0.97±0.03 2.89±0.28 5.45±0.65 11.18±0.56 16.17±0.65 16.83±0.72 – y= 18.20/(1+192.11e-0.1745x) 0.9938
SM
Apical 1.13 3.01 5.72 11.53 16.62 17.45 – y= 18.94/(1+167.24e-0.1695x) 0.9944
Middle 1.12 3.17 6.16 12.18 17.33 18.03 – y= 19.48/(1+167.80e-0.1718x) 0.9946
Basal 1.16 3.45 6.54 12.65 17.68 18.44 – y= 19.91/(1+143.93e-0.1681x) 0.9950

Int. J. Adv. Agric. Res. 108 Table 2. Contd.
Average 1.14±0.02 3.21±0.22 6.14±0.41 12.12±0.56 17.21±0.54 17.97±0.50 – y= 19.44/(1+158.47e-0.1697x) 0.9948
SMR
Apical 1.12 3.28 6.02 11.96 17.04 17.59 – y= 19.08/(1+156.82e-0.1699x) 0.9930
Middle 1.20 3.5 6.59 12.67 17.72 18.51 – y= 20.02/(1+136.60e-0.1662x) 0.9950
Basal 1.22 3.62 6.58 12.73 17.89 18.52 – y= 20.09/(1+134.45e-0.1659x) 0.9936
Average 1.18±0.05 3.47±0.17 6.40±0.33 12.45±0.43 17.55±0.45 18.21±0.53 – y= 19.73/(1+141.82e-0.1673x) 0.9940 †SM, Soybean in monocropping; SI, soybean in intercropping; SMR, soybean in monocropping with rhizobial inoculation; SIR, soybean in intercropping with rhizobial inoculation; –, no data available.
Table 3. The dry matter weight of maize grain after silking for various maize varieties, the fitted logistic equation and determinate coefficient.
Maize variety Treatment† Grainposition Dry matter weight (y, g) of maize grain(100 seeds) after x days of silking Fitted equation
[y= W0/(1+A·e-B·x)] Determinate coefficient (R2) 18 days 25days 32days 39days 46days 53days 60days
Zhengdan 958
MI
Apical 1.55 4.63 8.69 16.94 24.16 29.54 30.52 y= 32.28/(1+272.75e-0.1462x) 0.9988
Middle 1.67 4.87 9.59 18.87 26.06 32.39 32.36 y= 34.27/(1+308.60e-0.1516x) 0.9976
Basal 1.37 4.72 8.98 18.69 26.70 31.93 31.84 y= 33.43/(1+471.97e-0.1640x) 0.9978
Average 1.53±0.15 4.74±0.12 9.09±0.46 18.17±1.07 25.64±1.32 31.29±1.53 31.57±0.95 y= 33.30/(1+339.99e-0.1539x) 0.9982
MIR
Apical 1.55 4.67 8.73 17.02 26.22 30.50 30.56 y= 32.31/(1+442.70e-0.1613x) 0.9970
Middle 1.72 4.94 9.71 19.43 28.46 32.43 32.44 y= 33.95/(1+498.80e-0.1681x) 0.9978
Basal 1.63 4.72 8.90 18.77 27.04 31.99 32.02 y= 33.59/(1+487.41e-0.1649x) 0.9978
Average 1.63±0.09 4.78±0.14 9.11±0.52 18.41±1.25 27.24±1.13 31.64±1.01 31.67±0.99 y= 33.27/(1+474.66e-0.1647x) 0.9976
MM
Apical 1.57 4.82 9.12 18.39 28.01 33.17 33.58 y= 35.39/(1+461.29e-0.1608x) 0.9978
Middle 1.78 4.97 9.84 20.76 30.54 36.25 36.35 y= 38.12/(1+548.81e-0.1668x) 0.9980
Basal 1.72 4.94 9.26 19.98 29.82 34.48 34.92 y= 36.43/(1+605.70e-0.1700x) 0.9978
Average 1.69±0.11 4.91±0.08 9.41±0.38 19.71±1.21 29.46±1.30 34.63±1.55 34.95±1.39 y= 36.64/(1+534.17e-0.1658x) 0.9980
Xianyu 335
MI
Apical 1.49 3.69 8.43 17.54 25.57 29.49 29.69 y= 30.82/(1+681.54e-0.1751x) 0.9988
Middle 1.50 4.53 9.30 18.53 27.74 31.63 33.10 y= 34.26/(1+458.90e-0.1624x) 0.9992
Basal 1.34 4.45 9.12 17.54 26.95 31.45 30.78 y= 32.62/(1+549.56e-0.1683x) 0.9964
Average 1.44±0.09 4.22±0.46 8.95±0.46 17.87±0.57 26.75±1.10 30.86±1.19 31.19±1.74 y= 32.56/(1+551.69e-0.1683x) 0.9986
MIR
Apical 1.45 4.15 9.05 18.02 26.89 30.67 30.75 y= 32.08/(1+611.10e-0.1725x) 0.9984
Middle 1.56 4.63 9.44 19.75 29.14 32.63 33.02 y= 34.22/(1+688.32e-0.1767x) 0.9982
Basal 1.60 4.39 9.22 18.54 27.81 31.85 31.94 y= 33.39/(1+588.99e-0.1709x) 0.9980
Average 1.54±0.08 4.39±0.24 9.24±0.20 18.77±0.89 27.95±1.13 31.72±0.99 31.90±1.14 y= 33.23/(1+627.46e-0.1733x) 0.9982
MM
Apical 1.66 4.71 10.11 19.46 29.56 33.25 33.48 y= 34.97/(1+550.45e-0.1700x) 0.9978
Middle 1.67 5.28 10.53 21.21 30.84 35.58 35.58 y= 37.20/(1+510.27e-0.1681x) 0.9982
Basal 1.65 4.85 10.46 20.04 30.24 34.42 34.52 y= 36.13/(1+526.83e-0.1685x) 0.9980
Average 1.66±0.01 4.95±0.30 10.37±0.23 20.24±0.89 30.21±0.64 34.42±1.17 34.53±1.05 y= 36.11/(1+527.37e-0.1688x) 0.9982
Jinshengyu 567
MI
Apical 1.19 3.14 7.96 18.29 27.33 29.95 31.33 y= 31.71/(1+1450.05e-0.1951x) 0.9992
Middle 1.33 3.94 8.82 18.85 28.45 32.29 33.65 y= 34.55/(1+759.12e-0.1755x) 0.9992
Basal 1.31 3.80 8.73 18.57 28.87 31.66 33.14 y= 33.88/(1+961.98e-0.1828x) 0.9984
Average 1.28±0.08 3.63±0.43 8.50±0.47 18.57±0.28 28.22±0.80 31.30±1.21 32.71±1.22 y= 33.37/(1+1000.28e-0.1839x) 0.9990
MIR
Apical 1.25 3.64 8.02 18.27 28.15 30.17 31.43 y= 31.99/(1+1440.56e-0.1954x) 0.9978
Middle 1.23 4.06 9.06 20.13 30.05 32.75 33.91 y= 34.57/(1+1160.01e-0.1904x) 0.9986
Basal 1.25 4.02 8.87 18.99 30.41 32.64 33.34 y= 34.36/(1+1335.44e-0.1929x) 0.9966
Yang et al. 109
Table 3. Contd.
Average 1.24±0.01 3.91±0.23 8.65±0.55 19.13±0.94 29.54±1.21 31.85±1.46 32.89±1.30 y= 33.64/(1+1298.66e-0.1927x) 0.9978
MM
Apical 1.49 4.29 9.82 20.26 31.26 34.29 34.47 y= 35.75/(1+1006.45e-0.1866x) 0.9976
Middle 1.58 4.72 10.18 21.94 32.16 35.75 36.11 y= 37.25/(1+911.15e-0.1849x) 0.9984
Basal 1.57 4.53 9.98 21.20 31.85 34.65 35.05 y= 36.17/(1+1024.60e-0.1884x) 0.9978
Average 1.55±0.05 4.51±0.22 9.99±0.18 21.13±0.84 31.76±0.46 34.90±0.76 35.21±0.83 y= 36.39/(1+979.41e-0.1867x) 0.9980 †MM, Maize in monocropping; MI, Maize in Intercropping; MIR, maize inintercropping with rhizobial inoculation to soybean.
Table 4. Some growth parameters at grain filling of three soybean varieties.
Soybean variety Treatment † Grain position Parameters of grain filling*
T Tm Va Vm W1 W2 W3 W T1 T2 T3 V1 V2 V3
Xudou 18
SI
Apical 73.11 40.66 0.31 0.81 4.86 13.29 4.63 22.78 31.36 18.60 23.15 0.16 0.71 0.20
Middle 70.44 39.10 0.34 0.87 5.04 13.78 4.80 23.62 30.11 17.97 22.36 0.17 0.77 0.21
Basal 71.10 39.75 0.33 0.86 4.96 13.56 4.75 23.27 30.77 17.97 22.36 0.16 0.75 0.21
Average 71.59 39.84 0.33 0.85 4.96 13.54 4.71 23.21 30.74 18.20 22.65 0.16 0.74 0.21
SIR
Apical 75.15 40.96 0.32 0.80 5.03 13.73 4.79 23.55 31.16 19.60 24.39 0.16 0.70 0.20
Middle 71.48 39.48 0.34 0.88 5.16 14.09 4.95 24.2 30.31 18.34 22.83 0.17 0.77 0.22
Basal 71.79 39.97 0.33 0.86 5.01 13.70 4.80 23.51 30.85 18.24 22.70 0.16 0.75 0.21
Average 72.77 40.11 0.33 0.85 5.06 13.83 4.79 23.68 30.75 18.72 23.30 0.16 0.74 0.21
SM
Apical 70.71 40.03 0.35 0.92 5.18 14.15 4.93 24.26 31.24 17.58 21.88 0.17 0.80 0.23
Middle 69.61 39.46 0.37 0.97 5.41 14.77 5.15 25.33 30.82 17.28 21.51 0.18 0.85 0.24
Basal 68.85 39.40 0.36 0.96 5.18 14.16 4.97 24.31 30.96 16.88 21.01 0.17 0.84 0.24
Average 69.75 39.64 0.36 0.95 5.25 14.35 4.98 24.58 31.01 17.26 21.48 0.17 0.83 0.23
SMR
Apical 72.18 40.33 0.34 0.90 5.25 14.35 5.00 24.6 31.21 18.25 22.72 0.17 0.79 0.22
Middle 69.29 39.45 0.37 0.99 5.43 14.84 5.23 25.5 30.90 17.10 21.29 0.18 0.87 0.25
Basal 68.99 39.44 0.36 0.97 5.26 14.36 5.02 24.64 30.97 16.94 21.08 0.17 0.85 0.24
Average 70.12 39.73 0.36 0.95 5.31 14.51 5.03 24.85 31.02 17.42 21.68 0.17 0.83 0.23
Nansheng 270
SI
Apical 69.48 39.19 0.19 0.51 2.83 7.73 2.70 13.26 30.51 17.36 21.61 0.09 0.45 0.12
Middle 71.51 39.69 0.21 0.54 3.18 8.68 2.99 14.85 30.57 18.24 22.70 0.10 0.48 0.13
Basal 70.19 39.43 0.22 0.59 3.32 9.07 3.19 15.58 30.62 17.63 21.94 0.11 0.51 0.15
Average 70.41 39.44 0.21 0.55 3.11 8.49 2.95 14.55 30.57 17.75 22.09 0.10 0.48 0.13
SIR
Apical 71.17 39.40 0.19 0.49 2.88 7.86 2.74 13.48 30.29 18.22 22.67 0.10 0.43 0.12
Middle 73.15 39.95 0.21 0.53 3.22 8.80 3.04 15.06 30.44 19.03 23.69 0.11 0.46 0.13
Basal 69.80 39.23 0.23 0.59 3.33 9.10 3.22 15.65 30.47 17.52 21.81 0.11 0.52 0.15
Average 71.34 39.52 0.21 0.54 3.14 8.58 2.96 14.68 30.40 18.24 22.70 0.10 0.47 0.13
SM
Apical 72.30 39.82 0.22 0.56 3.32 9.06 3.16 15.54 30.52 18.61 23.17 0.11 0.49 0.14
Middle 71.94 39.63 0.23 0.59 3.52 9.62 3.36 16.5 30.37 18.52 23.05 0.12 0.52 0.15
Basal 70.12 39.12 0.25 0.64 3.67 10.03 3.52 17.22 30.23 17.77 22.12 0.12 0.56 0.16
Average 71.41 39.50 0.23 0.60 3.50 9.57 3.32 16.39 30.36 18.29 22.77 0.12 0.52 0.15
SMR
Apical 73.41 40.23 0.22 0.57 3.45 9.43 3.29 16.17 30.72 19.02 23.67 0.11 0.50 0.14
Middle 72.87 40.10 0.24 0.61 3.66 10.01 3.50 17.17 30.70 18.79 23.38 0.12 0.53 0.15
Basal 70.54 39.41 0.25 0.65 3.75 10.25 3.60 17.6 30.49 17.84 22.21 0.12 0.57 0.16

Int. J. Adv. Agric. Res. 110
Table 4. Contd. Average 72.20 39.88 0.24 0.61 3.62 9.89 3.42 16.93 30.62 18.52 23.05 0.12 0.53 0.15
Heihe 43
SI
Apical 56.32 30.28 0.30 0.74 3.55 9.69 3.38 16.62 22.82 14.92 18.57 0.16 0.65 0.18
Middle 57.29 30.19 0.32 0.77 3.83 10.47 3.61 17.91 22.43 15.53 19.33 0.17 0.67 0.19
Basal 57.36 30.12 0.32 0.78 3.90 10.65 3.71 18.26 22.31 15.61 19.43 0.17 0.68 0.19
Average 57.03 30.20 0.31 0.76 3.76 10.28 3.60 17.64 22.52 15.38 19.14 0.17 0.67 0.19
SIR
Apical 55.33 30.43 0.31 0.80 3.65 9.97 3.47 17.09 23.29 14.28 17.77 0.16 0.70 0.20
Middle 56.73 29.96 0.33 0.79 3.91 10.68 3.61 18.2 22.28 15.35 19.10 0.18 0.70 0.19
Basal 57.05 30.00 0.33 0.80 3.98 10.88 3.78 18.64 22.25 15.50 19.29 0.18 0.70 0.20
Average 56.47 30.13 0.32 0.79 3.85 10.51 3.69 18.05 22.59 15.09 18.79 0.17 0.70 0.20
SM
Apical 57.31 30.20 0.33 0.80 4.00 10.94 3.81 18.75 22.43 15.54 19.34 0.18 0.70 0.20
Middle 56.57 29.82 0.34 0.84 4.12 11.25 3.92 19.29 22.15 15.33 19.08 0.19 0.73 0.21
Basal 56.90 29.56 0.35 0.84 4.21 11.50 3.98 19.69 21.73 15.67 19.50 0.19 0.73 0.20
Average 56.93 29.85 0.34 0.82 4.11 11.22 3.93 19.26 22.09 15.52 19.32 0.19 0.72 0.20
SMR
Apical 56.80 29.75 0.34 0.81 4.03 11.02 3.84 18.89 22.00 15.50 19.29 0.18 0.71 0.20
Middle 57.23 29.59 0.35 0.83 4.23 11.56 4.00 19.79 21.66 15.85 19.72 0.20 0.73 0.20
Basal 57.24 29.54 0.35 0.83 4.25 11.60 4.04 19.89 21.60 15.88 19.76 0.20 0.73 0.20
Average 57.08 29.61 0.35 0.83 4.17 11.39 3.98 19.54 21.74 15.74 19.59 0.19 0.72 0.20
† SM, Soybean in monocropping; SI, soybean in intercropping; SMR, Soybean in monocropping with rhizobial inoculation; SIR, soybean in intercropping with rhizobial inoculation. *T, Total duration days (d) of grain filling, T = T1 +T2 +T3 where, T1, T2 and T3are the duration days (d) of grain filling in prophase (T1), metaphase (T2), and anaphase (T3), respectively; Tm, days (d) reaching to maximal rate of grain filling, Tm = (lnA)/B, where values of A and B come from Table 2; Va, average filling rate of 100 grains per day(g/100 grains/d); Vm, maximal rate of 100 grains filling per day (g/100 grains/d), Vm = W0×B/4, where W0 and B come from Table 2; W1, W2 and W3, dry matter accumulation (g) of 100 grains in prophase (W1), metaphase(W2), and anaphase (W3), respectively; V1, V2 and V3, filling rate of 100 grains in prophase (V1 =W1/T1), metaphase (V2 = W2/T2), and anaphase (V3=W3/T1), respectively.
Table 5. Some growth parameters at grain filling stage of three maize varieties.
Maize variety Treatment Grain position Parameters of grain filling*
T Tm Va Vm W1 W2 W3 T1 T2 T3 V1 V2 V3
Zhengdan 958
MI
Apical 69.79 38.36 0.46 1.18 6.82 18.64 6.50 29.35 18.02 22.42 0.23 1.03 0.29
Middle 68.12 37.81 0.50 1.30 7.24 19.79 6.94 29.12 17.37 21.62 0.25 1.14 0.32
Basal 65.56 37.54 0.51 1.37 7.06 19.30 6.85 29.51 16.06 19.99 0.24 1.20 0.34
Average 67.73 37.87 0.49 1.28 7.04 19.23 6.58 29.32 17.11 21.30 0.24 1.12 0.31
MIR
Apical 66.26 37.77 0.49 1.30 6.83 18.65 6.50 29.61 16.33 20.32 0.23 1.14 0.32
Middle 64.29 36.96 0.53 1.43 7.17 19.60 6.87 29.12 15.67 19.50 0.25 1.25 0.35
Basal 65.40 37.53 0.51 1.38 7.10 19.39 6.75 29.55 15.97 19.88 0.24 1.21 0.34
Average 65.32 37.42 0.51 1.37 7.03 19.21 6.69 29.42 15.99 19.90 0.24 1.20 0.34
MM
Apical 66.72 38.15 0.53 1.42 7.48 20.43 7.12 29.96 16.38 20.39 0.25 1.25 0.35
Middle 65.36 37.82 0.58 1.59 8.06 22.01 7.73 29.92 15.79 19.65 0.27 1.39 0.39
Basal 64.71 37.68 0.56 1.55 7.70 21.03 7.37 29.94 15.49 19.28 0.26 1.36 0.38
Average 65.60 37.88 0.56 1.52 7.74 21.15 7.47 29.94 15.89 19.77 0.26 1.33 0.38
Xianyu 335 MI
Apical 63.50 37.26 0.49 1.35 6.51 17.79 6.20 29.74 15.04 18.72 0.22 1.18 0.33
Middle 66.03 37.74 0.52 1.39 7.24 19.78 6.73 29.63 16.22 20.19 0.24 1.22 0.33
Basal 64.79 37.49 0.50 1.37 6.89 18.83 6.62 29.66 15.65 19.48 0.23 1.20 0.34

Yang et al. 111 Table 5. Contd.
Average 64.81 37.51 0.50 1.37 6.88 18.80 6.56 29.69 15.65 19.48 0.23 1.20 0.34
MIR
Apical 63.83 37.19 0.50 1.38 6.78 18.52 6.46 29.56 15.27 19.00 0.23 1.21 0.34
Middle 62.98 36.98 0.54 1.51 7.23 19.76 6.93 29.53 14.91 18.55 0.24 1.33 0.37
Basal 64.21 37.32 0.52 1.43 7.06 19.28 6.67 29.62 15.41 19.18 0.24 1.25 0.35
Average 63.69 37.17 0.52 1.44 7.02 19.19 6.71 29.57 15.20 18.92 0.24 1.26 0.35
MM
Apical 64.15 37.12 0.55 1.49 7.39 20.19 7.04 29.38 15.49 19.28 0.25 1.30 0.37
Middle 64.44 37.10 0.58 1.56 7.86 21.48 7.46 29.27 15.67 19.50 0.27 1.37 0.38
Basal 64.46 37.19 0.56 1.52 7.64 20.86 7.28 29.38 15.63 19.45 0.26 1.33 0.37
Average 64.35 37.13 0.56 1.52 7.63 20.85 7.27 29.33 15.60 19.42 0.26 1.34 0.37
Jinshengyu 567
MI
Apical 60.86 37.31 0.52 1.55 6.70 18.31 6.38 30.56 13.50 16.80 0.22 1.36 0.38
Middle 63.97 37.79 0.54 1.52 7.30 19.95 6.65 30.29 15.01 18.68 0.24 1.33 0.36
Basal 62.71 37.58 0.54 1.55 7.16 19.56 6.89 30.37 14.41 17.93 0.24 1.36 0.38
Average 62.55 37.56 0.53 1.53 7.05 19.27 6.73 30.40 14.32 17.83 0.23 1.35 0.38
MIR
Apical 60.74 37.22 0.53 1.56 6.76 18.47 6.44 30.48 13.48 16.78 0.22 1.37 0.38
Middle 61.19 37.06 0.56 1.65 7.31 19.96 6.88 30.14 13.83 17.22 0.24 1.44 0.40
Basal 61.13 37.31 0.56 1.66 7.26 19.84 6.96 30.48 13.65 16.99 0.24 1.45 0.41
Average 61.05 37.20 0.55 1.62 7.11 19.42 6.76 30.37 13.67 17.01 0.23 1.42 0.40
MM
Apical 61.68 37.05 0.58 1.67 7.55 20.64 7.20 30.00 14.12 17.57 0.25 1.46 0.41
Middle 61.71 36.86 0.60 1.72 7.87 21.51 7.46 29.73 14.25 17.73 0.26 1.51 0.42
Basal 61.18 36.79 0.59 1.70 7.64 20.88 7.32 29.80 13.98 17.40 0.26 1.49 0.42
Average 61.50 36.89 0.59 1.70 7.69 21.01 7.33 29.83 14.11 17.56 0.26 1.49 0.42
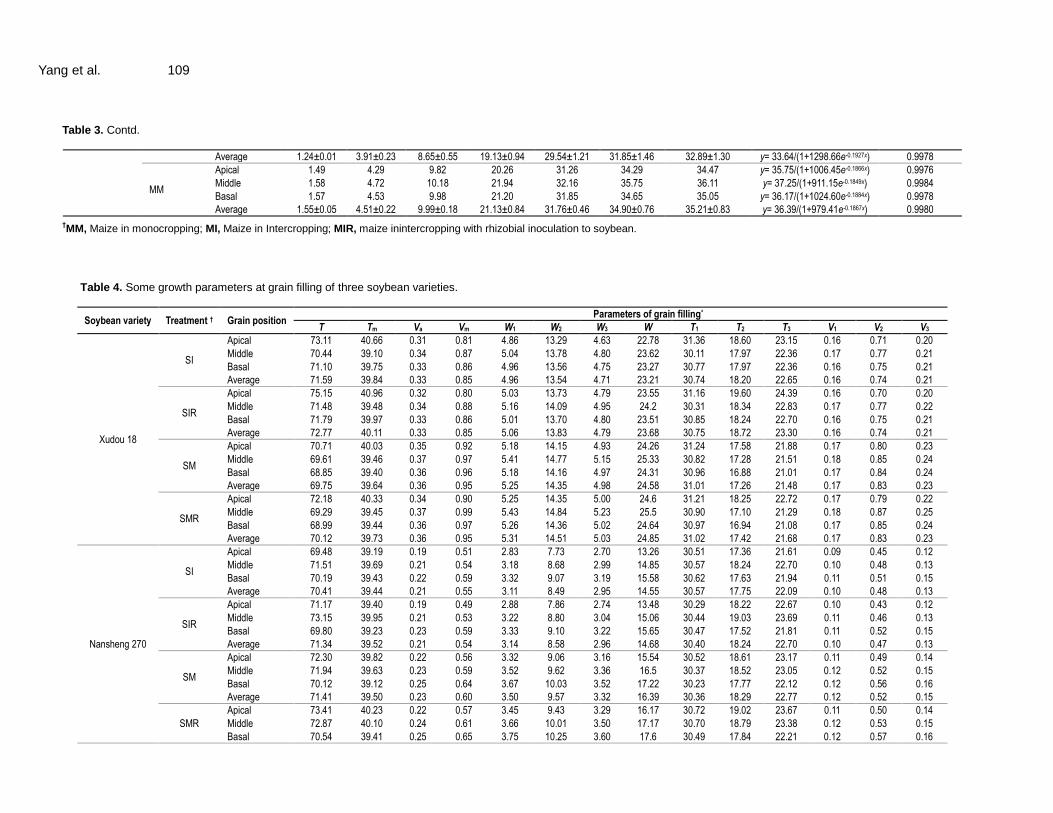
† MM, Maize in monocropping; MI, maize in intercropping; MIR, maize in intercropping with rhizobial inoculation to soybean; *T, total duration days (d) of grain filling, T = T1 +T2 +T3 where, T1, T2 and T3 are the duration days (d) of grain filling in prophase (T1), metaphase (T2), and anaphase (T3), respectively; Tm, days (d) reaching to maximal rate of grain filling, Tm=(lnA)/B, where values of A and B come from Table 3 Va, average filling rate of 100 grains per day (g/100 grains/d); Vm filling per day (g/100 grains/d),Vm = W0 × B/4, where W0 and B come from Table 3; W1, W2 and W3, dry matter accumulation (g) of 100 grains in prophase (W1), metaphase(W2), and anaphase (W3), respectively; V1, V2 and V3, filling rate of 100 grains in prophase (V1 =W1/T1), metaphase (V2 = W2/T2), and anaphase (V3 =W3/T1), respectively. from fitted logistic growth equations (Table 2 and 3) and the parameters (Table 4 and 5).
Among the three soybean varieties, the total duration days of grain filling (T) extended for longer time for the all inoculated treatments compared with the non-inoculation treatments, except the treatment Heihe 43 in the intercropping system (Table 4). There was no difference for the average filling rate of 100 grains per day (Va) between the inoculated and non-inoculated treatments for the three soybean varieties, but significant increases of the Va values were found in the sole cropped soybeans than those in the intercropped treatments (Table 4).
For the three maize varieties, total duration days of grain filling (T) extended for longer time only for the maize-non-inoculated-soybean intercropping (MI) treatments (Table 5). However the highest values of the average filling rate of 100 grains per day (Va) were found in the sole cropped maize (MM) treatments (Table 5). Slightly increases of the Va were observed in the maize intercropped with inoculated soybean (Table 5). Crop yield and yield components The adjusted yields of the three soybean varieties
were highest in the monocropping systems with rhizobial inoculation (SMR) (Figure 4A). Of the three varieties, Xudou 18 showed the highest yields in SMR treatment than other treatments (SM, SIR and SI) (p<0.01) (Figure 4A). The yield components were related significantly to the number of filled pods per plant, total seeds per plant, and 100-seed weight (Figure 4B, C and D). A yield increase of 53.2% was ever reported due to inoculation of rhizobium over the uninoculated control in monocropping system (Solomon et al., 2012), indicating the huge potential of rhizobial inoculation to the yield of soybean.
The yields of the three maize varieties were

Int. J. Adv. Agric. Res. 112
Figure 4. Yield and its components of the crops. A to D, For three varieties of soybean; E to H, for three varieties of maize; SI, soybean in intercropping; SIR, soybean in intercropping with rhizobial inoculation; SM, soybean in monocropping; SMR, soybean in monocropping with rhizobial inoculation; MI, maize in intercropping; MIR, maize in intercropping with rhizobial inoculation to soybean; MM, maize in monocropping. Columns followed by the different letters are significantly different (p<0.05).

Yang et al. 113
Figure 5. Yield value for soybean and maize in different treatments. A, Yield value of three maize varieties in monocropping system; B, yield value of soybean variety Xudou 18 grown solely and intercropped (+) with the three varieties of maize; C, yield value of soybean variety Heihe 43 grown solely and intercropped (+) with the three varieties of maize; D, yield value of soybean variety Nansheng 270 grown solely and intercropped (+) with the three varieties of maize. Black and grey (control) columns in (B), (C) and (D) represent inoculated and non-inoculated soybean plants with Sinorhizobium fredii, respectively.
significantly higher in monocropping than in intercropping treatments (p<0.01) (Figure 4E). The number of maize ears per hectare at maturity was not significantly different between monocropping and intercropping (p>0.05) (Figure 4F). However, the numbers of grains per ear and 100-seed weight were significantly higher in monocropping than in intercropping (p>0.01) (Figure 4G). Our results were consistent with those reported by Gutu et al. (2015) that sole cropped maize gave significantly higher number of grains per ear, biological yield and grain
yield than the respective intercrop. Yield value of crops and LER The highest yield value ($5130.7 ha
-1) was in the
intercropping system comprising maize variety Zhengdan 958 and soybean variety Xudou 18 inoculated with rhizobium (Figure 5B). All the treatments with inoculation to soybean increased the yield values by more than

Int. J. Adv. Agric. Res. 114
Table 6. The LER for intercropping soybean and maize†.
Soybean Xudou 18 Heihe 43 Nansheng 270
Maize Inoculated Control Inoculated Control Inoculated Control
Zhengdan 958 1.62±0.003a 1.58±0.017b 1.59±0.002a 1.59±0.011a 1.56±0.014a 1.55±0.012a
Xianyu 335 1.64±0.005a 1.60±0.004b 1.60±0.012a 1.61±0.004a 1.58±0.008a 1.58±0.007a
Jinshengyu 567 1.56±0.01a 1.53±0.001b 1.53±0.004a 1.54±0.012a 1.50±0.06a 1.50±0.03a † Values followed by different letters are significantly different at p<0.05.
5.07% (Figure 5B, C and D).
The LER values in all intercropping systems were greater than 1.5 and were higher than those in the monocropping systems of maize or soybean (Table 6). The LER of inoculated soybean variety Xudou 18 intercropped with all the three maize varieties reached the highest value compared with all the other treatments (Table 6). The total LER of maize and soybean intercrops was significantly (p<0.01) affected by soybean variety and plant population (Gutu et al., 2016). Based on the results above, the two varieties, Xudou 18 and Zhengdan 958 represented the best combination and could be recommended for the study area around Shandong Province. Conclusions In current study, the characterization and logistic fitting of DMA of shoots, grain filling and crop yield of different varieties of inoculated soybean and maize were evaluated and compared in the intercropping and monocropping system. Maximum DMA of shoots and grain filling were only observed in the monocropping system, while the rhizobial inoculation to soybean increased in the yield of soybean in both cropping systems. Best combination of inoculated soybean (Xudou 18) and maize (Zhengdan 958) varieties in intercropping system was obtained in the test field for their highest yields, yield values and higher LER value. Though the consistency of the three repeats in the same treatment, the current experiment was performed only in one year. More experiments need be carried out and further studies could focus on the influences of the root exudates and rhizosphere microbiome on the interaction of the two crop varieties (Xudou 18 and Zhengdan 958) in intercropping system. ACKNOWLEDGEMENTS This work was supported financially from National Key Research and Development Program of China (2018YFD0201001), National Basic Research Program of China (973 program 2015CB158301), State Key
Laboratory of Agrobiotechnology (2017SKLAB7-1) and from Chinese Universities Scientific Fund (No. 2017TC030). Thanks to Suge Wang, Rui Guo, Xianglong Guo, Jiqiu Cao and Xiaoyan Zhang (from Shandong Shofine Seed Technology Company, Ltd.) for their help and managements in cultivation of soybean/maize in the field. Abbreviations MM, Maize in monocropping; SM, soybean in monocropping; MI, maize in intercropping; MIR, maize in intercropping with rhizobial inoculation of soybean; SI, soybean in intercropping; SMR, soybean in monocropping with rhizobial inoculation; SIR, soybean in intercropping with rhizobial inoculation; DMA, dry matter accumulation of shoots; DMAR, dry matter accumulation rate; LER, land equivalent ratio. REFERENCES Board J. E. & Kahlon C. S. (2011). Soybean yield formation: what
controls it and how it can be improved. Soybean Hany A. El-Shemy, IntechOpen. doi: 10.5772/17596.
Chen F. & Pang H. (2000). Research on mechanism for maximum yield of intercropping pattern wheat/corn/corn. J. China Agri. Univ. 5(5):12-16.
Chen P., Du Q., Liu X. M., Zhou L., Hussain S., Lei L., Song C., Wang X. C., Liu W. G., Feng Y., Shu K., Liu J., Du J. B., Yang W. Y. & Yong T. W. (2017). Effects of reduced nitrogen inputs on crop yield and nitrogen use efficiency in a long-term maize-soybean relay strip intercropping system. PLoS ONE. 12(9): e0184503.
Chen W. X., Di L. F. & Yan Z. C. (2002). Retrospect and prospect of soil microbiology and biological nitrogen fixation researches in China. World Sci-Tech. Res. Dep. 24(4):6-12.
Darroch B. A. & Baker R. J. (1990). Grain filling in 3 spring wheat genotypes-statistical-analysis. Crop Sci. 30:525-529.
Echarte L., Della Maggiora A., Cerrudo D., Gonzalez V. H., Abbate P., Cerrudo A., Sadras V. O. & Calvino P. (2011). Yield response to plant density of maize and sunflower intercropped with soybean. Field Crops Res. 121(3):423-429.
Gao Y., Duan A., Liu Z., Sun J., Chen J. and Wang H. (2009). Effect of intercropping patterns on dry matter accumulation and yield components of maize and soybean. Chin. Agri. Sci. Bull. 25(2):214-221.
Gutu T., Tana T. & Geleta N. (2015). Effect of varieties and population of intercropped soybean with maize on yield and yield components at haro sabu, Western Ethiopia. Sci. Tech. Arts Res. J. 4(4):31-39.

Yang et al. 115 Gutu T., Tana T. & Geleta N. (2016). Influence of varieties and
population of intercropped soybean with maize on land equivalent ratio (LER) and growth monetary value (GMV) of the component crops. J. Biol. Agri. Health. 6:25-29.
Hanway J. J. & Weber C. R. (1971a). Dry matter accumulation in 8 soybean [Glycine max (L.) Merrill] varieties. Agron. J. 63(2):227-230.
Hanway J. J. & Weber C. R. (1971b). Dry matter accumulation in soybean [Glycine max (L.) Merrill] plants as influenced by N, P, and K fertilization. Agron. J. 63(2):263-266.
Issahaku A. R. (2010). Spatial arrangements and time of introducing an intercrop on the productivity of component crops in maize (Zea mays L.) – soybean [Glycine max (L.) Merrill] intercropping systems. Doctoral dissertation.
Javanmard A., Nasab A. D. M., Javanshir A., Moghaddam M. & Janmohammadi H. (2009). Forage yield and quality in intercropping of maize with different legumes as double-cropped. J. Food Agri. Environ. 7(1):163-166.
Ji Z. J., Wang F. M., Wang S. G., Yang S. H., Guo R., Tang R. Y., Chen W. X. and Chen W. F. (2014). Symbiotic matching between soybean cultivar Luhuang No. 1 and different rhizobia. J. Appl. Ecol. 25(12):3573-3579.
Jiang Z. F., Han Y. P., Teng W. L., Zhang Z. C., Sun D. S., Li Y. H. & Li W. B. (2010). Identification of QTL underlying the filling rate of protein at different developmental stages of soybean seed. Euphytica. 175(2):227-236.
Kurdali F. (2009). Growth and nitrogen fixation in dhaincha/sorghum and dhaincha/sunflower intercropping systems using
15Nitrogen and
13Carbon natural abundance techniques. Commun. Soil Sci. Plant.
40(19-20):2995-3014. Li L., Sun J. H., Zhang F. S., Li X. L., Rengel Z. & Yang S. C. (2001).
Wheat/maize or wheat/soybean strip intercropping: Ii. Recovery or compensation of maize and soybean after wheat harvesting. Field Crops Res. 71(3):173-181.
Li S. C., Sheng X., Lu J. H. & Meng B. M. (1999). Growth analysis on the process of grain filling in maize. J. Shihezi Univ. 3(12):1-5.
Lithourgidis A. S., Vlachostergios D. N., Dordas C. A. and Damalas C. A. (2011). Dry matter yield, nitrogen content, and competition in pea-cereal intercropping systems. Eur. J. Agron. 34(4):287-294.
Mead R. & Willey R. W. (1980). The concept of a ʻland equivalent ratioʼ and advantages in yields from intercropping. Exp. Agr. 16:217-228.
Midmore D. J. (1993). Agronomic modification of resource use and intercrop productivity. Field Crops Res. 34(3-4):357-380.
Ntanos D. A. & Koutroubas S. D. (2002). Dry matter and N accumulation and translocation for indica and japonica rice under mediterranean conditions. Field Crops Res. 74(1):93-101.
Ofori F. & Stern W. R. (1987). Cereal–legume intercropping systems. In Advances in agronomy. Pp. 41-90.
Olsen S. R., Cole C. V., Watanabe F. S. & Dean L. A. (1954). Estimation of available phosphorus in soils by extraction with sodium bicarbonate. US Dept. Agri. Circ. 939:1-19.
Ren Y. Y., Wang Z. L., Wang X. L. & Zhang S. Q. (2015). The effect and mechanism of intercropping pattern on yield and economic benefit on the Loess Plateau. Acta Ecol. Sin. 35(12):4168-4177.
Sadras V. O. & Lawson C. (2011). Genetic gain in yield and associated changes in phenotype, trait plasticity and competitive ability of south australian wheat varieties released between 1958 and 2007. Crop Past Sci. 62(7):533-549.
Solomon T., Pant L. M. & Angaw T. (2012). Effects of inoculation by
Bradyrhizobium japonicum strains on nodulation, nitrogen fixation, and yield of soybean [Glycine max (L.) Merill] varieties on nitisolsof bako, Western Ethiopia. Int. Sch. Res. Net. ISRN Agron. 261475:1-8.
Su Y. H., Huang G. Q., Liu X. Y. & Liu L. W. (2005). Studies on the mechanism of increasing yield and income of the intercropping system with maize and soybean in upland of red soil. Acta Agri. Univ. Jiangxi. 27:210-213.
Tang J., Mboreha I. A., She L., Liao H., Chen H., Sun Z. & Yan X. (2005). Nutritional effects of soybean root architecture in a maize/soybean intercropping system. Sci. Agri. Sin. 38(6):1196-1203.
Tariah N. M. & Wahua T. A. T. (1985). Effects of component populations on yields and land equivalent ratios of intercropped maize and cowpea. Field Crops Res. 12(1):81-89.
Wahed A. R., Moutonnet P., Ashraf M. Y., Naqvi M. H., Kirda C., Tahir G. R., Awan A. R. & Iqbal M. M. (2001). Contribution of irrigations to grain yield of wheat (Triticum aestivum L.) at critical crop growth stages. J. Biol. Sci. 1(6):468-471.
Wang X., Wang Z. B., Xu Z. J., Qi Y. J., Wang X. J. & Sui D. (2014). Breeding report of summer soybean variety Xudou 18. Soybean Sci. 33:145-146.
Xiao Y., Li L. & Zhang F. (2005). The interspecific nitrogen facilitation and the subsequent nitrogen transfer between the intercropped wheat and fababean. Sci. Agri. Sin. 38(5):965-973.
Xie F. T., Wang H. Y., Wang X. G., Cao Y. Q. & Zhao W. H. (2001). Dynamics of growth and development of a soybean cultivar with specific plant-type. J. Shengyang Agri. Univ. 6:403-406.
Yang S. H., Chen W. H., Wang E. T., Chen W. F., Yan J., Han X. Z., Tian C. F., Sui X. H., Singh R. P., Jiang G. M. & Chen W. X. (2018). Rhizobial biogeography and inoculation application to soybean in four regions across China. J. Appl. Microbiol. 125(3):853-866.
Yang S. H., Qiu J. X., Li H. J., Wang S. G., Zhang X. Y., Li C. Y., Li Q. & Zhang C. X. (2013). Technological exploration for the yield potential of the soybean in Huanghuaihai region. Chin. Seed Indust. 2013:42-44.
Yao X. D., Zhou H. L., Zhu Q., Li C. H., Zhang H. J., Wu J. J. and Xie F. T. (2017). Photosynthetic response of soybean leaf to wide light-fluctuation in maize-soybean intercropping system. Front Plant Sci. 8(9):1695.
Zhang Y. T., Liu J., Zhang J. Z., Liu H. B., Liu S., Zhai L. M., Wang H. Y., Lei Q. L., Ren T. Z. & Yin C. B. (2015). Row ratios of intercropping maize and soybean can affect agronomic efficiency of the system and subsequent wheat. PLoS ONE. 10(6): e0129245.
Zhang Y. Z., Wang E. T., Li M., Li Q. Q., Zhang Y. M., Zhao S. J., Jia X. L., Zhang L. H., Chen W. F. & Chen W. X. (2011). Effects of rhizobial inoculation, cropping systems and growth stages on endophytic bacterial community of soybean roots. Plant Soil. 347(1-2):147-161.
Zhong Z. T., Shen Q. R., Ran W., Sun X. H., Tan J. K. & Mao Z. S. (2002). The promoting of plant growth by rhizobium inoculation in mixed cropping of rice and peanut cultivated on upland condition. Sci. Agri. Sin. 35(5):303-308.
Recommended