Inner-shell photoabsorption studies in free atoms and ions isoelectronic to sodium, magnesium, aluminium
and silicon.
A thesis for the degree of Doctor of Philosophy
submitted to
Dublin City University
By
Muhammad Hassan Sayyad, M.Sc.
School of Physical Sciences Dublin City University
Research Supervisor
Prof. Eugene T. Kennedy
August 1994

I hereby certify that this material, which I now submit for assessment on the programme of study leading to the award of Doctor of Philosophy, is entirely my
own work and has not been taken from the work of others save and to the extent
that such work has been cited and acknowledged within the text of my work.
Signed: / ' ID No: 1 M )Candidate
Dated: 3 / - / 9 %

This thesis is dedicated to my parents, wife (Riwana), sister (Azra)
and daughter (Maryam).
CONTENTS
Chapter 1: Inner-shell photoionization studies in free ions 1
1.1 Introduction 1
1.2 Photoionization measurements in free ions 3
1.2.1 Photoion spectroscopy 5
1.2.2 Photoelcctron spectroscopy 6
1.2.3 Photoabsorption spectroscopy 10
1.3 Conclusions 17
1.4 References 18
Chapter 2: Summary of atomic structure theory 25
2.1 Introduction 252.2 The Schrodinger equation for a multi-electron system 262.3 Choosing the basis functions 292.4 Matrix elements for basis functions 30
2.5 One-electron and total atom binding energies 312.6 Calculation of level structure 34
2.6.1 Determination of radial functions 35
2.6.2 Calculation of energy levels 36
2.6.3 Calculation of statistically-weighted oscillator strength 40
2.7 Ab initio calculations with Cowan’s code 43
2.7.1 RCN35 43
2.7.2 RCN2 462.7.3 RCG10 47
2.8 References 48
Abstract viii
iv
Chapter 3: Experimental method and results 493.1 Experimental method 49
3.2 Experimental systems 503.2.1 Photographic system 51
3.2.2 Photoelectric system 533.3 Photoabsorption of magnesium laser plasma 54
3.3.1 Atomic magnesium in ground state absorption 54
3.3.2 Atomic magnesium in excited state absorption 55
3.3.3 Na-like magnesium in excited state absorption 56
3.4 Photoabsorption of aluminium laser plasma 5 83.4.1 Atomic aluminium in ground state absorption 58
3.4.2 Mg-like ionic A1+in ground state absorption 59
3.4.3 Neutral Al in excited state absorption 61
3.4.4 Mg-like ionic Al+ in excited state absorption 62
3.4.5 Na-like ionic Al2+ in excited state absorption 62
3.5 Photoabsorption of silicon laser plasma 633.5.1 Neutral and singly ionised silicon in ground state absorption 64
3.5.2 Mg-like ionic Si2+ in ground state absorption 65
3.4.4 Si3+, Si2+ and Si+ in excited state absorption 66
3.6 Conclusions 683.7 References 69
Chapter 4: Magnesium isoelectronic sequence in ground state
absorption 714.1 Previous work 714.2 Present work 74
4.3 Effects of Cl on the ground and excited states 764.3.1 Cl effects on the excited states 76
4.3.2 Cl effects on the ground state 81
4.4 Term analyses 844.5 Conclusions regarding the general behaviour along the
isoelectronic sequence 884.6 References 90
v
Chapter 5: Aluminium isoelectronic sequence in ground statesabsorption 93
5.1 Previous work 935.2 Present work 945.3 Results and analyses 95
5.3.1 The 2p53s23pns series 97
5.3.2 Transitions to the 2p53s3p3 array 102
5.3.3 The 2p53s23pnd series 106
5.4 Conclusions 114
5.6 References 115
Chapter 6: The ground states absorption in atomic silicon 1176.1 Introduction 1176.2 Results and analysis 118
6.2.1 Transitions from 2p63s23p2 3P012 levels 120
6.2.1 Transitions from 2p63s23p2 !D2 level 125
6.2.3 Transitions from 2p63s23p2 'S0 level 126
6.3 Comparison between the 2p absorption in atomic silicon and gasphase silane 127
6.4 Conclusions 1306.5 References 132
Chapter 7: Photoabsorption in valence-excited isoelectronicspecies 134
7.1 Introduction 1347.2 Magnesium sequence in excited state absorption 135
7.2.1 Results and term analyses 136
7.2.2 Decay of the levels of 2p53 s23p configuration 142
7.2.3 Absorption from metastable and dipole allowed levels 148
7.2.3(a) Kinetics of 'P and 3P populations 1507.2.3(b) Population of 3P levels 1517.2.3(c) Population of !P levels 153
7.3 Aluminium sequence in excited state absorption 154
7.3.1 Results and discussion 154
7.4 Conclusions 1597.5 References 160
vi

Appendix A: The sodium isoelectronic sequence in ground state absorption
Appendix B: The sodium isoelectronic sequence in excited states absorption
Appendix C: Details of the transitions in atomic silicon absorption
Acknowledgem ents
ABSTRACT
Using the dual laser-produced plasma technique photoabsorption studies of
Mg, A1 and Si plasmas have been carried out. The objective was to measure the
2p-subshell absoiption in neutral and ionised species of the Na I, Mg I, Al I and
Si I sequences prepared both in ground and valence-excited states. The spectra
were recorded on a grazing incidence 2m Hilger stigmatic spectrograph and a 2.2m
McPherson spectrometer equipped with MCP/PDA multichannel detection.
In an attempt to distinguish the origin of the various absorption features
observed, and to record almost pure spectra of the species of interest, a number of
time and space-resolved studies were carried out. These studies which exploit the
temporal and spatial evolution of absorbing species in a laser-generated plasma
plume were very successful, particularly, for neutral and singly ionised species. To
facilitate the analyses of the spectra a range of ab initio atomic structure
configuration-interaction Hartree-Fock (CIHF) calculations were carried out.
The Mg sequence in ground state absorption has been studied for atomic
Mg and Mg-like ions Al+ and Si2+. The effects of configuration-interaction in the
ground and excited states have been examined in detail. Interpretation has been
provided for the distribution of oscillator strength and the relative positions of
observed transitions. The Mg sequence in excited state absorption is reported for
Mg, Al+ and Si2+. In order to provide insight into the dynamics of excited levels a
comparison is made with the ejected-electron spectra of the corresponding atomic
and ionic species arising from the autoionising and Auger transitions following
electron- and photon-impact excitation/ionization.
The 2p-subshell photoabsorption study along the A1 sequence in ground
state has been carried out for atomic A1 and Al-like ionic Si+. In this work a
complete analysis of these three electron systems is reported. The 2p absorption
study of Al-like Si+ in their excited states has also been carried out.
The 2p-subshell photoabsorption spectrum of ground state atomic Si has
been investigated. In addition to providing interpretation for the observed
viii
spectrum, a comparison is made with molecular spectra.
Photoabsorption spectra of the isoelectronic species Mgr1-, A l2+ and Si3+
both in ground and valence-excited states are presented and await analysis.
The overall results show that 2p photoabsorption of atoms and ions along
the Mg I, Al I and Si I sequences in ground and excited states is dominated by the
2p63sa3pb -» 2p53sa3pb[(n+l)s + nd] + 2p53sa_13pb+1np, for n > 3, and
2p63sa*13pb+1 -» 2p53sa3pb+1 transitions respectively. In ground state absorption
spectra the 2p53sa3pb[(n+l)s + nd] Rydberg series members are strongly
perturbed by the 2p53sa_13pb+1np doubly-excited states. In moving from neutral to
ionic absorption along the sequences dramatic changes are observed. However, in
the valence-excited spectra the absorption structures corresponding to the
2p53sa3pb+1 type configurations are observed to be unperturbed and same in
appearance along the sequences.
Chapter i
INNER-SHELL PHOTOIONIZATION
STUDIES IN FREE IONS
The 2p-subshell photoabsorption spectra for a number of free many-electron systems,
mostly ions, in ground and valence-excited states are reported in this thesis for the first time. The
measurements and analyses of the observed spectra are given in the succeeding chapters. This
chapter reviews recent experimental developments in the inner-shell photoabsorption and
photoionization studies of free ions in ground and excited states.
1.1 Introduction
Even though highly ionised ions vastly predominate in the universe, very little is known experimentally on photoexcitation or photoionization of ions, because ionic species do not exist naturally on the earth. Experimental data on
inner-shell photoexcitation/photoionization in neutral, singly or multiply ionised atoms are required in many areas. A knowledge of the cross section for photoionization of positively charged atomic ions is necessary in connection with plasma physics and controlled thermonuclear fusion; is relevant to upper
atmospheric physics where solar radiation is absorbed by positive ions as well as neutral atoms and molecules; and finds applications in space and astrophysics to the transport of radiation through stellar atmospheres and planetary nebulae
(Missavage et al. 1977). The calculated ionic photoionization cross sections, usually based upon simple models, are largely untested (Nasreen et al. 1989, Deshmukh et al. 1988, Daum and Kelly 1976) because very little is known about
ionic photoabsorption due to the technical difficulties in producing high densities of ions suitable for photoabsorption measurements. The measured energy levels are required in connection with plasma diagnostics, XUV laser research and the identification of solar and stellar spectra. Photoabsorption studies complement
many other studies carried out using ejected-electron spectroscopy following photon, electron and ion-impact excitation/ionisation, and beam-foil spectroscopy.
1
The studies of the ejected-electron spectra following low energy electron or ion- impact excitation/ionisation which exhibit resonances arising from the dipole
allowed and optically inaccessible states often end with a number of unidentified structures (see for example Pejcev etal. 1977). Therefore, photoabsorption studies from ground and excited states achieved by optimising in either ground (see chapters 4, 5 and 6) or excited states (see chapter 7) are of great help for the
identification of such spectra. The study of the decay dynamics of individual levels (Whitfield et al. 1991) following photon excitation allows the identification of transitions involving spectator decay, participator decay, shakeup or shakedown
processes. These studies provide experimental evidence of the presence of various electron-interactions in a multi-electron system. Without the exact knowledge of the energy levels of the systems under consideration these studies are not possible; therefore, the measured level energies obtained through photoabsorption studies can stimulate these studies. Systematic investigations along isoelectronic or isonuclear sequences are of particular value as they provide insight into fundamental aspects of the photoionization process such as relativistic effects,
correlation effects, orbital collapse ( see e.g. Lucatorto et al. 1981, Lahiri and Manson 1988).
To date photoabsorption spectroscopy has been applied mostly to neutral
species, particularly easily evaporable elements such as alkali and alkaline earth metal atoms. However, very little absorption spectroscopy has been performed for the refractory metals and ionised species in either ground or excited states. The
reason is mainly due to the difficulty of producing a suitable and reproducible column of absorbing species with enough density to allow absorption measurements. These conditions can be met, however, in a pulsed regime and it is possible to perform absorption experiments of neutral and ionised species by using
a pulsed background continuum source time synchronised with the transient absorbing species. For this reason the laser produced plasma (LPP) is very suitable for absorption experiments of both refractory metals and ionised species.
In fact, it can be used to generate in pulsed regime, both the background continuum and the absorbing medium. Exploiting these properties of LPPs Carroll and Kennedy (1977) performed successfully an absorption experiment on the ionic
species Li+.This technique, known as dual laser-produced plasma (DLPP), is
relatively well established now and has been successfully applied to atoms and ions both in ground and excited states (see chapter 3).
Fortunately, the developments in instrumentation and atomic structure
2
theory have gone hand in hand with the development of experimental techniques. The rapid technological developments, leading to more efficient spectrometers
(Tondello 1979, Jannitti et al. 1979, Hopkins 1992) equipped with photoelectronic detectors (Cromer et al. 1985, Schwob et al. 1987, Jannitti et al. 1990, Kieman 1994a), computer aided control, data acquisition and analysis (Shaw 1994), have opened up remarkable possibilities - it is possible now to obtain and measure
absorption spectra of atoms and ions in ground and excited states for a wide variety of species. Atomic structure theory has entered a new era with the widespread availability of super computers and high performance workstations.
Experimental investigations of the observed features are greatly facilitated by the theoretical results, based on ab initio configuration-interaction atomic structure calculations (see chapter 2). Although some theoretical approaches enable one to
investigate fairly complicated mathematical models of the systems under consideration and to obtain in this way results which are in quite good agreement with the experimental measurements even then the study of some systems poses many challenging problems both for theorists and experimenters. The absorption
transitions arising from the different initial states or different ionisation stages which fall in the same spectral region are very difficult to distinguish. Short-lived dipole allowed states hardly get populated (see chapter 7), therefore, it is very
difficult to carry out their photoabsorption measurements. Some multiply-excited states though of great interest usually have very low cross sections and are, therefore, very difficult to observe (Kiernan et al. 1994b) in photoabsorption
experiments. Furthermore, a reliable calculation of term energies, together with a clear physical interpretation of the oscillator strength distributions between various transitions of a many-electron atom is an extremely difficult task for any theoretical approach when more than one electron is involved in the photoexcitation process
(see chapters 4, 5 and 6).
1.2 Photoionization measurements in free ions
Photoabsorption or photoionization of free atoms have long been areas of
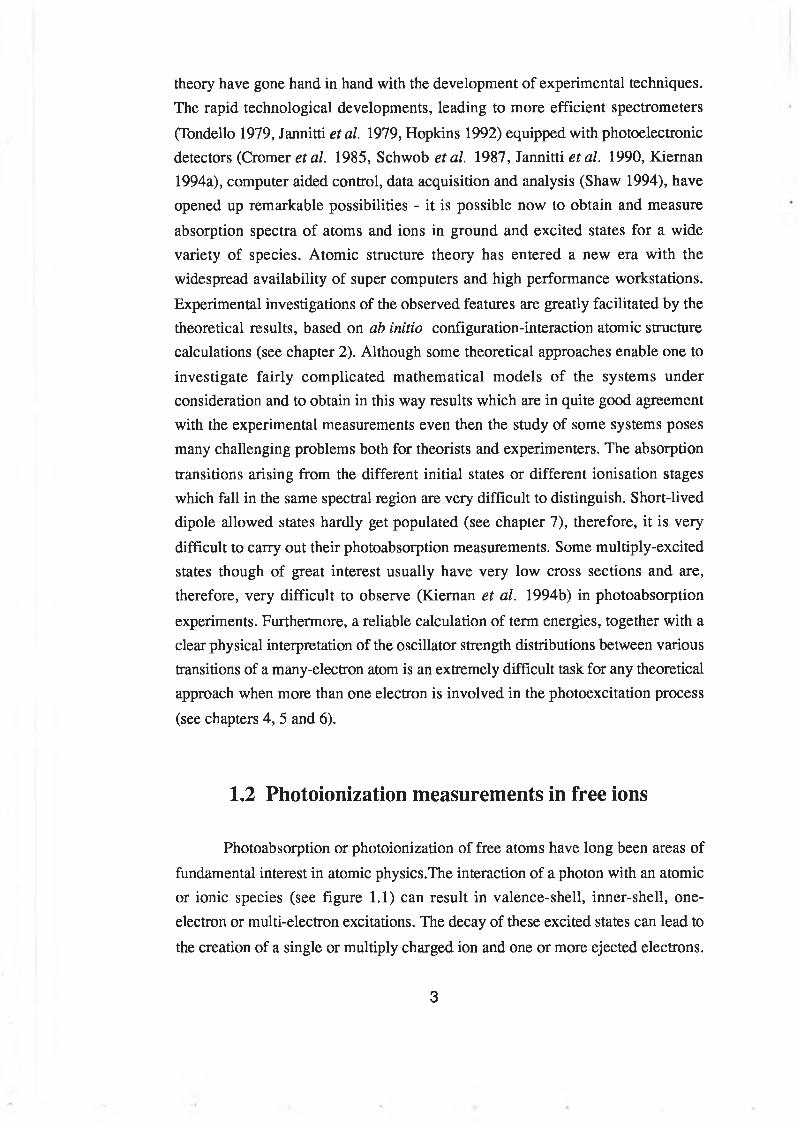
fundamental interest in atomic physics.The interaction of a photon with an atomic or ionic species (see figure 1.1) can result in valence-shell, inner-shell, one- electron or multi-electron excitations. The decay of these excited states can lead to
the creation of a single or multiply charged ion and one or more ejected electrons.
3
Fluorescence can also be a part of the decay cascade. Hence, absorption, ion, electron, and fluorescence spectroscopies are complementry experimental methods
which can be used to investigate various aspects of atomic dynamics. Because of the difficulties in producing the sufficient density of absorbing species the studies have mainly been carried out in rare gases and easily evaporable alkali and alkaline earth metals. A comprehensive review of the photoionization of rare gases by
synchrotron radiation has been provided recently by Schmidt (1992). The XUV photoabsorption spectroscopy of metal atoms has been reviewed in detail by Sonntag and Zimmermann (1992).
charge and mass resolved energy distributionangular distribution spin polarization electron-electron coincidence
electron-Ion coincidence spectroscopy
Figure 1.1Representation of the processes which provide information about various aspects of atomic
dynamics following the interaction between VUV radiation and free atomic spccies (from
Richter 1993).
The photoabsorption in ions has been mainly studied using the resonant laser driven ionization (RLDI) and the dual laser-produced plasma (DLPP) methods. The recent experimental developments in resonant laser-driven ionization
and dual laser plasma setups have been reviewed by Costello et al. (1991a). For the measurements of absolute photoionization cross sections the technique of merged photon-ion beam (Lyon etal. 1986) has been developed. More recently the
first observation of the photoelectron spectra emitted in the photoionization of a singly charged beam with undulator radiation has been successfully achieved (Bizau etal. 1991). The various developments in the photoionization studies of ions have been described in a number of review articles by Wuilleumier (1992),
Wuilleumier et al. (1991 and 1994) and Bizau etal. (1993). For the sake of
completeness a brief introduction to the various experimental techniques developed for the photoabsorption, photoion and photoelectron spectroscopy will be given.
1.2.1 Photoion spectroscopy
During the last fifteen years photoion spectrometery has been extensively applied to neutral species (Sonntag and Zimmermann 1992). Using this technique
one can measure photoion yield spectra, resonance structures arising from inner- shell excitations and absolute photoionization cross sections. Its suitability for absolute photoionization ionic cross section measurements was demonstrated by
Lyon et al. (1986) in a photon-ion merged beam experiment. The species studied in these experiments since then are shown in table 1.1.
Table 1.1. A summary of the photoionization studies in ground state ions carried out in photon-ion merged beam experiments.
Species Regions References
Ba+ 5p Lyon etal. (1986)
Si+ 4p Lyon etal. (1987a)
Ca+ 3p Lyon etal. (1987b)
Ga+ 3d Peart etal. (1987)
Zn+ 3d Peart etal. (1987)
K+ 3s Peart and Lyon (1987)
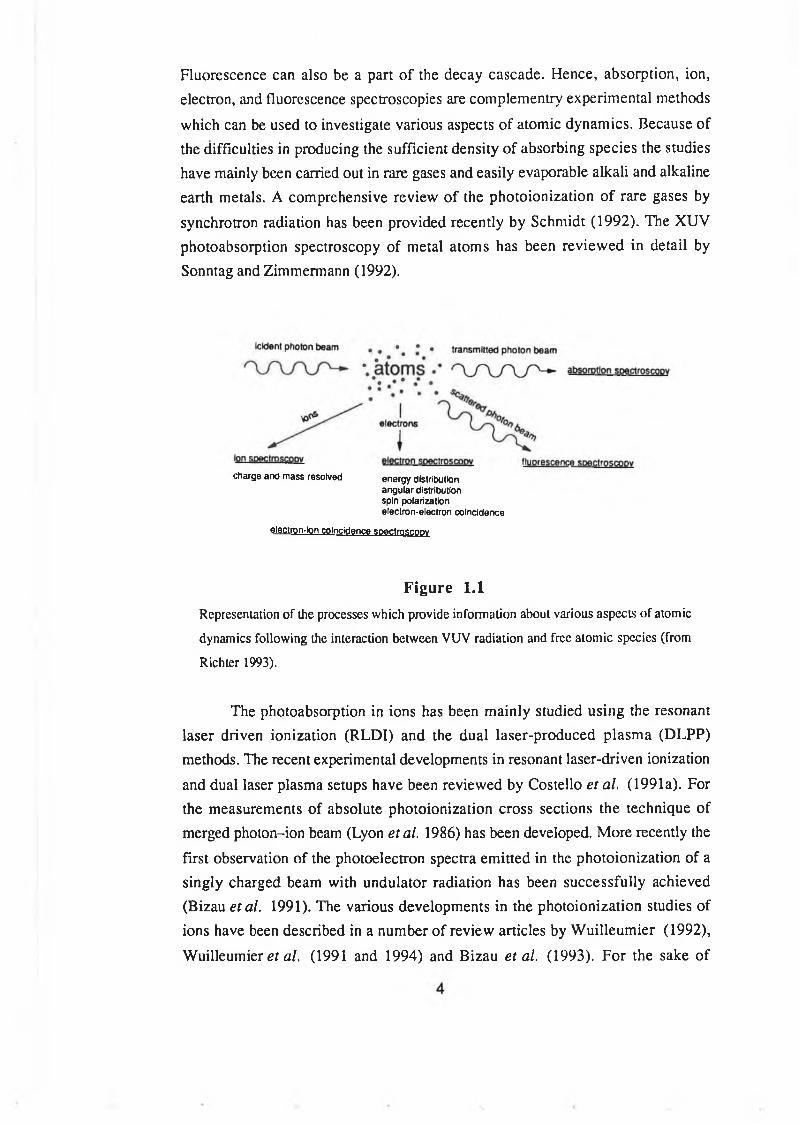
The apparatus used in the first successful photon-ion merged beam
experiment involving synchrotron radiation is shown in figure 1.2. A 0.1 pA 2 keV
singly-charged ion beam, produced in the surface ionization source S, is deflected
5
by the magnet Mj into the interaction region (I) after focussing through the differential pumping region (DP). The monochromatized synchrotron radiation
beam from a McPherson monochromator interacts with the ion beam along a path
of about 12 cm length, photoionizing some of the ions (A+) into doubly charged
ions (A2+), after separation by the second magnet M2.
Figure 1.2Schematic of the experimental set up for photoion spectrometry at Daresbury (from Lyon
e ta l . 1986).
1.2.2 Photoelectron spectroscopy
Photoion spectrometry (Lyon etal. 1986, 1987a, 1987b, Peart and Lyon
1987, Peart etal. 1987) allows the measurement of absolute photoionization cross sections in merged photon-ion-beam experiments; however, when several channels are open into the continuum, only photoelectron spectrometry provides the detailed insight into the photoionization process by providing partial photoionization cross
sections and measurement of branching ratios for the various subshells of a multielectron atom (Wuilleumier and Crause 1974, Wuilleumier 1989).
Very recently, the experimental setup shown in figure 1.3 has been
developed by Bizau etal. (1991) for the photoelectron studies of ions. Here, a
plasma discharge ion source delivers singly charged A+ ion beams of about 20-30
fiA at 10 to 20 keV kinetic energy. After magnetic and electrostatic deflections, the
6
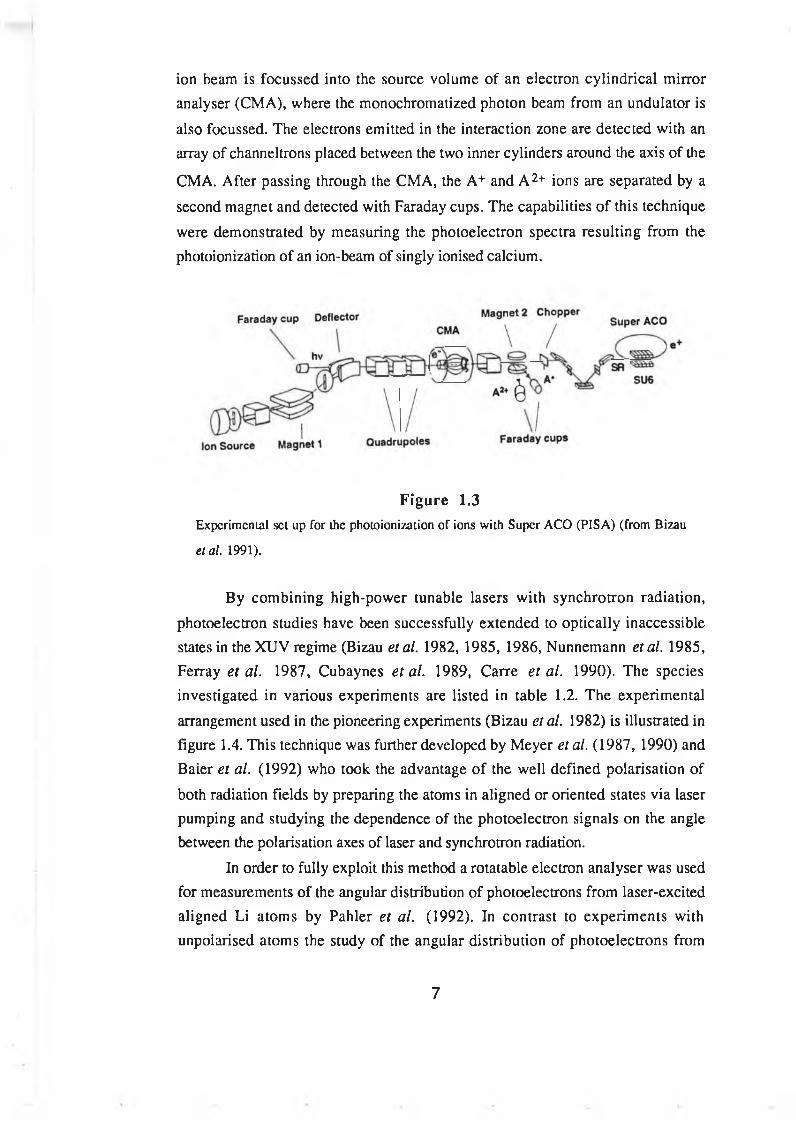
ion beam is focussed into the source volume of an electron cylindrical mirror analyser (CMA), where the monochromatized photon beam from an undulator is
also focussed. The electrons emitted in the interaction zone are detected with an array of channeltrons placed between the two inner cylinders around the axis of the
CMA. After passing through the CMA, the A+ and A 2+ ions are separated by a
second magnet and detected with Faraday cups. The capabilities of this technique
were demonstrated by measuring the photoelectron spectra resulting from the photoionization of an ion-beam of singly ionised calcium.
Figure 1.3Experimental set up for the photoionization of ions with Super ACO (PISA) (from Bizau
et al. 1991).
By combining high-power tunable lasers with synchrotron radiation,
photoelectron studies have been successfully extended to optically inaccessible states in theXUV regime (Bizau etal. 1982, 1985, 1986, Nunnemann etal. 1985, Ferray et al. 1987, Cubaynes eta l. 1989, Carre e ta l. 1990). The species investigated in various experiments are listed in table 1.2. The experimental
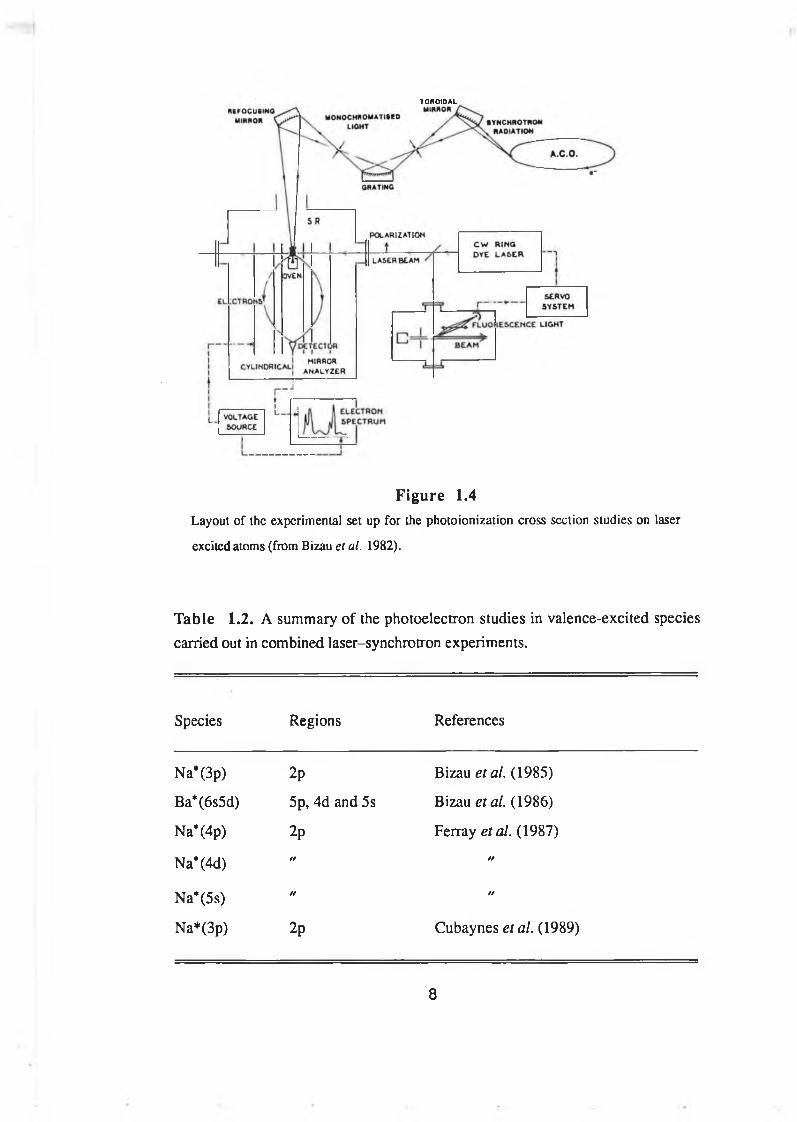
arrangement used in the pioneering experiments (Bizau etal. 1982) is illustrated in figure 1.4. This technique was further developed by Meyer etal. (1987, 1990) and Baier et al. (1992) who took the advantage of the well defined polarisation of
both radiation fields by preparing the atoms in aligned or oriented states via laser pumping and studying the dependence of the photoelectron signals on the angle between the polarisation axes of laser and synchrotron radiation.
In order to fully exploit this method a rotatable electron analyser was used for measurements of the angular distribution of photoelectrons from laser-excited aligned Li atoms by Pahler et al. (1992). In contrast to experiments with unpoiarised atoms the study of the angular distribution of photoelectrons from
7
T O RO ID A L
Figure 1.4Layout of the experimental set up for the photoionization cross section studies on laser
excited atoms (from Bizau el al. 1982).
Table 1.2. A summary of the photoelectron studies in valence-excited species carried out in combined laser-synchrotron experiments.
Species Regions References
Na*(3p) 2p Bizau etal. (1985)
Ba*(6s5d) 5p, 4d and 5s Bizau etal. (1986)
Na*(4p) 2p Ferray etal. (1987)
Na*(4d) 99 99
Na*(5s) 99 99
Na*(3p) 2p Cubaynes etal. (1989)
8
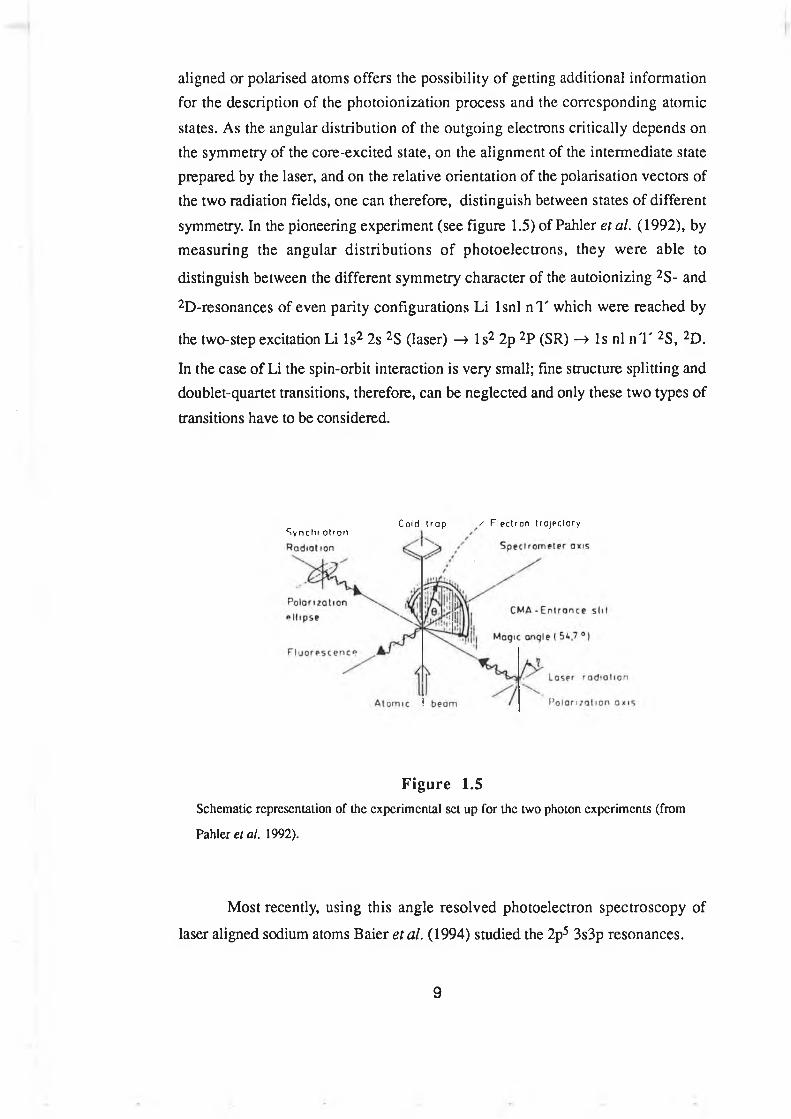
aligned or polarised atoms offers the possibility of getting additional information for the description of the photoionization process and the corresponding atomic
states. As the angular distribution of the outgoing electrons critically depends on the symmetry of the core-excited state, on the alignment of the intermediate state prepared by the laser, and on the relative orientation of the polarisation vectors of the two radiation fields, one can therefore, distinguish between states of different
symmetry. In the pioneering experiment (see figure 1.5) of Pahler et al. (1992), by measuring the angular distributions of photoelectrons, they were able to
distinguish between the different symmetry character of the autoionizing 2S- and
2D-resonances of even parity configurations Li lsnl n V which were reached by
the two-step excitation Li Is2 2s 2S (laser) —> Is2 2p 2P (SR) —» Is nl nV 2S, 2D.
In the case of Li the spin-orbit interaction is very small; fine structure splitting and doublet-quartet transitions, therefore, can be neglected and only these two types of
transitions have to be considered.
Figure 1.5Schematic representation of the experimental set up for the two photon experiments (from
Pahler el al. 1992).
Most recently, using this angle resolved photoelectron spectroscopy of
laser aligned sodium atoms Baier etal. (1994) studied the 2p5 3s3p resonances.
S y n c h r o l r o nCold t r ap ' Elect ron t rajectory
9
1.2.3 Photoabsorption spectroscopy
Photoabsorption measurements made on the radiation transmitted through the absorbing species can provide (i) total relative or absolute absorption cross sections, and (ii) energy level data of the resonance structures.
Progress in the field of VUV and XUV photoabsorption studies of ionic and some neutral species, other than gases and easily evaporable metallic atoms, has been hampered for many years by the lack of “small-scale” continuum sources to act as alternatives to synchrotron facilities. In addition the lack of suitable
techniques for the generation of the absorbing species was a major barrier.Esteva and Mehlman (1974) demonstrated such an experiment in which
ionic absorption was measured using two synchronised electrode vacuum sparks
(Mehlman-Ballofet and Esteva 1969, Esteva et al. 1972). One spark served as a transient source of absorbing species and the other one, termed a BRV source (Ballofet, Romand and Vodar 1961), was used to provide the background
continuum. Using this technique, time-resolved photoabsorption spectra were
measured for Mg, Mg+ and Mg2+ (Esteva and Mehlman 1974) and for Be2+ and
Be3+ (Mehlman and Esteva 1973). This technique has not been extended to other
ions.
The technique of flash-pyrolysis has been used in the photoabsorption
studies of ionic Ba+ (Roig 1976), Li+ (Cantu et al. 1977) and neutral aluminium
(Cantu et al. 1982). In this technique the absorbing metal is introduced in a quartz
or glass tube which is surrounded by a helical flash lamp. The material in the tube is vaporised and ionised by the strong luminous flux emitted by the flash lamp. A BRV source synchronised with the flash lamp was used to provide background continuum.
This technique was only applicable to easily evaporable materials and, at most, to singly ionised species. The other drawbacks of this set up were associated with the BRV spark which has a limited repetition rate, electrode life time and
operates under high vacuum environment. It provided a relatively linefree continuum but was limited to between 100-600 A and also the pulse duration was relatively long (~ 60 n s ) .
The techniques of synchronised dual vacuum spark and flash-pyrolysis were successfully employed in the time-resolved photoabsorption studies of atoms and ions but were restricted to ground state absorption studies only. Using these techniques it was not possible to selectively populate the absorbing species in
10
excited states.
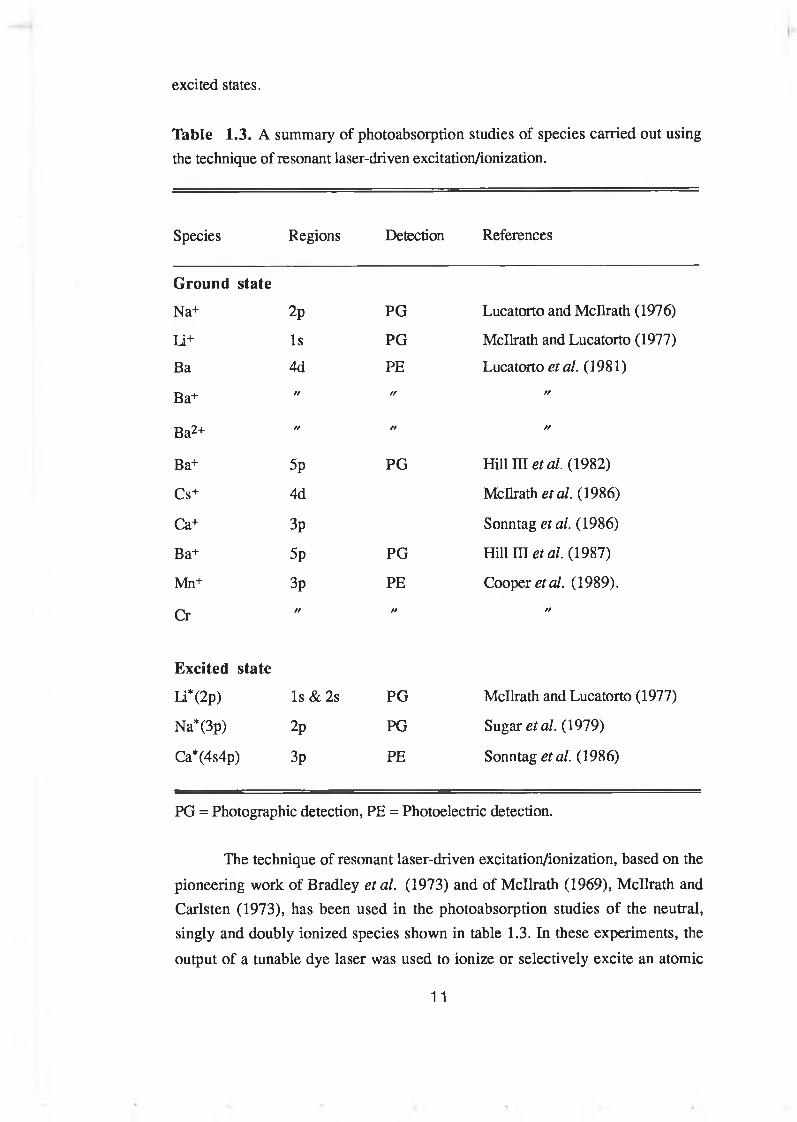
Table 1.3. A summary of photoabsorption studies of species carried out using the technique of resonant laser-driven excitation/ionization.
Species Regions Detection References
Ground state
Na+ 2p PG Lucatorto and Mcllrath (1976)
Ii+ Is PG Mcllrath and Lucatorto (1977)
Ba 4d PE Lucatorto etal. (1981)
Ba+ // n //
Ba2+ // // //
Ba+ 5p PG Hill in et al. (1982)
Cs+ 4d Mcllrath etal. (1986)
Ca+ 3p Sonntag etal. (1986)
Ba+ 5p PG Hill HI et al. (1987)
Mn+ 3p PE Cooper et al. (1989).
Cr // // //
Excited state
Ii*(2p) Is & 2s PG Mcllrath and Lucatorto (1977)
Na*(3p) 2p PG Sugar etal. (1979)
Ca*(4s4p) 3p PE Sonntag etal. (1986)
PG = Photographic detection, PE = Photoelectric detection.
The technique of resonant laser-driven excitation/ionization, based on the
pioneering work of Bradley etal. (1973) and of Mcllrath (1969), Mcllrath and Carlsten (1973), has been used in the photoabsorption studies of the neutral, singly and doubly ionized species shown in table 1.3. In these experiments, the
output of a tunable dye laser was used to ionize or selectively excite an atomic
11
vapour column produced in a heat pipe. To produce doubly charged species two time-synchronized tunable lasers were employed Lucatorto et al. (1981). One was
used to convert atomic vapour in a heat pipe to a singly ionized plasma and the second to ionize it into a doubly ionized plasma. To do photoabsorption measurements a time-synchronized BRV spark or laser plasma was used as the source of background continuum.
The application of this technique, requires sufficiently high vapour densities, therefore, it is mostly suitable for easily evaporable atomic systems. Because of the lack of laser technology at shorter wavelengths this technique does
not allow an extension to absorption measurements for the higher members of isoelectronic sequences although it does have the potential for selective excitation and ionization.
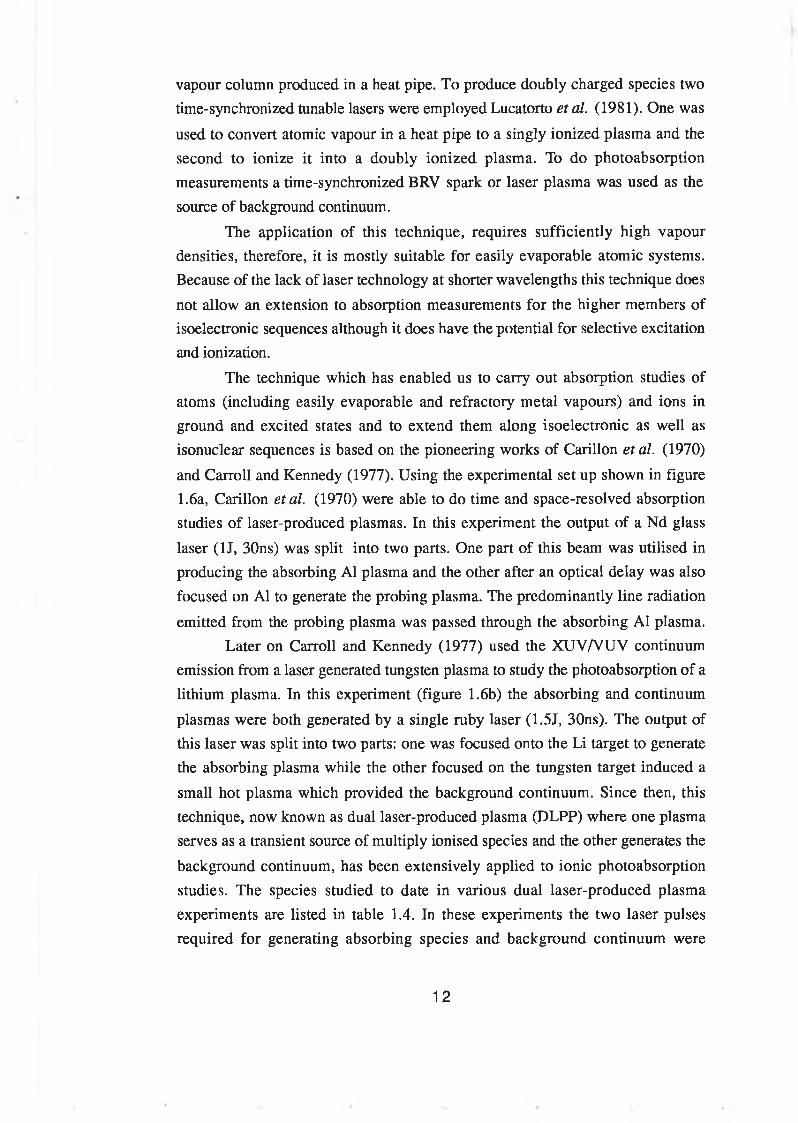
The technique which has enabled us to carry out absorption studies of atoms (including easily evaporable and refractory metal vapours) and ions in ground and excited states and to extend them along isoelectronic as well as isonuclear sequences is based on the pioneering works of Carillon etal. (1970)
and Carroll and Kennedy (1977). Using the experimental set up shown in figure 1.6a, Carillon etal. (1970) were able to do time and space-resolved absorption studies of laser-produced plasmas. In this experiment the output of a Nd glass
laser (1J, 30ns) was split into two parts. One part of this beam was utilised in producing the absorbing Al plasma and the other after an optical delay was also focused on Al to generate the probing plasma. The predominantly line radiation
emitted from the probing plasma was passed through the absorbing Al plasma.Later on Carroll and Kennedy (1977) used the XUV/VUV continuum
emission from a laser generated tungsten plasma to study the photoabsorption of a lithium plasma. In this experiment (figure 1.6b) the absorbing and continuum
plasmas were both generated by a single ruby laser (1.5J, 30ns). The output of this laser was split into two parts: one was focused onto the Li target to generate the absorbing plasma while the other focused on the tungsten target induced a
small hot plasma which provided the background continuum. Since then, this technique, now known as dual laser-produced plasma (DLPP) where one plasma serves as a transient source of multiply ionised species and the other generates the
background continuum, has been extensively applied to ionic photoabsorption studies. The species studied to date in various dual laser-produced plasma experiments are listed in table 1.4. In these experiments the two laser pulses required for generating absorbing species and background continuum were
12
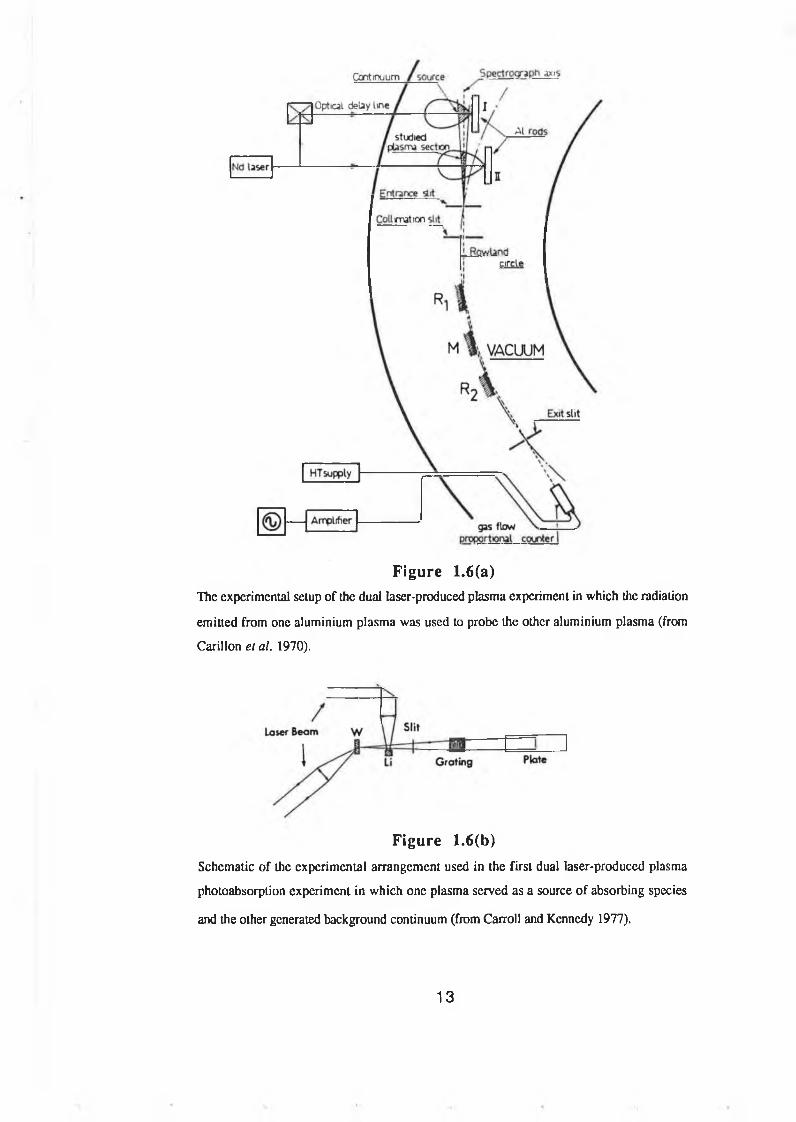
Figure 1.6(a)The experimental setup of the dual laser-produced plasma experiment in which the radiation
emitted from one aluminium plasma was used to probe the other aluminium plasma (from
Carillon el al. 1970).
Figure 1.6(b)Schematic of the experimental arrangement used in the first dual laser-produced plasma
photoabsorption experiment in which one plasma served as a source of absorbing species
and the other generated background continuum (from Carroll and Kennedy 1977).
13
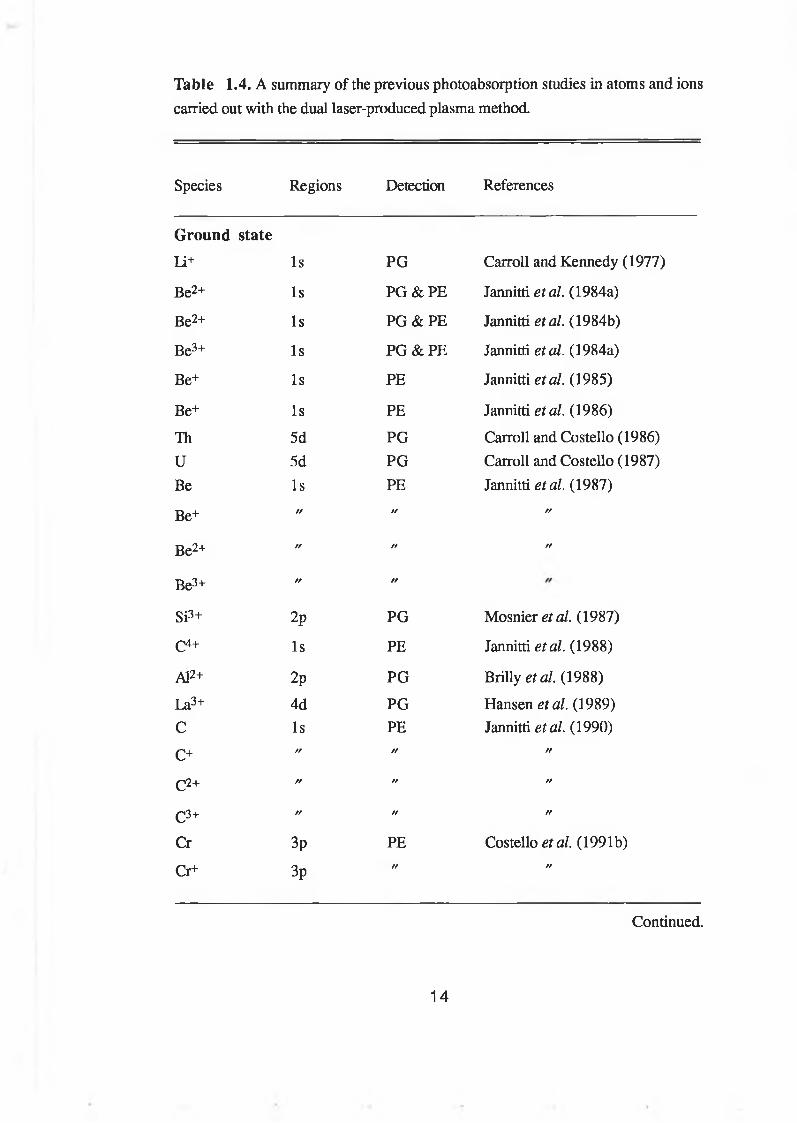
Table 1.4. A summary of the previous photoabsorption studies in atoms and ions carried out with the dual laser-produced plasma method.
Species Regions Detection References
Ground state
Ii+ Is PG Carroll and Kennedy (1977)
Be2+ Is P G & P E Jannitti etal. (1984a)
Be2+ Is PG & PE Jannitti etal. (1984b)
Be3+ Is P G & P E Jannitti etal. (1984a)
Be+ Is PE Jannitti etal. (1985)
Be+ Is PE Jannitti etal. (1986)
Th 5d PG Carroll and Costello (1986)U 5d PG Carroll and Costello (1987)Be Is PE Jannitti etal. (1987)
Be+ n t f //
Be2+ / / / / n
Be3+ t r / /
Si3+ 2p PG Mosnier et al. (1987)
c4+ Is PE Jannitti etal. (1988)
Al2+ 2p PG Brilly e ta l (1988)
La3+ 4d PG Hansen etal. (1989)C Is PE Jannitti etal. (1990)
C+ / / / / / /
C2+ / / / / / /
C3+ / / t r //
Cr 3p PE Costello etal. (1991b)
Cr+ 3p / / //
Continued.
14
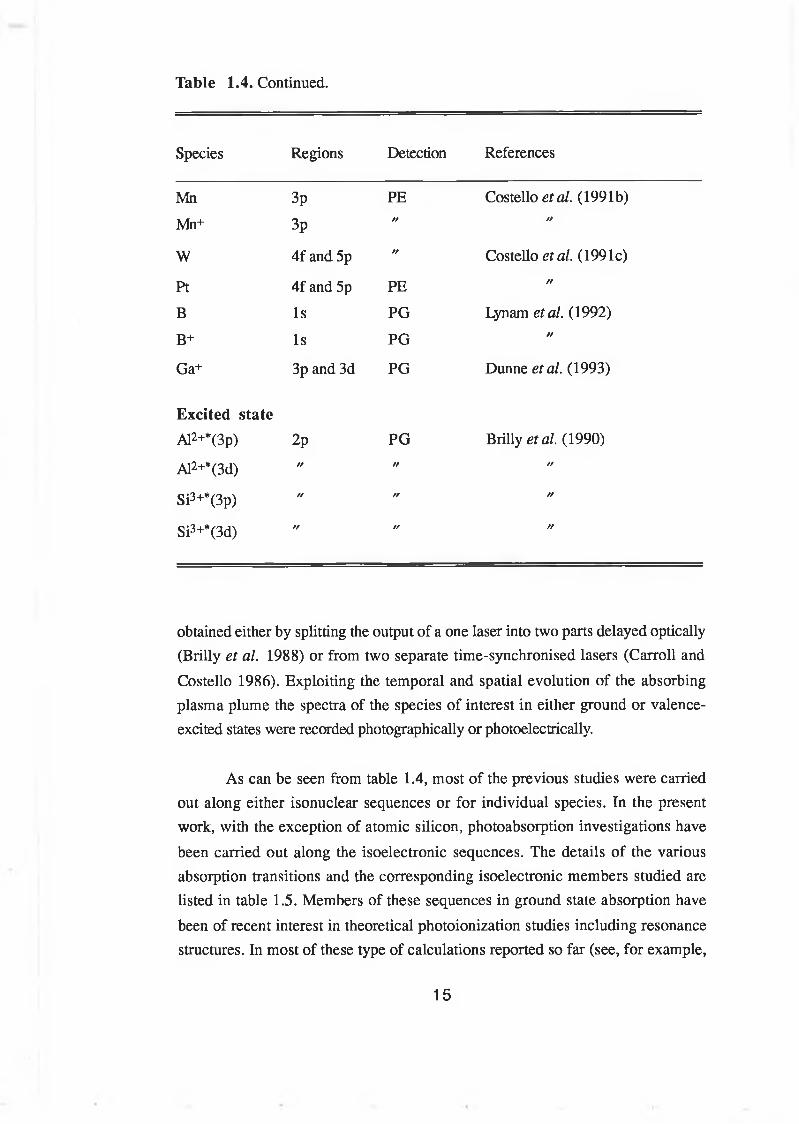
Table 1.4. Continued.
Species Regions Detection References
Mn 3p PE Costello et al. (1991b)
Mn+ 3p// //
W 4f and 5p // Costello et al. (1991c)
Pt 4f and 5p PE //
B Is PG Lynam et al. (1992)
B+ Is PG //
Ga+ 3p and 3d PG Dunne et al. (1993)
Excited state
Al2+*(3p) 2p PG Brilly et al. (1990)
Al2+*(3d) f f // /r
Si3+*(3p) // // //
Si3+*(3d) f f // ✓/
obtained either by splitting the output of a one laser into two parts delayed optically (Brilly et al. 1988) or from two separate time-synchronised lasers (Carroll and
Costello 1986). Exploiting the temporal and spatial evolution of the absorbing plasma plume the spectra of the species of interest in either ground or valence- excited states were recorded photographically or photoelectrically.
As can be seen from table 1.4, most of the previous studies were carried out along either isonuclear sequences or for individual species. In the present work, with the exception of atomic silicon, photoabsorption investigations have
been carried out along the isoelectronic sequences. The details of the various absorption transitions and the corresponding isoelectronic members studied are listed in table 1.5. Members of these sequences in ground state absorption have
been of recent interest in theoretical photoionization studies including resonance structures. In most of these type of calculations reported so far (see, for example,
15
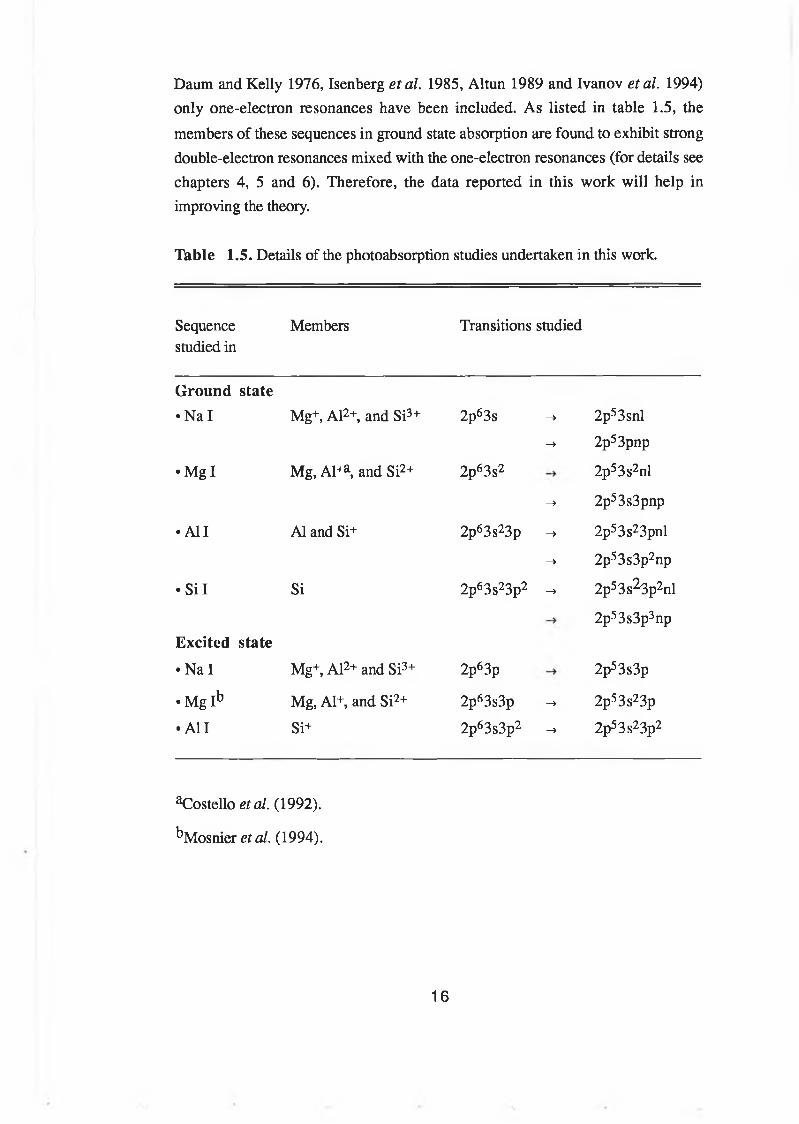
Daum and Kelly 1976, Isenberg etal. 1985, Altun 1989 and Ivanov etal. 1994) only one-electron resonances have been included. As listed in table 1.5, the
members of these sequences in ground state absorption are found to exhibit strong double-electron resonances mixed with the one-electron resonances (for details see chapters 4, 5 and 6). Therefore, the data reported in this work will help in improving the theory.
Table 1.5. Details of the photoabsorption studies undertaken in this work.
Sequence studied in
Members Transitions studied
G round state
• Na I Mg+, Al2+, and Si3+ 2p63s —» 2p53snl
-> 2p53pnp
• Mg I Mg, Al+a, and Si2+ 2p63s2 2p53s2nl
—» 2p53s3pnp
•A ll A1 and Si+ 2p63s23p —> 2p53s23pnl
—» 2p53s3p2np
• Si I Si 2p63s23p2 —» 2p53s^3p2nl
2p53s3p3npExcited state
• N a l Mg+, Al2+ and Si3+ 2p63p 2p53s3p
•M g Ib Mg, Al+, and Si2+ 2p63s3p —> 2p53s23p
• A ll Si+ 2p63s3p2 —> 2p53s23p2
Costello etal. (1992).
^Mosnier et al. (1994).
1 6

1.3 Conclusions
As can be seen from section 1.2, photoabsorption and photoionization has been studied only in few ions. Although various experimental setups have been developed, some are facing technical limitations and the remainder are passing
through their testing phase. At present, only the dual laser-produced plasma technique can be applied to a wide variety of species. Although it is suitable mostly for the measurements of relative ionic cross-sections even then it can provide a testing ground for theory. The inner-shell photoabsorption technique provides
measurements of descrete and continuum structures which can be compared with those predicted by theory. To date although a few calculations including resonance structures have been carried out this trend is expected to increase in the near future. It is hoped that the photoabsorption data reported in this thesis will play an important role in stimulating further theoretical studies.
17
1.4 References
Altun Zikri, 1989, Phys. Rev. A 40, 4968.
Baier S, Fiedler W, Muller B R, Schulze M, Zimmermann P, Meyer M, Pahler M,
Prescher T, Richter M, Ruder J and Sonntag B, 1992, J. Phys. B: At. Mol. Opt. Phys. 25, 923.
Baier S, Schulze M, Staiger H, Zimmermann P, Lorenz C, Pahler P, Ruder J, Sonntag B, Costello J T and Kieman L, 1994, J. Phys. B: At. Mol. Opt. Phys. 27, 1341.
Ballofet G, Romand J and Vodar B, 1961, C.R. Acad.Sci., 252, 4139.
Bizau J M, Wuilleumier F, Dhez P, Ederer D L, Picque J L, Gouet G L and Koch
P, 1982, in "Laser Techniques for Extreme Ultraviolet spectroscopy”, eds. T J Mcllrath and R J Freeman, AIP Conf. Proc. No. 90 (New York: American Institute of Physics) p. 331.
Bizau J M, Wuilleumier F, Ederer D L, Keller J C, LeGouet J L, Picque J L, Carre B and Koch P M, 1985, Phys. Rev. Lett. 5 5, 1281.
Bizau J M, Cubaynes D, Gerard P, Wuilleumier F J, Picque J L, Ederer D L, Carre B andWendin G, 1986, Phys. Rev. Lett. 57, 306.
Bizau J M, Cubayne D, Richter M, Wuilleumier F J, Obert J, Putaux J-C, Morgan T J, Kallne E, Sorensen S andDamany A, 1991, Phys. Rev. Lett., 67, 576.
Bizau J M, Cubayne D and Wuilleumier F J, 1993, in “Vacuum Ultraviolet Radiation Physics” , eds. Wuilleumier F J, Petroff Y and Nenner I, Proceedings of the 10th VUV conference (Singapore: World Scientific Publishing Co. Pte. Ltd.)
Bradley D J, Ewart P, Nicolas J V, Shaw J R D and Thompson D G, 1973, Phys. Rev. Lett., 31, 263.
1 8
Brilly J, Kennedy E T and Mosnier J P, 1990, Physica Scripta, 41, 30.
Cantu A M, Parkinson W H, Tondello G and Tozzi G P, 1977, J. Opt. Soc. Am., 67, 1030.
Cantu A M, Tozzi G P and Spector N, 1982, J. Opt. Soc. Am., 7 2, 729.
Carillon A, Jaegle P and Dhez P, 1970, Phys. Rev. Lett., 2 5, 140.
Carre B, Oliveira P D, Ferray M, Fournier P, Gounand F, Cubaynes D, Bizau J M
and Wuilleumier F J, 1990, Z. Phys. D15, 177.
Carroll P K and Kennedy E T, 1977, Phys. Rev. Lett., 38, 1068.
Carroll P K and Costello J T, 1986, Phys. Rev. Lett. 5 7, 1581.
Cooper J W, Clark C W, Cromer C L, Lucatorto T B, Sonntag B F, Kennedy E T
and Costello J T, 1989, Phys. Rev. A 3 9, 6074.
Costello J T, Mosnier J P, Kennedy E T, Carroll P K and O ’Sullivan G, 1991a,
“XUV Absorption Spectroscopy with Laser-Produced Plasmas; A Review” Physica Scripta (Proceedings of 22nd EGAS Conference), T34, 77.
Costello J T, Kennedy E T, Sonntag B F and Clarke C W, 1991b, Phys. Rev. A
43, 1441.
Costello J T, Kennedy E T, Sonntag B F and Clarke C W, 1991c, Phys. Rev. A
43, 1441.
Costello J T, Evans D, Hopkins R B, Kennedy E T, Kieman L, Mansfield M W
D, Mosnier J P, Sayyad M H and Sonntag B F, 1992, J. Phys. B: At. Mol. Opt. Phys. 25, 5055.
Cromer CL, Bridges T M, Robert T R and Lucatorto T B, 1985, Appl. Opt., 24,
2996.
Brilly J, Kennedy E T and Mosnier J P, 1988, J. Phys. B, 21, 368.
Cubaynes D, Bizau J M, Wuilleumier F J, Carre B and Gounand F, 1989, Phys. Rev. Lett. 6 3, 2460.
Daum R G and Kelly H P, 1976, Phys. Rev. A 13, 715.
Deshmukh P C, Nasreen G and Manson S T, 1988, Phys. Rev. A 38, 504.
Dunne P, O ’Sullivan G and Ivanov V K, 1993, Phys. Rev. A 4 8,
Esteva J M, Mehlman-Ballofet G and Romand J, 1972, J. Quant. Spectrosc. Radiat. Transfer., 12, 291.
Esteva J M and Mehlman G, 1974, Astrophys. J., 193, 747.
Ferray, Gounand F, Oliveira P D, Fourier P R, Cubayne D, Bizau J M, Morgan T J and Wuilleumier F J, 1987, Phys. Rev. Lett. 5 9, 2040.
Hansen J E, Brilly J, Kennedy E T and O ’Sullivan G, 1989, Phys. Rev. Lett., 63, 1934.
Hill W T III, Cheng K T, Johnson W R, Lucatorto T B, Mcllrath T J and Sugar J, 1982, Phys. Rev. A 4 9, 1631.
Hill W T III, Sugar J, Lucatorto T B and Cheng K T, 1987, Phys. Rev. A 36, 1200.
Hopkins R B, 1992, M.Sc. thesis, Dublin City University, unpublished.
Isenberg E M, Carter S L, Kelly H P and Salomoson S, 1985, Phys. Rev. A 32,
1472.
Ivanov V K, West J B, Gribakin G F and Gribakina A A, 1994, Z. Phys. D 2 9,
109.
Jannitti E, Nicolosi P and Tondello G, 1979, Optics Letters, 4, 187.
Jannitti E, Nicolosi P and Tondello G, 1984a , Physica 124C, 139.
20
Jannitti E, Nicolosi P and Tondello G, 1984b , Opt. Commun. 5 0, 225.
Jannitti E, Mazzoni M, Nicolosi P, Tondello G and Yongchang W, 1985, J. Opt. Soc. Am. 2, 1078.Jannitti E, Pinzong F and Tondello G, 1986, Physica Scripta, 3 3, 434.
Jannitti E, Nicolosi P and Tondello G, 1987, Physica Scripta, 3 6, 93.
Jannitti E, Nicolosi P and Tondello G, 1988, Phys. Lett. A, 131, 186.
Jannitti E, Nicolosi P and Tondello G, 1990, Physica Scripta, 41, 458.
Kennedy E T and Carroll P K, 1977, Phys. Lett., 6 4 A, 37.
Kiernan L, 1994a, Ph.D. thesis, Dublin City University, unpublished.
Kiernan L M, Kennedy E T, Mosnier J-P, Costello J T and Sonntag B F, 1994b, Phys. Rev. Lett. 7 2, 2359.
Lahiri J and Manson S T, 1988, Phys. Rev. A 3 7, 1047.
Lucatorto T B and Mcllrath T J, 1976, Phys. Rev. Lett., 3 7, 428.
Lucatorto T B, Mcllrath T J, Sugar J and Younger S M, 1981, Phys. Rev. Lett., 47, 1124.
Lucatorto T B, Mcllrath T J, Hill W T and Clark C W, 1982, AIP Conf. Proc. 94 , 584.
Lynam W G, Carroll P K, Costello J T, Evans D and O ’Sullivan G, 1992, J. Phys. B. 2 5, 3963.
Lyon I C, Peart B, West J B and Dolder K, 1986, J. Phys. B. 19, 4137.
Lyon I C, Peart B and Dolder K, 1987a, J. Phys. B 2 0, 1925.
Lyon I C, PeartB, Dolder K and West J B, 1987b, J. Phys. B, 20, 1471.
Mcllrath T J, 1969, Appl. Phys. Lett., 15, 41.
Mcllrath T J and Carlsten JL , 1973, J. Phys. B: Atom. Molec. Phys., 6, 697.
Mcllrath T J and Lucatorto T B, 1977, Phys. Rev. Lett., 3 8, 1390.
Mcllrath T J, Sugar J, Kaufman V, Cooper W and Hill W T III, 1986, J. Opt. Soc. Am. B 3, 398.
Mehlman-Balofet G and Esteva J M, 1969, Astrophys. J., 157, 945.
Mehlman G and Esteva J M, 1973, C.R. Acad. Sci., 276, 1973.
Meyer M, Muller B, Nunnemann A, Prescher Th, v Raven E, Richter M, Schmidt M and Zimmermann P, 1987, Phys. rev. Lett. 5 9, 2963.
Meyer M, Pahler M, Prescher T, v Raven E, Richter M, Sonntag B, Baier S, Fiedler W, Muller B R, Schulze M and Zimmermann P, 1990, Physica Scripta T31, 28.
Missavage D W, Manson S T, and Daum G R, 1977, Phys. Rev. A 15, 1001.
Mosnier J P, Brilly J and Kennedy E T, 1987, J. Physique, 48, C9-219.
Mosnier J P, Costello J T, Kennedy E T, Kieman L and Sayyad M H, 1994, Phys. Rev. A 4 9, 755.
Nasreen G, Manson S T and Deshmukh P C, 1989, Phys. Rev. A 40, 6091.
Nicolosi P, Jannitti E and Tondello G, 1991, J. Physique II, 1, Cl-89.
Nunnemann A, Prescher T, Richter M, Schmidt M, Sonntag B, Wetzel H E and
Zimmermann P, 1985, J. Phys. B 18, L387.
Pahler M, Lorenz C, v Raven E, Sonntag B, Baier S, Muller B R, Schulze M, Staiger H, Zimmermann P and Kabachnik N M, 1992, Phys. Rev. Lett., 68,
2285.
22
Peart B and Lyon I C, 1987, J. Phys. B: Atom. Molec. Phys., 2 0, L673.
Peart B, Lyon I C, and Dolder K, 1987, J. Phys. B: Atom. Molec. Phys., 20, 5403.
Pejcev V, Ottley T W, Rassi D and Ross K J, 1977, J. Phys. B IO , 2389.
Richter M, 1993, in “ Vacuum Ultraviolet Radiation Physics” , eds. Wuilleumier F J, Petroff Y and Nenner I, Proceedings of the 10th VUV conference (Singapore:
World Scientific Publishing Co. Pte. Ltd.)Roig R A, 1976, J. Opt. Soc. Am., 66, 1400.
Schwob J L, Wouter A W and Suckewer S, 1987, Rev. Sei. Instrum., 5 8, 1601.
ScmidtV, 1992, Rep. Prog. Phys., 55, 1483.
Shaw M, 1994, M.Sc. thesis, un-finished work.
Sonntag B F, Cromer C L, Bridges J M, Mcllrath T J and Lucatorto T B, 1986,
“Short Wavelength Coherent Radiation: Generation and Applications.” (Monterey, California 1986), Proceedings of the Topical Meeting on Short Wavelength Coherent Radiation, AIP Conf. Proc. No 147 (New York: Am. Inst. Phys.) pp
412-21.
Sonntag B and Zimmermann P, 1992, Rep. Prog. Phys., 991.
Sugar J, Lucatorto T B, Mcllrath T J and Weiss A W, 1979, Opt. Lett., 4, 109.
Tondello G, 1979, Optica Acta, 26, 357.
Wuilleumier F J, 1989, Proc. of the LURE-ESRF Workshop on Photon-Ion Interactionq, eds. Wuilleumier F J and Kallne E, (ESRF: Grenoble) pp. 5 and
231.
Whitfield S B, Caldwell C D and Krause M 0 , 1991, Phys. Rev. A 4 3, 2338.
Wuilleumier F J and Krause M 0 , 1974, Phys. Rev. A 10, 242.
23

Wuilleumier F J, Cubaynes D and Bizau J M, “Atomic and Molecular Physics Third US-Mexico Symposium”, eds. C. Cisneros, I Alvarez and T J Morgan
(World Scientific Publishing Company: Singapore, 1991) p. 474.
Wuilleumier F J, 1992, "Proceedings o f Sixth Symposium on Correlations and Polarization in Electronic and Atomic Collisions and (e, 2e) Reactions”, (Bristol: UK: Institute of Physics) p. 203.
Wuilleumier F J, Bizau J M, Cubaynes D, Rouvellou B and Journel L, 1994,
Nuclear Instruments and Methods in Physics Research B 87, 190.
24
SUMMARY OF ATOMIC STRUCTURE THEORY
To facilitate the analysis of measured spectra extensive atomic structure calculations
have been performed with the help of a suite of atomic structure computer programs. Computed
transition energies and energy level compositions were needed as an aid to identification of the
observed spectral lines. To interpret line intensities, oscillator strengths were required. This
chapter provides an introduction to the theory of atomic structure and an outline of the programs.
2.1 Introduction
Using the Slater-Condon theory of atomic structure (Slater 1929, 1960; Condon and Shortley 1935) ab initio or scaled calculations (for explanation see section 2.7.2) can be made of atomic energy levels and spectra, either in the single configuration or including configuration-interaction effects. For this purpose there are required theoretical values of: (1) the total binding energy of the spherically-averaged atom in each configuration of interest (corresponding to the centre-of-gravity energy E,v of all possible states of the configuration); (2)
the electrostatic and spin-orbit radial integrals Fk, Gk, and in terms of which the energy splittings from EIV are expressible; (3) the more general
Slater integrals Rk, if configuration-interaction effects are to be included; and (4) the dipole matrix elements for the transitions in question, if gf-values are to be calculated.
All of these quantities are given by familiar expressions involving various integrals of the one-electron radial wavefunction which can be obtained from the solution of the Schrodinger wave equation. The treatment provided in the following sections follows closely that given in the famous book "The Theory of Atomic Structure and Spectra" by R. D. Cowan (Cowan 1981).
25
2.2 The Schrödinger equation for a multi-electronsystem
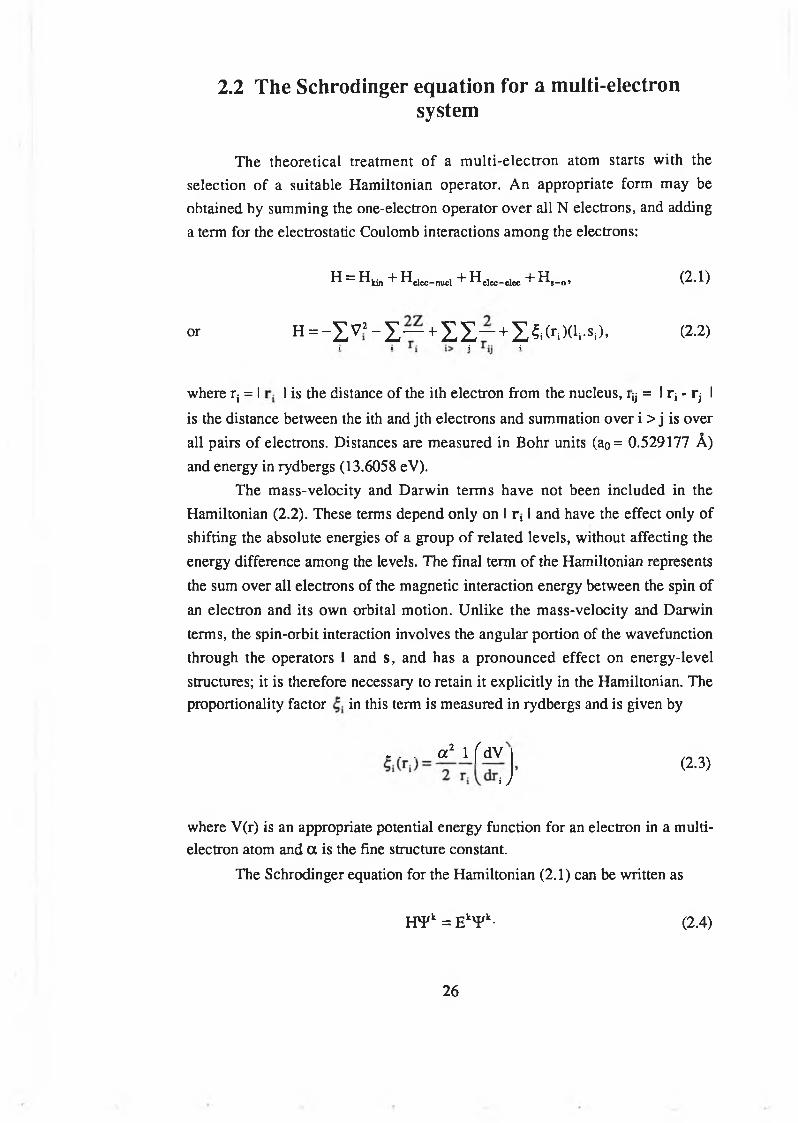
The theoretical treatment of a multi-electron atom starts with the selection of a suitable Hamiltonian operator. An appropriate form may be obtained by summing the one-electron operator over all N electrons, and adding a term for the electrostatic Coulomb interactions among the electrons:
H = Hy,, + Helec_nucl + H elec_dec + Hs_0, (2.1)
or h = - Y , V ’ - ' L — + Z £ - + E 6 < riX M ,), (2-2)1 1 i i
where r; = I I is the distance of the ith electron from the nucleus, ijj = I rj - rj I
is the distance between the ith and jth electrons and summation over i > j is over all pairs of electrons. Distances are measured in Bohr units (ao= 0.529177 A) and energy in rydbergs (13.6058 eV).
The mass-velocity and Darwin terms have not been included in the Hamiltonian (2.2). These terms depend only on I i*, I and have the effect only of shifting the absolute energies of a group of related levels, without affecting the energy difference among the levels. The final term of the Hamiltonian represents the sum over all electrons of the magnetic interaction energy between the spin of an electron and its own orbital motion. Unlike the mass-velocity and Darwin terms, the spin-orbit interaction involves the angular portion of the wavefunction through the operators 1 and s, and has a pronounced effect on energy-level structures; it is therefore necessary to retain it explicitly in the Hamiltonian. The proportionality factor in this term is measured in rydbergs and is given by
. . . a 2 1 f dV(2.3)
i y
where V(r) is an appropriate potential energy function for an electron in a multi- electron atom and a is the fine structure constant.
The Schrödinger equation for the Hamiltonian (2.1) can be written as
HvFk = E kvFk- (2.4)
26
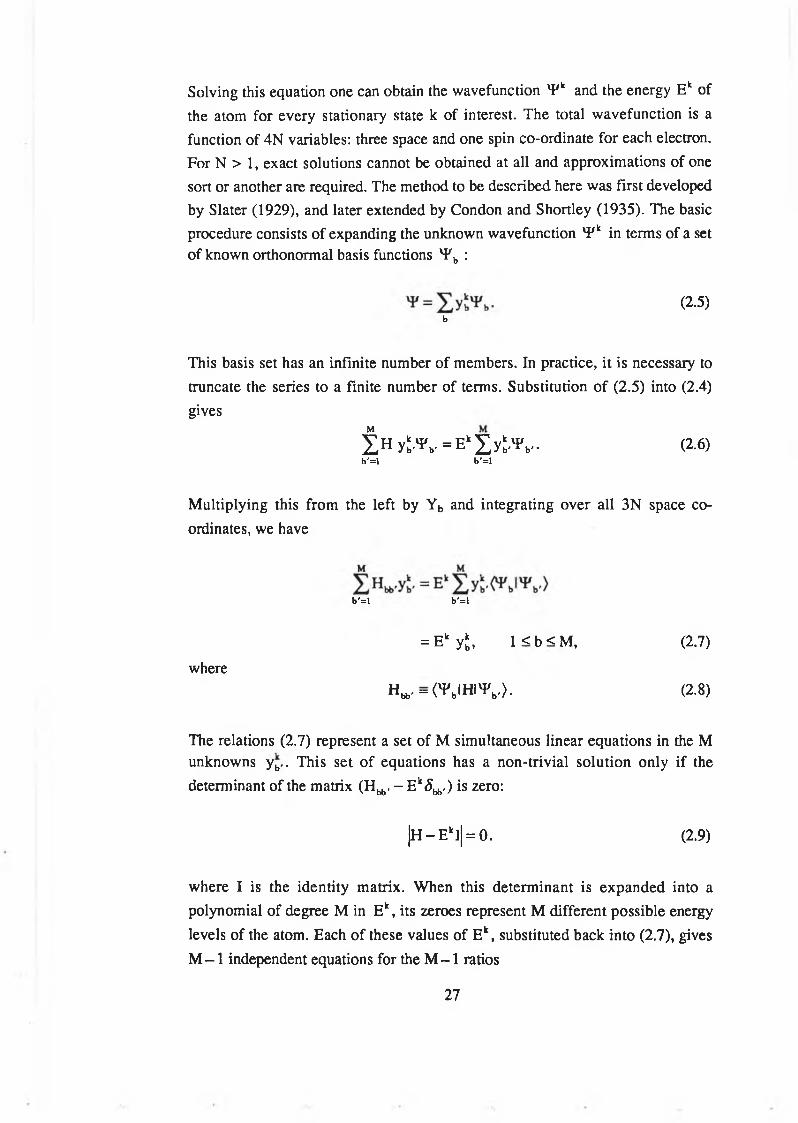
Solving this equation one can obtain the wavefunction 4/k and the energy Ek of the atom for every stationary state k of interest. The total wavefunction is a function of 4N variables: three space and one spin co-ordinate for each electron. For N > 1, exact solutions cannot be obtained at all and approximations of one sort or another are required. The method to be described here was first developed by Slater (1929), and later extended by Condon and Shortley (1935). The basic procedure consists of expanding the unknown wavefunction vF k in terms of a set of known orthonormal basis functions vi 'b :
<2 - 5 >b
This basis set has an infinite number of members. In practice, it is necessary to truncate the series to a finite number of terms. Substitution of (2.5) into (2.4) gives
¿ H y i . ¥ l. = E‘ £y5.>Pb.. (2.6)b '= l b '= l
Multiplying this from the left by Yb and integrating over all 3N space coordinates, we have
b '= l b '= l
= Ek ykb, 1 < b < M, (2.7)
whereHls,=(>PbIHI>Pb.>. (2.8)
The relations (2.7) represent a set of M simultaneous linear equations in the M unknowns yb,. This set of equations has a non-trivial solution only if the determinant of the matrix (Hy,, - E 1 , ) is zero:
|H - E kl| = 0. (2.9)
where I is the identity matrix. When this determinant is expanded into a polynomial of degree M in Ek, its zeroes represent M different possible energylevels of the atom. Each of these values of Ek, substituted back into (2.7), givesM - 1 independent equations for the M - 1 ratios
27
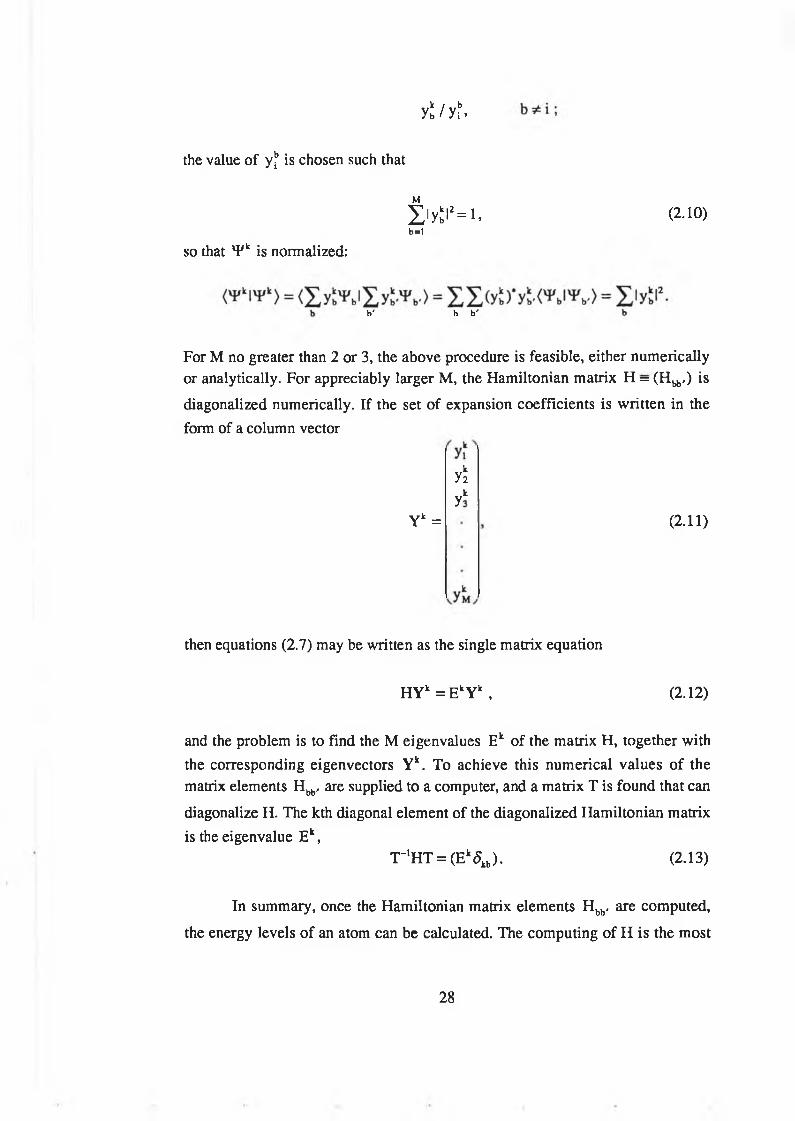
y£/yf.
i i y £ i J= i . (2.io)
the value of yj* is chosen such that
b=1
so that vFk is normalized:
b ' b b '
For M no greater than 2 or 3, the above procedure is feasible, either numerically or analytically. For appreciably larger M, the Hamiltonian matrix H = (Hy,,) is
diagonalized numerically. If the set of expansion coefficients is written in the form of a column vector
yk2y*
Yk = (2 .11)
then equations (2.7) may be written as the single matrix equation
HYk = EkYk , (2.12)
and the problem is to find the M eigenvalues Ek of the matrix H, together with the corresponding eigenvectors Yk. To achieve this numerical values of thematrix elements Hbb, are supplied to a computer, and a matrix T is found that can
diagonalize H. The kth diagonal element of the diagonalized Hamiltonian matrix is the eigenvalue Ek,
T-1HT = (Ek5kb). (2.13)
In summary, once the Hamiltonian matrix elements Hbb, are computed,
the energy levels of an atom can be calculated. The computing of H is the most
28
difficult task. It involves setting up suitable basis functions required to evaluate the matrix elements.
2.3 Choosing the basis functions
In a multi-electron atom any given electron i can be assumed to move independently of the others in the electrostatic field of the nucleus and the other N-l electrons (Independent particle model). This field is assumed to be time- averaged over the motion of the N-l electrons, and therefore to be spherical symmetric. In this central field, the probability distribution of electron i can be described by a one-electron wavefunction (also called spin-orbital):
where rj denotes position (r,0,0)w ith respect to the nucleus and also the spin
orientation s. This function differs from the hydrogenic one only in the radial part Pni. As the potential energy V(r) in a multi-electron atom is no longer a simple Coulomb function; exact analytical solution of the differential equation is therefore not possible. Numerical procedures are required for the calculation of Pni. The orthonormality of the spin-orbital yields
From the one-electron spin-orbitals one can construct the basis function for the entire atom. The probability that an electron lies at rj from the nucleus is I (ri )l2 so the probability distribution of all the N electrons is n ^ lp jir .) !2. This shows that for a multi-electron atom the basis function can be written as a product of spin-orbitals
(2.14)
or(2.15)
(2.16)
Y = ( p l(Tl)<p2(T2)(p3(T2) - ’<ps (Tii) . (2.17)
The drawback of this product function is that it does not obey the Pauli exclusion principle. However, this can be rectified by using a wavefunction that is antisymmetric upon interchange of any two electron co-ordinates. Such a
wavefunction can be formed by taking the following linear combination of
product functions:
'F = (N!)-,/2X ( - l ) P<P1(r1)<p2(r2)<p3(r3)-” 'PN(rN)- (2.18)
This antisymmetrized function may be written in the form of a determinant
VP =N!1/2
<pM <Pi(r2) <Pi(r3) • ■ <Pi(rN)<P2(t i) <P2(r2) <p2(r3) • ' <P2(rN)<p3(ri) <P3(r2) <P3(r3) * • <P3(r n)
<pM <PN(r2) <PN(r3) ' • PnO-n)
(2.19)
and is therefore referred to as a determinantal function or a Slater determinant (Slater 1929). The physical significance of this choice is clear from the well known properties of determinants. The interchanging of two columns in this determinant is equivalent to changing the co-ordinates of any two electrons. A determinant is zero if its two rows or columns are identical. Two orbitals having the same quantum numbers are reflected by two identical rows while the two electrons being in the same location are shown by two identical columns.
This determinantal form of a basis function Y exhibits almost all the required features for a basis vector. Although the basis functions can be chosen arbitrarily it is convenient to chose them to be as close as possible to the eigenfunctions of the Hamiltonian. Such a choice is important to have desired accuracy from ab initio calculations.
2.4 Matrix elements for determinantal basis functions
In the Hamiltonian operator given by
. r i i> j r ij(2.20)
the first three terms are one-electron operators of the form
30
i=l i(2.21)
symmetric in the spatial-plus-spin co-ordinates r* of all N electrons, and the last term is a two-electron operator of the form
i s U , * . <2-22>i=2 j=l i> j
symmetric in all N(N - l)/2 pairs of co-ordinates. For a determinantal basis function it can be shown that
O Fl£f.l'F> = £ < i l f ili>, (2.23)i i
('i' lX X 8 . l'I'> = E E [ < y |8lii>-< ijlglji>- (2.24)i> j i> j
In equation (2.24), the first terms on the right are the direct terms and they represent the energy due to mutual electrostatic repulsion for an uncorrelated spatial distribution of electrons. The second terms are the exchange terms and they represent the decrease in the repulsion energy that results when one includes the positional correlation of parallel-spin electrons.
2.5 One-electron and total atom binding energies
With the aid of the above results for determinantal basis functions, we can derive expressions for the centre-of-gravity energy of atomic states corresponding to an arbitrary electron configuration. It represents the energy of the spherically averaged atom, and is given by
E1V = (blHlb>tv, (2.25)
where the average is to be carried out over all basis functions b belonging to the configuration in question. The simple form of this average is when all basis functions are given equal weight:
31
y ( b I H I b )E = ----------^ ------- ---------- . (2.26)
number of basis functions
Since the trace of a matrix is invariant under all orthogonal transformations (2.13) which diagonalizes H, (2.26) may also be written in the form
E = -------^ ------------. (2.27)number of states
where the summation is over all eigen states k of the configuration, having corresponding eigen value Ek. Since each energy level has a (2J + l)-fold degeneracy, we may also write
£ ( 2 J + 1)Ej
E = . (2.28)*v X (2 J + D
levels
From this expression one may calculate an experimental value of Eav, using the observed energies of the levels belonging to the configuration in question. For example, for the configuration p2 having LS terms 3P, 'D and 'S,
E,v = ¿ [ E(3po) + 3E(3P, ) + 5E(3P2) + 5E(3D2) + E(’ S0)].
The value of the centre-of-gravity energy given by the above expression is significant only to the extent that configuration-interaction perturbations are small.
The theoretical expressions for Eav can be obtained by substituting (2.23) and (2.24) in (2.25):
9 7 9 9B„ = £ < i|- V!|i>.. + £ < il------li> .,+ X X [< ijl— !« > „-< « — (2.29)
i i r i i> j r i2 r i2
For the spin-orbit term the matrix elements cancel out (see Cowan 1981); thus the spin-orbit contribution to Eav is zero.
In expression (2.29), the first and second terms represent the kinetic (E k) and electron-nuclear (E n) energies while the last terms represent the electron-
32
electron Coulomb energies. The configuration-average binding energy of an electron in an orbital n ^ is
E‘ = E k‘ + En‘ + ] ^ E iJ. (2.30)j«“
and the configuration-average total binding energy of all N electrons may be written in any of the equivalent forms
E „ = 5 X 1 + X E,,l + I £ E‘i - (2.31)
or( 1
E.v = £ Eki + E ni + - 2 E ij > V )*' y
(2.32)
or
or
E» = Xi V z y
e . . = 5 Z ( e > e „, + e ‘)-
(2.33)
(2.34)
Making use of the spin-orbitals (2.14) the values of the different terms - involved in the expressions for one-electron and total-atom binding energies - can be evaluated using the following expressions:
E k* = ( i l - V 2li>tv = r*P*n,i,(r) d2 , 1,(1,+1)dr2 r2
Pn,i. (r)dr, (2.35)
E n‘ = < i l - — li> = [ " ( - — mrtfdr, Tj Jo r
(2.36)
The general expression for the matrix elements of ( l / r 12) between the two- electron product functions is given by
( ij l2 /r12ltu>= 8 8 ¿ R k(ij,tu)“ k=0
x >c ‘ < > i " \ . * . " ' 1 . ) . (2-3 7 >q=-k
where
33
Rl (ij,.u) = J " £ - ^ ^ ( r , ) P ; ( r J )P ,(r,)P ,(rI )dr1drJ . (2.38)
The electron-electron matrix elements involved in the expression (2.29) for E iV
are the special cases of (2.32). For the direct contribution we obtain
(ij!2 / r12lij) = ¿ F k(ij)ck (limli,limli)ck(ljmli,ljmlj), (2.39)k=0
where
F k(ij) = Rk(ij,ij) = Jo" J “ - ^ P i(rI)l2IPJ(r2)ll dr1dr2f (2.40)
the contribution due to the exchange term is given by
- < i j2 / r u lji) = - i f , Gk(ij)[c‘ (l1mIi, l1mlj)]! , (2.41)■J 'v=o
wherer- f- 2r kI I < DGk (ij) = R*(ij,ji) = j~ -¡S l-P , ‘ (r, )P ; (fl )Pj (r, )P, (r2 )dr,dr2. (2.42)
The radial integrals Fkand Gk (or more generally, Rk) are called the Slater integrals . The ckl s are the angular co-efficients and can be represented by analytical expressions (see Cowan 1981).
2.6 Calculation of level structure
The calculation of the level structure of an atom or ion involves the (i) determination of the detailed shape of the functions P ^ r ) that form the radial
factors of the one-electron spin-orbitals (2.14), and (ii) calculation of the energy matrix elements H bb, s <blHlb')[using as basis functions ^ either the
uncoupled determinental functions (2.14) or functions constructed according to any desired coupling scheme (see Cowan 1981)] and diagonalization of the energy matrix as described in section 2.2.
34
2.6.1 Determination of radial functions
The radial wavefunctions are the solutions of the radial part of the Schrodinger wave equation. For a multi-electron system no analytical solution is possible for this equation, however, this many body problem can be solved through approximations. As already stated, each electron can be assumed to be moving independently in an average potential formed by the Coulomb forces of the nucleus and other electrons (Independent Particle Model). Within the framework of this approximation, similar to hydrogen atom, each electron can be described by a spin-orbital
<pi(ri) = -PYc7. (2.43)r
The state wavefunction can be obtained from an antisymmetric linear combination of these spin-orbital products.
Each spin-orbital must satisfy the eigenvalue equation. Thus we get a set of N equations of the form,
n i(pi(ri) = ei(pi(ri) , (2.44)
called the Hartree equations. The radial part of these equations to be solved is of the form
_ i l + M !i± I> + V ‘(r)dr r
^ ( 0 = ^ ( 0 , (2.45)
where V‘(r) is the potential-energy function for the field in which the ith electron moves. Once the P;(r) are found for each configuration, the centre-of- gravity energy E,v and Fk, Gk, ^ and Rk can easily be calculated. These
quantities when combined with the angular coefficients give the energies of the various levels in the configuration.
The differential equations (2.45) each have exactly the same form as the hydrogenic Schrodinger equation but V '(r) is different. In these equations the Vl(r) depends on the radial functions P ^ r), therefore, they are solved numerically by the self-consistent field (SCF) method. The net potential V‘(r)
experienced by the ith electron - initially unknown - can be found by going through a self-consistent treatment.
The calculation is started with the aid of an appropriate potential-energy function VQ(r), scaled to -2 Z /r at small radii and to -2 (Z - N + l)/r at large
radii. This provides an initial potential V’(r) in which to calculate trial functions
35
Pj^O") for all orbitals n|lj on the first cycle of the SCF iteration (m = 1). Therefore, the potential-energy function Vl(r) for cycle m is computed for the
desired method (H, HFS, HX, or HS) (see section 2.7.1), using the functions Pj(r) from cycle m -1 . The value of e; is adjusted so that P ^ i r ) ) satisfy the
boundary conditions
Pj(0) = 0, and
lim P;(r) = 0.
(2.46)
(2.47)
The condition (2.46) is required to keep the electron density finite at r = 0 and the condition (2.47) is required for the wavefunction of a bound electron. The P;(m)(r) obtained is normalized and used to calculate V '(r) which in the next cycle yield P;tm)(r). This procedure is repeated until the Piiq>(r) found at the end
of a cycle is essentially the same as that used at the beginning.
2.6.2 Calculation of energy levels
The energy levels of an atom or ion can be computed using a single or multi-configuration basis set.
In the single-configuration approximation of the Slater-Condon theory of atomic structure the energies of the various states of the field free atom are given by the eigenvalues of the matrix
h 12 H 13 • • \
h 21 H * • • •
H31 ^ 3 2 h 33 • • •
(2.48)
(one matrix for each possible value of total angular momentum) of the Hamiltonian operator. The matrix elements of the Hamiltonian
i> j r ij(2.49)
36
connecting states b and b' may be written in the form
ijk
if only the most important interactions are included and are evaluated using the coupled, antisymmetric basis functions (see Cowan 1981). Here lj and lj are
orbital angular-momentum quantum numbers of electrons of a configuration
of incompletely filled subshells. EIvis the average energy of all states (not
levels) of the configuration. The parameters Fk and Gk are the same as defined by equations (2.40) and (2.42). The term d ^ is defined by
The parameter coefficients f k> gk, dj in equation (2.50) depend on the angular
quantum numbers of the basis sates b and b 'o f the configuration (2.51) in the chosen representation, but are independent of the radial wavefunctions and therefore of the particular atom or ion which exhibits this configuration. Their values can be computed with the help of general analytical formulas (see Cowan
In the case of interacting configurations, accurate calculations cannot be made within the limitations of a single-configuration basis set. It is then necessary to use a multi-configuration approximation, in which the basis set includes wavefunctions from two or more configurations. Each computed eigenfunction 'P will in general then be a mixture of basis functions from all configurations included in the calculation - a result referred to as configuration mixing. Correspondingly, the computed energies will be different from the values that would have been given by a set a single-configuration calculations - a result referred to as configuration-interaction perturbations. The wavefunction-mixing and energy-level and energy-level-perturbation aspects jointly are referred to simply as configuration-interaction.
(2.51)
where
(2.53)
1968).
37
Similar to the calculations performed for a single configuration, the Cl calculations involve the setting up the matrix the of Hamiltonian operator. For two configurations (c, and c2) the Hamiltonian matrix can be written in the
form:
It is made up of four different submatrix blocks. The two diagonal blocks ( q and c2) are always square, and are identical with the energy matrices that we would have had for the two configurations Cj and c2 when considered separately. In either block, each matrix consists of sums of terms EIV, f kFk(ij), gkGk(ij), and d ;^ . However, the numerical value of E1V that appears in the diagonal elements of the block q will be different from that in c2. Likewise, the radial integrals Fk(ij), etc., for the block q will normally be computed from radial wavefunctions P;(r) and Pj(r) obtained from a Hartree-Fock (or HX, HFS, etc.)
calculation for the configuration Cj whereas the radial integrals appearing within c2 will be computed via a HF calculation for c2.
The off-diagonal blocks (blocks C j- c 2 and c2-C j) represent configuration-interaction elements, They are in general rectangular rather than square, and one block is just the transpose of the other because the total matrix is symmetric. The configuration-interaction (Cl) matrix elements are calculated exactly as were the single-configuration matrix elements [H ^, =(blH lb ')] but
(b and b') now belong to different configurations. In place of the single-
configuration direct and exchange radial integrals Fk and Gk, the electron- electron Coulomb operator gives Cl radial integrals Rk and Rk. The general
forms of these integrals are given by
(2.54)
and
38
Note that unlike Fk and Gk, Rkis not necessarily positive. Analogous to the single-configuration direct and exchange angular coefficients fk and gk, Cl integrals have their own coefficients rk and r k, respectively, and are defined by
general analytical formulas (see Cowan 1981). There are also configuration- interaction spin-orbit matrix elements but their contribution is usually very small.
Requirements and consequences of configuration-interactions.1. The Hamiltonian operator has even parity, and so the Cl matrix
elements are zero unless the bra and ket functions have a common parity. Thus the configurations included in the calculations should have the same parity.
2. The Hamiltonian involves only one- and two-electron operators, so that interactions can occur only between two configurations that differ in at most two orbitals. For example, interactions may occur between any two of the configurations d3s2, d4s, d5, d3p2 and d2sp2, except for d5-d2sp2.
3. The matrix of the Coulomb operator in an LS representation is (just in the single-configuration case) diagonal in the quantum numbers LSJM. Therefore, non-zero Coulomb Cl matrix elements exist only if each configuration contains a basis state with some common value of LS. For example, sp and sf do not interact, because the former contains only 1-3P° terms whereas the latter contains only 1-3F°.
4. The non-zero Coulomb matrix element that connects basis functions lb) and lb ')of two configurations c and c ' causes each eigenstate to be a
mixture of the two basis states. Because of the spin-orbit mixing present within each configuration separately, each eigenstate of the two-configuration calculation indirectly becomes a mixture of all basis states (of given J) of both configurations. Similarly, a three-configuration calculation for d5 + d3s2 + d2sp2 will give eigenstates each of which is a mixture of basis functions of all three configurations, even though d5 and d2sp2 do not interact directly.
5. Configuration-interaction effects tend to be largest between configurations whose centre-of-gravity energies E1V are not greatly different,
and/or for cases in which the Coulomb matrix elements rkRk(ij,i'j') are large in
magnitude. Large values of IRkl tend to occur when the two configurations belong to the same complex (i.e. configurations having the same n values such as configurations 2p63s3p, 2p53s23d, 2p53s3p2, 2p53d3p2 belong to the same complex) because the various radial wavefunctions then tend to have maximum overlap. Thus, particularly in high ionisation stages where Eav depends primarily
39
on the principal quantum numbers and relatively weakly on the orbital angular momenta, the largest interactions tend to occur among the configurations within a complex, such as 3s23pw-3pw+2 or 3s3pw+1 -3s23pw l3d interaction remains strong throughout the isoelectronic sequence. However, the interaction 3s3pw+1 - 3s23pw_1nd is notoriously strong in neutral atoms for all values of n. Consequently, it results in the strong perturbation of all nd Rydberg states.
2.6.3 Calculation of statistically-weighted oscillator strength(gf-value)
When XUV radiation is passed through an atomic or ionic vapour its absorption due to various excitation and ionization processes results in the attenuation of the incident beam. The relation between the transmitted and incident radiation at some discrete frequency v is given by the expression
I = I0e-kvL, (2.57)
which is also known as the Lambert-Beer law and kv is termed as the absorption
co-efficient. I and I0 are the initial and final intensities of radiation of frequency V passed through the absorbing column of length L.
In the case of discrete atomic absorption the oscillator strength (f) is oftenused to quantify the strength of an observed transition and it can be shown(Kirkbright and Sargent 1974) that
, (2.58)n Jte J
where m, e, c and n are the electron mass, electron charge, velocity of light and the number of absorbing species per unit volume. The integral J k vdv is the
integrated absorption co-efficient.The photoabsorption spectra reported in this work are obtained by
plotting ln(Io/I) versus energy. I0 represents the intensity of the backlighting continuum and I the intensity transmitted through the absorbing column (see chapter 3 for further details). It has been shown (Kieman 1994) that for optically thin cases this provides a good representation of the relative absorption coefficient as a function of energy. To facilitate the analysis visual comparisons are made between the relative absorption spectra and stick diagrams based on
40
calculated gf-values for the atomic or ionic transitions (for example, see chapter 4).
The oscillator strength (f) of a transition can be written in terms of its gf- value by the expression
f . f = . (2.59),_>f 2J; + 1
The theoretical expression for the gf-value for a transition from somelower level "i" to a higher level "j" is given by
gf = ~(Ej —E;)S, (2.60)
where E 3 - E ; is the transition energy in rydbergs. The quantity S is called the
line strength and its square root is defined by the expression
S1/2=<vPiIIP(1)ll'Pf>, (2.61)
' k 1 ^or S1/2 = (~ \)h (2lj + l)1/2(2lf + 1)1/20 0 0
x J p n if (r) e r p n i, (r)d r, (2.62)
where P (1) = e r , is the electric dipole operator.The above expressions show that calculation of the gf-value for a
transition involves the computation of the corresponding line strength or that ofits square root
S1/2 = ('PiIIP(1)ll4/f> = (yJj IIP(1)II yJf >. (2.63)
In real calculations the wavefunctions I yJj) and lyJf) usually do not involve
only the single terms, therefore, they are expanded in terms of their suitable basis functions of the form
= and (2.64)
lV ,> = X y { ;J,iP,J,>- (2.65)Pr
Substitution of (2.64) and (2.65) in (2.63) gives
41
p. p ,(2.66)
In the case of neutral atoms having complex configurations errors in the computed gf-values - ranging from 50 or 100 percent to one or more orders of magnitude - can be observed. The deviations between observed and calculated values usually arise as a result of cancellation effects of one sort or another. Some of these effects described below can be explained on the basis of expressions (2.61) and (2.66).
Intermediate coupling. The line strengths are generally computed in terms of single-configuration, pure-coupling basis functions. The quantum states in real atoms (especially with Z and N greater than 5) do not usually closely approximate pure basis functions. Therefore, computed line strengths usually involve evaluating the sum of several terms, because of intermediate-coupling and configuration-interaction mixing of basis states. As is clear from expression (2.64) this sum represents a mixing of amplitudes rather than of line strengths themselves. Consequently, the effect of mixing is not necessarily a tendency to average out the various line strengths. The destructive effects could occur frequently and cause a weak line to become still weaker, or even cause an otherwise strong line to essentially disappear - a situation observed in the 2p-subshell photoabsorption spectra of neutral A1 and Si.
Radial-integral cancellation. Another type of cancellation may occur which is completely different from the angular effects produced by intermediate- coupling mixing of basis states. Such a situation arises from the destructive- interference effect in the radial portion (rather than the angular portion) of Sl/1. In extreme cases, the cancellation effect may be almost 100%. This more or less completely wipes out an entire transition array (Cowan 1981).
Configuration-interaction effects. The computed line strengths are very sensitive to the composition of a level, so configuration-interaction while not affecting greatly the energy of a level may have a considerable effect on the line strengths. This situation is very common in the case of core-valence interactions (see chapters 4). As the total line strength is always conserved: cancellation effects in one line are always counterbalanced by increased line strengths elsewhere. In this way, configuration-interaction effects quite commonly result in the net transfer of line strength from one transition array to another (also see chapter 4).
42
2.7 Ab initio calculations with Cowan's code
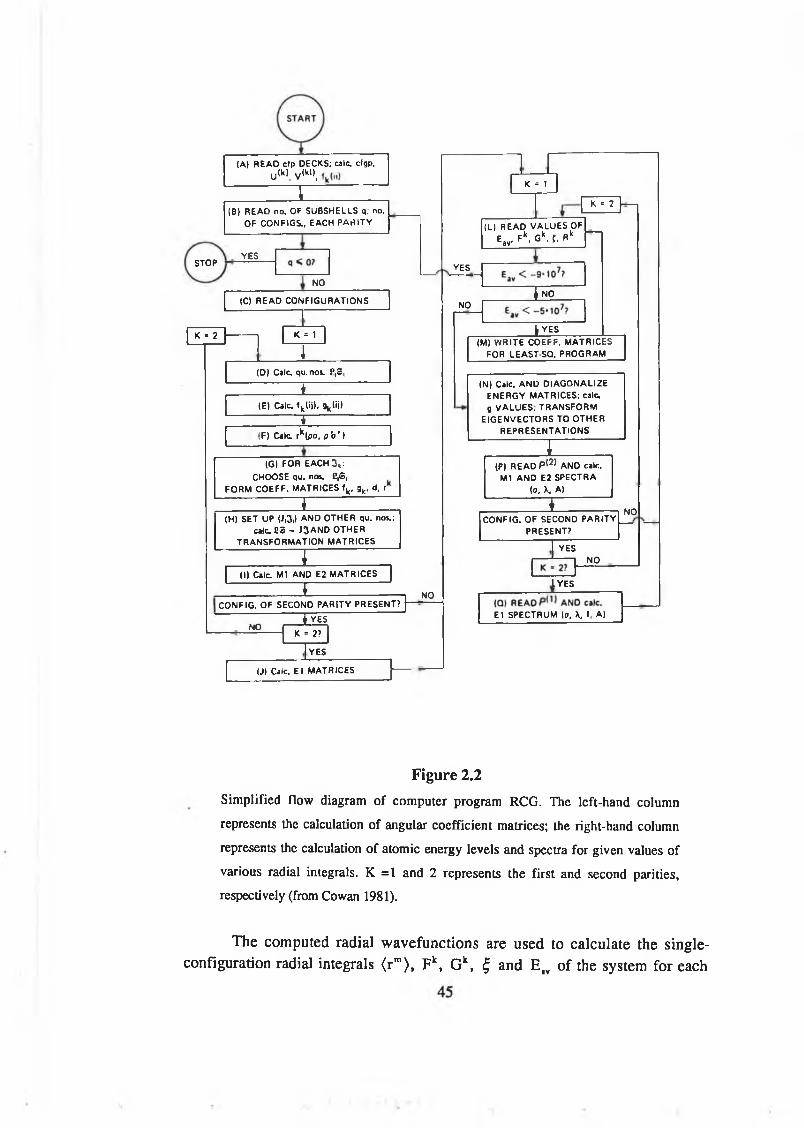
In order to analyse the measured spectra reported in this work a range of ab initio scaled as well as unsealed Configuration-Interaction Hartree-Fock (CIHF) atomic structure calculations were carried out with the help of a suite of computer programs (Cowan 1981) based on the preceeding theory. The calculations requiring limited basis states were performed on the DCU VAX while the ones involving large expansions were performed on the Cray XMP/48 at the Rutherford Appleton Laboratory (UK). The results obtained from these calculations, particularly the computed transition energies are highly accurate with the exception of a few multi-electron transitions and is clearly evident from the comparison made between the computed and measured transition energies (see chapters 4, 5 and 6). For the study of photoabsorption spectra from excited states (see chapter 7) the ab initio unsealed calculations were found in agreement with the measured spectra, therefore, the assignment of the spectra were straightforward (for discussion see section 2.7.2). In the case of absorption from ground states (see chapters 4, 5 and 6) the desired accuracy was achieved partly by suitably scaling the various radial integrals (for discussion see section 2.7.2). This suite consisted of the programs RCN35, RCN2, and RCG10. The roles played by each of these programs are given in the flow diagrams shown in figures 2.1 and 2.2. The primary information is always to RCN, and each program automatically provides information to the succeeding program of the chain.
2.7.1 RCN35
Program RCN35 calculates the single-configuration wavefunctions P ^ r )
for a spherically symmetrized atom via any one of the following methods - each is an approximation to the true Hartree-Fock Method (Cowan 1981) -
1. Hartree (H),2. Hartree-Fock-Slater (HFS),3. Hartree-plus-statistical-exchange (HX), and4. Hartree-Slater.The difference in these approaches lies in the form of assumed central
field potential (for details see Cowan 1981). Nonnally the HX method is used since it is computationally the most efficient. It also serves as a starting point for
43
the other methods. The calculations can be made either within the framework of centre-of-gravity energy of the configuration or for the energy of a specific LS term of the configuration (LSD-HF) provided there exists only one term having that value of LS.
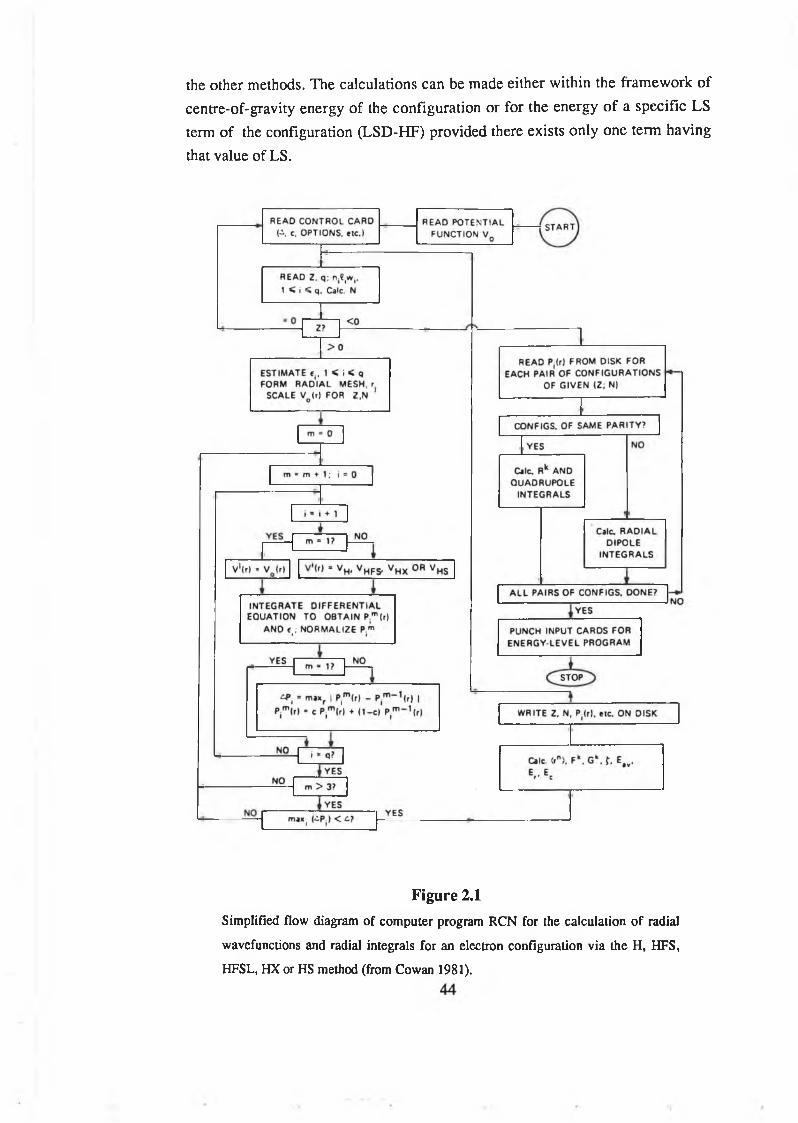
Figure 2.1Sim plified flow diagram o f com p u ter program R C N for the calcu lation o f radial
w avefunctions and radial integrals for an electron configuration v ia the H , H F S ,
H F S L , H X or HS method (from C ow an 1 9 8 1 ).
(A( READ ctp DECKS; calc, cfgp, U (k>, V (kl>,
1 ~
(S) READ no. OF SUBSHELLS q, no. OF CONFIGS., EACH PARITY
STOPYES
NO
K 1 2
(Cl REAO CONFIGURATIONS
K = 1
i
(D I Calc. qu. nos. S’,3,
*
(E) Calc 1k(¡¡), gk (ij)
*IF) Calc. rk |po, p b ’ l
(G) FOR EACH 3 ,:CHOOSE qu. nos. C,S,
FORM COEFF. MATRICES <k, gk. d. r
I(H) SET UP (J,3i) AND OTHER qu. nos.;
calc. £ 3 - J3 AND OTHER TRANSFORMATION MATRICES
I(I) Calc. M l AND E2 MATRICES
*CONFIG. OF SECOND PARITY PRESENT?
NOj YES
K = 2?
YES
(J) Calc. E l MATRICES
K = 1K ■= 2
(L) READ VALUES OF Eav. Fk, Gk. f. Rk
YES
NOj NO
YES(M) W RITE COEFF. MATRICES
FOR LEAST-SQ. PROGRAM
(N) Calc. AND DIAGONALIZE ENERGY MATRICES; calc, g VALUES. TRANSFORM
EIGENVECTORS TO OTHER REPRESENTATIONS
I(PI R E A D ? *21 AND calc.
M l AND E2 SPECTRA (0, X, A)
♦CONFIG. OF SECONO PARITY
PRESENT?
NO
YESNO
Ly e s
NO
E l SPECTRUM (a, X, «, A)
Figure 2.2S im p lified flow d iagram o f co m p u te r p rog ram R C G . T h e left-h and colu m n
represents the calculation o f angular co e fficien t m atrices; the right-hand colum n
represents the calculation o f a to m ic en ergy levels and spectra for given values o f
variou s radial in tegrals. K = 1 and 2 rep resen ts the first and seco n d p arities,
respectively (from Cow an 1 9 8 1 ).
The computed radial wavefunctions are used to calculate the single- configuration radial integrals <rm), F \ Gk, £ and E1V of the system for each
electron configuration involved in the calculation. Relativistic effects on the total binding energies and radial wavefunctions become appreciable for Z as small as 10 and 30, respectively. In this program these effects are incorporated as perturbations to the Hartree Method (see Cowan 1981). Proper treatment of relativistic effects leads to what may be called the Dirac-Fock (DF) or Dirac - Hartree-Fock (DHF) equations (Grant 1970, Desclaux 1975). However, these are considerably more complex than the HF equations. Also the achievement of convergence of the SCF (Self-Consistent-Field) procedure becomes more difficult when Dirac-Fock equations are used.
It has been found (Cowan 1981 and references therein) that theoretical values of E1V agree well with the experiment (at least in simple cases), provided
that relativistic and correlation corrections are included. Spin-orbit effects are usually predicted with good accuracy, provided that values of Ç are computed via the Blume-Watson theory (see Cowan 1981) using HF radial functions. Within the framework of the configuration-average approach, the computed energy-level splitting resulting from electron-electron Coulomb interactions are generally larger than observed by ten to fifty percent. This is a consequence of the neglect of the LS-term dependence of electron correlation.
2.7.2 RCN2
Program RCN2 accepts radial wavefunctions from the RCN program and calculates various multiple-configuration radial integrals: overlap integrals (PIP'), configuration-interaction Coulomb integrals Rk and spin-orbit integrals £u, and radial electric-dipole integrals. At this stage, it is also possible to scale
down the various radial integrals, if desired.In the ab initio HF method (or any of the approximations thereto),
electrons are considered to move independently of each other. In reality, the electron movements are spatially correlated, primarily by virtue of the simple Coulomb repulsion between them. The effects of these corrections can only be taken into account approximately, because exact analytical solutions are not known for non-hydrogenic systems. The single-configuration ab initio methods such as Hartree-X and and Hartree-Fock do contain approximate allowances for correllations; and by specifically including configuration mixings, better approximations to reality are obtained. However, in any practicable calculation of atomic structure, relatively few configurations can be included directly. Beyond about 40 simple configurations or 2 or 3 very complex ones, the
46
combination of computer time and storage requirements soon become prohibitive on even the largest computers.
In situations, where configurations are widely separated in energy or else are only linked by very small Rk, it is found that good agreement with the observed energy level separations can be obtained by direct inclusion of only a few of the most significant interactions (see chapter 7). In some cases, even the single configuration approximation is good enough. However, as fewer and fewer mixings are directly treated, so it becomes more and more important to allow for omitted weak mixings in some way. Even if as many as 40 or more configurations are explicitly in the calculation, it is still very often necessary to allow for the infinity of mixings with far-off configurations, and indeed for mixing with the continuum of unbound states. In short, the spatial correlation between electrons may be fairly well represented by the inclusion of some nearby configurations, but it is not completely so.
However, with calculations performed including only the most significant interactions better agreement with experiment can be obtained by decreasing the ab initio values of various radial integrals by suitable amounts (see chapters 4, 5 and 6). This scaling is used to account for the electron-electron correlation effects not properly modelled in the ab initio calculations (Cowan and Wilson 1988). The required values of scale factors depend on the system under investigation. For the systems which exhibit very small electron-correlation effects - a situation observed in energy levels closest to being hydrogenic (e.g., in highly ionised atoms, configurations involving highly excited states or excited configurations arising from the valence-excited states) scaling factors have been observed as almost unity (see chapter 7).
2.7.3 RCG10
This program employing Racah-algebra techniques generates the coefficients of fractional parentage required to remove ambiguity in the similarly labelled LS levels and the various angular coefficients needed to construct the Hamiltonian energy matrices from the radial integrals supplied by the RCN35/RCN2 programs. By diagonalizing the energy matrices it yields energy levels and eigenvector compositions. From these energy levels and eigenvector compositions data, and the supplied electric-dipole integrals it computes the statistically weighted transition rates (gA) and oscillator strengths (gf).
47
2.8 References
Condon E U and Shortley G H, 1935, The Theory of Atomic Spectra (Cambrigde
University Press.).
Cowan R D, 1968, J. Opt. Soc. Am. 58, 808.
Cowan R D, 1981, The Theory of Atomic Structure and Spectra (Uinversity of California Press).
Cowan R D and Wilson M, 1988, J. Phys. B: At. Mol. Phys. 21, L275.
Desclaux J P, 1975, Comput. Phys. Commun. 9,31.
Grant IP , 1970, Adv. Phys. 19,747.
Kieman L, 1994, Ph.D. thesis, Dublin City University.
Kirkbright G F and Sargent M, 1974, Atomic Absorption and Fluorescence Spectroscopy (Academic Press London).
Slater J C, 1929, Phys. Rev. 34,1293.
Slater J C, 1960, Quantum Theory of Atomic Structure (McGrawHill Book Co., New York.) 2 Vols.
48
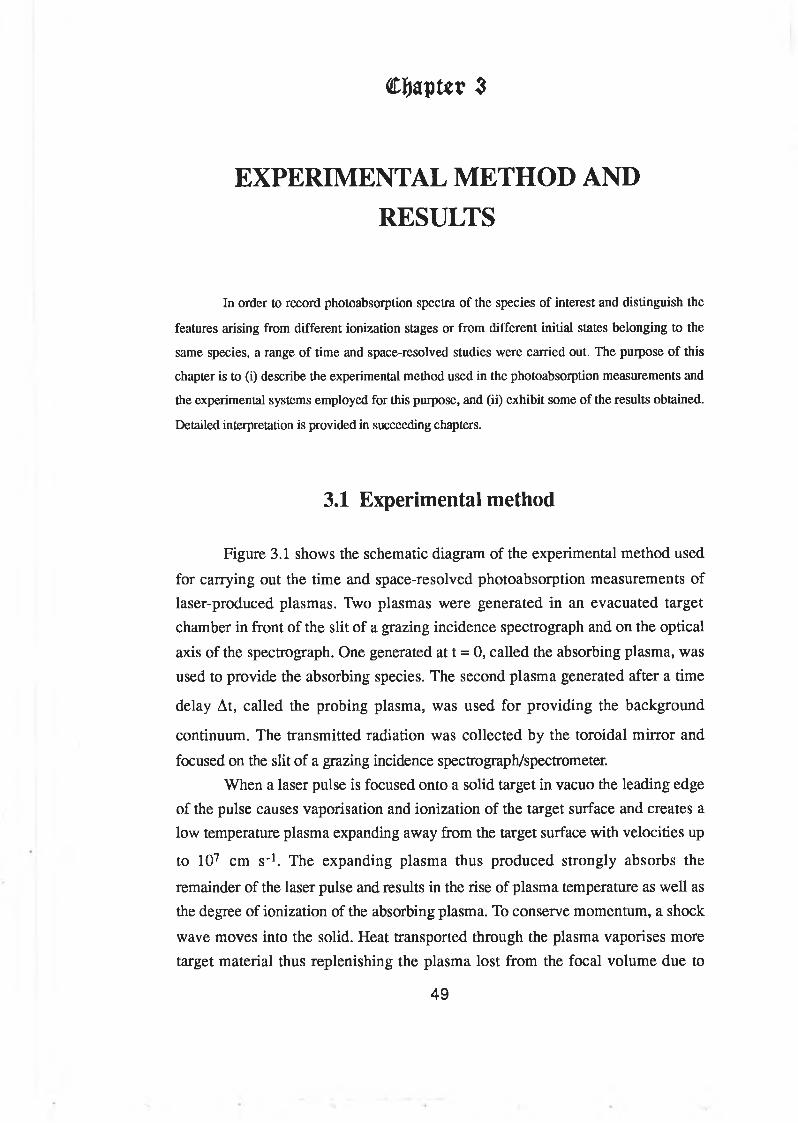
C & a p t t r 3
EXPERIMENTAL METHOD AND RESULTS
In order to record photoabsorption spectra of the species of interest and distinguish the
features arising from different ionization stages or from different initial states belonging to the
same species, a range of time and space-resolved studies were carried out. The purpose of this
chapter is to (i) describe the experimental method used in the photoabsorption measurements and
the experimental systems employed for this purpose, and (ii) exhibit some of the results obtained.
Detailed interpretation is provided in succeeding chapters.
3.1 Experimental method
Figure 3.1 shows the schematic diagram of the experimental method used
for carrying out the time and space-resolved photoabsorption measurements of laser-produced plasmas. Two plasmas were generated in an evacuated target chamber in front of the slit of a grazing incidence spectrograph and on the optical
axis of the spectrograph. One generated at t = 0, called the absorbing plasma, was used to provide the absorbing species. The second plasma generated after a time
delay At, called the probing plasma, was used for providing the background
continuum. The transmitted radiation was collected by the toroidal mirror and
focused on the slit of a grazing incidence spectrograph/spectrometer.When a laser pulse is focused onto a solid target in vacuo the leading edge
of the pulse causes vaporisation and ionization of the target surface and creates a low temperature plasma expanding away from the target surface with velocities up
to 107 cm s '1. The expanding plasma thus produced strongly absorbs the
remainder of the laser pulse and results in the rise of plasma temperature as well as the degree of ionization of the absorbing plasma. To conserve momentum, a shock
wave moves into the solid. Heat transported through the plasma vaporises more target material thus replenishing the plasma lost from the focal volume due to
49
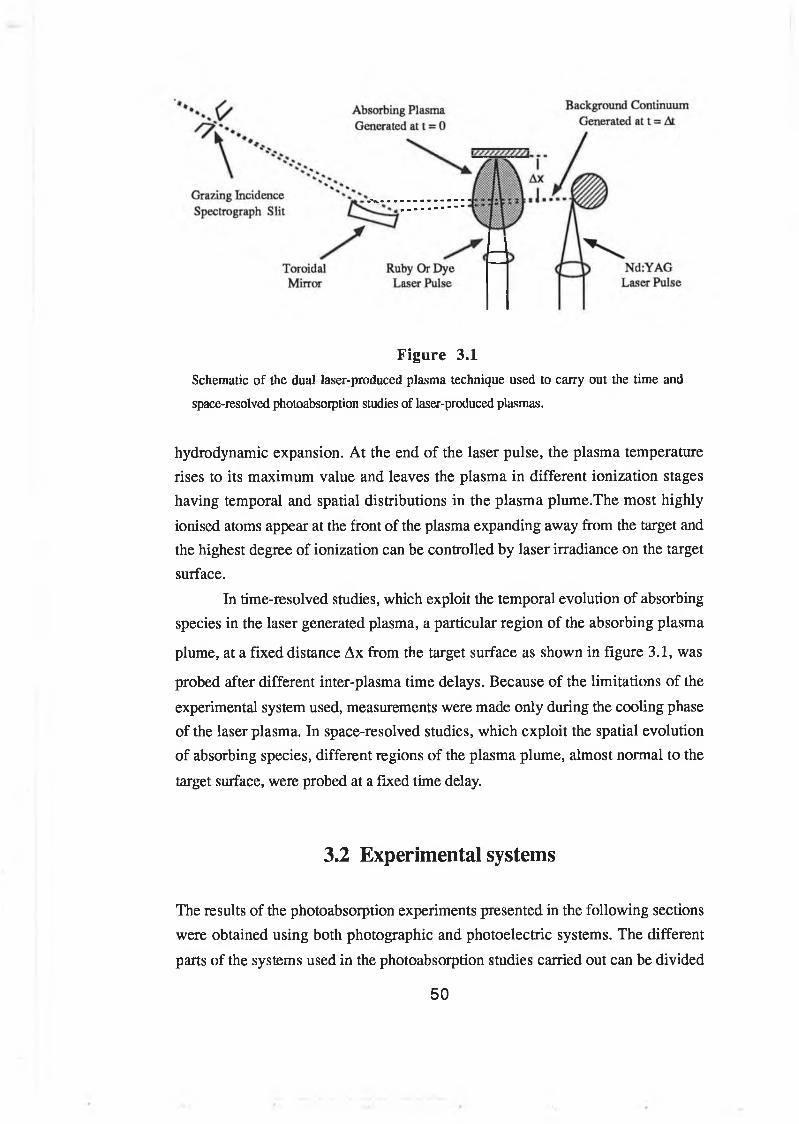
Figure 3.1Schematic of the dual laser-produced plasma technique used to carry out the time and
space-resolved photoabsorption studies of laser-produced plasmas.
hydrodynamic expansion. At the end of the laser pulse, the plasma temperature rises to its maximum value and leaves the plasma in different ionization stages having temporal and spatial distributions in the plasma plume.The most highly ionised atoms appear at the front of the plasma expanding away from the target and the highest degree of ionization can be controlled by laser irradiance on the target surface.
In time-resolved studies, which exploit the temporal evolution of absorbing species in the laser generated plasma, a particular region of the absorbing plasma
plume, at a fixed distance Ax from the target surface as shown in figure 3.1, was
probed after different inter-plasma time delays. Because of the limitations of the
experimental system used, measurements were made only during the cooling phase of the laser plasma. In space-resolved studies, which exploit the spatial evolution of absorbing species, different regions of the plasma plume, almost normal to the
target surface, were probed at a fixed time delay.
3.2 Experimental systems
The results of the photoabsorption experiments presented in the following sections were obtained using both photographic and photoelectric systems. The different
parts of the systems used in the photoabsorption studies carried out can be divided
50
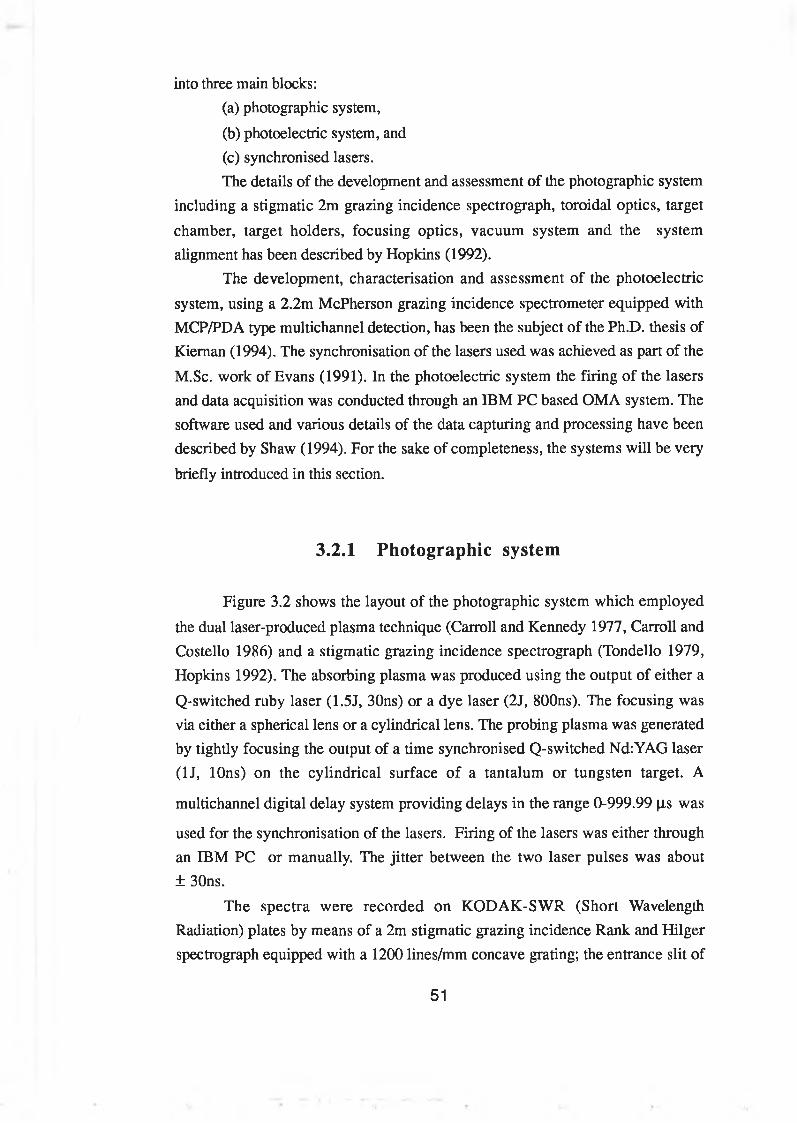
into three main blocks:(a) photographic system,
(b) photoelectric system, and(c) synchronised lasers.The details of the development and assessment of the photographic system
including a stigmatic 2m grazing incidence spectrograph, toroidal optics, target
chamber, target holders, focusing optics, vacuum system and the system alignment has been described by Hopkins (1992).
The development, characterisation and assessment of the photoelectric system, using a 2.2m McPherson grazing incidence spectrometer equipped with MCP/PDA type multichannel detection, has been the subject of the Ph.D. thesis of Kieman (1994). The synchronisation of the lasers used was achieved as part of the
M.Sc. work of Evans (1991). In the photoelectric system the firing of the lasers and data acquisition was conducted through an IBM PC based OMA system. The software used and various details of the data capturing and processing have been described by Shaw (1994). For the sake of completeness, the systems will be very
briefly introduced in this section.
3.2.1 Photographic system
Figure 3.2 shows the layout of the photographic system which employed
the dual laser-produced plasma technique (Carroll and Kennedy 1977, Carroll and Costello 1986) and a stigmatic grazing incidence spectrograph (Tondello 1979, Hopkins 1992). The absorbing plasma was produced using the output of either a
Q-switched ruby laser (1.5J, 30ns) or a dye laser (2J, 800ns). The focusing was via either a spherical lens or a cylindrical lens. The probing plasma was generated by tightly focusing the output of a time synchronised Q-switched Nd:YAG laser (1J, 10ns) on the cylindrical surface of a tantalum or tungsten target. A
multichannel digital delay system providing delays in the range 0-999.99 [is was
used for the synchronisation of the lasers. Firing of the lasers was either through an IBM PC or manually. The jitter between the two laser pulses was about ± 30ns.
The spectra were recorded on KODAK-SWR (Short Wavelength Radiation) plates by means of a 2m stigmatic grazing incidence Rank and Hilger spectrograph equipped with a 1200 lines/mm concave grating; the entrance slit of
51
at 120 A. The theory and construction of the spectrograph can be found in an excellent book by Samson (1967). The various details of the spectrograph used
and development of the plates has been described by Brilly (1990a).In a typical photoabsorption experiment carried out using this system
10 - 20 shots were enough to produce adequate plate blackening; this is much less
than required in earlier experiments employing astigmatic spectrographs (Brilly et al. 1988). In measuring the plates well known emission lines of A1 and O ions listed by Kelly (1987) were used as external wavelength standards in addition to
the internal absorption lines of Al2+ reported by Brilly et al. (1988, 1990) and Al
and A1+ listed by Cantu et al. (1982). The external references were obtained by
recording emission spectra of point plasmas formed on aluminium and aluminium oxide targets with tightly focused laser beams. The plates were measured on a
photoelectric comparator in the Physics Department at University College Dublin.
spectrograph was kept at 10 |xm. The dispersion of the spectrograph was 1 A/mm
Ruby or Dye Laser Pulse Used to Ge.neratp. Absorbing Soe.cies
Nd: YAG Laser Pulse Used to Generate Background continuum
Target Chamber
Figure 3.2Layout of the photographic system used in the XUV photoabsorption studies of atoms and
ions.
This instrument is operated by hand and essentially allows the accurate
52
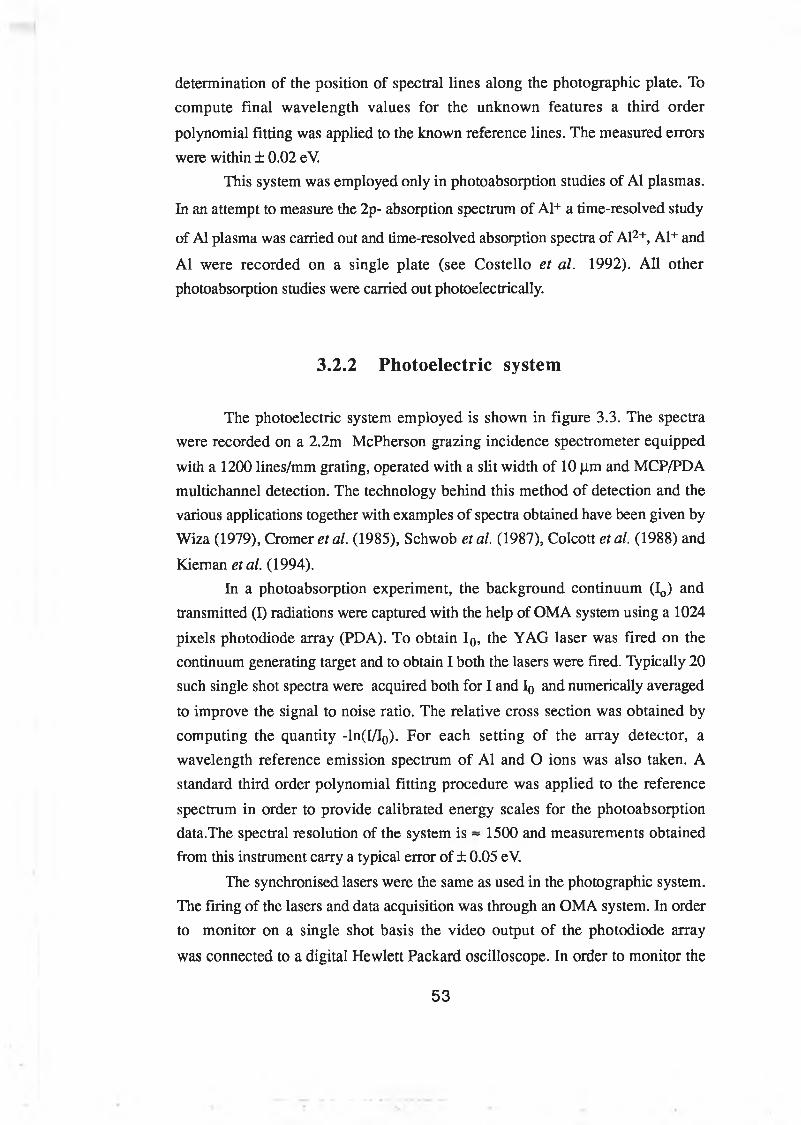
determination of the position of spectral lines along the photographic plate. To compute final wavelength values for the unknown features a third order
polynomial fitting was applied to the known reference lines. The measured errors were within ± 0.02 eV.
This system was employed only in photoabsorption studies of A1 plasmas.
In an attempt to measure the 2p- absorption spectrum of A1+ a time-resolved study
of A1 plasma was carried out and time-resolved absorption spectra of Al2+, Al+ and
A1 were recorded on a single plate (see Costello et al. 1992). All other photoabsorption studies were carried out photoelectrically.
3.2.2 Photoelectric system
The photoelectric system employed is shown in figure 3.3. The spectra were recorded on a 2.2m McPherson grazing incidence spectrometer equipped
with a 1200 lines/mm grating, operated with a slit width of 10 fim and MCP/PDA multichannel detection. The technology behind this method of detection and the various applications together with examples of spectra obtained have been given by Wiza (1979), Cromer etal. (1985), Schwob etal. (1987), Colcott etal. (1988) and
Kieman etal. (1994).In a photoabsorption experiment, the background continuum (I0) and
transmitted (I) radiations were captured with the help of OMA system using a 1024
pixels photodiode array (PDA). To obtain I0, the YAG laser was fired on the continuum generating target and to obtain I both the lasers were fired. Typically 20 such single shot spectra were acquired both for I and I0 and numerically averaged
to improve the signal to noise ratio. The relative cross section was obtained by computing the quantity -ln(I/I0). For each setting of the array detector, a wavelength reference emission spectrum of Al and O ions was also taken. A standard third order polynomial fitting procedure was applied to the reference
spectrum in order to provide calibrated energy scales for the photoabsorption data.The spectral resolution of the system is ~ 1500 and measurements obtained from this instrument carry a typical error of ± 0.05 eY.
The synchronised lasers were the same as used in the photographic system. The firing of the lasers and data acquisition was through an OMA system. In order to monitor on a single shot basis the video output of the photodiode array
was connected to a digital Hewlett Packard oscilloscope. In order to monitor the
53
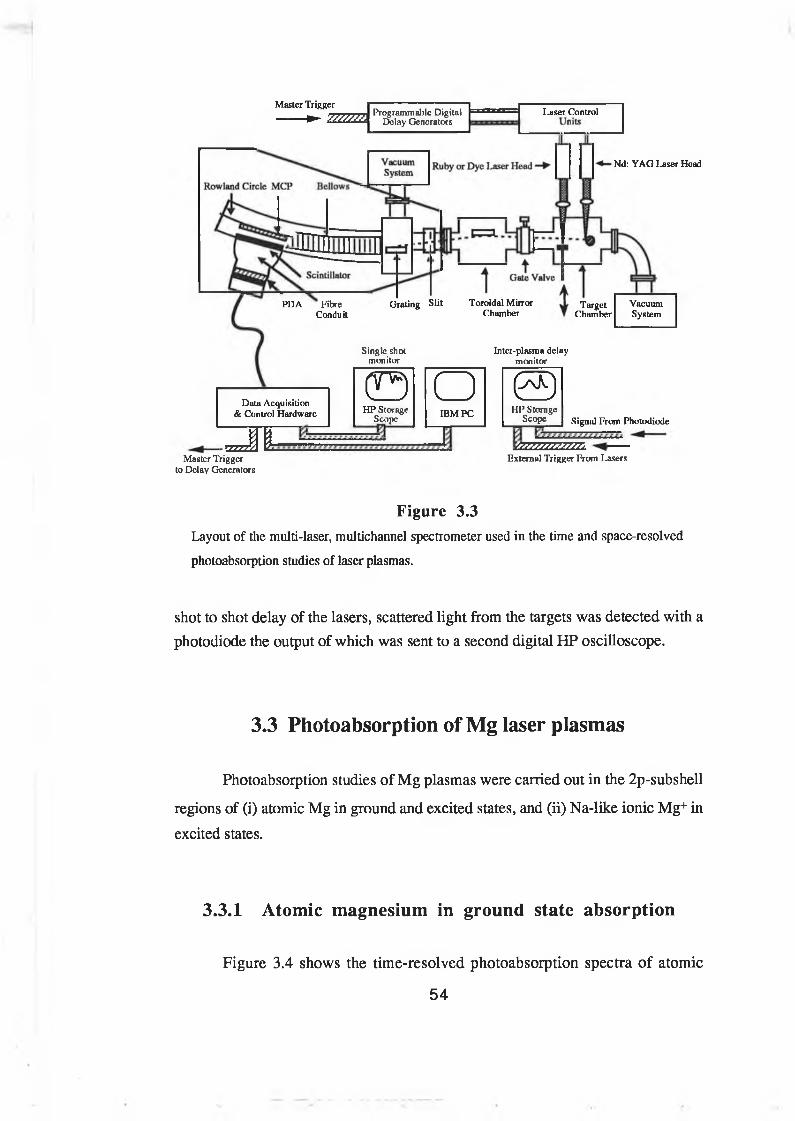
Master Trigger
► 7ZZZZZL. Programmai)le Digital D^slay Generators
Laser Control
Nd: YAG Laser Head
PDA Fibre Conduit
Grating Slit Toroidal Mirror Chamber
TargetChamber
VacuumSystem
Single shot monitor
Inter-plasma delay monitor
Data Acquisition & Control Hardware
. J l
( D o ©HP Storage
ScopeIBM PC HP Storage
Scope Signal From Photodiode
Master Trigger to Delay Generators
YMMSSJT/27Í ----External Trigger From Lasers
Figure 3.3L ayo u t o f the m ulti-laser, m ultichannel spectrom eter used in the tim e and space-resolved
photoabsorption studies o f laser plasm as.
shot to shot delay of the lasers, scattered light from the targets was detected with a photodiode the output of which was sent to a second digital HP oscilloscope.
3.3 Photoabsorption of Mg laser plasmas
Photoabsorption studies of Mg plasmas were carried out in the 2p-subshell
regions of (i) atomic Mg in ground and excited states, and (ii) Na-like ionic Mg+ in
excited states.
3.3.1 Atomic magnesium in ground state absorption
Figure 3.4 shows the time-resolved photoabsorption spectra of atomic
54
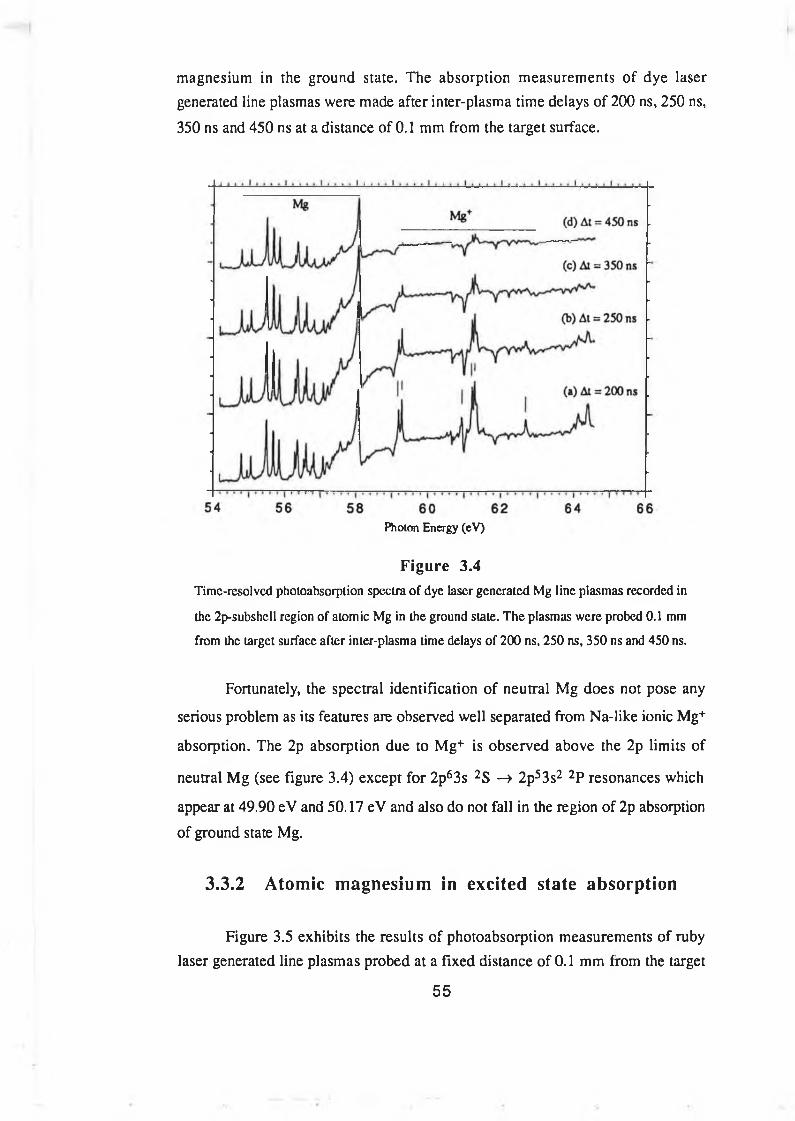
magnesium in the ground state. The absorption measurements of dye laser generated line plasmas were made after inter-plasma time delays of 200 ns, 250 ns,
350 ns and 450 ns at a distance of 0.1 mm from the target surface.
Photon Energy (eV)
Figure 3.4T im e-resolved photoabsorption spectra o f dye laser generated M g line plasm as recorded in
the 2p-subshell region o f atom ic M g in the ground state. T h e plasm as w ere probed 0 .1 mm
from the target surface after inter-plasm a lime delays o f 2 0 0 ns, 2 5 0 ns, 3 5 0 ns and 4 5 0 ns.
Fortunately, the spectral identification of neutral Mg does not pose any
serious problem as its features are observed well separated from Na-like ionic Mg+
absorption. The 2p absorption due to Mg+ is observed above the 2p limits of
neutral Mg (see figure 3.4) except for 2p63s 2S —» 2p53s2 2P resonances which
appear at 49.90 eV and 50.17 eV and also do not fall in the region of 2p absorption
of ground state Mg.
3.3.2 Atomic magnesium in excited state absorption
Figure 3.5 exhibits the results of photoabsorption measurements of ruby laser generated line plasmas probed at a fixed distance of 0.1 mm from the target
55
surface under two different laser irradiances. At the lower laser power density corresponding to a flash lamp voltage of 1.9 kV the measurements were made at
time delays of 105 ns (Figure 2.5a) and 130 ns (Figure 2.5b). At a higher flash lamp voltage of 2 kV, the time delays were 105 ns (Figure 2.5c) and 150 ns
(Figure 2.5d). In both cases significant absorption is observed from the 2p63s3p
3P metastable states but absorption from the 2p63s3p !P states is very weak.
Photon Energy (eV)
F igure 3.5.Tim e-resolved phoioabsorpiion spectra o f ruby laser generated M g line plasm as recorded in
the 2p-subshell region o f atom ic M g in excited slates using tw o different laser irradiances
but probed at a fixed distance from o f 0 .1 m m from the target surface. In the cases o f (a)
and (b) the ruby flash lamp voltage w as 1 .9 kV. F o r (c ) and (d) it was increased to 2 kV.
3.3.3 Na-Iike magnesium in excited state absorption
In order to make absorption measurements for Na-like Mg+ in excited
states a time-resolved study of ruby generated Mg line plasmas was carried out. The results are shown in figure 3.6. The absorbing plasma was probed 0.1 mm
56
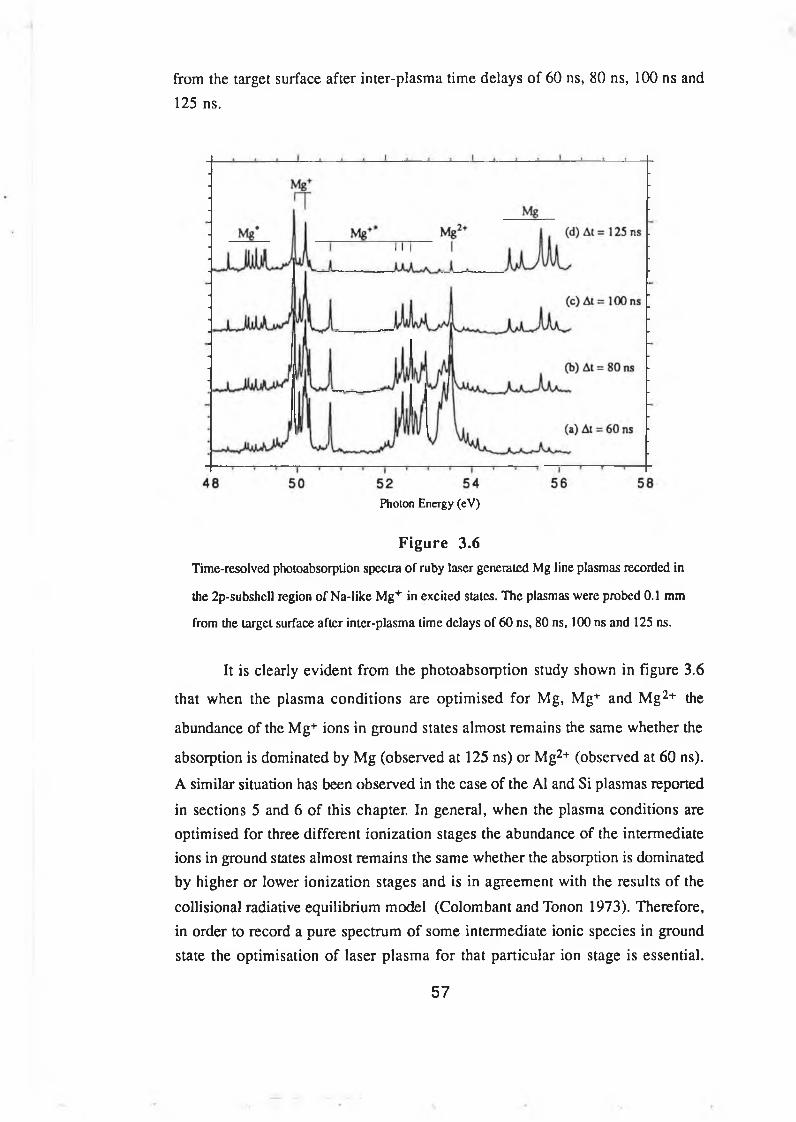
from the target surface after inter-plasma time delays of 60 ns, 80 ns, 100 ns and
125 ns.
Photon Energy (eV )
Figure 3.6Time-resolved photoabsorption spectra of ruby laser generated Mg line plasmas recorded in
the 2p-subshcl! region of Na-like Mg+ in excited states. The plasmas were probed 0.1 mm
from the target surface after inter-plasma time delays of 60 ns, 80 ns, 100 ns and 125 ns.
It is clearly evident from the photoabsorption study shown in figure 3.6
that when the plasma conditions are optimised for Mg, Mg+ and Mg2+ the
abundance of the Mg+ ions in ground states almost remains the same whether the
absorption is dominated by Mg (observed at 125 ns) or Mg2+ (observed at 60 ns).
A similar situation has been observed in the case of the A1 and Si plasmas reported
in sections 5 and 6 of this chapter. In general, when the plasma conditions are optimised for three different ionization stages the abundance of the intermediate ions in ground states almost remains the same whether the absorption is dominated by higher or lower ionization stages and is in agreement with the results of the
collisional radiative equilibrium model (Colombant and Tonon 1973). Therefore, in order to record a pure spectrum of some intermediate ionic species in ground state the optimisation of laser plasma for that particular ion stage is essential.
57
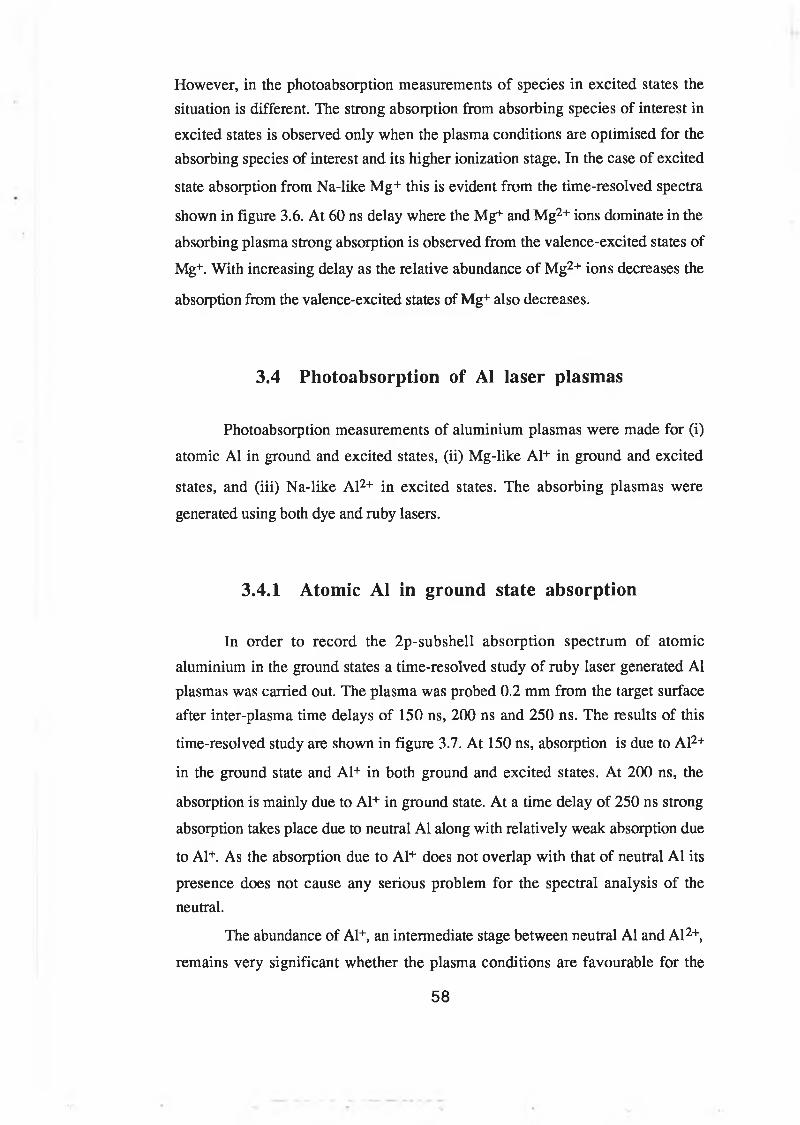
However, in the photoabsorption measurements of species in excited states the situation is different. The strong absorption from absorbing species of interest in
excited states is observed only when the plasma conditions are optimised for the absorbing species of interest and its higher ionization stage. In the case of excited
state absorption from Na-like Mg+ this is evident from the time-resolved spectra
shown in figure 3.6. At 60 ns delay where the Mg+ and Mg2+ ions dominate in the
absorbing plasma strong absorption is observed from the valence-excited states of
Mg+. With increasing delay as the relative abundance of Mg2+ ions decreases the
absorption from the valence-excited states of Mg+ also decreases.
3.4 Photoabsorption of A1 laser plasmas
Photoabsorption measurements of aluminium plasmas were made for (i)
atomic A1 in ground and excited states, (ii) Mg-like Al+ in ground and excited
states, and (iii) Na-like Al2+ in excited states. The absorbing plasmas were
generated using both dye and ruby lasers.
3.4.1 Atomic A1 in ground state absorption
In order to record the 2p-subshell absorption spectrum of atomic
aluminium in the ground states a time-resolved study of ruby laser generated A1 plasmas was carried out. The plasma was probed 0.2 mm from the target surface after inter-plasma time delays of 150 ns, 200 ns and 250 ns. The results of this
time-resolved study are shown in figure 3.7. At 150 ns, absorption is due to Al2+
in the ground state and A1+ in both ground and excited states. At 200 ns, the
absorption is mainly due to A1+ in ground state. At a time delay of 250 ns strong
absorption takes place due to neutral A1 along with relatively weak absorption due
to Al+. As the absorption due to Al+ does not overlap with that of neutral A1 its
presence does not cause any serious problem for the spectral analysis of the neutral.
The abundance of Al+, an intermediate stage between neutral A1 and Al2+,
remains very significant whether the plasma conditions are favourable for the
58
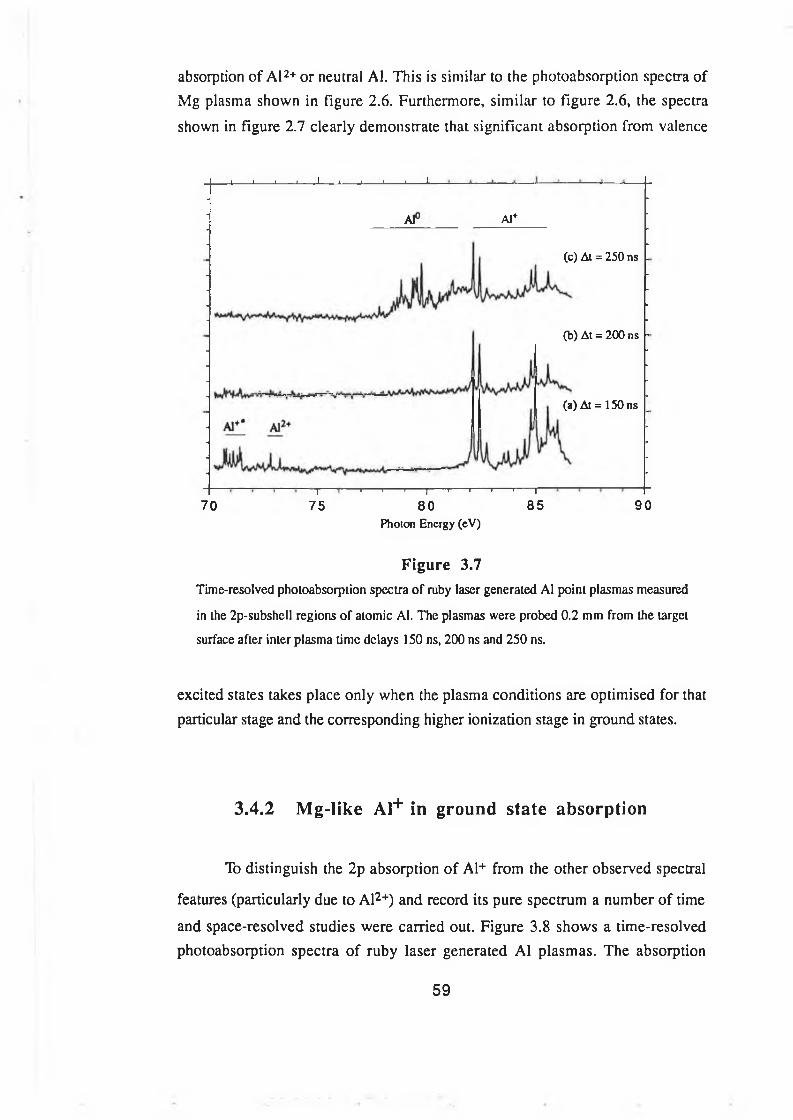
absorption of Al2+ or neutral Al. This is similar to the photoabsorption spectra of Mg plasma shown in figure 2.6. Furthermore, similar to figure 2.6, the spectra
shown in figure 2.7 clearly demonstrate that significant absorption from valence
-JU —1---------J-------- JL_ _l I I 1 I _JL_
Al Al+
(c) At = 250 ns
(b) At = 200 ns
(a) At = 150 ns
70T
75-f |-- I |------1------!------1------1------ [“
80 85Photon Energy (eV)
90
Figure 3.7Tim e-resolved photoabsorption spectra o f ruby laser generated A1 point plasm as measured
in the 2p-subshell regions o f atom ic A l. The plasm as w ere probed 0 .2 mm from the target
surface after inter plasm a lim e delays 1 5 0 ns, 2 0 0 ns and 2 5 0 ns.
excited states takes place only when the plasma conditions are optimised for that particular stage and the corresponding higher ionization stage in ground states.
3.4.2 M g-like Al+ in ground state absorption
To distinguish the 2p absorption of Al+ from the other observed spectral
features (particularly due to Al2+) and record its pure spectrum a number of time
and space-resolved studies were carried out. Figure 3.8 shows a time-resolved photoabsorption spectra of ruby laser generated Al plasmas. The absorption
59
measurements were made at inter-plasma time delays of 80 ns, 110 ns, 150 ns, 180 ns and 220 ns, and the plasma was probed 1.2 mm from the target surface.
(0 At = 200 ns
(e) At = 220 ns
(d) At = 180 ns
(c) At = 150 ns
(b) At = 110 ns
(a) At = 80 ns
80 85 90Photon Energy (eV)
95 100
Figure 3.8Tim e-resolved photoabsorption spectra o f ruby laser generated Al plasm as recorded in the
2p-subshell region o f M g-like A l+ in ground state. In figures (a ) - (e ) the plasm as w ere
probed 1.2 mm from the target surface after inter plasm a delays o f 8 0 ns, 1 1 0 ns, 150 ns,
180 ns and 2 2 0 ns. In figure ( 0 it w as probed at 0 .1 5 m m from the target su rface after
inter-plasma delay o f 2 0 0 ns.
At a time delay of 80 ns, the absorption is due to Al+ and Al2+ but is
dominated by Al2+ absorption. In moving from 80 ns to 220 ns as the relatively
fast moving Al2+ ions leave the region probed by XUV radiation and more slowly
moving Al+ ions arrive in this region the relative absorption due to Al+ increases.
Consequently, at higher delays these ions become almost time-resolved in this
region. At 220 ns only the strongest features of Al2+ are observed. In an other
experiment (figure 3.8f) where the Al plasma, generated under the same conditions
of laser-irradiance and focusing, was probed at a distance of 0.15 mm from the
target surface after an inter-plasma time delay of 200 ns the Al+ and Al2+ ions
60
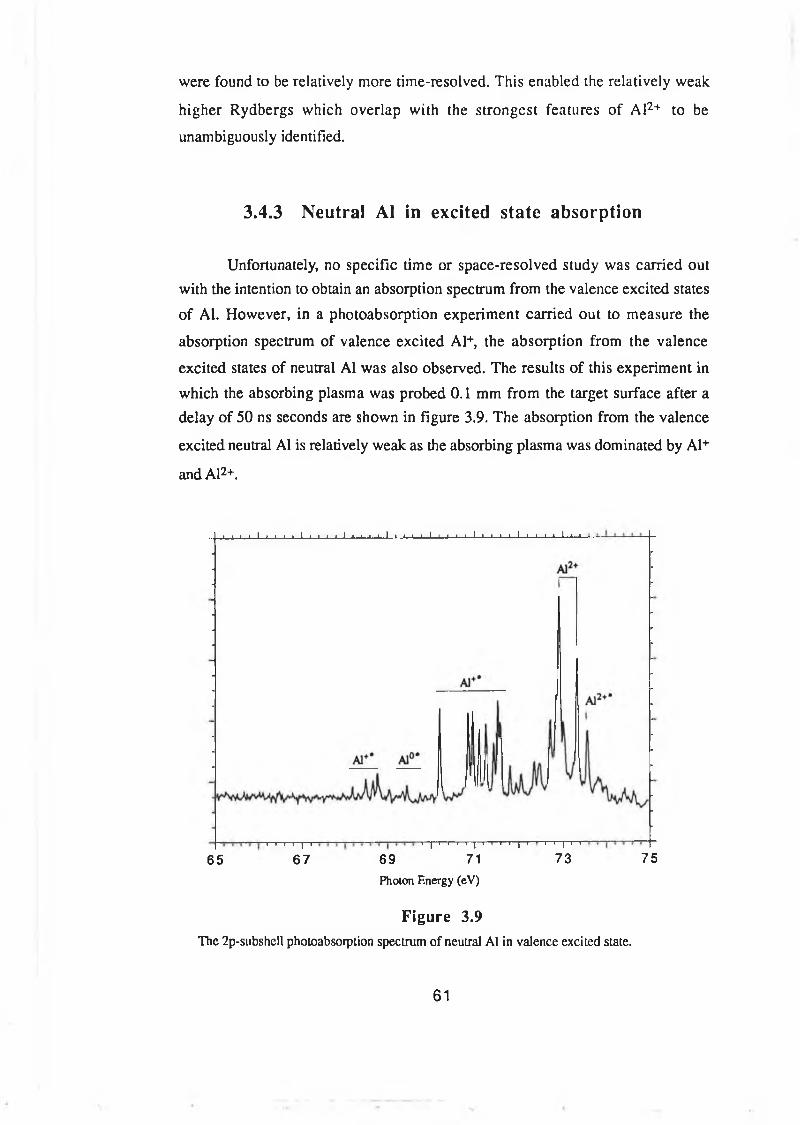
were found to be relatively more time-resolved. This enabled the relatively weak
higher Rydbergs which overlap with the strongest features of Al2+ to be
unambiguously identified.
3.4.3 Neutral A1 in excited state absorption
Unfortunately, no specific time or space-resolved study was carried out with the intention to obtain an absorption spectrum from the valence excited states
of Al. However, in a photoabsorption experiment carried out to measure the
absorption spectrum of valence excited Al+, the absorption from the valence
excited states of neutral Al was also observed. The results of this experiment in
which the absorbing plasma was probed 0.1 mm from the target surface after a delay of 50 ns seconds are shown in figure 3.9. The absorption from the valence
excited neutral Al is relatively weak as the absorbing plasma was dominated by Al+
and Al2+.
■ i i t i * ■ i i i i i i i i— i— i— i— i— i— i— i — i— i— i— *— »— i— i— i— i— i— i— i— i — *— i— i 1— i — i— 1
t—i—r—i—|—i 1 -|—i—<-. i I ' ' i ■ I i7 1
t—i—|—i—r
6 5 6 7 6 9 7 3 75Photon Energy (eV)
Figure 3.9The 2p-subshell photoabsorption spectrum o f neutral A l in valen ce excited state.
61
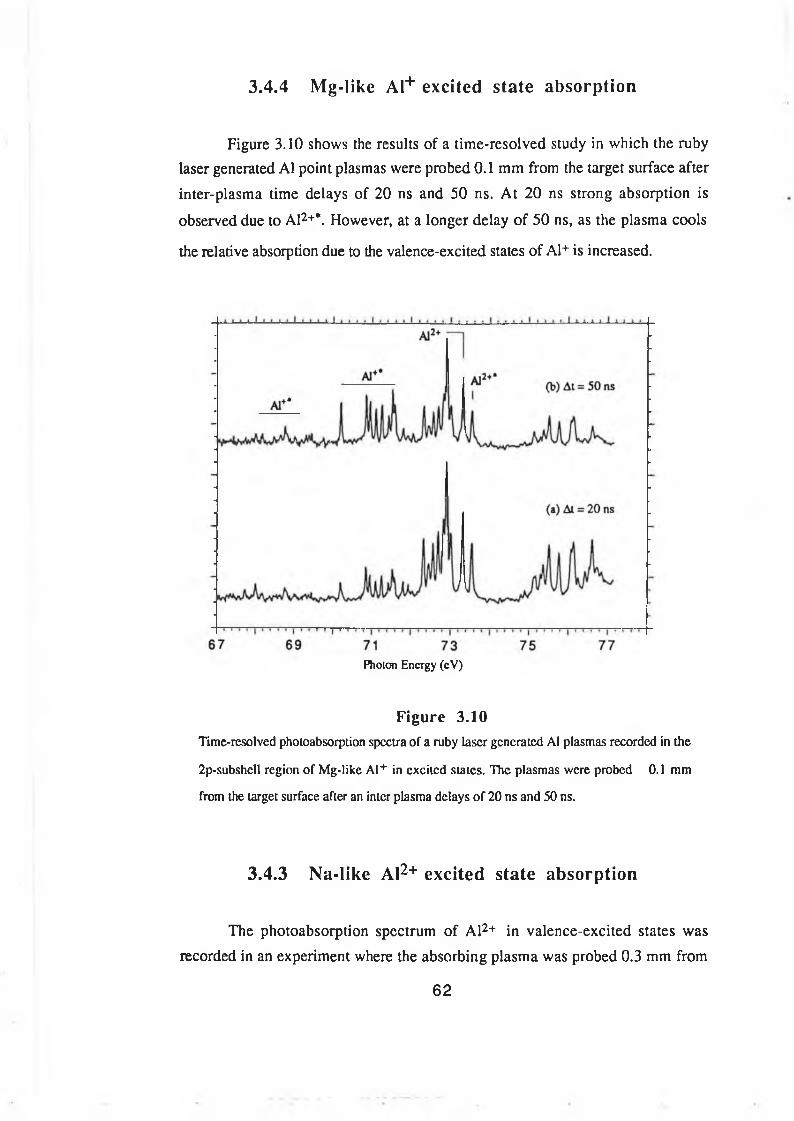
3.4.4 Mg-like Al+ excited state absorption
Figure 3.10 shows the results of a time-resolved study in which the ruby laser generated A1 point plasmas were probed 0.1 mm from the target surface after
inter-plasma time delays of 20 ns and 50 ns. At 20 ns strong absorption is
observed due to Al2+*. However, at a longer delay of 50 ns, as the plasma cools
the relative absorption due to the valence-excited states of Al+ is increased.
Photon Energy (eV)
Figure 3.10Tim e-resolved photoabsorplion spectra o f a ruby laser generated A1 plasm as recorded in the
2p-subshell region o f M g-like A l+ in excited states. T h e plasm as w ere probed 0 .1 mm
from the target surface after an inter plasm a delays o f 2 0 ns and 5 0 ns.
3.4.3 Na-like Al2+ excited state absorption
The photoabsorption spectrum of Al2+ in valence-excited states was
recorded in an experiment where the absorbing plasma was probed 0.3 mm from
62
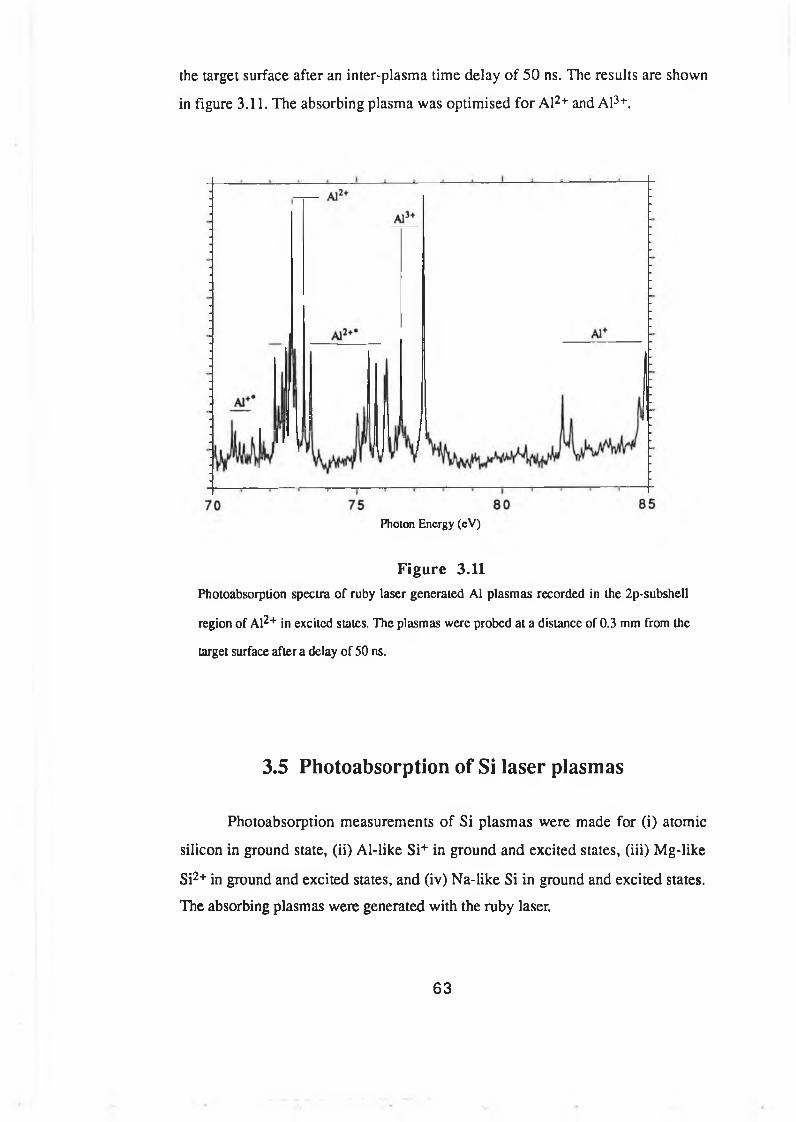
the target surface after an inter-plasma time delay of 50 ns. The results are shown
in figure 3.11. The absorbing plasma was optimised for Al2+ and Al3+.
Photon Energy (eV)
Figure 3.11Photoabsorption spectra o f ruby laser generated A1 p lasm as recorded in the 2p-subshell
region o f A l2 + in excited states. T he plasm as w ere probed at a distance o f 0 .3 mm from the
target surface after a delay o f 5 0 ns.
3.5 Photoabsorption of Si laser plasmas
Photoabsorption measurements of Si plasmas were made for (i) atomic
silicon in ground state, (ii) Al-like Si+ in ground and excited states, (iii) Mg-like
Si2+ in ground and excited states, and (iv) Na-like Si in ground and excited states.
The absorbing plasmas were generated with the ruby laser.
63
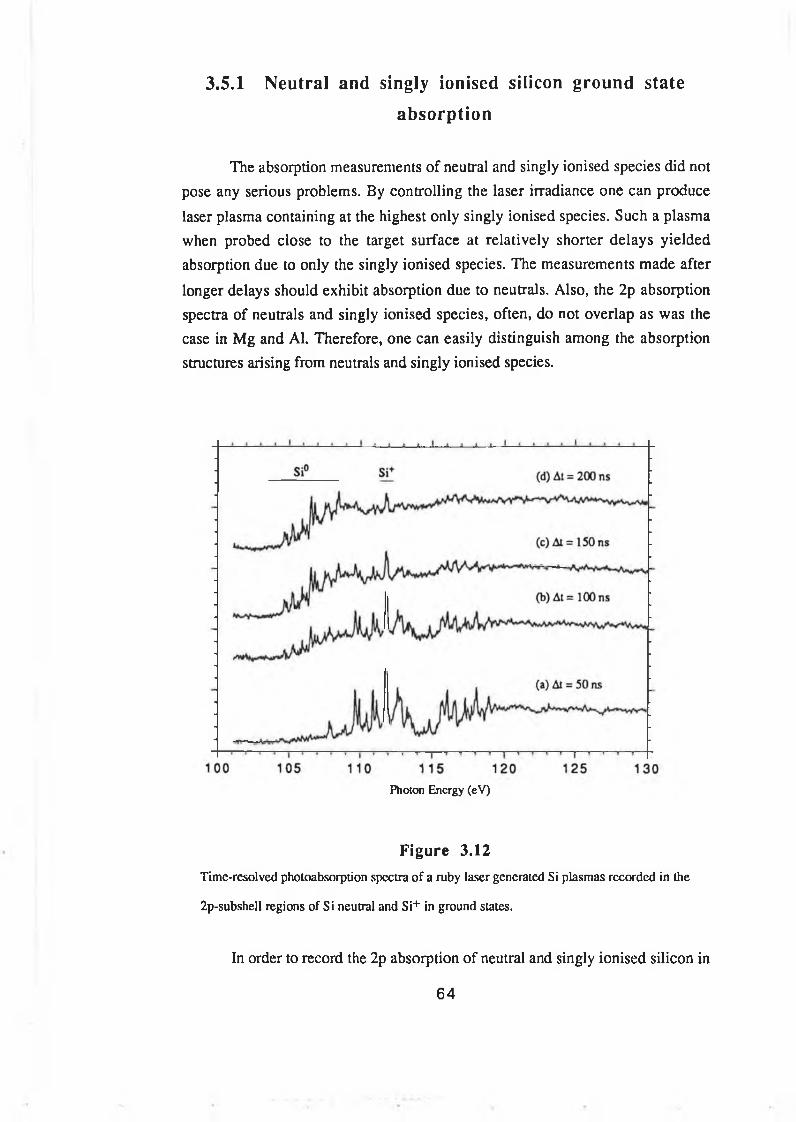
3.5.1 Neutral and singly ionised silicon ground state
absorption
The absorption measurements of neutral and singly ionised species did not pose any serious problems. By controlling the laser irradiance one can produce
laser plasma containing at the highest only singly ionised species. Such a plasma when probed close to the target surface at relatively shorter delays yielded absorption due to only the singly ionised species. The measurements made after
longer delays should exhibit absorption due to neutrals. Also, the 2p absorption spectra of neutrals and singly ionised species, often, do not overlap as was the case in Mg and Al. Therefore, one can easily distinguish among the absorption structures arising from neutrals and singly ionised species.
Photon Energy (eV)
Figure 3.12
Tim e-resolved photoabsorption spectra o f a ruby laser generated Si plasm as recorded in the
2p-subshell regions o f Si neutral and Si+ in ground slates.
In order to record the 2p absorption of neutral and singly ionised silicon in
64
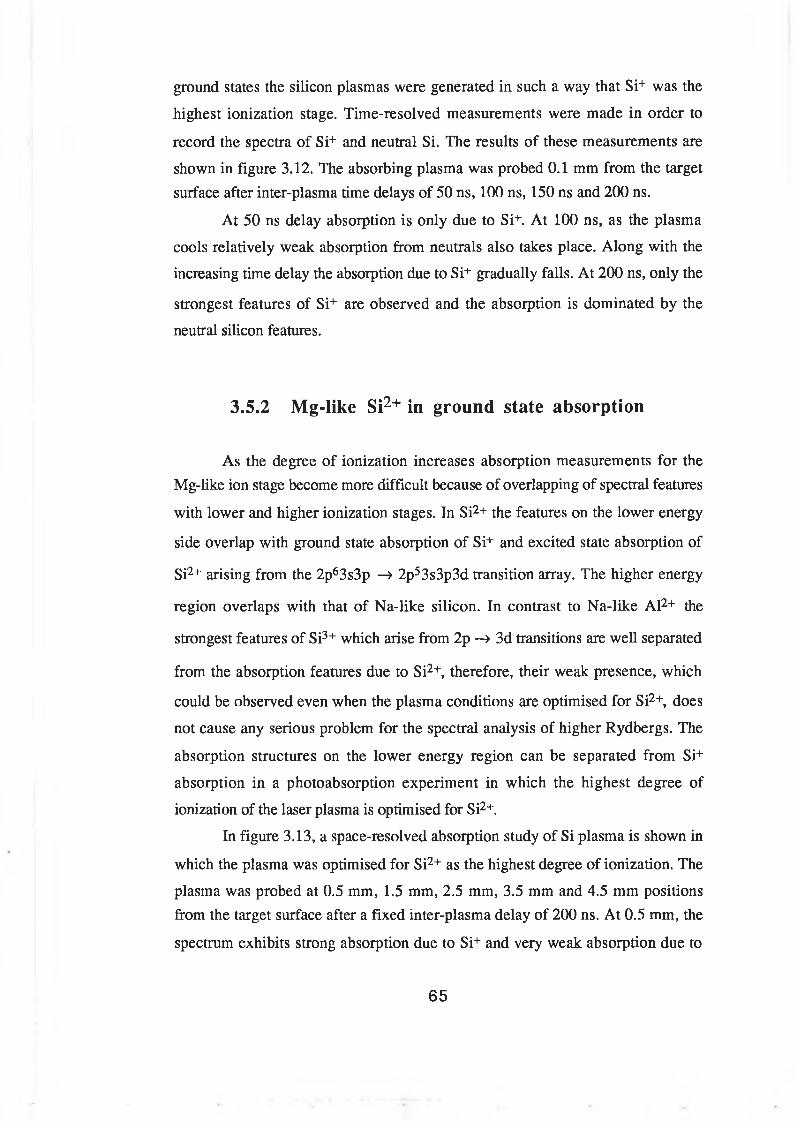
ground states the silicon plasmas were generated in such a way that Si+ was the
highest ionization stage. Time-resolved measurements were made in order to
record the spectra of Si+ and neutral Si. The results of these measurements are
shown in figure 3.12. The absorbing plasma was probed 0.1 mm from the target surface after inter-plasma time delays of 50 ns, 100 ns, 150 ns and 200 ns.
At 50 ns delay absorption is only due to Si+. At 100 ns, as the plasma
cools relatively weak absorption from neutrals also takes place. Along with the
increasing time delay the absorption due to Si+ gradually falls. At 200 ns, only the
strongest features of Si+ are observed and the absorption is dominated by the
neutral silicon features.
3.5.2 Mg-like Si2+ in ground state absorption
As the degree of ionization increases absorption measurements for the Mg-like ion stage become more difficult because of overlapping of spectral features
with lower and higher ionization stages. In Si2+ the features on the lower energy
side overlap with ground state absorption of Si+ and excited state absorption of
Si2+ arising from the 2p63s3p —> 2p53s3p3d transition array. The higher energy
region overlaps with that of Na-like silicon. In contrast to Na-like Al2+ the
strongest features of Si3+ which arise from 2p —» 3d transitions are well separated
from the absorption features due to Si2+, therefore, their weak presence, which
could be observed even when the plasma conditions are optimised for Si2+, does
not cause any serious problem for the spectral analysis of higher Rydbergs. The
absorption structures on the lower energy region can be separated from Si+
absorption in a photoabsorption experiment in which the highest degree of
ionization of the laser plasma is optimised for Si2+.
In figure 3.13, a space-resolved absorption study of Si plasma is shown in
which the plasma was optimised for Si2+ as the highest degree of ionization. The
plasma was probed at 0.5 mm, 1.5 mm, 2.5 mm, 3.5 mm and 4.5 mm positions from the target surface after a fixed inter-plasma delay of 200 ns. At 0.5 mm, the
spectrum exhibits strong absorption due to Si+ and very weak absorption due to
65
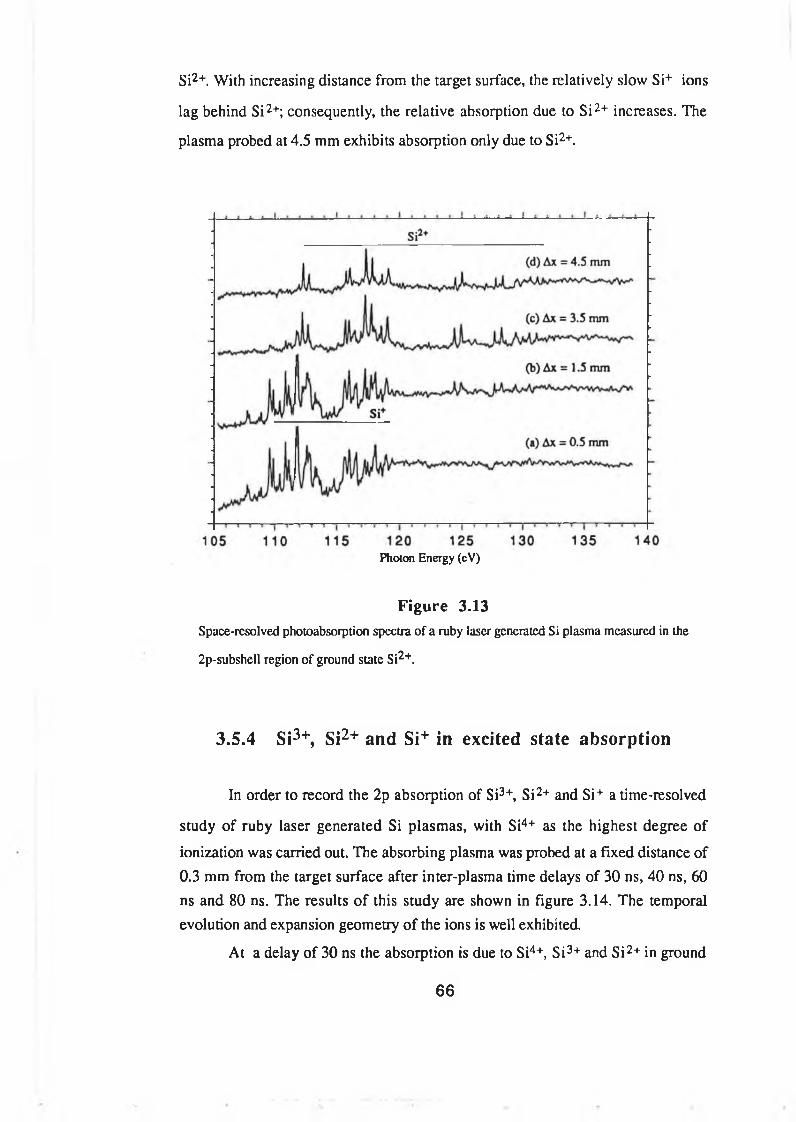
Si2+. With increasing distance from the target surface, the relatively slow Si+ ions
lag behind Si2+; consequently, the relative absorption due to Si2+ increases. The
plasma probed at 4.5 mm exhibits absorption only due to Si2+.
Photon Energy (eV)
Figure 3.13Space-resolved photoabsorption spectra o f a ruby laser generated Si plasm a m easured in the
2p-subshell region o f ground state Si2 + .
3.5.4 Si3+, Si2+ and Si+ in excited state absorption
In order to record the 2p absorption of Si3+, Si2+ and Si+ a time-resolved
study of ruby laser generated Si plasmas, with Si4+ as the highest degree of
ionization was carried out. The absorbing plasma was probed at a fixed distance of 0.3 mm from the target surface after inter-plasma time delays of 30 ns, 40 ns, 60 ns and 80 ns. The results of this study are shown in figure 3.14. The temporal evolution and expansion geometry of the ions is well exhibited.
At a delay of 30 ns the absorption is due to Si4+, Si3+ and Si2+ in ground
66
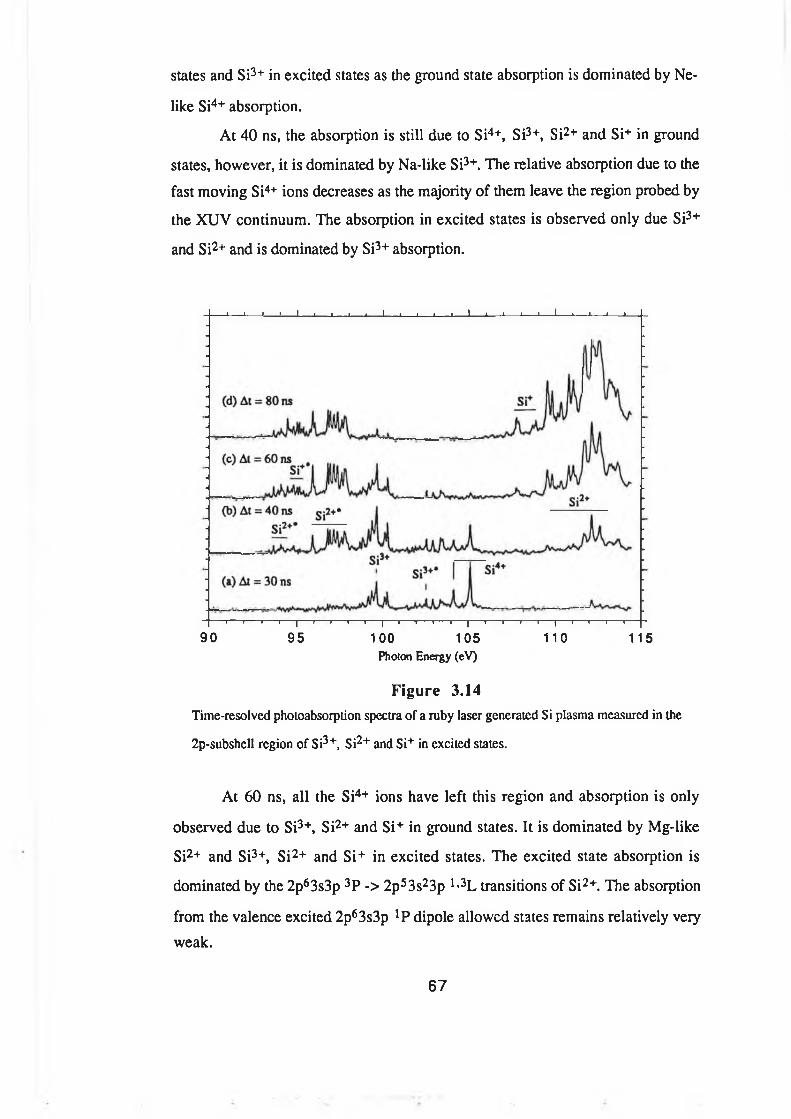
states and Si3+ in excited states as the ground state absorption is dominated by Ne-
like Si4+ absorption.
At 40 ns, the absorption is still due to Si4+, Si3+, Si2+ and Si+ in ground
states, however, it is dominated by Na-like Si3+. The relative absorption due to the
fast moving Si4+ ions decreases as the majority of them leave the region probed by
the XUV continuum. The absorption in excited states is observed only due Si3+
and Si2+ and is dominated by Si3+ absorption.
« « i « I i i i « 1 « i i > I » » i « I «___i i i
j » 1 1 1 1 « 1 1 1 1 1 i i 1 1 1 1 r — i 1 1 1 1 1 ■
90 95 100 105 110 1 15Photon Energy (eV)
Figure 3.14Time-resolved pholoabsorption spectra of a ruby laser generated Si plasma measured in the
2p-subshell region of Si3“*', Si2+ and Si+ in excited states.
At 60 ns, all the Si4+ ions have left this region and absorption is only
observed due to Si3+, Si2+ and Si+ in ground states. It is dominated by Mg-like
Si2+ and Si3+, Si2+ and Si+ in excited states. The excited state absorption is
dominated by the 2p63s3p 3P -> 2p53s23p li3L transitions of Si2+. The absorption
from the valence excited 2p63s3p !P dipole allowed states remains relatively very
weak.
67
At 80 ns, the absorption is due to Si3+, Si2+ and Si+ in ground states and is
dominated by Si2+ and Si+. The weak absorption observed due to Si3+ shows that
they are slower than Si4+. The valence excited absorption is observed in Si2+ and
Si+.
3.6 Conclusions
The way time- and space-resolved studies of laser plasmas help us to distinguish the absorption features arising from different species is demonstrated. These studies show that in the case of ground state absorption by probing the
plasma close to the target surface just after the end of the laser pulse almost pure spectra of the ion stage of interest can be obtained when the highest degree of ionization in the plasma is equal to the ion stage of interest. If the degree of ionization is higher a relatively longer delay is required. However, in the case of excited states the strong absorption from species of interest can be obtained only when the plasma conditions are optimised for the absorbing species of interest and its higher ionization stage.
68
3.7 References
Brilly J, 1990, Ph.D. thesis, Dublin City University, unpublished.
Brilly J, Kennedy E T and Mosnier J P, 1990, Physica Scripta, 41, 30.
Callcott T A, Tsang K-L and Zhang C H, 1988, Nucl. Instrum. Methods, A262,
578.
Cantu A M, Tozzi G P and Spector N, 1982, J. Opt. Soc. Am., 7 2, 729.
Carroll P K and Kennedy E T, 1977, Phys. Rev. Lett., 3 8, 1068.
Carroll P K and Costello J T, 1986, Phys. Rev. Lett., 5 7, 1581.
Colombant D and Tonon G F, 1973, J. Appl. Phys., 4 4, 8.
Cromer C L, Brigdes T M, Robert T R and Lucatorto T B, 1985, Appl. opt., 2 4,
2996.
Dave D, 1991, M.Sc. thesis, Dublin City University, unpublished.
Hopkins R B, 1992, M.Sc. thesis, Dublin City University, unpublished.
Jannitti E, Nicolosi P and Tondello G, 1979, Optics Letters, 4, 187.
Kelly RP, 1987, J. Phys. Chem. Ref. Data, 16, Supp. 1.
Kiernan L, 1994, Ph.D. thesis, Dublin City University, unpublished.Samson J A, 1967, 'Techniques o f Vacuum Ultraviolet Spectroscopy.” , (Wiley &
Sons).
Schwob J L, Wouter A W and Suckewer S, 1987, Rev. Sci. Instrum., 5 8, 1601.
Brilly J, Kennedy E T and Mosnier J P, 1988, J. Phys. B, 21, 368.
69

Shaw M, 1994, M.Sc. thesis, Dublin City University, unpublished.
Tondello G, 1979, Optica Acta, 26, 357.
Wize J L, 1979, Nucl. Instrum. Methods, 162, 587.
70
Chapter 4
MAGNESIUM ISO ELECTRO N IC SEQUENCE IN GROUND STATE ABSORPTION
Photoabsorption in vestigation s o f isoelectron ic sp ecies M g , A l+ and S i2 + in their
ground states have been carried out in their 2p-subshell reg ion s. T h e effects o f configuration-
interactions on the relative distribution o f g f-valu es and term en ergies both in the ground and
excited states have been exam ined in detail for A l+ and Si2 + . A revised term analysis is given for
Al+ and a com plete assignm ent o f the S i2 + spectrum is given for the first tim e. General features
o f the spectra are discussed and a com parison is m ade with the corresponding valence-shell spectra.
4.1 Previous work
2p-subshell excitation/ionization along the Mg isoelectronic sequence in the ground state continues to be the subject of both theoretical and experimental studies. Atomic magnesium, because of its rather simple structure (Kämmerling et al. 1992) and dynamics (Hausmann et al. 1988, Whitfield et al. 1991), has been an ideal candidate for 2p photoionization studies. The 2p-subshell excitation/ionization of neutral magnesium has been studied experimentally using a
variety of techniques. The resonance structures were measured in photoabsorption experiments by Newsom (1971), Esteva and Mehlman (1974) and Ederer etal. (1979). Detailed term analyses have been made on the basis of quantum defect
(Newsom 1971) and multiconfiguration atomic structure calculations (Mansfield and Connerade 1972, Esteva and Mehlman 1974). Experimental photoionization studies were carried out by Hausmann et al. (1988) and Kämmerling et al. (1992). Decay of the autoionizing states has been the subject of ejected-electron (Pegg et al. 1975, Pejcev et al. 1977), electron-impact (Breuckmann et al. 1976) and photoemission (Whitfield etal. 1991) studies.
Photoionization of atomic Mg has been studied using different theoretical
approaches. Using the relativistic random-phase approximation (RRPA),
71
Deshmukh and Manson (1983) performed cross section calculations covering the energy region from the 3s threshold to 270 eV but included only the
single-electron resonances due to the 2s -> np ( n > 6) and 2p -> nd (ms) (n > 8, m
> 10) excitations. Using the many-body perturbation theory (MBPT), Altun (1989) carried out detailed calculations of the photoionization cross section of magnesium for photon energies ranging from the 3s threshold to 300 eV. In these
calculations he included both 2s -> np (n > 3), 2p -> nd (ms) (n ^ 3, m > 4)
single-electron resonances and 3s2 -> 3pnd (ms) (n > 3, m > 4) double-electron
resonances.Inner-shell ionization studies of Mg-like ions have been carried out in
connection with their importance in laboratory and astrophysical plasmas where
ionization takes place through direct and indirect processes. In the direct-ionization process either a valence electron or any of the inner-shell electrons are knocked out from the ion by photon or electron-impact. The indirect-ionization proceeds through the excitation of an inner-shell electron followed by autoionization. These excitation-autoionization processes have recently been of great interest both in photoionization (Peart et al. 1989) and electron-impact (Howald et al. 1986) studies as they result in the dramatic enhancement of ionization cross sections.
Absolute electron-impact ionization cross sections for the Mg-like ions S4+, Cl5+,
and Ar6* were measured in a crossed-beam experiment from threshold to 1500 eV
by Howald et al. (1986). The relative magnitude of the indirect ionization process
was found to be increased dramatically in comparison with the direct process along the sequence. Excitation-autoionization contributions to the electron-impact
ionization of the Mg-like ions S4+, Cl5+, and Ar6* were calculated in the distorted- wave approximation by Pindzola et al. (1986). The calculated cross sections were
in very good agreement with the experimental measurements of Howald et al.(1986). Using the R-matrix method Tayyal and Henry (1986) carried out
calculations for Mg-like ions A1+, S4+, Cl5+ and Ar6+. The ground 3s2 JS state
together with the autoionizing states arising from the 2p53s23p, 2p53s23d,
2p53s24s, 2s2p63s23p, 2s2p63s23d, and 2s2p63s24s configurations were included
in the R-matrix expansion. In the case of A1+ a comparison was made with the
experimental data of Montague and Harrison (1983). The calculated cross sections
for S4+, Cl5+ and Ar6* were compared with the crossed-beam experimental data of
72
Howald et al. (1986). Although the 2p53s3p2 configuration, which is strongly
mixed with the 2p53s23d configuration, was not included in the calculations even
then the calculated and measured cross sections were in excellent agreement. In
both calculations the largest contributions predicted were due to the 2p -> 3p
monopole and 2p -> 3d dipole excitations.
Theoretical investigations of the electron-correlations involving the valence shells in the magnesium sequence are numerous. The two-electron excitations,
both below and above the first ionization limits, which lead to resonances and series perturbers are of great interest in computation (Chang 1986a, 1986b, 1987).
A theoretical study of the 2p63s2 *S 2p6[3p(n+l)s + 3pnd, n > 3] *P doubly
excited states, which lie above the first-ionization threshold of magnesium, has
been reported by Chang (1986b). Good agreement was found between the experimental and calculated energy values of these doubly excited states. The importance of the configuration-interaction between the doubly excited perturber
and the singly excited 2p63snl series has been examined quantitatively using
superposition of configuration calculations (Chang 1986a). The entire 3snd series was found perturbed by the 3pn(>3)p configuration series. In particular the entire
3snd series was shifted due to the strong interaction with the 3p2 configuration.
The effects of configuration-interaction on the term values and oscillator strengths
of the 2p63snl !L singly excited states of the Mg atom below the first-ionization
threshold have also been examined in detail by Chang (1987). A theoretical study
of configuration-interaction between bound singly excited (3snl) li3L and doubly
excited (n1l1, n2l2)1,3L states below the first ionization threshold of the Mg-like
ions A1+ and Si2+ has been published by Chang and Wang (1987). The study
viewed the problem from the perspective of the doubly excited state as the
perturber of each one electron Rydberg series 3s2 -* 3snl. The effect of each
doubly excited state on term energies and gf values for each Rydberg member was examined in detail. Recently Chang and Wang (1991) have extended their study on the effect of configuration-interaction to the energy levels, the oscillator strengths
and the radiative lifetimes of the bound excited states to the Mg-like ions P3+ and
S4+. The Al+ and Si2+ ions were also included in this study. O ’Mahony (1985)
using a combination of R-matrix and hyperspherical coordinate techniques studied
the effects of electron correlation in atomic valence-shells. The 2p63snd-2p63p2
73
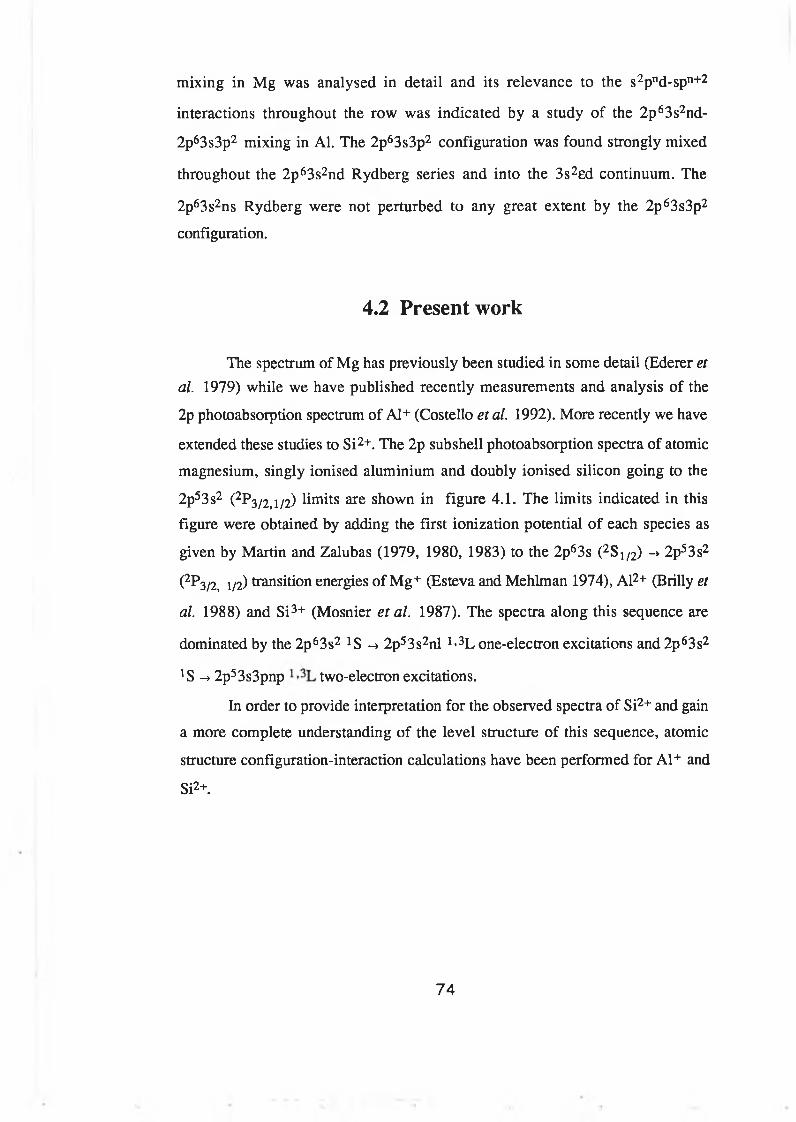
mixing in Mg was analysed in detail and its relevance to the s2pnd-spn+2
interactions throughout the row was indicated by a study of the 2p63s2nd-
2p63s3p2 mixing in Al. The 2p63s3p2 configuration was found strongly mixed
throughout the 2p63s2nd Rydberg series and into the 3s2ed continuum. The
2p63s2ns Rydberg were not perturbed to any great extent by the 2p63s3p2
configuration.
4.2 Present work
The spectrum of Mg has previously been studied in some detail (Ederer et al. 1979) while we have published recently measurements and analysis of the
2p photoabsorption spectrum of A1+ (Costello et al. 1992). More recently we have
extended these studies to Si2+. The 2p subshell photoabsorption spectra of atomic
magnesium, singly ionised aluminium and doubly ionised silicon going to the
2p53s2 (2P3/2,i/2) limits are shown in figure 4.1. The limits indicated in this figure were obtained by adding the first ionization potential of each species as
given by Martin and Zalubas (1979, 1980, 1983) to the 2p63s (2S1/2) -» 2p53s2
(2P3/2 . 1/2) transition energies of Mg+ (Esteva and Mehlman 1974), Al2+ (Brilly et
al. 1988) and Si3+ (Mosnier et al. 1987). The spectra along this sequence are
dominated by the2p63s2 JS -> 2p53s2nl 1-3L one-electron excitations and 2p63s2
XS -> 2p53s3pnp two-electron excitations.
In order to provide interpretation for the observed spectra of Si2+ and gain
a more complete understanding of the level structure of this sequence, atomic
structure configuration-interaction calculations have been performed for Al+ and
Si2+.
74
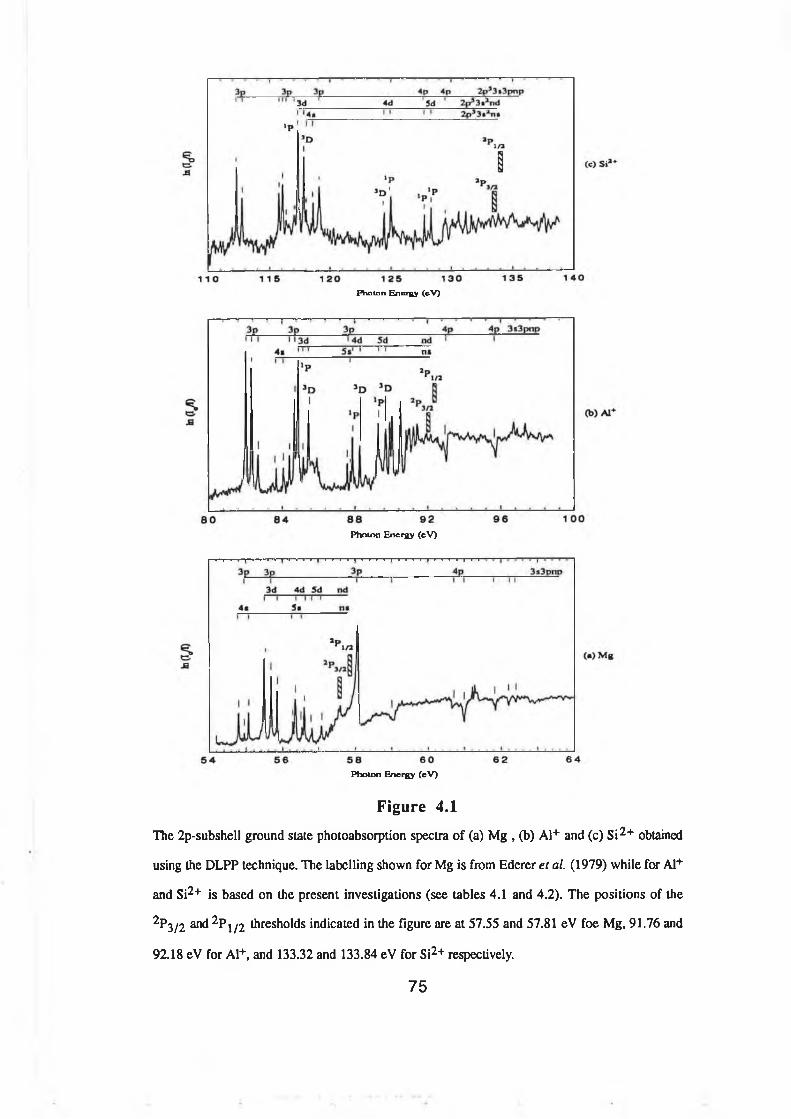
P h o to n E n e r g y ( c V )
Photon E nergy (eV )
Photon E nergy (eV )
Figure 4.1
T he 2p-subshell ground state photoabsorption spectra o f (a ) M g , (b) A l+ and (c ) S i2 + obtained
using the D L P P technique. T he labelling shown for M g is from E d erer et al. (1 9 7 9 ) while for Al+
and Si2 + is based on the present investigations (see tables 4 .1 and 4 .2 ) . T h e p osition s o f the
2 P 3 / 2 and 2 P i / 2 thresholds indicated in the figure are at 5 7 .5 5 and 5 7 .8 1 eV foe M g, 9 1 .7 6 and
9 2 .1 8 eV for A l+ , and 1 3 3 .3 2 and 1 3 3 .8 4 eV for Si2 + respectively.
75
4.3 Effects of Cl on the ground and excited states
The effects of configuration-interaction (Cl) both on the ground and excited
states have been examined in detail for A1+ and Si2+. A qualitative comparison with
the experimental results is also provided. The effects of configuration-interaction
on the term energies and oscillator strength of excited states will be discussed in section 4.3.1 while the role of electron correlations in the ground state will be assessed in section 4.3.2.
4.3.1 C l effects on the excited states
In order to investigate the configuration-interaction (Cl) effects on the excited states a series of scaled atomic structure calculations were performed with a fixed basis states expansion for the ground states while adding successively the
odd parity configurations to the excited states expansion including only the Rydberg series members. Throughout this study the computed and observed relative transition energies and oscillator strengths were compared as each new
configuration was addedFirst of all, the calculated level structure obtained for the unperturbed
Rydberg series members, referred to as SA, is discussed then the effects of the
2p53s3p2 and 2p53s3p4p the doubly excited perturbers are investigated. Finally
the effects of the 2s2p63s23p, 2p63s3p and 2p63p3d configurations, which
account for the core-valence interactions, are examined on the energies and
oscillator strengths of both the Rydberg series members and the doubly excited states. The results of these scaled calculations, where the direct and exchange integrals were reduced by 20%, configuration-interaction integrals by 30% and
spin orbit integrals by 10%, are shown in figure 4.2 both for A1+ and Si2+. In this
figure the gf-values have been plotted against the calculated term energies for each expansion.
SA = 2p6(3s2+3p2) —» 2ps 3 s2(n+l)s + 2ps 3 s2nd, [n = 3,..10]
Apart from overestimating the transition energies by < 0.3 eV, this
76
expansion provides a reasonable fit to the 2p -> nl, ( n > 4) Rydberg series. It also clearly demonstrates that some of the strongest features in this spectrum must arise
from multiply excited transitions and hence correlation effects play a major role in
Al+ and Si2+ just as they do in Mg.
The relative positions and intensities of *P and 3D terms, belonging to the
3d (lines 4 and 5), 4d (lines 7 and 8) and 5d (lines 9 and 10) configurations in A1+,
predicted by these calculations are in accordance with the observed spectra (Figure
4.2a). In Si2+, the calculated positions of !P and 3D in 3d configuration (lines 3
and 4) are not in agreement with experiment (Figure 4.2b).
SB = SA + 2ps 3 s 3 p 2
The origin of the three prominent features, in the A1+ spectrum, in the
81.5 -> 83.0 eV range becomes clear as oscillator strength is transferred from the
2p -> 3d array to 2p -> 3s3p2 transitions leading to a substantial redistribution of
oscillator strength between these two arrays. Compared to the 3d ]P term more
oscillator strength is sucked from the 3d 3D term.
The inversion of !p and 3D (lines 3 and 4 respectively) as observed in the
Si2+ spectrum is also evident from expansion SB when compared with expansion
SA (Figure 4.2b). In the Si2+ spectrum the 3D term of the 3d configuration is
strongly perturbed by the 2p53s3p2 configuration and is pushed to higher
energy region while the TP term remains unperturbed in energy. In the case of
A1+, both the 'P and 3D are strongly perturbed in energy (Figure 4.2a SA and SB)
but their relative positions remain the same.
The 2p53s23d and 2p53s3p2 configurations were found strongly mixed
with each other both in A1+ and Si2+. On the other hand, no significant effect has
been seen on the higher Rydberg series members belonging to the nd series as well as the entire ns series.
77
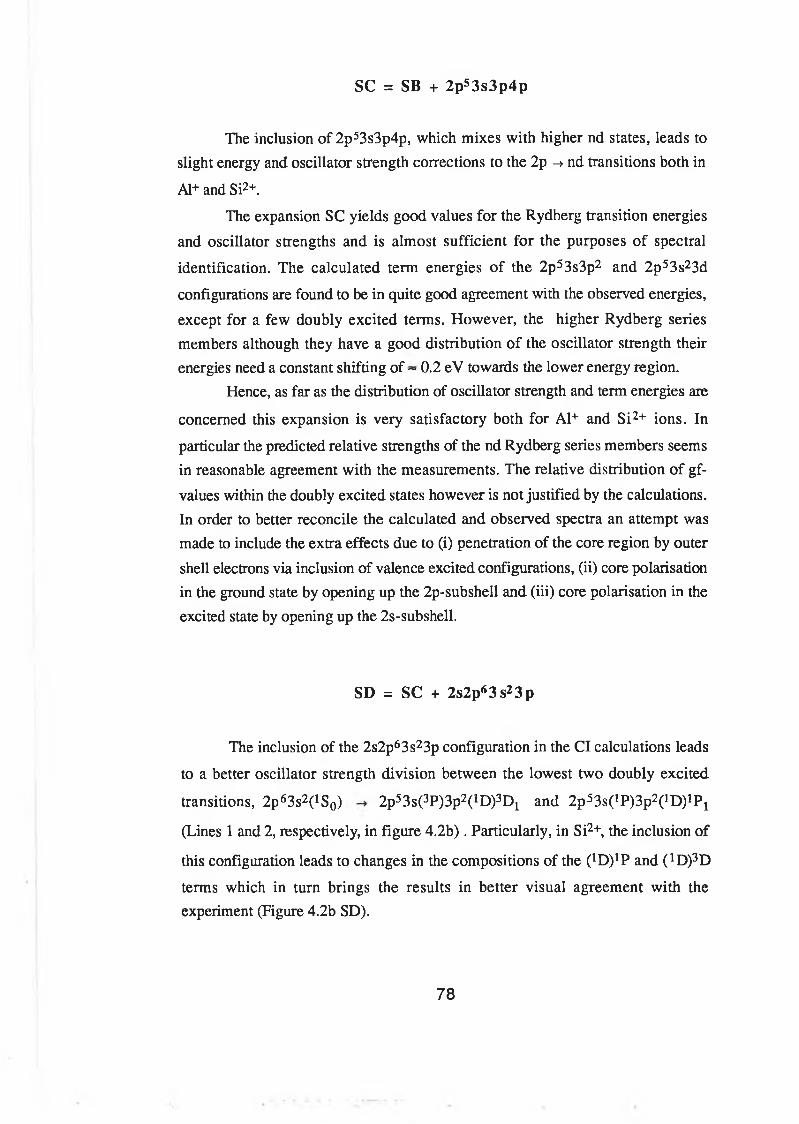
SC = SB + 2p53s3p4p
The inclusion of 2p53s3p4p, which mixes with higher nd states, leads to slight energy and oscillator strength corrections to the 2p -> nd transitions both in
Al+ and Si2+.
The expansion SC yields good values for the Rydberg transition energies
and oscillator strengths and is almost sufficient for the purposes of spectral
identification. The calculated term energies of the 2p53s3p2 and 2p53s23d
configurations are found to be in quite good agreement with the observed energies,
except for a few doubly excited terms. However, the higher Rydberg series members although they have a good distribution of the oscillator strength their energies need a constant shifting of ~ 0.2 eV towards the lower energy region.
Hence, as far as the distribution of oscillator strength and term energies are
concerned this expansion is very satisfactory both for Al+ and Si2+ ions. In
particular the predicted relative strengths of the nd Rydberg series members seems in reasonable agreement with the measurements. The relative distribution of gf-
values within the doubly excited states however is not justified by the calculations. In order to better reconcile the calculated and observed spectra an attempt was made to include the extra effects due to (i) penetration of the core region by outer
shell electrons via inclusion of valence excited configurations, (ii) core polarisation in the ground state by opening up the 2p-subshell and (iii) core polarisation in the excited state by opening up the 2s-subshell.
SD = SC + 2s2p6 3 s 23 p
The inclusion of the 2s2p63s23p configuration in the Cl calculations leads
to a better oscillator strength division between the lowest two doubly excited
transitions, 2p63s2(1S0) 2p53s(3P)3p2(1D)3D1 and 2p53s(1P)3p2(1D)iP1
(Lines 1 and 2, respectively, in figure 4 .2b). Particularly, in Si2+, the inclusion of
this configuration leads to changes in the compositions of the ^ D ^ P and ( !D)3D
terms which in turn brings the results in better visual agreement with the experiment (Figure 4.2b SD).
78
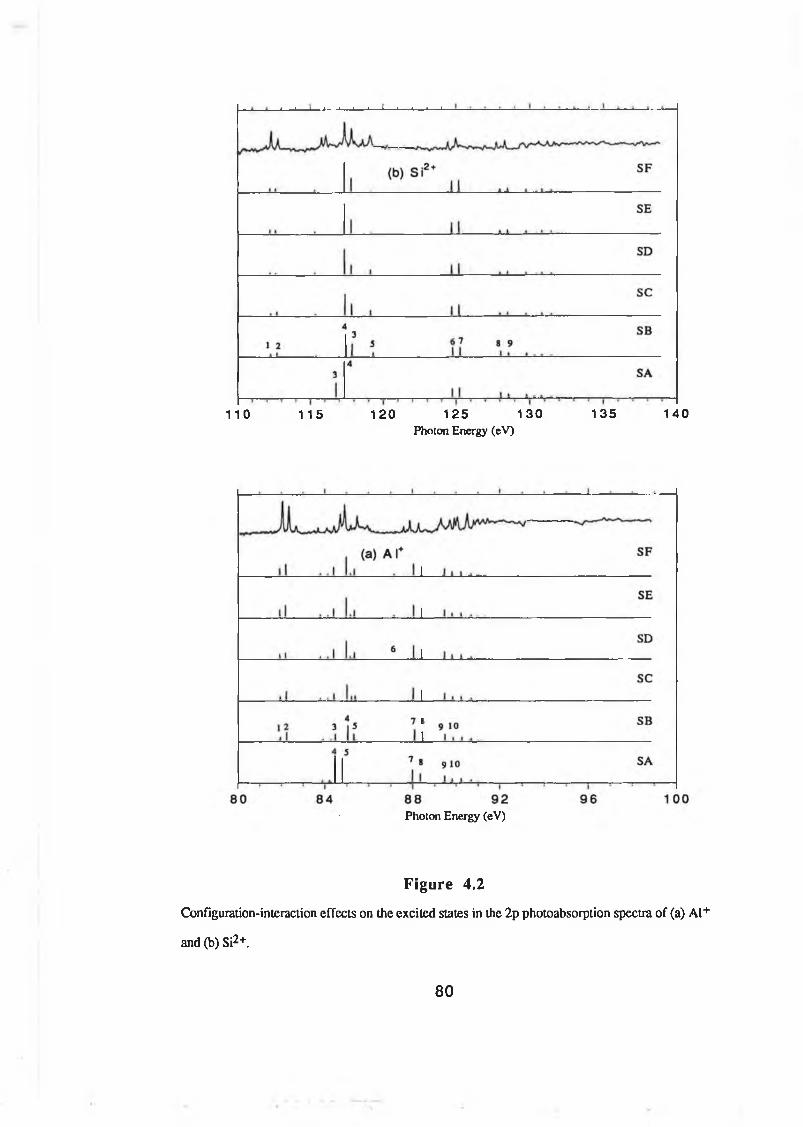
1 1 0 1 1 5 1 2 0 1 2 5 1 3 0Photon Energy (eV)
1 3 5 1 4 0
Photon Energy (eV)
Figure 4.2
Configuration-interaction effects on the excited states in the 2p photoabsorption spectra o f (a ) A l+
and (b ) Si2 + .
8 0
4.3.2 Cl effects on the ground state
The ground state of the magnesium sequence shows strong electron- correlation effects (Robb 1974). Recently the electron-correlations in the ground
state of Mg-like ions Al+ and Si2+ have been investigated in detail by Serrao (1991,
1991). In this study which used the configuration interaction method where the electronic orbitals were generated by means of Thomas-Fermi-Dirac-Amaldi (TFDA) potentials, the most important contribution to the ground state
wavefunction was reported to be made by the doubly excited states (2p63pnp 1S).
In order to assess the effect of electron-correlations in the ground state, a series of calculations were carried out with a fixed configuration expansion for the
excited states (which includes the 2p53s2(n+l)s + 2p53s2nd, [n = 3,4...10] +
2p53s3p2 + 2p53s3p4p + 2s2p63s23p + 2p63s3p + 2p63d3p basis states) while
adding successively even parity configurations to the ground state. The results of
the first set of calculations, named as SG, carried out for the 2p63s2 ->
2p53s2(n+l)s + 2p53s2nd, [n = 3,4... 10] + 2p53s3p2 + 2p53s3p4p + 2s2p63s23p
+ 2p6(3s3p + 3d3p) are shown in figure 4.3a.
SH = SG + 2p63 p 2
The addition of the 2p63p2 configuration which is known to mix strongly
with the 2p63s2 ground state (Serrao, 1991, 1991) leads to an overall weakening
of most of the 2p63s2 -> 2p53s3p2 1>3L array with the exception of 2p63s2
-> 2p53s(1P)3p2 (1S)1P 1 (line 3 both in Al+ and Si2+, figure 4.3) which is
strengthened. The effect of 2p63p2 configuration on the term energies is evident
from the comparison of expansions SG and SH (Figure 4.3).In the magnesium 2p absorption spectrum the strongest asymmetric
resonance at 58.07 eV has been identified as the 2p63s2(1S0) -»
2p53s(1P)3p2(1S)1P 1 transition (Ederer etal. 1979). The reason for this feature to
be the strongest was described as the mixing of the !S term of the 2p63p2
configuration with the normal 2p63s2 l S0 ground state. The present results along
81
the Mg-like ions agree with this proposition (see figure 4.3), the predicted enhancement is by no means as great. Also, this term (line 3) is not among the
strongest features in the Al+ and Si2+ spectra. One other interesting point about this
particular resonance is that it is surprisingly not observed in the ejected-electron data of Pejcev et al. (1977). The following explanation is proposed for this. It
should be noted that the Mg feature at 58.07 eV is observed above the 2P3/2, 1/2 limits thereby opening up the possibility both for direct and resonant 2p
photoionization via the process 2p63s2+hv -»2p53s3p2(1S)1P ->2p5 (2P3/2)3s2el.
Such a process can both lead to an enhancement in the strength of this feature in phoexcitation and will also result in an Auger electron of an energy of less than
1 eV compared to the 41.5 -> 50.4 eV expected by Pejcev and co-workers who
searched for its decay into the 2p63s, 3p or 3d + el channels.
SI = SH + 2p53 s23p
The 2p53s23p configuration has been included in order to account for core
polarisation in the ground state. Although not affecting the energy distribution of the computed spectrum it certainly does lead to a significant enhancement in the
strength of the singly excited 2p -» nl transitions while leaving transitions to doubly
excited states largely unaffected with the exception of the 2p53s3p2(3P)1P term
(Line 6 both in A1+ and Si2+, figure 4.3). The strength of this term was enhanced
in Si2+ and decreased in A1+.
82
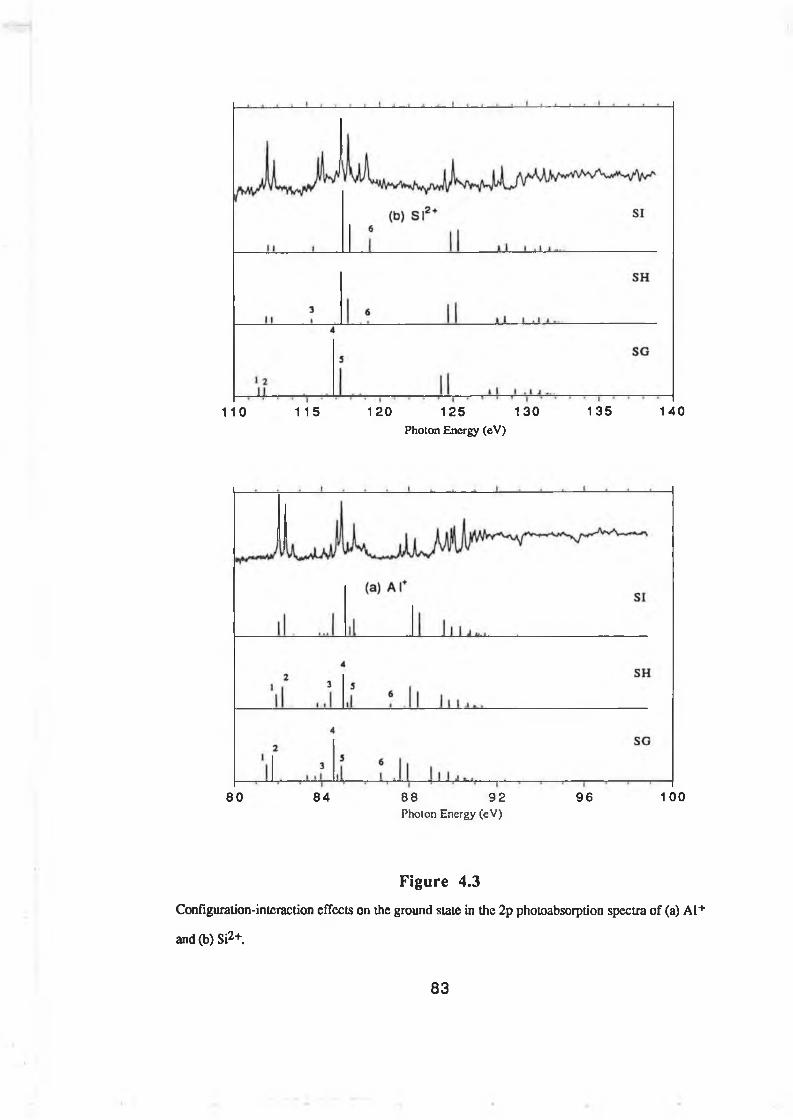
1 1 0 1 1 5 1 2 0 1 2 5 1 3 0
Photon Energy (eV)1 3 5 1 4 0
8 0 8 4 8 8 9 2Phoion Energy (cV)
9 6 1 00
Figure 4.3
Configuration-interaction effects on the ground slate in the 2p photoabsorption spectra o f (a ) A l+
and (b) Si2 + .
83
4.4 Term analyses
The analyses of measured level structure becomes extremely difficult when more than one electron is involved in the photoexcitation process. The unsealed and scaled atomic structure calculations performed using the same set of basis
states including extensive interactions differ widely in the calculated term energies and gf-values and make the line identification more complicated and confusing. The different approximations give the same term energies but differ in the distribution of oscillator strengths in a very dramatic way such as a feature
predicted as strongest by one approximation is shown with negligible gf-values using some other approximation.
In the approach adopted, with only the most significant interactions
included in both the ground and excited states, the different expansions give almost the same term energies but slightly differ in the distribution of gf-values. A comparison of figures 4.2 and 4.3 shows that the calculated positions of the energy levels obtained using expansions SC, SD, SE, SF, SG = SE, SH and SI are almost the same. However, in going from one expansion to other slight changes in the distribution of oscillator strength are observed. The expansion SE which includes only the most significant interactions in the initial and final state
expansions gives a better qualitative as well as quantitative agreement with the
experiment. The level energies and gf-values of both the Al+ and Si2+ computed
using expansion SE are listed in tables 4.1 and 4.2. In table 4.1 a comparison of
the levels belonging to the 2p53s3p2 and 2p53s23d configurations is made with the
calculated energies. The experimental and theoretical level energies of the higher Rydberg series members are compared in table 2. With the exception of a few
doubly excited states, the results are in reasonable agreement with the measured spectra.
The assignments for A1+ have already been reported by our group (Costello
etal. 1991). In that work along with the basis states included in expansion SE
although basis states 2p63d2 for ground state expansion and 2p53p23d, 2p53s3d2
and 2p53p24s for the excited state expansion were also included.
In the assignment of the observed features at 84.78 eV, 84.99 eV and
85.36 eV the present investigation differs from the earlier study of Al+ (Costello
etal. 1991) where they were assigned to the 3d 3P, 3D and ’P levels. According to
the present study 3P terms in the whole nd series both in Al+ and Si2+ show
84
negligible gf-values and, therefore, should not be observed. The ]P and 3D terms
are predicted strong and weak, respectively, throughout the nd series both in Al+
and Si2+ which is in agreement with the experiment. In the earlier assignment the
strong and weak levels of the 3d configuration were assigned to the 3D and !P
terms respectively. The present assignment is more reliable because calculated term energies of these resonances along with the distribution of gf-values are in
agreement with the experiment which was not the case in earlier studies.
In the case of Si2+, the lines predicted at 115.32 eV and 116.01 eV which
are assigned to the features at 115.81 eV and 116.07 eV could only be identified
tentatively because they do not follow the rules, adopted in the assignments given, which are: (i) a strong line should be predicted as a strong line and vice versa, (ii) the splitting of the predicted term energies -at least- within a configuration should be equal to the measured splitting of the corresponding terms, and (iii) measured
and calculated energies should fall in the same energy region. Also we are not sure about the origin of the features measured at 115.81 eV and 116.07 eV. These
features could be due to the 2p63s3p 2p53s3p3d transitions which are predicted
in this region by our calculations, performed during the study of 2p63s3p ->
2p53s23p + 2p63s3p3d transitions (Mosnier et al. 1994). In atomic Mg the
2p63s3p -> 2p53s3p3d transitions have not been observed. In Al+, the 2p53s3p3d
transition array has been observed but features were very weak and unresolvable.
In moving from atomic Mg to Si2+, with the increase in the overlap of 2p and 3d
orbitals, which is evident from the increase in the relative strength of 2p -> 3d
transitions (Figure 4.1), the 2p63s3p 2p53s3p3d transitions should be stronger
than in A1+. There is another possibility that these features could be due to some
impurities which we were not able to identify in this spectrum. By extending photoabsorption studies to the higher isoelectronic species the identification of these features could be solved. With continuous increase in the overlap of 2p and
3d orbitals along this sequence if they are associated with the 2p63s3p
2p53s3p3d transitions they should appear stronger.
85
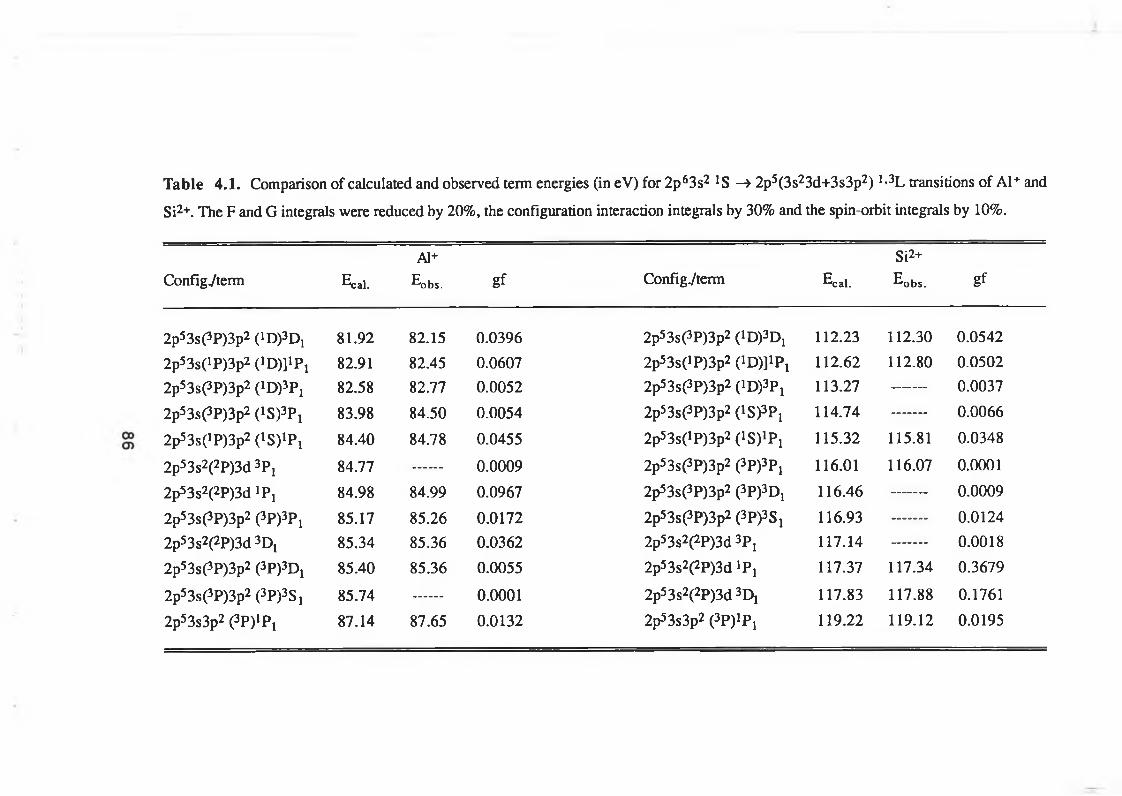
Table 4.1. Comparison of calculated and observed term energies (in eV) for 2p63s2 JS —» 2p5(3s23d+3s3p2) li3L transitions of AI+ and
Si2+. The F and G integrals were reduced by 20%, the configuration interaction integrals by 30% and the spin-orbit integrals by 10%.
Config./term Ecal.
Al+
^obs. gf Config./term Ecal.
Si2+
Eobs. gf
2p53s(3P)3p2 (1D)3D1 81.92 82.15 0.0396 2p53s(3P)3p2 (iD^Dj 112.23 112.30 0.0542
2p53s(1P)3p2 0D)]1P, 82.91 82.45 0.0607 2p53s(1P)3p2 ODMiPj 112.62 112.80 0.0502
2p53s(3P)3p2 (iD)3?! 82.58 82.77 0.0052 2p53s(3P)3p2 (iD)3?! 113.27 0.0037
2p53s(3P)3p2 i ^ ) 3?! 83.98 84.50 0.0054 2p53s(3P)3p2 (1S)3P! 114.74 0.0066
2p53s(1P)3p2 O S^Pj 84.40 84.78 0.0455 2p53s(1P)3p2 (iS)1?! 115.32 115.81 0.0348
2p53s2(2P)3d 3P! 84.77 0.0009 2p53s(3P)3p2 (3P)3Pj 116.01 116.07 0.0001
2p53s2(2P)3d iPi 84.98 84.99 0.0967 2p53s(3P)3p2 (3P)3D! 116.46 0.0009
2p53s(3P)3p2 (3P)3Pî 85.17 85.26 0.0172 2p53s(3P)3p2 (3P)3S j 116.93 0.0124
2p53s2(2P)3d 3Dj 85.34 85.36 0.0362 2p53s2(2P)3d 3Pj 117.14 ---------- 0.0018
2p53s(3P)3p2 (3P)3Di 85.40 85.36 0.0055 2p53s2(2P)3d iPj 117.37 117.34 0.3679
2p53s(3P)3p2 (3P)3S! 85.74 0.0001 2p53s2(2P)3d 3Dj 117.83 117.88 0.1761
2p53s3p2 (3P)lP! 87.14 87.65 0.0132 2p53s3p2 ^ P ) ^ 119.22 119.12 0.0195
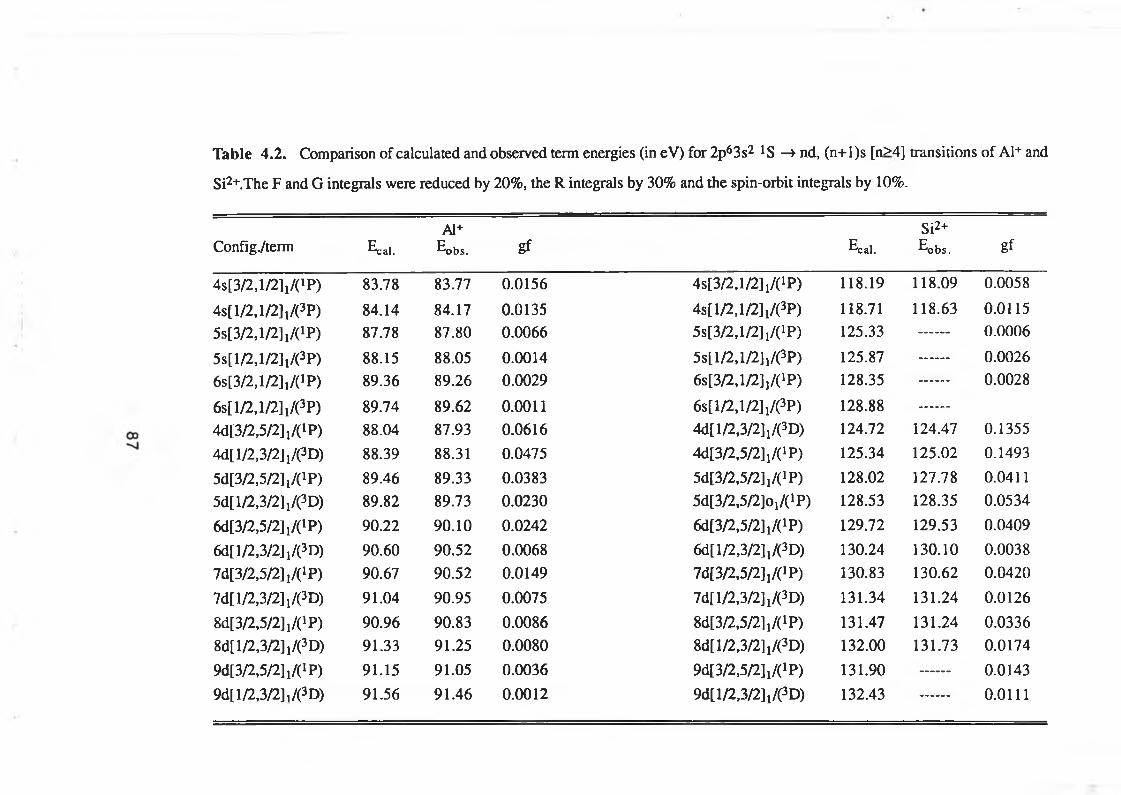
Table 4.2. Comparison of calculated and observed term energies (in eV) for 2p63s2 !S —> nd, (n+l)s [n>4] transitions of Al+ and
Si2+.The F and G integrals were reduced by 20%, the R integrals by 30% and the spin-orbit integrals by 10%.
Config./term ECal.Al+
Eobs. g f Ecal.Si2+Eobs. g f
4s[3/2,l/2] P) 83.78 83.77 0.0156 4s[3/2,l/2]1/(1P) 118.19 118.09 0.0058
4s[1/2,1/2]1/(3P) 84.14 84.17 0.0135 4s[l/2 ,l/2]1/(3P) 118.71 118.63 0.01155s[3/2,l/2] P) 87.78 87.80 0.0066 Sstf/^lÆ lj/O P) 125.33 0.0006
5s[l/2,l/2] P) 88.15 88.05 0.0014 5s[1/2,1/2]!/(3P) 125.87 0.00266s[3/2,l/2] P) 89.36 89.26 0.0029 6s [ i l 2 M 2 y m 128.35 0.0028
6s[l/2,l/2] P) 89.74 89.62 0.0011 ô s t l Æ . l / ^ P ) 128.884d[3/2,5/2] P) 88.04 87.93 0.0616 4d[l/2,3/2]1/(3D) 124.72 124.47 0.1355
4d[l/2,3/2] D) 88.39 88.31 0.0475 4d[3/2,5/2]1/(1P) 125.34 125.02 0.1493
5d[3/2,5/2] P) 89.46 89.33 0.0383 5d[3/2,5/2]!/(iP) 128.02 127.78 0.04115d[l/2,3/2] D) 89.82 89.73 0.0230 5d[3/2,5/2]0l/(iP) 128.53 128.35 0.0534
6d[3/2,5/2] P) 90.22 90.10 0.0242 6d[3/2,5/2]1/(iP) 129.72 129.53 0.0409
6d[l/2,3/2] D) 90.60 90.52 0.0068 6d[l/2,3/2]1/(3D) 130.24 130.10 0.00387d[3/2,5/2] P) 90.67 90.52 0.0149 7d[3/2,5/2]1/(1P) 130.83 130.62 0.0420
7d[ 1/2.3/2] D) 91.04 90.95 0.0075 7d[l/2,3/2]1/(3D) 131.34 131.24 0.0126
8d[3/2,5/2] P) 90.96 90.83 0.0086 8d[3/2,5/2]!/(iP) 131.47 131.24 0.03368d[l/2,3/2] D) 91.33 91.25 0.0080 8d[l/2,3/2]!/(3D) 132.00 131.73 0.01749d[3/2,5/2] P) 91.15 91.05 0.0036 9d[3/2,5/2]1/(1P) 131.90 0.01439d[l/2,3/2] D) 91.56 91.46 0.0012 9d[l/2,3/2]1/(3D) 132.43 0.0111
4.5 Conclusions regarding the general behaviour along the isoelectronic sequence
On the basis of the assignments given in section 4.4 and a study of the eigenvector compositions of the observed transitions a number of general remarks
may be made.With the increase in Z along the isoelectronic sequence the spectrum
restructures itself and shows changes in the distribution of oscillator strength and
the relative positions of singlets and triplets. As we move along the sequence to
Si2+ the transitions to 2p53s3p2 (which are the strongest features in the Mg and Al+
spectra) weaken considerably as the 3d orbital contracts and 2p -> 3d transitions
become the dominant features of the Si2+ 2p - subshell absorption spectra. In Al+
the TP terms belonging to the 3d, 4d and 5d configurations are observed lower in
energy than the corresponding 3D terms (Figure 4.1b). In the case of Si2+ such a
situation is observed only in 3d configuration (Figure 4.1c).
In Al+ and Si2+ the centres of gravity of the 2p53s3p2 and 2p53s3p4p
configurations shift downwards in energy with respect to the Eav of the 2p53s2nl
Rydberg series members. All terms of the 2p53s3p2 configuration drop below the
limit for A1+ and Si2+ and are strongly mixed with the 2p53s23d configuration.
Some features belonging to the 2p53s3p4p configuration are also observed below
the series limit where they are mixed with higher Rydberg series members.
Level crossing within the 2p53s2ns and 2p53s2nd Rydberg series is evident
from these spectra. In particular the 3d drops below the 4s on going from Al+ to
Si2+. Clearly 3d contraction is also responsible for this 3d/4s level crossing
observed in Si2+. The 4d and 5s energies become almost degenerate.
Level crossing within the 2p53s2nl and 2p53s3pnp configurations is also
observed along this sequence. This occurs in an isoelectronic sequence whenever “plunging” configurations are present (Froese Fisher, 1980). These are the
configurations whose energies lie above the ionization limit in neutral atoms and are present both in the valence and inner-shell spectra. In the valence-shell spectra
they could be the doubly excited states (such as, 3s2 -> 3pn(>3)d or 3s2 ->
3pm(>4)s transitions in magnesium) or the singly-excited states where the inner-
88
valence electron is excited (such as, 3s23p -> 3s3pn(>3)p, transitions in
aluminium). In the inner-shell spectra these are the multi-electron excitations, such
as the doubly excited states belonging to the 2p53s3p2 configuration in the ground
state 2p absorption in magnesium. As the nuclear charge increases, the energy levels of the plunging configurations drop below the limit where they appear as discrete features mixed with the Rydberg series members in the case of valence-
shell spectra while in the inner-shell spectra, in addition to the strong mixing with the Rydberg series members, they are also coupled to the background continuum channel (Conneely et al. 1992).
In neutral Mg the 2p53s3p2 configuration acts as a strong perturber for the
whole 2p53s2nd Rydberg series. However, along the magnesium isoelectronic
sequence the 2p53s2n(>4)d-2p53s3p2 interaction is “short-range” in nature (Froese
Fisher 1980) as in proceeding from neutral magnesium to the Mg-like ions Al+ and
Si2+ it is not observed. The reason is that in magnesium the 2p53s3p2
configuration is smeared out over the entire Rydberg series including the 2p53s2el
continuum while in going from the neutral to ions all its levels lie below the 4cL On
the other hand, 2p53s23d-2p53s3p2 interaction acts as a “long-range” interaction
along the magnesium sequence as it remains strong throughout the sequence. This is because the two configurations belong to the same complex. It is due to this
long-range interaction that the 1’3L terms of the 2p53s23d configuration remain
strongly perturbed in the magnesium sequence.
The 2p53s2nd-2p53s3p2 interaction among the core-excited configurations
of neutral magnesium is analogous to that of the 2p63s23pn3d-2p63s3pn+2
interaction along the period which could be seen from the 2p63s2nd-2p63s3p2 and
2p63s23pnd-2p63s3p3 interactions described for atomic aluminium (Weiss 1974,
Lin 1974, O ’Mahony 1985) and silicon (Tatewaki 1978) respectively. The coreexcited states in Mg sequence are perturbed by the doubly excited states while the perturbers in the outer-shell spectra of neutral Al and Si are singly excited states.
The doubly excited states belonging to the 2p53s3p4p configuration in neutral
magnesium all are observed above the 2p-limit which is again similar to the
2p63s3p4p and 2p63s3p24p configurations along the period in Al ( Martin and
Zalubas 1979) and Si (Martin and Zalubas 1983) respectively.
89
4.6 References
Breuckmann B, Schmidt V and Schmitz W, 1976, J. Phys. B 9, 3037.
Brilly J, Kennedy E T and Mosnier J P, 1988, J. Phys. B: At. Mol. Opt. Phys. 21, 3685.
Chang T N, 1986a, Phys. Rev. A 34 , 4550.
Chang T N, 1986b, Phys. Rev. A 3 4 , 4554.
Chang T N, 1987, Phys. Rev. A 36, 447.
Chang T N and Wong Rong-Qi, 1987, Phys. Rev. A 36, 3535.
Chang T N and Wong Rong-Qi, 1991, Phys. Rev. A 4 4, 80.
Conneely M J, Lipsky L and Russek A, 1992, Phys. Rev. A 46, 4012.
Costello J T, Evans D, Hopkins R B, Kennedy E T, Kieman L, Mansfield M W
D, Mosnier J-P, Sayyad M H and Sonntag B F, 1992, J. Phys. B: At. Mol. Opt. Phys., 25 , 5055.
Cowan R D, 1981, "The Theory o f Atomic Structure and Spectra" , (University of California Press, Berkeley).
Deshmukh P C and Manson S T, 1983, phys. Rev. A 2 8, 209.
Deshmukh P C, Nasreen G and Manson S T, 1988, phys. Rev. A 3 8, 504.
Ederer D L, Lucatorto T B and Mehlman G, 1979, J. Opt. Soc. Am., 6 9, 520. Esteva J M and Mehlman G, 1974, Astrophys. J. 1 9 3 ,7 4 7 .
Froese Fisher C, 1980, Phys. Rev. A 22, 551.
Altun Z, 1989, Phys. Rev. A 4 0, 4968.
90
Hameed S, Phys. Rev., 1969, 179, 16.
Haussmann A, Kämmerling B, Kossmann H and Schmidt V, 1988, Phys. Rev.
Lett., 61, 2669.
Hibbert A, Physica Scripta , 1989, 3 9, 574.
Howald A M, Gregory D C, Meyer F W, Phaneuf R A, Müller A, Djuric N and Dunn G H, 1986, Phys. Rev. A 33, 3779.
Kämmerling B, Haussmann A, La..uger J and Schmidt V, 1992, J. Phys. B 25, 4773.
Lin C D, (1974), Astrophys. J. 187, 385.
Mansfield M W D and Connerade J P, 1972, Physica Scripta 6, 191.
Martin W C and R. Zalubas R, 1979, J. Phys. Chem. Ref. Data, 8, 817.
Martin W C and R. Zalubas R, 1980, J. Phys. Chem. Ref. Data, 9, 1.
Martin W C and R. Zalubas R, 1983, J. Phys. Chem. Ref. Data, 12, 323.
Montague R G and Harrison M F A, 1983, J. Phys. B 16, 3045.
Mosnier J P, Brilly J and Kennedy E T, 1987, J. Physique, C-9, 219.
Nasreen G, Manson S T and Deshmukh P C, 1989, Phys. Rev. A 4 0, 6091.
Newsom G H, 1971, Astrophys. J. 166, 243.
O’Mahony P F, 1985, Phys. Rev. A 32, 908.
Pindzola M S, Griffin D C and Böttcher C, 1986, Phys. Rev. A 3 3, 3787.
Hameed S, Herzenberg A and James M G, 1968, J. Phys. B 1, 822.
91
Peart B, Underwood J R A and Dolder K, 1989, J. Phys. B: At. Mol. Opt. Phys. 22, 1679.
Pegg D J, Haselton H H, Thoe R S, Griffin P M, Brown M D and Sellin I A, 1975, Phys. Rev. A 12, 1330.
Pejcev V, Ottley T W, Rassi D and Ross K J, 1977, J. Phys. B 10, 2389.
Robb W D, 1974, J. Phys. B 7, 1837.
Serrao JM P , 1991a, J. Quant. Spectrosc. Radiat. Transfer, 45, 121.
Serrao J M P, 1991b, J. Quant. Spectrosc. Radiat. Transfer, 4 5, 349.
Tatewaki H and Sasaki F, 1978, Phys. Rev. A 18, 1837.
Tayyal S S and Henry R T W, 1986, Phys. Rev. A 3 3, 3825.
Weisheit J C, 1972, Phys. Rev. A 5, 1621.
Wiess A W, 1974, Phys. Rev. A 9, 1524.
Whitfield S B, Caldwell C D and Krause M O, 1991, Phys. Rev. A 4 3, 233.
92
Chapter 5
ALUMINIUM ISO ELECTRO N IC SEQUENCE
IN GROUND STATE ABSORPTION
Photoabsorption investigations o f a tom ic A1 and Si+ in ground states have been carried
ou t in th eir 2p sub sh ell re g io n s . To p rov id e in terp retation fo r the ob served sp e ctra a
co m p reh en siv e an alysis o f this th re e -e le ctro n sy stem , b ased on con figu ration in teractio n
calcu lation s, has been carried out. T he ob jective o f this chap ter is to describe the previous w ork
done along the A1 sequence in ground state absorption and report the present investigations carried
5.1 Previous work
Aluminium is placed among the 15 most abundant cosmic elements (Martinson, 1989). A large number of aluminium lines are present in the solar spectrum. For a long time its atomic properties have been measured and calculated whenever new techniques promised improved results.
The transitions that involve the excitation of the outer shell 3p or 3s electrons have been extensively studied both theoretically and experimentally; a summary of this work has been published by Cantu et al. (1982), and Tayal and
Burke (1987). Only a few investigations have been carried out on the transitions involving the excitation of an inner-shell 2p-electron. Among them the Auger decay following 2p ionisation/excitation processes by electron impact, as studied by Aksela (1984) and Messmer (1984), has been mentioned by Malutzki etal.
(1987) as part of their private communication. Ejected-electron spectra of atomic Al following 2p excitation/photoionization have been measured at selected photon energies by Malutzki et al. (1987). At photon energies higher than the 2p ionisation
of Al, they have observed decay due to the 2p53s23p configuration of A1+. At
79 eY photon energy - below the 2p limit of Al - autoionization decay due to the
levels of 2p53s23pnl configurations of atomic Al has been reported. In their work
the authors have provided almost complete interpretation for the observed Auger
93
spectra of Al+. However, in their experiment because of the broad bandpass of the exciting photons (Malutzki et al. 1987) a detailed discussion of the structures
arising from the autoionising decay of atomic Al was not possible. The 2p absorption spectrum of neutral aluminium, obtained with a flash-pyrolysis technique combined with a BRV source, has been reported by Cantu et al. (1982).
Like aluminium, silicon is also among the 15 most abundant cosmic
elements (Martinson, 1989). The astrophysical importance of silicon is well known (Dufton et al. 1992 and references therein). Knowledge of oscillator strength and photoionization cross sections of astrophysical important elements
such as silicon are necessary for calculations of stellar abundances, opacity, electron density and other properties (Daum and Kelly 1976). Experimental measurement of the photoionization cross section of ionic silicon is quite difficult because of the recombination effects (Daum and Kelly 1976) as well as the difficulties associated with the production of enough ionic silicon. As far as we
know no experimental study of ionic Si+, involving the excitation of a 2p electron,
has been carried out. However, on the theoretical side, photoionization cross
section calculations of Si+ have been reported (Daum and Kelly 1976) from
threshold to 1 KeV. In their calculations, which were performed using the technique of many body perturbation theory, resonances from the 3s3pnp,
2p53s23pns, 2p53s23pnd, and 2s2p63s23pnp configurations were also included.
Correlations among the 2p, 3s, and 3p electrons were shown to have a large effect on the cross section.
5.2 Present work
We have undertaken a comprehensive new analysis of the aluminium 2p photoabsorption spectrum which we have recorded using the dual laser plasma technique. Furthermore, we have extended this photoabsorption study to the aluminium like silicon spectrum which we have recorded for the first time. To elucidate the observed features, configuration-interaction calculations were performed with Cowan’s code (see chapter 2).
In the photoinduced 2p Auger spectra of atomic Al (Malutzki etal. 1987) some difficulties associated with the production of an atomic Al vapour were mentioned. In particular, the aluminium oxide layer, which is always present, and the high reactivity of the hot Al liquid, made the production of an atomic Al vapour
94
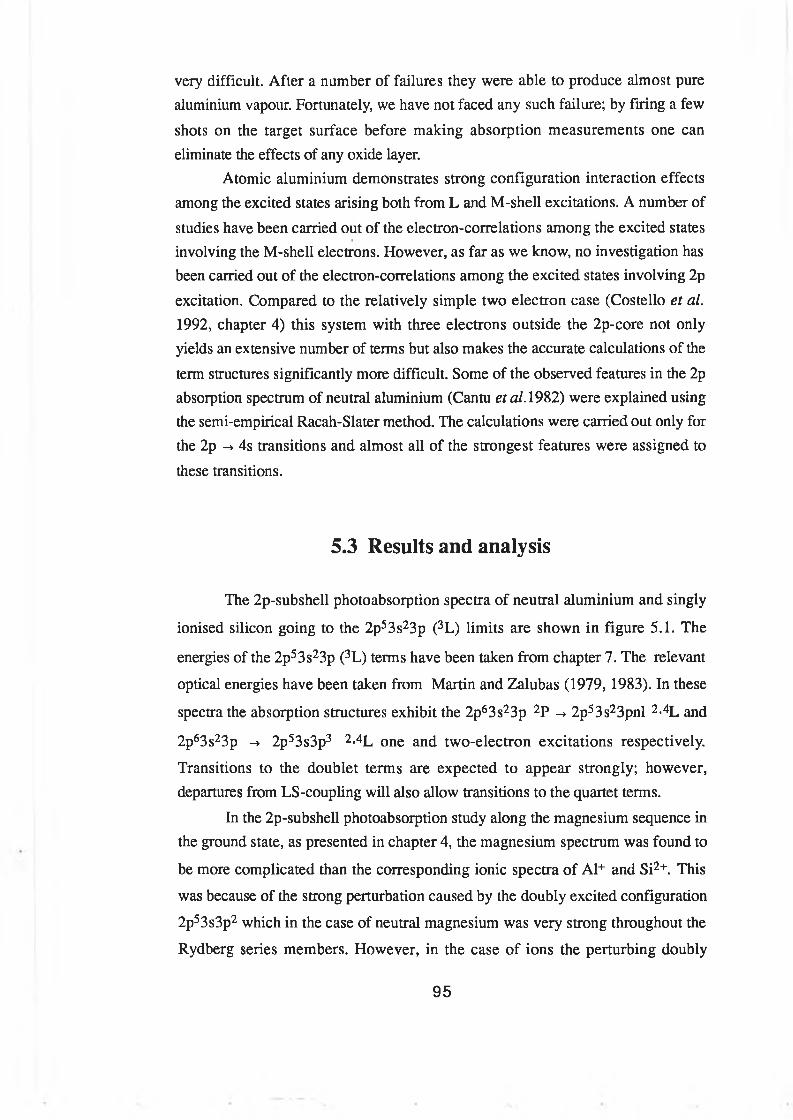
very difficult. After a number of failures they were able to produce almost pure aluminium vapour. Fortunately, we have not faced any such failure; by firing a few
shots on the target surface before making absorption measurements one can eliminate the effects of any oxide layer.
Atomic aluminium demonstrates strong configuration interaction effects among the excited states arising both from L and M-shell excitations. A number of
studies have been carried out of the electron-correlations among the excited states involving the M-shell electrons. However, as far as we know, no investigation has been carried out of the electron-correlations among the excited states involving 2p
excitation. Compared to the relatively simple two electron case (Costello et al. 1992, chapter 4) this system with three electrons outside the 2p-core not only yields an extensive number of terms but also makes the accurate calculations of the
term structures significantly more difficult. Some of the observed features in the 2p absorption spectrum of neutral aluminium (Cantu etal. 1982) were explained using the semi-empirical Racah-Slater method. The calculations were carried out only for the 2p -» 4s transitions and almost all of the strongest features were assigned to
these transitions.
5.3 Results and analysis
The 2p-subshell photoabsorption spectra of neutral aluminium and singly
ionised silicon going to the 2p53s23p (3L) limits are shown in figure 5.1. The
energies of the 2p53s23p (3L) terms have been taken from chapter 7. The relevant
optical energies have been taken from Martin and Zalubas (1979, 1983). In these
spectra the absorption structures exhibit the 2p63s23p 2P -> 2p53s23pnl 2-4L and
2p63s23p -> 2p53s3p3 2*4L one and two-electron excitations respectively.
Transitions to the doublet terms are expected to appear strongly; however, departures from LS-coupling will also allow transitions to the quartet terms.
In the 2p-subshell photoabsorption study along the magnesium sequence in the ground state, as presented in chapter 4, the magnesium spectrum was found to
be more complicated than the corresponding ionic spectra of Al+ and Si2+. This
was because of the strong perturbation caused by the doubly excited configuration
2p53s3p2 which in the case of neutral magnesium was very strong throughout the
Rydberg series members. However, in the case of ions the perturbing doubly
95
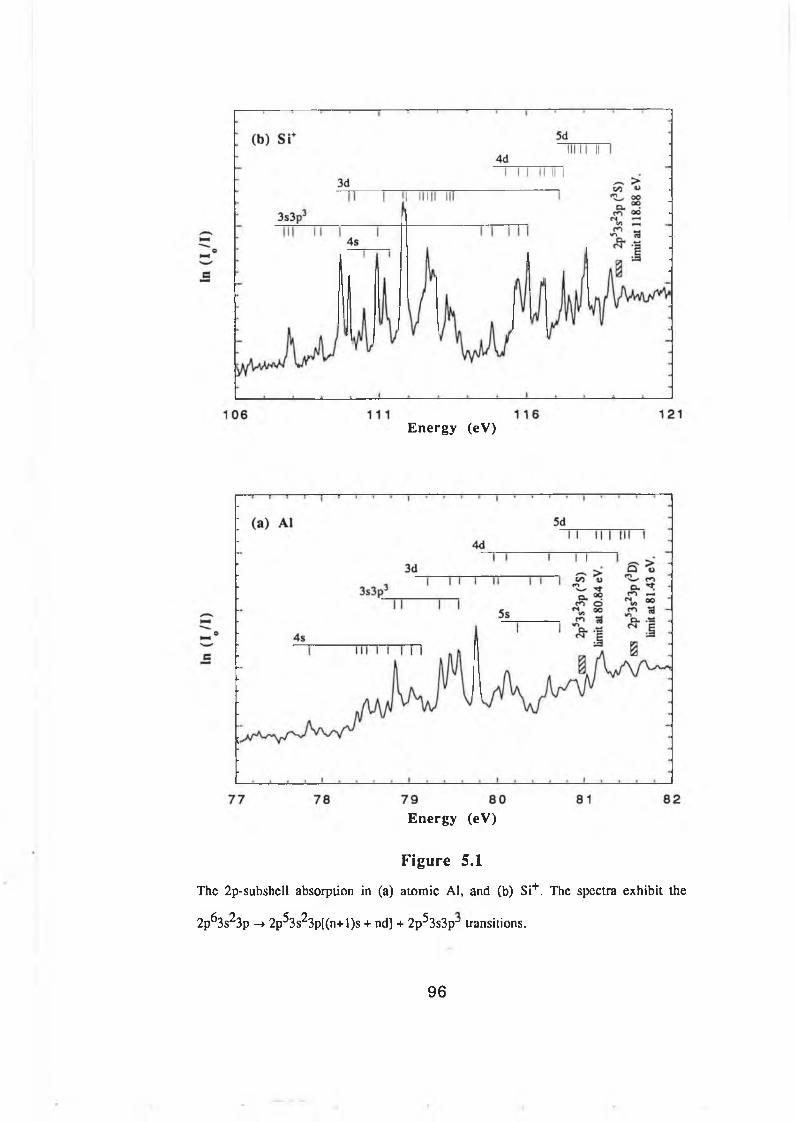
E n e rg y (e V )
E n e rg y (e V )
Figure 5.1
T h e 2p -subshell absorption in (a ) a to m ic A l, and (b ) Si+ . The sp ectra exh ib it the
2 p ^ 3 s2 3p - » 2p ^ 3 s2 3 p [(n + l)s + nd] + 2 p ^ 3 s3 p ~ transitions.
96
excited states were only found mixed with the 2p53s23d configuration. In the 2p
absorption along the aluminium sequence the situation looks quite the opposite.
The spectrum of ionic Si+ seems to be more perturbed than the corresponding
spectrum of atomic aluminium. We believe that in Al I most of the doubly excited
states belonging to the 2p53s3p3 configuration are above the 2p threshold which is
at 80.84 eV for the 2p53s23pnl resonances and only a few are present below this
threshold. When we move to Si+ more members of the doubly excited states drop
below the limit which is at 118.88 eV in Si+ and mix with the 2p53s23pnl Rydberg
series members resulting in strong perturbation.To provide an interpretation for the measured spectra we have performed
scaled atomic structure calculations. The calculations, performed with the Cowan’s
code (chapter 2), include the 2p63s23p and 2p63p3 basis states for the ground state
expansion while the 2p53s23p[ms+nd, m = 4, 5; n = 3, 4, 5.], 2p53s3p3,
2p63s23d, 2p63s3p2 and 2s2p63s23p2 basis states are included for the excited state
expansion. To give reasonable agreement with the measured level energies the HF
radial integrals Fk(i, i), Fk(i, j), Gk(i, j), Rk(i, j) and ^ were scaled down by 15%,
15%, 15%, 25% and 10% respectively. The results of these calculations are listed
in tables 5.1-5.6.
5.3.1 The 2p53s23pns series
The configurations of the type 2p53s23pns give rise to 30 possible
transitions (see table 5.1). In most of the transitions the same upper level is
connected to the two lower 2P i/2 ,3/2 levels. Due to the small splitting between the
2P 1/2 and 2P3/2 levels, the transitions connecting the two 2P levels to the same
upper level are not resolvable. Out of the 30 possible transitions 26 constitute such
unresolvable double transitions and the remaining four are of the type 2P3/2 ->
2'4Ls/2 single transitions.
In the 2p53s23p4s array, out of the 13 doubles the two doubles associated
with the (3S) 4S3/2 and (3D) 4D1/2 terms are not allowed as they are almost pure
LS-coupled both in A1 and Si+. Among the remaining 11 doubles, in aluminium
97
the 4 doubles associated with the (*P) 2P i/2, (3P) 4P i/2> (3P) 2P i /2 and ( 1S) 2S1/2
terms show negligible gf-values. Also there is a single 2P3/2 -> (3P) 4Ps/2 transition which shows a negligible gf-value. Therefore, we are left with 7 doubles and 3 single transitions having non-negligible gf-values. A comparison of the predicted and measured spectra are listed in table 5.1.
Almost all the features associated with the 2p53s23p4s array in A1 are well
resolved from the features associated with the 2p53s23p3d and 2p53s3p3
configurations. However, a double and a single transition assigned to a shoulder at
78.91 eV are not resolvable. In the doubles assigned to the (3D) 4I>3/2, (3P) 4P3/2
and (3P) 2P3/2 terms at 78.47 eV, 79.02 eV and 79.13 eV, respectively, the upper
terms could be assigned to the lower level 2P3/2 only as the gf-values associated
with the transitions arising from the 2P i /2 level are negligible (table 5.1).
In the 5s array in Al, only the 2P i /2 -» (3D) 4D3/2 and 2P i /2 (!P) 2P3/2transitions show non-negligible gf-values. The features predicted by these transitions (table 5.2) are observed at 80.23 eV and 80.70 eV.
In Si+, where the 2p absorption is dominated by the strong and broad
features arising from the 2p63s23p -> 2p5[3s23pnd + 3s3p2np] transitions, the ns
series members are predicted very weak compared to and degenerate with the
strong members of the 2p53s23p3d and 2p53s3p3 configurations. Only a shoulder
measured at 111.34 eV could be assigned to the 2P3/2 -> 4s(3D) 2D5/2 transition.
This transition has also been observed as strongest in the 4s array of Al. The predicted energy of this transition is 111.38 eV and the corresponding gf-value is 0.0426. The gf-value of the remaining members are negligible (table 5.1).
The terms belonging to the 2p53s23p4s array exhibit strong mixing among
themselves. However, no significant mixing was observed with the terms
belonging to the 2p53s23pnd Rydberg series members or the 2p53s3p2np
configuration which is analogous to the 2p53s2ns interaction with the 2p53s2nd
and 2p53s3pnp series along the Mg-sequence in ground state absorption (see
chapter 4). In the Mg-sequence, only the 2p53s2nd and 2p53s3pnp channels
interact strongly. The same is observed here in the aluminium sequence where the ns series remains unperturbed. The LS-compositions of the dominant terms remain
dominant in moving along the sequence with the exception of the (*P) 2P3/2 and
98
(3D) 2E>3/2 terms. In Si+, these terms appear twice as they become dominant over
the (3P) 4P3 /2 and (3P) 2P3/2 terms respectively. The inclusion of the 2p63s23d,
2p63s3p2 and 2s2p63s23p2 configurations, which account for the core-polarisation
effect (Hibbert, 1989) in our configuration-interaction (Cl) approach, have shown
no significant effect on the term energies of the 2p53s23pns series. Even the gf-
values are not affected to any great extent by the addition of these configurations.
99
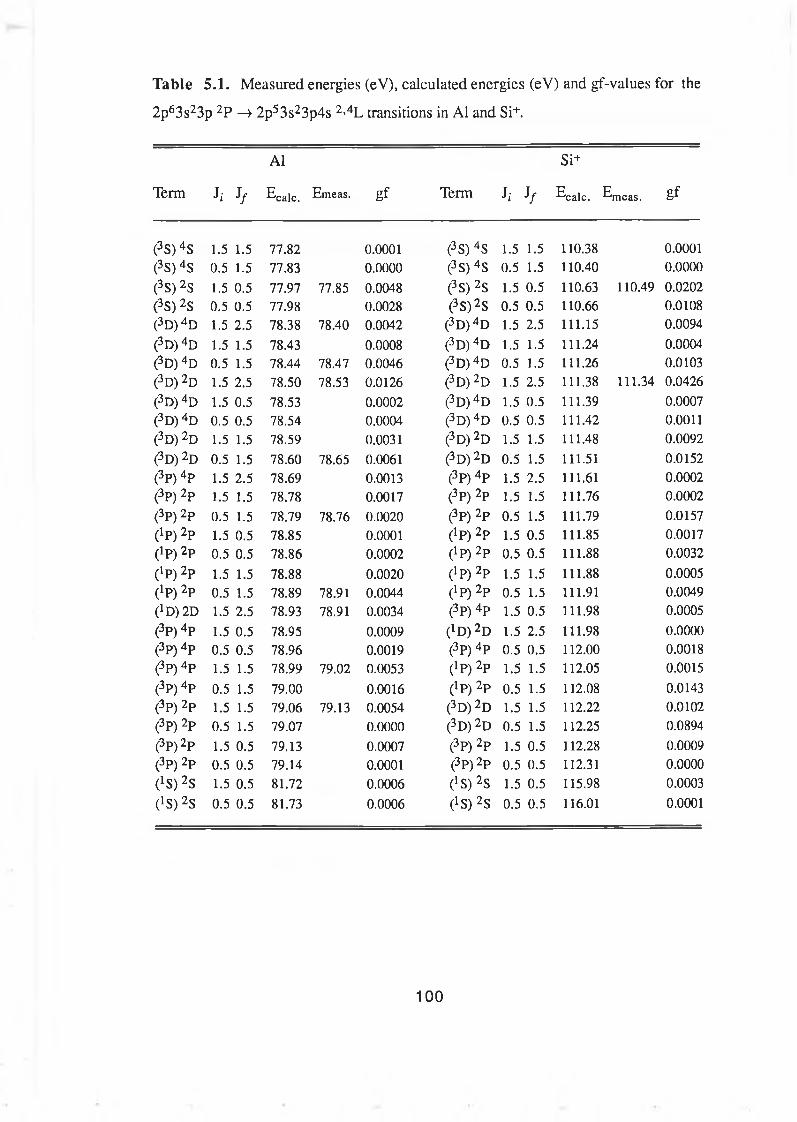
Table 5.1. Measured energies (eV), calculated energies (eV) and gf-values for the
2p63s23p 2P —> 2p53s23p4s 2>4L transitions in A1 and Si+.
Term J; J/
A1
^calc. Emeas. gf Term h J/
Si+
ECalc. E,Tieas. gf
(3S) 4S 1.5 1.5 77.82 0.0001 (3S) 4S 1.5 1.5 110.38 0.0001(3S) 4S 0.5 1.5 77.83 0.0000 (3S) 4S 0.5 1.5 110.40 0.0000(3S) 2S 1.5 0.5 77.97 77.85 0.0048 (3S) 2S 1.5 0.5 110.63 110.49 0.0202(3S) 2S 0.5 0.5 77.98 0.0028 (3S )2S 0.5 0.5 110.66 0.0108(3D )4D 1.5 2.5 78.38 78.40 0.0042 (3D ) 4D 1.5 2.5 111.15 0.0094
(3D) 4d 1.5 1.5 78.43 0.0008 (3D) 4d 1.5 1.5 111.24 0.0004
(3D) 4d 0.5 1.5 78.44 78.47 0.0046 (3D )4D 0.5 1.5 111.26 0.0103(3D) 2d 1.5 2.5 78.50 78.53 0.0126 (3D ) 2D 1.5 2.5 111.38 111.34 0.0426
(3D) 4d 1.5 0.5 78.53 0.0002 (3D )4D 1.5 0.5 111.39 0.0007(3D) 4d 0.5 0.5 78.54 0.0004 (3D) 4d 0.5 0.5 111.42 0.0011(3D) 2d 1.5 1.5 78.59 0.0031 (3D ) 2D 1.5 1.5 111.48 0.0092
(3D) 2d 0.5 1.5 78.60 78.65 0.0061 (3D) 2d 0.5 1.5 111.51 0.0152
(3P) 4P 1.5 2.5 78.69 0.0013 (3P) 4P 1.5 2.5 111.61 0.0002(3P) 2P 1.5 1.5 78.78 0.0017 (3P) 2P 1.5 1.5 111.76 0.0002
(3P) 2P 0.5 1.5 78.79 78.76 0.0020 (3P) 2P 0.5 1.5 111.79 0.0157(!p ) 2P 1.5 0.5 78.85 0.0001 (ip ) 2p 1.5 0.5 111.85 0.0017(lp ) 2p 0.5 0.5 78.86 0.0002 (!p ) 2P 0.5 0.5 111.88 0.0032
(!p ) 2P 1.5 1.5 78.88 0.0020 (ip ) 2p 1.5 1.5 111.88 0.0005(ip ) 2p 0.5 1.5 78.89 78.91 0.0044 (lP) 2P 0.5 1.5 111.91 0.0049(!D )2 D 1.5 2.5 78.93 78.91 0.0034 (3P) 4P 1.5 0.5 111.98 0.0005
(3P) 4P 1.5 0.5 78.95 0.0009 (1D ) 2D 1.5 2.5 111.98 0.0000(3P) 4P 0.5 0.5 78.96 0.0019 (3P) 4P 0.5 0.5 112.00 0.0018(3P) 4P 1.5 1.5 78.99 79.02 0.0053 (1P) 2p 1.5 1.5 112.05 0.0015
(3P) 4P 0.5 1.5 79.00 0.0016 (tp ) 2p 0.5 1.5 112.08 0.0143(3P) 2P 1.5 1.5 79.06 79.13 0.0054 (3D) 2d 1.5 1.5 112.22 0.0102(3P) 2P 0.5 1.5 79.07 0.0000 (3D ) 2D 0.5 1.5 112.25 0.0894
(3P )2P 1.5 0.5 79.13 0.0007 (3P) 2P 1.5 0.5 112.28 0.0009(3P) 2P 0.5 0.5 79.14 0.0001 (3p )2p 0.5 0.5 112.31 0.0000(1S )2S 1.5 0.5 81.72 0.0006 (iS) 2S 1.5 0.5 115.98 0.0003
(XS) 2S 0.5 0.5 81.73 0.0006 (lS) 2S 0.5 0.5 116.01 0.0001
100
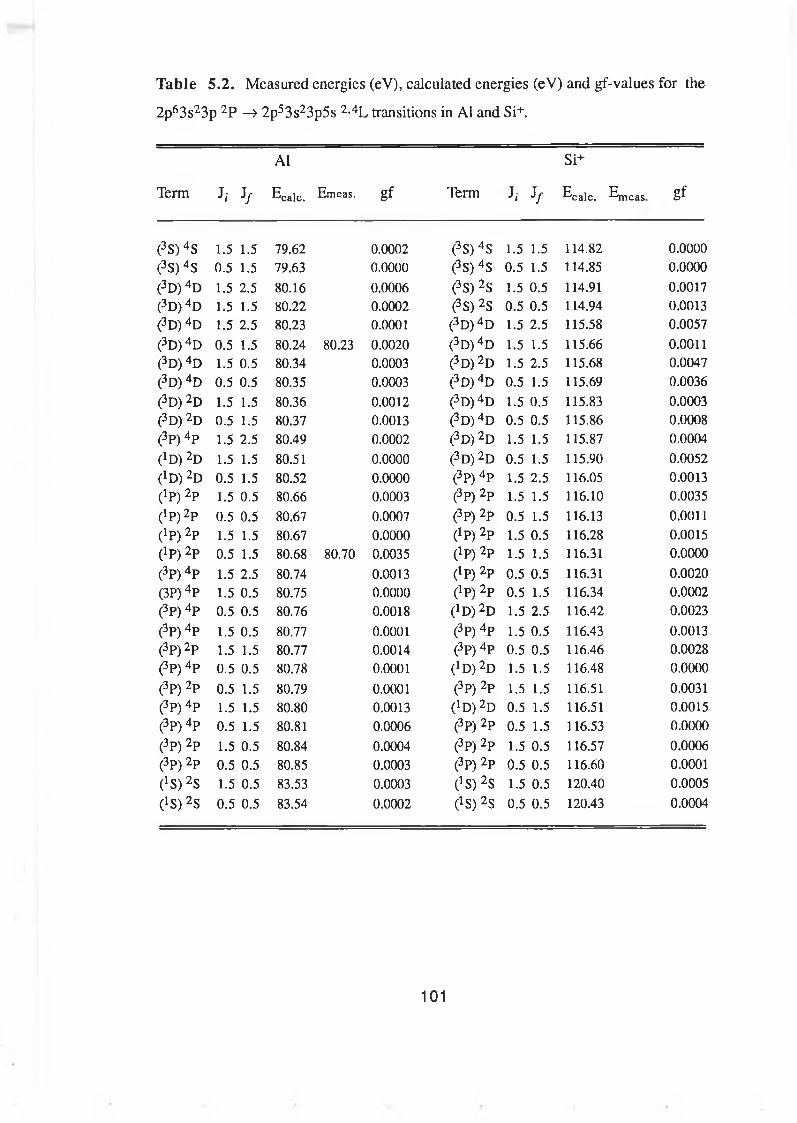
Table 5.2. Measured energies (eV), calculated energies (eV) and gf-values for the
2p63s23p 2P —> 2p53s23p5s 2<4L transitions in A1 and Si+.
Term h Jf
A1
ECalc. Emcas. gf Term J, Jf
Si+
ECalc. Efneas gf
(3S) 4S 1.5 1.5 79.62 0.0002 (3S) 4S 1.5 1.5 114.82 0.0000(3S) 4S 0.5 1.5 79.63 0.0000 (3S) 4S 0.5 1.5 114.85 0.0000(3D) 4d 1.5 2.5 80.16 0.0006 (3S) 2S 1.5 0.5 114.91 0.0017(3D) 4d 1.5 1.5 80.22 0.0002 (3S) 2S 0.5 0.5 114.94 0.0013(3D) 4d 1.5 2.5 80.23 0.0001 (3D) 4d 1.5 2.5 115.58 0.0057(3D) 4d 0.5 1.5 80.24 80.23 0.0020 (3D) 4d 1.5 1.5 115.66 0.0011(3D) 4d 1.5 0.5 80.34 0.0003 (3D )2D 1.5 2.5 115.68 0.0047(3D) 4d 0.5 0.5 80.35 0.0003 (3D) 4d 0.5 1.5 115.69 0.0036(3D) 2d 1.5 1.5 80.36 0.0012 (3D )4D 1.5 0.5 115.83 0.0003(3D) 2d 0.5 1.5 80.37 0.0013 (3D )4D 0.5 0.5 115.86 0.0008(3P) 4P 1.5 2.5 80.49 0.0002 (3D) 2d 1.5 1.5 115.87 0.0004(iD) 2D 1.5 1.5 80.51 0.0000 (3D )2D 0.5 1.5 115.90 0.0052(*D)2D 0.5 1.5 80.52 0.0000 (3P) 4P 1.5 2.5 116.05 0.0013(ip) 2p 1.5 0.5 80.66 0.0003 (3P) 2P 1.5 1.5 116.10 0.0035(iP) 2p 0.5 0.5 80.67 0.0007 (3P) 2P 0.5 1.5 116.13 0.0011( iP) 2p 1.5 1.5 80.67 0.0000 ( iP) 2p 1.5 0.5 116.28 0.0015(1P) 2p 0.5 1.5 80.68 80.70 0.0035 (!P) 2P 1.5 1.5 116.31 0.0000(3P) 4P 1.5 2.5 80.74 0.0013 (ip) 2p 0.5 0.5 116.31 0.0020(3P) 4P 1.5 0.5 80.75 0.0000 (ip) 2p 0.5 1.5 116.34 0.0002(3P) 4P 0.5 0.5 80.76 0.0018 (^D) 2D 1.5 2.5 116.42 0.0023(3P) 4P 1.5 0.5 80.77 0.0001 (3P) 4P 1.5 0.5 116.43 0.0013(3P) 2P 1.5 1.5 80.77 0.0014 (3P) 4P 0.5 0.5 116.46 0.0028(3P) 4P 0.5 0.5 80.78 0.0001 (iD) 2D 1.5 1.5 116.48 0.0000(3P) 2P 0.5 1.5 80.79 0.0001 (3P) 2p 1.5 1.5 116.51 0.0031(3P) 4P 1.5 1.5 80.80 0.0013 (!D )2D 0.5 1.5 116.51 0.0015(3P) 4P 0.5 1.5 80.81 0.0006 (3P) 2P 0.5 1.5 116.53 0.0000(3p) 2p 1.5 0.5 80.84 0.0004 (3P) 2P 1.5 0.5 116.57 0.0006(3P) 2P 0.5 0.5 80.85 0.0003 (3P) 2P 0.5 0.5 116.60 0.0001(!S) 2S 1.5 0.5 83.53 0.0003 (!S) 2S 1.5 0.5 120.40 0.0005(!S) 2S 0.5 0.5 83.54 0.0002 Os) 2s 0.5 0.5 120.43 0.0004
101
5.3.2 Transitions to the 2p53s3p3 array
In Al I the terms of the 2p53s3p3 array are smeared out over the entire
Rydberg series members and throughout the continuum. Among the 73 possible transitions (table 5.3) associated with this array the energies of 46 transitions are
predicted above the 2p53s23p (3S) edge. Out of these 46 transitions in 32
transitions the upper term is 2L. However, out of the remaining 27 transitions
which are predicted below the 2p-limit only 5 transitions have the upper terms of
the type 2L.
The 27 transitions predicted below the 2p53s23p (3S) edge include 11
unresolvable doubles and 5 single transitions. The 7 doubles with upper terms
(4S) 4Pi/2,3/2> (2D) 4D1/2,312, (2D) 4F3/2> (2P) 4S3/2, (2P) 4Pi/2 and (2D) 4D3/2
show negligible gf-values. The 4 single transitions having the upper terms (4S)
4Pg/2, (2D) 4D5/2, (2D) 4F5/2 and (2D) 4F5y2 also show negligible gf-values. Thus
in A1 we are left with 3 doubles and one single transition having non-negligible gf-
values. These transitions are associated with the (2D) 2P3/2, (2D) 2P i/2, (2P) 4Di/2
and (2D) 4P5/2 upper terms. In our absorption measurements all of these four
predicted structures are observed (Figure 6.1). Their assignment is listed in table
5.3. The two doubles assigned to the (2D) 2P3/2 and (2D) 2P i/2 terms, are not
resolvable. The same is observed for a feature assigned to the (2D) 4D1/2 term
which is degenerate with a very strong and broad structure measured at 79.58 eV.
However, a very strong feature measured at 79.37 eV assigned to the (2D) 4P5/2
term is well resolved.
The Si+ spectrum looks quite different from its isoelectronic partner Al I. It
exhibits relatively much more strong features which are divided into sharp and
broad structures. The reason is that in Si+ the whole 2p53s3p3 array drops below
the 2p-threshold and gives rise to a number of strong and sharp absorption structures.
In Si+ there are 12 transitions connected with the upper terms of the type
4L1/2, 16 transitions connected with the 4I-3/2 terms and 7 transitions connected
with the 4L5/2 terms. Thus we are left with 38 transitions connected with the upper
terms of the type 2L. In Si+, all these 38 transitions are predicted below the 2p-
102
threshold. The 4L1/2,3/2 terms in Si+ are not mixed with 2L terms to any great
extent. Consequently, all the doubles connected with upper quartet terms show
negligible gf-values. Among the 7 single transitions only the 2 transitions
connected with the (2P) 4D5/2 and (2P) 4Ps/2 terms show non-negligible gf-
values.The 38 transitions which are connected with the upper terms of the type 2L
include 16 unresolvable doubles and 6 single transitions.
In table 5.3 we show a comparison of calculated and measured spectra both
for A1 and Si+. The inspection of LS-compositions showed that, in moving from
A1 to ionic Si+, most of the dominant terms remained dominant in their LS-
compositions along the sequence. But the strong transitions in A1 are no longer
strong in Si+ (see table 5.3).
In A1 the lower energy region is dominated by the 2p53s23p4s array.
However, in Si+ it is dominated by the members of the 2p53s3p3 configuration. In
moving from A1 to Si+ level crossing of the 2p53s3p3 array takes place with
respect to the ns and nd series. Also the level crossing of the nd series occurs with respect to the ns series. Consequently, most of the weak members of the 3s array become degenerate with the strong members of the 3d array. The level crossing of
the 2p53s3p3 configuration and the 2p53s23pnd series with respect to the
2p53s23pns series has no significant effect on the level structure. However, the
level crossing of the members of the 2p53s3p3 array with respect to the
2p53s3p3nd series gives rise to a number of irregularities along the sequence. The
strong features exhibited by the 2p53s3p3 array in Si+ are associated with the terms
which were above the 2p53s23p (3S) edge in Al.
103
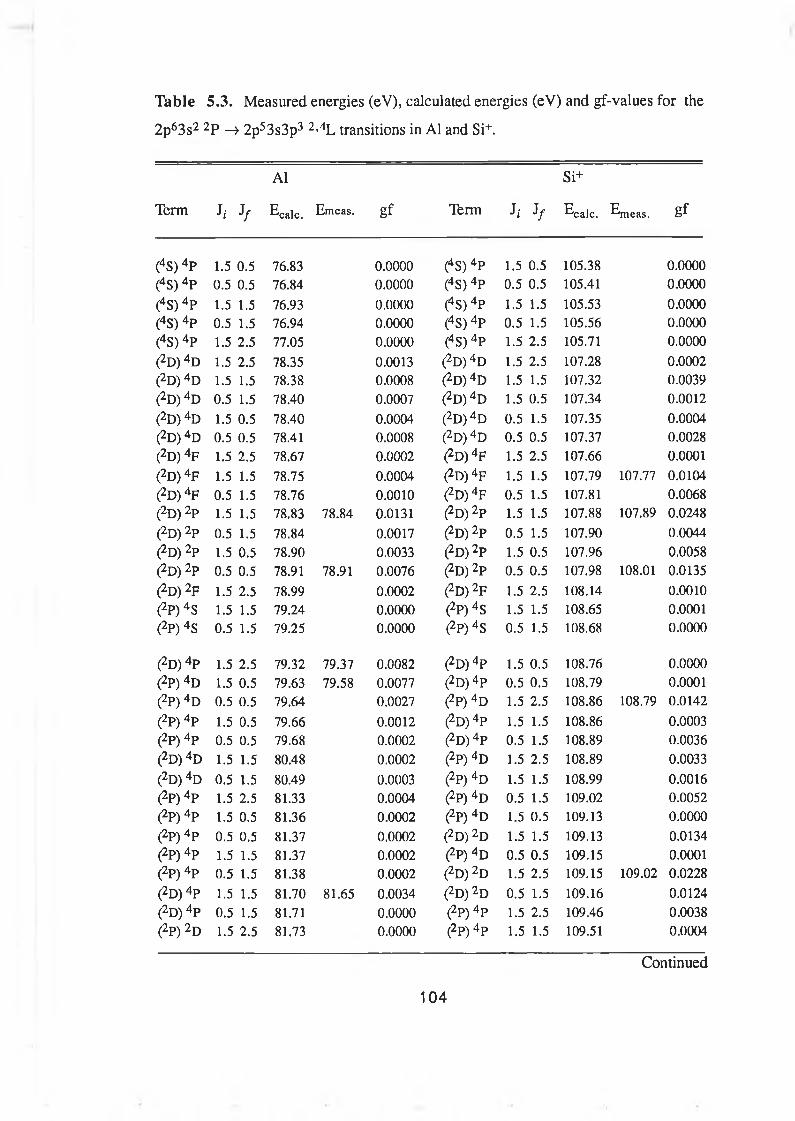
Table 5.3. Measured energies (eV), calculated energies (eV) and gf-values for the
2p63s2 2P —» 2p53s3p3 2>4L transitions in A1 and Si+.
Term h J/
A1
Ecalc. Em eas. g f Term h if
S i+
Ecalc. Emeas. g f
(4S) 4p 1.5 0.5 76.83 0.0000 (4S) 4P 1.5 0.5 105.38 0.0000(4S) 4p 0.5 0.5 76.84 0.0000 (4S) 4P 0.5 0.5 105.41 0.0000
(4S) 4P 1.5 1.5 76.93 0.0000 (4S) 4P 1.5 1.5 105.53 0.0000
(4S) 4P 0.5 1.5 76.94 0.0000 (4S) 4P 0.5 1.5 105.56 0.0000
(4S) 4P 1.5 2.5 77.05 0.0000 (4S) 4P 1.5 2.5 105.71 0.0000
(2D) 4d 1.5 2.5 78.35 0.0013 (2D) 4d 1.5 2.5 107.28 0.0002
(2D) 4d 1.5 1.5 78.38 0.0008 (2D) 4d 1.5 1.5 107.32 0.0039
(2D) 4d 0.5 1.5 78.40 0.0007 (2D) 4d 1.5 0.5 107.34 0.0012
(2D) 4d 1.5 0.5 78.40 0.0004 (2D )4D 0.5 1.5 107.35 0.0004
^D ) 4D 0.5 0.5 78.41 0.0008 (2D) 4d 0.5 0.5 107.37 0.0028
(2D) 4f 1.5 2.5 78.67 0.0002 (2D) 4f 1.5 2.5 107.66 0.0001
(2D) 4f 1.5 1.5 78.75 0.0004 ^D ) 4F 1.5 1.5 107.79 107.77 0.0104
(2D) 4f 0.5 1.5 78.76 0.0010 (2D) 4f 0.5 1.5 107.81 0.0068
(2D) 2P 1.5 1.5 78.83 78.84 0.0131 (2D) 2p 1.5 1.5 107.88 107.89 0.0248
(2D) 2p 0.5 1.5 78.84 0.0017 ^D ) 2P 0.5 1.5 107.90 0.0044
(2D) 2p 1.5 0.5 78.90 0.0033 (2D) 2p 1.5 0.5 107.96 0.0058
(2D) 2p 0.5 0.5 78.91 78.91 0.0076 ^D ) 2P 0.5 0.5 107.98 108.01 0.0135
(2D) 2f 1.5 2.5 78.99 0.0002 (2D) 2f 1.5 2.5 108.14 0.0010
(2P) 4S 1.5 1.5 79.24 0.0000 ^ P ^ S 1.5 1.5 108.65 0.0001
(2P) 4S 0.5 1.5 79.25 0.0000 (2P )4S 0.5 1.5 108.68 0.0000
(2D) 4P 1.5 2.5 79.32 79.37 0.0082 (2D) 4p 1.5 0.5 108.76 0.0000
(2P) 4d 1.5 0.5 79.63 79.58 0.0077 ^D ) 4P 0.5 0.5 108.79 0.0001
(2P) 4d 0.5 0.5 79.64 0.0027 (2P)4D 1.5 2.5 108.86 108.79 0.0142
(2P) 4P 1.5 0.5 79.66 0.0012 ^D ) 4P 1.5 1.5 108.86 0.0003(2p)4p 0.5 0.5 79.68 0.0002 ^D ) 4P 0.5 1.5 108.89 0.0036
(2D) 4d 1.5 1.5 80.48 0.0002 (2P) 4D 1.5 2.5 108.89 0.0033
(2D) 4d 0.5 1.5 80.49 0.0003 (2P) 4D 1.5 1.5 108.99 0.0016(2p) 4p 1.5 2.5 81.33 0.0004 (2P )4D 0.5 1.5 109.02 0.0052
(2P) 4P 1.5 0.5 81.36 0.0002 (2P) 4D 1.5 0.5 109.13 0.0000
(2P) 4P 0.5 0.5 81.37 0.0002 (2D) 2d 1.5 1.5 109.13 0.0134
(2P) 4P 1.5 1.5 81.37 0.0002 (2P) 4D 0.5 0.5 109.15 0.0001
(2P) 4P 0.5 1.5 81.38 0.0002 (2D) 2d 1.5 2.5 109.15 109.02 0.0228
(2D) 4P 1.5 1.5 81.70 81.65 0.0034 (2D) 2d 0.5 1.5 109.16 0.0124
(2D) 4p 0.5 1.5 81.71 0.0000 (2P) 4P 1.5 2.5 109.46 0.0038(2P) 2d 1.5 2.5 81.73 0.0000 (2p) 4p 1.5 1.5 109.51 0.0004
104
Continued
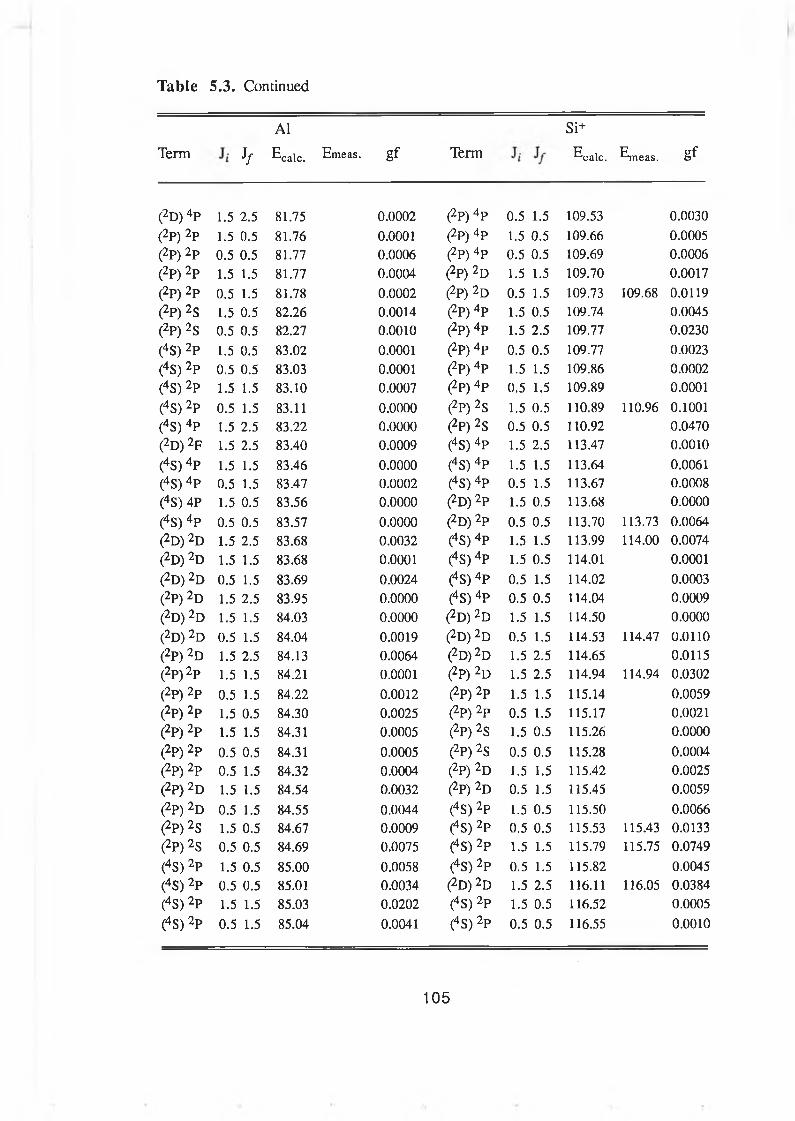
Table 5.3. Continued
Term Jf
A1
E calc. Emeas. g f Term
Si+
Ecalc. Emeas. g f
(2D) 4p 1.5 2.5 81.75 0.0002 (2p) 4P 0.5 1.5 109.53 0.0030(2p) 2p 1.5 0.5 81.76 0.0001 (2p) 4P 1.5 0.5 109.66 0.0005(2p) 2p 0.5 0.5 81.77 0.0006 (2p) 4P 0.5 0.5 109.69 0.0006(2P) 2p 1.5 1.5 81.77 0.0004 (2p) 2d 1.5 1.5 109.70 0.0017(2p) 2p 0.5 1.5 81.78 0.0002 (2p) 2d 0.5 1.5 109.73 109.68 0.0119(2P) 2S 1.5 0.5 82.26 0.0014 (2P) 4P 1.5 0.5 109.74 0.0045(2P) 2S 0.5 0.5 82.27 0.0010 (2P) 4P 1.5 2.5 109.77 0.0230
(4S) 2P 1.5 0.5 83.02 0.0001 (2 p )4p 0.5 0.5 109.77 0.0023(4S) 2P 0.5 0.5 83.03 0.0001 (2p) 4P 1.5 1.5 109.86 0.0002(4S) 2P 1.5 1.5 83.10 0.0007 (2p) 4P 0.5 1.5 109.89 0.0001
(4S) 2p 0.5 1.5 83.11 0.0000 (2p) 2S 1.5 0.5 110.89 110.96 0.1001(4S) 4P 1.5 2.5 83.22 0.0000 (2P) 2S 0.5 0.5 110.92 0.0470(2D) 2f 1.5 2.5 83.40 0.0009 (4S) 4P 1.5 2.5 113.47 0.0010
(4S) 4P 1.5 1.5 83.46 0.0000 (4S) 4P 1.5 1.5 113.64 0.0061(4S) 4P 0.5 1.5 83.47 0.0002 (4S) 4P 0.5 1.5 113.67 0.0008(4S) 4P 1.5 0.5 83.56 0.0000 (2d ) 2P 1.5 0.5 113.68 0.0000
(4S) 4P 0.5 0.5 83.57 0.0000 (2D) 2P 0.5 0.5 113.70 113.73 0.0064(2D) 2d 1.5 2.5 83.68 0.0032 (4S) 4P 1.5 1.5 113.99 114.00 0.0074
(2D) 2d 1.5 1.5 83.68 0.0001 (4S) 4P 1.5 0.5 114.01 0.0001
(2D) 2d 0.5 1.5 83.69 0.0024 (4S) 4P 0.5 1.5 114.02 0.0003(2P) 2d 1.5 2.5 83.95 0.0000 (4 S) 4P 0.5 0.5 114.04 0.0009(2D) 2d 1.5 1.5 84.03 0.0000 (2D) 2d 1.5 1.5 114.50 0.0000
(2D) 2d 0.5 1.5 84.04 0.0019 (2d ) 2d 0.5 1.5 114.53 114.47 0.0110(2P) 2d 1.5 2.5 84.13 0.0064 (2D )2D 1.5 2.5 114.65 0.0115(2p)2p 1.5 1.5 84.21 0.0001 (2P) 2D 1.5 2.5 114.94 114.94 0.0302(2P) 2p 0.5 1.5 84.22 0.0012 (2p)2p 1.5 1.5 115.14 0.0059(2P) 2P 1.5 0.5 84.30 0.0025 (2p) 2P 0.5 1.5 115.17 0.0021(2P) 2p 1.5 1.5 84.31 0.0005 (2P) 2S 1.5 0.5 115.26 0.0000
(2P) 2p 0.5 0.5 84.31 0.0005 (2P) 2S 0.5 0.5 115.28 0.0004(2P) 2p 0.5 1.5 84.32 0.0004 (2P) 2D 1.5 1.5 115.42 0.0025(2P) 2D 1.5 1.5 84.54 0.0032 (2p) 2d 0.5 1.5 115.45 0.0059(2p) 2d 0.5 1.5 84.55 0.0044 (4S) 2P 1.5 0.5 115.50 0.0066(2p) 2S 1.5 0.5 84.67 0.0009 (4S) 2P 0.5 0.5 115.53 115.43 0.0133(2p) 2 s 0.5 0.5 84.69 0.0075 (4 S) 2P 1.5 1.5 115.79 115.75 0.0749
(4S) 2P 1.5 0.5 85.00 0.0058 (4S) 2P 0.5 1.5 115.82 0.0045(4S) 2P 0.5 0.5 85.01 0.0034 (2D) 2d 1.5 2.5 116.11 116.05 0.0384(4S) 2P 1.5 1.5 85.03 0.0202 (4S) 2P 1.5 0.5 116.52 0.0005
(4S) 2P 0.5 1.5 85.04 0.0041 (4 S) 2P 0.5 0.5 116.55 0.0010
105

5.3.3 The 2p53 s23pnd series
The 2p53s23pnd Rydberg series members are mixed with the 2p53s3p3
2’4L doubly excited states. In A1 because of the spreading nature of the 2p53s3p3
configuration the 2p53s3p3 and 2p53s23pnd mixing is relatively dilute. In Si+, as
the whole 2p53s3p3 array drops below the 2p-threshold a number of its terms
become degenerate with the 2p53s23pnd Rydberg series members and result in
relatively more interaction with the Rydberg series members. Consequently, it
makes the calculations more difficult for the Si+ than the less perturbed Al I
spectrum. In particular, the interaction between the 2p53s23p3d and 2p53s3p3
configurations is found to be very strong.Among the 76 predicted possible transitions associated with arrays of the
type 2p53s23pnd 2>4L, 58 transitions constitute 29 unresolvable doubles and the
remaining 18 single transitions. In the 2p absorption spectrum of Al I all the
strongest features exhibit the transitions to the strongly mixed 2p53s3p3 and
2p53s23p3d configurations. Out of the 29 doubles only 13 doubles, assigned to
the (3D) 4P3/2, (3D) 2P 1/2, (ID) 2D3/2, (3D) 2P3/2, (3D) 4P 1/2, (3D) 2P3/2, (3D)
4P3/2, (ID) 2D3/2, (3D) 2S1/2, (ID) 2P3/2, (ID) 2S1/2, (ID) 2P3/2 and (3P) 4D3/2
terms, exhibit transitions having non-negligible gf-values. Among the remaining 18 are single transitions in which the upper term is associated with J values 5/2
only the 7 transitions, assigned to the (3S) 2D, (3P) 4D, (3P) 4P, (3D) 4P, (3P) 4D,
(*P) 2D and (3P) 4P terms, show non-negligible gf-values. A strong feature
observed at 79.47 eV could be assigned to the two doubles and one single
transition associated with the (3D) 2P 1/2, (*D) 2P3/2 and (3P) 4D5/2 terms as the
predicted values for these terms are 79.47±0.1 eV. A double and a single transition
assigned to a strong feature at 79.58 eV is also not resolvable.
In moving from neutral A1 to ionic Si+ dramatic changes occur both in the
measured and computed spectra. With the exception of a few terms, having
negligible gf-values both in A1 and Si+, almost all the terms change their relative
positions (table 5.4). We believe that in Si+, the whole 2p53s23p3d 2-4L array is
strongly perturbed by the doubly excited 2p53s3p3 states. Also in Si+ the change
in LS-composition results in the flipping of most of the terms. The unique
106
I'
assignment of such a strongly perturbed Rydberg series is meaningless, therefore, here we can provide only tentative assignments.
In Si+, for the 2p -» 3d transitions, there are 19 unresolvable doubles and 7
single transitions which show negligible values. These doubles and single
transitions are associated with the (3P) 2P 1/2, (3S) 4D1/2, (3S) 4E^/2> C1?) 2D3/2,
(3P) 4F3/2, (3D )2 D 3 /2, (3D )4S3/2, (1D)2Si/2, (3D) 2P3/2, (3D) 4D3/2, (3D )4D1/2,
(3D) 4P1/2, (3D) 4P 1/2, (3D) 4P3/2, CD) 2p3/2, (3D) 4D1/2, (5D) 4D3/2, (ID) 2D3/2,
(ip) 2P1/2, (ip) 2p3/2, (3D) 2S1/2, (IS) 2D3/2, (ip) 2D5/2, (3P) 4F5/2, (3D) 2d 5/2,
(3D) 4D5/2, (5p) 2D5/2, (3S) 2d5/2, (ID) 2D5/2, (ID) 2D5/2 and (5p) 2F5/2 upper
terms. Their measured energies, calculated energies and gf-values are listed in
table 6.4.The absorption structures observed above 80.00 eV and 115.00 eV are
dominated by the 2p63s23p -> 2p53s23pn(= 4 and 5)d + 2p53s3p3 transitions both in A1 and Si+. The features assigned to the 4d and 5d Rydberg series members are listed in tables 5.5 and 5.6 respectively.
The inclusion of the 2p63s23d and 2p63s3p2 configurations in the excited
state expansion was found to enhance the gf-values of some members of the
2p53s3p3 configuration and the 2p53s23pnd series very prominently. While the
inclusion of 2s2p63s23p2 configuration leads to redistribution of oscillator
strength. Consequently, brings the calculated gf-values in a better visual agreement with the measured spectra.
107
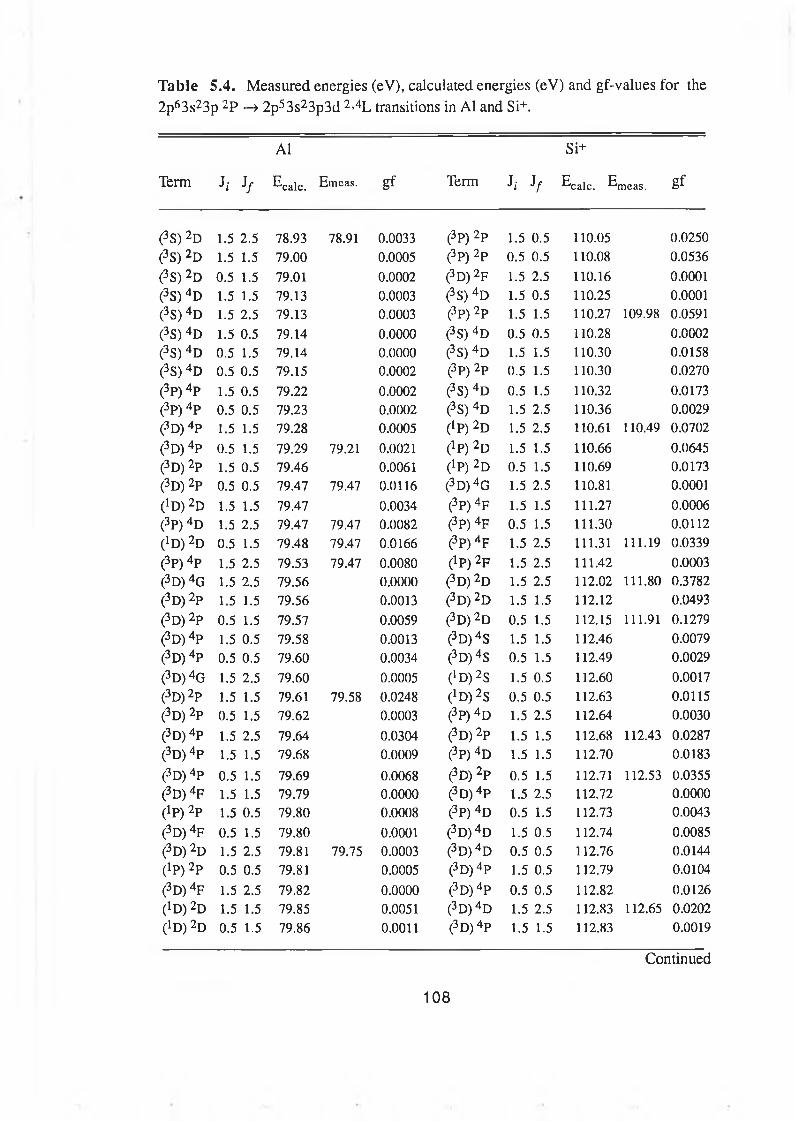
Table 5.4. Measured energies (eV), calculated energies (eV) and gf-values for the2p63s23p 2P —» 2p53s23p3d 2-4L transitions in A1 and Si+.
Term J i Jf
A1
^calc. Emeas. g f Term J,- Jf
Si+
^calc. E,neas. g f
(3S) 2D 1.5 2.5 78.93 78.91 0.0033 (3P) 2P 1.5 0.5 110.05 0.0250(3S) 2d 1.5 1.5 79.00 0.0005 (3P) 2P 0.5 0.5 110.08 0.0536
(3S) 2d 0.5 1.5 79.01 0.0002 (3D) 2f 1.5 2.5 110.16 0.0001(3S) 4d 1.5 1.5 79.13 0.0003 (3S) 4d 1.5 0.5 110.25 0.0001(3S) 4d 1.5 2.5 79.13 0.0003 (3P) 2P 1.5 1.5 110.27 109.98 0.0591
(3S) 4d 1.5 0.5 79.14 0.0000 (3S) 4d 0.5 0.5 110.28 0.0002
(3S) 4 d 0.5 1.5 79.14 0.0000 (3S) 4 d 1.5 1.5 110.30 0.0158(3S) 4 d 0.5 0.5 79.15 0.0002 (3P) 2P 0.5 1.5 110.30 0.0270
(3P) 4P 1.5 0.5 79.22 0.0002 (3S) 4 D 0.5 1.5 110.32 0.0173(3P) 4P 0.5 0.5 79.23 0.0002 (3S) 4d 1.5 2.5 110.36 0.0029(3D) 4p 1.5 1.5 79.28 0.0005 (ÏP) 2D 1.5 2.5 110.61 110.49 0.0702
(3D) 4p 0.5 1.5 79.29 79.21 0.0021 ^P) 2D 1.5 1.5 110.66 0.0645(3D) 2p 1.5 0.5 79.46 0.0061 C1 P) 2D 0.5 1.5 110.69 0.0173(3D) 2p 0.5 0.5 79.47 79.47 0.0116 (3D )4G 1.5 2.5 110.81 0.0001(iD ) 2D 1.5 1.5 79.47 0.0034 (3P) 4f 1.5 1.5 111.27 0.0006(3P) 4d 1.5 2.5 79.47 79.47 0.0082 (3P) 4F 0.5 1.5 111.30 0.0112
(iD ) 2D 0.5 1.5 79.48 79.47 0.0166 (3P) 4p 1.5 2.5 111.31 111.19 0.0339(3p) 4p 1.5 2.5 79.53 79.47 0.0080 (JP) 2F 1.5 2.5 111.42 0.0003(3D) 4g 1.5 2.5 79.56 0.0000 (3D) 2d 1.5 2.5 112.02 111.80 0.3782(3D) 2p 1.5 1.5 79.56 0.0013 (3D) 2d 1.5 1.5 112.12 0.0493
(3D) 2p 0.5 1.5 79.57 0.0059 (3D) 2 d 0.5 1.5 112.15 111.91 0.1279(3D) 4p 1.5 0.5 79.58 0.0013 (3D )4 S 1.5 1.5 112.46 0.0079(3D) 4p 0.5 0.5 79.60 0.0034 (3D) 4S 0.5 1.5 112.49 0.0029
(3D) 4g 1.5 2.5 79.60 0.0005 (1D )2S 1.5 0.5 112.60 0.0017(3D) 2p 1.5 1.5 79.61 79.58 0.0248 (! D )2S 0.5 0.5 112.63 0.0115(3D) 2p 0.5 1.5 79.62 0.0003 (3P) 4D 1.5 2.5 112.64 0.0030
(3D) 4p 1.5 2.5 79.64 0.0304 (3D) 2P 1.5 1.5 112.68 112.43 0.0287(3D) 4p 1.5 1.5 79.68 0.0009 (3P) 4D 1.5 1.5 112.70 0.0183
(3D) 4p 0.5 1.5 79.69 0.0068 (3D) 2p 0.5 1.5 112.71 112.53 0.0355(3D) 4f 1.5 1.5 79.79 0.0000 (3D )4P 1.5 2.5 112.72 0.0000(ip) 2p 1.5 0.5 79.80 0.0008 (3P) 4D 0.5 1.5 112.73 0.0043
(3D) 4f 0.5 1.5 79.80 0.0001 (3D )4D 1.5 0.5 112.74 0.0085(3D) 2d 1.5 2.5 79.81 79.75 0.0003 (3D )4D 0.5 0.5 112.76 0.0144(!p) 2P 0.5 0.5 79.81 0.0005 (3D) 4P 1.5 0.5 112.79 0.0104
(3D) 4f 1.5 2.5 79.82 0.0000 (3D) 4p 0.5 0.5 112.82 0.0126(*D) 2D 1.5 1.5 79.85 0.0051 (3D )4D 1.5 2.5 112.83 112.65 0.0202(iD ) 2D 0.5 1.5 79.86 0.0011 (3D) 4p 1.5 1.5 112.83 0.0019
Continued
108
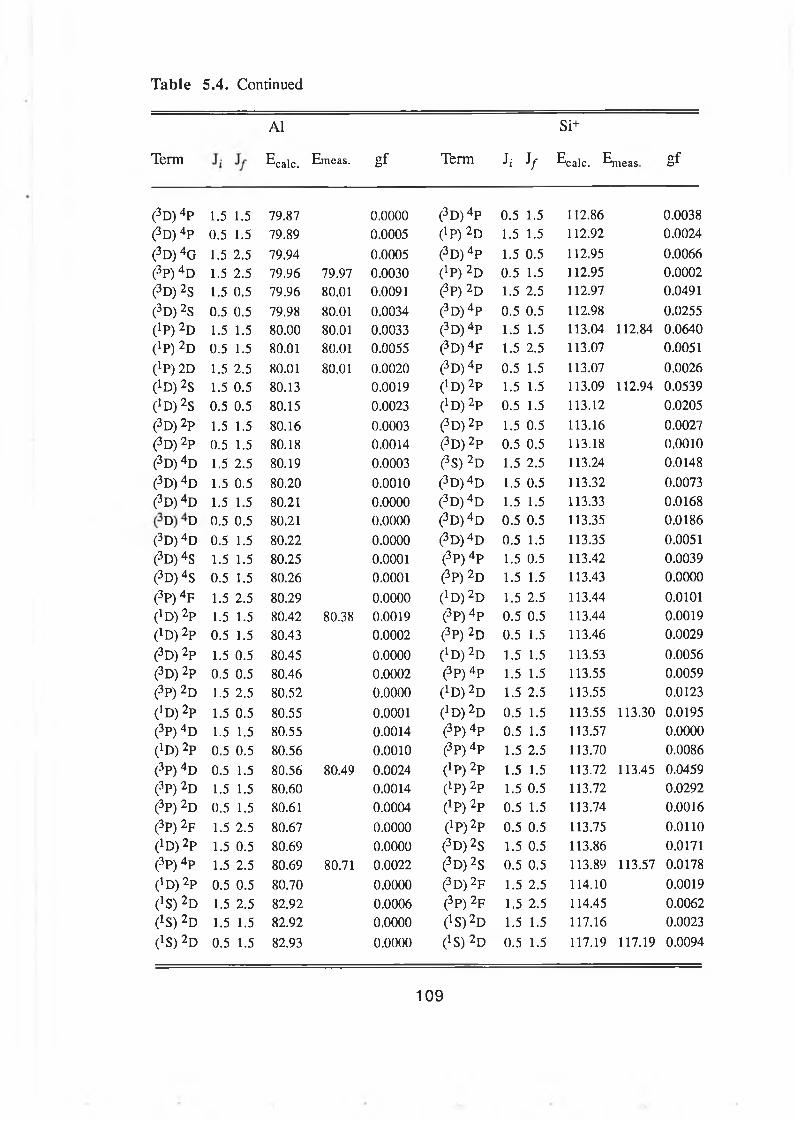
Table 5.4. Continued
Term
Al
Ecalc. Emcas. g f Term h J/
S i+
Ecalc. Ejneas g f
(3D) 4p 1.5 1.5 79.87 0.0000 (3D )4P 0.5 1.5 112.86 0.0038
(3D) 4p 0.5 1.5 79.89 0.0005 (!P) 2D 1.5 1.5 112.92 0.0024
(3D) 4G 1.5 2.5 79.94 0.0005 (3D )4P 1.5 0.5 112.95 0.0066
(3P) 4d 1.5 2.5 79.96 79.97 0.0030 (!p) 2d 0.5 1.5 112.95 0.0002
(3D) 2S 1.5 0.5 79.96 80.01 0.0091 (3P) 2D 1.5 2.5 112.97 0.0491
(3D) 2s 0.5 0.5 79.98 80.01 0.0034 (3D )4P 0.5 0.5 112.98 0.0255
(!p) 2D 1.5 1.5 80.00 80.01 0.0033 (3D) 4P 1.5 1.5 113.04 112.84 0.0640
(!P) 2D 0.5 1.5 80.01 80.01 0.0055 (3D )4F 1.5 2.5 113.07 0.0051
(!P) 2D 1.5 2.5 80.01 80.01 0.0020 (3D )4P 0.5 1.5 113.07 0.0026
^D ) 2S 1.5 0.5 80.13 0.0019 (! D) 2P 1.5 1.5 113.09 112.94 0.0539
^ D ) 2S 0.5 0.5 80.15 0.0023 ^ D ) 2P 0.5 1.5 113.12 0.0205
(3D) 2P 1.5 1.5 80.16 0.0003 (3D) 2P 1.5 0.5 113.16 0.0027
(3d ) 2P 0.5 1.5 80.18 0.0014 (3D) 2P 0.5 0.5 113.18 0.0010
(3D) 4D 1.5 2.5 80.19 0.0003 (3S) 2D 1.5 2.5 113.24 0.0148
(3D) 4D 1.5 0.5 80.20 0.0010 (3D ) 4D 1.5 0.5 113.32 0.0073
(3D) 4D 1.5 1.5 80.21 0.0000 (3D) 4D 1.5 1.5 113.33 0.0168
0.5 0.5 80.21 0.0000 (3D )4D 0.5 0.5 113.35 0.0186
(3D) 4D 0.5 1.5 80.22 0.0000 (3D )4D 0.5 1.5 113.35 0.0051
(3D) 4s 1.5 1.5 80.25 0.0001 (3P) 4P 1.5 0.5 113.42 0.0039
(3D) 4s 0.5 1.5 80.26 0.0001 (3P) 2d 1.5 1.5 113.43 0.0000
(3P) 4f 1.5 2.5 80.29 0.0000 (jd ) 2d 1.5 2.5 113.44 0.0101
^D ) 2P 1.5 1.5 80.42 80.38 0.0019 (3P) 4P 0.5 0.5 113.44 0.0019
(io ) 2P 0.5 1.5 80.43 0.0002 (3P) 2d 0.5 1.5 113.46 0.0029
(3D) 2P 1.5 0.5 80.45 0.0000 ( !D )2D 1.5 1.5 113.53 0.0056
(3D) 2P 0.5 0.5 80.46 0.0002 (3P) 4P 1.5 1.5 113.55 0.0059
(3P) 2D 1.5 2.5 80.52 0.0000 (1D ) 2D 1.5 2.5 113.55 0.0123
(!D) 2P 1.5 0.5 80.55 0.0001 (1D ) 2D 0.5 1.5 113.55 113.30 0.0195
(3P) 4D 1.5 1.5 80.55 0.0014 (3P) 4P 0.5 1.5 113.57 0.0000
(!D) 2P 0.5 0.5 80.56 0.0010 (3p) 4p 1.5 2.5 113.70 0.0086
(3P) 4D 0.5 1.5 80.56 80.49 0.0024 (!P) 2P 1.5 1.5 113.72 113.45 0.0459
(3P) 2D 1.5 1.5 80.60 0.0014 (lp) 2p 1.5 0.5 113.72 0.0292
(3P) 2D 0.5 1.5 80.61 0.0004 (ip) 2p 0.5 1.5 113.74 0.0016
(3p) 2F 1.5 2.5 80.67 0.0000 (1P) 2P 0.5 0.5 113.75 0.0110
(*D) 2P 1.5 0.5 80.69 0.0000 (3D) 2S 1.5 0.5 113.86 0.0171
(3P) 4P 1.5 2.5 80.69 80.71 0.0022 (3D) 2S 0.5 0.5 113.89 113.57 0.0178
(!D) 2P 0.5 0.5 80.70 0.0000 (3D ) 2F 1.5 2.5 114.10 0.0019
(]S) 2D 1.5 2.5 82.92 0.0006 (3P) 2F 1.5 2.5 114.45 0.0062
^S) 2D 1.5 1.5 82.92 0.0000 (1S )2D 1.5 1.5 117.16 0.0023
C1 S) 2D 0.5 1.5 82.93 0.0000 (iS) 2D 0.5 1.5 117.19 117.19 0.0094
109
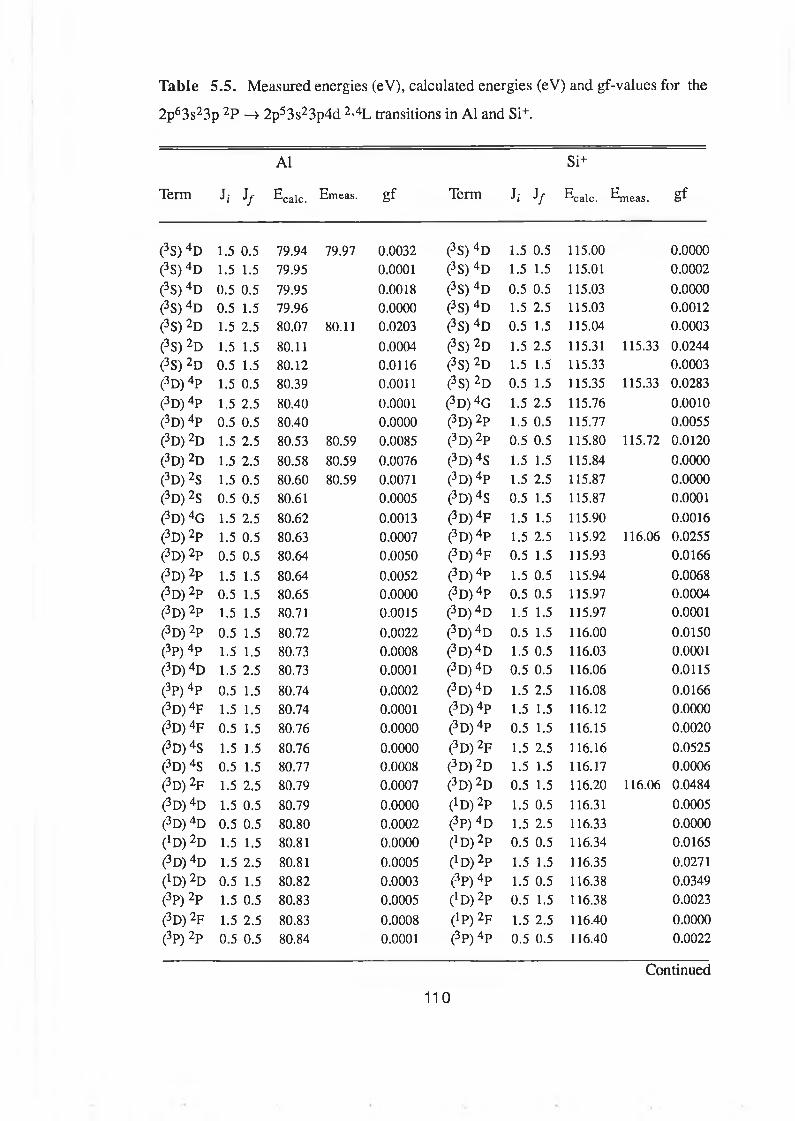
Table 5.5. Measured energies (eV), calculated energies (eV) and gf-values for the
2p63s23p 2P —» 2p53s23p4d 2>4L transitions in A1 and Si+.
Term h if
A1
^calc. Emcas. gf Term Ji Jf
Si+
ECalc. ^meas. gf
(3S) 4D 1.5 0.5 79.94 79.97 0.0032 (3S) 4d 1.5 0.5 115.00 0.0000(3S) 4D 1.5 1.5 79.95 0.0001 (3S) 4d 1.5 1.5 115.01 0.0002(3S) 4D 0.5 0.5 79.95 0.0018 (3S) 4d 0.5 0.5 115.03 0.0000(3S) 4d 0.5 1.5 79.96 0.0000 (3S) 4d 1.5 2.5 115.03 0.0012(3S) 2d 1.5 2.5 80.07 80.11 0.0203 (3S) 4d 0.5 1.5 115.04 0.0003(3S) 2d 1.5 1.5 80.11 0.0004 (3S) 2d 1.5 2.5 115.31 115.33 0.0244(3S) 2d 0.5 1.5 80.12 0.0116 (3S) 2d 1.5 1.5 115.33 0.0003(3D) 4p 1.5 0.5 80.39 0.0011 (3S) 2d 0.5 1.5 115.35 115.33 0.0283(3D) 4p 1.5 2.5 80.40 0.0001 (3 D )4G 1.5 2.5 115.76 0.0010(3D) 4p 0.5 0.5 80.40 0.0000 (3D) 2p 1.5 0.5 115.77 0.0055(3D) 2d 1.5 2.5 80.53 80.59 0.0085 (3D) 2p 0.5 0.5 115.80 115.72 0.0120(3D) 2d 1.5 2.5 80.58 80.59 0.0076 (3 D) 4s 1.5 1.5 115.84 0.0000(3D) 2s 1.5 0.5 80.60 80.59 0.0071 (3D )4P 1.5 2.5 115.87 0.0000(3D) 2s 0.5 0.5 80.61 0.0005 (3D) 4s 0.5 1.5 115.87 0.0001(3D) 4g 1.5 2.5 80.62 0.0013 (3D )4F 1.5 1.5 115.90 0.0016(3D) 2p 1.5 0.5 80.63 0.0007 (3D) 4p 1.5 2.5 115.92 116.06 0.0255(3D) 2p 0.5 0.5 80.64 0.0050 (3D) 4f 0.5 1.5 115.93 0.0166(3D) 2p 1.5 1.5 80.64 0.0052 (3D) 4p 1.5 0.5 115.94 0.0068(3D) 2p 0.5 1.5 80.65 0.0000 (3D )4P 0.5 0.5 115.97 0.0004(3D) 2p 1.5 1.5 80.71 0.0015 (3D )4D 1.5 1.5 115.97 0.0001(3D) 2p 0.5 1.5 80.72 0.0022 (3D) 4d 0.5 1.5 116.00 0.0150(3P) 4P 1.5 1.5 80.73 0.0008 (3D )4D 1.5 0.5 116.03 0.0001(3D) 4d 1.5 2.5 80.73 0.0001 (3D )4D 0.5 0.5 116.06 0.0115(3P) 4P 0.5 1.5 80.74 0.0002 (3 D )4D 1.5 2.5 116.08 0.0166(3D) 4f 1.5 1.5 80.74 0.0001 (3D) 4p 1.5 1.5 116.12 0.0000(3D) 4f 0.5 1.5 80.76 0.0000 (3D) 4p 0.5 1.5 116.15 0.0020(3D) 4s 1.5 1.5 80.76 0.0000 (3D) 2f 1.5 2.5 116.16 0.0525(3D) 4s 0.5 1.5 80.77 0.0008 (3D) 2d 1.5 1.5 116.17 0.0006(3D) 2f 1.5 2.5 80.79 0.0007 (3D) 2d 0.5 1.5 116.20 116.06 0.0484(3D) 4d 1.5 0.5 80.79 0.0000 (}D)2P 1.5 0.5 116.31 0.0005(3D) 4d 0.5 0.5 80.80 0.0002 (3P) 4d 1.5 2.5 116.33 0.0000(!D) 2d 1.5 1.5 80.81 0.0000 (*D) 2P 0.5 0.5 116.34 0.0165(3D) 4d 1.5 2.5 80.81 0.0005 (! D) 2P 1.5 1.5 116.35 0.0271(iD ) 2D 0.5 1.5 80.82 0.0003 (3P) 4P 1.5 0.5 116.38 0.0349(3p) 2p 1.5 0.5 80.83 0.0005 C1 D) 2P 0.5 1.5 116.38 0.0023(3D) 2f 1.5 2.5 80.83 0.0008 (lp) 2F 1.5 2.5 116.40 0.0000(3P) 2P 0.5 0.5 80.84 0.0001 (3P) 4P 0.5 0.5 116.40 0.0022
Continued
110
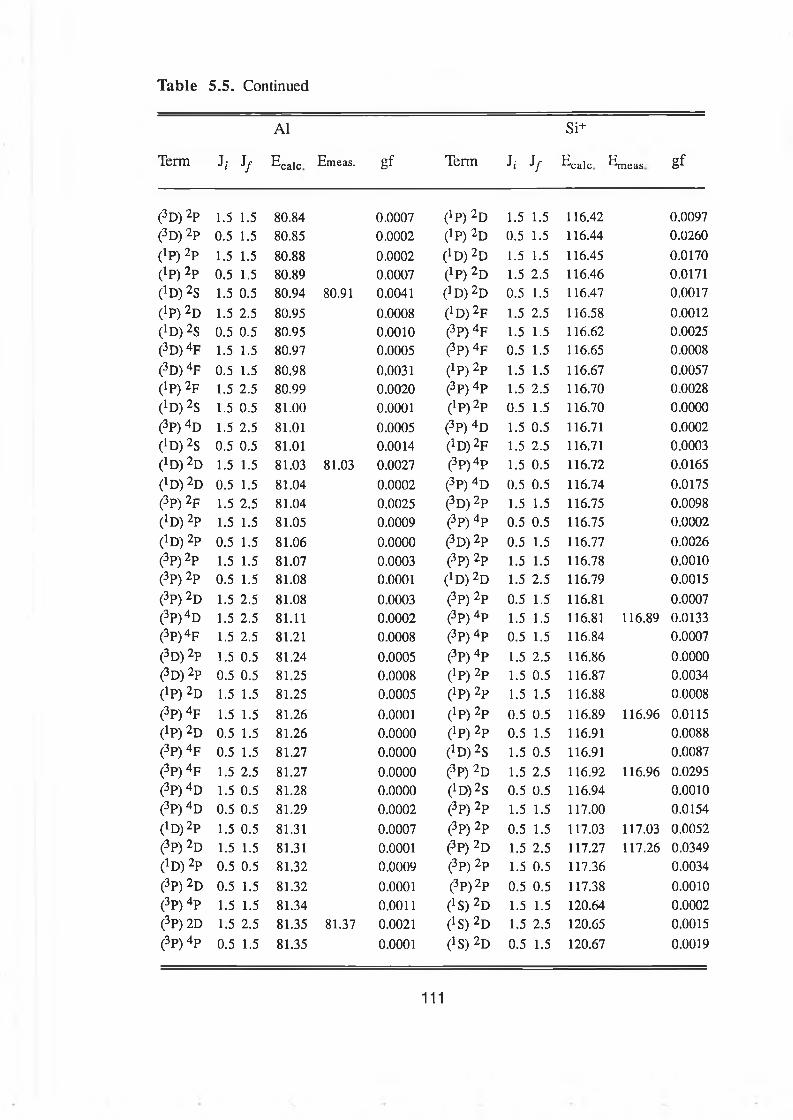
Table 5.5. Continued
Term 1 / Jy Ecajc Em eas. g f Term J(' Jy Ecajc E^gas g f
A1 Si+
(3D) 2p 1.5 1.5 80.84 0.0007 0 ? ) 2 d 1.5 1.5 116.42 0.0097(3D) 2p 0.5 1.5 80.85 0.0002 (!p) 2D 0.5 1.5 116.44 0.0260(ip) 2p 1.5 1.5 80.88 0.0002 (1D )2D 1.5 1.5 116.45 0.0170(1P) 2p 0.5 1.5 80.89 0.0007 (!p) 2D 1.5 2.5 116.46 0.0171i 1 D) 2S 1.5 0.5 80.94 80.91 0.0041 (iD ) 2D 0.5 1.5 116.47 0.0017
( l P) 2D 1.5 2.5 80.95 0.0008 (*D) 2f 1.5 2.5 116.58 0.0012^ D ) 2S 0.5 0.5 80.95 0.0010 (3P) 4F 1.5 1.5 116.62 0.0025(3D) 4f 1.5 1.5 80.97 0.0005 (3P) 4F 0.5 1.5 116.65 0.0008
(3D) 4f 0.5 1.5 80.98 0.0031 (!P) 2P 1.5 1.5 116.67 0.0057(*P) 2f 1.5 2.5 80.99 0.0020 (3P) 4P 1.5 2.5 116.70 0.0028(iD ) 2S 1.5 0.5 81.00 0.0001 ( ip )2? 0.5 1.5 116.70 0.0000
(3P) 4D 1.5 2.5 81.01 0.0005 (3P) 4 D 1.5 0.5 116.71 0.0002(iD ) 2S 0.5 0.5 81.01 0.0014 ( i D ) ^ 1.5 2.5 116.71 0.0003(!D) 2D 1.5 1.5 81.03 81.03 0.0027 (3P)4P 1.5 0.5 116.72 0.0165(iD ) 2D 0.5 1.5 81.04 0.0002 (3P) 4D 0.5 0.5 116.74 0.0175(3P) 2p 1.5 2.5 81.04 0.0025 (3D) 2P 1.5 1.5 116.75 0.0098(iD ) 2P 1.5 1.5 81.05 0.0009 (3p) 4P 0.5 0.5 116.75 0.0002
(iD ) 2P 0.5 1.5 81.06 0.0000 (3D) 2P 0.5 1.5 116.77 0.0026(3P) 2P 1.5 1.5 81.07 0.0003 (3P) 2P 1.5 1.5 116.78 0.0010(3P) 2P 0.5 1.5 81.08 0.0001 ( ! D ) 2D 1.5 2.5 116.79 0.0015
(3P) 2D 1.5 2.5 81.08 0.0003 (3P) 2P 0.5 1.5 116.81 0.0007(3P )4D 1.5 2.5 81.11 0.0002 (3P) 4 P 1.5 1.5 116.81 116.89 0.0133(3p)4p 1.5 2.5 81.21 0.0008 (3P) 4P 0.5 1.5 116.84 0.0007
(3D) 2P 1.5 0.5 81.24 0.0005 (3P) 4p 1.5 2.5 116.86 0.0000(3D) 2P 0.5 0.5 81.25 0.0008 (1P) 2P 1.5 0.5 116.87 0.0034(!P) 2D 1.5 1.5 81.25 0.0005 ( iP) 2p 1.5 1.5 116.88 0.0008
(3P) 4F 1.5 1.5 81.26 0.0001 (! P) 2P 0.5 0.5 116.89 116.96 0.0115(!p) 2D 0.5 1.5 81.26 0.0000 c1 P) 2P 0.5 1.5 116.91 0.0088(3P) 4F 0.5 1.5 81.27 0.0000 ( !D )2S 1.5 0.5 116.91 0.0087
(3P) 4F 1.5 2.5 81.27 0.0000 (3P) 2D 1.5 2.5 116.92 116.96 0.0295(3P) 4 D 1.5 0.5 81.28 0.0000 (1D )2S 0.5 0.5 116.94 0.0010(3P) 4 D 0.5 0.5 81.29 0.0002 (3P) 2P 1.5 1.5 117.00 0.0154( iD )2? 1.5 0.5 81.31 0.0007 (3P) 2P 0.5 1.5 117.03 117.03 0.0052(3P) 2D 1.5 1.5 81.31 0.0001 (3P) 2D 1.5 2.5 117.27 117.26 0.0349^ D ) 2P 0.5 0.5 81.32 0.0009 (3P) 2P 1.5 0.5 117.36 0.0034
(3P) 2D 0.5 1.5 81.32 0.0001 (3P) 2P 0.5 0.5 117.38 0.0010(3P) 4P 1.5 1.5 81.34 0.0011 ^ S ) 2D 1.5 1.5 120.64 0.0002(3P) 2D 1.5 2.5 81.35 81.37 0.0021 C1 S) 2D 1.5 2.5 120.65 0.0015(3P) 4P 0.5 1.5 81.35 0.0001 (}S ) 2d 0.5 1.5 120.67 0.0019
111
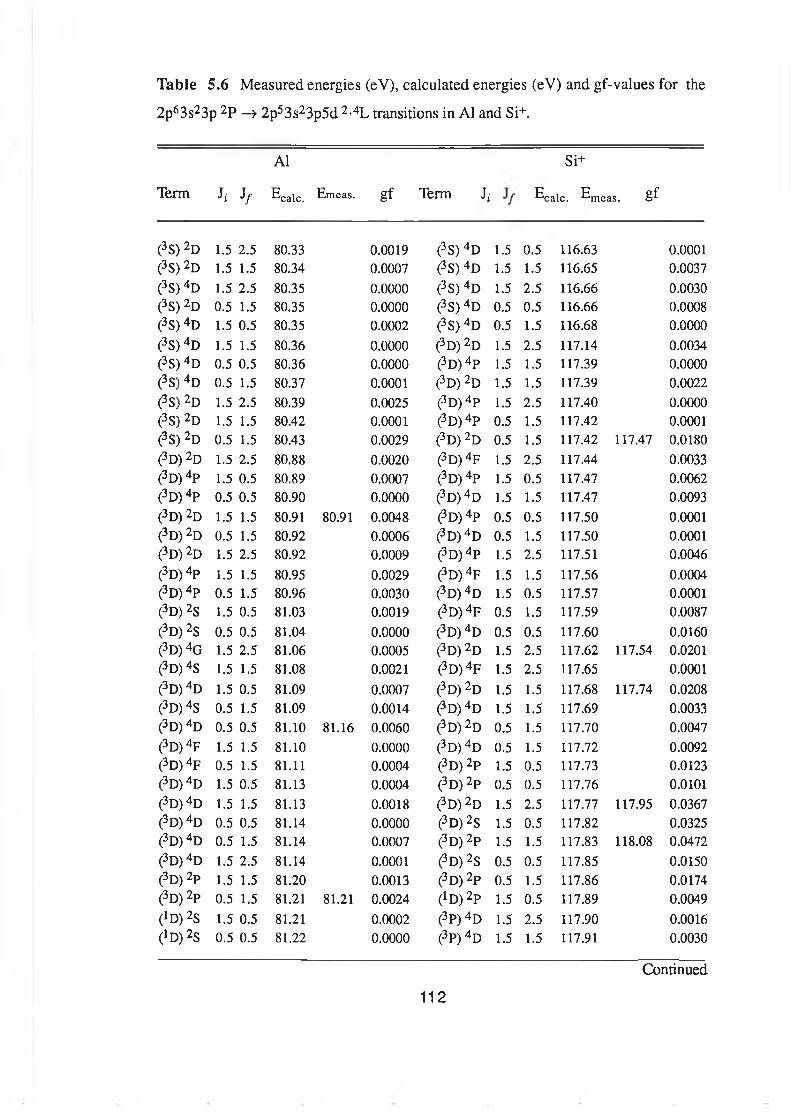
Table 5.6 Measured energies (eV), calculated energies (eV) and gf-values for the
2p63s23p 2P —» 2p53s23p5d 2>4L transitions in A1 and Si+.
Term h J/
A1
locale. Em eas. gf Term J;
Si+
locale. Emeas. g f
(3S) 2D 1.5 2.5 80.33 0.0019 (3S) 4D 1.5 0.5 116.63 0.0001(3S) 2D 1.5 1.5 80.34 0.0007 (3S) 4D 1.5 1.5 116.65 0.0037(3S) 4d 1.5 2.5 80.35 0.0000 (3S) 4D 1.5 2.5 116.66 0.0030(3S) 2d 0.5 1.5 80.35 0.0000 (3S )4D 0.5 0.5 116.66 0.0008(3S) 4d 1.5 0.5 80.35 0.0002 (3S) 4D 0.5 1.5 116.68 0.0000(3S) 4d 1.5 1.5 80.36 0.0000 (3D) 2d 1.5 2.5 117.14 0.0034(3S) 4d 0.5 0.5 80.36 0.0000 (3D) 4P 1.5 1.5 117.39 0.0000(3S) 4d 0.5 1.5 80.37 0.0001 (3D) 2d 1.5 1.5 117.39 0.0022(3S) 2d 1.5 2.5 80.39 0.0025 (3D )4P 1.5 2.5 117.40 0.0000(3S) 2d 1.5 1.5 80.42 0.0001 (3D )4P 0.5 1.5 117.42 0.0001(3S) 2d 0.5 1.5 80.43 0.0029 (3D) 2d 0.5 1.5 117.42 117.47 0.0180(3D) 2d 1.5 2.5 80.88 0.0020 (3D) 4f 1.5 2.5 117.44 0.0033(3D) 4p 1.5 0.5 80.89 0.0007 (3D) 4p 1.5 0.5 117.47 0.0062(3D) 4p 0.5 0.5 80.90 0.0000 (3D) 4d 1.5 1.5 117.47 0.0093(3D) 2d 1.5 1.5 80.91 80.91 0.0048 (3D )4P 0.5 0.5 117.50 0.0001(3D) 2d 0.5 1.5 80.92 0.0006 (3D )4D 0.5 1.5 117.50 0.0001(3D) 2d 1.5 2.5 80.92 0.0009 (3D) 4p 1.5 2.5 117.51 0.0046(3D) 4p 1.5 1.5 80.95 0.0029 (3D) 4f 1.5 1.5 117.56 0.0004(3D) 4p 0.5 1.5 80.96 0.0030 (3D) 4d 1.5 0.5 117.57 0.0001(3D) 2s 1.5 0.5 81.03 0.0019 (3D) 4f 0.5 1.5 117.59 0.0087(3D) 2s 0.5 0.5 81.04 0.0000 (3D) 4d 0.5 0.5 117.60 0.0160(3D) 4g 1.5 2.5 81.06 0.0005 (3D) 2d 1.5 2.5 117.62 117.54 0.0201(3D) 4s 1.5 1.5 81.08 0.0021 (3D )4F 1.5 2.5 117.65 0.0001(3D) 4d 1.5 0.5 81.09 0.0007 (3D) 2d 1.5 1.5 117.68 117.74 0.0208(3D) 4s 0.5 1.5 81.09 0.0014 (3D )4D 1.5 1.5 117.69 0.0033(3D) 4d 0.5 0.5 81.10 81.16 0.0060 (3D) 2d 0.5 1.5 117.70 0.0047(3D) 4f 1.5 1.5 81.10 0.0000 (3D )4D 0.5 1.5 117.72 0.0092(3D) 4f 0.5 1.5 81.11 0.0004 (3D) 2p 1.5 0.5 117.73 0.0123(3D) 4d 1.5 0.5 81.13 0.0004 (3D) 2p 0.5 0.5 117.76 0.0101(3D) 4d 1.5 1.5 81.13 0.0018 (3D) 2d 1.5 2.5 117.77 117.95 0.0367(3D) 4d 0.5 0.5 81.14 0.0000 (3 D )2S 1.5 0.5 117.82 0.0325(3D) 4d 0.5 1.5 81.14 0.0007 (3D) 2p 1.5 1.5 117.83 118.08 0.0472(3D) 4d 1.5 2.5 81.14 0.0001 (3D )2S 0.5 0.5 117.85 0.0150(3D) 2p 1.5 1.5 81.20 0.0013 (3D) 2p 0.5 1.5 117.86 0.0174(3D) 2p 0.5 1.5 81.21 81.21 0.0024 (iD )2? 1.5 0.5 117.89 0.0049(tD) 2S 1.5 0.5 81.21 0.0002 (3P) 4d 1.5 2.5 117.90 0.0016(*D) 2S 0.5 0.5 81.22 0.0000 (3P) 4d 1.5 1.5 117.91 0.0030
112Continued
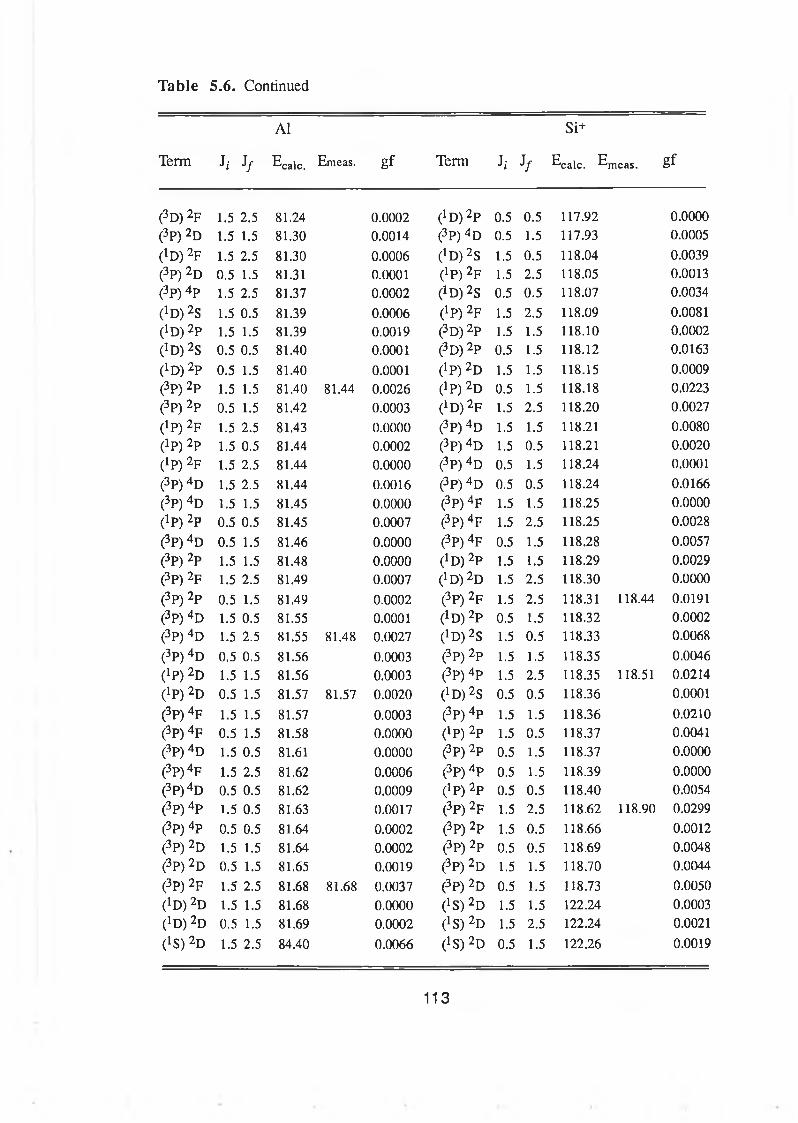
Table 5.6. Continued
Term h h
A1
Ecalc. Etneas. g f Term h J/
Si+
Ecalc. E,neas. g f
(3D) 2f 1.5 2.5 81.24 0.0002 (! D) 2P 0.5 0.5 117.92 0.0000(3P) 2D 1.5 1.5 81.30 0.0014 (3P) 4D 0.5 1.5 117.93 0.0005
(! D) 2f 1.5 2.5 81.30 0.0006 (1D )2S 1.5 0.5 118.04 0.0039(3P) 2D 0.5 1.5 81.31 0.0001 (1P) 2p 1.5 2.5 118.05 0.0013(3P) 4P 1.5 2.5 81.37 0.0002 (1D ) 2S 0.5 0.5 118.07 0.0034
(iD ) 2S 1.5 0.5 81.39 0.0006 (iP) 2F 1.5 2.5 118.09 0.0081(! D ) 2P 1.5 1.5 81.39 0.0019 (3D) 2P 1.5 1.5 118.10 0.0002( i D ) ^ 0.5 0.5 81.40 0.0001 (3D) 2P 0.5 1.5 118.12 0.0163
(*D) 2P 0.5 1.5 81.40 0.0001 (!p) 2D 1.5 1.5 118.15 0.0009(3P) 2p 1.5 1.5 81.40 81.44 0.0026 (! P) 2D 0.5 1.5 118.18 0.0223(3P) 2P 0.5 1.5 81.42 0.0003 (iD ) 2F 1.5 2.5 118.20 0.0027(tP) 2p 1.5 2.5 81.43 0.0000 (3P) 4D 1.5 1.5 118.21 0.0080( iP) 2p 1.5 0.5 81.44 0.0002 (3P) 4D 1.5 0.5 118.21 0.0020(*P) 2F 1.5 2.5 81.44 0.0000 (3P) 4 D 0.5 1.5 118.24 0.0001(3P) 4D 1.5 2.5 81.44 0.0016 (3P) 4D 0.5 0.5 118.24 0.0166
(3P) 4D 1.5 1.5 81.45 0.0000 (3P) 4F 1.5 1.5 118.25 0.0000(tp) 2p 0.5 0.5 81.45 0.0007 (3P) 4p 1.5 2.5 118.25 0.0028
(3P) 4D 0.5 1.5 81.46 0.0000 (3P) 4F 0.5 1.5 118.28 0.0057(3P) 2P 1.5 1.5 81.48 0.0000 (! D ) 2P 1.5 1.5 118.29 0.0029(3P) 2F 1.5 2.5 81.49 0.0007 ^ D ) 2D 1.5 2.5 118.30 0.0000(3P) 2P 0.5 1.5 81.49 0.0002 (3P) 2F 1.5 2.5 118.31 118.44 0.0191(3P) 4D 1.5 0.5 81.55 0.0001 (! D )2P 0.5 1.5 118.32 0.0002(3P) 4D 1.5 2.5 81.55 81.48 0.0027 (!D )2S 1.5 0.5 118.33 0.0068
(3P) 4D 0.5 0.5 81.56 0.0003 (3p) 2P 1.5 1.5 118.35 0.0046(!P) 2D 1.5 1.5 81.56 0.0003 (3p) 4P 1.5 2.5 118.35 118.51 0.0214
(!P) 2D 0.5 1.5 81.57 81.57 0.0020 (!D )2S 0.5 0.5 118.36 0.0001(3P) 4F 1.5 1.5 81.57 0.0003 (3P) 4P 1.5 1.5 118.36 0.0210(3P) 4F 0.5 1.5 81.58 0.0000 (! P) 2P 1.5 0.5 118.37 0.0041(3P) 4D 1.5 0.5 81.61 0.0000 (3P) 2P 0.5 1.5 118.37 0.0000(3p ) 4f 1.5 2.5 81.62 0.0006 (3P) 4P 0.5 1.5 118.39 0.0000(3P )4D 0.5 0.5 81.62 0.0009 ^ P ) 2P 0.5 0.5 118.40 0.0054(3P) 4P 1.5 0.5 81.63 0.0017 (3P) 2F 1.5 2.5 118.62 118.90 0.0299
(3P) 4P 0.5 0.5 81.64 0.0002 (3P) 2P 1.5 0.5 118.66 0.0012(3P) 2D 1.5 1.5 81.64 0.0002 (3P) 2P 0.5 0.5 118.69 0.0048(3P) 2D 0.5 1.5 81.65 0.0019 (3P) 2D 1.5 1.5 118.70 0.0044
(3P) 2f 1.5 2.5 81.68 81.68 0.0037 (3P) 2d 0.5 1.5 118.73 0.0050(iD ) 2D 1.5 1.5 81.68 0.0000 (1S ) 2D 1.5 1.5 122.24 0.0003(*D) 2D 0.5 1.5 81.69 0.0002 (JS) 2D 1.5 2.5 122.24 0.0021
(!S) 2D 1.5 2.5 84.40 0.0066 (1S ) 2D 0.5 1.5 122.26 0.0019
113
5.4 Conclusions
In this work a comprehensive investigation of the 2p absorption spectra of
A1 and Si+, recorded using the dual laser-produced plasma technique, have been
carried o u t . A combination of photoabsorption and theoretical studies along the
isoelectronic sequence have been successfully employed for explaining the measured spectra.
The investigations presented in this work are not in agreement with those
of Cantu et al. (1982) and Daum and Kelly (1976) reported for A1 and Si+ respectively. In the case of A1 all the strong features were assigned to the
2p53s23p4s array by Cantu etal. (1982). Though the calculated term energies and
relative intensities were in reasonable agreement with the observed features we
believe the analysis presented by Cantu and co-workers is not reliable for the following reasons: i) the contribution of 2p -> 3d transitions was seriously underestimated, and (ii) no configuration-interaction effects were taken into
account in the semi-empirical approach used. In the photoionization calculations of
Si+ (Daum and Kelly 1976), the resonances belonging to the 2p53s3p3
configuration were not included. Our calculations, where almost all significant interactions have been included, predict that the 2p absorption spectra for both A1
and Si+ are dominated by the 2p63s23p -» 2p53s3p3 + 2p53s23pnd transitions and
the 2p63s23p -> 2p53s23pns transitions are relatively very weak which has also
been found to be in agreement with the experiment.
114

5.5 References
Carroll P K and Kennedy E T, 1977, Phys. Rev. Lett., 3 8, 1068.
Costello J T, Evans D, Hopkins R B, Kennedy E T, Kieman L, Mansfield M W D, Mosnier J-P, Sayyad M H and Sonntag B F, 1992, J. Phys. B: At. Mol. Phys., 2 5, 5055.
Daum G R and Kelly H P, 1976, Phys. Rev. A 13, 715.
Dufton P L, Keenan F P, Hibbert A, Ojha P C and Stafford R P, 1992, The Astophysical Journal, 3 8 7, 414.
Hibbert A, Kinston A E and Tiwary S N, 1982, J. Phys. B: At. Mol. Phys., 15, L643.
Hibbert A, 1989, Physica Scripta, 3 9, 574.
Malutzki R, Watcher A, Schmidth V and Hansen J E, 1987, J. Phys. B: At. Mol. Phys., 20, 5411.
Martin W C and Zalubas R, 1979, J. Phys. Chem. Ref. Data, 8, 820.
Martin W C and Zalubas R, 1979, J. Phys. Chem. Ref. Data, 8, 826.
Martin W C and Zalubas R, 1983, J. Phys. Chem. Ref. Data, 12, 342.
Martin W C and Zalubas R, 1983, J. Phys. Chem. Ref. Data, 8, 347.
Martinson I, 1989, Rep. Prog. Phys., 52, 157.
Mosnier J-P, Costello J T, Kennedy E T, Kieman L and Sayyad M H, 1994, Phys. Rev. A 4 9, 755.
Cantu A M and Tozzi G P, 1982, J. Opt. Soc. Am., 7 2, 729.
115

Tayal S S and Burke P G, 1987, J. Phys. B: At. Mol. Phys., 2 0, 4715.
116

Cfmpttr 6
THE GROUND STATE ABSORPTION IN ATOMIC SILICON
The photoabsorption spectrum o f atom ic Si is reported in the 1 0 3 eV to 113 eV region.
The absorption features in this region arise from the excitation o f 2p electron s. Interpretation for
the m easured spectrum is provided on the basis o f con figu ratio n -in teraction atom ic structure
calculations. Com parison is m ade with the 2p absorption in gas p hase SiH 4.
6.1 Introduction
The study of the spectrum involving inner-shell excitations is a valuable
tool to establish connections between the behaviour of free atoms and those in molecules, clusters and solids, currently an important thrust of research (see e.g. Connerade et al. 1987, Connerade andKamatak 1990, Costello et al. 1991). Most
frequently inner-shell excitation in molecules and solids exhibit spectra similar to those of the constituent atoms. For example, inner-shell excitations in molecules and solids exhibit giant resonances if the constituent atoms do so. The persistence of these resonances indicate that the effect originates inside the constituent atoms,
where the initial- and final state wavefunctions are only slightly perturbed by the external environment (Bnechignac et al. 1991). Considerable attention has been paid to the phenomenon of giant resonances and its consequences (Connerade et
al. 1987 and references therein). The basic mechanism of giant-resonance formation has been explained in terms of a collective oscillation of an electron shell as well as within the framework of an independent particle model (Clark 1987 and
references therein). Their formation involves one-electron excitations which have very significant probability in molecules as well as solids. Therefore, they have been observed in the inner-shell spectra of metals and molecules. Close similarities have been observed between the inner-shell spectra of metals, molecules and their
constituent atoms exhibiting giant resonances (see e.g. Costello et al. 1991) because the transitions take place between the orbits which are deep within the
117
atom and, therefore, are not influenced by the environment. The 4d and 3p photoabsorption studies in rare-earths (see e.g. Richter et al. 1989) and 3d
elements (see e.g. Sonntag and Zimmermann 1992), respectively, and their molecules has played a major role not only in establishing relations between the behaviour of these atoms and their molecules but also proved of great value in understanding the various aspects of giant resonances (Connerade et al. 1987 and
references therein).For more than two decades second row atoms and their molecules have
been the subject of 2p-subshell photoabsorption/photoionization investigations.
However, in spite of intense efforts their spectra have not been thoroughly investigated. The 2p-subshell photoabsorption/photoionization measurements have been made in Na (Connerade et al. 1971, Wolff et al. 1972), Mg (see chapter 4 and references therein) and Al (see chapter 5 and references therein) atoms but to our knowledge corresponding spectra of their molecules have not been reported. On the other hand the 2p-subshell photoabsorption have been studied extensively in the molecules of Si (Hayes etal. 1971, Hayes and Brown 1972, de Souza etal. 1986, Sutherland etal. 1994), P (Hayes and Brown 1972, Ishiguro etal. 1987), S (Hayes and Brown 1972, Hudson etal. 1993, 1994) and Cl (Hayes and Brown 1972, Aksela et al. 1990) but the corresponding spectra of these atoms have not
been reported. Therefore, it was not possible to study the behaviour of second row atoms and their molecules in their 2p photoabsorption spectra . With this in mind, the photoabsorption investigations of the 2p-subshell spectrum of atomic Si has
been carried out and comparison is made with the gas phase 2p absorption spectrum of SiH4 reported by Hayes etal. (1971, 1972).
The investigations and identification of the 2p photoabsorption spectra of atomic Si will be reported first. Then, comparison will be made with the
corresponding photoabsorption spectrum of gas phase SiH4.
6.2 Results and analysis
The ground configuration 2p63s23p2 of Si neutral includes the 3P0 ,1,2» ^
and iSo levels. The 3P 1? 3P2, !D2 and levels lie 77.115 cm '1, 223.157 cm-1, 6298.850 cm"1, 15394.370 cm-1, respectively, above the ground state 3P0 and lie lower than the levels of the excited configurations (Martin and Zalubas 1983).
Therefore, in the dual laser plasma experiment, optimised for Si neutral, all of
118
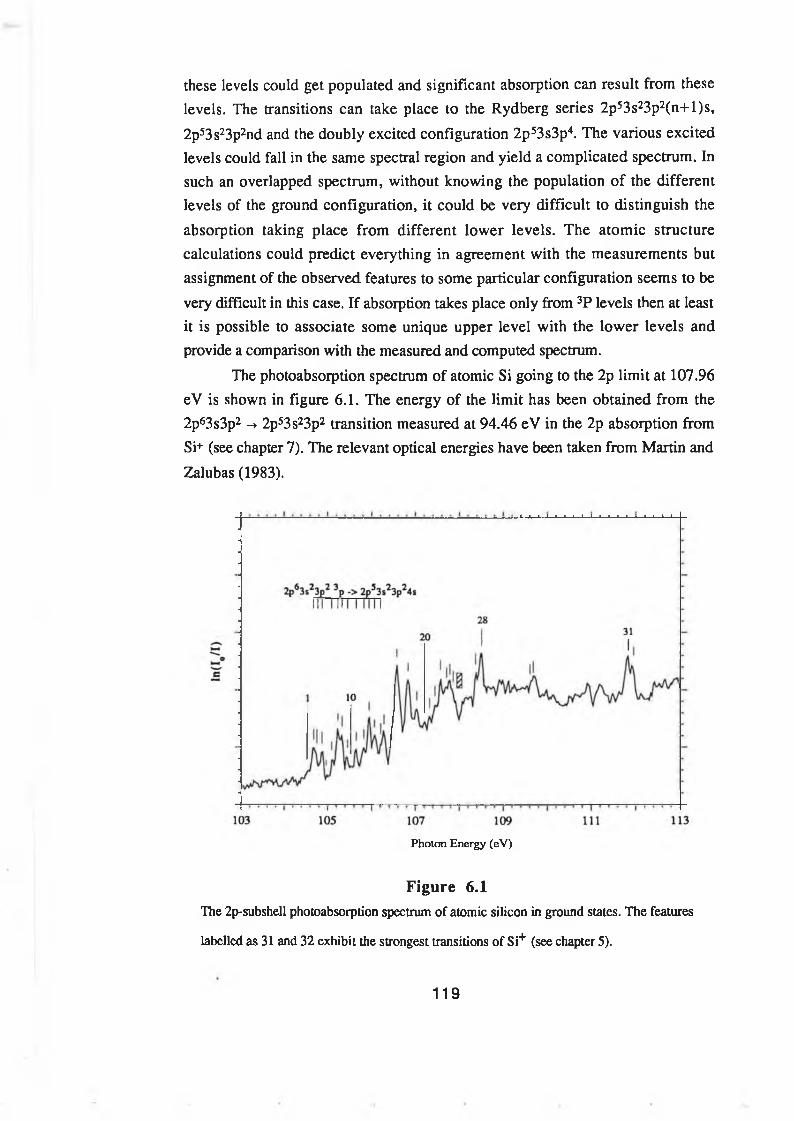
these levels could get populated and significant absorption can result from these levels. The transitions can take place to the Rydberg series 2p53s23p2(n+l)s,
2p53s23p2nd and the doubly excited configuration 2p53s3p4. The various excited levels could fall in the same spectral region and yield a complicated spectrum. In such an overlapped spectrum, without knowing the population of the different levels of the ground configuration, it could be very difficult to distinguish the absorption taking place from different lower levels. The atomic structure calculations could predict everything in agreement with the measurements but assignment of the observed features to some particular configuration seems to be
very difficult in this case. If absorption takes place only from 3P levels then at least it is possible to associate some unique upper level with the lower levels and provide a comparison with the measured and computed spectrum.
The photoabsorption spectrum of atomic Si going to the 2p limit at 107.96 eV is shown in figure 6.1. The energy of the limit has been obtained from the 2p63s3p2 -» 2p53s23p2 transition measured at 94.46 eV in the 2p absorption from Si+ (see chapter 7). The relevant optical energies have been taken from Martin and
Zalubas (1983).
Photon Energy (eV )
Figure 6.1The 2p-subshell photoabsorption spectrum o f atom ic silicon in ground states. T h e features
labelled as 31 and 3 2 exhibit the strongest transitions o f Si+ (see chapter 5 ).
119
The observed Si I energies and their assignments are listed in tables 6.1, 6.2 and 6.3. The assignments are given on the basis of scaled atomic structure
calculations (see chapter 2) carried out for the 2p63s23p2 + 2p63p4 -» 2p5[3s23p2(4s + 5s + 6s) + 3s23p2(3d + 4d) + 3s3p4] transitions. The HF integrals I* (i, i), Fk (i,
j), Gk (i, j), Rk (i, j) and Ç (i) have been scaled by 15%, 15%, 15%, 25% and 10%
respectively. The 2p63p4 configuration has been included to provide configuration-
interaction effects in the ground states. No extra configuration-interaction effects have been included in the core-excited states. The core-excited 2p53s23p2nd series has been found mixed with the doubly excited 2p53s3p4 configuration, however, the mixing is not severe. On the other hand, the 2p53s23p2(n+l)s series have been
observed not to mix with the 2p53s23p2nd series and the 2p53s3p4 configuration.
6.2.1 Transitions from 2p63s23p2 3P0? ^ 2 lev e ls
From 3P0 j 2 levels transitions to the 3L terms are expected to appear strongly. Departures from LS coupling will allow transitions to the 5L and ’L
terms. In the case of the 2p53s23p2(n+l)s series significant mixing has been observed between the 3L and 5L terms, therefore, strong transitions have been predicted to only the 3L and 5L terms (see table 6.1). Transitions to the !L terms
have been predicted with negligible gf-values and along with the other transitions predicted with negligible gf-values have been deleted in table 6.1. With the exception of the two lowest terms there is excellent agreement between the computed and measured term energies. Analogous to the 2p absorption in atomic
Mg (see chapter 4) and atomic A1 (see chapter 5) the whole lower energy region is dominated by the 2p -* 4s transition airay. The 2p -» 5s and 6s transitions are predicted very weak and degenerate with the very strong transitions resulting from the 2p -> 3d transitions, therefore, their identification here is not possible.
In the case of transitions to 2p53s23p23d and 2p53s23p24d configurations, out of the total 470 possible transitions (see Appendix C) only 50 transitions have
been predicted with non-negligible gf-values and their assignment is given in table6.2. In the region from 106.44 eV to 106.81 eV, a number of transitions have been predicted. But in this region only the peaks 17 and 18 (Figure 6.1) appear as resolved. These two peaks appear as strongest in the 2p absorption spectrum of
atomic Si. The computed energy of the (3P) 3P2 -» (!D) !F3 transition predicted as strongest is in agreement with the measured energy of peak 18, therefore, this
120
transition can be assigned to peak 18. The gf-value of the transition having energy corresponding to the measured energy of the strongest feature (peak 17) has been
predicted almost zero and analogous to the 2p absorption in atomic A1 (see chapter 5). The gf-value of the transition corresponding to the strongest observed feature in atomic AI was predicted almost zero. In the calculations carried out for the isoelectronic ion Si+ the same transition was predicted as the strongest and was in
agreement with the experiment. Therefore, assignment was given on the basis of isoelectronic comparison of measured and computed spectra. In the present case the calculations carried out for P+ which is isoelectronic to atomic Si predict the
same transition as the strongest. Therefore, we believe the computed gf-values for neutrals are not reliable. The zero gf predicted for the strongest transition in atomic Si could be due to cancellation effects which have been observed frequently (see
chapter 2).The doubly excited 2p53s3p4 configuration has 40 terms (see Appendix C).
The transitions to the 3L terms expected to appear as strong have been predicted far above the 2p threshold. On the other hand, transitions to the 5L terms which are
dipole forbidden in pure LS coupling have been predicted all below the 2p threshold with the exception of transitions to the (3P) 5St term. No significant mixing has been observed between the 5L terms of the 2p53s3p4 configuration with
the terms of 2p53s23p2nd series. As the transitions to the doubly excited states borrow strength mainly through mixing with the most favourable transitions to the nd series, therefore, transitions to the doubly excited states have been predicted
with negligible gf-values. However, analogous to the Al isoelectronic sequence (see chapter 5), the 3L terms of the doubly excited configuration in P+ isoelectronic to Si I will drop below the the 2p threshold. Their mixing with the terms of the 2p53s23p2nd series could give rise to some strong transitions to the doubly excited
states. Furthermore, the strong interaction between the doubly and singly excited states in P+ could yield relatively complicated spectrum and make the identification difficult.
121
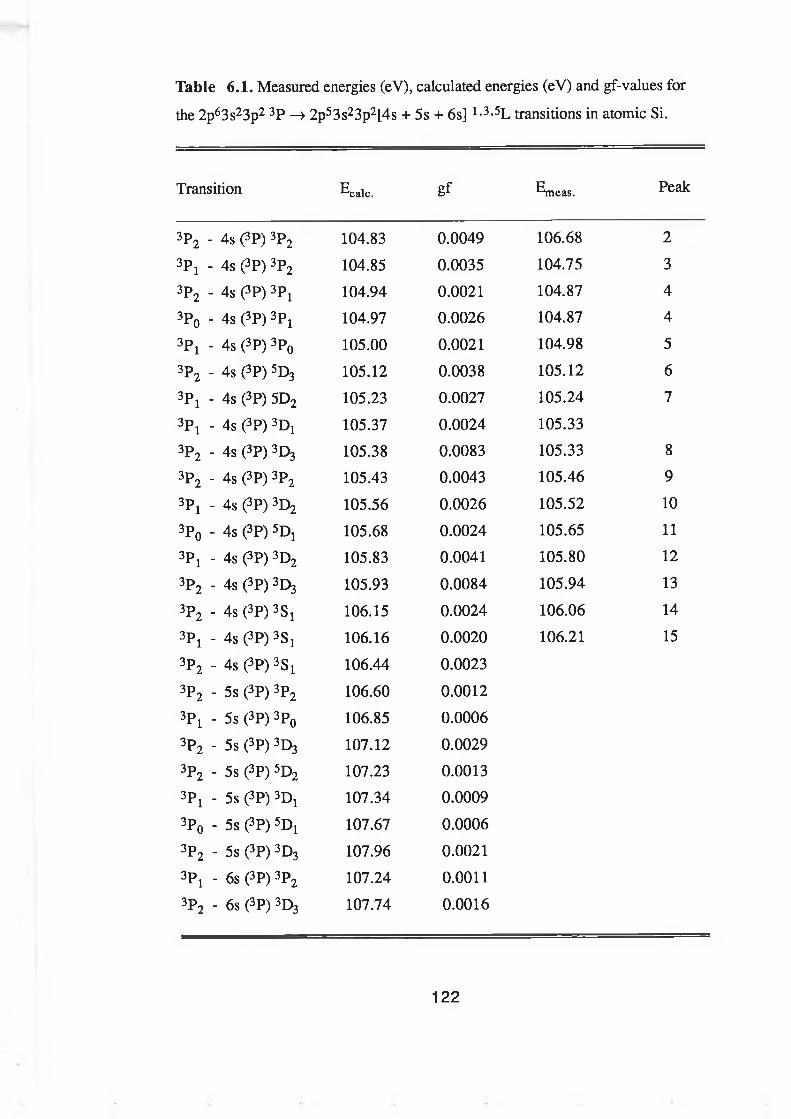
Table 6.1. Measured energies (eV), calculated energies (eV) and gf-values for
the 2p63s23p2 3P —» 2p53s23p2[4s + 5s + 6s] 1-3>5L transitions in atomic Si.
Transition Ecalc. gf ^meas. Peak
3P2 - 4s C»P) 3P2 104.83 0.0049 106.68 2
3P X - 4s (3P) 3P2 104.85 0.0035 104.75 3
3P2 - 4s ^P) 3Pi 104.94 0.0021 104.87 4
3P0 - 4s (3P) 3Pl 104.97 0.0026 104.87 4
3Pi - 4s (SP) 3P0 105.00 0.0021 104.98 5
3P 2 - 4s (3P) 5D3 105.12 0.0038 105.12 6
3Pi - 4s (SP) 5D2 105.23 0.0027 105.24 7
3Pi - 4s (3P) 3DX 105.37 0.0024 105.33
3P2 - 4s (3P) 3D3 105.38 0.0083 105.33 8
3P2 - 4s (3P) 3P2 105.43 0.0043 105.46 9
3Pi - 4s ^P) 3D2 105.56 0.0026 105.52 10
3P0 - 4s (5P) 5Di 105.68 0.0024 105.65 11
3Pi - 4s (5P) 3D2 105.83 0.0041 105.80 12
3P2 - 4s (3P) 3E>3 105.93 0.0084 105.94 13
3P2 - 4s (SP) 3SX 106.15 0.0024 106.06 14
3P X - 4s (3P) 3Sj 106.16 0.0020 106.21 15
3P2 - 4s (3P ) 3S! 106.44 0.0023
3P2 - 5s (3P) 3P2 106.60 0.0012
3P l - 5s (3P) 3P0 106.85 0.0006
3P2 - 5s (3p) 3D3 107.12 0.0029
3P2 - 5s (3P) 5D2 107.23 0.0013
3Pj - 5s (3P) 3Di 107.34 0.0009
3P0 - 5s (SP) 5Dl 107.67 0.0006
3P2 - 5s (5P) 3D3 107.96 0.0021
3Pi - 6s (3P) 3P2 107.24 0.0011
3P2 - 6s (3P) 3D3 107.74 0.0016
122
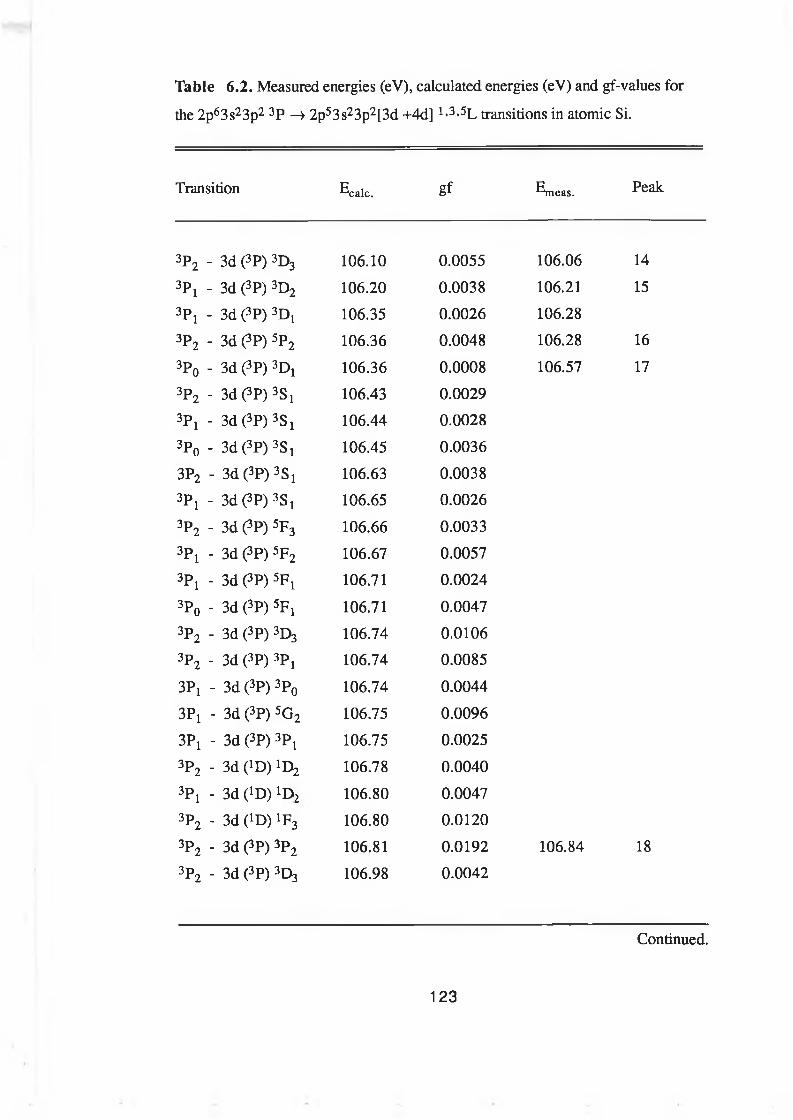
Table 6.2. Measured energies (eV), calculated energies (eV) and gf-values for
the 2p63s23p2 3P —» 2p53s23p2[3d +4d] li3-5L transitions in atomic Si.
Transition ^calc. gf Emcas. Peak
3P2 - 3d (3P) 3D3 106.10 0.0055 106.06 14
3P ! - 3d (3P) 3D2 106.20 0.0038 106.21 15
3Pi - 3d (3P) 3Dt 106.35 0.0026 106.28
3P2 - 3d (3P) 5P2 106.36 0.0048 106.28 16
3P0 - 3d (3P) 3Di 106.36 0.0008 106.57 17
3P2 - 3d(3P ) 3S1 106.43 0.0029
3Pj - 3 d (3P ) 3Si 106.44 0.0028
3P0 - 3d (3P) 3Si 106.45 0.0036
3P2 - 3d (3P) 3Si 106.63 0.0038
3P! - 3d(3P ) 3S1 106.65 0.0026
3P2 - 3d (3p) 5 f3 106.66 0.0033
3Pi - 3d (?P) 5F2 106.67 0.0057
3P t - 3d (5P) 5Fl 106.71 0.0024
3P0 - 3d (SP) 5Fj 106.71 0.0047
3P2 - 3d (3P) 3D3 106.74 0.0106
3P2 - 3d (SP) 3Pj 106.74 0.0085
3Pi - 3d (3P) 3P0 106.74 0.0044
3Pi - 3d (3P) 5G2 106.75 0.0096
3Pt - 3d (3P) 3P X 106.75 0.0025
3P2 - 3d (ID) !D2 106.78 0.0040
3P i - 3d (ID) iDz 106.80 0.0047
3P2 - 3d (ID) !F3 106.80 0.0120
3P2 - 3 d m 3P2 106.81 0.0192 106.84 18
3P2 - 3d (3P) 3D, 106.98 0.0042
Continued.
123
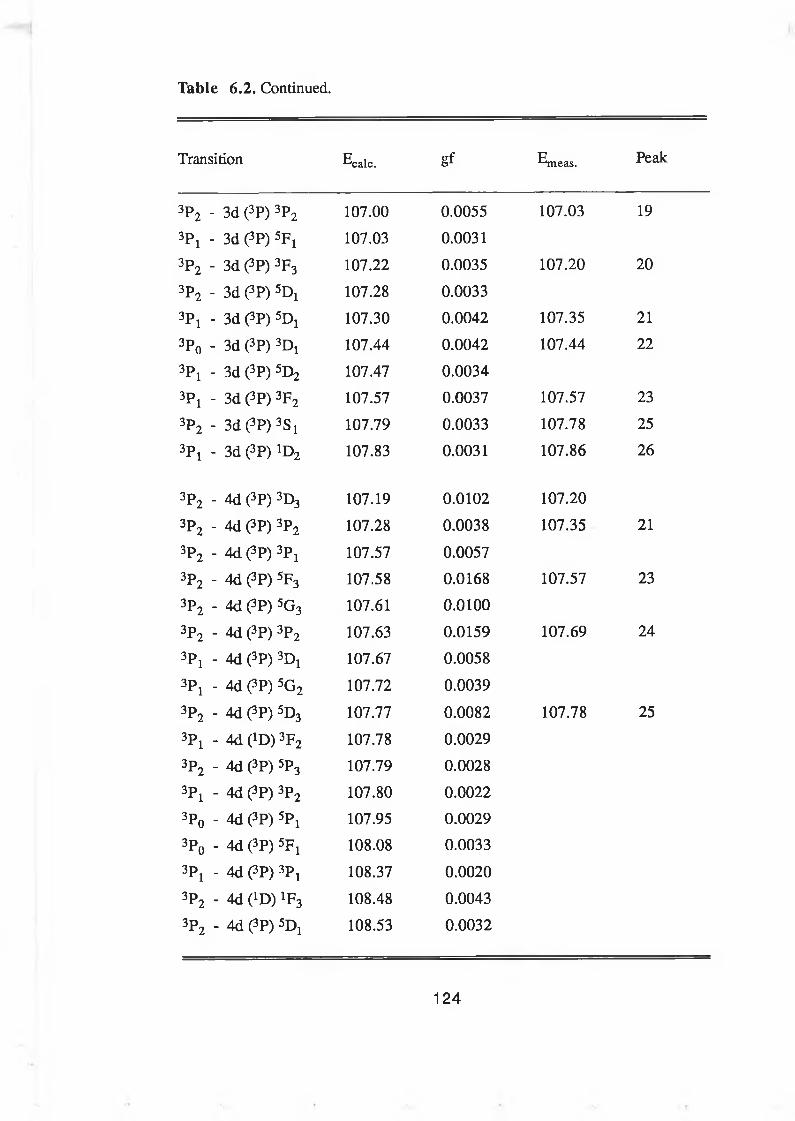
Table 6.2. Continued.
Transition ^calc. gf ^meas. Peak
3P2 - 3d(3p)3p2 107.00 0.0055 107.03 19
3Pj - 3d (3p) 5Fi 107.03 0.0031
3p2 - 3d (3p) 3F3 107.22 0.0035 107.20 20
3?2 - 3d(3P)5D! 107.28 0.0033
3Pj - 3d (3p) SDi 107.30 0.0042 107.35 21
3p0 - 3d (3P) 3Dt 107.44 0.0042 107.44 22
3Pi - 3d (3P) 5D2 107.47 0.0034
3Pj - 3d (3P) 3F2 107.57 0.0037 107.57 23
3p2 - 3d (3P ) 3S1 107.79 0.0033 107.78 25
3Pi - 3d(3P )iD 2 107.83 0.0031 107.86 26
3P2 - 4d (3p) 3D3 107.19 0.0102 107.20
3p2 - 4d (3P) 3p2 107.28 0.0038 107.35 21
3P2 - 4d (3p) 3pL 107.57 0.0057
3P2 - 4d (3p) 5 f3 107.58 0.0168 107.57 23
3p2 - 4d (3p) 5G3 107.61 0.0100
3p2 - 4d (3p) 3P2 107.63 0.0159 107.69 24
3Pj - 4d (3p) 3Di 107.67 0.0058
3px - 4d (3p) 5G2 107.72 0.0039
3p2 - 4d (3p) 5d3 107.77 0.0082 107.78 25
3Pi - 4d (*D) 3F2 107.78 0.0029
3p2 - 4d (3P) 5p3 107.79 0.0028
3P! - 4d (3P) 3p2 107.80 0.0022
3P0 - 4d (3p) 5pi 107.95 0.0029
3p0 - 4d (3p) 5F! 108.08 0.0033
3Pi - 4d (3P) 3Pj 108.37 0.0020
3p2 - 4d (!D) !F3 108.48 0.0043
3p2 - 4d (3p) SDi 108.53 0.0032
124
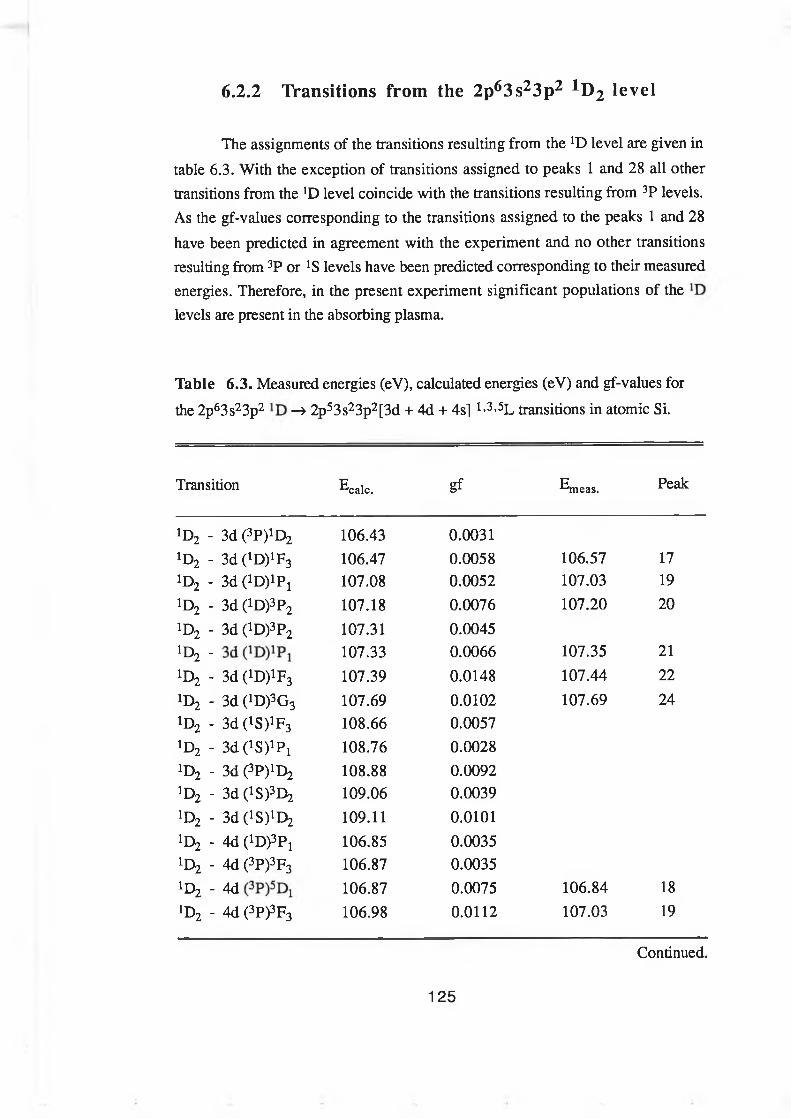
6.2.2 Transitions from the 2p63 s23p2 *D2 leve l
The assignments of the transitions resulting from the !D level are given in
table 6.3. With the exception of transitions assigned to peaks 1 and 28 all other transitions from the *D level coincide with the transitions resulting from 3P levels. As the gf-values coiresponding to the transitions assigned to the peaks 1 and 28
have been predicted in agreement with the experiment and no other transitions resulting from 3P or !S levels have been predicted coiTesponding to their measured energies. Therefore, in the present experiment significant populations of the levels are present in the absorbing plasma.
Table 6.3. Measured energies (eV), calculated energies (eV) and gf-values for
the 2p63s23p2 -> 2p53s23p2[3d + 4d + 4s] 1*3-5L transitions in atomic Si.
Transition ^calc. gf Emeas. Peak
1D2 - 3d(3p)iD2 106.43 0.0031*D2 - 3d (1D)1F3 106.47 0.0058 106.57 171D2 - 3d(iD )iP! 107.08 0.0052 107.03 191D2 - 3d (1D)3P2 107.18 0.0076 107.20 20
*D2 - 3 d (1D)3P2 107.31 0.0045!D2 - 107.33 0.0066 107.35 21
1D2 - 3d (1D)1F3 107.39 0.0148 107.44 22
*D2 - 3d (1D)3G3 107.69 0.0102 107.69 24*D2 - 3d (1S)1F3 108.66 0.0057!D2 - S d ^ S ) ^ 108.76 0.0028!D2 - 3 d (3P)1D2 108.88 0.00921D2 - 3d(iS )3D2 109.06 0.0039lD2 - 3 d (1S)lD2 109.11 0.0101!D2 - 4d (iD ^Pi 106.85 0.0035!D2 - 4d (3P)3F3 106.87 0.0035!D2 - 4d 106.87 0.0075 106.84 18!D2 - 4d (3P)3F3 106.98 0.0112 107.03 19
Continued.
125
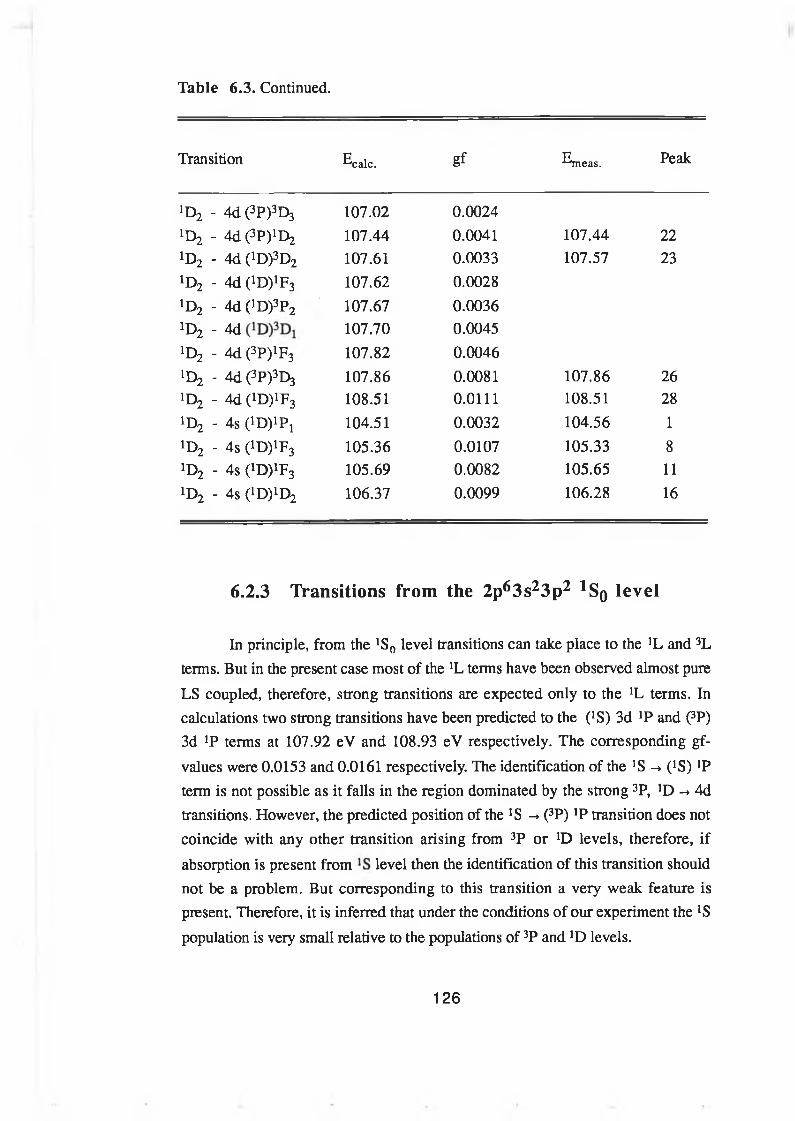
Table 6.3. Continued.
Transition ^calc. gf Emeas. Peak
jD2 - 4 d (3P)3D3 107.02 0.0024*D2 - 4 d (3P)1D2 107.44 0.0041 107.44 221D2 - 4d (1D)3D2 107.61 0.0033 107.57 23*D2 - 4d (1D)1F3 107.62 0.00281D2 - 4d (1D)3P2 107.67 0.0036*D2 - 4d 107.70 0.0045!D2 - 4d (3P)1F3 107.82 0.0046!D2 - 4 d (3P)3E>3 107.86 0.0081 107.86 26!D2 - 4d (1D)1F3 108.51 0.0111 108.51 28!D2 - 4s OD)1?! 104.51 0.0032 104.56 1!D2 - 4s (1D)1F3 105.36 0.0107 105.33 8!D2 - 4s (1D)1F3 105.69 0.0082 105.65 11!D2 - 4s (1D)1D2 106.37 0.0099 106.28 16
6.2.3 Transitions from the 2p63s23p2 1Sq lev e l
In principle, from the ’Sq level transitions can take place to the !L and 3L terms. But in the present case most of the *L terms have been observed almost pure
LS coupled, therefore, strong transitions are expected only to the !L terms. In calculations two strong transitions have been predicted to the (’S) 3d !P and (3P) 3d !P terms at 107.92 eV and 108.93 eV respectively. The corresponding gf-
values were 0.0153 and 0.0161 respectively. The identification of the ’S -> (!S) *P term is not possible as it falls in the region dominated by the strong 3P, ’D -> 4d transitions. However, the predicted position of the !S -> (3P) !P transition does not coincide with any other transition arising from 3P or !D levels, therefore, if
absorption is present from level then the identification of this transition should not be a problem. But corresponding to this transition a very weak feature is present. Therefore, it is inferred that under the conditions of our experiment the !S
population is very small relative to the populations of 3P and *D levels.
126
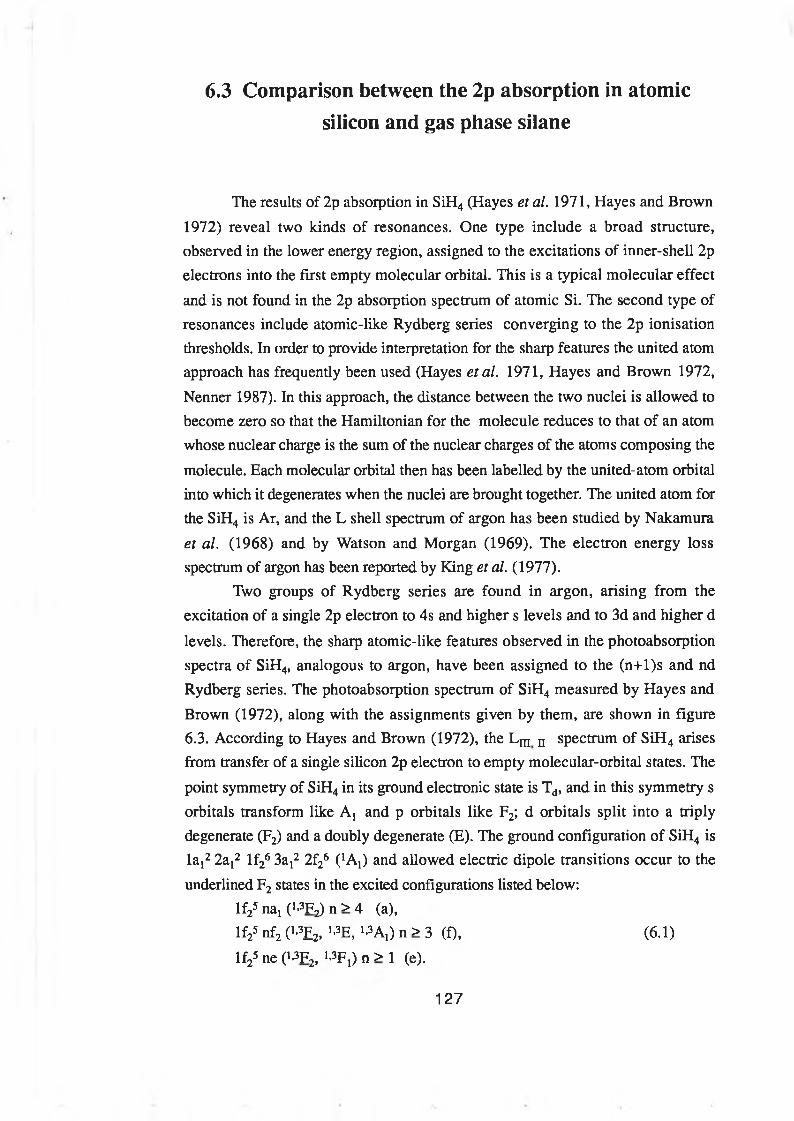
6.3 Comparison between the 2p absorption in atomic silicon and gas phase silane
The results of 2p absorption in SiH4 (Hayes et al. 1971, Hayes and Brown 1972) reveal two kinds of resonances. One type include a broad structure, observed in the lower energy region, assigned to the excitations of inner-shell 2p electrons into the first empty molecular orbital. This is a typical molecular effect
and is not found in the 2p absorption spectrum of atomic Si. The second type of resonances include atomic-like Rydberg series converging to the 2p ionisation thresholds. In order to provide interpretation for the sharp features the united atom approach has frequently been used (Hayes etal. 1971, Hayes and Brown 1972,
Nenner 1987). In this approach, the distance between the two nuclei is allowed to become zero so that the Hamiltonian for the molecule reduces to that of an atom whose nuclear charge is the sum of the nuclear charges of the atoms composing the
molecule. Each molecular orbital then has been labelled by the united-atom orbital into which it degenerates when the nuclei are brought together. The united atom for the SiH4 is Ar, and the L shell spectrum of argon has been studied by Nakamura et al. (1968) and by Watson and Morgan (1969). The electron energy loss spectrum of argon has been reported by King et al. (1977).
Two groups of Rydberg series are found in argon, arising from the excitation of a single 2p electron to 4s and higher s levels and to 3d and higher d
levels. Therefore, the sharp atomic-like features observed in the photoabsorption spectra of SiH4, analogous to argon, have been assigned to the (n+l)s and nd Rydberg series. The photoabsorption spectrum of SiH4 measured by Hayes and Brown (1972), along with the assignments given by them, are shown in figure 6.3. According to Hayes and Brown (1972), the Lm n spectrum of SiH4 arises from transfer of a single silicon 2p electron to empty molecular-orbital states. The
point symmetry of SiH4 in its ground electronic state is Td, and in this symmetry s orbitals transform like A, and p orbitals like F2; d orbitals split into a triply degenerate (F2) and a doubly degenerate (E). The ground configuration of SiH4 is la t2 2a^ lf26 3a!2 2f26 (!At) and allowed electric dipole transitions occur to the
underlined F2 states in the excited configurations listed below: lf25na1(i.3F2) n > 4 (a),lf2s nf2 (WE* i.3E, ^A j) n > 3 (f), (6.1)lf25 ne (‘.3F2, i.3Fi) n > 1 (e).
127
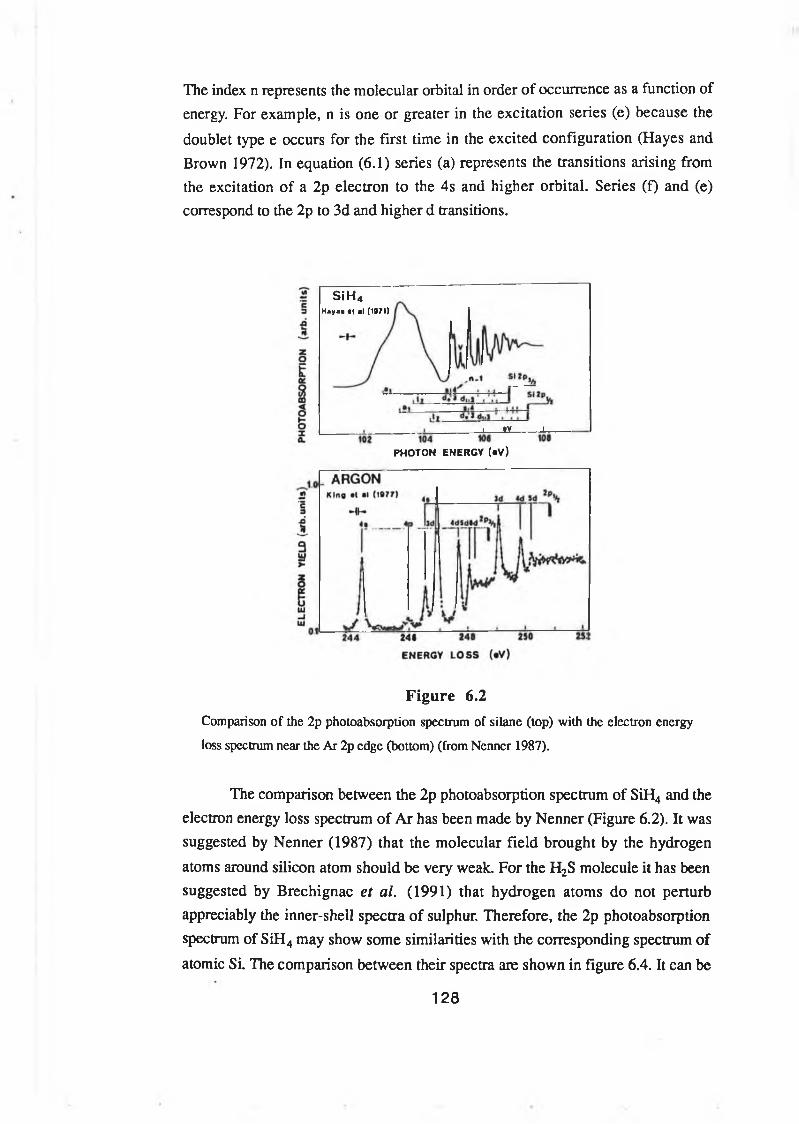
The index n represents the molecular orbital in order of occurrence as a function of energy. For example, n is one or greater in the excitation series (e) because the
doublet type e occurs for the first time in the excited configuration (Hayes and Brown 1972). In equation (6.1) series (a) represents the transitions arising from the excitation of a 2p electron to the 4s and higher orbital. Series (f) and (e) correspond to the 2p to 3d and higher d transitions.
F igure 6.2
Com parison o f the 2p photoabsorption spectrum o f silane (top ) with the electron energy
loss spectrum near the A r 2p edge (bottom ) (from N enner 1 9 8 7 ).
The comparison between the 2p photoabsorption spectrum of SiH4 and the electron energy loss spectrum of Ar has been made by Nenner (Figure 6.2). It was suggested by Nenner (1987) that the molecular field brought by the hydrogen atoms around silicon atom should be very weak. For the H2S molecule it has been suggested by Brechignac et al. (1991) that hydrogen atoms do not perturb appreciably the inner-shell spectra of sulphur. Therefore, the 2p photoabsorption spectrum of SiH4 may show some similarities with the corresponding spectrum of
atomic Si. The comparison between their spectra are shown in figure 6.4. It can be
SiH4Hay** « I al (1971)
___ I ÎY----------- 1—PHOTON ENERGY (*V)
128
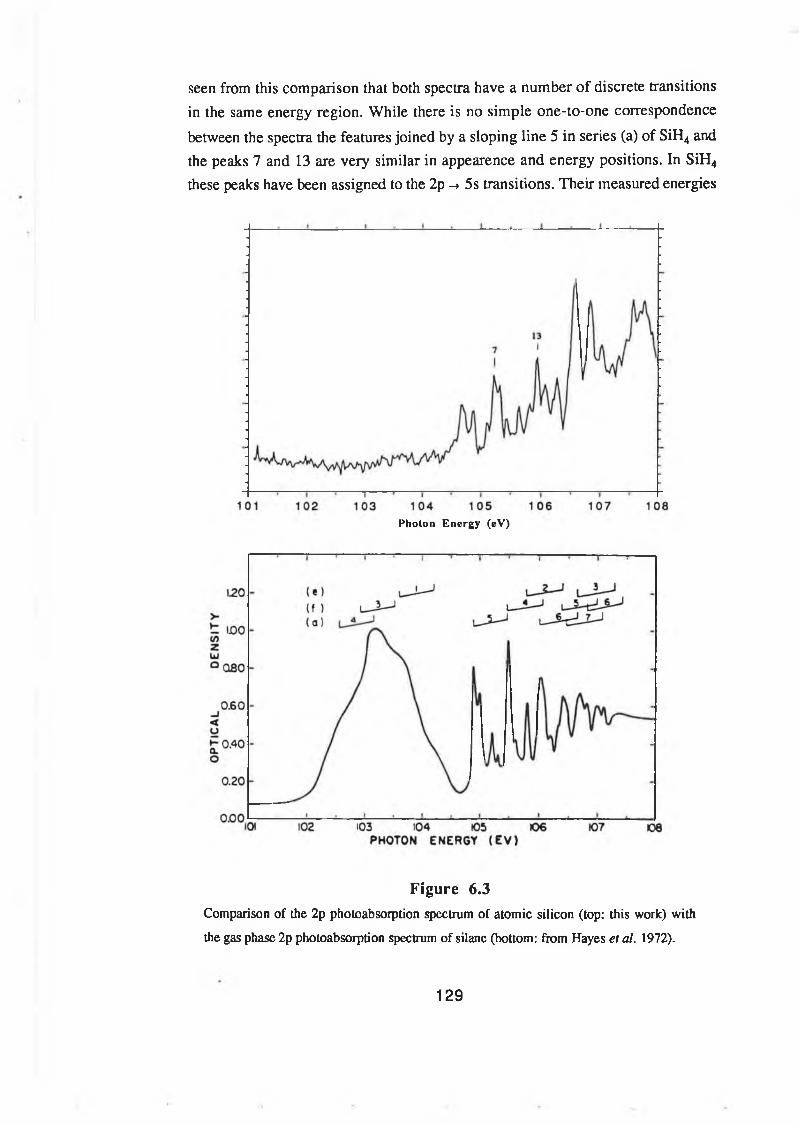
seen from this comparison that both spectra have a number of discrete transitions in the same energy region. While there is no simple one-to-one correspondence
between the spectra the features joined by a sloping line 5 in series (a) of SiH4 and the peaks 7 and 13 are very similar in appearence and energy positions. In SiH4 these peaks have been assigned to the 2p -> 5s transitions. Their measured energies
Photon E nergy (eV )
Figure 6.3Com parison o f the 2p photoabsorption spectrum o f a to m ic silicon (top : this w ork) with
the gas phase 2p photoabsorption spectrum o f silanc (bottom : from H ayes et al. 1 9 7 2 ).
129
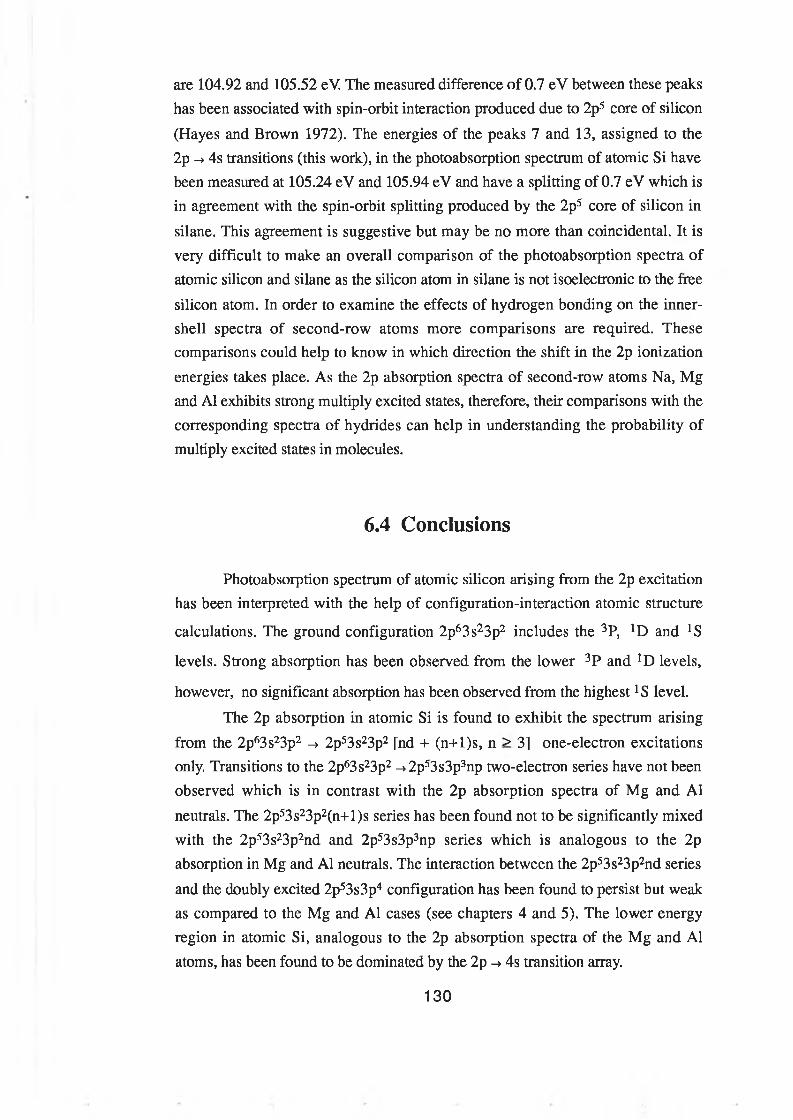
are 104.92 and 105.52 eV. The measured difference of 0.7 eV between these peaks has been associated with spin-orbit interaction produced due to 2p5 core of silicon
(Hayes and Brown 1972). The energies of the peaks 7 and 13, assigned to the 2p -> 4s transitions (this work), in the photoabsorption spectrum of atomic Si have been measured at 105.24 eV and 105.94 eV and have a splitting of 0.7 eV which is in agreement with the spin-orbit splitting produced by the 2p5 core of silicon in
silane. This agreement is suggestive but may be no more than coincidental. It is very difficult to make an overall comparison of the photoabsorption spectra of atomic silicon and silane as the silicon atom in silane is not isoelectronic to the free
silicon atom. In order to examine the effects of hydrogen bonding on the inner- shell spectra of second-row atoms more comparisons are required. These comparisons could help to know in which direction the shift in the 2p ionization
energies takes place. As the 2p absorption spectra of second-row atoms Na, Mg and A1 exhibits strong multiply excited states, therefore, their comparisons with the corresponding spectra of hydrides can help in understanding the probability of multiply excited states in molecules.
6.4 Conclusions
Photoabsorption spectrum of atomic silicon arising from the 2p excitation has been interpreted with the help of configuration-interaction atomic structure
calculations. The ground configuration 2p63s23p2 includes the 3P, !D and *S
levels. Strong absorption has been observed from the lower 3P and ]D levels,
however, no significant absorption has been observed from the highest !S level.
The 2p absorption in atomic Si is found to exhibit the spectrum arising from the 2p63s23p2 -> 2p53s23p2 [nd + (n+l)s, n > 3] one-electron excitations only. Transitions to the 2p63s23p2 ->2p53s3p3np two-electron series have not been observed which is in contrast with the 2p absorption spectra of Mg and A1
neutrals. The 2p53s23p2(n+l)s series has been found not to be significantly mixed with the 2p53s23p2nd and 2p53s3p3np series which is analogous to the 2p absorption in Mg and A1 neutrals. The interaction between the 2p53s23p2nd series
and the doubly excited 2p53s3p4 configuration has been found to persist but weak as compared to the Mg and A1 cases (see chapters 4 and 5). The lower energy region in atomic Si, analogous to the 2p absorption spectra of the Mg and A1 atoms, has been found to be dominated by the 2p -> 4s transition array.
130
Comparison has been made between the 2p photoabsorption spectra of atomic silicon and gas phase silane. Some of the features observed in the 2p
photoabsorption spectrum of SiH4 and atomic silicon have been found very similar in appearance and energy positions. However, on the whole the members of Ryberg series observed in SiH4 do not show strong resemblance with that of the atomic silicon spectrum. This is not surprising even if it is assumed that the 2p
absorption spectrum of atomic silicon is not influenced to any great extent by the hydrogen atoms in silane. Atomic silicon is an open system and in the present experiment absorption is taking place from various levels of the ground configuration. On the other hand, in silane silicon atom is isoelectronic to argon and is behaving like a closed system. Also in silane absorption is taking from a single well-defined ground level.
131
6.5 References
Aksela H, Aksela S, Ala-Korpela M, Sairanen O-P, Hotokka M, Bancroft G M, Tan K H and Tulkki J, 1990, Phys. Rev. A 41, 6000.
Brechignac C, Broyer M, Cahuzac Ph, de Frutos M, Labastie P and Roux J-Ph, 1991, Phys. Rev. Lett. 67, 1222.
Clark C W, 1987, Phys. Rev. A 35, 4865.
Connerade J P, Esteva J M and Kamatak R C (eds.), 1987, “Giant resonances in Atoms, Molecules and Solids” (NATO ASI Series B) Vol. 151 (New York:
Plenum).
Connerade J P, Garton W R S and Mansfield M W D, 1971, Astrophys. J. 165,
203.
Connerade J P and Kamatak R C, 1990, Comment. At. Mol. Phys. 2 4, 1.
Costello J T, Kennedy E T, Sonntag B F and Clark C W, 1991, Phys. Rev. A 4 3, 1441.
de Souza G G B, Morin P and Nenner I, 1986, Phys. Rev. A 3 4, 4770.
Hayes W, Brown F C and Kunz A B, 1971, Phys. Rev. Lett. 27, 774.
Hayes W and Brown F C, 1972, Phys. Rev. A 6, 21.
Hudson E, Shirley D A, Domke M, Remmers G, Puschmann A, Mandel T, Xue C
and Kaindl G, 1993, Phys. Rev. A 4 7, 361.
Hudson E, shirely D A, Domke M, Remmers G and Kaindl G, 1994, Phys. Rev.
49, 161.
Ishiguro E, Iwata S, Mikuni A, Suzuki Y, Kanamori H and Sasaki T, 1987, J.
Phys. B: At. Mol. Phys. 20, 4725.
132
Martin W C and Zalubas R, 1983, J. Phys. Chem. Ref. Data, 12, 323.
Nakamura M, Sasanuma M, Sato S, Watanahe M, Yamashita H, Iguchi Y, Ejira A,
Nakai S, Yameguchi S, Sagawa T, Nakai Y and Oghio T, 1968, Phys. Rev. Lett. 21, 1303.
Nenner I, 1987, “Giant resonances in Atoms, Molecules and Solids”, eds. Connerade J P, Esteva J M and Kamatak R C (NATO ASI Series B) Vol. 151 (New York: Plenum).
Sutherland D G J, Liu Z F, Bancroft G M and Tan K H, 1994, Nuclear Instruments and Methods in Physics Research B 87, 183 [Proceedindings of the 16th International Conference on X-RAY AND INNER-SHELL PROCESSES (X’
93) Debrecen, Hungary, July 12-16]
Watson W S and Morgan P J, 1969, J. Phys. B 2, 277.
Wolff H W, Radler K, Sonntag B and Haensel R, 1972, Zeitschreift fur Physik. 157, 353.
King G C, Tronc M, Read F H and Bradford R C, 1977, J. Phys. B Atom.Molec. Phys. 10, 2479.
133

Cïmpttr T
PHOTO ABSORPTION IN VALENCE- EXCITED ISOELECTRONINC SPECIES
Photoabsorption investigations o f species isoelectron ic to m agnesium and alum inium ,
prepared in their v a len ce-excited states, h ave been carried out. Interpretation fo r the observed
spectra is provided on the basis o f configuration-interaction atom ic structure calcu lation s. In order
to obtain insight into the d yn am ics o f e x c ite d states a com p arison is m ade w ith the ejected -
electron spectra o f the corresponding atom ic and ionic species arising from the autoionising and
A uger transitions follow ing electron - and p h oton -im p act excitation /ion isation respectively . A
qualitative interpretation for the population and depopulation o f the v alen ce-excited levels in the
laser plasm a is given.
7.1 Introduction
The photoabsorption measurements in valence-excited species allow to
study the core-excited states which do not connect to the ground state via the electric dipole operator. The experimental data on these states in atoms and ions are required for understanding the many-electron dynamics, laboratory plasmas and astrophysical phenomena (Mosnier et al. 1994). In photoabsorption measurements
of these states the species of interest are prepared beforehand in a specific valence- excited state. Such experiments were carried out in the inner-shell regime first using photoabsorption spectroscopy (Lucatorto and Mcllrath 1977, Sugar et al. 1979) and then using photoelectron spectroscopy (Bizau etal. 1985). Also, the controllable excitation of a valence electron into higher states offers the unique opportunity to produce gradual modifications in the effective potential of an inner-
shell electron (Sonntag etal. 1986, Ferray etal. 1987). The specific properties of high intensity synchrotron light sources (wigglers, undulators) combined with highly selective excitation mechanisms and detection techniques have initiated measurements on excited atoms providing an ever more complete description of the
photoionization process, e.g. resonant photoionization of excited aligned species (Meyer et al. 1987), direct photoionization cross-sections of excited atoms
134
(Cubaynes et al. 1989), angular dependence of ejected electrons in the photoionization of excited aligned atoms (Pahler et al. 1992).
In all the experiments mentioned above, the excitation technique used was
based on the pioneering works of Bradley (1969), Bradley etal. (1973), Mcllrath
(1969), and Mcllrath and Carlsten (1973). In this technique a high power tunable
dye laser selectively pumps ground state atoms into an excited state. The
population density of the excited state thus obtained is large enough so as to make
a photoabsorption or a photoelectron spectrum originating from it readily
observable. The applicability of the technique to a wide range of atomic species is
only limited by the tuning range of the high power dye laser. As the spectral range
covered by currently available high power dye lasers is limited to the visible
region, excited state studies have been restricted to only a few neutral species to
date. The dual laser-produced plasma technique has enabled us (i) to study
photoabsorption both in atoms and ions prepared in their valence-excited states,
and to extend them along the sequences.
Very little is known about the kinetics of the valence-excited states in the
laser-plasmas. The photoabsorption studies reported in this work though carried
out from a spectroscopic point of view could be very stimulating for theoretical and
experimental studies regarding the modelling of laser-plasmas.
7.2 Magnesium sequence in excited state absorption
As far as we know, no previous results exist for 2p photoabsorption of species isoelectronic to Mg in valence excited states. In the case of ions this may be due to the experimental difficulties in generating the sufficient densities of absorbing species and preparing them in selectively excited states beforehand for
absorption measurements. An extensive study of the ejected-electron spectrum of magnesium autoionising levels excited by low-energy electron impact was published some years ago by Pejcev etal. (1977). At the low incident electron
energies (62, 100 and 400 eV) used by these authors, the 2p53s23p autoionising levels are populated via quadrupole excitation of a 2p ground state electron. Although the presence of these levels was mentioned no assignments were given.
Recently, a comprehensive study of the Auger spectra of atomic Al following 2p
135
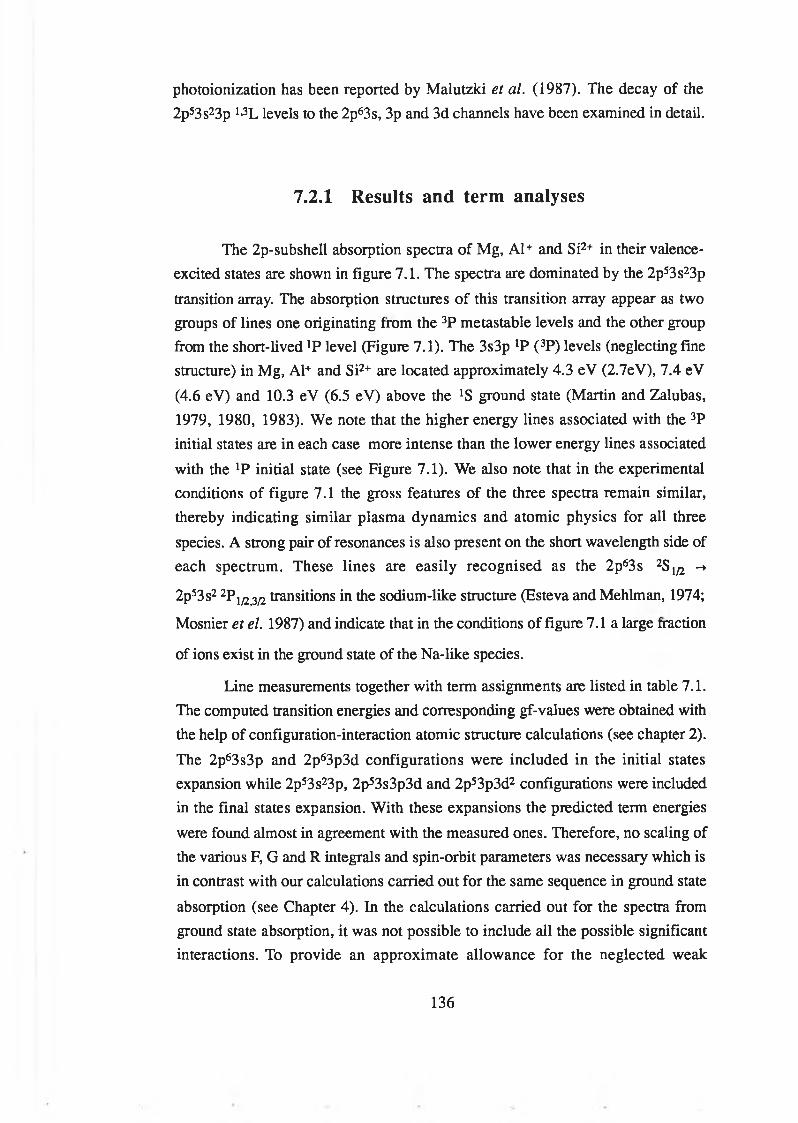
photoionization has been reported by Malutzki et al. (1987). The decay of the 2p53s23p li3L levels to the 2p63s, 3p and 3d channels have been examined in detail.
7.2.1 Results and term analyses
The 2p-subshell absorption spectra of Mg, A l+ and Si2+ in their valence- excited states are shown in figure 7.1. The spectra are dominated by the 2p53s23p
transition array. The absorption structures of this transition array appear as two groups of lines one originating from the 3P metastable levels and the other group from the short-lived 'P level (Figure 7.1). The 3s3p lP (3P) levels (neglecting fine structure) in Mg, Al+ and Si2+ are located approximately 4.3 eV (2.7eV), 7.4 eV
(4.6 eV) and 10.3 eV (6.5 eV) above the *S ground state (Martin and Zalubas, 1979, 1980, 1983). We note that the higher energy lines associated with the 3P initial states are in each case more intense than the lower energy lines associated
with the JP initial state (see Figure 7.1). We also note that in the experimental conditions of figure 7.1 the gross features of the three spectra remain similar, thereby indicating similar plasma dynamics and atomic physics for all three
species. A strong pair of resonances is also present on the short wavelength side of each spectrum. These lines are easily recognised as the 2p63s 2S 1/2 ->
2p53s2 2Pi/2,3/2 transitions in the sodium-like structure (Esteva andMehlman, 1974;
Mosnier et el. 1987) and indicate that in the conditions of figure 7.1a large fraction
of ions exist in the ground state of the Na-like species.
Line measurements together with term assignments are listed in table 7.1. The computed transition energies and corresponding gf-values were obtained with the help of configuration-interaction atomic structure calculations (see chapter 2).
The 2p63s3p and 2p63p3d configurations were included in the initial states expansion while 2p53s23p, 2p53s3p3d and 2p53p3d2 configurations were included in the final states expansion. With these expansions the predicted term energies
were found almost in agreement with the measured ones. Therefore, no scaling of the various F, G and R integrals and spin-orbit parameters was necessary which is in contrast with our calculations carried out for the same sequence in ground state
absorption (see Chapter 4). In the calculations carried out for the spectra from ground state absorption, it was not possible to include all the possible significant interactions. To provide an approximate allowance for the neglected weak
136
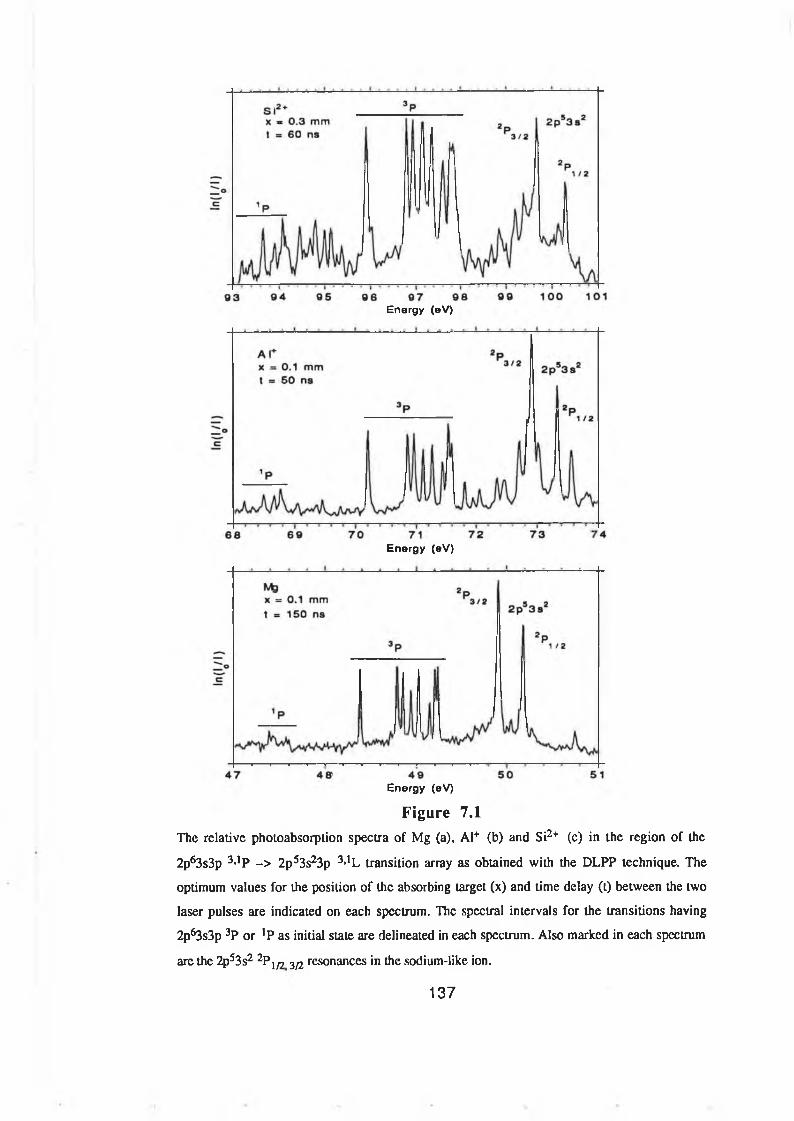
Ene rgy (eV)
E n e rg y (eV)
Ene rgy (eV)
Figure 7.1T h e relativ e photoabsorption sp ectra o f M g (a ), A l+ (b ) and Si2+ (c ) in the region o f the
2p 6 3 s3p 3>1P - > 2 p 53s2 3p 3,1L transition array as obtained with the D L P P technique. T h e
optim um valu es for the position o f the absorbing target (x ) and tim e delay (l) betw een the two
laser pulses are indicated on each spectrum . The spectral intervals for the transitions having
2p 63s3p 3P o r *P as initial state are delineated in each spectrum . A lso m arked in each spectrum
are the 2p53 s2 2P 1/2 3/2 resonances in the sodium -like ion.
137
configuration-interaction effects the various Slater integrals were reduced by suitable amounts for which the calculated term energies and distribution of
oscillator strength was found in very good agreement with the measured level structure. In the case of excited state absorption the interactions included were found sufficient enough to reproduce the observed structure, in particular for term energies; therefore, there was no need for scaling the Slater integrals.
In the case of transitions from 3P as initial states, line assignments are straightforward as the computed values are in very good agreement with the measured values. In the case of transitions having initial state, it was found that the ab initio computed transition energies differed from the measured values by a constant amount roughly equal to 0.5 eV in all three spectra. This is due to an overestimation of the G!(3s,3p) exchange integral. Although an abundant literature
is available on the subject of the precise calculation of the optical levels in the magnesium series (see e.g. Martin and Zalubas, 1979, 1980, 1983 ), it was found sufficient for the purpose of assigning inner-shell transitions to apply a constant correction factor to the relevant transition energies. The value of the correction is
equal to the amount that must be added to the ab initio energy value of 2p63s3p !P in order to make the 3P - ’P energy interval exactly equal to its tabulated value (Martin and Zalubas, 1979, 1980, 1983). This factor is equal to 5796 cm-1 (Mg),
4845 cm-1 (A1+) and 4462 cm-1 (Si2+). This simple constant shifting procedure brings the calculated values in good agreement with the measured ones; the only exception being the !Pj - 'S0 transitions which are not present in our spectra . In
view of the general good agreement previously observed for all levels except 2p53s23p ïSo, we surmise that our ab initio unsealed calculations provide only a mediocre description of the wavefunction of the latter. Thus, the corresponding transition energies and strengths quoted in table 7.1 are only indicative. This view is supported by the interpretation of the photoinduced 2p Auger spectrum of atomic aluminium by Malutzki et al. (1987) in which similar difficulties are reported and discussed in the case of the calculation of the Auger decay rate of
2p53s23 p 1S0.In a pure LS coupling picture, the 2p63s3p -» 2p53s23p spectrum exhibits
the characteristic 3>1P -> 3’1S, 3-1P,3-1D structure with cross-system transitions being
forbidden. However, the observed spectra are more complex than suggested by this picture as a number of strong lines must be assigned to LS forbidden transitions (see Table 7.1). Comparison with the 2p valence excited photoabsorption spectra in the sodium sequence provides a straightforward
explanation for this observation. In effect, it has been reported by several authors
138
(Froese-Fisher, 1986; Brilly etal. 1990) that the structure of the 2p63p -> 2p53s3p spectrum is due mostly to large spin-orbit mixing of different terms of the upper
configuration produced by the 2p5 open core. It is plain that the addition of an extra electron in the 3 s subshell should only be marginal in this respect and we therefore expect strong departure from LS coupling for some of the terms of the 2p53s23p configuration. Wavefunction composition of the relevant triplet and singlet states in
Mg, A1+ and Si2+ is given in table 7.2 in increasing order of energy. Correlation
mixing with 2p53s3p3d amounts to 1.5% at most and therefore has a minor
influence over the energy level structure of the 2p53s23p configuration. On the other hand, when one considers autoionization /Auger decay, it is well known that such configuration effects play an essential role in the understanding of the origin
of satellite features attributed to electron correlations (see below for further discussion). The 3Sl5 3D3 and 'S 0 terms have been omitted from this table as they are all 95% or more pure LS. Complete breakdown of LS coupling is exemplified by the almost complete mixing between 3P2 and *D2. In view of the rather arbitrary
nature of LS labelling in these cases, we simply designate a state by considering
only the leading eigenvector, hence the double appearance of the 3P2 state in table
7.2. Also, the 1P 1 state is placed below 3P, as a result of strong mixing between
them.Following our previous conclusions regarding the relative intensity
patterns in figure 7.1, we infer from figure 7.1 and table 7.2 that on going from Mg to Si2+ , the dominant effect remains spin-orbit mixing due to the open core since the increase in nuclear charge has little influence on the restructuring of the
energy level system of the 2p53s23p configuration. This is in sharp contrast with
the behaviour of the 2p53s23d configuration observed in photoabsorption along the
same isoelectronic sequence (see chapter 4).
139
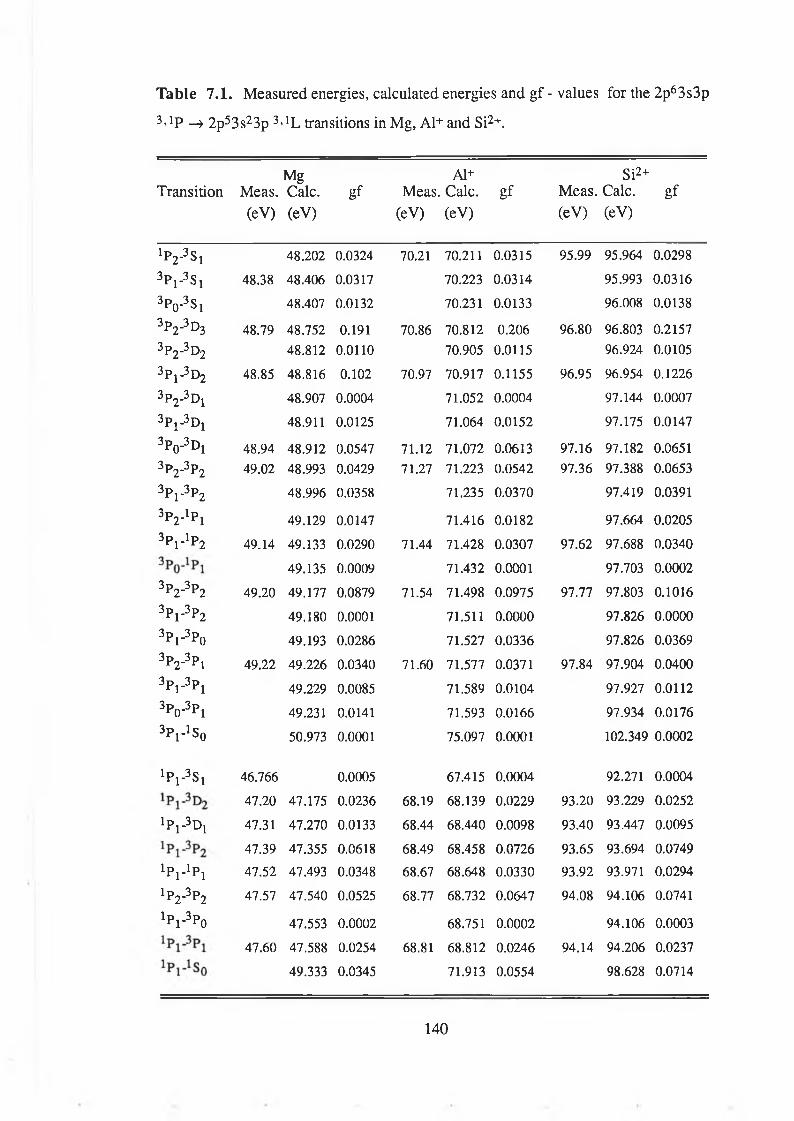
Table 7.1. Measured energies, calculated energies and gf - values for the 2p63s3p
3>1P —» 2p53s23p 3ilL transitions in Mg, Al+ and Si2+.
Transition Meas.(eV)
MgCalc.(eV)
g fAl+
Meas. Calc. (eV) (eV)
g fSi2+
Meas. Calc.(eV) (eV)
g f
1p 2-3S i 48.202 0.0324 70.21 70.211 0.0315 95.99 95.964 0.0298
3P r 3S i 48.38 48.406 0.0317 70.223 0.0314 95.993 0.0316
3P0-3S i 48.407 0.0132 70.231 0.0133 96.008 0.0138
3P2-3D3 48.79 48.752 0.191 70.86 70.812 0.206 96.80 96.803 0.2157
3p 2-3d 2 48.812 0.0110 70.905 0.0115 96.924 0.0105
3P i -3d 2 48.85 48.816 0.102 70.97 70.917 0.1155 96.95 96.954 0.1226
3P2-3D i 48.907 0.0004 71.052 0.0004 97.144 0.0007
3p 1-3d 1 48.911 0.0125 71.064 0.0152 97.175 0.0147
3P0-3D i 48.94 48.912 0.0547 71.12 71.072 0.0613 97.16 97.182 0.0651
3p 2-3p 2 49.02 48.993 0.0429 71.27 71.223 0.0542 97.36 97.388 0.0653
3P i -3P2 48.996 0.0358 71.235 0.0370 97.419 0.0391
3P2-1P i 49.129 0.0147 71.416 0.0182 97.664 0.0205
3P r 1P2 49.14 49.133 0.0290 71.44 71.428 0.0307 97.62 97.688 0.0340
49.135 0.0009 71.432 0.0001 97.703 0.0002
3p 2-3p 2 49.20 49.177 0.0879 71.54 71.498 0.0975 97.77 97.803 0.1016
3P i -3P2 49.180 0.0001 71.511 0.0000 97.826 0.0000
3P1-3P0 49.193 0.0286 71.527 0.0336 97.826 0.0369
3P2-3Pl 49.22 49.226 0.0340 71.60 71.577 0.0371 97.84 97.904 0.0400
3P1-3P1 49.229 0.0085 71.589 0.0104 97.927 0.0112
3P0-3P1 49.231 0.0141 71.593 0.0166 97.934 0.0176
3PlJ S0 50.973 0.0001 75.097 0.0001 102.349 0.0002
1P l -3S i 46.766 0.0005 67.415 0.0004 92.271 0.0004
47.20 47.175 0.0236 68.19 68.139 0.0229 93.20 93.229 0.0252
iP l^ D i 47.31 47.270 0.0133 68.44 68.440 0.0098 93.40 93.447 0.0095
47.39 47.355 0.0618 68.49 68.458 0.0726 93.65 93.694 0.0749
iP j - iP l 47.52 47.493 0.0348 68.67 68.648 0.0330 93.92 93.971 0.0294
^ 2 ^ 2 47.57 47.540 0.0525 68.77 68.732 0.0647 94.08 94.106 0.0741
l p r 3P0 47.553 0.0002 68.751 0.0002 94.106 0.0003
47.60 47.588 0.0254 68.81 68.812 0.0246 94.14 94.206 0.0237
49.333 0.0345 71.913 0.0554 98.628 0.0714
140

Table 7.2. Calculated purity of some of the terms (in increasing order of energy ) of the 2p53s23p configuration in Mg, Al+
and Si2+. Term labeling (left -hand side column) is obtained by considering the leading component only.
3D . 3D, 3Po 3P ij2 \ 12 M 2 1
M g
TermM g A l+ S i 2 + M g A l+ S i 2 + M g A l+ S i 2 + M g A l+ S i 2 + M g A l+ S i 2 + M g A l+ S i 2 +
3D2 78 79 78 17 14 14
3D1 70 74 73 10 8 10 18 14 15
3P2 51 51 54 44 44 41
1P1 27 22 24 25 27 27 46 47 46
3P2 17 16 17 43 42 39 37 39 41
3P, 62 59 59 33 35 36
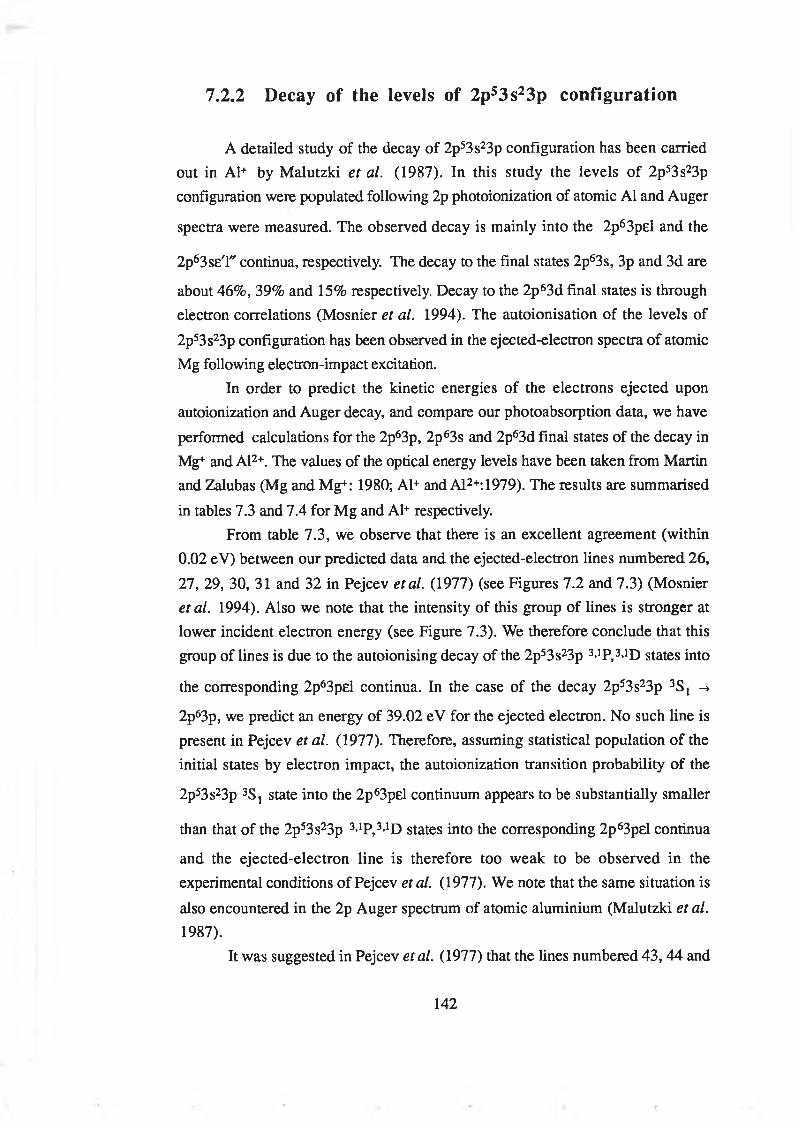
7.2.2 Decay of the levels of 2p53s23p configuration
A detailed study of the decay of 2p53s23p configuration has been carried out in Al+ by Malutzki et al. (1987). In this study the levels of 2p53s23p configuration were populated following 2p photoionization of atomic Al and Auger
spectra were measured. The observed decay is mainly into the 2p63pel and the
2p63seT continua, respectively. The decay to the final states 2p63s, 3p and 3d are
about 46%, 39% and 15% respectively. Decay to the 2p63d final states is through electron correlations (Mosnier et al. 1994). The autoionisation of the levels of
2p53s23p configuration has been observed in the ejected-electron spectra of atomic Mg following electron-impact excitation.
In order to predict the kinetic energies of the electrons ejected upon autoionization and Auger decay, and compare our photoabsorption data, we have
performed calculations for the 2p63p, 2p63s and 2p63d final states of the decay in Mg+ and Al2+. The values of the optical energy levels have been taken from Martin and Zalubas (Mg and Mg+: 1980; Al+ and Al2+: 1979). The results are summarised
in tables 7.3 and 7.4 for Mg and Al+ respectively.From table 7.3, we observe that there is an excellent agreement (within
0.02 eV) between our predicted data and the ejected-electron lines numbered 26,
27, 29, 30, 31 and 32 in Pejcev etal. (1977) (see Figures 7.2 and 7.3) (Mosnier etal. 1994). Also we note that the intensity of this group of lines is stronger at lower incident electron energy (see Figure 7.3). We therefore conclude that this group of lines is due to the autoionising decay of the 2p53s23p 3>1P,3>1D states into
the corresponding 2p63pel continua. In the case of the decay 2p53s23p 3Sj ->
2p63p, we predict an energy of 39.02 eV for the ejected electron. No such line is present in Pejcev et al. (1977). Therefore, assuming statistical population of the initial states by electron impact, the autoionization transition probability of the
2p53s23p 3Sj state into the 2p63pel continuum appears to be substantially smaller
than that of the 2p53s23p 3-1P,3-1D states into the corresponding 2p63p£l continua
and the ejected-electron line is therefore too weak to be observed in the experimental conditions of Pejcev etal. (1977). We note that the same situation is
also encountered in the 2p Auger spectrum of atomic aluminium (Malutzki et al.1987).
It was suggested in Pejcev etal. (1977) that the lines numbered 43,44 and
142
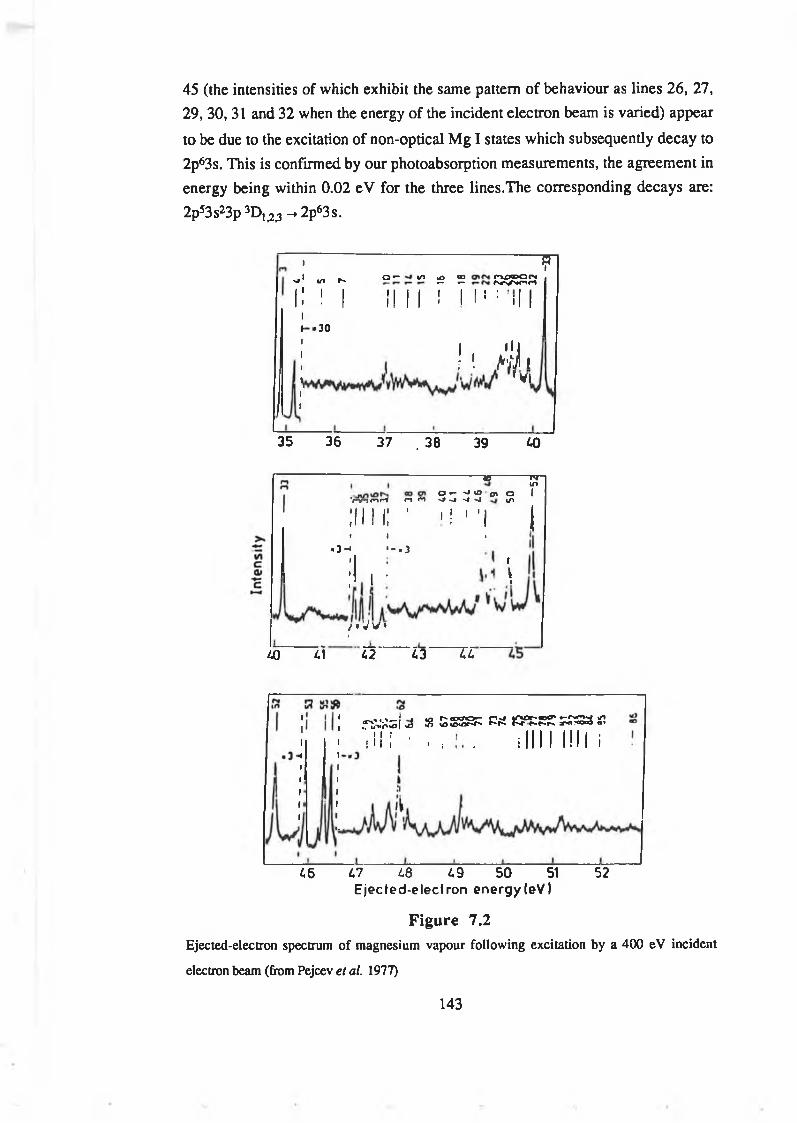
45 (the intensities of which exhibit the same pattern of behaviour as lines 26, 27, 29, 30, 31 and 32 when the energy of the incident electron beam is varied) appear
to be due to the excitation of non-optical Mg I states which subsequently decay to 2p63s. This is confirmed by our photoabsorption measurements, the agreement in energy being within 0.02 eV for the three lines.The corresponding decays are:
2p53s23p 3D1i2i3 -* 2p63s.
T, i _ * O'- in ud <o rvotDOCM
W ^ ^ r - r - N N T M T i n
i: ! I II II M I 1 : III• 30
! \ h i j i’VI
35 36 37 .3 8 39 ¿0
"TO---------------- I T "ino — -i vD«^ o I
V * tM f n r ' f n m 's f -s» «*1 "nJ i/ i
¡ m i : ■ ' i 1 ' i |• i .
■3-< ' - . 3
;1 , : \
/ r JW'I
¿JO ¿1 ¿2 ¿3 Z£
r c ^ z i <s 8 £ s s s : Pfi « p s s s : z z s a c'.¡I! ' . , . HIM l!lI i
46 ¿7 ¿8 ¿9 50 51 52Ejected-elecfron energy(eV)
Figure 7.2E je cte d -e le ctro n spectrum o f m agnesium vap ou r fo llow in g excitatio n b y a 4 0 0 e V in cid ent
electron beam (from Pejcev et al. 19 7 7 )
143
____i------------ :------------ :------------ 1------------ -------42 ¿3 a 45 46
Ejecled-electron energy (eV)
Figure 7.3Ejected-electron spectrum o f m agnesium vapour follow ing excitation by a 1 0 0 eV incident
electron beam (from P e jce v et al. 1 9 7 7 )
The dependence of the intensity of the ejected-electron line numbered 40
(43.41 eV) in Pejcev et al. (1977) upon the energy of the low-energy incident electron beam suggests the assignment 2p53s23p 3Sj -> 2p63s for the corresponding autoionizing decay (see table 7.3). The ejected-electron lines numbered 46 (44.17
eV), 47 (44.25 eV) and 48 (44.32 eV) are possible candidates for the decay of the 2p53s23p states having dominant 3P or 'P character (table 7.3). The assignments are considered less definite in these cases for the dependence on incident energy
differ appreciably for the three lines as discussed in Pejcev etal. (1977).According to our data autoionisation decays of 2p53s23p to 2p63d (16.510
eV) and 2p64p (17.643 eV) -entirely due to electron correlations- would give rise to ejected-electrons with kinetic energies in the 34.585-35.44 eV and 33.452-
34.311 eV ranges respectively. In the first case the presence of the very intense
Auger lines at 34.86 eV and 35.13 eV make the identification of the corresponding ejected-electron lines impossible in the spectrum of Pejcev et al.
(1977). A different experimental technique would be required in this case to clarify this important point, i.e. the strength of electron correlations which result in 2p63d as the final state of the autoionizing decay of 2p53s23p. There is no evidence in Pejcev et al. (1977) for the presence of ejected electrons with kinetic energies
corresponding to the second type of decay (2p64p final state) for which a possible class of correlation effects would be 3p -> 4p shake up excitation. We note that in the case of the photoinduced 2p Auger spectrum of atomic aluminium (Malutzki
etal. 1987), the 2p63d exit channel contributes about 15% of the overall intensity whereas 2p64p has a negligible contribution.
Finally, we point out that in the spectrum of Pejcev et al. (1977) the group
of lines we assigned to the 2p53s23p -» 2p63p decay is stronger than the group of lines we assigned to the 2p53s23p -» 2p63s decay, with, however, the notable exception of the lines corresponding to the decay of 2p53s23p 3Sj in which case the opposite situation is observed. This seems to suggest that the 3p electron chiefly
remains a spectator during the autoionizing decay of the 2p53s23p 3-1P,3>1D states
resulting in 2p63pel as a preferential decay channel.
145
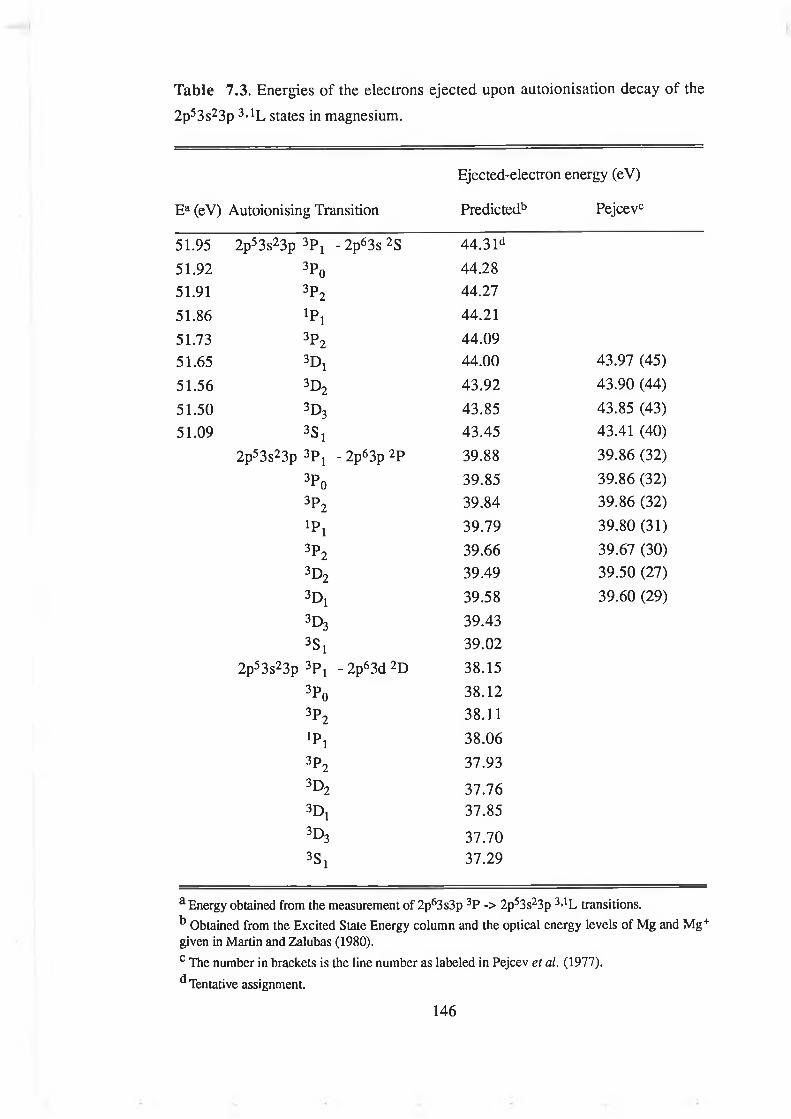
Table 7.3. Energies of the electrons ejected upon autoionisation decay of the
2p53s23p 3ilL states in magnesium.
Ejected-electron energy (eV)
Ea (eV) Autoionising Transition Predicted15 Pejcevc
51.95 2p53s23p 3P i - 2p63 s 2S 44.31d51.92 3Po 44.2851.91 3p 2 44.2751.86 'P i 44.2151.73 3p 2 44.0951.65 3D! 44.00 43.97 (45)
51.56 3d 2 43.92 43.90 (44)
51.50 3d 3 43.85 43.85 (43)51.09 3S i 43.45 43.41 (40)
2p53s23p 3P ! - 2p63p 2P 39.88 39.86 (32)
3Po 39.85 39.86 (32)
3p 2 39.84 39.86 (32)
'P i 39.79 39.80 (31)
3p 2 39.66 39.67 (30)
3d 2 39.49 39.50 (27)
3D i 39.58 39.60 (29)
3D3 39.43
3S i 39.022p53s23p 3P i - 2p63d 2D 38.15
3Po 38.12
3p 2 38.11
'P i 38.06
3p 2 37.93
3d 2 37.763Di 37.853D3 37.703S i 37.29
a E n ergy obtained from the m easurem ent o f 2p 63 s3 p 3P - > 2p 53s2 3p 3)1L transitions.
^ O btained from the E x cite d State E n ergy colum n and the op tical energy levels o f M g and M g + given in M artin and Z alubas (1 9 8 0 ) .
c The num ber in brackets is the line num ber as labeled in P ejcev et al. (1 9 7 7 ) .
^ Tentative assignm ent.
146

Table 7.4. Energies of the electrons ejected upon autoionisation decay of the
2p53s23p 3>1L states in Al+.
Ejected-electron energy (eV)
Ea (eV) Autoionising Transition Predictedb Malutzki
71.60 2p53s23p 3Pj - 2p63 s 2S 57.4171.54 3Po 57.3571.54 3p 2 57.35 57.3571.44 'P i 57.2571.27 3p 2 57.08 57.0571.12 3Di 56.9370.97 3D2 56.78 56.75
70.86 3d 3. 56.6770.21 3S i 56.02 56.05
2p53s23p 3Pj - 2p63p 2P 50.75
3Po 50.69
3p 2 50.69 50.68
'P i 50.59
3p 2 50.42 50.38
3d 2 50.27
3Di 50.12 50.083D3 50.01
3S i 49.36 49.382p53s23p 3Pj - 2p63d 2D 43.03
3Po 42.97
3p 2 42.97 42.98
'P i 42.87
3p 2 42.70 42.68
3Di 42.553D2 42.40 42.383d 3 42.293S i 41.64
a E n ergy obtained from the m easurem ent o f 2 p 6 3s3p 3 P -> 2p 5 3 s2 3p 3 ,1 L transitions.
^ O btained from the E xcited State E n ergy colum n and the optical energy levels o f A l+ and A l2 + given in M artin and Zalubas (1 9 7 9 ) .
The energies o f 2p 6 3s3 p , 2p 6 3s , 2 p 6 3p and 2p 6 3d from 2p 6 3s2 w ere taken as 4 .6 4 eV, 1 8 .8 3 eV, 2 0 .8 5 eV and 2 8 .5 7 eV respectively.
147
7.2.3 Absorption from metastable and dipole allowed
lev e ls
In a laser produced plasma, a complex combination of various collisional and recombination processes result in a spatial and temporal distribution of ions
among the different ionisation stages in their ground state and various excitation states which include both optically accessible and inaccessible states from the ground state. Using the dual laser-produced plasma technique, by suitably
regulating the laser power density on the absorbing target, the distance between the optical axis and the absorbing target, and the time delay between the absorbing plasma and the background continuum pulse one can optimise the absorbing species of one particular ionisation stage for absorption measurements. The
versatility of this selective nature of the dual laser produced plasma technique, which exploits temporal and spatial evolution of laser plasmas, for the ground state absorption is evident from the space and time-resolved studies reported in chapter 3. However, in the case of excited state absorption, the optimisation of some particular initial state belonging to some specific ionisation stage is an extremely difficult task and is well exhibited in the photoabsoiption measurements from the
valence excited configuration 2p63s3p in Mg, Al+ and Si2+. In all these cases the absorption features associated with the 'P levels are relatively very weak compared to the absorption features associated with the 3P levels. After a number of experiments we were hardly able to see the features associated with the lP levels
although the calculated gf-values for the transitions arising both from the *P and 3P levels were predicted of the same order with a few exceptions. We believe that in our photoabsorption measurements, made always during the cooling phase of the
laser plasma, the relative populations of the *P levels was much less than the 3P levels. A quantitative interpretation for the relative populations of !P and 3P would only be obtained with the help of extensive modelling of the laser plasma.
However, a qualitative interpretation for the relative population of initial states in the laser plasma can be provided by examining the mechanisms of their population/depopulation. Experimentally some information about the mechanisms of population/depopulation of these levels can be obtained by looking at the optical emission spectra of the laser plasma or by examining the time and space history of the initial states and taking into account the plasma conditions. The time and space history can be obtained with the help of time and space-resolved photoabsorption
measurements of the absorbing plasma. Both these studies can provide some clues
148

regarding the relative population of 3P levels but the temporal resolution of our system (= 10-15 ns) as determined by the continuum pulse was not suitable for
investigating the time history of the dipole allowed *P levels which have life times
less than 2 nano seconds. The time history of the nonmetastable as well as metastable levels can only be investigated together if the temporal resolution of the experimental system is at least less than the decay time of the nonmetastable levels.
Therefore, on the basis of our time and space-resolved studies for the 3P levels and
space-resolved studies only for the !P levels, carried out during our photoabsorption measurements, we will examine the mechanisms of populations
of these levels.
149
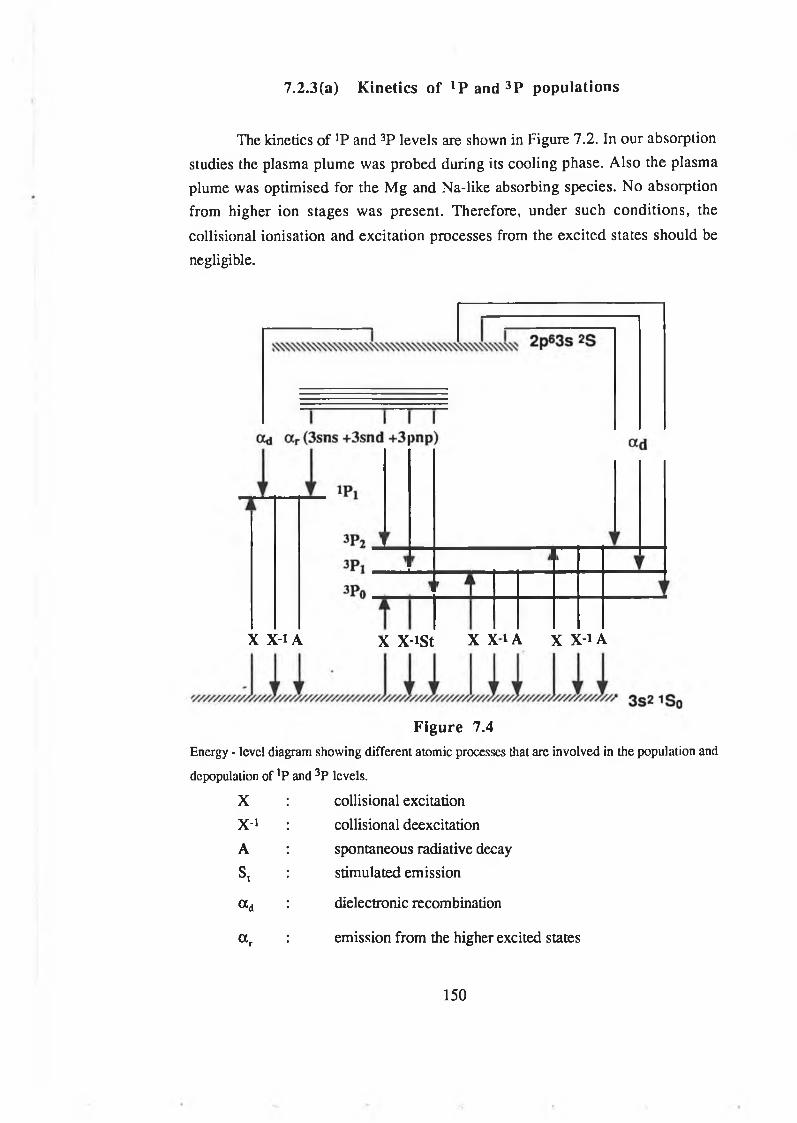
7.2.3(a) Kinetics of ! P and 3P populations
The kinetics of 'P and 3P levels are shown in Figure 7.2. In our absorption studies the plasma plume was probed during its cooling phase. Also the plasma plume was optimised for the Mg and Na-like absorbing species. No absorption from higher ion stages was present. Therefore, under such conditions, the collisional ionisation and excitation processes from the excited states should be negligible.
X X-i A X X-iSt X X l A X X-1 A
F igure 7.4Energy - level diagram show ing different atom ic processes that are involved in the population and
depopulation of *P and 3P levels.
X collisional excitationX-1 collisional deexcitationA spontaneous radiative decay
s, stimulated emission
a d dielectronic recombination
ttr emission from the higher excited states
150
7.2.3(b) Population of 3P levels
A photoabsorption spectrum of a dye-laser produced aluminium plasma
was recorded on a photographie plate with inter-plasma time delays of 0.8 |is, 1.0
(is, 1.4 [is and 1.8 (is (not shown in this work). In that spectrum, absorption
features associated with the 3P levels were observed at time delays of 0.8 [is and
1.0 (is only. These are delays at which absorption from the ground state of Al2+, in
addition to the ground state absorption of A1+, was also present. Although at a
longer time delay of 1.4 (is the ground state absorption in Al+ was present no
absorption from 3P levels was observed at this delay. A similar situation is
exhibited in the absorption spectra of A1 plasma shown in figure 3.7.Figure 7.5 shows a space-resolved photoabsorption spectra of ruby-laser
produced aluminium plasma recorded 0.1 mm, 0.2 mm, 0.3 mm, 0.4 mm, 0.5
mm, 0.6 mm, 0.7 mm, 0.8 mm and 0.9 mm from the target surface at a fixed rime delay of 50 ns. These spectra exhibit strong absorption both from the ground and
excited states of Al2+. As the plasma is scanned starting with Ax = 0.1 mm to Ax =
0.9 mm away from the target surface, the intensities of absorption both in A1+* and
Al2+ decrease. However, the relative intensities of the features associated with the
3P level of A1+* and those associated with the ground state absorption of Al2+
remain the same. These time and space-resolved studies suggest that the dominant
mechanism through which the 3P levels get populated could be the dielectronic
recombination and radiative decay proceeding as follows:
<? + A1+2 (3s) Al+**(3pml) Al+(3snl) +hv
i
Al+*(3s3p) +hv
In general,
e + X+n (3s) X+<n-D**(3pml) X+(n-i)(3Snl) +hv
i
X+(n-i)(3s3p) +hv
151
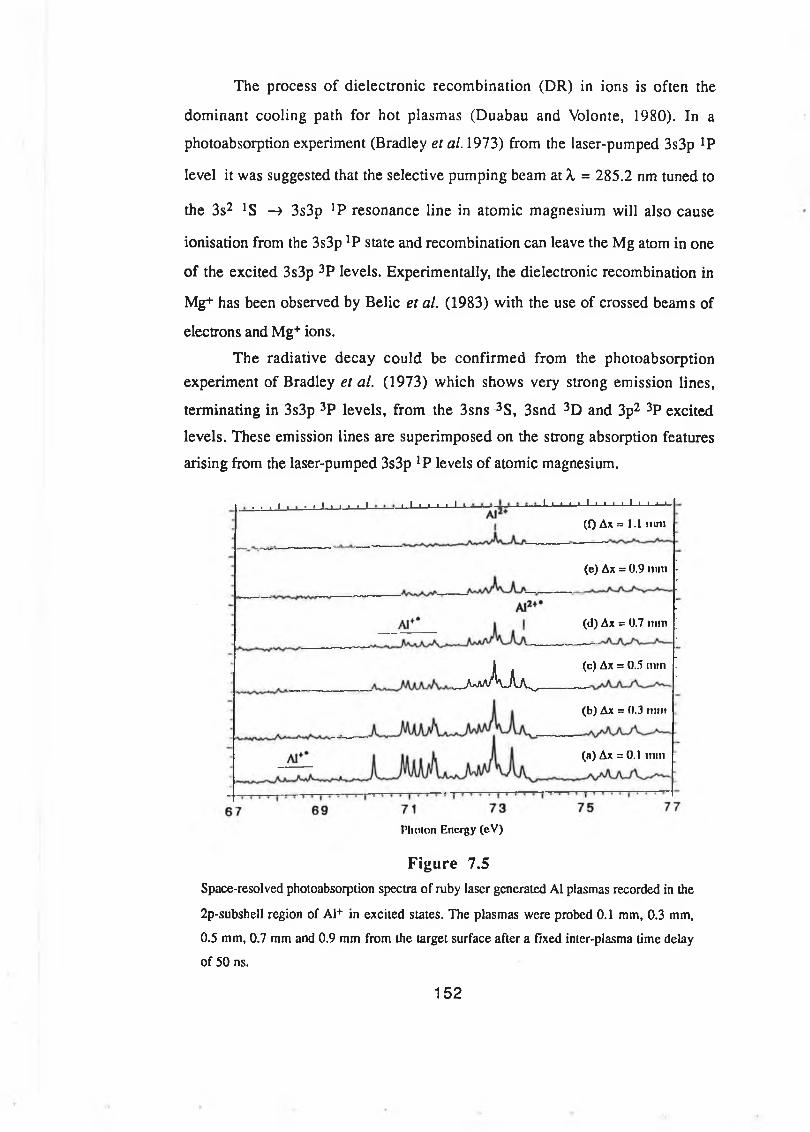
The process of dielectronic recombination (DR) in ions is often the
dominant cooling path for hot plasmas (Duabau and Volonte, 1980). In a
photoabsorption experiment (Bradley et al. 1973) from the laser-pumped 3s3p *P
level it was suggested that the selective pumping beam at X = 285.2 nm tuned to
the 3s2 !S —» 3s3p ]P resonance line in atomic magnesium will also cause
ionisation from the 3s3p !P state and recombination can leave the Mg atom in one
of the excited 3s3p 3P levels. Experimentally, the dielectronic recombination in
Mg+ has been observed by Belie et al. (1983) with the use of crossed beams of
electrons and Mg+ ions.
The radiative decay could be confirmed from the photoabsorption experiment of Bradley et al. (1973) which shows very strong emission lines,
terminating in 3s3p 3P levels, from the 3sns 3S, 3snd 3D and 3p2 3P excited
levels. These emission lines are superimposed on the strong absorption features
arising from the laser-pumped 3s3p JP levels of atomic magnesium.
t i » -■ » I i i i i -1 i t i ». . . i . . . . i . . . . i ' i ■ ■ ■ ■ i i(0 Ax = 1.1 nini
(c) Ax = 0.9 mm
(d) Ax = 0.7 nun
— A aaAvAa .(c) Ax = 0.5 nun
(b) Ax = 0.3 mm
(a) Ax = 0.1 mm
Photon Energy (eV)
Figure 7.5Space-resolved photoabsorption spectra o f ruby laser generated Al plasm as recorded in the
2p-subshell region o f A l+ in excited states. T he plasm as w ere probed 0 .1 m m , 0 .3 m m ,
0 .5 m m , 0 .7 mm and 0 .9 m m from the target surface after a fixed inter-plasm a tim e delay
o f 5 0 ns.
152
In our assignment, the transitions from different 3P0ii,2 levels have been associated with a single core excited level. This is because of the negligible
resolution of our system as far the separation of 3P levels is concerned. The photoabsorption studies from the laser-pumped excitation, tuned to the intercombination line 3s2 ^ -» 3s3p !P, can complement our studies and help us to some extent in assigning the upper state to some particular initial state which in
turn tell us about the presence of different 3P levels in the laser plasmas. Also there is need to do more experiments with the dual laser plasma technique because they could also be of great help in assigning the upper state to some particular
initial state. This is evident from the space-resolved photoabsorption spectra shown in figure 7.5. A feature at 70.21 eV associated with the 3Po,i^ -» 3Si
transition in Al+ is gone in the space-resolved spectra at Ax = 0.7 mm.
7.2.3(c) Population of *P levels
In our experiments (Figure 7.1) absorption from the JP levels has been
observed close to the target surface at relatively shorter time delays where both the plasma temperature and electron density are relatively higher. In this region due to the high electron density the collisional processes should be more important than
the radiative decay. On the other hand, away from the target surface the electron density as well as the density of absorbing species decreases. Consequently, the radiative decay should become the dominant process and should result in less
population of the !P levels. This is evident from the space-resolved
photoabsorption scans shown in figure 5.5. In going from Ax = 0.1 mm to Ax =
0.4 mm away from the target surface the absorption strength of the features
associated with the !P levels goes on decreasing and at Ax = 0.5 mm all these
features are gone.
153
7.3 Aluminium sequence in excited state absorption
As far as we know 2p photoabsorption from the valence-excited configuration of species isoelectronic to A1 sequence has not been reported before. The photoabsorption data reported here could be very useful for future
complementary studies which are very difficult to carry out without the photoabsorption data available. The odd parity configuration 2p53s23p2 is the lowest core-excited configuration in Si+. Therefore, levels of the higher even parity 2p53s23pnl configurations can decay radiatively to the levels of the 2p53s23p2 configuration. The emission spectra arising from this decay can be studied in beam-foil spectroscopy similar to the studies carried out for Mg+ (Gaardsted et al.1988) and Al2+ (Gaardsted et al. 1990), and the levels of the 2p53s23pnl type
configurations in Si+ can be resolved which were not possible in our XUV photoabsorption study (see chapter 5).
Also our results from the valence-excited state of Si+ should be very
helpful for the study of Auger spectra of atomic silicon vapour following 2p photoionization similar to the one carried out for atomic A1 vapour by Malutzki et al. (1987). This kind of study can provide deep insight into the dynamics of the states of the 2p53s23p2 configuration.
7.3.1 Results and discussion
The photoabsorption spectrum from the valence-excited states of Si+ is shown in figure 7.6. There is strong absorption present from the valence-excited
states of Si2+ (section 7.2), showing that along with Si+ a large quantity of the higher ion stage Si2+ was also present in the absorbing plasma.
The absorption structures due to the valence-excited states of Si+ exhibit
2p63s3p2 -> 2p53s23p2 transitions. The initial configuration 2p63s3p2 includes the 4P, 2D, 2P and 2S levels. The metastable 4P levels are lower in energy than the dipole-allowed 2L levels (see Martin and Zalubas 1983) which is analogous to the levels of the valence-excited configuration 2p63s3p in the Mg sequence (see Martin
and Zalubas 1980), Al+ (see Martin and Zalubas 1980) and Si2+ (see Martin and Zalubas 1983). In our photoabsorption measurements from the valence-excited species isoelectronic to Mg (see section 7.2) strong absorption was observed from
the metastable 2p63s3p 3P levels, however, absorption from the short-lived dipole
154
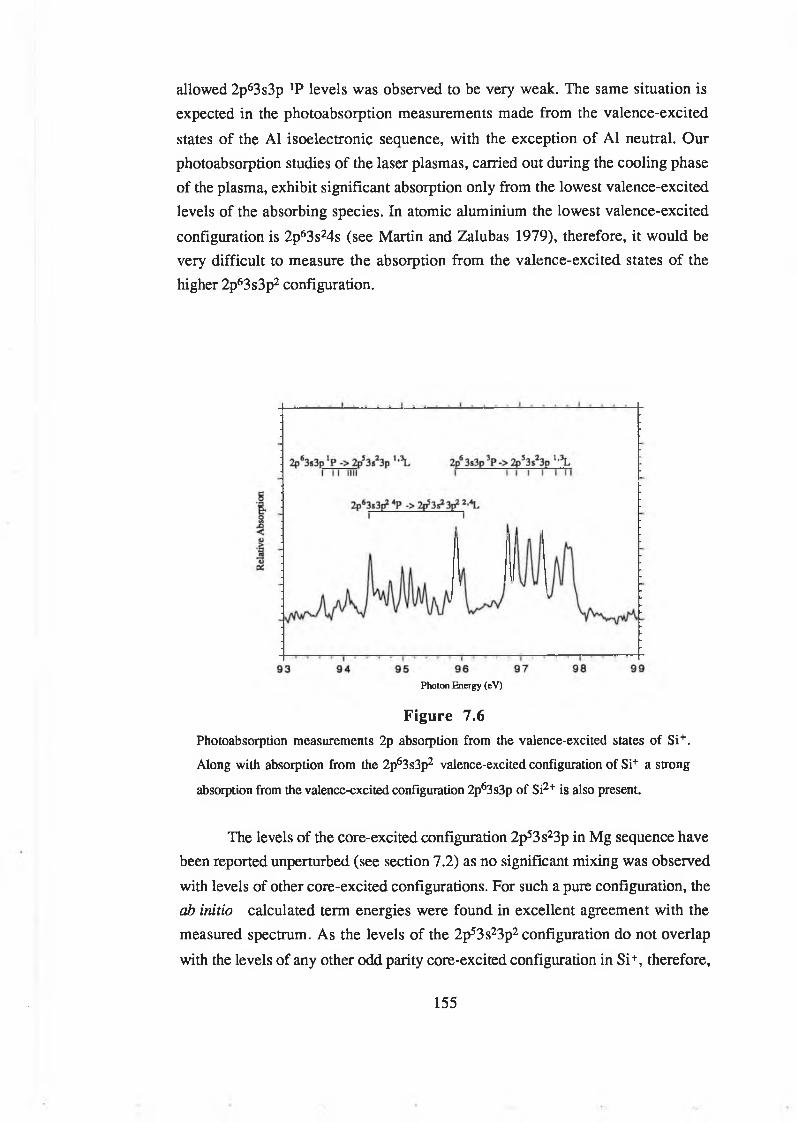
allowed 2p63s3p !P levels was observed to be very weak. The same situation is expected in the photoabsorption measurements made from the valence-excited
states of the A1 isoelectronic sequence, with the exception of A1 neutral. Our photoabsorption studies of the laser plasmas, carried out during the cooling phase of the plasma, exhibit significant absorption only from the lowest valence-excited levels of the absorbing species. In atomic aluminium the lowest valence-excited configuration is 2p63s24s (see Martin and Zalubas 1979), therefore, it would be very difficult to measure the absorption from the valence-excited states of the higher 2p63s3p2 configuration.
Photon Energy (cV)
Figure 7.6Photoabsorption m easu rem en ts 2p absorption from the v a le n ce -e x cite d states o f S i+ .
A long with absorption from the 2p 6 3 s3p 2 valen ce-excited configuration o f Si+ a strong
absorption from the valen ce-excited configuration 2p 63 s3p o f Si2+ is also present.
The levels of the core-excited configuration 2p53s23p in Mg sequence have been reported unperturbed (see section 7.2) as no significant mixing was observed with levels of other core-excited configurations. For such a pure configuration, the ab initio calculated term energies were found in excellent agreement with the measured spectrum. As the levels of the 2p53s23p2 configuration do not overlap
with the levels of any other odd parity core-excited configuration in Si+, therefore,
155
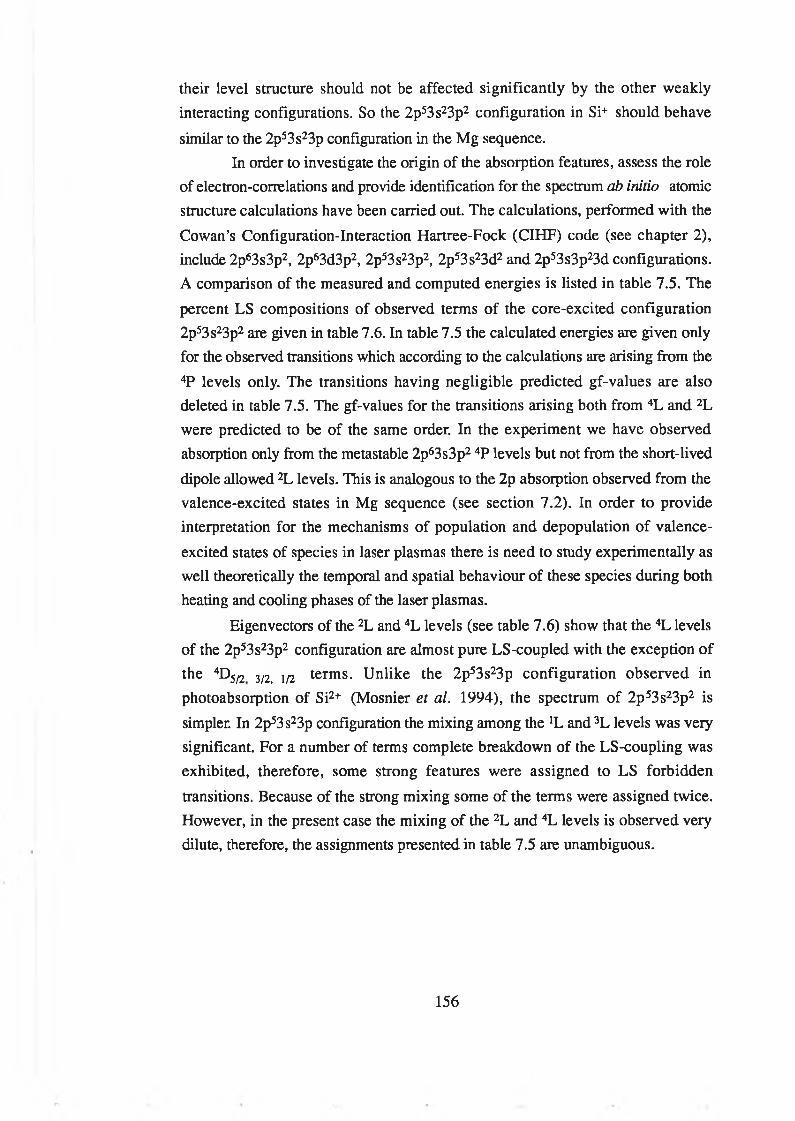
their level structure should not be affected significantly by the other weakly interacting configurations. So the 2p53s23p2 configuration in Si+ should behave
similar to the 2p53s23p configuration in the Mg sequence.In order to investigate the origin of the absorption features, assess the role
of electron-correlations and provide identification for the spectrum ab initio atomic structure calculations have been carried out. The calculations, performed with the
Cowan’s Configuration-Interaction Hartree-Fock (CIHF) code (see chapter 2), include 2p63s3p2, 2p63d3p2, 2p53s23p2, 2p53s23d2 and 2p53s3p23d configurations. A comparison of the measured and computed energies is listed in table 7.5. The
percent LS compositions of observed terms of the core-excited configuration 2ps3s23p2 are given in table 7.6. In table 7.5 the calculated energies are given only for the observed transitions which according to the calculations are arising from the
4P levels only. The transitions having negligible predicted gf-values are also deleted in table 7.5. The gf-values for the transitions arising both from 4L and 2L were predicted to be of the same order. In the experiment we have observed absorption only from the metastable 2p63s3p2 4P levels but not from the short-lived
dipole allowed 2L levels. This is analogous to the 2p absorption observed from the valence-excited states in Mg sequence (see section 7.2). In order to provide interpretation for the mechanisms of population and depopulation of valence-
excited states of species in laser plasmas there is need to study experimentally as well theoretically the temporal and spatial behaviour of these species during both heating and cooling phases of the laser plasmas.
Eigenvectors of the 2L and 4L levels (see table 7.6) show that the 4L levels of the 2p53s23p2 configuration are almost pure LS-coupled with the exception of the 4D5/2 j/l, i/2 terms. Unlike the 2p53s23p configuration observed in photoabsorption of Si2+ (Mosnier et al. 1994), the spectrum of 2p53s23p2 is
simpler. In 2p53s23p configuration the mixing among the 'L and 3L levels was very significant. For a number of terms complete breakdown of the LS-coupling was exhibited, therefore, some strong features were assigned to LS forbidden
transitions. Because of the strong mixing some of the terms were assigned twice. However, in the present case the mixing of the 2L and 4L levels is observed very dilute, therefore, the assignments presented in table 7.5 are unambiguous.
156
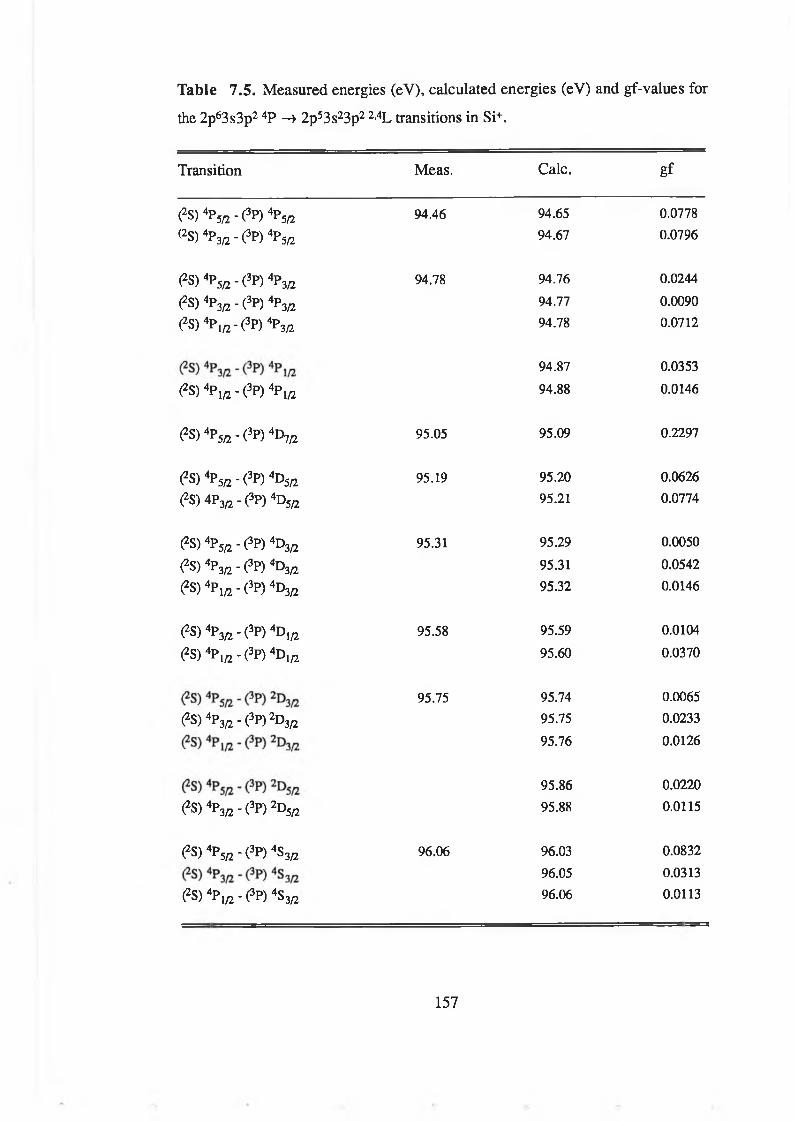
Table 7.5. Measured energies (eV), calculated energies (eV) and gf-values for
the 2p63s3p2 4P —» 2p53s23p2 2’4L transitions in Si+.
Transition M eas. Calc. g f
^S) 4P5/2 - ( 3P ) 4P5/2 94.46 94.65 0.0778
(2S )4P3/2 -(3 p )4P5/2 94.67 0.0796
(2S)4P5/2 -(3 p )4P3/2 94.78 94.76 0.0244
(2S) 4P3/2 - (3p) 4P3/2 94.77 0.0090
( ^ P ^ P ) 4? ^ 94.78 0.0712
94.87 0.0353
(2S)4Pw -(3 P )4P 1/2 94.88 0.0146
^S) 4P5/2 - (3P) 4D7/2 95.05 95.09 0.2297
<?S) 4?5/2 - (3P) 4D5/2 95.19 95.20 0.0626
^S) 4P3/2 - (3P) 4D5/2 95.21 0.0774
^ s) 4p5/2 ' (3P) 4d 3/2 95.31 95.29 0.0050
^S) 4P3/2 ' (3P) 4D3/2 95.31 0.0542
^S) 4P !/2 - (3P) 4D3y2 95.32 0.0146
<?S) 4P3/2 - (3P) 4d î/2 95.58 95.59 0.0104
(2S)4P 1/2 -(3 p )4D1/2 95.60 0.0370
95.75 95.74 0.0065
(2S)4P3/2 - ( 3P )2D3Æ 95.75 0.0233
95.76 0.0126
95.86 0.0220
^S) 4P3/2 ■ (3P) 2D5/2 95.88 0.0115
(2S) 4P5/2 - ( 3P )4S3Æ 96.06 96.03 0.0832
96.05 0.0313
? S ) 4P1/2 - (3P) 4S3/2 96.06 0.0113
157
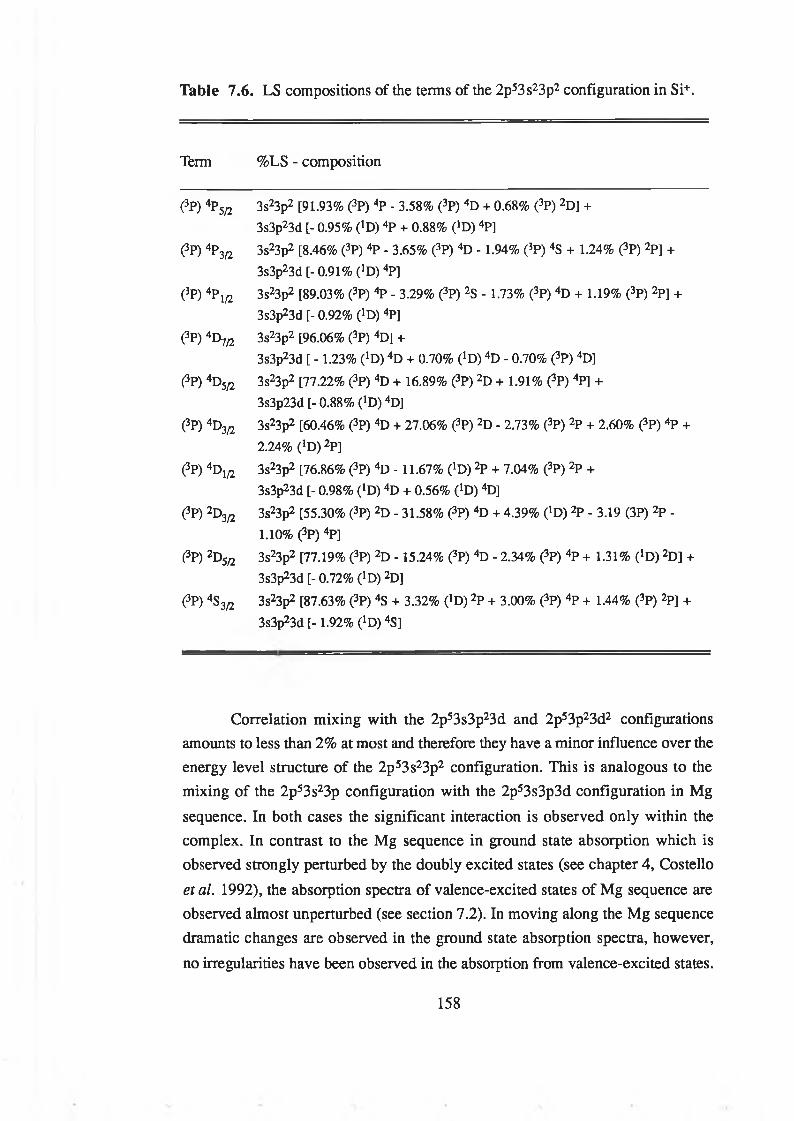
Table 7.6. LS compositions of the terms of the 2p53s23p2 configuration in Si+.
Term %LS - composition
(*P) 4P 5/2 3 s 23p 2 [9 1 .9 3 % (3P ) 4P - 3 .5 8 % (3P ) 4D + 0 .6 8 % ( 3P ) 2D ] +
3s3p 2 3 d [- 0 .9 5 % ( JD) 4P + 0 .8 8 % (*D ) 4P]
^ P ) 4P 3/2 3 s 23p 2 [8 .4 6 % (3P ) 4P - 3 .6 5 % (3P ) 4D - 1 .9 4 % (*P ) 4S + 1 .2 4 % (3P ) 2P ] +
3s3p 2 3d [- 0 .9 1 % ( ]D ) 4P]
(*P) 4P 1/2 3 s 23p 2 [8 9 .0 3 % (3P ) 4P - 3 .2 9 % (3P ) 2S - 1 .7 3 % (3P ) 4D + 1 .1 9 % (3P ) 2P ] +
3s3p 2 3d [- 0 .9 2 % ( ’ D) 4P ]
(?P) 4D7/2 3 s 23p2 [9 6 .0 6 % (3P ) 4D ] +
3 s3p 2 3 d [ - 1 .2 3 % (*D ) 4D + 0 .7 0 % (lD) 4D - 0 .7 0 % (3P ) 4D]
(Sp) 4D5/2 3 s 23p 2 [7 7 .2 2 % (3P ) 4D + 1 6 .8 9 % (3P ) 2D + 1 .9 1 % (3P ) 4P] +
3 s3 p 2 3 d [- 0 .8 8 % ( ! D ) 4D]
(3p) 4D3y2 3 s23p2 [6 0 .4 6 % (3P ) 4D + 2 7 .0 6 % ^ P ) 2D - 2 .7 3 % (3P ) 2P + 2 .6 0 % (3p ) 4P +
2 .2 4 % ( JD ) 2P]
(3p) 4D 1/2 3 s 23p 2 [7 6 .8 6 % (3P ) 4D - 1 1 .6 7 % ( ! D ) 2P + 7 .0 4 % (3P ) 2P +
3s3p 2 3d [- 0 .9 8 % (*D ) 4D + 0 .5 6 % (>D ) 4D]
^ P ) 2 D3/2 3 s23p 2 [5 5 .3 0 % (3P ) 2D - 3 1 .5 8 % (3P ) 4D + 4 .3 9 % (>D ) 2P - 3 .1 9 (3 P ) 2P -
1 .1 0 % (3P ) 4P]
(3P) 2D5/2 3 s 23p 2 [7 7 .1 9 % (3P) 2D - 1 5 .2 4 % (3P ) 4D - 2 .3 4 % (3P ) 4P + 1 .3 1 % ( ! D ) 2D ] +
3 s3p 23 d [- 0 .7 2 % ( ] D) 2D]
^ P ) 4S 3/2 3s13pz [8 7 .6 3 % (3P ) 4S + 3 .3 2 % ^ D ) 2P + 3 .0 0 % (3P ) 4P + 1 .4 4 % (3P ) 2P ] +
3s3p 2 3 d [ - 1 .9 2 % ( !D ) 4S]
Correlation mixing with the 2p53s3p23d and 2p53p23d2 configurations amounts to less than 2% at most and therefore they have a minor influence over the energy level structure of the 2p53s23p2 configuration. This is analogous to the mixing of the 2p53s23p configuration with the 2p53s3p3d configuration in Mg
sequence. In both cases the significant interaction is observed only within the complex. In contrast to the Mg sequence in ground state absorption which is observed strongly perturbed by the doubly excited states (see chapter 4, Costello
etal. 1992), the absorption spectra of valence-excited states of Mg sequence are observed almost unperturbed (see section 7.2). In moving along the Mg sequence dramatic changes are observed in the ground state absorption spectra, however,
no irregularities have been observed in the absorption from valence-excited states.
158
In the 2p absorption along the A1 sequence in ground state, moving from A1 neutral to singly ionised Si a number of irregularities have been observed (see chapter 5).
However, the levels of the core-excited configuration 2p53s23p2 have been observed unperturbed - analogous to the 2p53s23p configuration in Mg sequence (Mosnier etal. 1994) -, therefore, its structure and behaviour is expected same in the other isoelectronic species.
7.4 Conclusions
Inner-shell photoabsorption investigations of the core-excited states which do not connect to the ground state via the electric dipole operator are presented
along the magnesium isoelectronic sequence for Mg, A1+ and Si2+, and for Si+. The results show the powerful potential of the DLP technique for the study of photoabsorption from the valence-excited states along an isoelectronic which has
not been achieved before.Photoabsorption spectra reported along the magnesium sequence exhibits
the 2p63s3p -> 2p53s23p transitions. In moving along the sequence, spectra remain similar in appearance, with the exception of transition energy shifts, which rules
out the presence of any perturbers. This is in contrast with the ground state absorption reported along this sequence. The behaviour of the core-excited configuration 2p53s23p2 in Si+ has been shown same to the 2p53s23p configuration
in magnesium sequence.In case of atomic magnesium the photoabsorption data has been used to
interpret its ejected-electron spectrum (Pejcev et al. 1977) excited by low-energy
electron impact corresponding to the autoionization decay of 2p53s23p states. In the case of Al+ the decay dynamics of this core-excited configuration has already been described in detail by Malutzki etal. (1987), therefore, only comparison is shown with their data.
As the measurements were made during cooling phase of the laser plasma, strong absorption has been observed only from the metastable states both in magnesium and aluminium sequences.
159
7.5 References
Belie D S, Dunn G H, Morgan T J, Mueller D W and Timmer C, 1983, Phys. Rev. Lett., 5 0, 339.
Bizau J M, Wuillemier F, Ederer D L, Keller J C, LeGouet J L, Picque J.-L, carre B and Koch PM , 1985, Phys. Rev. Lett. 55, 1281.
Bradley D J, 1969, Appl. Opt. 8, 1957.
Bradley D J, Ewart P, Nicholas J V, Shaw J R D and Thompson D G, 1973, Phys.Rev.Lett., 31, 263.
Brilly J, Kennedy E T and Mosnier J -P, 1990, Phys. Scr. 41, 30.
Costello J T, Evans D, Hopkins R B, Kennedy E T, Kieman L, Mansfield M W D, Mosnier J P, Sayyad M H and Sonntag B F, 1992, J. Phys.B: At. Mol. Phys., 25, 5055.
Cowan R D, 1981, The Theory of Atomic Structure and Spectra, University of California Press.
Cubaynes D, Bizau J M, Wuilleumier F J, Carre B and Gounand F, 1989, Phys. Rev. Lett. 6 3, 2460.
Dubau J and Volonte S, 1980, Rep. Prog. Pysic. 43, 199.
Esteva J M and Mehlman G, 1974, Ap.J., 193, 747 (1974).
Ferray M, Gounand F, D ’Oliveira P, Fournier P R, Cubaynes D, Bizau J M, Morgan T J and Wuilleumier F J, 1987, Phys. Rev. Lett. 5 9, 2040.
Froese-Fisher C, 1986, Phys. Rev. A 34, 1667.
Gaardsted J O, Andersen T, Sonnek D, Mannervik S and Short R T, 1988, Physica Scripta, 3 8, 27.
160
Gaardsted J O, Brage, Froese Fischer C and Sonnek D, 1990, Physica Scripta, 42, 543.
Lucatorto T B and Mcllrath T J, 1977, Phys. Rev. Lett. 3 8, 1390
Malutzki R, Wächter A, Schmidt V and Hansen J E, 1987,J. Phys.B: At. Mol. Phys., 2 0, 5411.
Martin W C and Zalubas R, 1979, J. Phys. Chem. Ref. Data, 8, 817.
Martin W C and Zalubas R, 1980, J. Phys. Chem. Ref. Data, 9, 1.
Martin W C and Zalubas R, 1983, J. Phys. Chem. Ref. Data, 12, 323.
Mcllrath T J, 1969, Appl.Phys.Lett., 15, 41.
Mcllrath T J and Carlsten J L, 1973, J.Phys.B: Atom. Molec.Phys., 6, 697.
Meyer M, Muller B, Nunnemann A, Prscher Th, Raven R v, Richter M, Schmidt M, Sonntag B and Zimmermann P, 1987, Phys. Rev. Lett. 5 9, 2040.
Mosnier J -P, Brilly J and Kennedy E T, 1987, J.Physique, 4 8, C9-219 (1987). Mosnier J P, Costello J T, Kennedy E T, Kieman L and Sayyad M H, 1994, Phys. Rev. A 4 9, 755.
Pahler M, Lorenz C, Raven E v, Ruder J, Sonntag B, Baier S, Muller B R, Schulze M, Staiger H, Zimmermann P and Kabachnik N M, 1992, Phys. Rev. Lett. 68, 2285.
Pejcev V, Ottley T W, Rassi D and Ross K J, 1977, J.Phys.B: Atom. Molec. Phys., 10,2389
Sonntag B F, Cromer C L, Bridges J M, Mcllrath T J and Lucatorto T B, 1986, in Short Wavelength Coherent Radiation: Generation and Applications (Monterey, California, March 24-26, 1986), edited by Attwood D T and Bokor J, AIP Conf. Proc. No. 147 (AIP, New York), p. 412.
Sugar J, Lucatorto T B, Mcllrath T J and Weiss A W, 1979. Opt. Lett. 4, 109.
161
APPENDIX A
THE SODIUM ISOELECTRONIC SEQUENCE IN
GROUND STATE ABSORPTION
Photoabsorption spectrum of Na-like Si3+ has been recorded in the
2p-subshell region. The results of the measurements made in the regions of
2p63s 2S —» 2p53s2 2P and 2p63s 2S —» 2p5[3snd +3s(n+l)s + 3pnp, n > 3]
resonances are shown in figures A-1(a) and A-1(b) respectively. The Si3+
spectrum is dominated by the 2p —» 3d transitions and the remaining Rydbergs are
relatively very weak.
In order to do isoelectronic comparison, the photoabsorption spectra of
Na-like ions Mg+ and Al2+ have also been recorded. In figure A-2 the results are
shown in the regions of 2p —> 3p2 + 3s3d and 3s4s transitions for the
isoelectronic species Mg+, Al2+ and Si3+. In moving from Mg+ to Si3+, the 3d
contraction and level crossings result in dramatic changes in the spectra. In the case
of Mg+, the spectrum shown is only due to the 2p —» 3p2 + 3s3d and 3s4s
transitions and in this region no significant absorption has been observed from its
valence-excited states. In the cases of Al2+ and Si3+, relatively more absorption
features are observed which are arising from the 2p63p —> 2p53p3d transitions.
A1
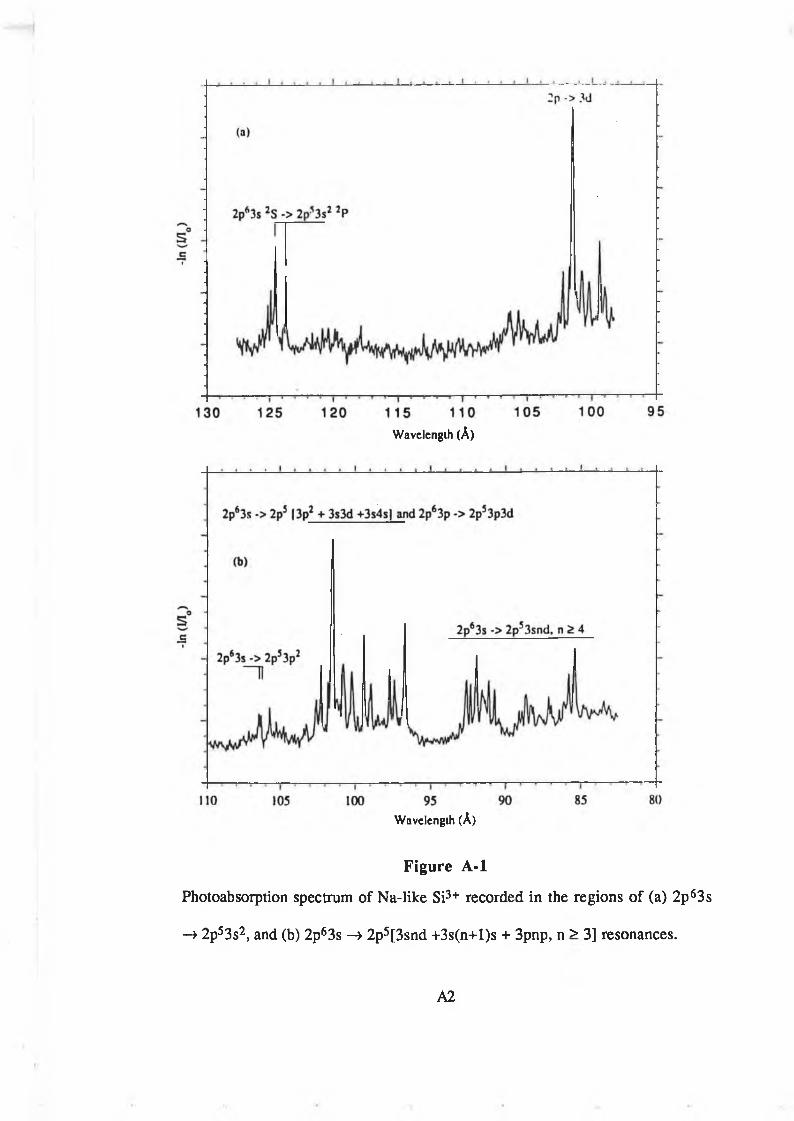
W avelength (A)
W avelength (A)
Figure A -l
Photoabsorption spectrum of Na-like Si3+ recorded in the regions of (a) 2p63s
-> 2p53s2, and (b) 2p63s —> 2p5[3snd +3s(n+l)s + 3pnp, n > 3] resonances.
A2
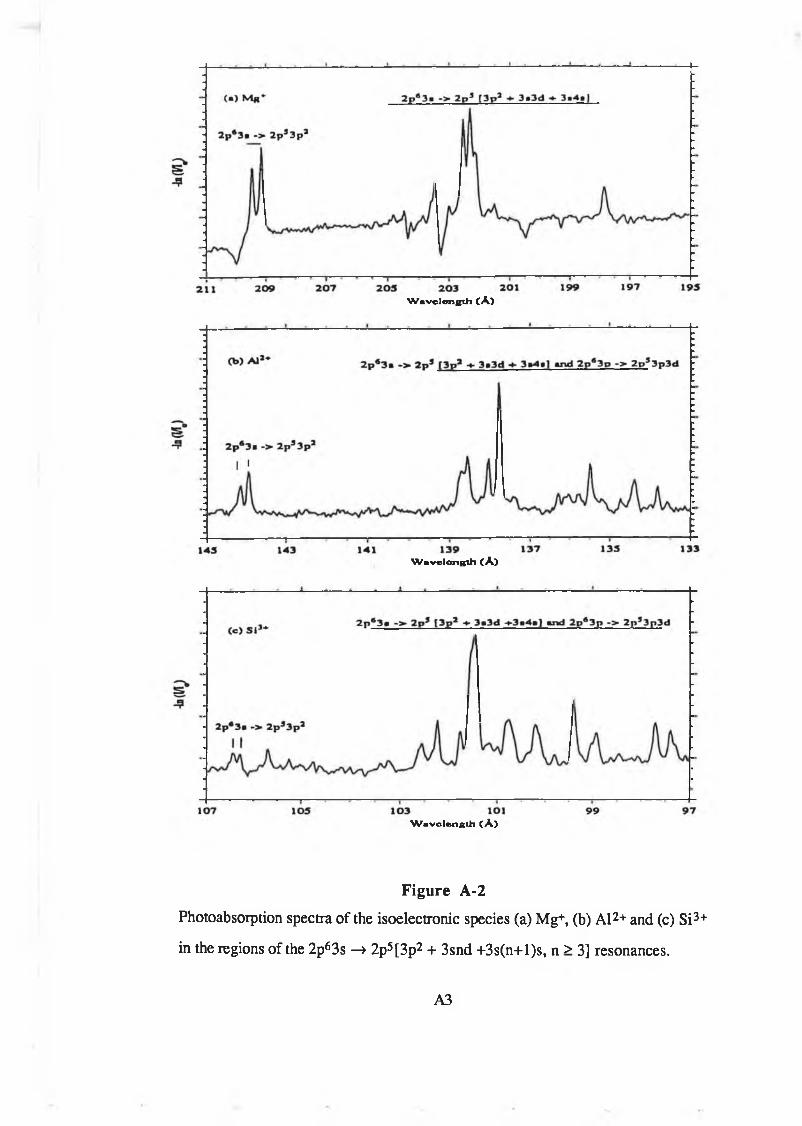
W avelength (A)
W avelength (A)
Wavelength (A)
Figure A-2
Photoabsorption spectra of the isoelectronic species (a) Mg+, (b) Al2+ and (c) Si3+
in the regions of the 2p63s —> 2p5[3p2 + 3snd +3s(n+l)s, n > 3] resonances.
A3
APPENDIX B
THE SODIUM ISOELECTRONIC SEQUENCE IN
EXCITED STATE ABSORPTION
Using the dual laser-produced plasma technique the 2p-subshell
photoabsorption spectra have been measured for the Na-like ions Mg+, Al2+ and
Si3+ prepared in valence-excited states. The results are shown in figure B-l. In
these spectra, along with the absorption from Mg+, Al2+ and Si3+ in valence-
excited states 2p63p 2Pi/2, 3/2 * the absorption structures which include the
resonances arising from the 2p63s 2S 1/2 —> 2p53s2 2P 3/2 ,i /2 (Na-like ground state
state absorption) and the transition arrays arising from the 2p63s3p —> 2p53s23p
(Mg-like excited state absorption) are also present.
In the 2p53s3p excited configuration the parent configuration 3s3p couples
through the exchange interaction to form 1»3P terms. These two terms in turn
couple with the 2p5 2P3/2ii /2 core to form terms of the type 2>4D, 2*4P, and 2>4S
and form two groups of excitation states.
In moving along the sequence from Mg+ to Si3+, no significant change can
be observed which rules out the presence of any perturbation. This is analogous to
the photoabsorption spectra measured along Mg sequence prepared in the valence-
excited 2p63s3p configuration (see chapter 5).
B1
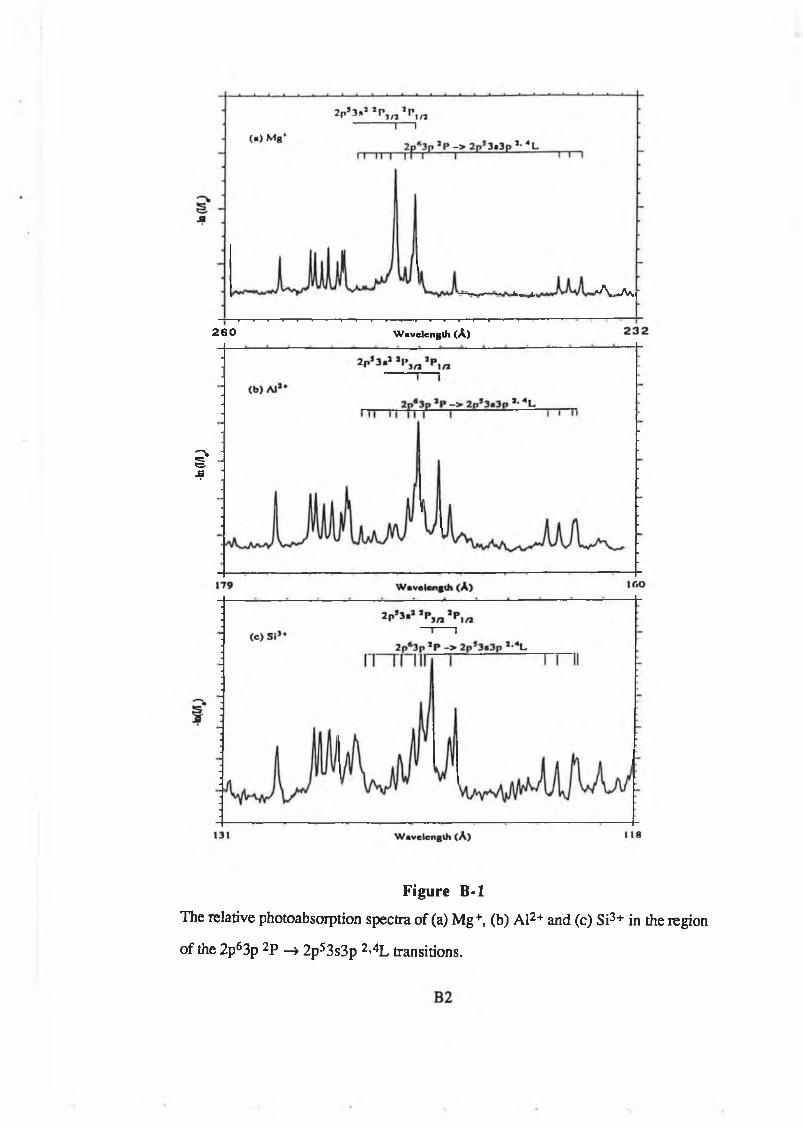
■ta a/i
.)
hVii _>i -*^\i , iA\|
2 6 0 Wave length (À)
Figure B -l
The relative photoabsorption spectra of (a) Mg+, (b) Al2+ and (c) Si3+ in the region
of the 2p63p 2P —> 2p53s3p 2-4L transitions.
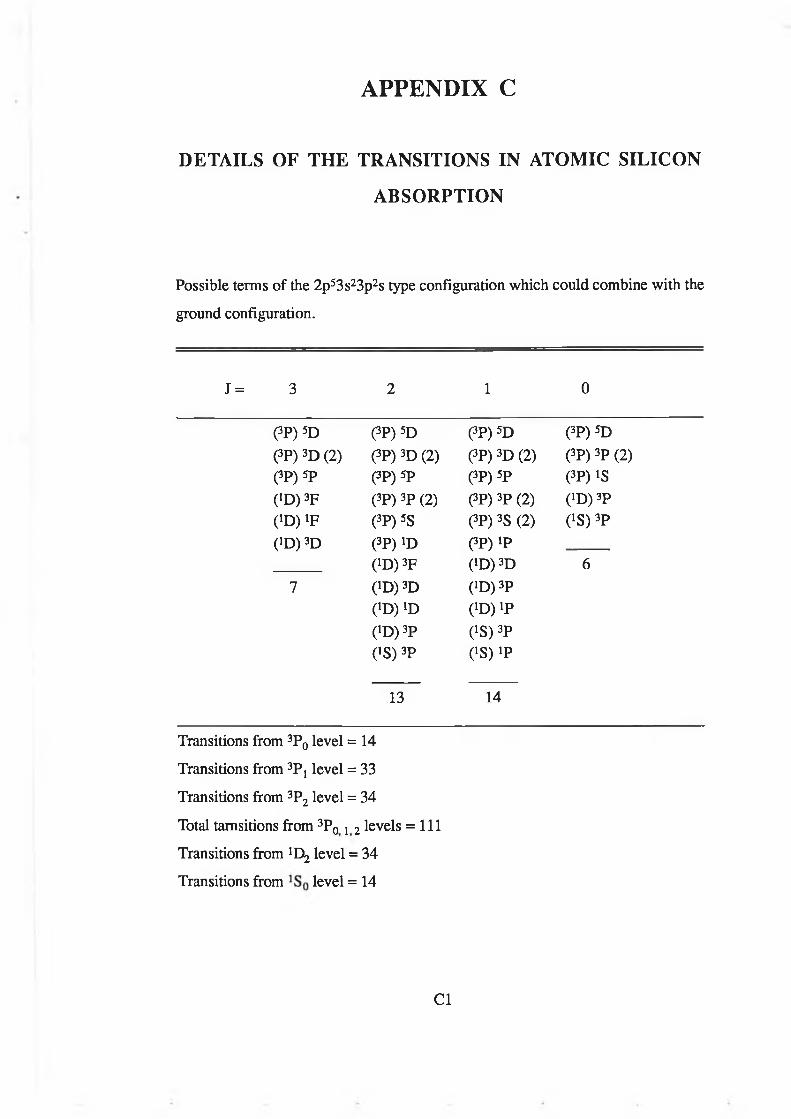
APPENDIX C
DETAILS OF THE TRANSITIONS IN ATOMIC SILICON
ABSORPTION
Possible terms of the 2p53s23p2s type configuration which could combine with the
ground configuration.
J = 3 2 1 0
(3P) 5D (3P) 5D (3P) 5D (3P) 5D(3P) 3D (2) (3P) 3D (2) (3P) 3D (2) (3P) 3P (2)(3P) 5P (3P) 5P (3P) 5P (3P) !S(*D) 3F (3P) 3P (2) (3P) 3P (2) OD) 3POD) !F (3P) 5S (3P) 3S (2) OS) 3POD) 3D (3P) !D (3P) !P
(ID) 3F (ID) 3D 67 (ID) 3D OD) 3P
OD) !D OD) !pOD) 3P OS) 3POS) 3P OS) !P
13 14
Transitions from 3P0 level = 14
Transitions from 3Pj level = 33
Transitions from 3P2 level = 34
Total tamsitions from 3P0 12 levels = 111
Transitions from ’D2 level = 34
Transitions from level = 14
Cl
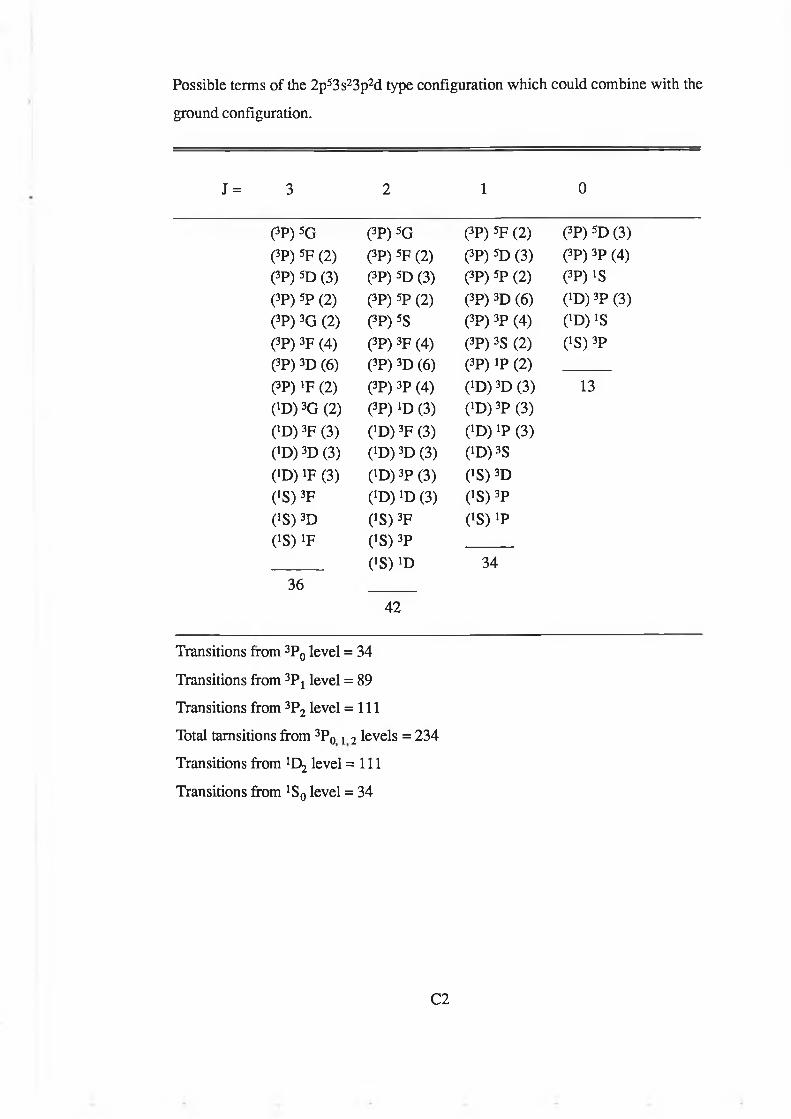
Possible terms o f the 2p 53s23p2d type configuration w h ic h cou ld com bine w ith the
ground configuration.
J = 3 2 1 0
(3P) 5G (3P) 5G (3P) 5F (2) (3P) 5D (3)
(3P) 5F (2) (3P) 5F (2) (3P) 5D (3) (3P) 3P (4)(3P) 5D (3) (3P) 5D (3) (3P) 5P (2) (3P) lS(3P) sp (2) (3P) sp (2) (3P) 3D (6) OD) 3P (3)(3P) 3G (2) (3P) 5S (3P) 3P (4) OD) !S(3P) 3F (4) (3P) 3F (4) (3P) 3S (2) OS) 3P(3P) 3D (6) (3P) 3D (6) (3P) IP (2)(3P) IF (2) (3P) 3P (4) (ID) 3D (3) 13OD) 3G (2) (3P) iD (3) 0 D )3P (3)0 D )3F (3) 0 D )3F (3) OD) iP (3)(ID) 3D (3) OD) 3D (3) (ID) 3Sm IF (3) OD) 3P (3) OS) 3DOS) 3F OD) ID (3) OS) 3POS) 3D OS) 3F OS) !POS) !F OS) 3P
OS) !D 3436
42
Transitions from 3P0 level = 34
Transitions from 3P t level = 89
Transitions from 3P2 level =111
Total tamsitions from 3P0 l 2 levels = 234
Transitions from !D2 level =111
Transitions from *S0 level = 34
C 2
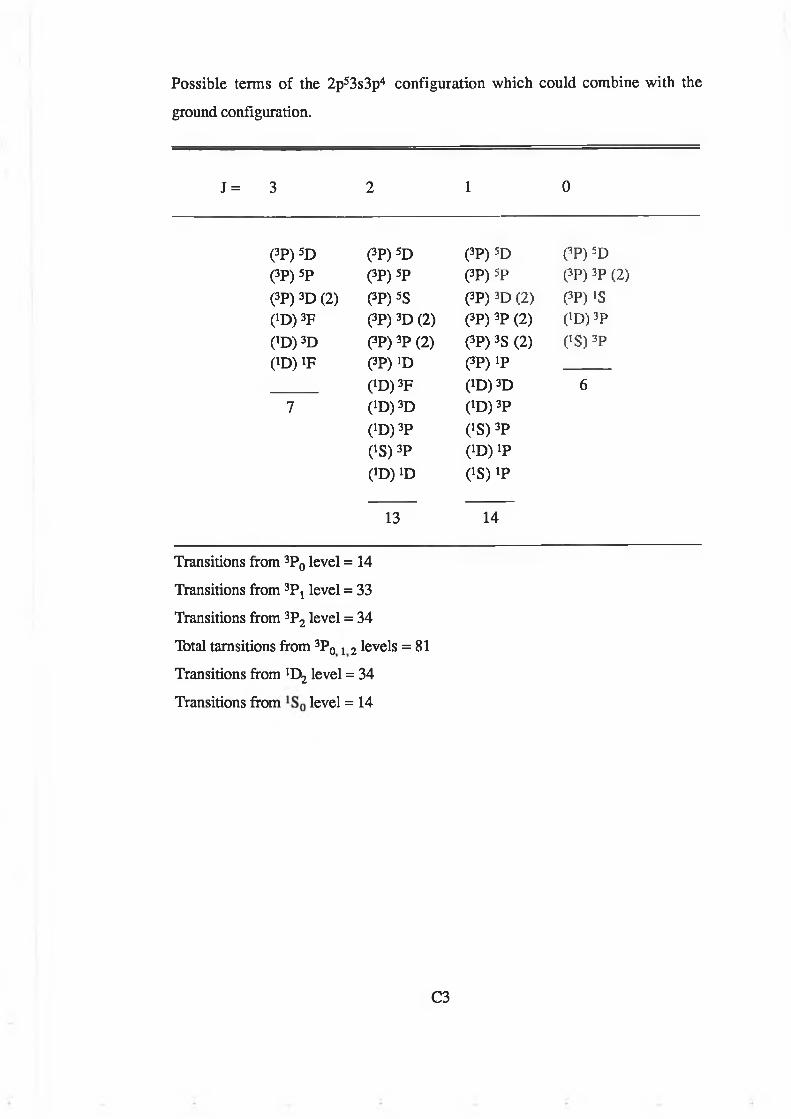
P o s s ib le ternis o f the 2 p 53s3p4 c o n fig u ra tio n w h ic h c o u ld c o m b in e w ith the
ground con fig u ration.
J = 3 2 1 0
(3P) 5D (3P) 5D (3P) 5D (3P) 5D(3P) 5P (3P) 5P (3P ) 5 p (3P) 3P (2)(3P) 3D (2) (3P) 5S (3P) 3D (2) OP) 'SCD) 3F (3P)3D(2) (3P) 3P (2) 0 D )3POD) 3D (3P)3P (2) (3P ) 3S(2) OS) 3P(ID) IF 0>P) !D (3P) !P
0 D )3F 0 D )3D 67 (ID) 3D OD) 3P
OD) 3P OS) 3POS) 3P (ID) IP(ID) ID OS) !P
13 14
Transitions from 3P0 level = 14
Transitions from 3Pj level = 33
Transitions from 3P2 level = 34
Total tamsitions from 3P0 l 2 levels = 81
Transitions from !D2 level = 34
Transitions from level = 14
C 3

Acknowledgements
First of all I would like to thank Professor Eugene T Kennedy for providing me with the opportunity to carry out research in the Physics Department, School of Physical Sciences. Without his inspiration, encouragement and kindness this work would never have been completed.
The efforts of the respected staff of LPGROUP -my supervisor, Dr. John T Costello and Dr. Jean-Paul Mosnier- and the contribution of the fellow postgraduates in developing an excellent facility which enabled me to carry out the research reported in this thesis are very much appreciated. I am also grateful to the staff for keeping open for me the doors of all kinds of assistance and guidance throughout this period.
I am grateful to Dr. John T Costello for numerous discussions which proved very stimulating and helpful in writing chapter 4 .1 would also like to thank Dr. Jean-Paul Mosnier for his time and help during discussions on various topics of spectroscopy and acknowledge his help in providing the comparison of photoabsorption data with the ejected-electron spectra reported in chapter 5.
I wish to thank Martin G O ’Mullane of UCC for help in installing and running Cowan’ s code on the DCU VAX which has been used for the atomic structure calculations reported in this work.
The co-operation and help of the technical and administrative school staff on various occasions are very much appreciated.
I would also like to take this opportunity to thank very much Dr. R J A Bradley on his very sympathetic efforts in getting visas for me and my family.
The time passed in extra-circular activities with fellow postgraduates, particularly, Dave, Bruce, Matthew, Martin, Laurence and Ulrich will never be forgotten.
Finally I would also like to thank my family members who allowed me to go for studies and showed a great patience. I am also grateful to my brother Muhammad Hussain and in-laws who shared my family responsibilities during this difficult period.
Recommended