INSIGHTS – OUTLOOK » INTerIm repOrT aS Of JUNe 30, 2009
2
INSIGHTS – OUTLOOKINTerIm repOrT aS Of JUNe 30, 2009CONTENTS
Key fIGUreS 3
INTerIm maNaGemeNT repOrT 5
GrOUp INTerIm fINaNCIaL STaTemeNTS 14
ImprINT 27
33 Key Figures » interim report as of June 30, 2009
Key fIGUreS
4
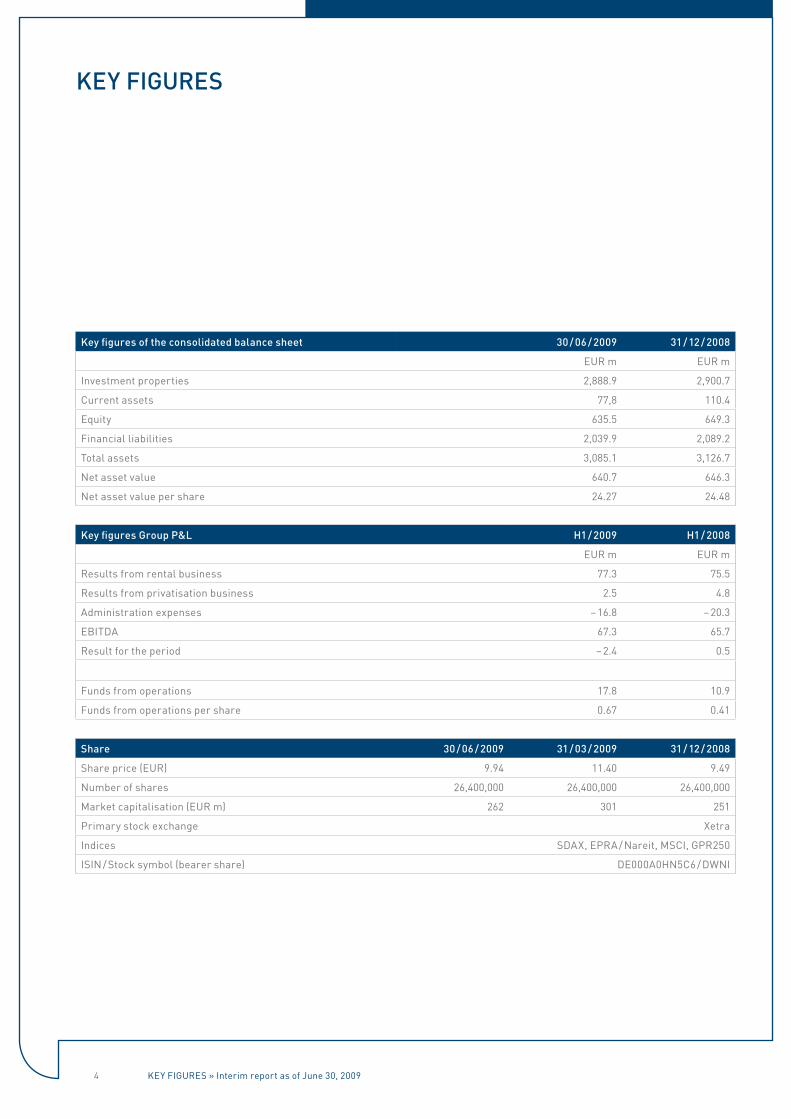
Key figures of the consolidated balance sheet 30 / 06 / 2009 31 / 12 / 2008
eur m eur m
investment properties 2,888.9 2,900.7
Current assets 77,8 110.4
equity 635.5 649.3
Financial liabilities 2,039.9 2,089.2
Total assets 3,085.1 3,126.7
Net asset value 640.7 646.3
Net asset value per share 24.27 24.48
Key figures Group p&L H1 / 2009 H1 / 2008
eur m eur m
results from rental business 77.3 75.5
results from privatisation business 2.5 4.8
Administration expenses – 16.8 – 20.3
eBiTDA 67.3 65.7
result for the period – 2.4 0.5
Funds from operations 17.8 10.9
Funds from operations per share 0.67 0.41
Share 30 / 06 / 2009 31 / 03 / 2009 31 / 12 / 2008
share price (eur) 9.94 11.40 9.49
Number of shares 26,400,000 26,400,000 26,400,000
Market capitalisation (eur m) 262 301 251
Primary stock exchange Xetra
indices sDAX, ePrA / Nareit, MsCi, gPr250
isiN / stock symbol (bearer share) De000A0HN5C6 / DWNi
Key fIGUreS
Key Figures » interim report as of June 30, 2009
55 iNTeriM MANAgeMeNT rePorT » interim report as of June 30, 2009
INTerIm maNaGemeNT repOrT

6
INTerIm maNaGemeNT repOrT
In the second quarter of 2009 and also in the entire first half of 2009, the operational development continued successfully.
» The estimated rent increased further by 0.8 % to EUR 5.29 per m2, the most strongly in our development portfolio (cluster B) by 1.5 % to EUR 4.83 per m2. Here, our investments in the property paid off. Compared to December 31, 2008 the estimated rent in the core portfolio increased by 1.1 %.
» In the core portfolio, the vacancy rate was substantially reduced by 15 % to 3.3 % in the first half of the year.
» In the area of single privatisation, we already notarially concluded 403 purchase agreements, of a goal for the year of 500 housing units. Of these 403 sold units, 190 units reflected in the balance sheet in the first half of 2009. The average sales price was 34 % above the respective fair value and thus steadily above 30 % since the beginning of 2008.
» The cost savings initiated in the past year are having full effect in 2009; accordingly, personnel costs in the first half of the year were lowered by 23 % and material costs by 4 % compared to the previous year’s 6-months.
» The financial result decreased by 9.5 % from EUR 61.8 million to EUR 55.9 million in the first half of 2009, which is essentially due to the redemptions in 2008. Through redemptions amounting to EUR 54.4 million net in the first half of 2009, we reached a loan-to-value ratio of less than 70 %.
As a result, the operative improvement translated into a significantly higher pre-tax profit of EUR 10 million (30 / 06 / 2008: EUR 2.6 million). Correspondingly, the funds from operations increased to EUR 0.67 per share (H1 / 2008 EUR 0.41 per share). The introduction of SAP is structurally concluded. The service quality has con-siderably improved due to the organisational and proce-
dural improvements in the property management divi-sion.
On the turbulent capital markets, the share price of Deutsche Wohnen has held its ground well. With a share price of EUR 9.94 per share at the end of the quarter, the value of the share has increased by 5 % since the beginning of the year.
It was concluded on an extraordinary general meeting on August 7, 2009 to raise the capital of the company by up to EUR 250 million. The new capital is to support the reduction of the leverage and the increase of the strate-gic flexibility during arising growth opportunities.
New serious risks in connection with the development of the economic situation cannot be observed. We there-fore also expect a stable operative development for the future business development.
a pOrTfOLIO STrUCTUre
Overall, Deutsche Wohnen has been managing 50,122 residential units as of 30 June 2009.
Our holdings in the core portfolio with presently 33,777 residential units are located in growing metropolitan areas such as Berlin and the rhine-main region. Here, we see the largest and most sustainable rental poten-tials and thus growth.
By far the largest single location is still Berlin, with a total portfolio share of almost 50 % and of 67 % in the core portfolio respectively.
iNTeriM MANAgeMeNT rePorT » interim report as of June 30, 2009

7
B pOrTfOLIO STraTeGy
Our business model is characterised by three main approaches:
1. Internal growth: full utilisation of rent development potentials
We plan to raise rents in our portfolio by 3 – 4 % each year. We can achieve this by making consistent use of adjustments to the rent index through targeted mod-ernisation measures that can be allocated to tenants and through a reduction in the vacancy rate. Market conditions and the property / location-based charac-teristics of our portfolio open up opportunities to enjoy continued above-average growth.
2. Value-based privatisationWe have laid a sustainable foundation for our privatisa-tion business, involving the sale particularly of residen-tial properties to occupants desirous of becoming owners. The earlier volume and liquidity-driven sales strategy is no longer a priority. Rather, our properties are to be sold at least at fair value as part of a continuous concentration of our portfolio.
The single sale partial portfolio with presently 4,840 housing units is made up of the holdings released for sale in preceding years mainly in Berlin and Rhine-Main. We have assumed sales of about 500 units p. a. in our planning, which corresponds to a sales rate of 10 % p. a. of this partial portfolio and 1 % p. a. of the entire portfolio.
iNTeriM MANAgeMeNT rePorT » interim report as of June 30, 2009
Völklinger Weg, Frankfurt / Main
imbrosweg, Berlin-Mariendorf
residential Commercial parking
units
Area m2 k
estimated rent
eur / m2
Vacancy rate
%
units
Area m2 k
units
Core portfolio 33,777 2,037 5.29 3.3 377 70 8,047
Berlin 22,757 1,369 5.08 2.5 270 37 1,855
Frankfurt / Main 3,660 217 6.76 2.6 43 17 1,825
rhine-Main 3,272 203 5.81 6.9 54 14 1,960
rheintal-süd 4,088 249 4.76 5.3 10 1 2,407
Housing privatisation 13,724 859 4.82 10.6 81 7 5,181
single sales 4,840 322 5.33 11.3 20 2 1,820
Bloc sales 8,884 537 4.52 10.1 61 5 3,361
Own property* 47,501 2,896 5.15 5.3 458 77 13,228
DB 14 2,621 179 5.47 6.2 31 8 2,624
Total properties 50,122 3,075 5.17 5.4 489 85 15,852
* not incl. North Hessen
8
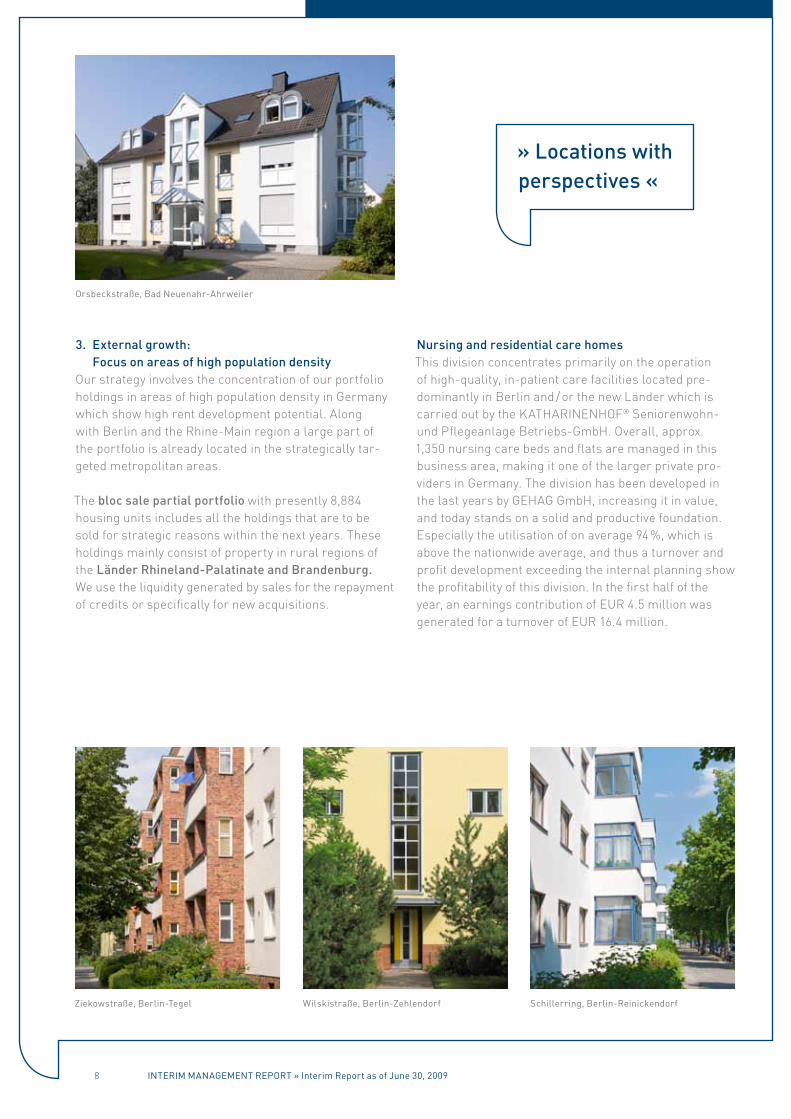
3. external growth: focus on areas of high population density
Our strategy involves the concentration of our portfolio holdings in areas of high population density in Germany which show high rent development potential. Along with Berlin and the Rhine-Main region a large part of the portfolio is already located in the strategically tar-geted metropolitan areas.
The bloc sale partial portfolio with presently 8,884 housing units includes all the holdings that are to be sold for strategic reasons within the next years. These holdings mainly consist of property in rural regions of the Länder rhineland-palatinate and Brandenburg. We use the liquidity generated by sales for the repayment of credits or specifically for new acquisitions.
Nursing and residential care homesThis division concentrates primarily on the operation of high-quality, in-patient care facilities located pre-dominantly in Berlin and / or the new Länder which is carried out by the KATHARINENHOF® Seniorenwohn- und Pflegeanlage Betriebs-GmbH. Overall, approx. 1,350 nursing care beds and flats are managed in this business area, making it one of the larger private pro-viders in Germany. The division has been developed in the last years by GEHAG GmbH, increasing it in value, and today stands on a solid and productive foundation. Especially the utilisation of on average 94 %, which is above the nationwide average, and thus a turnover and profit development exceeding the internal planning show the profitability of this division. In the first half of the year, an earnings contribution of EUR 4.5 million was generated for a turnover of EUR 16.4 million.
iNTeriM MANAgeMeNT rePorT » interim report as of June 30, 2009
Ziekowstraße, Berlin-Tegel Wilskistraße, Berlin-Zehlendorf schillerring, Berlin-reinickendorf
orsbeckstraße, Bad Neuenahr-Ahrweiler
» Locations with perspectives «
9
C OperaTIONaL DeVeLOpmeNTS
Leasing
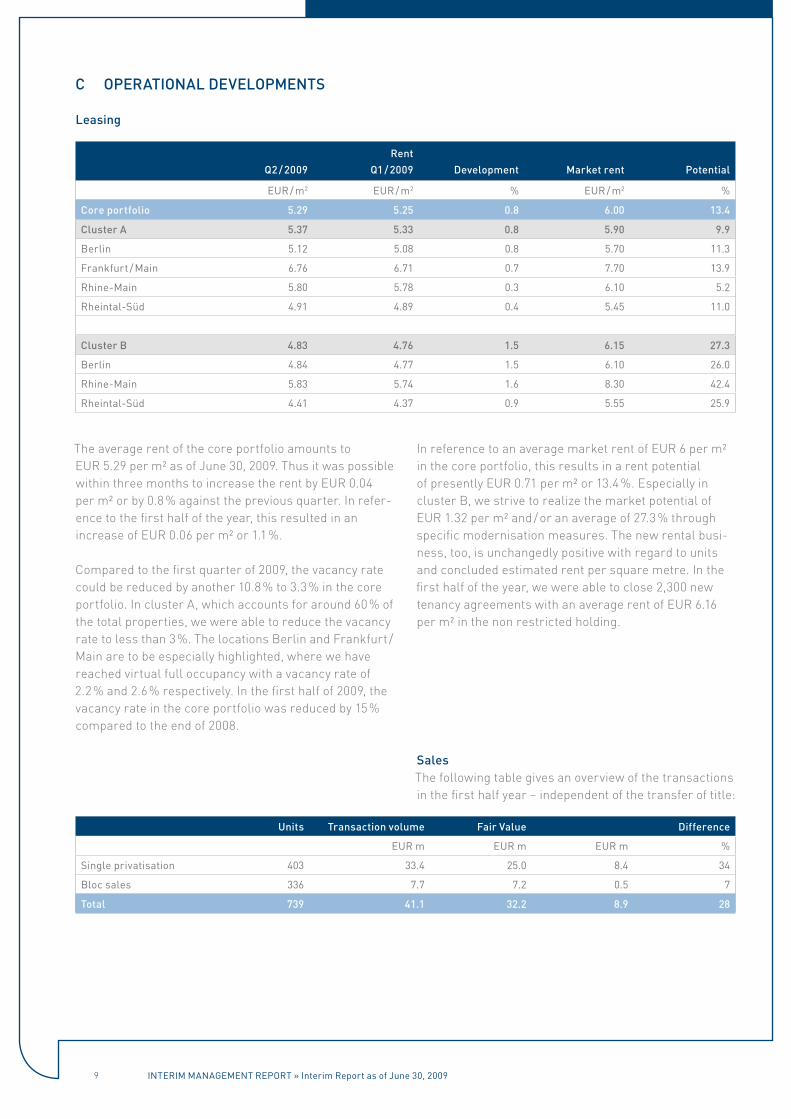
The average rent of the core portfolio amounts to EUR 5.29 per m² as of June 30, 2009. Thus it was possible within three months to increase the rent by EUR 0.04 per m² or by 0.8 % against the previous quarter. In refer-ence to the first half of the year, this resulted in an increase of EUR 0.06 per m² or 1.1 %.
Compared to the first quarter of 2009, the vacancy rate could be reduced by another 10.8 % to 3.3 % in the core portfolio. In cluster A, which accounts for around 60 % of the total properties, we were able to reduce the vacancy rate to less than 3 %. The locations Berlin and Frankfurt / Main are to be especially highlighted, where we have reached virtual full occupancy with a vacancy rate of 2.2 % and 2.6 % respectively. In the first half of 2009, the vacancy rate in the core portfolio was reduced by 15 % compared to the end of 2008.
In reference to an average market rent of EUR 6 per m² in the core portfolio, this results in a rent potential of presently EUR 0.71 per m² or 13.4 %. Especially in cluster B, we strive to realize the market potential of EUR 1.32 per m² and / or an average of 27.3 % through specific modernisation measures. The new rental busi-ness, too, is unchangedly positive with regard to units and concluded estimated rent per square metre. In the first half of the year, we were able to close 2,300 new tenancy agreements with an average rent of EUR 6.16 per m² in the non restricted holding.
SalesThe following table gives an overview of the transactions in the first half year – independent of the transfer of title:
iNTeriM MANAgeMeNT rePorT » interim report as of June 30, 2009
rent
Q2 / 2009 Q1 / 2009 Development market rent potential
eur / m2 eur / m2 % eur / m2 %
Core portfolio 5.29 5.25 0.8 6.00 13.4
Cluster a 5.37 5.33 0.8 5.90 9.9
Berlin 5.12 5.08 0.8 5.70 11.3
Frankfurt / Main 6.76 6.71 0.7 7.70 13.9
rhine-Main 5.80 5.78 0.3 6.10 5.2
rheintal-süd 4.91 4.89 0.4 5.45 11.0
Cluster B 4.83 4.76 1.5 6.15 27.3
Berlin 4.84 4.77 1.5 6.10 26.0
rhine-Main 5.83 5.74 1.6 8.30 42.4
rheintal-süd 4.41 4.37 0.9 5.55 25.9
Units Transaction volume fair Value Difference
eur m eur m eur m %
single privatisation 403 33.4 25.0 8.4 34
Bloc sales 336 7.7 7.2 0.5 7
Total 739 41.1 32.2 8.9 28
10
In the context of the single privatisation, purchase agreements with a sales volume of EUR 33.4 million for 403 units were concluded in the first half year. The aver-age sales price amounted to EUR 1,196 per m2 and was thus steadily over 30 % above the fair value for the last 18 months. Average rent multipliers of 23 x for the prop-erty in Berlin and multipliers of 18 x for the Rhine-Main region could be arranged. Of these 403 sold units, 190 units reflected in the balance sheet in the first half of 2009 with a purchase price of EUR 15.9 million and a fair value of EUR 11.5 million.
For the bloc sales that are part of the portfolio adjust-ment, we concluded purchase agreements for 336 units and a transaction volume of EUR 7.7 million in the first half of the year. Of these, 202 units were recognised in the profit and loss statement with a purchase price of EUR 2.8 million and a fair value of EUR 2.6 million in the first half of the year.
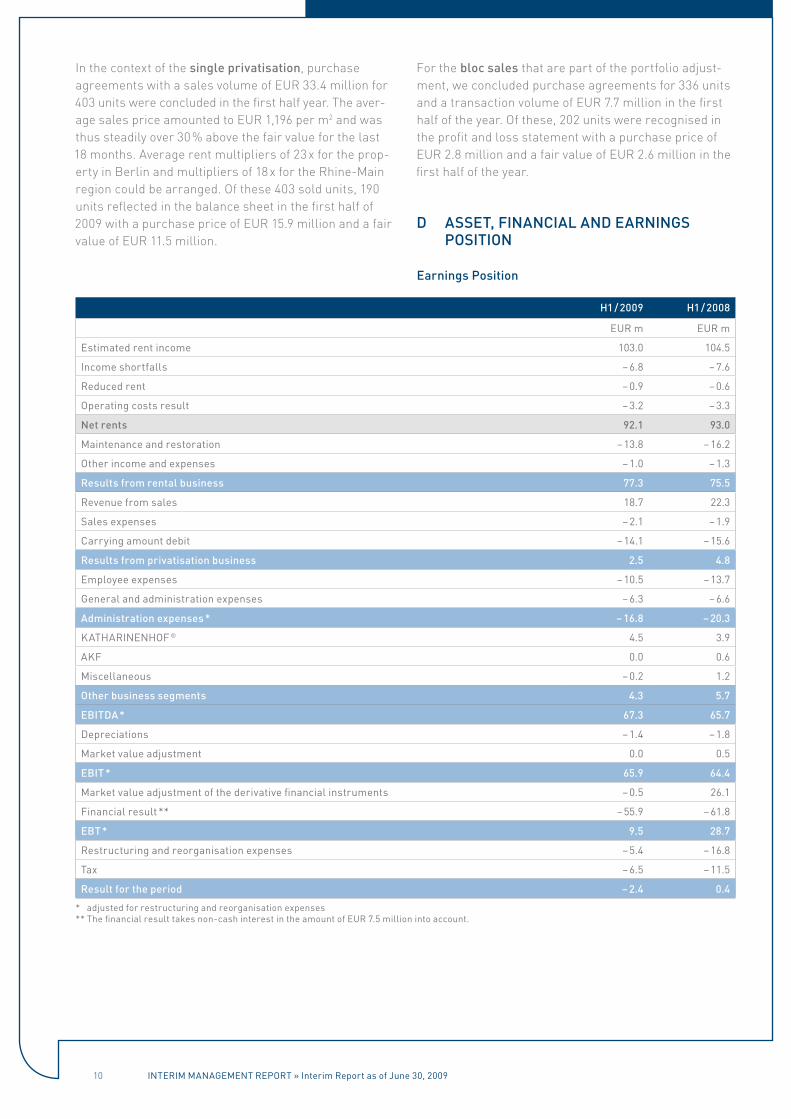
D aSSeT, fINaNCIaL aND earNINGS pOSITION
earnings position
iNTeriM MANAgeMeNT rePorT » interim report as of June 30, 2009
H1 / 2009 H1 / 2008
eur m eur m
estimated rent income 103.0 104.5
income shortfalls – 6.8 – 7.6
reduced rent – 0.9 – 0.6
operating costs result – 3.2 – 3.3
Net rents 92.1 93.0
Maintenance and restoration – 13.8 – 16.2
other income and expenses – 1.0 – 1.3
results from rental business 77.3 75.5
revenue from sales 18.7 22.3
sales expenses – 2.1 – 1.9
Carrying amount debit – 14.1 – 15.6
results from privatisation business 2.5 4.8
employee expenses – 10.5 – 13.7
general and administration expenses – 6.3 – 6.6
administration expenses * – 16.8 – 20.3
KATHAriNeNHoF ® 4.5 3.9
AKF 0.0 0.6
Miscellaneous – 0.2 1.2
Other business segments 4.3 5.7
eBITDa * 67.3 65.7
Depreciations – 1.4 – 1.8
Market value adjustment 0.0 0.5
eBIT * 65.9 64.4
Market value adjustment of the derivative financial instruments – 0.5 26.1
Financial result ** – 55.9 – 61.8
eBT * 9.5 28.7
restructuring and reorganisation expenses – 5.4 – 16.8
Tax – 6.5 – 11.5
result for the period – 2.4 0.4
* adjusted for restructuring and reorganisation expenses** The financial result takes non-cash interest in the amount of eur 7.5 million into account.

11
Except for the restructuring and reorganisation ex-penses, the first half of 2009 has not been substantially influenced by special items. In contrast, the first half of 2008 was moreover characterised by the positive market value adjustment of the derivative financial instruments.
The considerable improvement of results can be seen when the EBT is adjusted for the effect from the market value adjustment of the derivative financial instruments:
H1 / 2009 H1 / 2008
eur m eur m
earnings before taxes 4,1 12,3
restructuring and reorganisation expenses
5,4 16,8
result from the fair value adjustment of investment properties
0,0
– 0,5
result from the market value adjust-ment of derivative financial instru-ments
0,5 – 25,9
earnings before taxes (adjusted) 10,0 2,7
In spite of the shortfall in rental income due to the sell-offs in 2008, the result of the rental business could be slightly increased in the first half of 2009. This is due on the one hand to the realised rent increases and on the other hand to reduced maintenance expenses. Apart from this, we refer to our explanations in section C
“Operational Developments”.
The cost savings in the administrative area are to be especially highlighted. Employee expenses decreased in comparison with the same period of the previous year
from EUR 13.7 million by 23.4 % to EUR 10.5 million. Material costs decreased by EUR 0.3 million.
The financial result could be lowered by EUR 5.9 million or 9.5 % through the redemptions in 2008.
The restructuring and reorganisation expenses (EUR 5.4 million) include compensations and continued payments of wages in the amount of EUR 3.4 million. Furthermore, EUR 2 million were accumulated in the context of the reorganisation.
Net asset position The balance sheet total as of June 30, 2009 of EUR 3,085.1 million has only negligibly changed against December 31, 2008 (EUR 3,126.7 million). With 93 %, the investment properties make up the largest balance sheet item (EUR 2,888.9 million).
The current assets amount to EUR 77.8 million and include payment instruments with EUR 19.5 million and the noncurrent assets held for sale with EUR 18.1 million as the largest single items.
On June 30, 2009, the equity amounted to EUR 635.5 million.
The current and noncurrent financial liabilities with EUR 2,039.9 million decreased compared to the end of 2008 due to amortisations (net EUR 54 million) (31 / 12 / 2008: EUR 2089.2 million).
Thus we were able to improve our debt position to 69.9 %:
30 / 06 / 2009 31 / 12 / 2008
k eur k eur
Financial liabilities 2,039,892 2,089,173
Convertible bonds 25,998 25,430
2,065,890 2,114,603
Payment instruments – 19,545 – 41,974
Net financial liabilities 2,046,345 2,072,628
investment properties 2,888,911 2,900,673
Land and buildings held for sale 19,166 19,355
Noncurrent assets held for sale 18,132 17,696
2,926,209 2,937,724
Loan-to-value ratio 69.9 % 70.6 %
iNTeriM MANAgeMeNT rePorT » interim report as of June 30, 2009

12
The increase of the current financial liabilities is due, among other things, to the unscheduled repayment in connection with the planned increase in capital. These payments are under the condition that the increase in capital will take place and depend additionally on actu-ally realized issue proceeds.
financial positionThe Group cash flow statement shows a clear improve-ment of the liquidity development against the comparison period in 2008. The cash flow from operating activity improved by EUR 14.8 million to EUR 15.6 million. From disinvestments, further funds in the amount of EUR 20.5 million could be added to the company, of which EUR 2.8 were reinvested. Further payments occurred in connection with DB 14 (EUR 1.3 million). Financial liabili-ties in the amount of EUR 54.4 million net were repaid net.
As of June 30, 2009, the financial resource fund includes EUR 19.5 million in cash. Furthermore, we have free credit lines in the amount of EUR 65 million at our disposal.
The operationally improved cost structure, together with the reduction of the vacancy rate and the rent develop-ment, also clearly reflects positively in the funds from operations as of June 30, 2009. These funds amount to EUR 17.8 million or EUR 0.67 per share respectively and are calculated as follows:
H1 / 2009 H1 / 2008
eur m eur m
result for the period – 2.4 0.5
Depreciations 1.4 0.8
Value adjustment of investment properties
0.0
– 0.5
results from discontinued divisions
0.0
0.3
Value adjustment of the derivative financial instruments
0.5
– 25.9
Financial expenses not affecting liquidity
7.5
7.5
Deferred taxes 5.4 11.3
restructuring costs 5.4 16.8
FFo 17.8 10.8
FFo per share 0.67 0.41
Net asset ValueAs of June 30, 2009, the net asset value amounts to EUR 641 million or EUR 24.27 per share respectively. It is calculated from the equity of EUR 636 million as of June 30, 2009, adjusted by the deferred taxes in con-nection with the property (EUR 5 million). Stock market and Deutsche Wohnen Share The first half of 2009 at the worldwide financial markets continued to be ruled by strong insecurity regarding the economic development and the depth and length of the expected recession. While single economic indicators point to an improvement of the global economic condi-tions at the latest in 2010, it has also been suggested that a fast recovery and the effectiveness of the economic stimulus packages passed by the governments of many European countries and the USA are doubtful. As a result, the indices stagnated in the first half of the year.
iNTeriM MANAgeMeNT rePorT » interim report as of June 30, 2009
Wiesbadener straße, Berlin-Wilmersdorf
» Optimising cost structures «
13
The DAX finished the first half of the year almost un-changed, though with strong fluctuations. MDAX and SDAX gained 3 % and 4 % respectively in the first six months of this year. The EPRA index, which shows the development of the largest European real estate shares, lost 2 %. The EPRA Germany index, which shows the German real estate shares, also declined by just under 2 %.
The Deutsche Wohnen share was not able to defy these fluctuations. Between the low (EUR 7.26 on February 19, 2009) and the high (EUR 17.20 on April 24, 2009) was a difference of almost EUR 10. As a result, the share was able to record a price gain of 5 % in the first half of 2009 compared to the share price at the end of 2008. The Deutsche Wohnen share thus developed better than the real estate-specific reference indices and finished the quarter with a price of EUR 9.94.
Supplementary reportIt was concluded on the extraordinary general meeting on August 7, 2009 to raise the share capital by up to EUR 250 million against cash contributions by issuing of new shares.
risk reportIn terms of the risks of the future business development, we refer to the statements made in the risk report of the consolidated annual financial statements as of December 31, 2008. Due to the current financial crisis, we would like to especially point out the following: The risks resulting from the refinancing of loans are at present largely limited in the Deutsche Wohnen Group due to a by far predominant share in noncurrent loans.
In the next three years, our refinancing volume only amounts to EUR 150 million. Nevertheless, due to the more restrictive lending practice as a consequence of the financial crisis, future problems when taking out and extending loans can not be ruled out.
The value of our real estate assets was assessed and confirmed as of June 30, 2009 by an independent expert.
forecast reportThe continuing financial crisis and the associated slowdown of the economy will also continue to have a paralysing effect on the real-estate markets. Larger transactions are substantially impeded or deferred due to the tightening of credit.
Nevertheless, traditionally, Germany has one of the most stable real-estate markets of the world. The residential property market is taking up a relatively recession-proof position within this market, based on its intact economic fundamentals (household and rent development). This is especially true for the core regions of our portfolio.
Our business model has proved itself even on very difficult markets. Through the successful integration and reorganisation, we developed Deutsche Wohnen into an efficient and highly professional platform in the previous year. We are convinced that we have thus laid the foundation for further operational success in the coming years. We intend to use the funds from the increase in capital for the improvement of the balance sheet structure and for further growth.
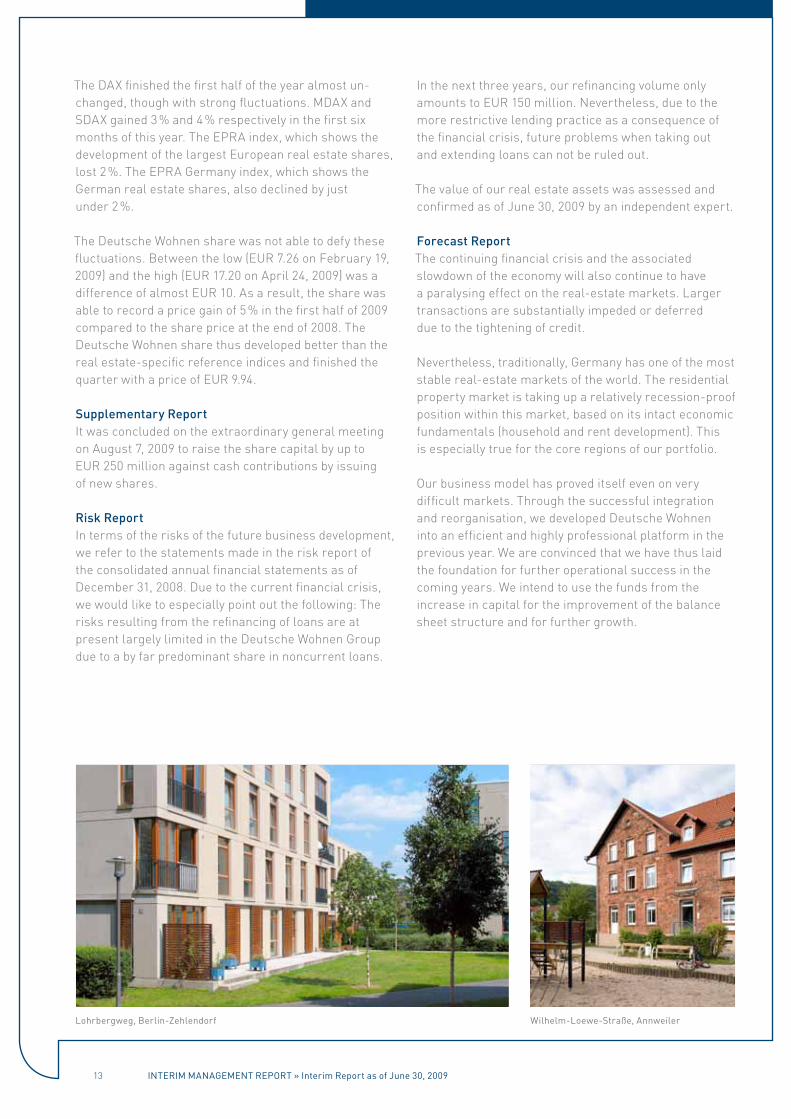
Wilhelm-Loewe-straße, Annweiler Lohrbergweg, Berlin-Zehlendorf
iNTeriM MANAgeMeNT rePorT » interim report as of June 30, 2009

1414
GrOUp INTerIm fINaNCIaL
STaTemeNTS
grouP iNTeriM FiNANCiAL sTATeMeNTs » interim report as of June 30, 2009

15
CONSOLIDaTeD BaLaNCe SHeeT Of DeUTSCHe WOHNeN aGASSETS
Deutsche Wohnen aG, frankfurt / mainConsolidated balance sheet as of June 30, 2009
30 / 06 / 2009
31 / 12 / 2008
k eur k eur
assets
investment properties 2,888,911 2,900,673
Fixed assets 17,168 17,745
intangible assets 4,220 4,652
other noncurrent assets 156 198
Holdings in affiliated companies 245 495
Deferred tax asset 96,598 92,559
Noncurrent assets 3,007,298 3,016,322
Land and buildings held for sale 19,166 19,355
other inventories 2,012 1,908
Trade receivables 12,905 21,202
receivables from income tax 2,653 5,479
other assets 3,384 2,796
Payment instruments 19,545 41,974
Subtotal current assets 59,665 92,714
Noncurrent assets held for sale 18,132 17,696
Current assets 77,797 110,410
Total assets 3,085,095 3,126,732
grouP iNTeriM FiNANCiAL sTATeMeNTs » interim report as of June 30, 2009
16
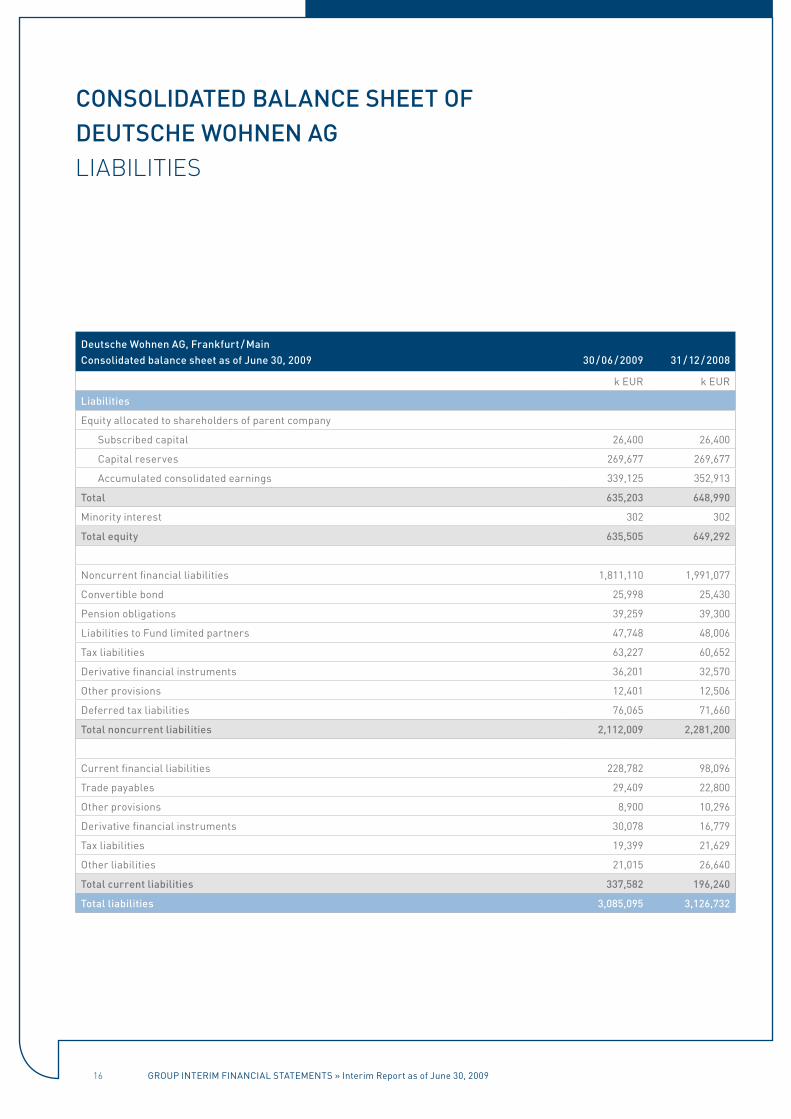
CONSOLIDaTeD BaLaNCe SHeeT Of DeUTSCHe WOHNeN aGLIABILITIES
Deutsche Wohnen aG, frankfurt / mainConsolidated balance sheet as of June 30, 2009
30 / 06 / 2009
31 / 12 / 2008
k eur k eur
Liabilities
equity allocated to shareholders of parent company
subscribed capital 26,400 26,400
Capital reserves 269,677 269,677
Accumulated consolidated earnings 339,125 352,913
Total 635,203 648,990
Minority interest 302 302
Total equity 635,505 649,292
Noncurrent financial liabilities 1,811,110 1,991,077
Convertible bond 25,998 25,430
Pension obligations 39,259 39,300
Liabilities to Fund limited partners 47,748 48,006
Tax liabilities 63,227 60,652
Derivative financial instruments 36,201 32,570
other provisions 12,401 12,506
Deferred tax liabilities 76,065 71,660
Total noncurrent liabilities 2,112,009 2,281,200
Current financial liabilities 228,782 98,096
Trade payables 29,409 22,800
other provisions 8,900 10,296
Derivative financial instruments 30,078 16,779
Tax liabilities 19,399 21,629
other liabilities 21,015 26,640
Total current liabilities 337,582 196,240
Total liabilities 3,085,095 3,126,732
grouP iNTeriM FiNANCiAL sTATeMeNTs » interim report as of June 30, 2009
17
CONSOLIDaTeD fINaNCIaL STaTemeNTS Of DeUTSCHe WOHNeN aGPROFIT AND LOSS STATEMENT
grouP iNTeriM FiNANCiAL sTATeMeNTs » interim report as of June 30, 2009
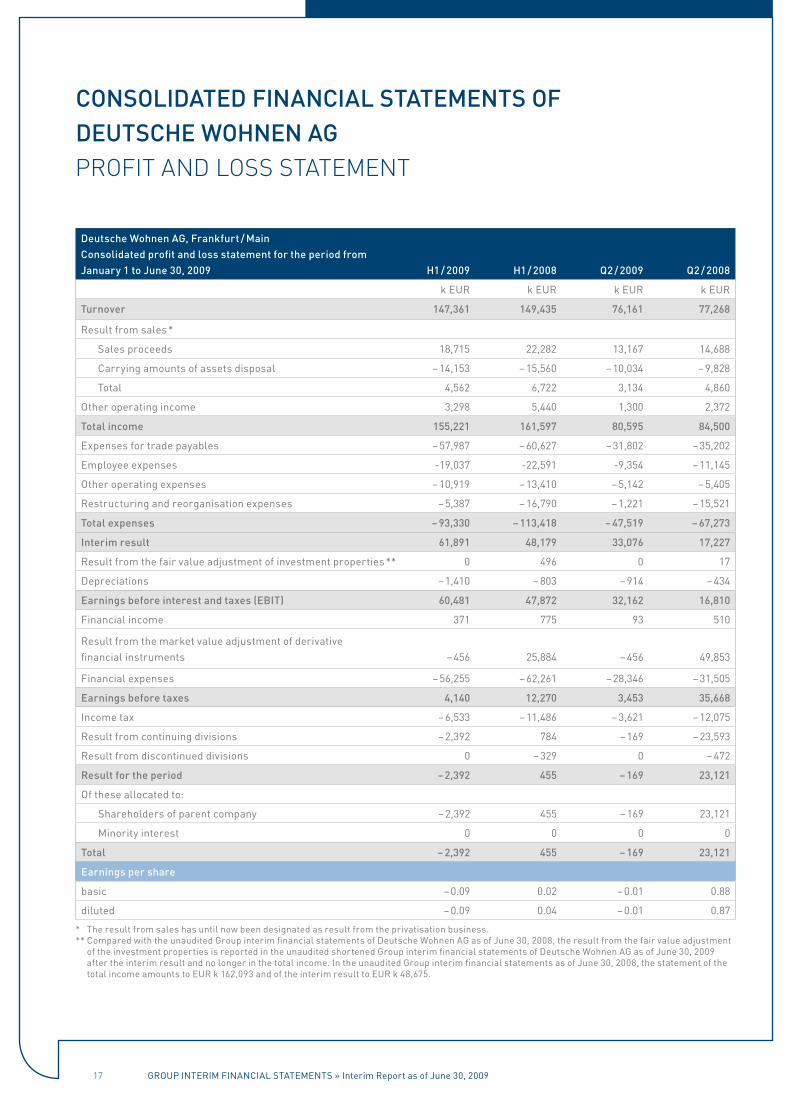
Deutsche Wohnen aG, frankfurt / mainConsolidated profit and loss statement for the period from January 1 to June 30, 2009
H1 / 2009
H1 / 2008
Q2 / 2009
Q2 / 2008
k eur k eur k eur k eur
Turnover 147,361 149,435 76,161 77,268
result from sales *
sales proceeds 18,715 22,282 13,167 14,688
Carrying amounts of assets disposal – 14,153 – 15,560 – 10,034 – 9,828
Total 4,562 6,722 3,134 4,860
other operating income 3,298 5,440 1,300 2,372
Total income 155,221 161,597 80,595 84,500
expenses for trade payables – 57,987 – 60,627 – 31,802 – 35,202
employee expenses -19,037 -22,591 -9,354 – 11,145
other operating expenses – 10,919 – 13,410 – 5,142 – 5,405
restructuring and reorganisation expenses – 5,387 – 16,790 – 1,221 – 15,521
Total expenses – 93,330 – 113,418 – 47,519 – 67,273
Interim result 61,891 48,179 33,076 17,227
result from the fair value adjustment of investment properties ** 0 496 0 17
Depreciations – 1,410 – 803 – 914 – 434
earnings before interest and taxes (eBIT) 60,481 47,872 32,162 16,810
Financial income 371 775 93 510
result from the market value adjustment of derivative financial instruments
– 456
25,884
– 456
49,853
Financial expenses – 56,255 – 62,261 – 28,346 – 31,505
earnings before taxes 4,140 12,270 3,453 35,668
income tax – 6,533 – 11,486 – 3,621 – 12,075
result from continuing divisions – 2,392 784 – 169 – 23,593
result from discontinued divisions 0 – 329 0 – 472
result for the period – 2,392 455 – 169 23,121
of these allocated to:
shareholders of parent company – 2,392 455 – 169 23,121
Minority interest 0 0 0 0
Total – 2,392 455 – 169 23,121
earnings per share
basic – 0.09 0.02 – 0.01 0.88
diluted – 0.09 0.04 – 0.01 0.87
* The result from sales has until now been designated as result from the privatisation business.** Compared with the unaudited group interim financial statements of Deutsche Wohnen Ag as of June 30, 2008, the result from the fair value adjustment
of the investment properties is reported in the unaudited shortened group interim financial statements of Deutsche Wohnen Ag as of June 30, 2009 after the interim result and no longer in the total income. in the unaudited group interim financial statements as of June 30, 2008, the statement of the total income amounts to eur k 162,093 and of the interim result to eur k 48,675.

18
Deutsche Wohnen aG, frankfurt / main Group statement of income and accumulated earnings as of January 1 to June 30, 2009
H1 / 2009
H1 / 2008
Q2 / 2009
Q2 / 2008
k eur k eur k eur k eur
result for the period – 2,392 455 – 169 23,121
unrealised losses from derivative financial instruments (after deduction of deferred taxes)
– 11,393
0
11,307
0
result for the period – 13,785 455 11,138 23,121
of these allocated to:
shareholders of parent company – 13,785 455 11,138 23,121
Minority interests 0 0 0 0
CONSOLIDaTeD fINaNCIaL STaTemeNTS Of DeUTSCHe WOHNeN aGOvERALL RESULT
grouP iNTeriM FiNANCiAL sTATeMeNTs » interim report as of June 30, 2009
19
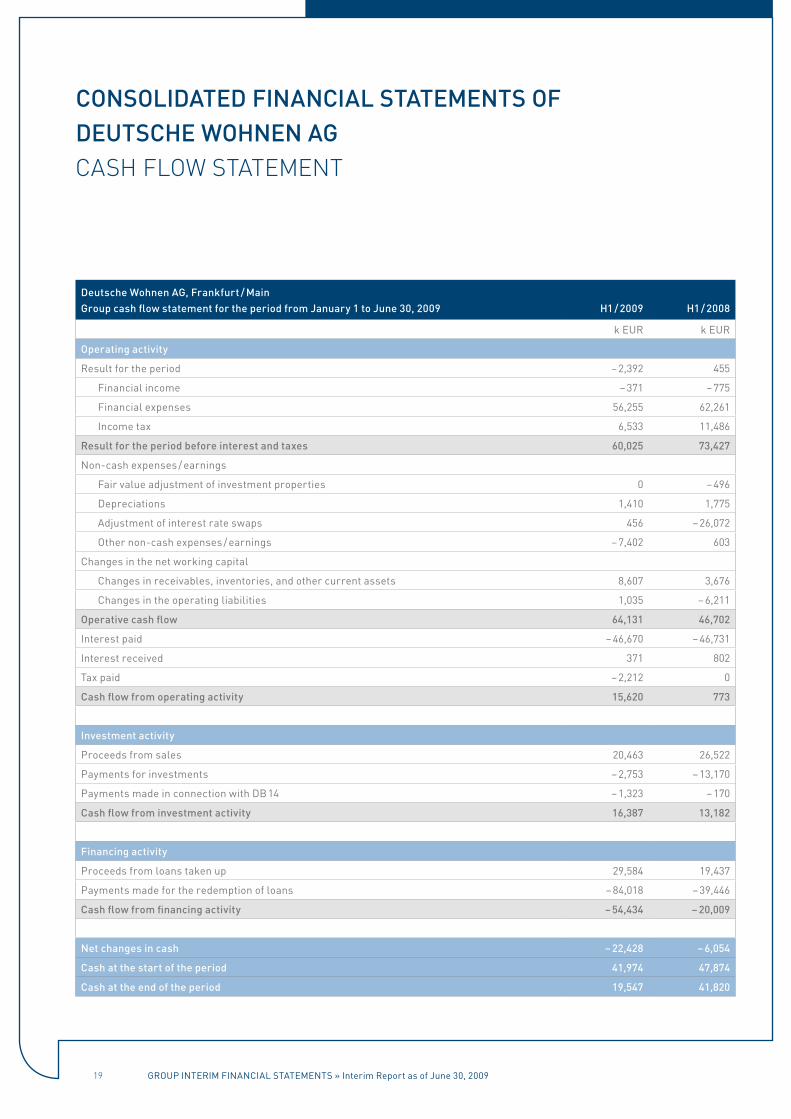
Deutsche Wohnen aG, frankfurt / mainGroup cash flow statement for the period from January 1 to June 30, 2009
H1 / 2009
H1 / 2008
k eur k eur
Operating activity
result for the period – 2,392 455
Financial income – 371 – 775
Financial expenses 56,255 62,261
income tax 6,533 11,486
result for the period before interest and taxes 60,025 73,427
Non-cash expenses / earnings
Fair value adjustment of investment properties 0 – 496
Depreciations 1,410 1,775
Adjustment of interest rate swaps 456 – 26,072
other non-cash expenses / earnings – 7,402 603
Changes in the net working capital
Changes in receivables, inventories, and other current assets 8,607 3,676
Changes in the operating liabilities 1,035 – 6,211
Operative cash flow 64,131 46,702
interest paid – 46,670 – 46,731
interest received 371 802
Tax paid – 2,212 0
Cash flow from operating activity 15,620 773
Investment activity
Proceeds from sales 20,463 26,522
Payments for investments – 2,753 – 13,170
Payments made in connection with DB 14 – 1,323 – 170
Cash flow from investment activity 16,387 13,182
financing activity
Proceeds from loans taken up 29,584 19,437
Payments made for the redemption of loans – 84,018 – 39,446
Cash flow from financing activity – 54,434 – 20,009
Net changes in cash – 22,428 – 6,054
Cash at the start of the period 41,974 47,874
Cash at the end of the period 19,547 41,820
CONSOLIDaTeD fINaNCIaL STaTemeNTS Of DeUTSCHe WOHNeN aGCASH FLOW STATEMENT
grouP iNTeriM FiNANCiAL sTATeMeNTs » interim report as of June 30, 2009
20
CONSOLIDaTeD fINaNCIaL STaTemeNTS Of DeUTSCHe WOHNeN aGSTATEMENT OF CHANGES IN EqUITy
grouP iNTeriM FiNANCiAL sTATeMeNTs » interim report as of June 30, 2009
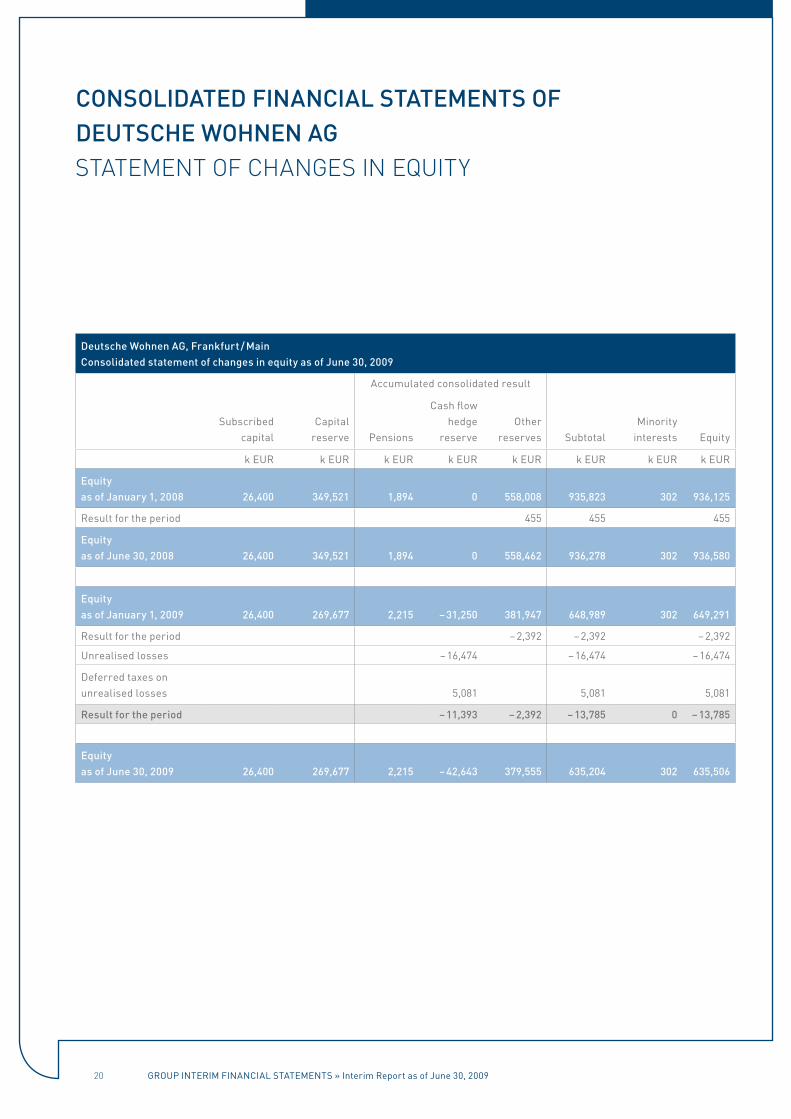
Deutsche Wohnen aG, frankfurt / mainConsolidated statement of changes in equity as of June 30, 2009
Accumulated consolidated result
subscribed
capital
Capital
reserve
Pensions
Cash flow hedge
reserve
other
reserves
subtotal
Minority
interests
equity
k eur k eur k eur k eur k eur k eur k eur k eur
equity as of January 1, 2008
26,400
349,521
1,894
0
558,008
935,823
302
936,125
result for the period 455 455 455
equity as of June 30, 2008
26,400
349,521
1,894
0
558,462
936,278
302
936,580
equity as of January 1, 2009
26,400
269,677
2,215
– 31,250
381,947
648,989
302
649,291
result for the period – 2,392 – 2,392 – 2,392
unrealised losses – 16,474 – 16,474 – 16,474
Deferred taxes on unrealised losses
5,081
5,081
5,081
result for the period – 11,393 – 2,392 – 13,785 0 – 13,785
equity as of June 30, 2009
26,400
269,677
2,215
– 42,643
379,555
635,204
302
635,506
21
I. GeNeraL INfOrmaTION
Deutsche Wohnen AG is the holding of the entire Deutsche Wohnen Group. In the holding, Group-wide issues such as company strategy, portfolio manage-ment, personnel, investor relations / business commu-nication, and planning / control are managed. The opera-tions of the subsidiaries focus on rental business and the sale of the property which is mainly located in Berlin and in the Rhein-Main region. According to their own valuation, Deutsche Wohnen is the second largest listed real estate company in Germany by market capitalisa-tion.
The consolidated financial statements have been pre-pared in EUR. Unless otherwise stated, all figures are rounded to thousand (k EUR) or million (EUR m). Slight mathematical rounding differences may be reflected in the tables and references.
II. fUNDameNTaLS aND meTHODS Of THe CONSOLIDaTeD aNNUaL fINaNCIaL STaTemeNTS
The shortened Group interim financial statements for the period from January 1 to June 30, 2009 were prepared in accordance with IAS 34 Interim Reporting, as it is to be applied in the EU. The Group interim financial state-ments were released for publication on August 27, 2009.
These interim financial statements do not contain all information and statements required for consolidated annual financial statements and are therefore to be read together with the consolidated annual financial state-ments as of December 31, 2008.
The consolidated financial statements have generally been prepared using the historical cost approach, with the exception of in particular investment properties and derivatives, which are valued at fair value.
The consolidated financial statements comprise the financial statements of Deutsche Wohnen AG and its subsidiaries as of June 30, 2009. The annual financial statements of the subsidiaries are prepared using standard accounting policies as of the same balance sheet date as the annual financial statements of the parent company.
In the preparation of the consolidated financial state-ments, discretionary judgements, estimates, and as-sumptions are made by the management which have an impact on the level of income, expenses, assets, and liabilities reported on the balance sheet date and the reporting of contingent liabilities. Due to the uncertainty associated with these assumptions and estimates, results might emerge which in future would lead to considerable adjustments being made to the book value of the assets or liabilities concerned.
The business activity of the Deutsche Wohnen Group is essentially free of seasonal or economic influences.
III. CHaNGeS IN THe CONSOLIDaTeD COmpaNIeS
There were no chances in the consolidated companies.
IV. CHaNGeS IN aCCOUNTING pOLICIeS
Deutsche Wohnen basically applied the same accounting policies as in the previous year.
In the first quarter of 2009, the new standards and interpretations to be applied that are mandatory for financial years beginning after January 1, 2009 were applied completely. The application of the standards led to adjustments of the elements of the Group’s interim financial statements (especially of the consolidated balance sheet, the Group profit and loss statement, and the Group’s statement of income and accumulated earnings). The previous year’s comparison values were adjusted accordingly. In the context of the initial applica-tion of the regulations of IFRS 8 regarding segment reporting, no changes of the business segments report-ed by the Deutsche Wohnen Group resulted. In the segment reporting, the housing privatisation segment was renamed sales. Furthermore, the definition of the segment result and the segment revenue in the sale segment were adjusted.
In April 2009, IASB published a further collection of standards regarding the changes of different IFRS. The collection of standards has the primary goal of elimi-nating inconsistencies and of clarifying formulations. Separate transition regulations exist for every standard. The Deutsche Wohnen Group expects no essential changes due to the initial application.
grouP iNTeriM FiNANCiAL sTATeMeNTs » interim report as of June 30, 2009

22
V. SeLeCTeD NOTeS ON THe CONSOLIDaTeD BaLaNCe SHeeT
The assets of the Deutsche Wohnen Group consists to 93 % of the investment properties. The reduction com-pared to December 31, 2008 is essentially due to sales. To ensure the plausibility of the real estate valuation (determination of the current market value) undertaken by the Deutsche Wohnen Group, an external expert was commissioned with the independent valuation of the property portfolio. In the context of his calculations, the external expert determined a valuation for the real estate assets of the Deutsche Wohnen Group which deviated from the internally determined property value by altogether approx. 0.02 %. The amount of the deviation per single property amounted to a valuation corridor of +/– 10 % of the internally determined property value. Altogether the valuation for the property amounted according to internal valuation to EUR 2,880.3 million and according to external valuation to EUR 2,879.6 million. Based on the valuation of single property clusters, approximately identical valuations between internal and external valuations result.
The tangible assets consist essentially of technical facilities and operational and office equipment.
The derivative financial instruments are interest rate swaps reported in the balance sheet at current market value that were finalised not for speculation purposes, but exclusively in order to minimize the risks of interest rate changes and thus cash flow risks of variable rate loans. Due to the further interest rate cuts, the negative market value increased from EUR 49.3 million to EUR 66.3 million as of the end of the year. Deutsche Wohnen fulfilled the requirements of the Hedge Accounting regulations of IAS 39 for the first time in the course of the financial year 2008 for the balancing of the hedgings for securing the cash flow from the variably interest-bearing loans. Accordingly the current market values of the interest rate swaps in the Group interim financial statements as of June 30, 2009 were reported in part as noncurrent liabilities and in part as current liabilities under the item “Derivative financial instruments”. On the other hand, the interest rate swaps as of June 30, 2008 are reported exclusively as current
liabilities, since at this time the requirements for Hedge Accounting had not yet been fulfilled. The changed statement does not represent a change of the accounting policies, but rather results on basis of the now existing documentation of hedging correlations between under-lying transactions (variably interest-bearing loans) and hedging (interest rate swaps). In addition to the balance sheet change, a change occurred in the handling of the market value adjustment of the interest rate swaps. As far as the hedging correlation is effective, the market value adjustments are reported in the equity and not recognised in the Group’s profit and loss statement. In the Group interim financial statements as of June 30, 2009, losses amounting to EUR 16.5 million (before taking deferred taxes into account) in the equity and EUR 0.5 million in the Group profit and loss statement from the market value adjustment for the six month period ending on June 30, 2009 were reported, while in the six month period ending on June 30, 2008, earnings from the market value adjustment of derivative financial instruments was reported in the Groups profit and loss statement.
The development of the equity can be seen in the state-ment of changes in shareholders’ equity on page 20.
The financial liabilities decreased in comparison with December 31, 2008 essentially due to redemptions. In the first six months, total loans in the amount of EUR 84 million were repaid. This was offset by new loan extensions in the amount of EUR 29.6 million. The in-crease of the current financial liabilities is due, among other things, to the unscheduled repayment in connec-tion with the planned increase in capital. These pay-ments are under the condition that the increase in capital will take place and depend additionally on actu-ally realized issue proceeds.
The share of debt capital of the convertible bond issued as part of the purchase price of the GEHAG Group is reported in the balance sheet item Convertible bond. The change is due to the accrued interest for the first six months.
The accrued taxes essentially take into account the payment obligation for EK 02.
grouP iNTeriM FiNANCiAL sTATeMeNTs » interim report as of June 30, 2009
23
VI. SeLeCTeD NOTeS ON THe GrOUp prOfIT aND LOSS STaTemeNT
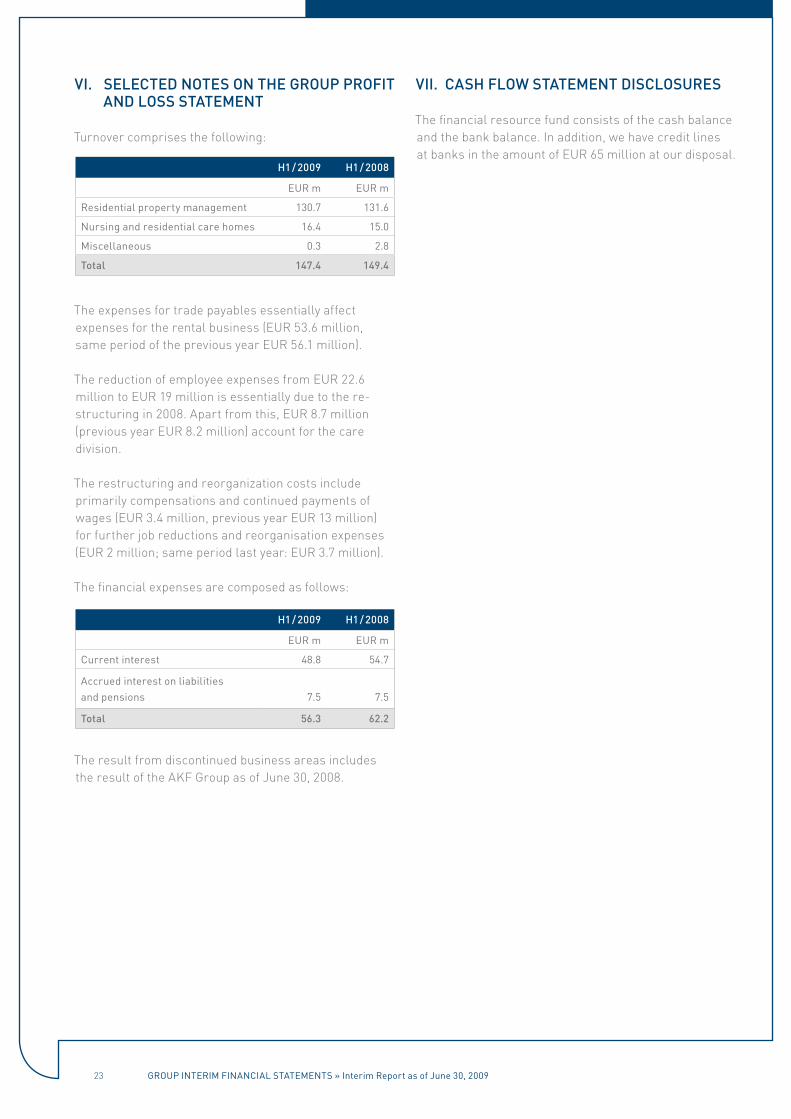
Turnover comprises the following:
H1 / 2009 H1 / 2008
eur m eur m
residential property management 130.7 131.6
Nursing and residential care homes 16.4 15.0
Miscellaneous 0.3 2.8
Total 147.4 149.4
The expenses for trade payables essentially affect expenses for the rental business (EUR 53.6 million, same period of the previous year EUR 56.1 million).
The reduction of employee expenses from EUR 22.6 million to EUR 19 million is essentially due to the re-structuring in 2008. Apart from this, EUR 8.7 million (previous year EUR 8.2 million) account for the care division.
The restructuring and reorganization costs include primarily compensations and continued payments of wages (EUR 3.4 million, previous year EUR 13 million) for further job reductions and reorganisation expenses (EUR 2 million; same period last year: EUR 3.7 million).
The financial expenses are composed as follows:
H1 / 2009 H1 / 2008
eur m eur m
Current interest 48.8 54.7
Accrued interest on liabilities and pensions
7.5
7.5
Total 56.3 62.2
The result from discontinued business areas includes the result of the AKF Group as of June 30, 2008.
VII. CaSH fLOW STaTemeNT DISCLOSUreS
The financial resource fund consists of the cash balance and the bank balance. In addition, we have credit lines at banks in the amount of EUR 65 million at our disposal.
grouP iNTeriM FiNANCiAL sTATeMeNTs » interim report as of June 30, 2009
24
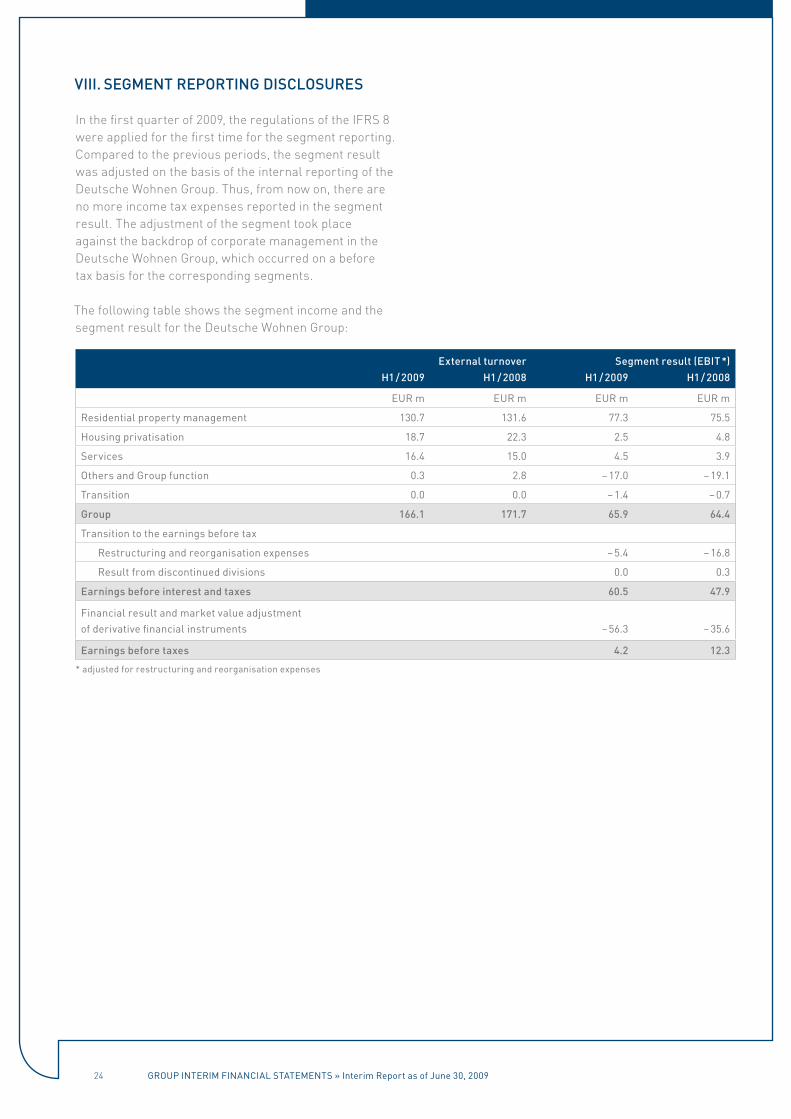
VIII. SeGmeNT repOrTING DISCLOSUreS
In the first quarter of 2009, the regulations of the IFRS 8 were applied for the first time for the segment reporting. Compared to the previous periods, the segment result was adjusted on the basis of the internal reporting of the Deutsche Wohnen Group. Thus, from now on, there are no more income tax expenses reported in the segment result. The adjustment of the segment took place against the backdrop of corporate management in the Deutsche Wohnen Group, which occurred on a before tax basis for the corresponding segments.
The following table shows the segment income and the segment result for the Deutsche Wohnen Group:
external turnover Segment result (eBIT *)
H1 / 2009 H1 / 2008 H1 / 2009 H1 / 2008
eur m eur m eur m eur m
residential property management 130.7 131.6 77.3 75.5
Housing privatisation 18.7 22.3 2.5 4.8
services 16.4 15.0 4.5 3.9
others and group function 0.3 2.8 – 17.0 – 19.1
Transition 0.0 0.0 – 1.4 – 0.7
Group 166.1 171.7 65.9 64.4
Transition to the earnings before tax
restructuring and reorganisation expenses – 5.4 – 16.8
result from discontinued divisions 0.0 0.3
earnings before interest and taxes 60.5 47.9
Financial result and market value adjustment of derivative financial instruments
– 56.3
– 35.6
earnings before taxes 4.2 12.3
* adjusted for restructuring and reorganisation expenses
grouP iNTeriM FiNANCiAL sTATeMeNTs » interim report as of June 30, 2009

25
IX. OTHer DISCLOSUreS
related companies and individualsNo changes occurred in the related companies / individuals in comparison with the information as of December 31, 2008.
management and Supervisory BoardNo changes occurred in the management and super-visory board compared to the information as of December 31, 2008.
events after the balance sheet dateIt was concluded on the extraordinary general meeting on August 7, 2009 to raise the share capital by up to EUR 250 million against cash contributions by issuing of new shares.
risk reportIn terms of the risks of the future business development, we refer to the statements made in the risk report of the consolidated annual financial statements as of December 31, 2008. Due to the current financial crisis, we would like to especially point out the following: The risks resulting from the refinancing of loans are at present largely limited in the Deutsche Wohnen Group due to a by far predominant share in noncurrent loans. In the next three years, our refinancing volume only amounts to EUR 150 million. Nevertheless, due to the more restrictive lending practice as a consequence of the financial crisis, future problems when taking out and extending loans can not be ruled out.
The value of our real estate assets was assessed and confirmed as of June 30, 2009 by means of an independ-ent expert.
Frankfurt / Main, August 2009
grouP iNTeriM FiNANCiAL sTATeMeNTs » interim report as of June 30, 2009
Helmut ullrich (Chief Financial officer)Michael Zahn (Chairman of the Management Board)
The management Board
26
aSSUraNCe Of THe LeGaL repreSeNTaTIVeS
“We assure to the best of our knowledge that in accord-ance with the applicable financial accounting principles the Group interim financial statements as of June 30, 2009 convey a view of the asset, financial, and revenue posi-tion of the company which corresponds to the actual circumstances, and that in the interim report the busi-ness performance including the financial result and the position of the Group is portrayed in such a manner that the significant opportunities and risks of the company’s likely development are depicted.”
Frankfurt / Main, August 2009
Deutsche Wohnen AG
Michael Zahn Helmut UllrichChairman of the Chief Financial OfficerManagement Board
grouP iNTeriM FiNANCiAL sTATeMeNTs » interim report as of June 30, 2009
27
maNaGemeNT BOarD
Version august 2009
michael ZahnChairman of the Management Board, Berlin
Helmut UllrichChief Financial Officer, Berlin
SUperVISOry BOarD
Version august 2009
Hermann T. DambachChairman, Bad Homburg
Dr. andreas Kretschmervice Chairman, Düsseldorf
Jens BernhardtOberursel
Uwe e. flachFrankfurt / Main
matthias HünleinOberursel
Dr. florian StetterErding
reGISTereD OffICe
Deutsche Wohnen aG
registered office Pfaffenwiese 30065929 Frankfurt / Main
Phone +49 (0)69 976 970 0Fax +49 (0)69 976 970 4930
Berlin OfficeMecklenburgische Straße 5714197 Berlin
Phone +49 (0)030 897 86 0Fax +49 (0)030 897 86 509
ImprINT
publisherDeutsche Wohnen AG
DesignWE DO communication GmbH GWA
picture creditsGeorgios AnastasiadesFelix KrumbholzAlex Otto / bemovedDawin Meckel / OSTKREUZDeutsche Wohnen AG
iMPriNT » interim report as of June 30, 2009
The German version of this report is legally binding. The Company cannot be held responsible for any misunderstandings or misinterpretation arising from this translation.
Recommended