INSPECTING A RESEARCH REACTOR’S CONTROL ROD SURFACE FOR PITTING USING A MACHINE VISION APPROACH
Akira Tokuhiro*Shreekanth Vadakattu**
*work done as Director & SRO,University of Missouri-Rolla Reactor facility; currently at Kansas State University
** MS Thesis, January 2005

UMRR Characteristics
Coolant out
Fuel plates
Coolant In
TOP
TIP
Magnetic disc couples to rod drive
Control Rod slot
27”/
68.6cm
2.25”/5.72cm
Operational since 1961; 1st nuclear reactor in Missouri Originally licensed at 10W; presently 200kW Switch from HEU to LEU in 1992; MTR (Material Test Reactor) plate type fuel Natural convection-cooled, pool-type reactor; non-pulse; φαvg,th ~ 1012 ns/cm2s One beam port φavg,th ~ 106 ns/cm2s, graphite thermal column, 2-pneumatic sample ports; core access & isotope production elements; sample rotator, various sample tubesMainly for training and reactor laboratory classes Re-licensing application filed in 2004 for 20-year extension
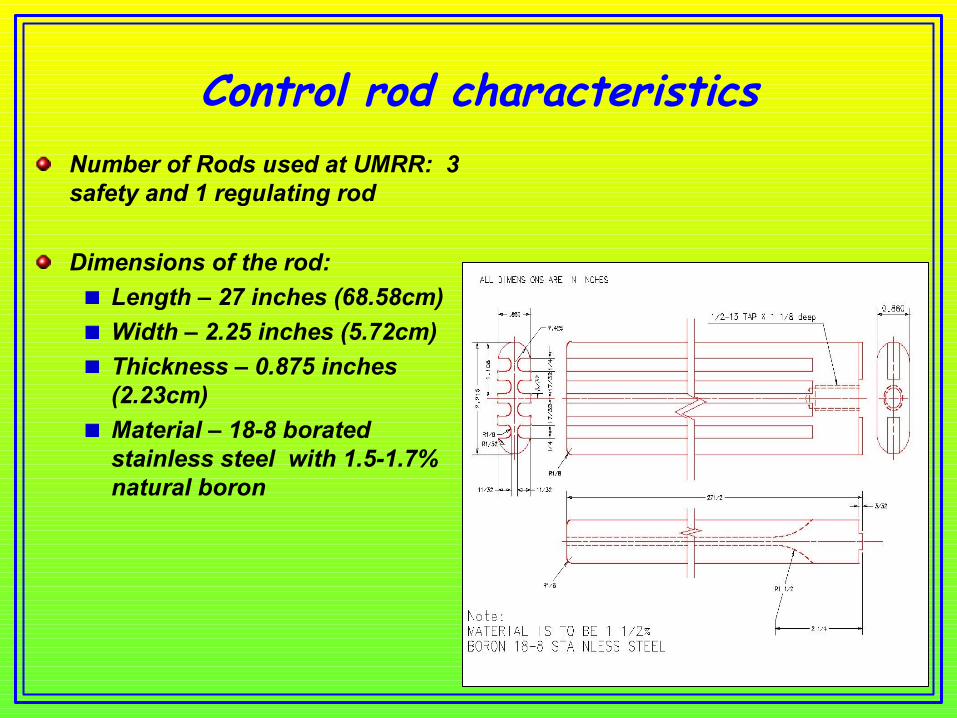
Control rod characteristicsNumber of Rods used at UMRR: 3 safety and 1 regulating rod
Dimensions of the rod:Length – 27 inches (68.58cm)Width – 2.25 inches (5.72cm)Thickness – 0.875 inches (2.23cm)Material – 18-8 borated stainless steel with 1.5-1.7% natural boron

Introduction
Traditional Inspection processPhysical inspection using gauges performed by UMRR staffSubjective in nature; potential source of errorPersonnel radiation exposure during inspection.

5
Introduction
Automation of inspection processAutomation piecewise using state-of-the-art technologies.Minimizes personnel exposure during inspection; mandated under NRC license (ALARA)Potentially provides smaller errorProvides archival quantitative results.

Control Rod Inspection Process at UMRR

Why to perform inspection of control rod?
According to the UMR Technical Specification 4.2.1(5) shim/safety rods shall be visually inspected annually for bowing, pitting and cracking to ensure whether they are capable of performing their function.Inspection for Bowing:
Bow on the control rod surface is mainly due to the ductile behavior, high temperature and high energy neutron bombardment and secondarily, temperature gradient.Bowing is measured to ensure geometric accuracy or shape deviation (bow) of control rod surface and make sure it does not frictionally contact with the control rod channel when driven in or out of the fuel element.
Inspection for Pitting:Pitting on the control rod surface may be due to bombardment of high energy neutrons and corrosion caused by impurities in coolant (Coolants is doubly de-ionized water).Resistivity of the coolant water observed is 0.806 MΩ-cm.Pitting is measured to check for physical degradation on the control rods.
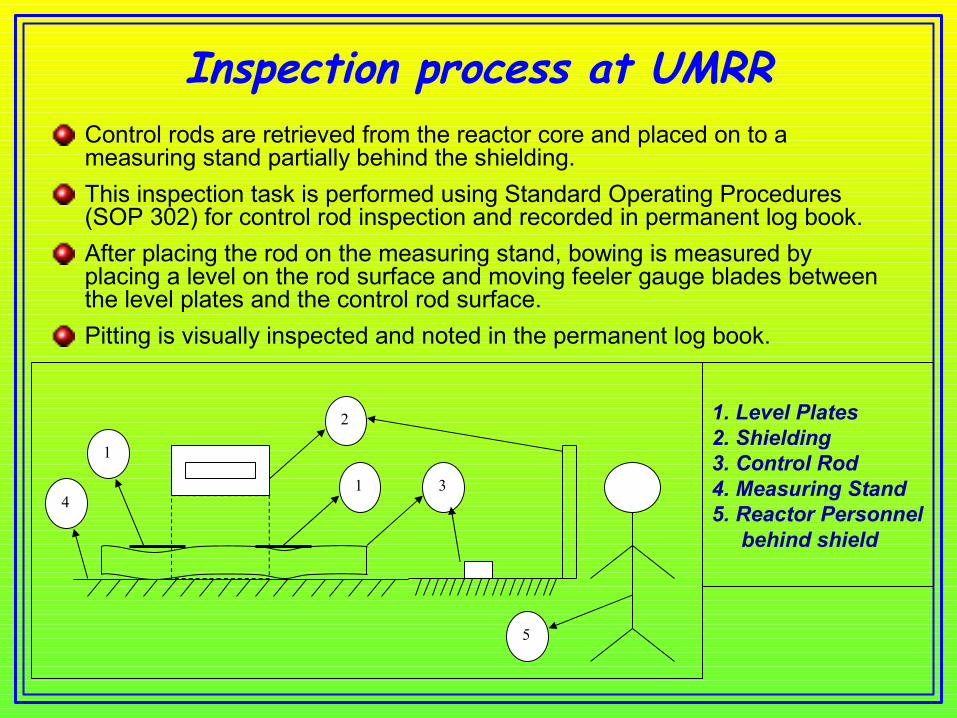
Inspection process at UMRRControl rods are retrieved from the reactor core and placed on to a measuring stand partially behind the shielding. This inspection task is performed using Standard Operating Procedures (SOP 302) for control rod inspection and recorded in permanent log book. After placing the rod on the measuring stand, bowing is measured by placing a level on the rod surface and moving feeler gauge blades between the level plates and the control rod surface.Pitting is visually inspected and noted in the permanent log book.
1. Level Plates2. Shielding3. Control Rod 4. Measuring Stand 5. Reactor Personnel behind shield
1
2
1 34
5
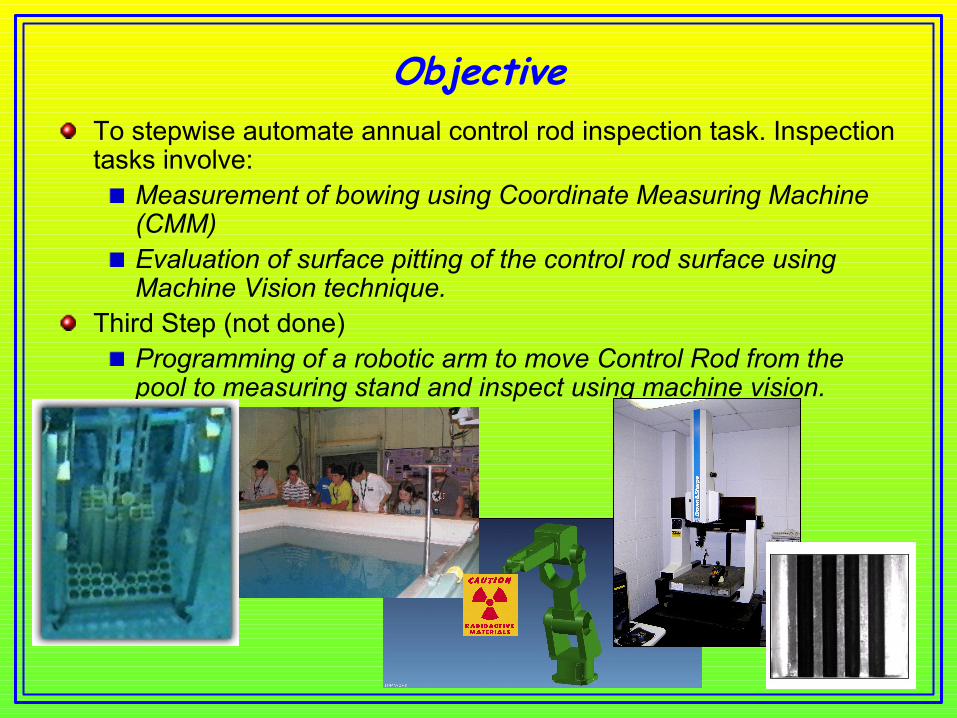
ObjectiveTo stepwise automate annual control rod inspection task. Inspection tasks involve:
Measurement of bowing using Coordinate Measuring Machine (CMM)Evaluation of surface pitting of the control rod surface using Machine Vision technique.
Third Step (not done)Programming of a robotic arm to move Control Rod from the pool to measuring stand and inspect using machine vision.

Bowing Inspection using CMM
Coordinate measuring machines (CMM) are mechanical systems designed to move a measuring probe to determine coordinates of points on a work piece surface.
CMM Specs:Manufacturer: Brown & SharpeSeries: Micro Val pfxMeasuring Range: 458x510x406 mm (18x20x16 inches)
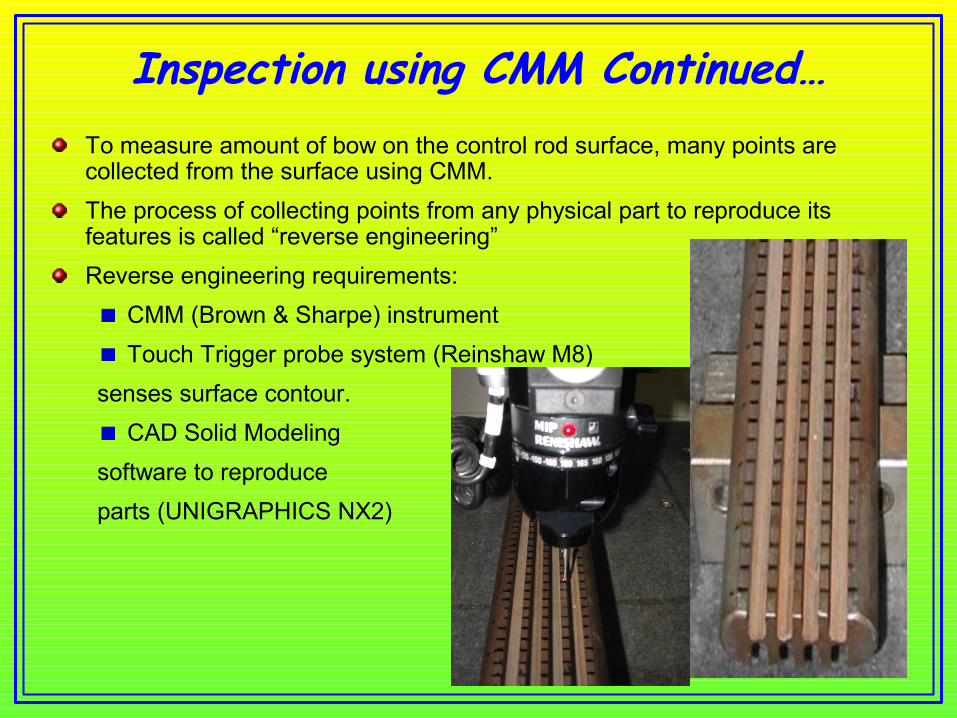
Inspection using CMM Continued…To measure amount of bow on the control rod surface, many points are collected from the surface using CMM. The process of collecting points from any physical part to reproduce its features is called “reverse engineering” Reverse engineering requirements:
CMM (Brown & Sharpe) instrumentTouch Trigger probe system (Reinshaw M8)
senses surface contour.CAD Solid Modeling
software to reproduce parts (UNIGRAPHICS NX2)

Inspection using CMM Contd…
600 points were digitized which represents 15 inches of control rod in length.Points collected from the DMIS program are retrieved using CAD UNIGRAPHICS software.Surface is generated using “Free form feature”Slope analysis is performed on the surface to determine bow on the control rod surface.

Results
Slope of the surface with respect to XC-Axis in degrees
Discussion
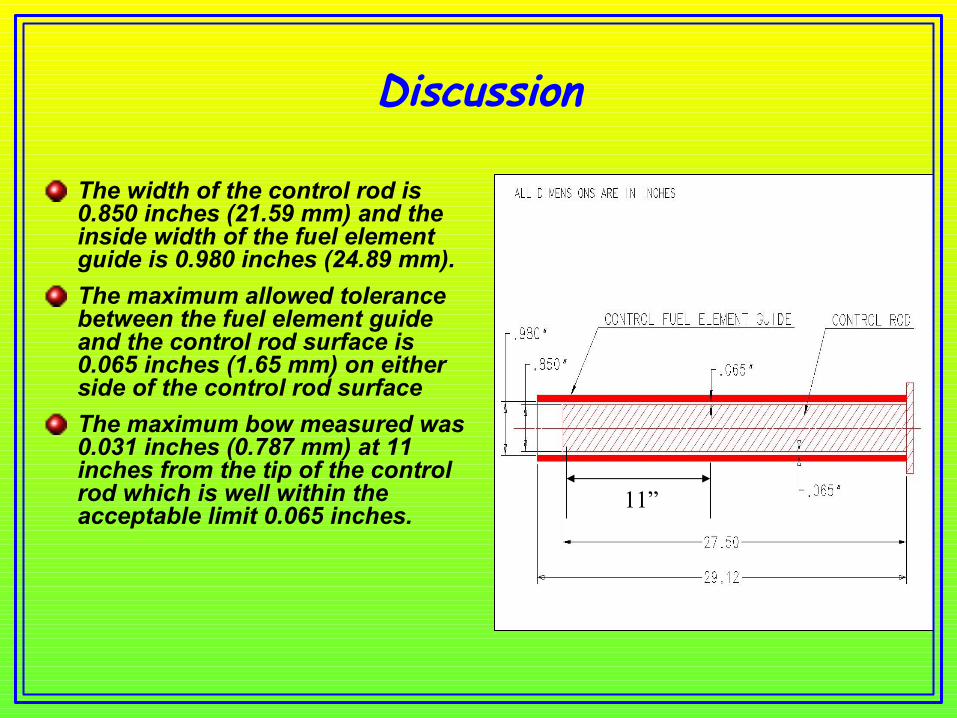
The width of the control rod is 0.850 inches (21.59 mm) and the inside width of the fuel element guide is 0.980 inches (24.89 mm). The maximum allowed tolerance between the fuel element guide and the control rod surface is 0.065 inches (1.65 mm) on either side of the control rod surface The maximum bow measured was 0.031 inches (0.787 mm) at 11 inches from the tip of the control rod which is well within the acceptable limit 0.065 inches. 11”

Pitting Inspection on Control Rod Surface Using Machine Vision
Pitting inspection using Machine Vision
Since in-service control rod surface images were not available to estimate number of pits, applicability of machine vision technique was performed by simulating pits on steel coupons
Pits are produced on steel coupon by immersing coupons in oxygen saturated de-ionized water at 30o, 50o and 70oC; de-ionized water is from reactor pool
ASTM G-31 and G-46 standards for immersion corrosion testing, examination and evaluation of pitting corrosion respectively is followed

Experiment Parameters
Steel Coupon: SAE 1018 low carbon steelCoupon size: 25 X 25 mm ±1mm.Test solution: De-ionized waterTest temperatures: 30o, 50o and 70oC (86o, 122o and 158oF)Aeration: Oxygen bubbled using sparger at a flow rate of 20 ml/min.Test duration: 24hrs for 30oC, 12hrs for 50oC, 8hrs for 70oC.Test cycles: 10 for each temperatureNumber of samples: 6 samples for each temperature rangeCleaning Method: Using Nylon brush.
Bristle Diameter = 0.4 mmNumber of Bristle=3320 approximately

Image AcquisitionTo study the pitting corrosion, images of the coupons are captured after each test cycle.To capture and analyze optical properties from the images, we setup the following system.
Optical UnitCamera lens (NIKON 50 mm lens)Light bulb (75 watts)Mini Environmental Quality meter-850070(Light meter)
Image sensing unitCCD camera (768 X 494) (Sony SR75 Model)
PCI Imaging Board for Camera Link from EPIX Inc technologiesXCAP-Standard software from EPIX Inc technologiesPC

Experimental Setup
Experimental setup
Image Processing Steps
Capture images using machine vision setup
Perform Image Analysis Using MATLAB
Blob Analysis Using XCAP-Std software
Blob Analysis Parameters
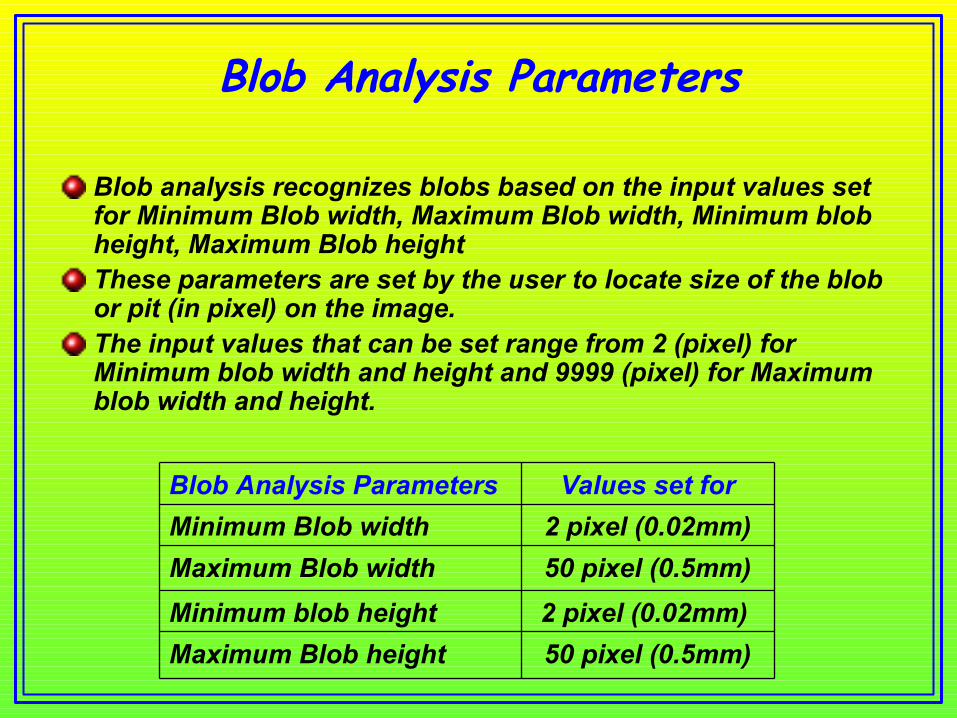
Blob analysis recognizes blobs based on the input values set for Minimum Blob width, Maximum Blob width, Minimum blob height, Maximum Blob height These parameters are set by the user to locate size of the blob or pit (in pixel) on the image. The input values that can be set range from 2 (pixel) for Minimum blob width and height and 9999 (pixel) for Maximum blob width and height.
50 pixel (0.5mm)Maximum Blob height2 pixel (0.02mm) Minimum blob height50 pixel (0.5mm)Maximum Blob width2 pixel (0.02mm)Minimum Blob width
Values set forBlob Analysis Parameters
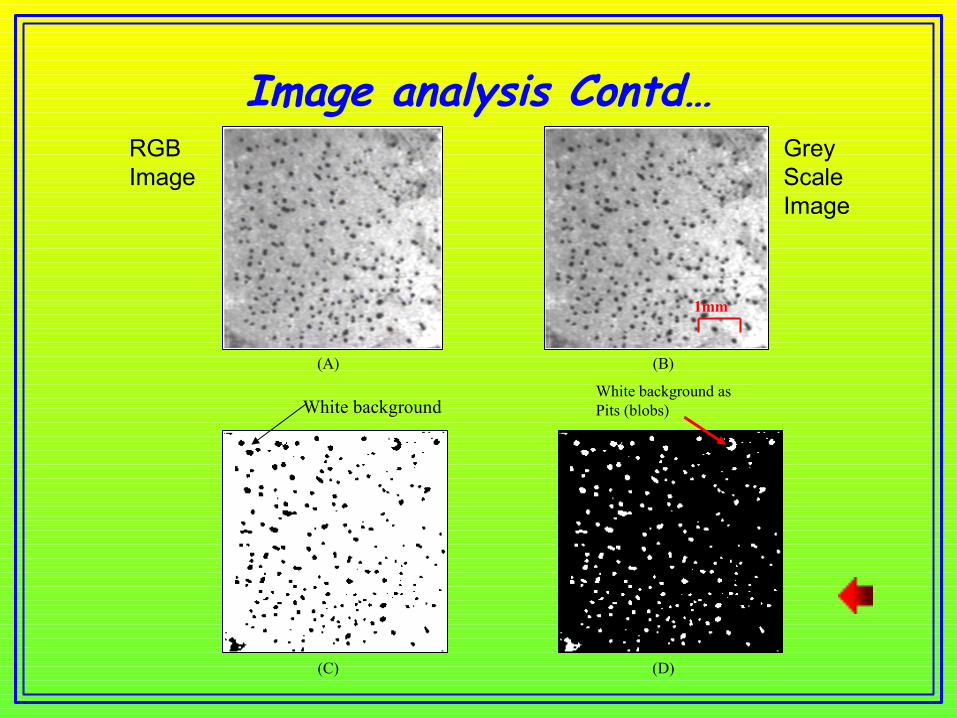
Image analysis Contd…
(A) (B)
(C) (D)
White backgroundWhite background as Pits (blobs)
1mm
RGB Image
Grey Scale Image
Results
Light intensity versus number of pits
Blob analysis is performed on the captured images after each test cycle to estimate number of pits.
Light intensity versus number of pits helps in selecting the image showing maximum number of pits.
Image with maximum topological information; i.e. maximum number of pits is sought.
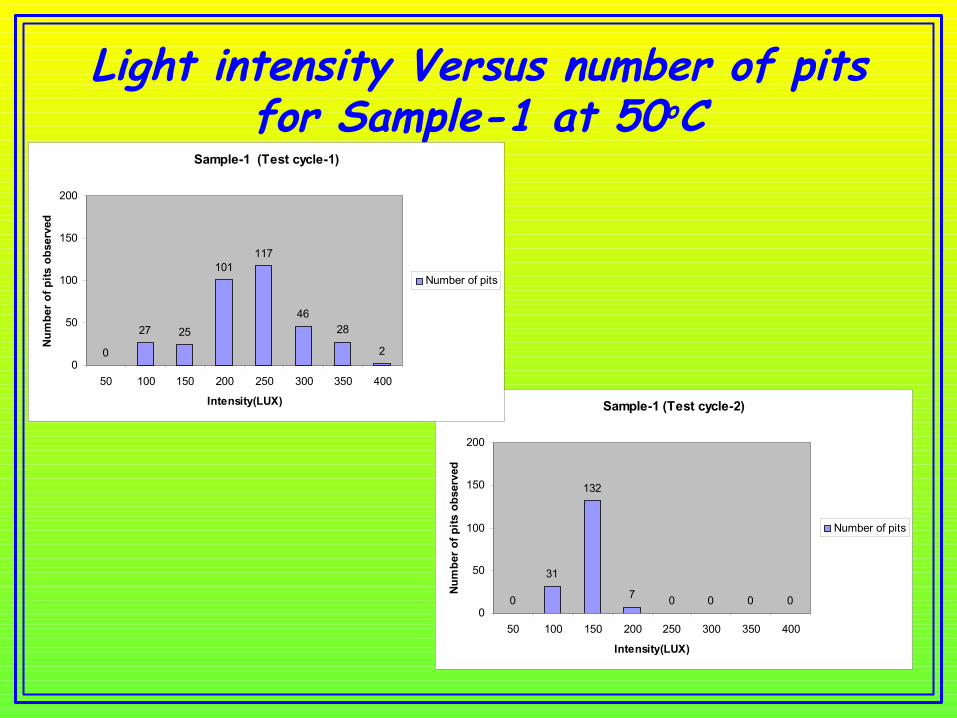
Light intensity Versus number of pits for Sample-1 at 50oC
Sample-1 (Test cycle-2)
0
31
132
7 0 0 0 00
50
100
150
200
50 100 150 200 250 300 350 400
Intensity(LUX)
Num
ber o
f pits
obs
erve
d
Number of pits
Sample-1 (Test cycle-1)
0
27 25
101117
4628
20
50
100
150
200
50 100 150 200 250 300 350 400
Intensity(LUX)
Num
ber o
f pits
obs
erve
d
Number of pits
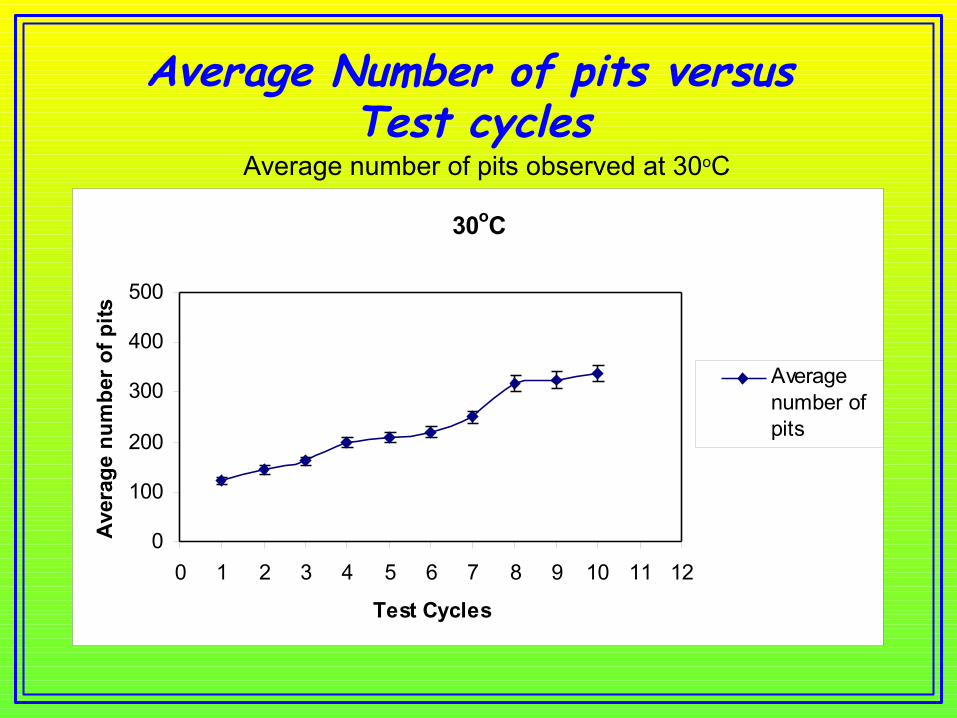
Average Number of pits versus Test cycles
Average number of pits observed at 30oC
30oC
0
100
200
300
400
500
0 1 2 3 4 5 6 7 8 9 10 11 12
Test Cycles
Ave
rage
num
ber
of p
its
Averagenumber ofpits

Average number of pits observed at 30o, 50o and 70oC
0
100
200
300
400
500
600
0 1 2 3 4 5 6 7 8 9 10 11
Test cycles
Ave
rage
num
ber
of p
its o
bser
ved
30 Degrees50 Degrees70 Degrees
0
100
200
300
400
500
600
0 25 50 75 100 125 150
Time (Hours)
Aver
age
num
ber o
f pits
obs
erve
d
30 Degrees50 Degrees70 Degrees
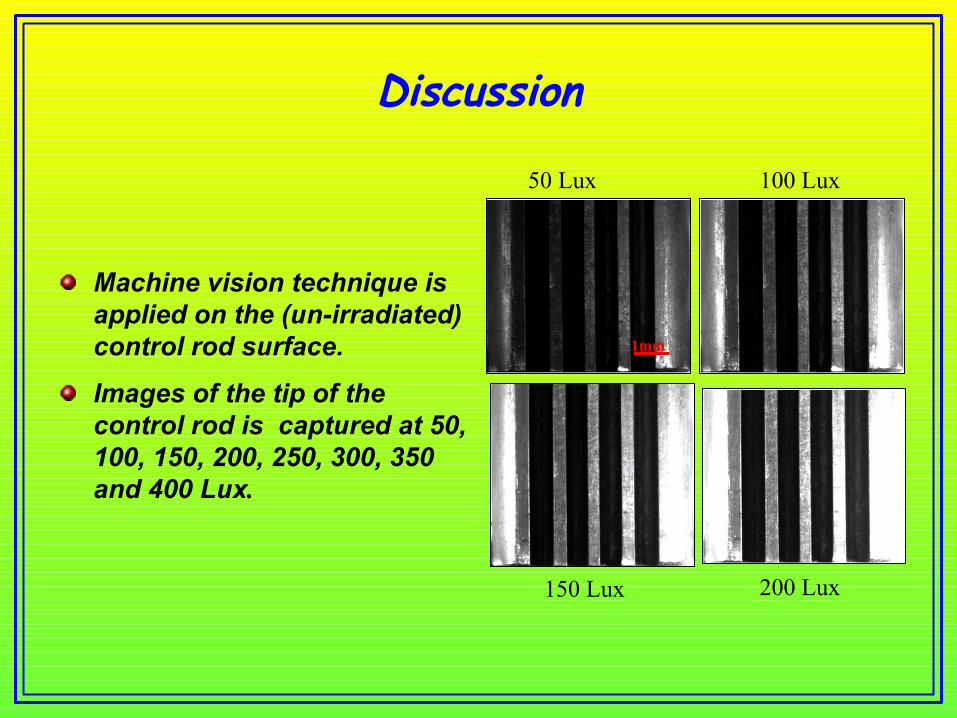
Discussion
Machine vision technique is applied on the (un-irradiated) control rod surface.
Images of the tip of the control rod is captured at 50, 100, 150, 200, 250, 300, 350 and 400 Lux.
1mm
50 Lux 100 Lux
150 Lux 200 Lux
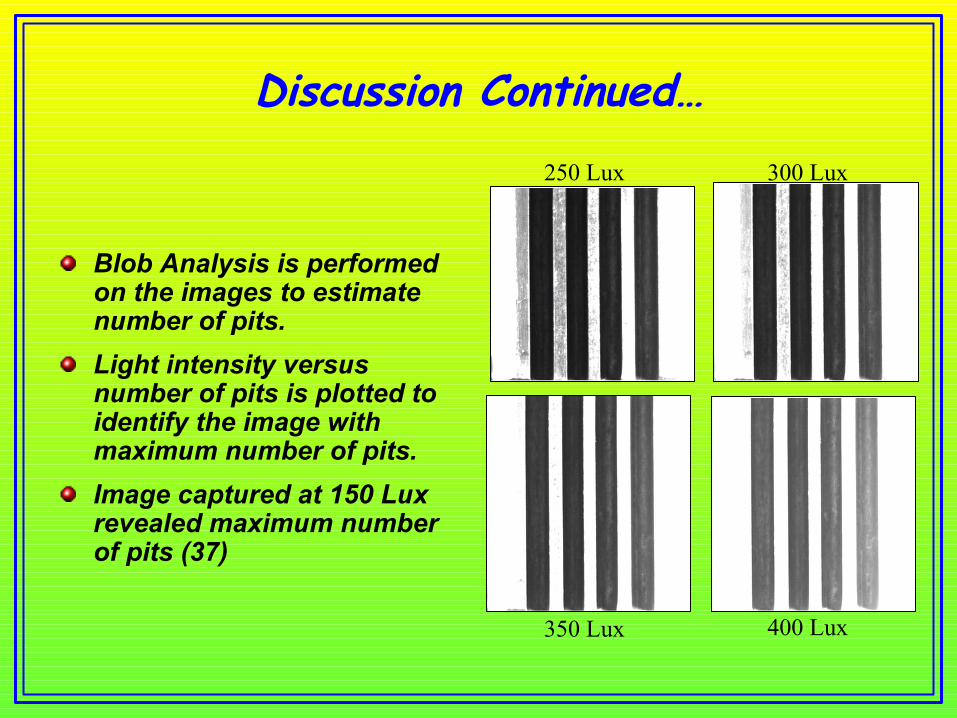
Discussion Continued…
Blob Analysis is performed on the images to estimate number of pits.Light intensity versus number of pits is plotted to identify the image with maximum number of pits.Image captured at 150 Lux revealed maximum number of pits (37)
250 Lux 300 Lux
350 Lux 400 Lux
Conclusions
State-of-the-art technologies such as CMM and machine vision can be used to automate control rod inspection process
Simple reverse-engineered surface generated after annual inspection can be compared from year-to-year; thereby reveal bowing trend of the control rod surface with accumulated in-core service time.
Plotting number of pits versus light intensity is needed to identify the light intensity that gives the maximum number of pits; the maximum and distribution provide useful topographic information.

Conclusions Continued…
Application of both CMM and machine vision can be applied on the actual control rods of the UMR Reactor; thereby all but eliminate subjective evaluation
Application of CMM and machine vision facilitates IT-based data archiving and data comparison
Although not shown here, it is possible to use a late-model, programmable robotic arm to perform the control rod to/from movements from the pool’s surface

32
Contact information
Akira TokuhiroMechanical and Nuclear Engineering
Kansas State UniversityRathbone Hall
Manhattan, Kansas USA 66506-5205E: [email protected]
T: +1-785-532-3429F: +1-785-532-7057

Procedure to capture images
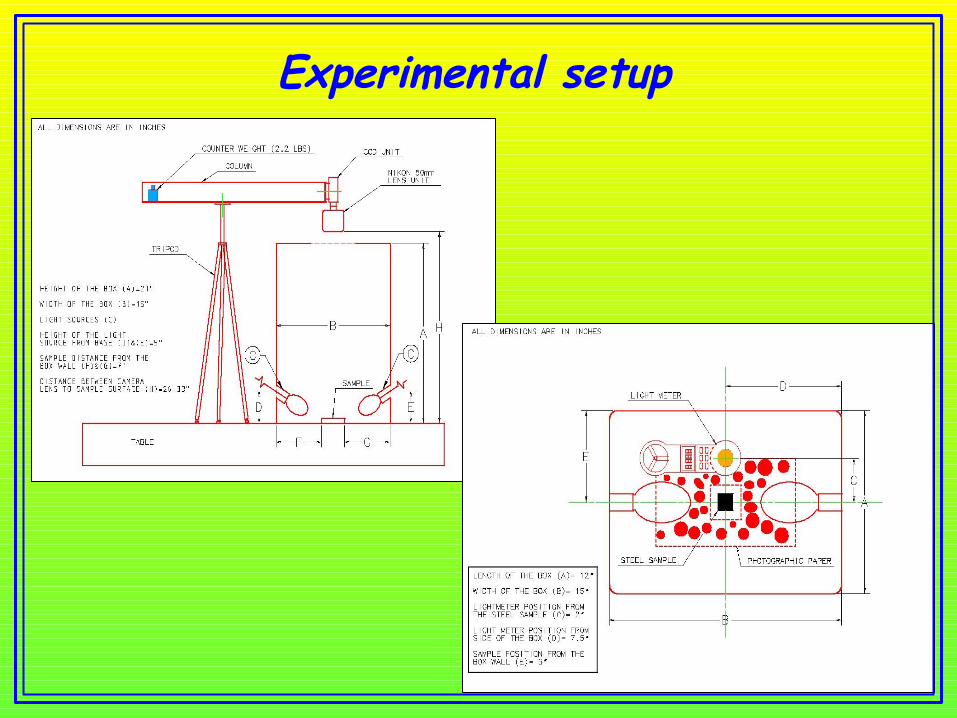
Method for capturing images is based on the optical reflective properties of the surface and principles of light scattering. After each cycle, coupon is placed inside the box on photographic paper to obtain best sharpness on the coupon surface, between two light sources and perpendicular to the lens so that light is reflected from the coupon surface. Images are captured under varied light intensity to reveal the surface topology of the coupon Since it is difficult to identify at which particular light intensity value the surface gives maximum topological information , eight different light intensities 50, 100, 150, 200, 250, 300, 350 and 400 Lux are chosen which is measured using Light meter.Light intensity measured using light meter.

Image Analysis
After capturing images at different intensities of light, XCAP-Std software is used to identify the image that reveal maximum number of pits.XCAP-Std has a Blob Analysis features which recognizes blobs as pits on the images and generates output report containing number of blobs.Blob Analysis feature in XCAP-Std identifies image blobs based on segmenting the image into foreground that is blob and background.Since the image captured is in RGB (Red, Green and Blue), filters available in XCAP-Std are not compatible with this format (RGB) and further blob analysis could not recognize between foreground and background in the image. To overcome this problem, image is converted into binary images (black and white) using MATLAB. By doing this all the black picture elements as foreground are identified as pits and background as white picture elements.
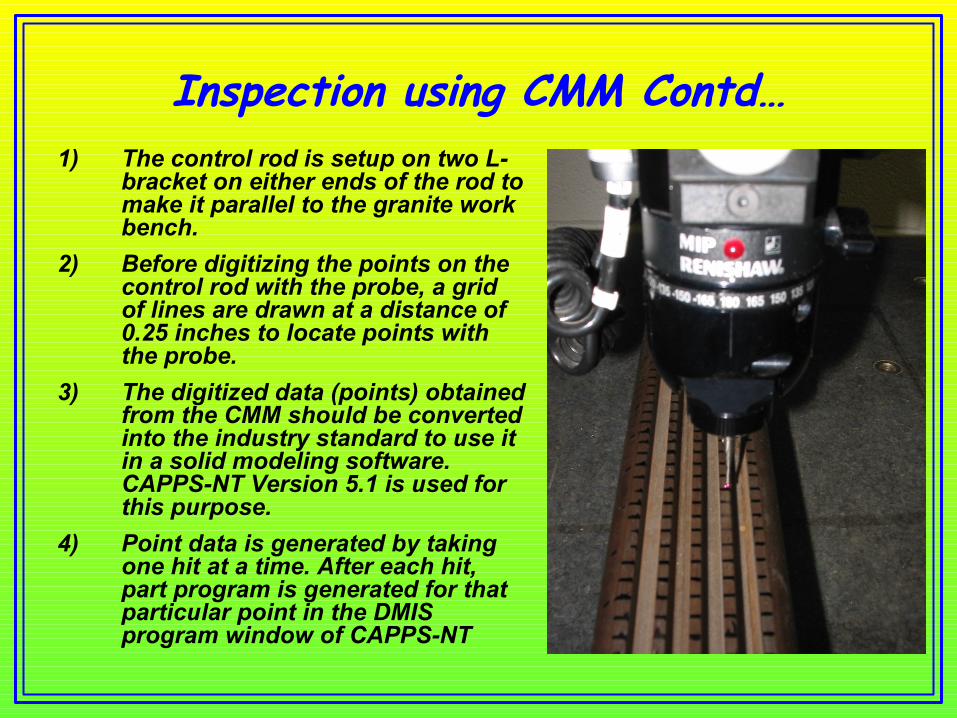
Inspection using CMM Contd…1) The control rod is setup on two L-
bracket on either ends of the rod to make it parallel to the granite work bench.
2) Before digitizing the points on the control rod with the probe, a grid of lines are drawn at a distance of 0.25 inches to locate points with the probe.
3) The digitized data (points) obtained from the CMM should be converted into the industry standard to use it in a solid modeling software. CAPPS-NT Version 5.1 is used for this purpose.
4) Point data is generated by taking one hit at a time. After each hit, part program is generated for that particular point in the DMIS program window of CAPPS-NT
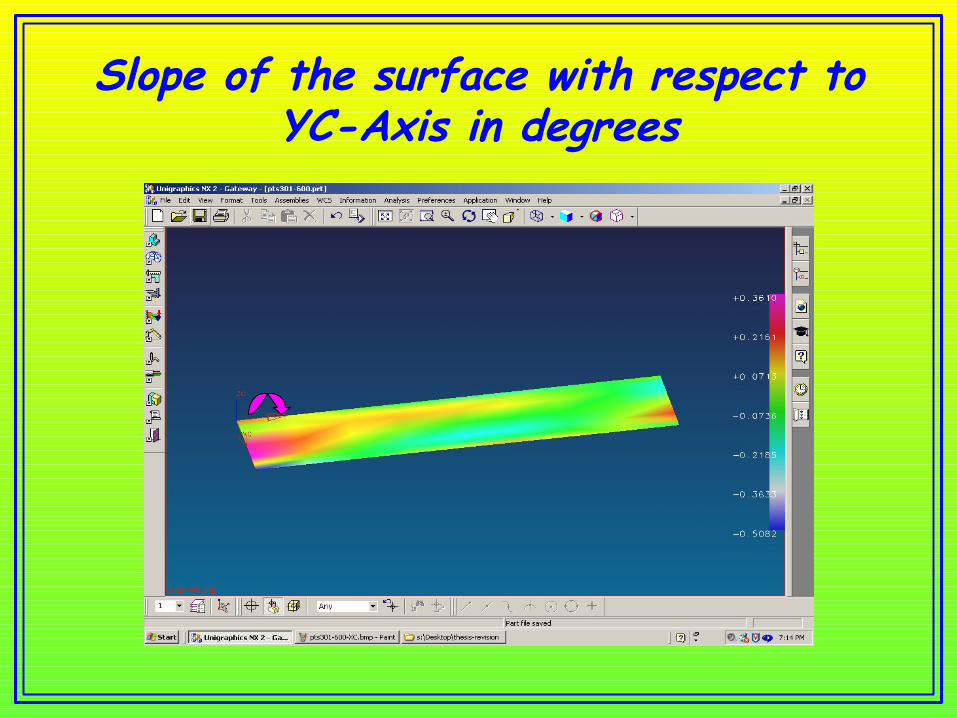
Slope of the surface with respect to YC-Axis in degrees

Slope of the surface with respect to ZC-Axis in degrees

38
Past Investigations
Electrochemical noise experiment to establish relationship between Electrochemical noise, pit depth and pit density.
Immersion of 430, 304L,316L and alloy 278 in 3.5 wt % NaCl aqueous solution made of 34 gm NaCl and 920 ml distilled water according to ASTM G61-86
Bogaert-Alvarez R J
To study topography of corroded areas using SEM and grey scale images
Immersion test of AISI 316L stainless steel in 3% NaCl aqueous solution at pH 2.5 and 5.0
Kong D Y
PurposePitting Corrosion experiment method
Authors
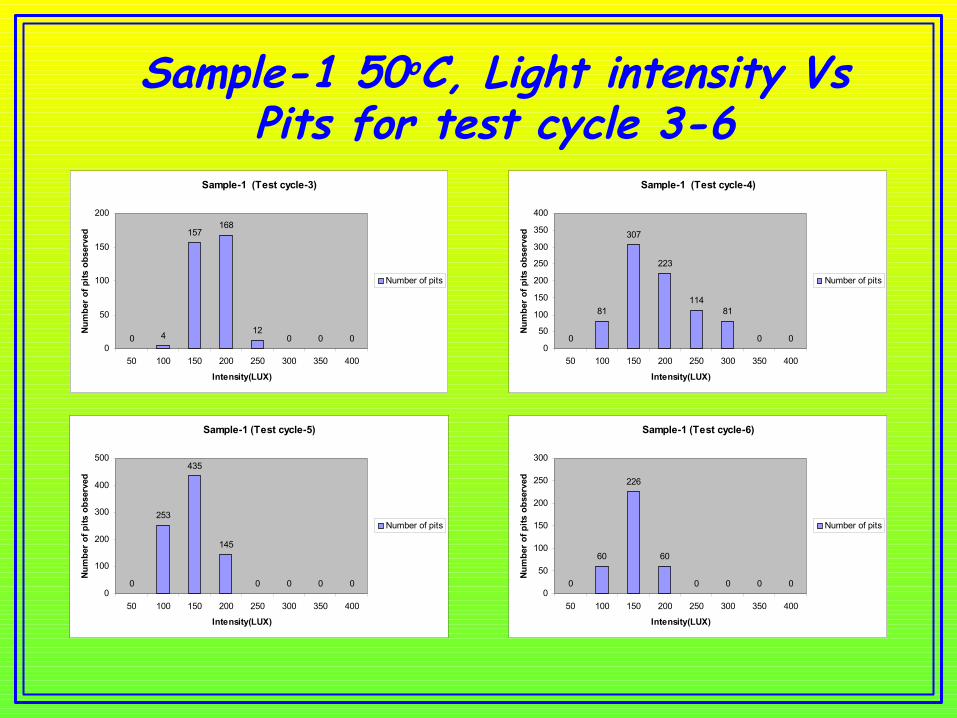
Sample-1 50oC, Light intensity Vs Pits for test cycle 3-6
Sample-1 (Test cycle-3)
0 4
157168
120 0 0
0
50
100
150
200
50 100 150 200 250 300 350 400
Intensity(LUX)
Num
ber
of p
its o
bser
ved
Number of pits
Sample-1 (Test cycle-4)
0
81
307
223
11481
0 00
50
100
150
200
250
300
350
400
50 100 150 200 250 300 350 400
Intensity(LUX)
Num
ber
of p
its o
bser
ved
Number of pits
Sample-1 (Test cycle-5)
0
253
435
145
0 0 0 00
100
200
300
400
500
50 100 150 200 250 300 350 400
Intensity(LUX)
Num
ber
of p
its o
bser
ved
Number of pits
Sample-1 (Test cycle-6)
0
60
226
60
0 0 0 00
50
100
150
200
250
300
50 100 150 200 250 300 350 400
Intensity(LUX)
Num
ber
of p
its o
bser
ved
Number of pits

Sample-1 50oC, Light intensity Vs Pits for test cycle 7-10
Sample-1 (Test cycle-7)
0
92 91
0 0 0 0 00
50
100
150
200
50 100 150 200 250 300 350 400
Intensity(LUX)
Num
ber
of p
its o
bser
ved
Number of pits
Sample-1 (Test cycle-8)
0
124
586
295
0 0 0 00
100
200
300
400
500
600
50 100 150 200 250 300 350 400
Intensity(LUX)
Num
ber
of p
its o
bser
ved
Number of pits
Sample-1 (Test cycle-9)
0
221 217
157
0 0 0 00
50
100
150
200
250
50 100 150 200 250 300 350 400
Intensity(LUX)
Num
ber
of p
its o
bser
ved
Number of pits
Sample-1 (Test cycle-10)
049
567
302
0 0 0 00
100
200
300
400
500
600
50 100 150 200 250 300 350 400
Intensity(LUX)
Num
ber
of p
its o
bser
ved
Number of pits
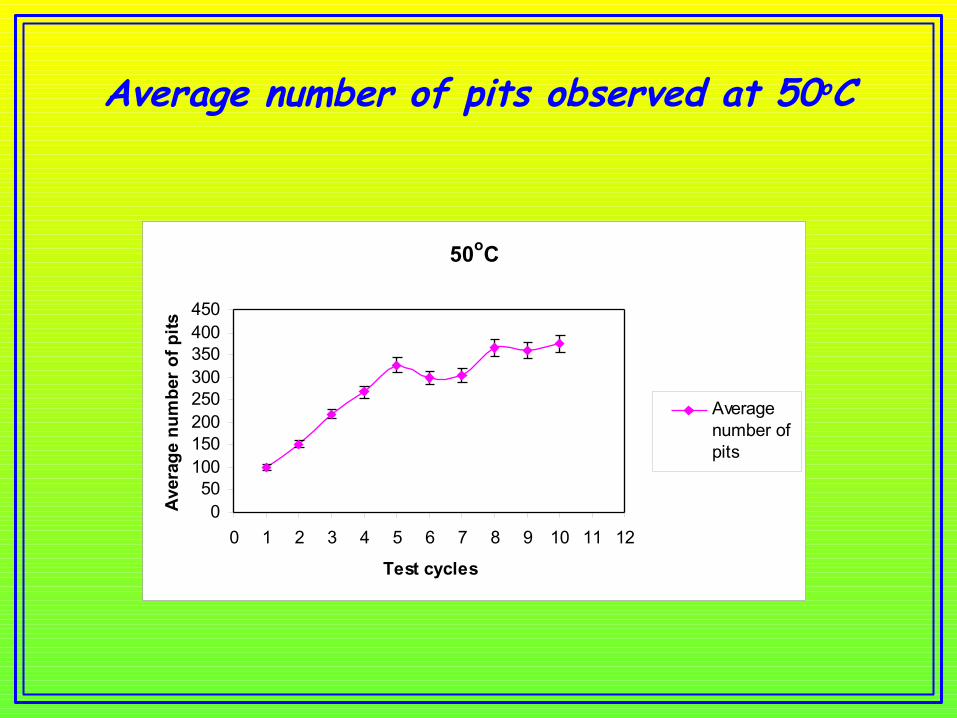
Average number of pits observed at 50oC
50oC
050
100150200250300350400450
0 1 2 3 4 5 6 7 8 9 10 11 12
Test cycles
Aver
age
num
ber o
f pits
Averagenumber ofpits
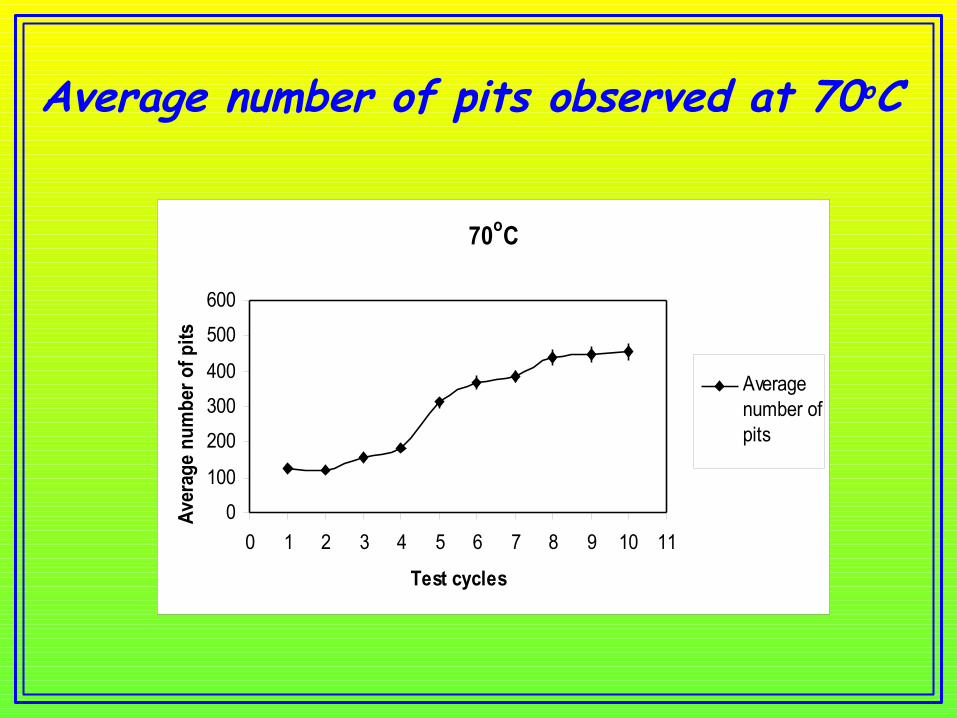
Average number of pits observed at 70oC
70oC
0
100
200
300
400
500
600
0 1 2 3 4 5 6 7 8 9 10 11
Test cycles
Aver
age
num
ber o
f pits
Averagenumber ofpits
Recommended


![[Mesh] Inspecting for Hazardous](https://img.pdfslide.net/doc/110x75/5695d02a1a28ab9b029144f9/mesh-inspecting-for-hazardous.jpg)