Functional Tests
Agilent TechnologiesN9020A MXA Signal Analyzer
Manufacturing Part Number: N9020-90086Supersedes: N9020-90054
Printed in USA
August 2008
© Copyright 2006 - 2008 Agilent Technologies, Inc.
NoticeThe information contained in this document is subject to change without notice.
Agilent Technologies makes no warranty of any kind with regard to this material, including but not limited to, the implied warranties of merchantability and fitness for a particular purpose. Agilent Technologies shall not be liable for errors contained herein or for incidental or consequential damages in connection with the furnishing, performance, or use of this material.
Where to Find the Latest InformationDocumentation is updated periodically. For the latest information about Agilent MXA signal analyzer, including software updates and application information, please visit the following Internet URLs:
http://www.agilent.com/find/mxa
2
ContentsTab
le of C
on
tents
1. Functional TestsFunctional Test Versus Performance Verification . . . . . . . . . . . . . . . . . . . . . . . . . . . . . . . . . 6Contents of this Document . . . . . . . . . . . . . . . . . . . . . . . . . . . . . . . . . . . . . . . . . . . . . . . . . . . 7Before Performing a Functional Test . . . . . . . . . . . . . . . . . . . . . . . . . . . . . . . . . . . . . . . . . . . 8Test Equipment . . . . . . . . . . . . . . . . . . . . . . . . . . . . . . . . . . . . . . . . . . . . . . . . . . . . . . . . . . . . 9
2. Displayed Average Noise Level (DANL)Procedure . . . . . . . . . . . . . . . . . . . . . . . . . . . . . . . . . . . . . . . . . . . . . . . . . . . . . . . . . . . . . . . 14
3. Frequency Readout AccuracyProcedure . . . . . . . . . . . . . . . . . . . . . . . . . . . . . . . . . . . . . . . . . . . . . . . . . . . . . . . . . . . . . . . 18
4. Second Harmonic Distortion (SHD)Test Limits . . . . . . . . . . . . . . . . . . . . . . . . . . . . . . . . . . . . . . . . . . . . . . . . . . . . . . . . . . . . . . 20Procedure . . . . . . . . . . . . . . . . . . . . . . . . . . . . . . . . . . . . . . . . . . . . . . . . . . . . . . . . . . . . . . . 22
5. Amplitude Accuracy at 50 MHzProcedure . . . . . . . . . . . . . . . . . . . . . . . . . . . . . . . . . . . . . . . . . . . . . . . . . . . . . . . . . . . . . . . 25Testing Preamp Option (P03, P08, P13, P26) . . . . . . . . . . . . . . . . . . . . . . . . . . . . . . . . . . . . 27
Procedure . . . . . . . . . . . . . . . . . . . . . . . . . . . . . . . . . . . . . . . . . . . . . . . . . . . . . . . . . . . . . 27
6. Frequency Response (Flatness)Procedure . . . . . . . . . . . . . . . . . . . . . . . . . . . . . . . . . . . . . . . . . . . . . . . . . . . . . . . . . . . . . . . 31
7. Frequency Response (Flatness), Preamp OnProcedure . . . . . . . . . . . . . . . . . . . . . . . . . . . . . . . . . . . . . . . . . . . . . . . . . . . . . . . . . . . . . . . 35
8. Scale FidelityProcedure . . . . . . . . . . . . . . . . . . . . . . . . . . . . . . . . . . . . . . . . . . . . . . . . . . . . . . . . . . . . . . . 39
9. BBIQ Input Frequency Response (Option BBA only)Procedure . . . . . . . . . . . . . . . . . . . . . . . . . . . . . . . . . . . . . . . . . . . . . . . . . . . . . . . . . . . . . . . 43
3

ContentsTa
ble
of
Co
nte
nts
4
1 Functional Tests
Fun
ction
al Tests
Functional tests are tests of various instrument parameters that give a high degree of confidence that the analyzer is operating correctly. They are recommended as a check of analyzer operation for incoming inspection or after a repair. Measurement uncertainty analysis is not available for functional tests, and the analyzer is checked against limits that are wider than the published specifications. The functional tests are designed to test an analyzer operating within the temperature range defined by the analyzer specifications using a minimum set of test equipment. If a test does not pass, performance verification tests must be run to determine whether a problem exists.
5
Functional TestsFunctional Test Versus Performance Verification
Fu
nct
ion
al T
ests
Functional Test Versus Performance VerificationFunctional tests use a minimum set of test equipment to check a much smaller range of parameters (and a limited number of data points for each parameter) than do performance verification tests. Functional tests use limits that are wider than the published specifications; measurement uncertainty analysis is not available for functional tests.
NOTE If a functional test does not pass, you must run performance verification tests to determine whether a problem exists.
Performance verification tests span a wide range of instrument parameters and provide the highest level of confidence that the instrument conforms to published specifications. These tests can be time consuming and require extensive test equipment.
6 Chapter 1
Functional TestsContents of this Document
Fu
nctio
nal Tests
Contents of this DocumentThis chapter includes the following:
• “Before Performing a Functional Test” on page 8 (what to do first).
• “Test Equipment” on page 9 (a list of the equipment required for all of the tests).
Subsequent chapters describe the following Functional Tests:
• “Displayed Average Noise Level (DANL)” on page 13
• “Frequency Readout Accuracy” on page 17
• “Second Harmonic Distortion (SHD)” on page 19
• “Amplitude Accuracy at 50 MHz” on page 23
• “Amplitude Accuracy at 50 MHz” on page 23
• “Frequency Response (Flatness)” on page 29
• “Frequency Response (Flatness), Preamp On” on page 33
• “Scale Fidelity” on page 37
• “BBIQ Input Frequency Response (Option BBA only)” on page 41
Each functional test includes:
• Test limits (pass/fail criteria)
• A description of the test
• The equipment required for the test
• A figure showing how to connect the equipment
• Step-by-step instructions
• One or more tables in which to record the measurement results
Chapter 1 7
Functional TestsBefore Performing a Functional Test
Fu
nct
ion
al T
ests
Before Performing a Functional Test
1. Ensure that you have the proper test equipment.
2. Switch on the unit under test (UUT) and let it warm up (in accordance with warm-up requirements in the instrument specifications).
3. Allow sufficient warm-up time for the required test equipment (refer to individual instrument documentation for warm-up specifications).
4. Ensure that the analyzer’s frequency reference is set to Internal:
a. Press the Input/Output, More, Freq Ref In keys.
b. If the Freq Ref In softkey does not show Internal, press the Freq Ref In softkey and select Internal.
5. Following instrument warm-up, perform the auto align routine:
Press System, Alignments, Align Now, All.
NOTE Functional test accuracy depends on the precision of the test equipment used. Ensure that all of the test equipment is calibrated before running a functional test.
8 Chapter 1
Functional TestsTest Equipment
Fu
nctio
nal Tests
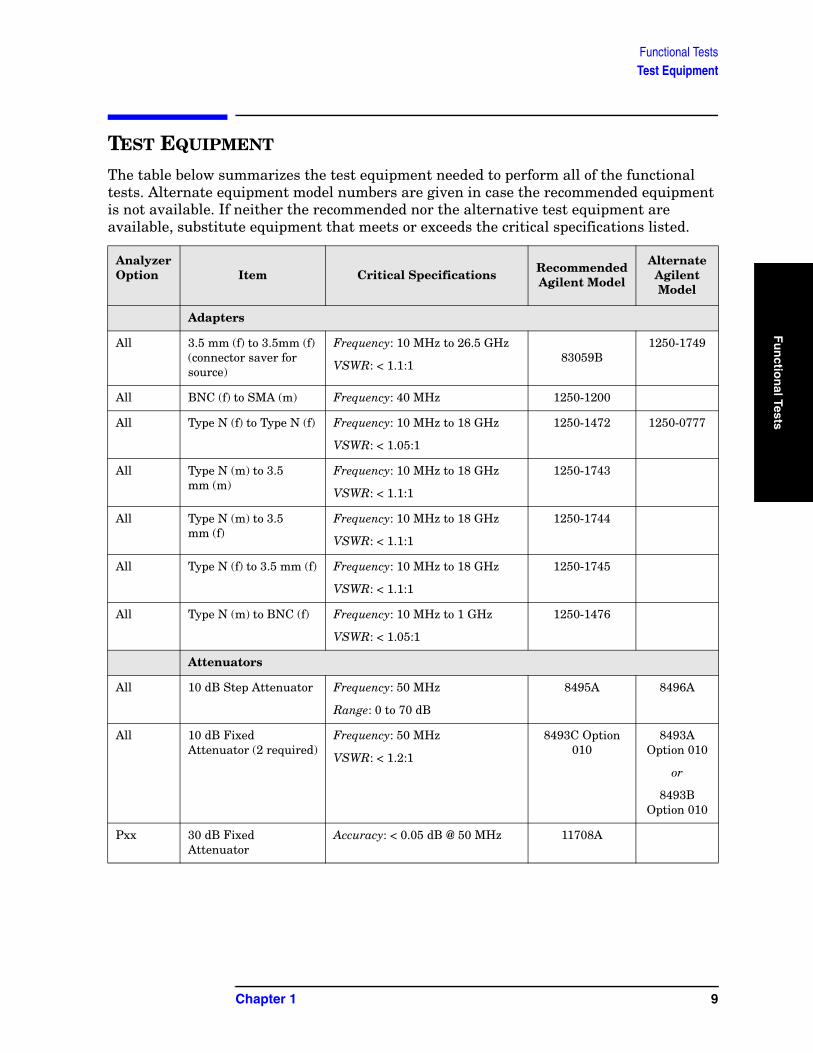
TEST EQUIPMENT
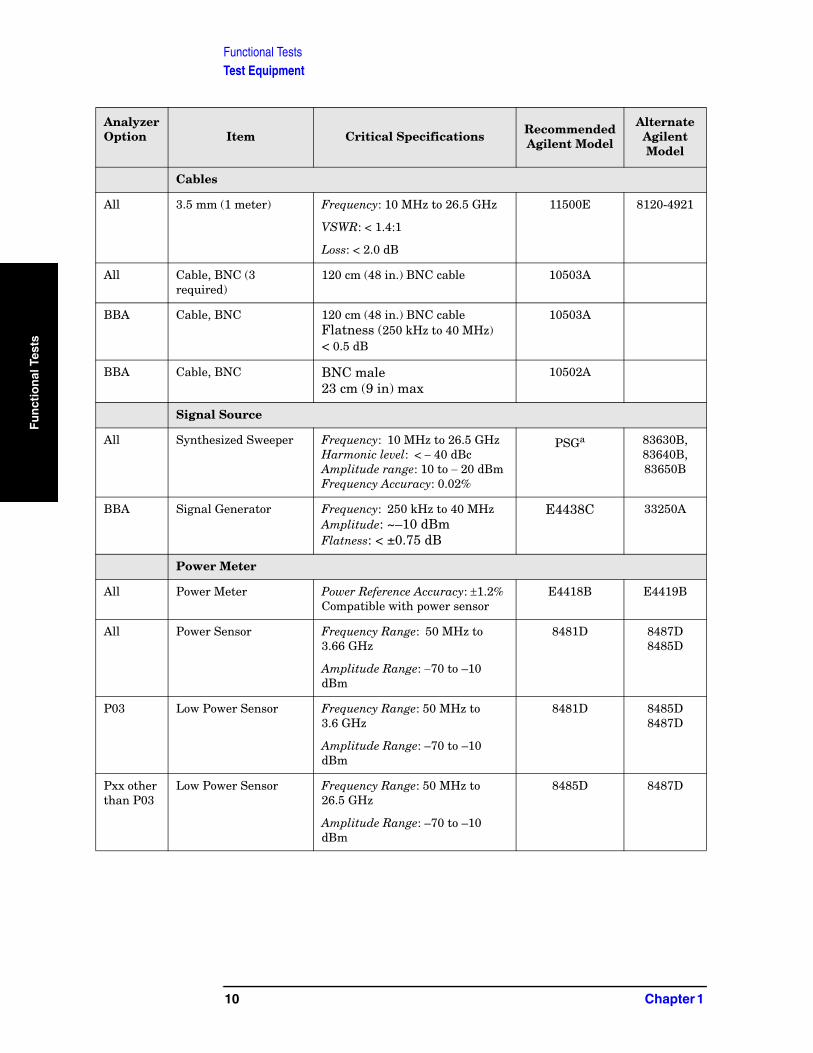
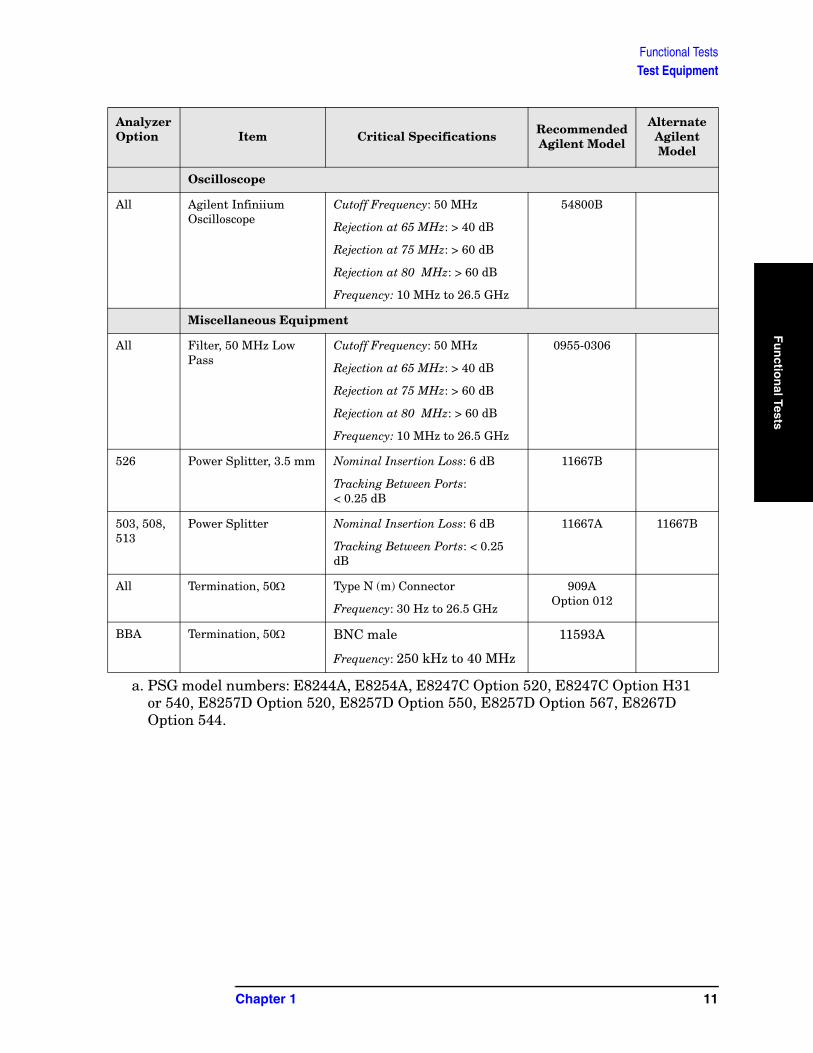
The table below summarizes the test equipment needed to perform all of the functional tests. Alternate equipment model numbers are given in case the recommended equipment is not available. If neither the recommended nor the alternative test equipment are available, substitute equipment that meets or exceeds the critical specifications listed.
Analyzer Option Item Critical Specifications Recommended
Agilent Model
Alternate Agilent Model
Adapters
All 3.5 mm (f) to 3.5mm (f)(connector saver for source)
Frequency: 10 MHz to 26.5 GHz
VSWR: < 1.1:183059B
1250-1749
All BNC (f) to SMA (m) Frequency: 40 MHz 1250-1200
All Type N (f) to Type N (f) Frequency: 10 MHz to 18 GHz
VSWR: < 1.05:1
1250-1472 1250-0777
All Type N (m) to 3.5 mm (m)
Frequency: 10 MHz to 18 GHz
VSWR: < 1.1:1
1250-1743
All Type N (m) to 3.5 mm (f)
Frequency: 10 MHz to 18 GHz
VSWR: < 1.1:1
1250-1744
All Type N (f) to 3.5 mm (f) Frequency: 10 MHz to 18 GHz
VSWR: < 1.1:1
1250-1745
All Type N (m) to BNC (f) Frequency: 10 MHz to 1 GHz
VSWR: < 1.05:1
1250-1476
Attenuators
All 10 dB Step Attenuator Frequency: 50 MHz
Range: 0 to 70 dB
8495A 8496A
All 10 dB Fixed Attenuator (2 required)
Frequency: 50 MHz
VSWR: < 1.2:1
8493C Option 010
8493A Option 010
or
8493B Option 010
Pxx 30 dB Fixed Attenuator
Accuracy: < 0.05 dB @ 50 MHz 11708A
Chapter 1 9
Functional TestsTest Equipment
Fu
nct
ion
al T
ests
Cables
All 3.5 mm (1 meter) Frequency: 10 MHz to 26.5 GHz
VSWR: < 1.4:1
Loss: < 2.0 dB
11500E 8120-4921
All Cable, BNC (3 required)
120 cm (48 in.) BNC cable 10503A
BBA Cable, BNC 120 cm (48 in.) BNC cableFlatness (250 kHz to 40 MHz) < 0.5 dB
10503A
BBA Cable, BNC BNC male23 cm (9 in) max
10502A
Signal Source
All Synthesized Sweeper Frequency: 10 MHz to 26.5 GHzHarmonic level: < − 40 dBcAmplitude range: 10 to − 20 dBmFrequency Accuracy: 0.02%
PSGa 83630B,83640B,83650B
BBA Signal Generator Frequency: 250 kHz to 40 MHzAmplitude: ~–10 dBmFlatness: < ±0.75 dB
E4438C 33250A
Power Meter
All Power Meter Power Reference Accuracy: ±1.2%Compatible with power sensor
E4418B E4419B
All Power Sensor Frequency Range: 50 MHz to 3.66 GHz
Amplitude Range: −70 to –10 dBm
8481D 8487D8485D
P03 Low Power Sensor Frequency Range: 50 MHz to 3.6 GHz
Amplitude Range: –70 to –10 dBm
8481D 8485D8487D
Pxx other than P03
Low Power Sensor Frequency Range: 50 MHz to 26.5 GHz
Amplitude Range: –70 to –10 dBm
8485D 8487D
Analyzer Option Item Critical Specifications Recommended
Agilent Model
Alternate Agilent Model
10 Chapter 1
Functional TestsTest Equipment
Fu
nctio
nal Tests
Oscilloscope
All Agilent Infiniium Oscilloscope
Cutoff Frequency: 50 MHz
Rejection at 65 MHz: > 40 dB
Rejection at 75 MHz: > 60 dB
Rejection at 80 MHz: > 60 dB
Frequency: 10 MHz to 26.5 GHz
54800B
Miscellaneous Equipment
All Filter, 50 MHz Low Pass
Cutoff Frequency: 50 MHz
Rejection at 65 MHz: > 40 dB
Rejection at 75 MHz: > 60 dB
Rejection at 80 MHz: > 60 dB
Frequency: 10 MHz to 26.5 GHz
0955-0306
526 Power Splitter, 3.5 mm Nominal Insertion Loss: 6 dB
Tracking Between Ports: < 0.25 dB
11667B
503, 508, 513
Power Splitter Nominal Insertion Loss: 6 dB
Tracking Between Ports: < 0.25 dB
11667A 11667B
All Termination, 50Ω Type N (m) Connector
Frequency: 30 Hz to 26.5 GHz
909A Option 012
BBA Termination, 50Ω BNC male
Frequency: 250 kHz to 40 MHz
11593A
a. PSG model numbers: E8244A, E8254A, E8247C Option 520, E8247C Option H31 or 540, E8257D Option 520, E8257D Option 550, E8257D Option 567, E8267D Option 544.
Analyzer Option Item Critical Specifications Recommended
Agilent Model
Alternate Agilent Model
Chapter 1 11
Functional TestsTest Equipment
Fu
nct
ion
al T
ests
12 Chapter 1
2 Displayed Average Noise Level (DANL)
Displayed
Averag
e No
ise Level (D
AN
L)
Test Limits (with 0 dB input attenuation)
See Table 2-1 for values.
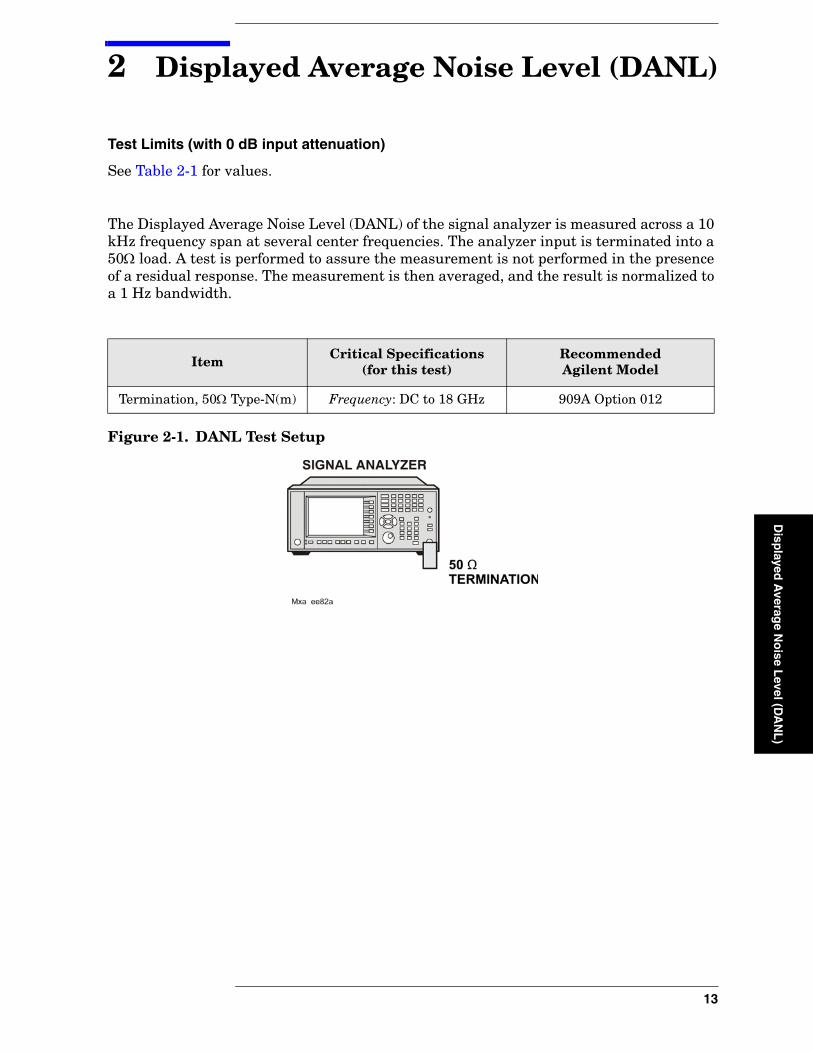
The Displayed Average Noise Level (DANL) of the signal analyzer is measured across a 10 kHz frequency span at several center frequencies. The analyzer input is terminated into a 50Ω load. A test is performed to assure the measurement is not performed in the presence of a residual response. The measurement is then averaged, and the result is normalized to a 1 Hz bandwidth.
Figure 2-1. DANL Test Setup
Item Critical Specifications(for this test)
RecommendedAgilent Model
Termination, 50Ω Type-N(m) Frequency: DC to 18 GHz 909A Option 012
13
Displayed Average Noise Level (DANL)Procedure
Dis
pla
yed
Ave
rag
e N
ois
e L
evel
(D
AN
L)
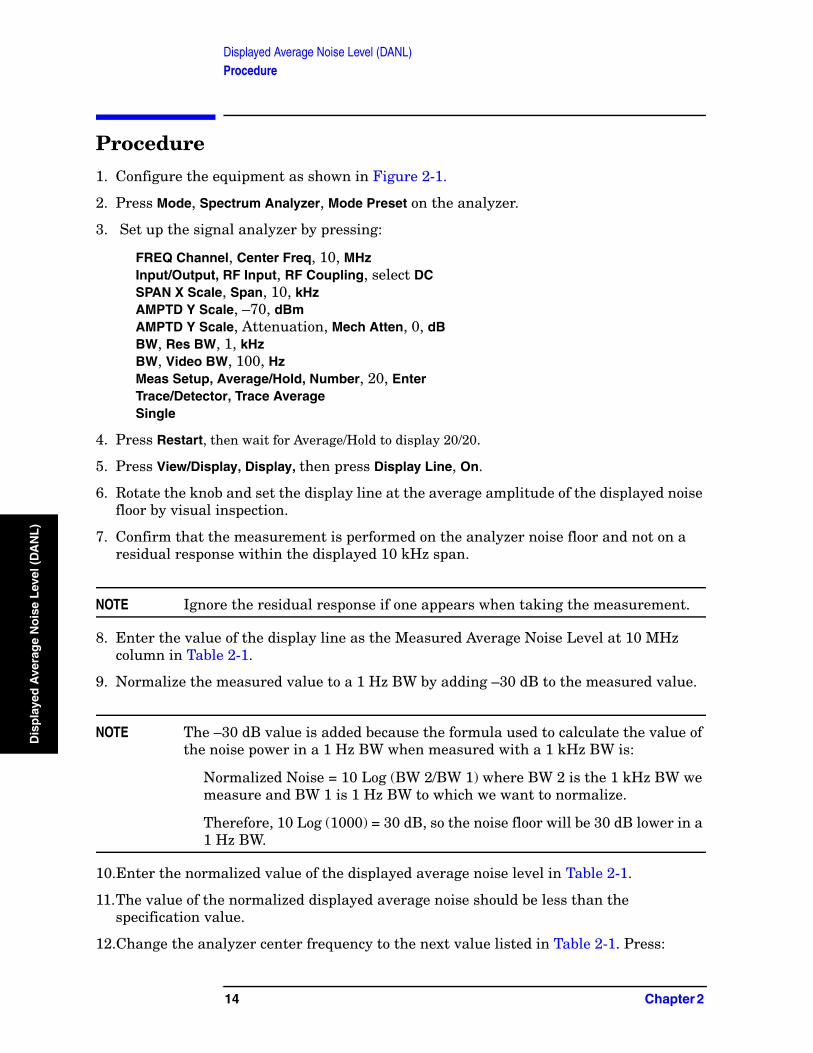
Procedure
1. Configure the equipment as shown in Figure 2-1.
2. Press Mode, Spectrum Analyzer, Mode Preset on the analyzer.
3. Set up the signal analyzer by pressing:
FREQ Channel, Center Freq, 10, MHzInput/Output, RF Input, RF Coupling, select DCSPAN X Scale, Span, 10, kHzAMPTD Y Scale, –70, dBmAMPTD Y Scale, Attenuation, Mech Atten, 0, dBBW, Res BW, 1, kHzBW, Video BW, 100, HzMeas Setup, Average/Hold, Number, 20, EnterTrace/Detector, Trace AverageSingle
4. Press Restart, then wait for Average/Hold to display 20/20.
5. Press View/Display, Display, then press Display Line, On.
6. Rotate the knob and set the display line at the average amplitude of the displayed noise floor by visual inspection.
7. Confirm that the measurement is performed on the analyzer noise floor and not on a residual response within the displayed 10 kHz span.
NOTE Ignore the residual response if one appears when taking the measurement.
8. Enter the value of the display line as the Measured Average Noise Level at 10 MHz column in Table 2-1.
9. Normalize the measured value to a 1 Hz BW by adding –30 dB to the measured value.
NOTE The –30 dB value is added because the formula used to calculate the value of the noise power in a 1 Hz BW when measured with a 1 kHz BW is:
Normalized Noise = 10 Log (BW 2/BW 1) where BW 2 is the 1 kHz BW we measure and BW 1 is 1 Hz BW to which we want to normalize.
Therefore, 10 Log (1000) = 30 dB, so the noise floor will be 30 dB lower in a 1 Hz BW.
10.Enter the normalized value of the displayed average noise level in Table 2-1.
11.The value of the normalized displayed average noise should be less than the specification value.
12.Change the analyzer center frequency to the next value listed in Table 2-1. Press:
14 Chapter 2
Displayed Average Noise Level (DANL)Procedure
Disp
layed A
verage N
oise L
evel (DA
NL
)
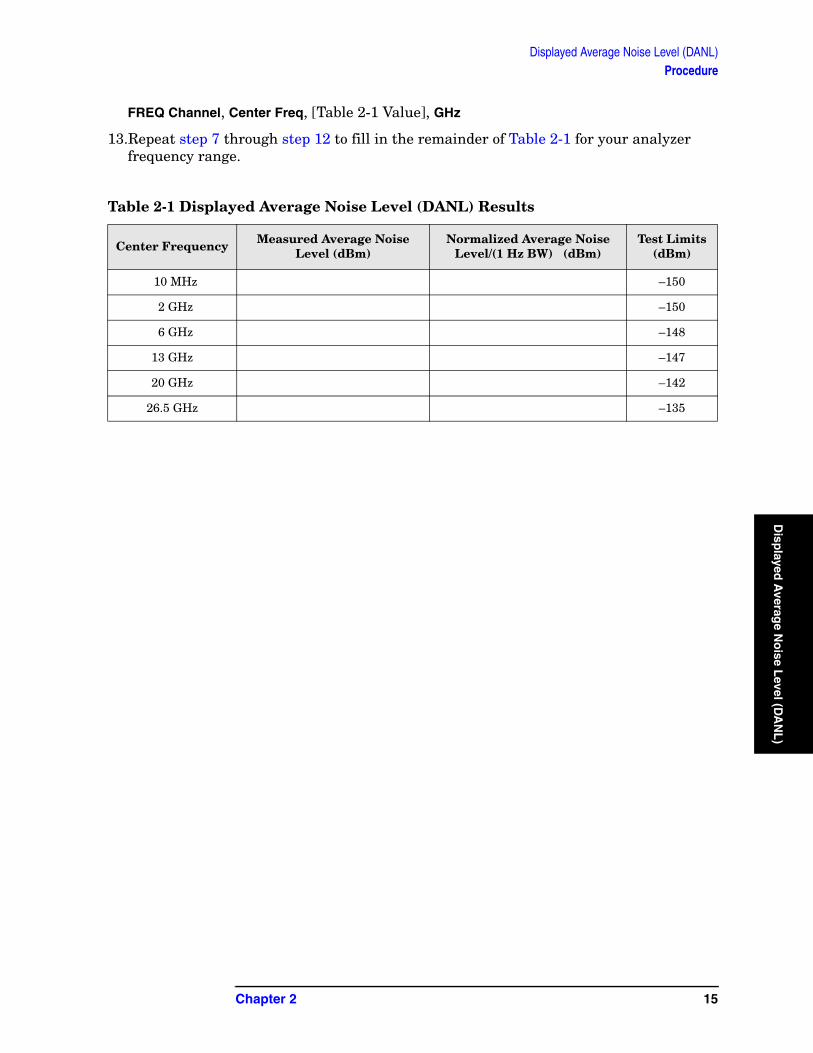
FREQ Channel, Center Freq, [Table 2-1 Value], GHz
13.Repeat step 7 through step 12 to fill in the remainder of Table 2-1 for your analyzer frequency range.
Table 2-1 Displayed Average Noise Level (DANL) Results
Center Frequency Measured Average Noise Level (dBm)
Normalized Average Noise Level/(1 Hz BW) (dBm)
Test Limits (dBm)
10 MHz –150
2 GHz –150
6 GHz –148
13 GHz –147
20 GHz –142
26.5 GHz –135
Chapter 2 15
Displayed Average Noise Level (DANL)Procedure
Dis
pla
yed
Ave
rag
e N
ois
e L
evel
(D
AN
L)
16 Chapter 2
3 Frequency Readout Accuracy
Frequ
ency R
eado
ut A
ccuracy
Test Limits
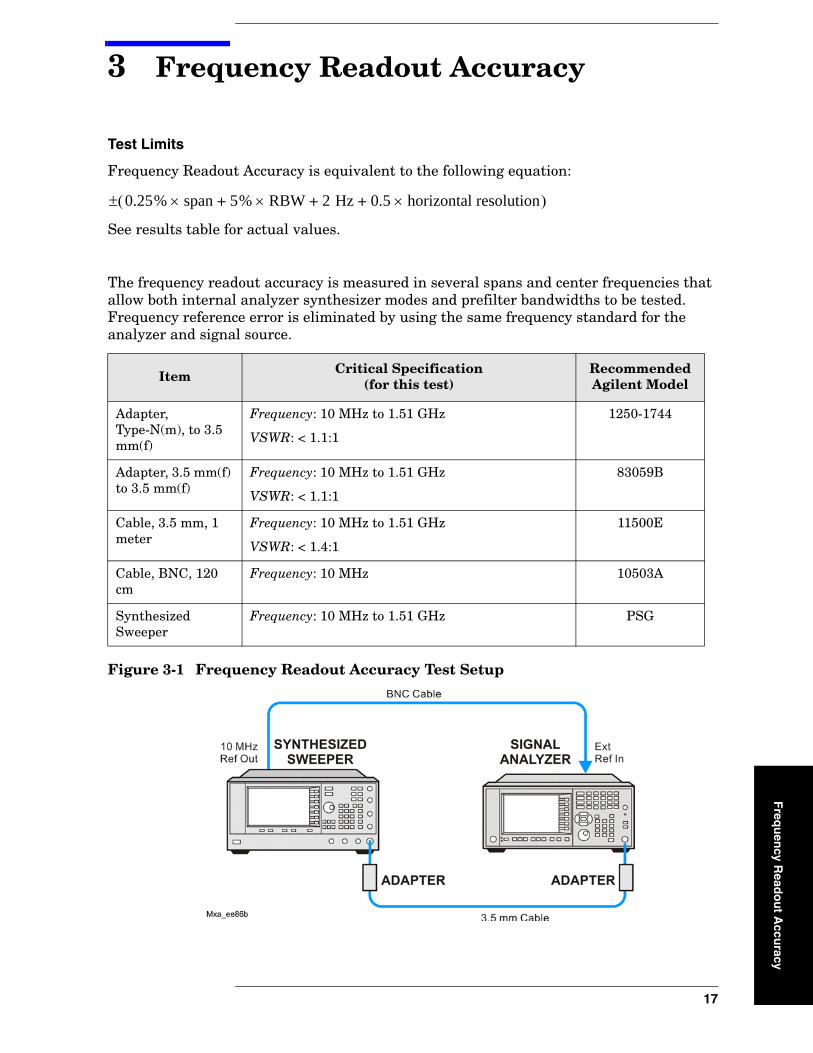
Frequency Readout Accuracy is equivalent to the following equation:
See results table for actual values.
The frequency readout accuracy is measured in several spans and center frequencies that allow both internal analyzer synthesizer modes and prefilter bandwidths to be tested. Frequency reference error is eliminated by using the same frequency standard for the analyzer and signal source.
Figure 3-1 Frequency Readout Accuracy Test Setup
Item Critical Specification(for this test)
Recommended Agilent Model
Adapter, Type-N(m), to 3.5 mm(f)
Frequency: 10 MHz to 1.51 GHz
VSWR: < 1.1:1
1250-1744
Adapter, 3.5 mm(f) to 3.5 mm(f)
Frequency: 10 MHz to 1.51 GHz
VSWR: < 1.1:1
83059B
Cable, 3.5 mm, 1 meter
Frequency: 10 MHz to 1.51 GHz
VSWR: < 1.4:1
11500E
Cable, BNC, 120 cm
Frequency: 10 MHz 10503A
Synthesized Sweeper
Frequency: 10 MHz to 1.51 GHz PSG
0.25% span 5% RBW 2 Hz 0.5 horizontal resolution×+ +×+×( )±
17
Frequency Readout AccuracyProcedure
Fre
qu
ency
Rea
do
ut
Acc
ura
cy
Procedure
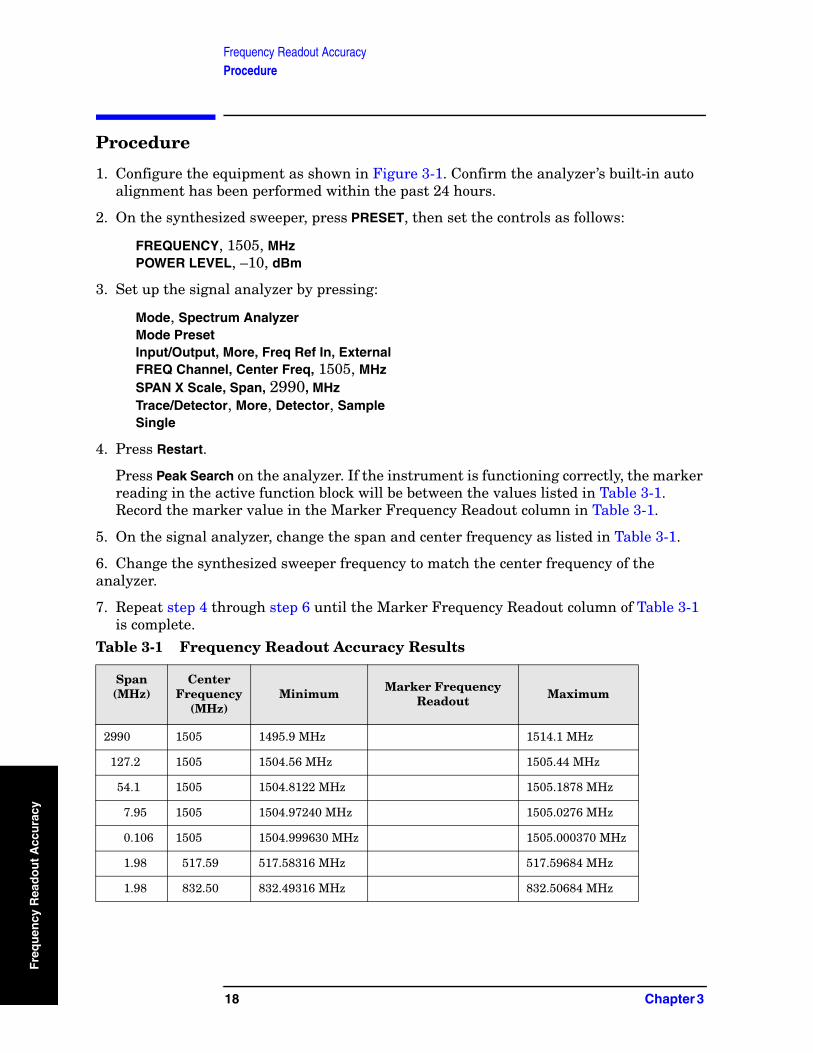
1. Configure the equipment as shown in Figure 3-1. Confirm the analyzer’s built-in auto alignment has been performed within the past 24 hours.
2. On the synthesized sweeper, press PRESET, then set the controls as follows:
FREQUENCY, 1505, MHzPOWER LEVEL, –10, dBm
3. Set up the signal analyzer by pressing:
Mode, Spectrum AnalyzerMode PresetInput/Output, More, Freq Ref In, ExternalFREQ Channel, Center Freq, 1505, MHzSPAN X Scale, Span, 2990, MHzTrace/Detector, More, Detector, SampleSingle
4. Press Restart.
Press Peak Search on the analyzer. If the instrument is functioning correctly, the marker reading in the active function block will be between the values listed in Table 3-1. Record the marker value in the Marker Frequency Readout column in Table 3-1.
5. On the signal analyzer, change the span and center frequency as listed in Table 3-1.
6. Change the synthesized sweeper frequency to match the center frequency of the analyzer.
7. Repeat step 4 through step 6 until the Marker Frequency Readout column of Table 3-1 is complete.
Table 3-1 Frequency Readout Accuracy Results
Span(MHz)
CenterFrequency
(MHz)Minimum Marker Frequency
Readout Maximum
2990 1505 1495.9 MHz 1514.1 MHz
127.2 1505 1504.56 MHz 1505.44 MHz
54.1 1505 1504.8122 MHz 1505.1878 MHz
7.95 1505 1504.97240 MHz 1505.0276 MHz
0.106 1505 1504.999630 MHz 1505.000370 MHz
1.98 517.59 517.58316 MHz 517.59684 MHz
1.98 832.50 832.49316 MHz 832.50684 MHz
18 Chapter 3
Seco
nd
Harm
on
ic D
4 Second Harmonic Distortion (SHD)
istortion
(SH
D)
19
Second Harmonic Distortion (SHD)Test Limits
Sec
on
d H
arm
on
ic D
isto
rtio
n (
SH
D)
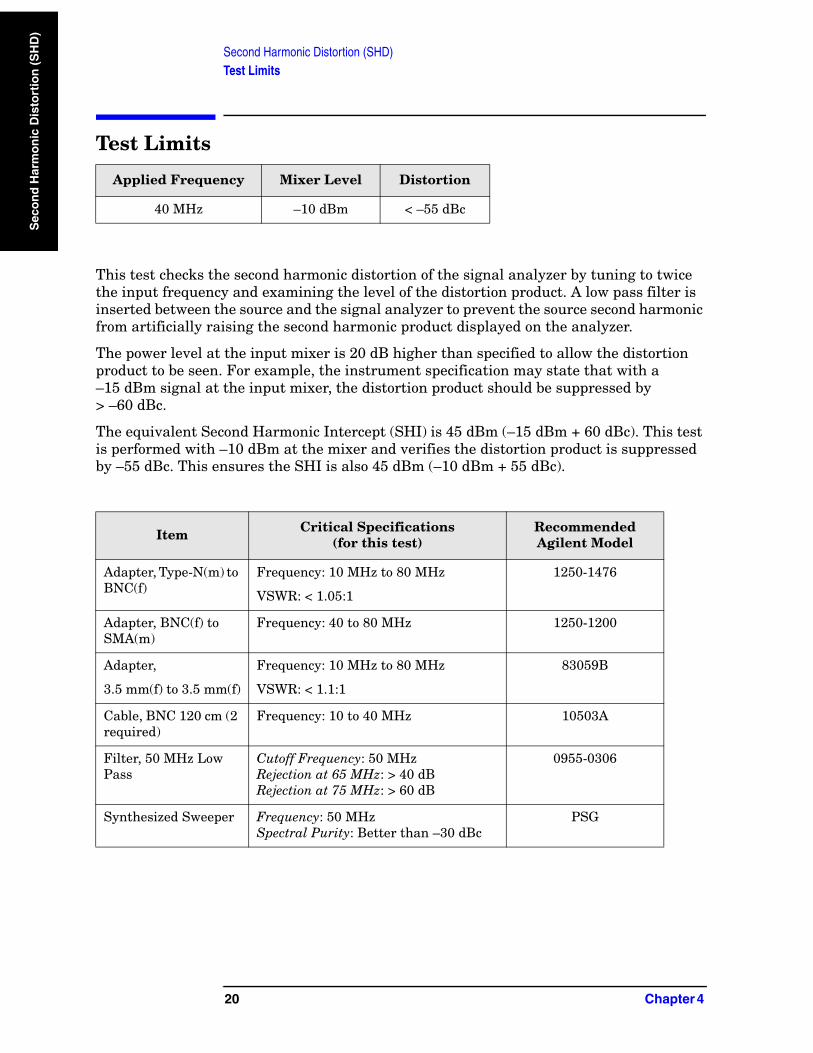
Test Limits
This test checks the second harmonic distortion of the signal analyzer by tuning to twice the input frequency and examining the level of the distortion product. A low pass filter is inserted between the source and the signal analyzer to prevent the source second harmonic from artificially raising the second harmonic product displayed on the analyzer.
The power level at the input mixer is 20 dB higher than specified to allow the distortion product to be seen. For example, the instrument specification may state that with a –15 dBm signal at the input mixer, the distortion product should be suppressed by > –60 dBc.
The equivalent Second Harmonic Intercept (SHI) is 45 dBm (–15 dBm + 60 dBc). This test is performed with –10 dBm at the mixer and verifies the distortion product is suppressed by –55 dBc. This ensures the SHI is also 45 dBm (–10 dBm + 55 dBc).
Applied Frequency Mixer Level Distortion
40 MHz –10 dBm < –55 dBc
Item Critical Specifications(for this test)
Recommended Agilent Model
Adapter, Type-N(m) to BNC(f)
Frequency: 10 MHz to 80 MHz
VSWR: < 1.05:1
1250-1476
Adapter, BNC(f) to SMA(m)
Frequency: 40 to 80 MHz 1250-1200
Adapter,
3.5 mm(f) to 3.5 mm(f)
Frequency: 10 MHz to 80 MHz
VSWR: < 1.1:1
83059B
Cable, BNC 120 cm (2 required)
Frequency: 10 to 40 MHz 10503A
Filter, 50 MHz Low Pass
Cutoff Frequency: 50 MHzRejection at 65 MHz: > 40 dBRejection at 75 MHz: > 60 dB
0955-0306
Synthesized Sweeper Frequency: 50 MHzSpectral Purity: Better than –30 dBc
PSG
20 Chapter 4
Second Harmonic Distortion (SHD)Test Limits
Seco
nd
Harm
on
ic Disto
rtion
(SH
D)
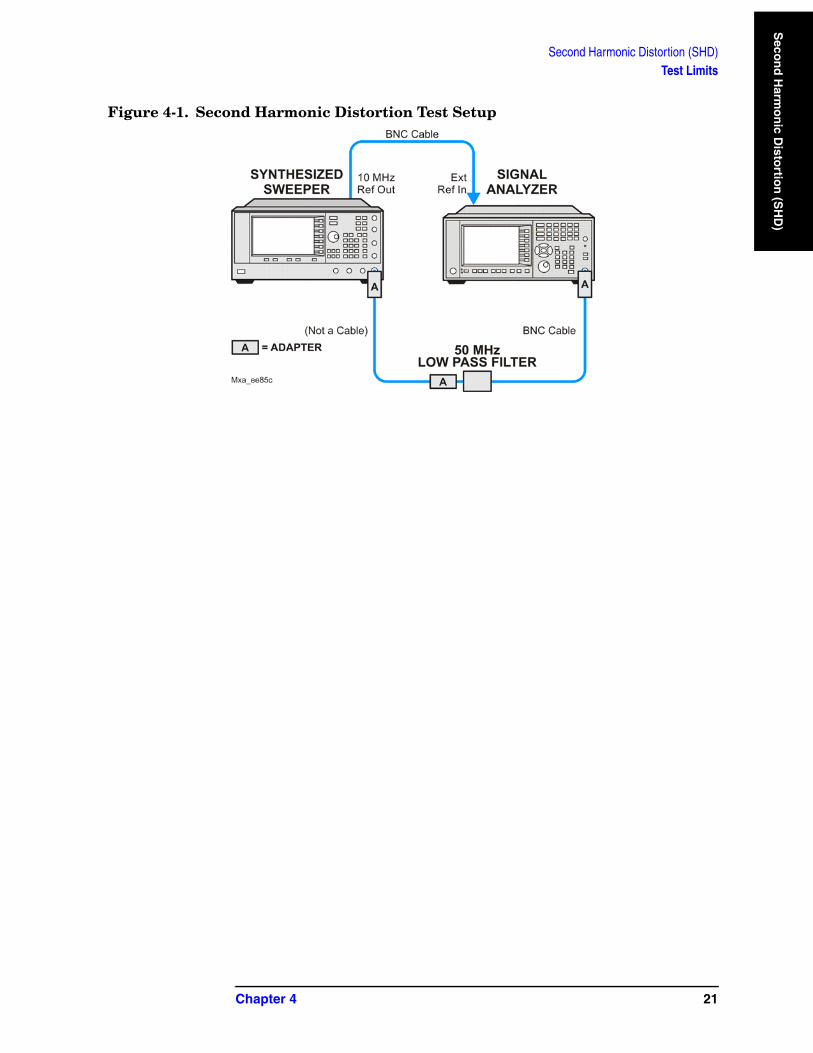
Figure 4-1. Second Harmonic Distortion Test Setup
Chapter 4 21
Second Harmonic Distortion (SHD)Procedure
Sec
on
d H
arm
on
ic D
isto
rtio
n (
SH
D)
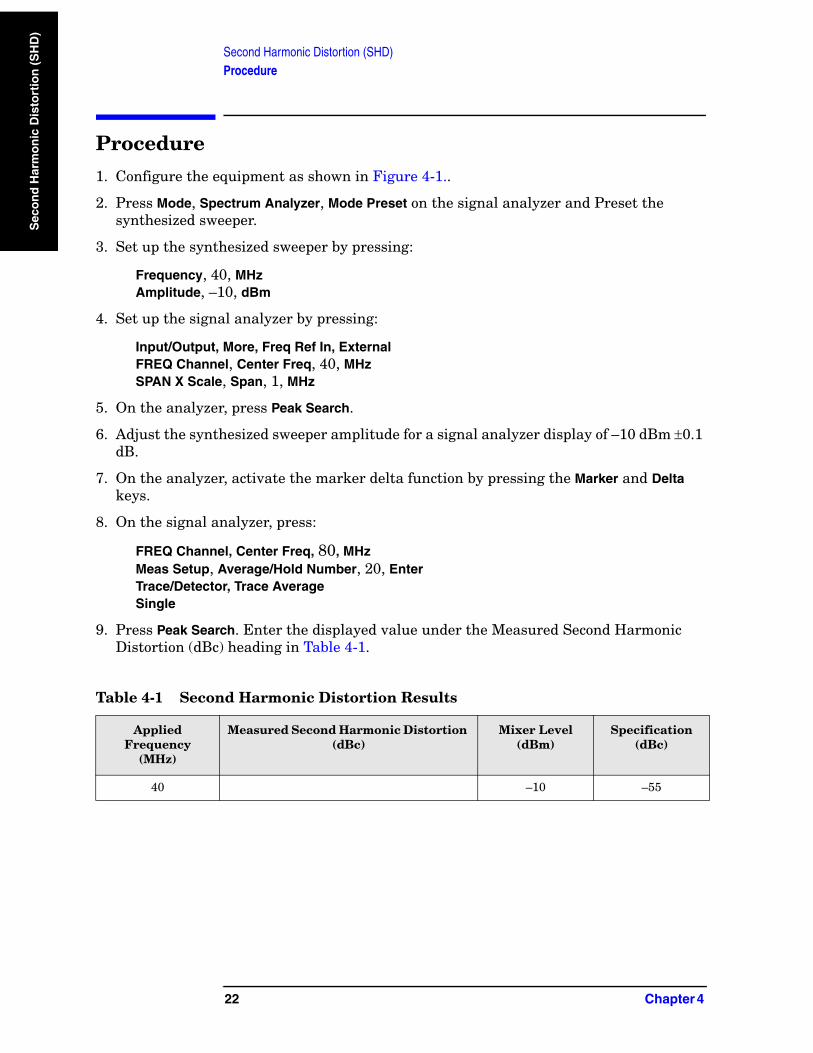
Procedure
1. Configure the equipment as shown in Figure 4-1..
2. Press Mode, Spectrum Analyzer, Mode Preset on the signal analyzer and Preset the synthesized sweeper.
3. Set up the synthesized sweeper by pressing:
Frequency, 40, MHzAmplitude, –10, dBm
4. Set up the signal analyzer by pressing:
Input/Output, More, Freq Ref In, ExternalFREQ Channel, Center Freq, 40, MHzSPAN X Scale, Span, 1, MHz
5. On the analyzer, press Peak Search.
6. Adjust the synthesized sweeper amplitude for a signal analyzer display of –10 dBm ±0.1 dB.
7. On the analyzer, activate the marker delta function by pressing the Marker and Delta keys.
8. On the signal analyzer, press:
FREQ Channel, Center Freq, 80, MHzMeas Setup, Average/Hold Number, 20, EnterTrace/Detector, Trace AverageSingle
9. Press Peak Search. Enter the displayed value under the Measured Second Harmonic Distortion (dBc) heading in Table 4-1.
Table 4-1 Second Harmonic Distortion Results
Applied Frequency
(MHz)
Measured Second Harmonic Distortion (dBc)
Mixer Level(dBm)
Specification (dBc)
40 –10 –55
22 Chapter 4
5 Amplitude Accuracy at 50 MHz
Amp
litud
e Accu
racy at 50 MH
z
Test Limits
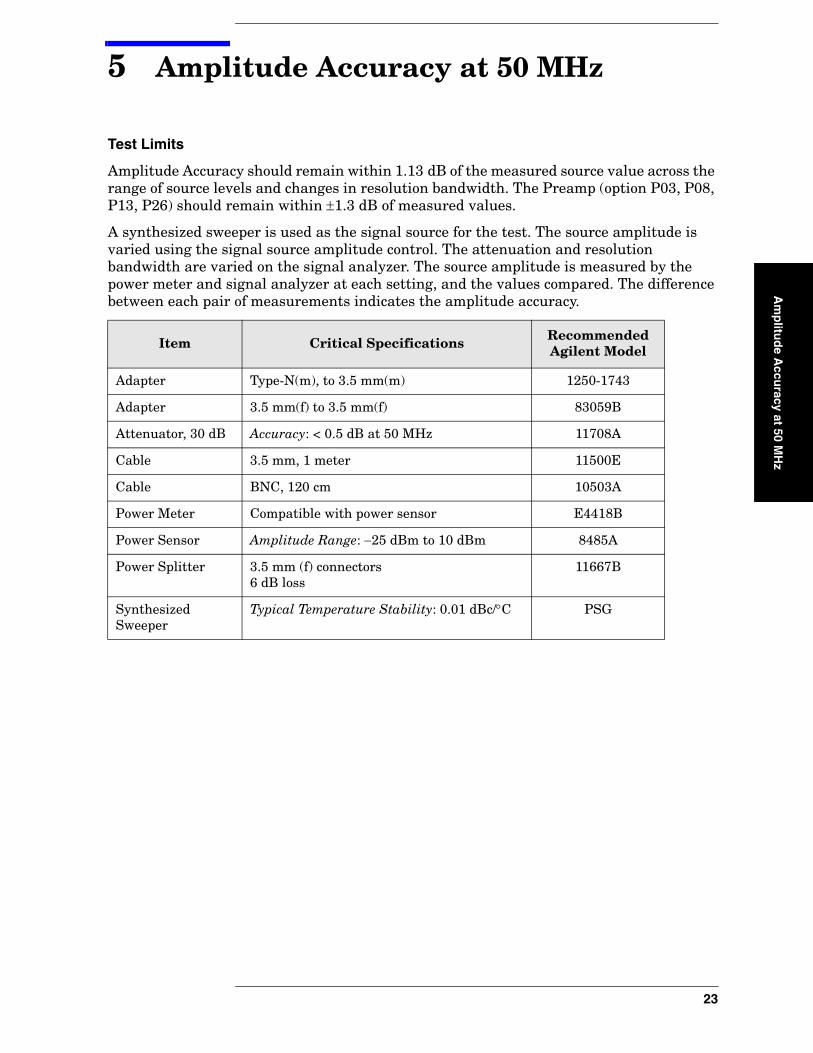
Amplitude Accuracy should remain within 1.13 dB of the measured source value across the range of source levels and changes in resolution bandwidth. The Preamp (option P03, P08, P13, P26) should remain within ±1.3 dB of measured values.
A synthesized sweeper is used as the signal source for the test. The source amplitude is varied using the signal source amplitude control. The attenuation and resolution bandwidth are varied on the signal analyzer. The source amplitude is measured by the power meter and signal analyzer at each setting, and the values compared. The difference between each pair of measurements indicates the amplitude accuracy.
Item Critical Specifications Recommended Agilent Model
Adapter Type-N(m), to 3.5 mm(m) 1250-1743
Adapter 3.5 mm(f) to 3.5 mm(f) 83059B
Attenuator, 30 dB Accuracy: < 0.5 dB at 50 MHz 11708A
Cable 3.5 mm, 1 meter 11500E
Cable BNC, 120 cm 10503A
Power Meter Compatible with power sensor E4418B
Power Sensor Amplitude Range: −25 dBm to 10 dBm 8485A
Power Splitter 3.5 mm (f) connectors6 dB loss
11667B
Synthesized Sweeper
Typical Temperature Stability: 0.01 dBc/°C PSG
23
Amplitude Accuracy at 50 MHzA
mp
litu
de
Acc
ura
cy a
t 50
MH
z
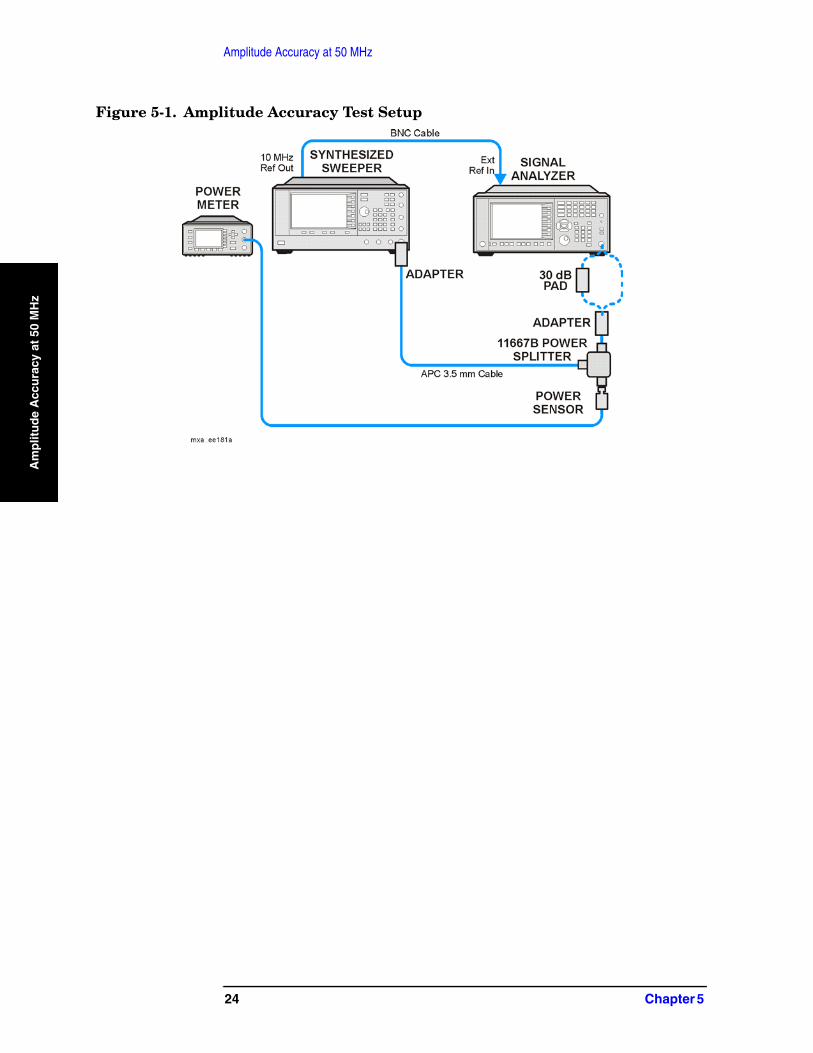
Figure 5-1. Amplitude Accuracy Test Setup
24 Chapter 5
Amplitude Accuracy at 50 MHzProcedure
Am
plitu
de A
ccuracy at 50 M
Hz
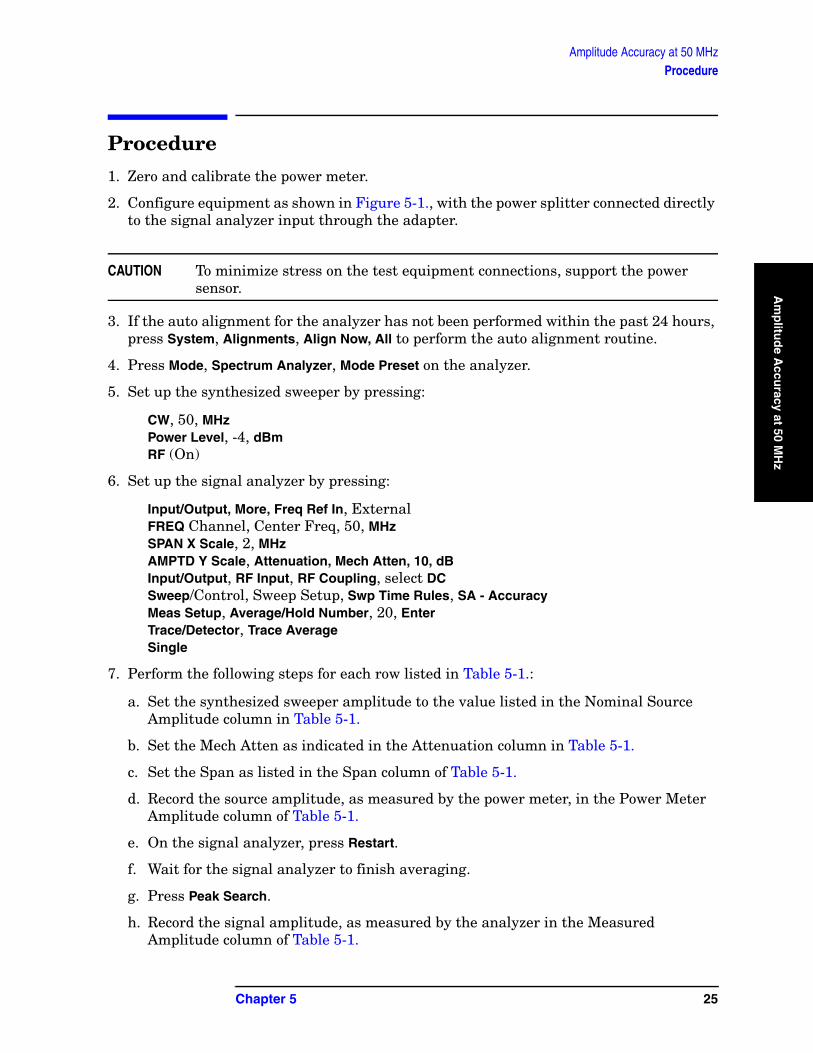
Procedure
1. Zero and calibrate the power meter.
2. Configure equipment as shown in Figure 5-1., with the power splitter connected directly to the signal analyzer input through the adapter.
CAUTION To minimize stress on the test equipment connections, support the power sensor.
3. If the auto alignment for the analyzer has not been performed within the past 24 hours, press System, Alignments, Align Now, All to perform the auto alignment routine.
4. Press Mode, Spectrum Analyzer, Mode Preset on the analyzer.
5. Set up the synthesized sweeper by pressing:
CW, 50, MHzPower Level, -4, dBmRF (On)
6. Set up the signal analyzer by pressing:
Input/Output, More, Freq Ref In, ExternalFREQ Channel, Center Freq, 50, MHzSPAN X Scale, 2, MHzAMPTD Y Scale, Attenuation, Mech Atten, 10, dBInput/Output, RF Input, RF Coupling, select DCSweep/Control, Sweep Setup, Swp Time Rules, SA - AccuracyMeas Setup, Average/Hold Number, 20, EnterTrace/Detector, Trace AverageSingle
7. Perform the following steps for each row listed in Table 5-1.:
a. Set the synthesized sweeper amplitude to the value listed in the Nominal Source Amplitude column in Table 5-1.
b. Set the Mech Atten as indicated in the Attenuation column in Table 5-1.
c. Set the Span as listed in the Span column of Table 5-1.
d. Record the source amplitude, as measured by the power meter, in the Power Meter Amplitude column of Table 5-1.
e. On the signal analyzer, press Restart.
f. Wait for the signal analyzer to finish averaging.
g. Press Peak Search.
h. Record the signal amplitude, as measured by the analyzer in the Measured Amplitude column of Table 5-1.
Chapter 5 25
Amplitude Accuracy at 50 MHzProcedure
Am
plit
ud
e A
ccu
racy
at
50 M
Hz
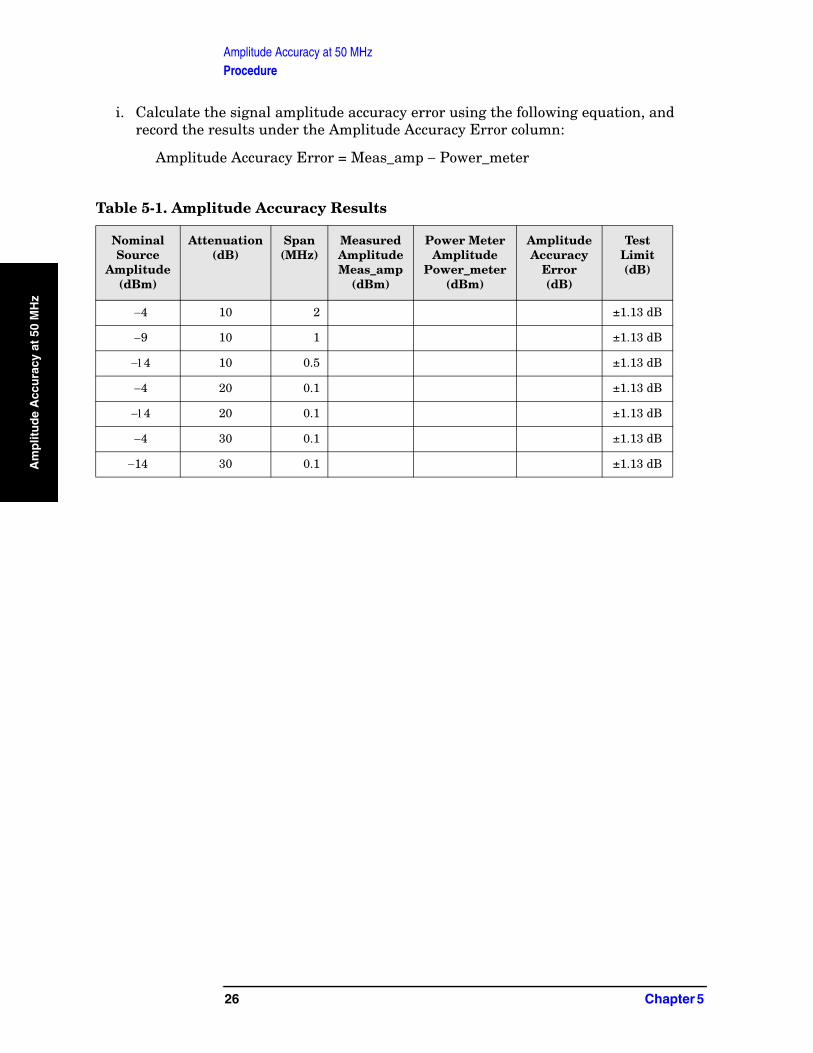
i. Calculate the signal amplitude accuracy error using the following equation, and record the results under the Amplitude Accuracy Error column:
Amplitude Accuracy Error = Meas_amp − Power_meter
Table 5-1. Amplitude Accuracy Results
NominalSource
Amplitude(dBm)
Attenuation(dB)
Span (MHz)
MeasuredAmplitudeMeas_amp
(dBm)
Power MeterAmplitude
Power_meter(dBm)
AmplitudeAccuracy
Error(dB)
Test Limit(dB)
−4 10 2 ±1.13 dB
−9 10 1 ±1.13 dB
−14 10 0.5 ±1.13 dB
−4 20 0.1 ±1.13 dB
−14 20 0.1 ±1.13 dB
−4 30 0.1 ±1.13 dB
−14 30 0.1 ±1.13 dB
26 Chapter 5
Amplitude Accuracy at 50 MHzTesting Preamp Option (P03, P08, P13, P26)
Am
plitu
de A
ccuracy at 50 M
Hz
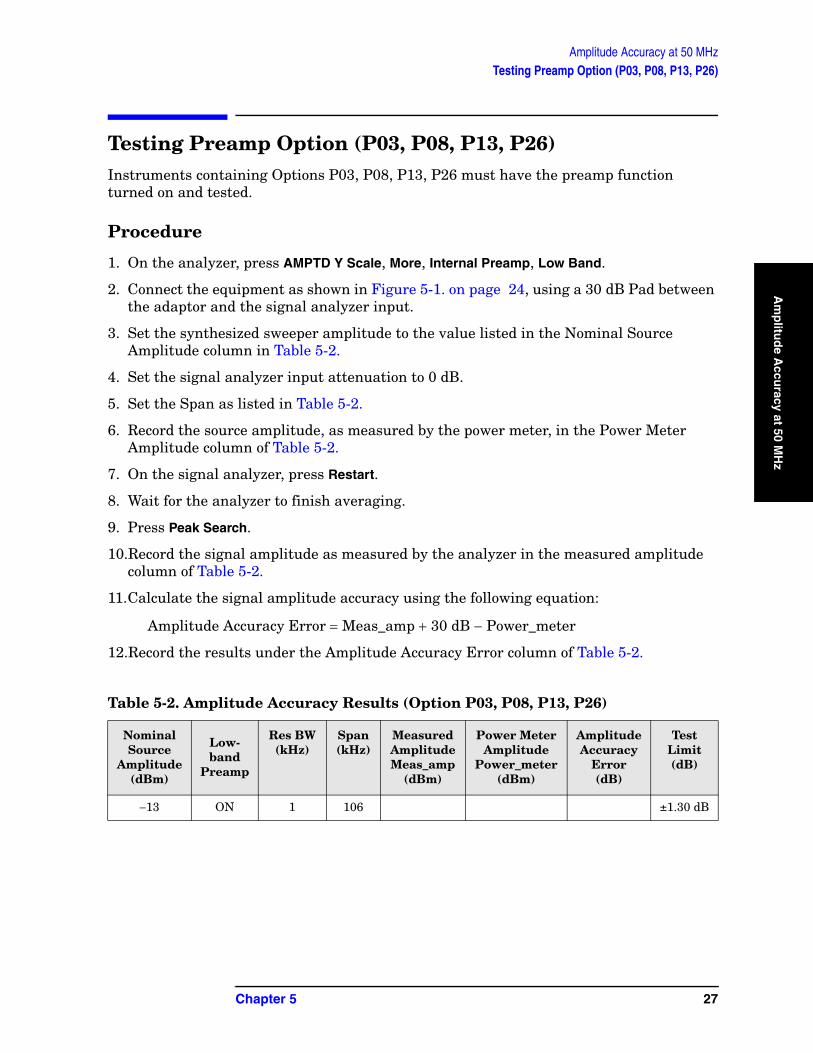
Testing Preamp Option (P03, P08, P13, P26)Instruments containing Options P03, P08, P13, P26 must have the preamp function turned on and tested.
Procedure
1. On the analyzer, press AMPTD Y Scale, More, Internal Preamp, Low Band.
2. Connect the equipment as shown in Figure 5-1. on page 24, using a 30 dB Pad between the adaptor and the signal analyzer input.
3. Set the synthesized sweeper amplitude to the value listed in the Nominal Source Amplitude column in Table 5-2.
4. Set the signal analyzer input attenuation to 0 dB.
5. Set the Span as listed in Table 5-2.
6. Record the source amplitude, as measured by the power meter, in the Power Meter Amplitude column of Table 5-2.
7. On the signal analyzer, press Restart.
8. Wait for the analyzer to finish averaging.
9. Press Peak Search.
10.Record the signal amplitude as measured by the analyzer in the measured amplitude column of Table 5-2.
11.Calculate the signal amplitude accuracy using the following equation:
Amplitude Accuracy Error = Meas_amp + 30 dB − Power_meter
12.Record the results under the Amplitude Accuracy Error column of Table 5-2.
Table 5-2. Amplitude Accuracy Results (Option P03, P08, P13, P26)
NominalSource
Amplitude(dBm)
Low- band
Preamp
Res BW (kHz)
Span (kHz)
MeasuredAmplitudeMeas_amp
(dBm)
Power MeterAmplitude
Power_meter(dBm)
AmplitudeAccuracy
Error(dB)
Test Limit(dB)
−13 ON 1 106 ±1.30 dB
Chapter 5 27
Amplitude Accuracy at 50 MHzTesting Preamp Option (P03, P08, P13, P26)
Am
plit
ud
e A
ccu
racy
at
50 M
Hz
28 Chapter 5
6 Frequency Response (Flatness)
Frequ
ency R
espo
nse (F
latness)
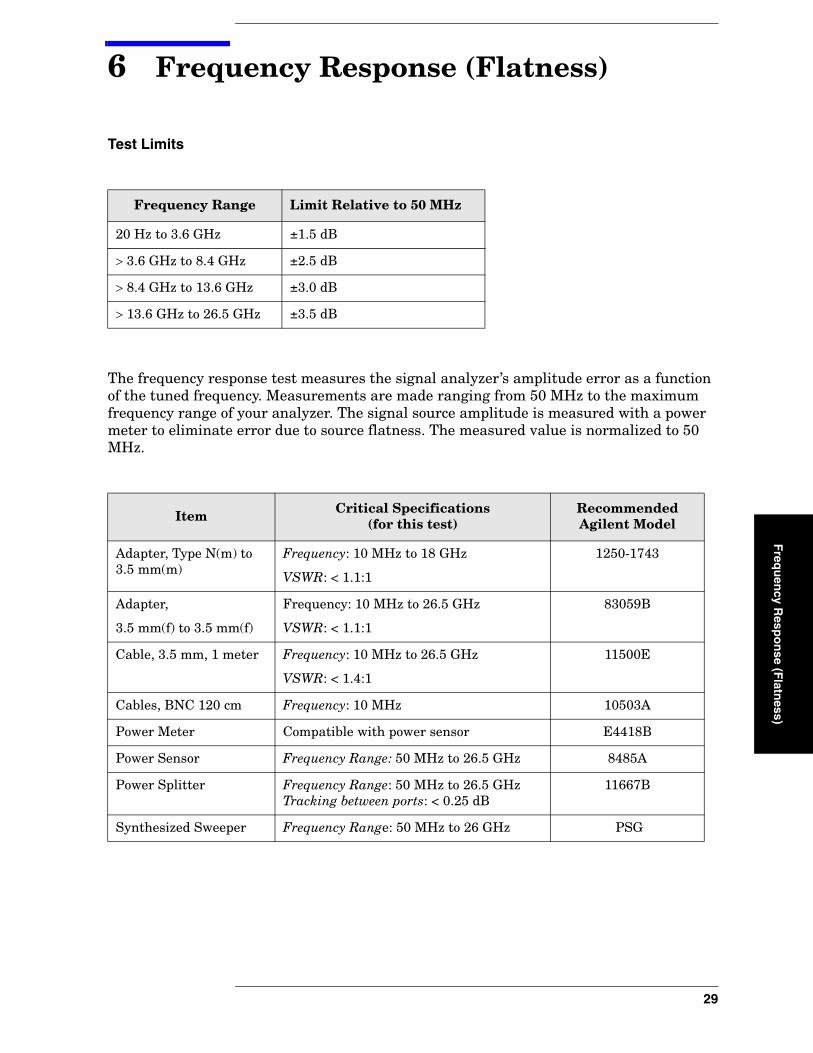
Test Limits
The frequency response test measures the signal analyzer’s amplitude error as a function of the tuned frequency. Measurements are made ranging from 50 MHz to the maximum frequency range of your analyzer. The signal source amplitude is measured with a power meter to eliminate error due to source flatness. The measured value is normalized to 50 MHz.
Frequency Range Limit Relative to 50 MHz
20 Hz to 3.6 GHz ±1.5 dB
> 3.6 GHz to 8.4 GHz ±2.5 dB
> 8.4 GHz to 13.6 GHz ±3.0 dB
> 13.6 GHz to 26.5 GHz ±3.5 dB
Item Critical Specifications(for this test)
Recommended Agilent Model
Adapter, Type N(m) to 3.5 mm(m)
Frequency: 10 MHz to 18 GHz
VSWR: < 1.1:1
1250-1743
Adapter,
3.5 mm(f) to 3.5 mm(f)
Frequency: 10 MHz to 26.5 GHz
VSWR: < 1.1:1
83059B
Cable, 3.5 mm, 1 meter Frequency: 10 MHz to 26.5 GHz
VSWR: < 1.4:1
11500E
Cables, BNC 120 cm Frequency: 10 MHz 10503A
Power Meter Compatible with power sensor E4418B
Power Sensor Frequency Range: 50 MHz to 26.5 GHz 8485A
Power Splitter Frequency Range: 50 MHz to 26.5 GHz Tracking between ports: < 0.25 dB
11667B
Synthesized Sweeper Frequency Range: 50 MHz to 26 GHz PSG
29
Frequency Response (Flatness)F
req
uen
cy R
esp
on
se (
Fla
tnes
s)
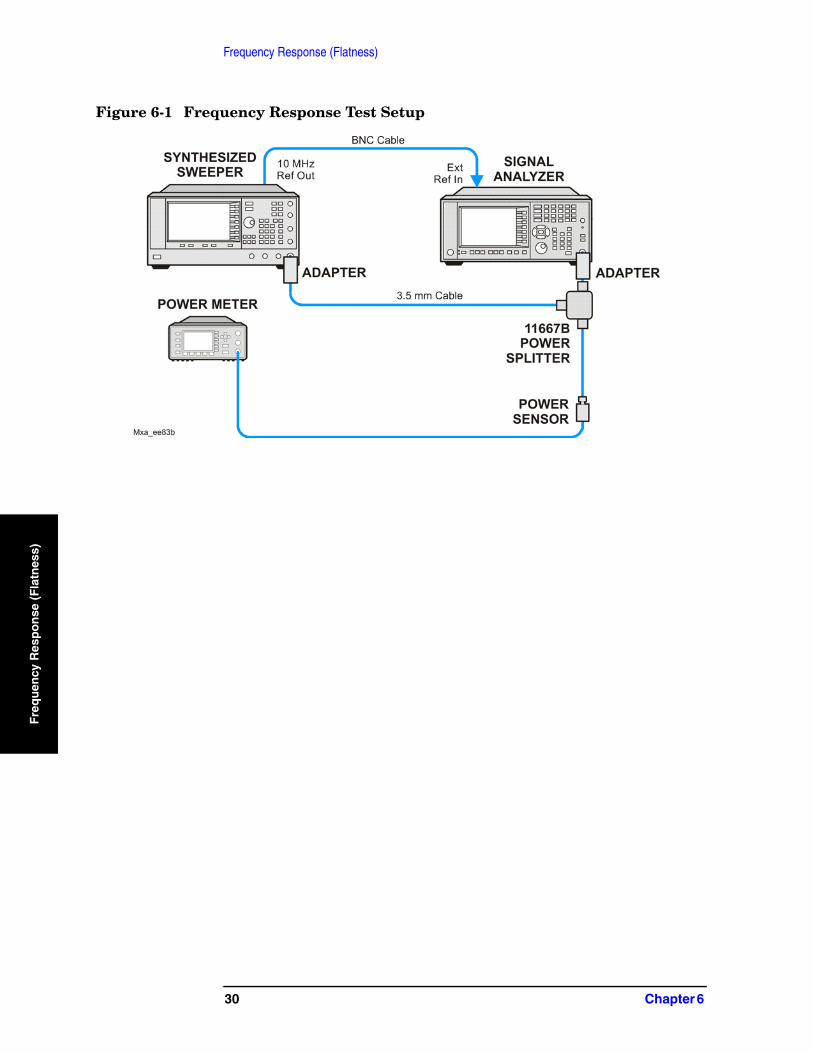
Figure 6-1 Frequency Response Test Setup
30 Chapter 6
Frequency Response (Flatness)Procedure
Freq
uen
cy Resp
on
se (Flatn
ess)
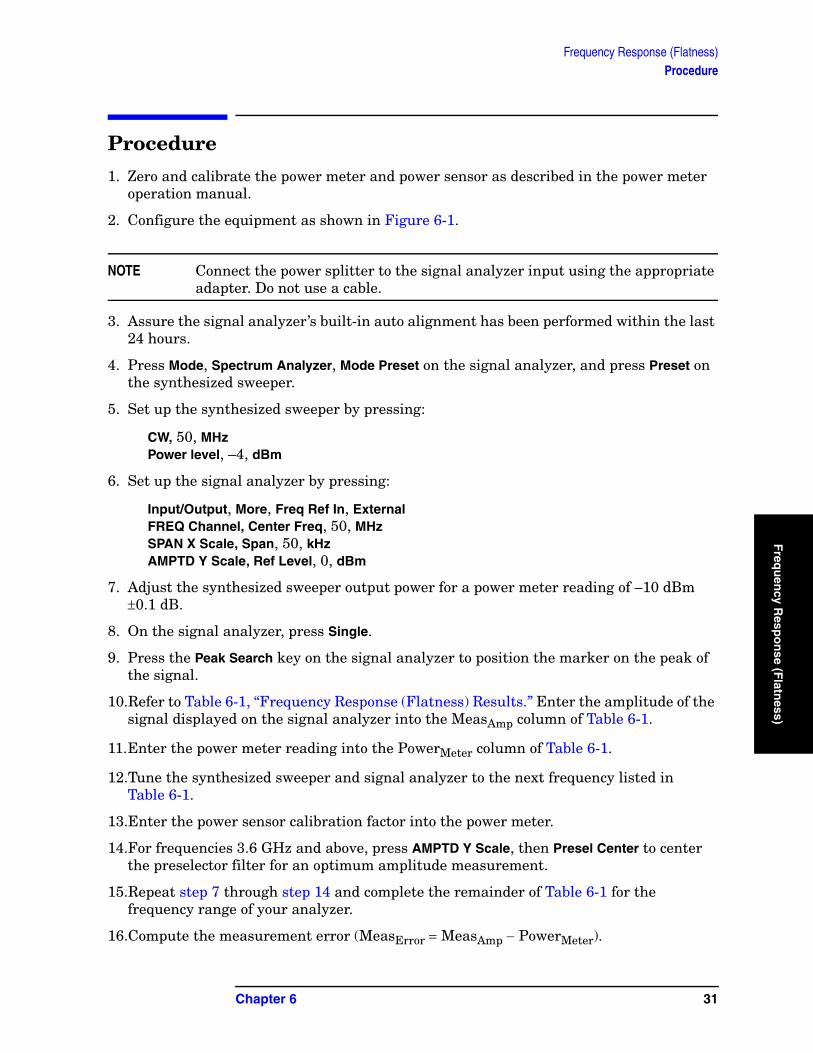
Procedure
1. Zero and calibrate the power meter and power sensor as described in the power meter operation manual.
2. Configure the equipment as shown in Figure 6-1.
NOTE Connect the power splitter to the signal analyzer input using the appropriate adapter. Do not use a cable.
3. Assure the signal analyzer’s built-in auto alignment has been performed within the last 24 hours.
4. Press Mode, Spectrum Analyzer, Mode Preset on the signal analyzer, and press Preset on the synthesized sweeper.
5. Set up the synthesized sweeper by pressing:
CW, 50, MHzPower level, –4, dBm
6. Set up the signal analyzer by pressing:
Input/Output, More, Freq Ref In, ExternalFREQ Channel, Center Freq, 50, MHzSPAN X Scale, Span, 50, kHzAMPTD Y Scale, Ref Level, 0, dBm
7. Adjust the synthesized sweeper output power for a power meter reading of –10 dBm ±0.1 dB.
8. On the signal analyzer, press Single.
9. Press the Peak Search key on the signal analyzer to position the marker on the peak of the signal.
10.Refer to Table 6-1, “Frequency Response (Flatness) Results.” Enter the amplitude of the signal displayed on the signal analyzer into the MeasAmp column of Table 6-1.
11.Enter the power meter reading into the PowerMeter column of Table 6-1.
12.Tune the synthesized sweeper and signal analyzer to the next frequency listed in Table 6-1.
13.Enter the power sensor calibration factor into the power meter.
14.For frequencies 3.6 GHz and above, press AMPTD Y Scale, then Presel Center to center the preselector filter for an optimum amplitude measurement.
15.Repeat step 7 through step 14 and complete the remainder of Table 6-1 for the frequency range of your analyzer.
16.Compute the measurement error (MeasError = MeasAmp − PowerMeter).
Chapter 6 31
Frequency Response (Flatness)Procedure
Fre
qu
ency
Res
po
nse
(F
latn
ess)
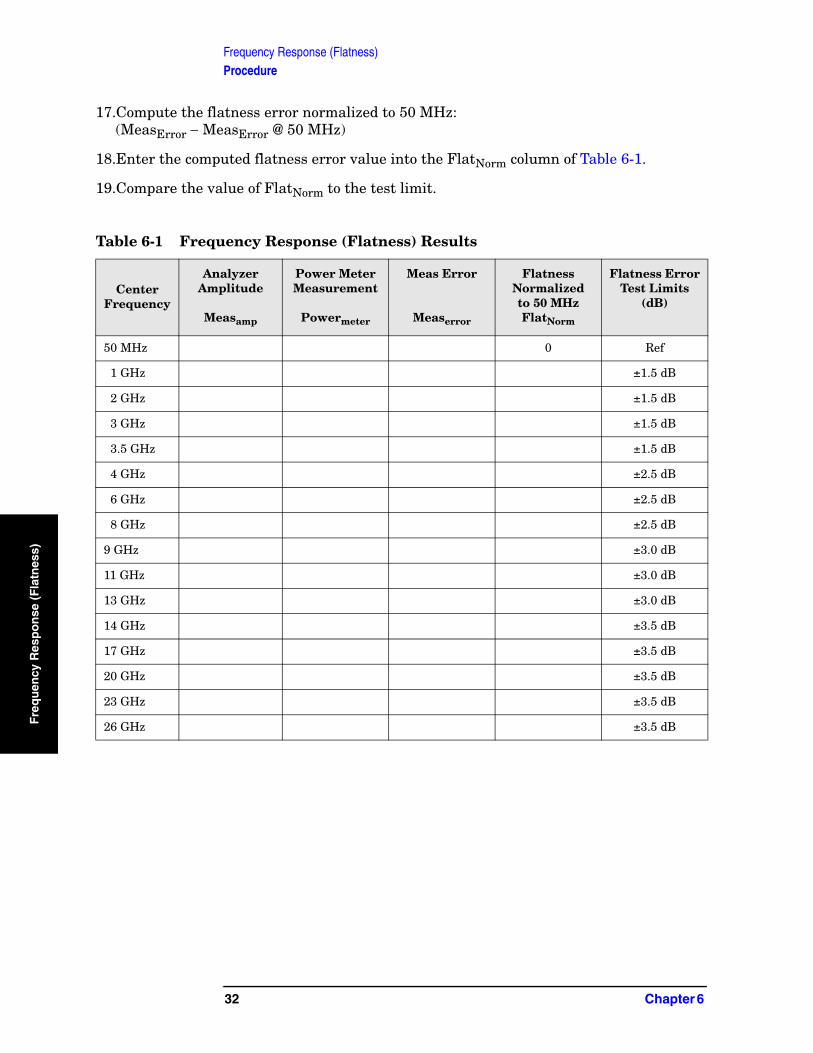
17.Compute the flatness error normalized to 50 MHz:(MeasError − MeasError @ 50 MHz)
18.Enter the computed flatness error value into the FlatNorm column of Table 6-1.
19.Compare the value of FlatNorm to the test limit.
Table 6-1 Frequency Response (Flatness) Results
CenterFrequency
Analyzer Amplitude
Measamp
Power Meter Measurement
Powermeter
Meas Error
Measerror
Flatness Normalizedto 50 MHzFlatNorm
Flatness ErrorTest Limits
(dB)
50 MHz 0 Ref
1 GHz ±1.5 dB
2 GHz ±1.5 dB
3 GHz ±1.5 dB
3.5 GHz ±1.5 dB
4 GHz ±2.5 dB
6 GHz ±2.5 dB
8 GHz ±2.5 dB
9 GHz ±3.0 dB
11 GHz ±3.0 dB
13 GHz ±3.0 dB
14 GHz ±3.5 dB
17 GHz ±3.5 dB
20 GHz ±3.5 dB
23 GHz ±3.5 dB
26 GHz ±3.5 dB
32 Chapter 6
7 Frequency Response (Flatness), Preamp On
Freq
uen
cy Resp
on
se (Flatn
ess)P
reamp
On
Test Limits
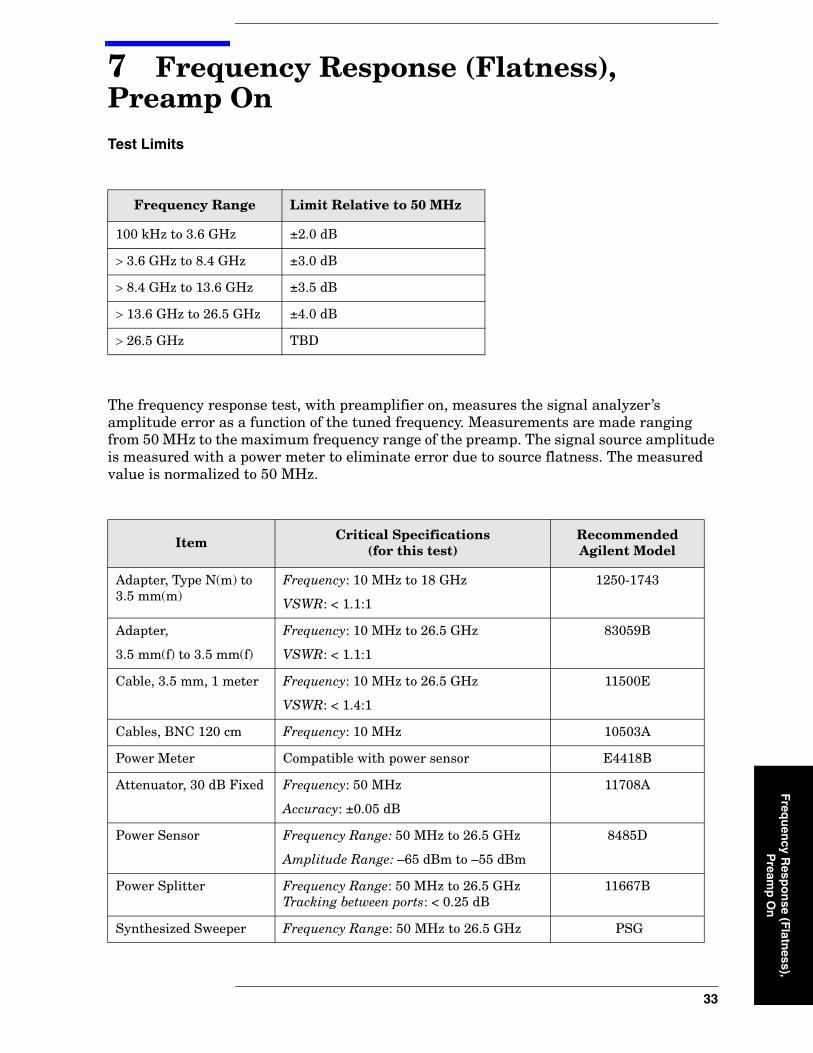
The frequency response test, with preamplifier on, measures the signal analyzer’s amplitude error as a function of the tuned frequency. Measurements are made ranging from 50 MHz to the maximum frequency range of the preamp. The signal source amplitude is measured with a power meter to eliminate error due to source flatness. The measured value is normalized to 50 MHz.
Frequency Range Limit Relative to 50 MHz
100 kHz to 3.6 GHz ±2.0 dB
> 3.6 GHz to 8.4 GHz ±3.0 dB
> 8.4 GHz to 13.6 GHz ±3.5 dB
> 13.6 GHz to 26.5 GHz ±4.0 dB
> 26.5 GHz TBD
Item Critical Specifications(for this test)
Recommended Agilent Model
Adapter, Type N(m) to 3.5 mm(m)
Frequency: 10 MHz to 18 GHz
VSWR: < 1.1:1
1250-1743
Adapter,
3.5 mm(f) to 3.5 mm(f)
Frequency: 10 MHz to 26.5 GHz
VSWR: < 1.1:1
83059B
Cable, 3.5 mm, 1 meter Frequency: 10 MHz to 26.5 GHz
VSWR: < 1.4:1
11500E
Cables, BNC 120 cm Frequency: 10 MHz 10503A
Power Meter Compatible with power sensor E4418B
Attenuator, 30 dB Fixed Frequency: 50 MHz
Accuracy: ±0.05 dB
11708A
Power Sensor Frequency Range: 50 MHz to 26.5 GHz
Amplitude Range: –65 dBm to –55 dBm
8485D
Power Splitter Frequency Range: 50 MHz to 26.5 GHz Tracking between ports: < 0.25 dB
11667B
Synthesized Sweeper Frequency Range: 50 MHz to 26.5 GHz PSG
33
,
Frequency Response (Flatness), Preamp On
Fre
qu
ency
Res
po
nse
(F
latn
ess)
, P
ream
p O
n
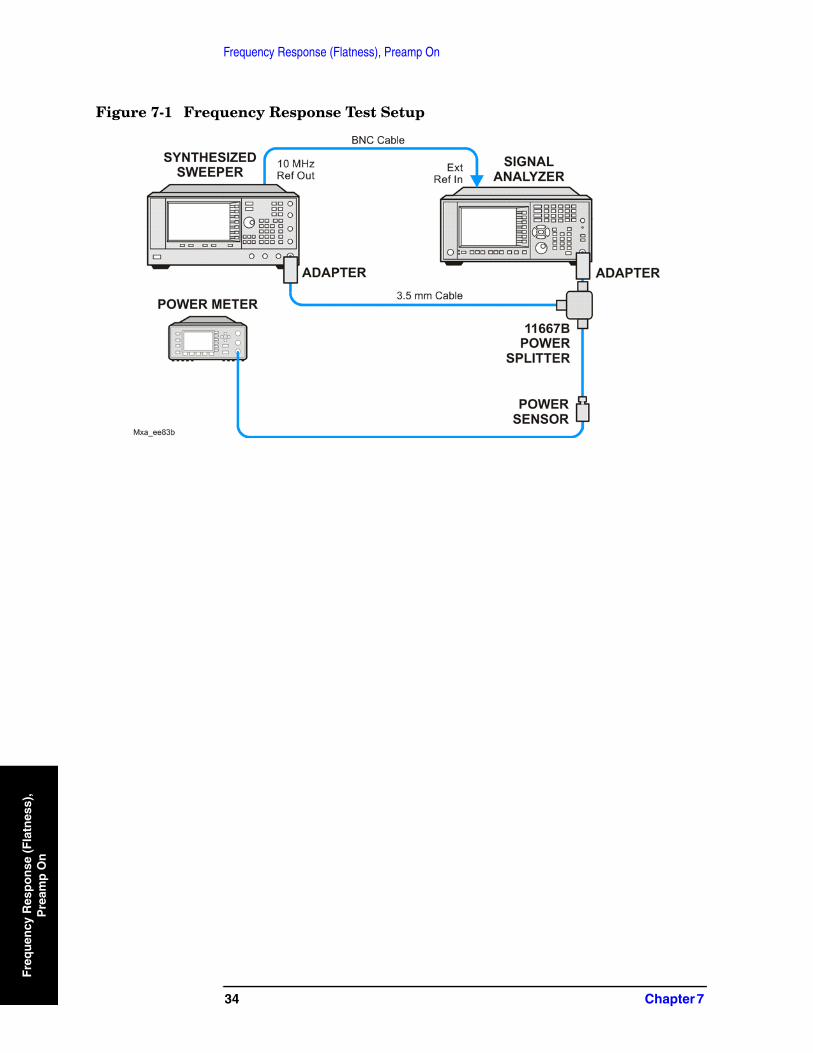
Figure 7-1 Frequency Response Test Setup
34 Chapter 7
Frequency Response (Flatness), Preamp OnProcedure
Freq
uen
cy Resp
on
se (Flatn
ess)P
reamp
On
Procedure
1. Zero and calibrate the power meter and power sensor as described in the power meter operation manual.
2. Configure the equipment as shown in Figure 7-1.
NOTE Connect the power splitter to the signal analyzer input using the appropriate adapter. Do not use a cable.
3. Assure the signal analyzer’s built-in auto alignment has been performed within the last 24 hours.
4. Press Mode, Spectrum Analyzer, Mode Preset on the signal analyzer, and press Preset on the synthesized sweeper.
5. Set up the synthesized sweeper by pressing:
CW, 50, MHzPower level, –54, dBm
6. Set up the signal analyzer by pressing:
Input/Output, More, Freq Ref In, ExternalFREQ Channel, Center Freq, 50, MHzSPAN X Scale, Span, 50, kHzAMPTD Y Scale, More, Internal Preamp, Full RangeAMPTD Y Scale, Attenuation, Mech Atten, 0, dBAMPTD Y Scale, Ref Level, –55, dBm
7. Adjust the synthesized sweeper output power for a power meter reading of –60 dBm ±0.1 dB.
8. On the signal analyzer, press Single.
9. Press the Peak Search key on the signal analyzer to position the marker on the peak of the signal.
10.Refer to Table 7-1, “Frequency Response (Flatness) Results.” Enter the amplitude of the signal displayed on the signal analyzer into the MeasAmp column of Table 7-1.
11.Enter the power meter reading into the PowerMeter column of Table 7-1.
12.Tune the synthesized sweeper and signal analyzer to the next frequency listed in Table 7-1.
13.Enter the power sensor calibration factor into the power meter.
14.For frequencies 3.6 GHz and above, press AMPTD Y Scale, then Presel Center to center the preselector filter for an optimum amplitude measurement.
15.Repeat step 7 through step 14 and complete the remainder of Table 7-1 for the frequency range of your preamp.
Chapter 7 35
,
Frequency Response (Flatness), Preamp OnProcedure
Fre
qu
ency
Res
po
nse
(F
latn
ess)
, P
ream
p O
n
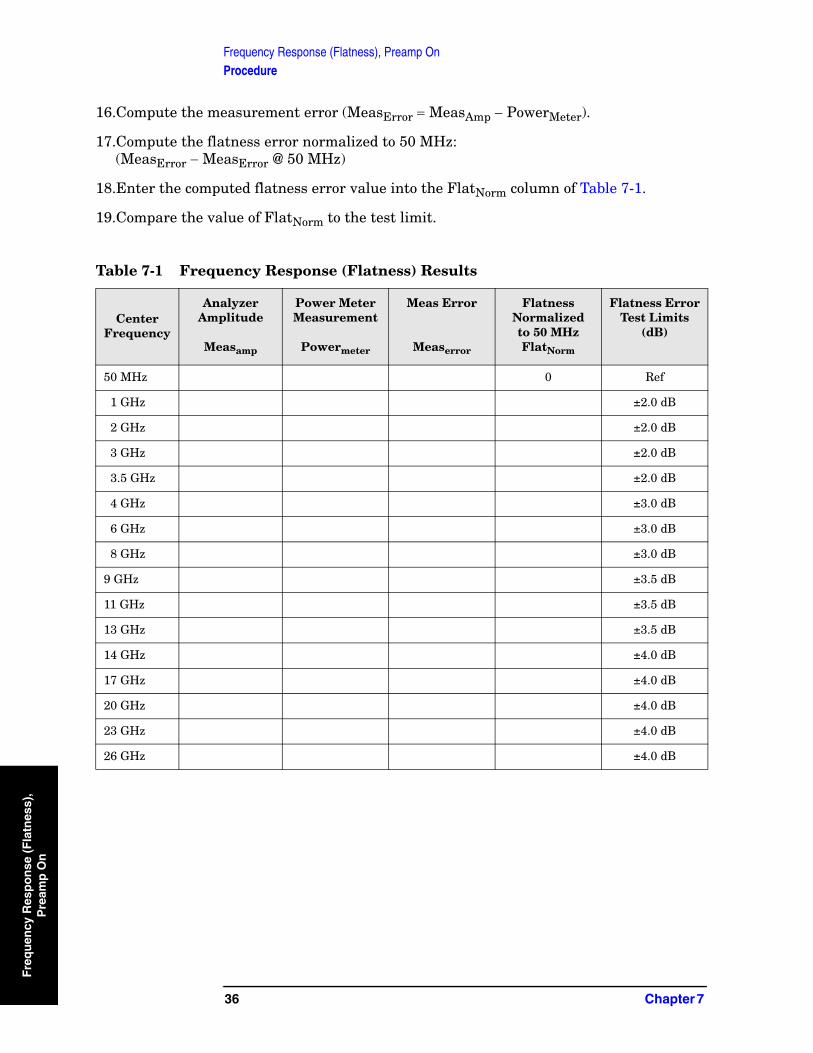
16.Compute the measurement error (MeasError = MeasAmp − PowerMeter).
17.Compute the flatness error normalized to 50 MHz:(MeasError − MeasError @ 50 MHz)
18.Enter the computed flatness error value into the FlatNorm column of Table 7-1.
19.Compare the value of FlatNorm to the test limit.
Table 7-1 Frequency Response (Flatness) Results
CenterFrequency
Analyzer Amplitude
Measamp
Power Meter Measurement
Powermeter
Meas Error
Measerror
Flatness Normalizedto 50 MHzFlatNorm
Flatness ErrorTest Limits
(dB)
50 MHz 0 Ref
1 GHz ±2.0 dB
2 GHz ±2.0 dB
3 GHz ±2.0 dB
3.5 GHz ±2.0 dB
4 GHz ±3.0 dB
6 GHz ±3.0 dB
8 GHz ±3.0 dB
9 GHz ±3.5 dB
11 GHz ±3.5 dB
13 GHz ±3.5 dB
14 GHz ±4.0 dB
17 GHz ±4.0 dB
20 GHz ±4.0 dB
23 GHz ±4.0 dB
26 GHz ±4.0 dB
36 Chapter 7
Scale
8 Scale Fidelity
Fidelity
Test Limits
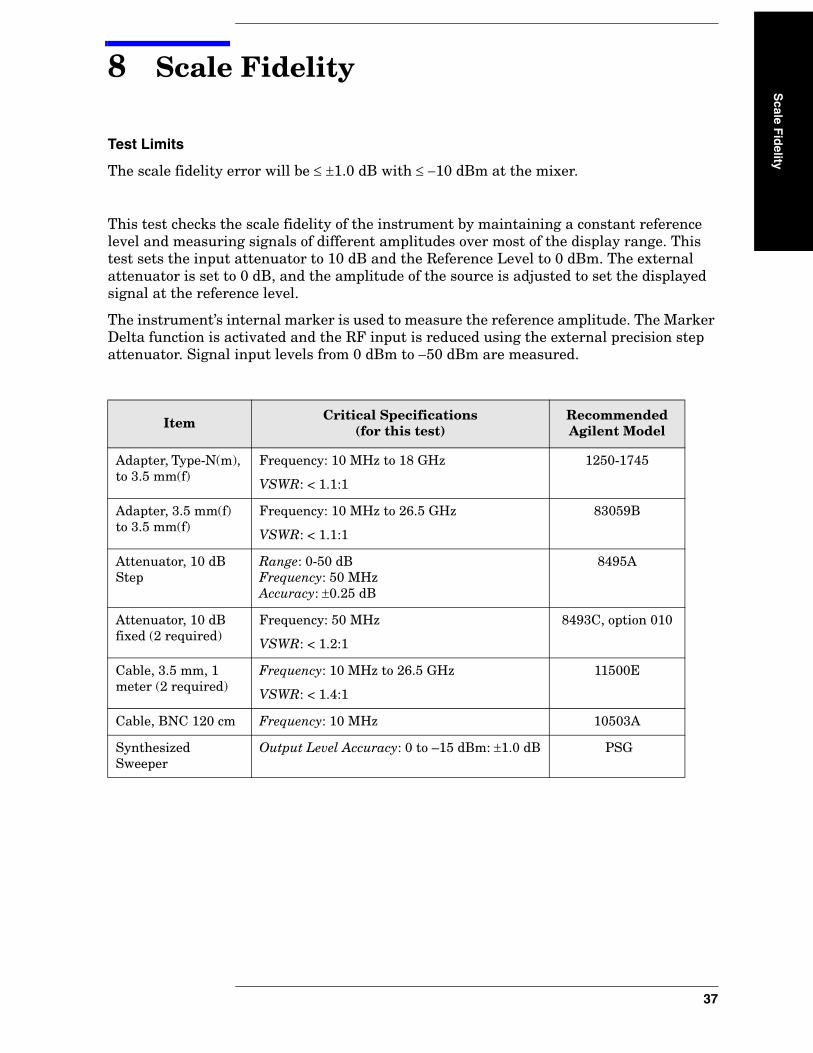
The scale fidelity error will be ≤ ±1.0 dB with ≤ −10 dBm at the mixer.
This test checks the scale fidelity of the instrument by maintaining a constant reference level and measuring signals of different amplitudes over most of the display range. This test sets the input attenuator to 10 dB and the Reference Level to 0 dBm. The external attenuator is set to 0 dB, and the amplitude of the source is adjusted to set the displayed signal at the reference level.
The instrument’s internal marker is used to measure the reference amplitude. The Marker Delta function is activated and the RF input is reduced using the external precision step attenuator. Signal input levels from 0 dBm to −50 dBm are measured.
Item Critical Specifications(for this test)
Recommended Agilent Model
Adapter, Type-N(m), to 3.5 mm(f)
Frequency: 10 MHz to 18 GHz
VSWR: < 1.1:1
1250-1745
Adapter, 3.5 mm(f) to 3.5 mm(f)
Frequency: 10 MHz to 26.5 GHz
VSWR: < 1.1:1
83059B
Attenuator, 10 dB Step
Range: 0-50 dBFrequency: 50 MHzAccuracy: ±0.25 dB
8495A
Attenuator, 10 dB fixed (2 required)
Frequency: 50 MHz
VSWR: < 1.2:1
8493C, option 010
Cable, 3.5 mm, 1 meter (2 required)
Frequency: 10 MHz to 26.5 GHz
VSWR: < 1.4:1
11500E
Cable, BNC 120 cm Frequency: 10 MHz 10503A
Synthesized Sweeper
Output Level Accuracy: 0 to –15 dBm: ±1.0 dB PSG
37
Scale FidelityS
cale
Fid
elit
y
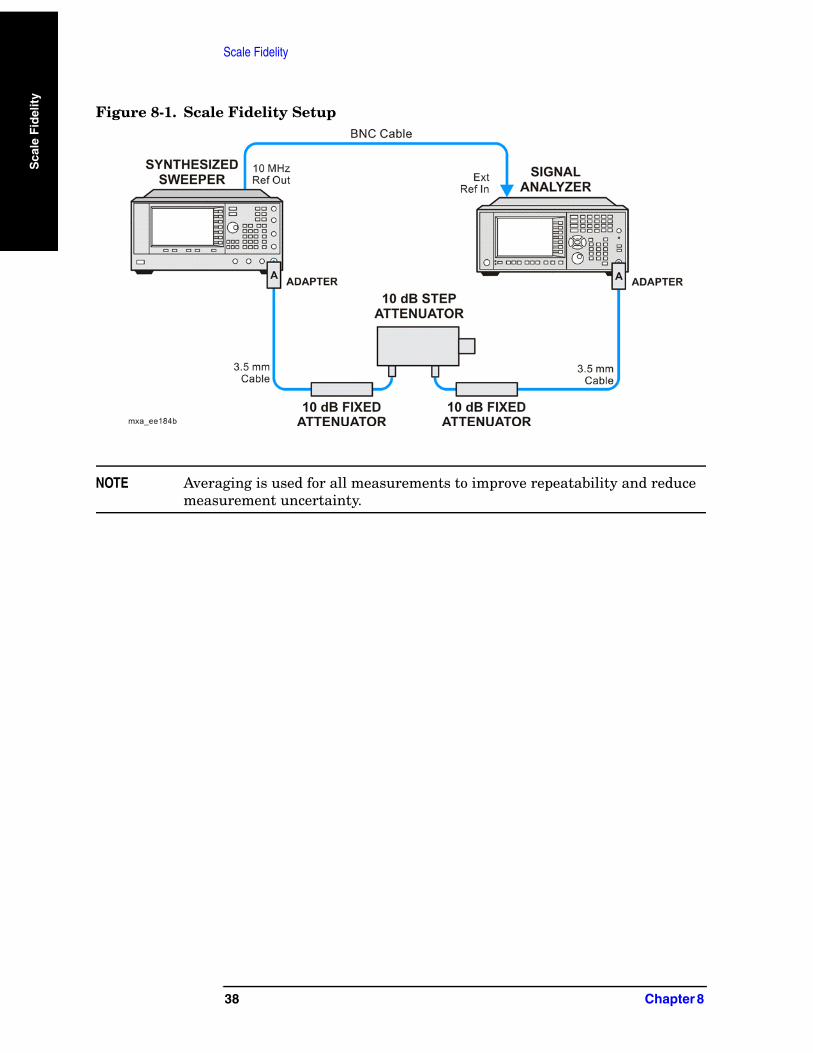
Figure 8-1. Scale Fidelity Setup
NOTE Averaging is used for all measurements to improve repeatability and reduce measurement uncertainty.
38 Chapter 8
Scale FidelityProcedure
Scale F
idelity
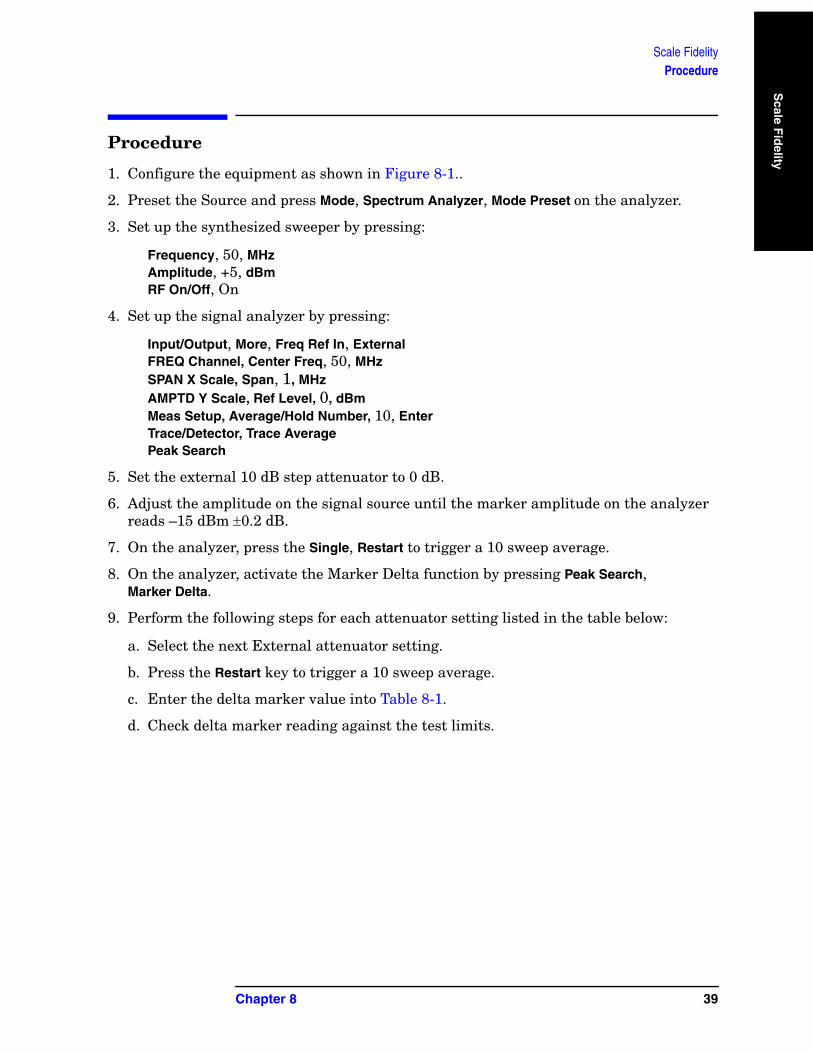
Procedure
1. Configure the equipment as shown in Figure 8-1..
2. Preset the Source and press Mode, Spectrum Analyzer, Mode Preset on the analyzer.
3. Set up the synthesized sweeper by pressing:
Frequency, 50, MHzAmplitude, +5, dBmRF On/Off, On
4. Set up the signal analyzer by pressing:
Input/Output, More, Freq Ref In, ExternalFREQ Channel, Center Freq, 50, MHzSPAN X Scale, Span, 1, MHzAMPTD Y Scale, Ref Level, 0, dBmMeas Setup, Average/Hold Number, 10, EnterTrace/Detector, Trace AveragePeak Search
5. Set the external 10 dB step attenuator to 0 dB.
6. Adjust the amplitude on the signal source until the marker amplitude on the analyzer reads –15 dBm ±0.2 dB.
7. On the analyzer, press the Single, Restart to trigger a 10 sweep average.
8. On the analyzer, activate the Marker Delta function by pressing Peak Search, Marker Delta.
9. Perform the following steps for each attenuator setting listed in the table below:
a. Select the next External attenuator setting.
b. Press the Restart key to trigger a 10 sweep average.
c. Enter the delta marker value into Table 8-1.
d. Check delta marker reading against the test limits.
Chapter 8 39
Scale FidelityProcedure
Sca
le F
idel
ity
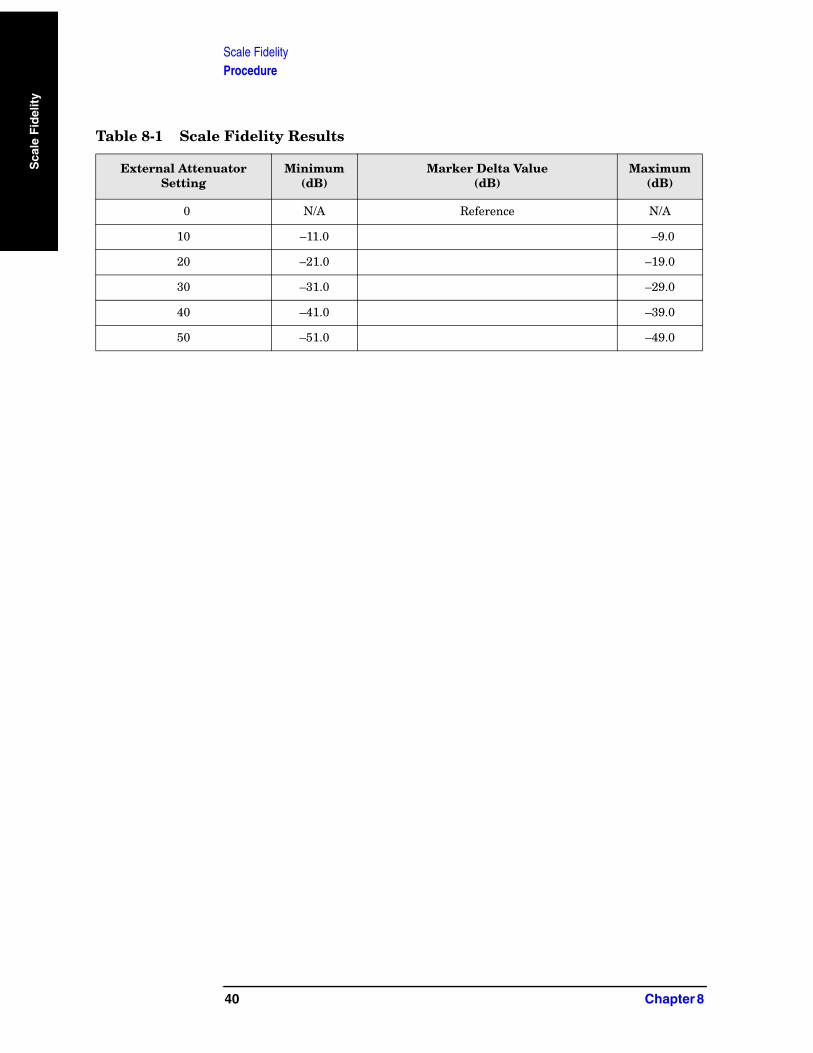
Table 8-1 Scale Fidelity Results
External Attenuator Setting
Minimum(dB)
Marker Delta Value (dB)
Maximum (dB)
0 N/A Reference N/A
10 –11.0 –9.0
20 –21.0 –19.0
30 –31.0 –29.0
40 –41.0 –39.0
50 –51.0 –49.0
40 Chapter 8
9 BBIQ Input Frequency Response (Option BBA only)
BB
IQ In
pu
t Freq
uen
cy Resp
on
se (O
ptio
n B
BA
on
ly)
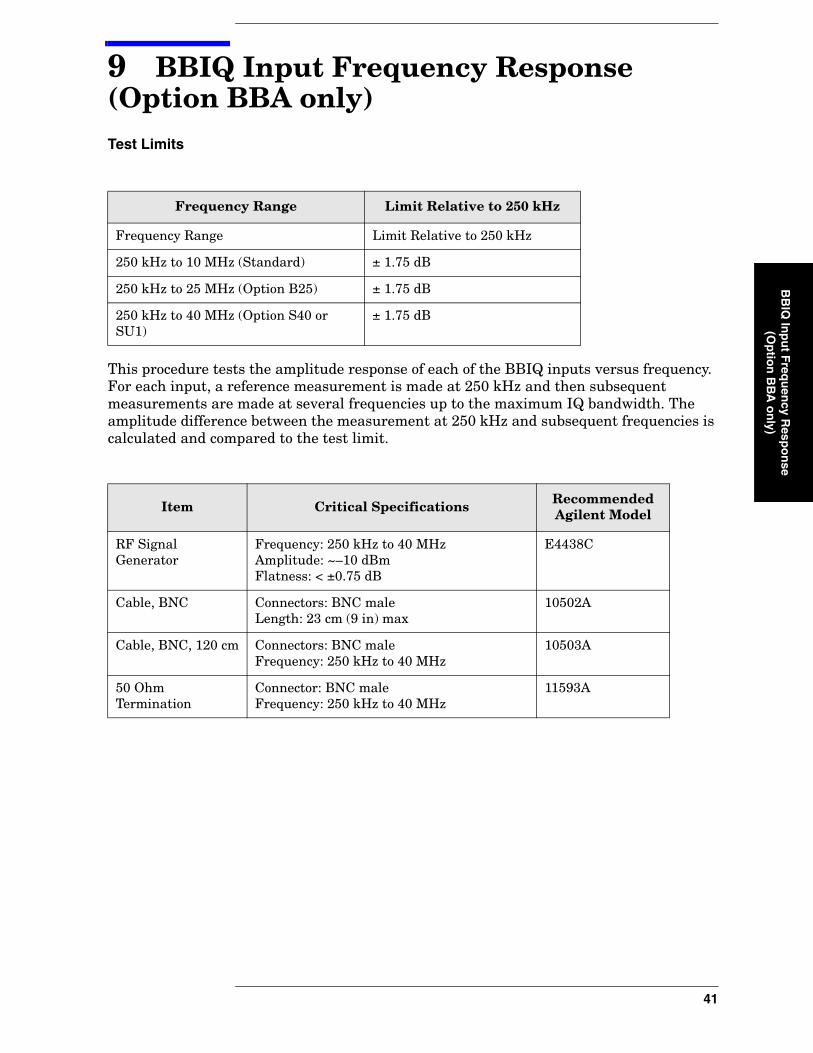
Test Limits
This procedure tests the amplitude response of each of the BBIQ inputs versus frequency. For each input, a reference measurement is made at 250 kHz and then subsequent measurements are made at several frequencies up to the maximum IQ bandwidth. The amplitude difference between the measurement at 250 kHz and subsequent frequencies is calculated and compared to the test limit.
Frequency Range Limit Relative to 250 kHz
Frequency Range Limit Relative to 250 kHz
250 kHz to 10 MHz (Standard) ± 1.75 dB
250 kHz to 25 MHz (Option B25) ± 1.75 dB
250 kHz to 40 MHz (Option S40 or SU1)
± 1.75 dB
Item Critical Specifications Recommended Agilent Model
RF Signal Generator
Frequency: 250 kHz to 40 MHzAmplitude: ~–10 dBmFlatness: < ±0.75 dB
E4438C
Cable, BNC Connectors: BNC maleLength: 23 cm (9 in) max
10502A
Cable, BNC, 120 cm Connectors: BNC maleFrequency: 250 kHz to 40 MHz
10503A
50 Ohm Termination
Connector: BNC maleFrequency: 250 kHz to 40 MHz
11593A
41
BBIQ Input Frequency Response (Option BBA only)
BB
IQ In
pu
t F
req
uen
cy R
esp
on
se
(Op
tio
n B
BA
on
ly)
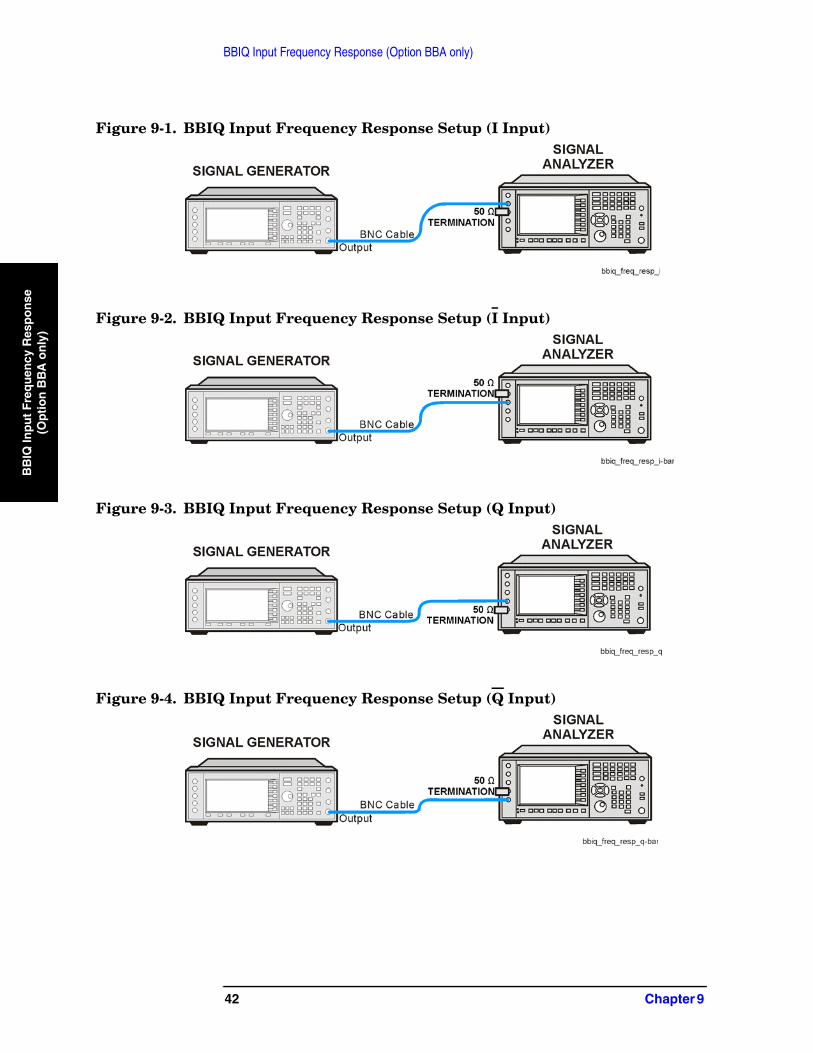
Figure 9-1. BBIQ Input Frequency Response Setup (I Input)
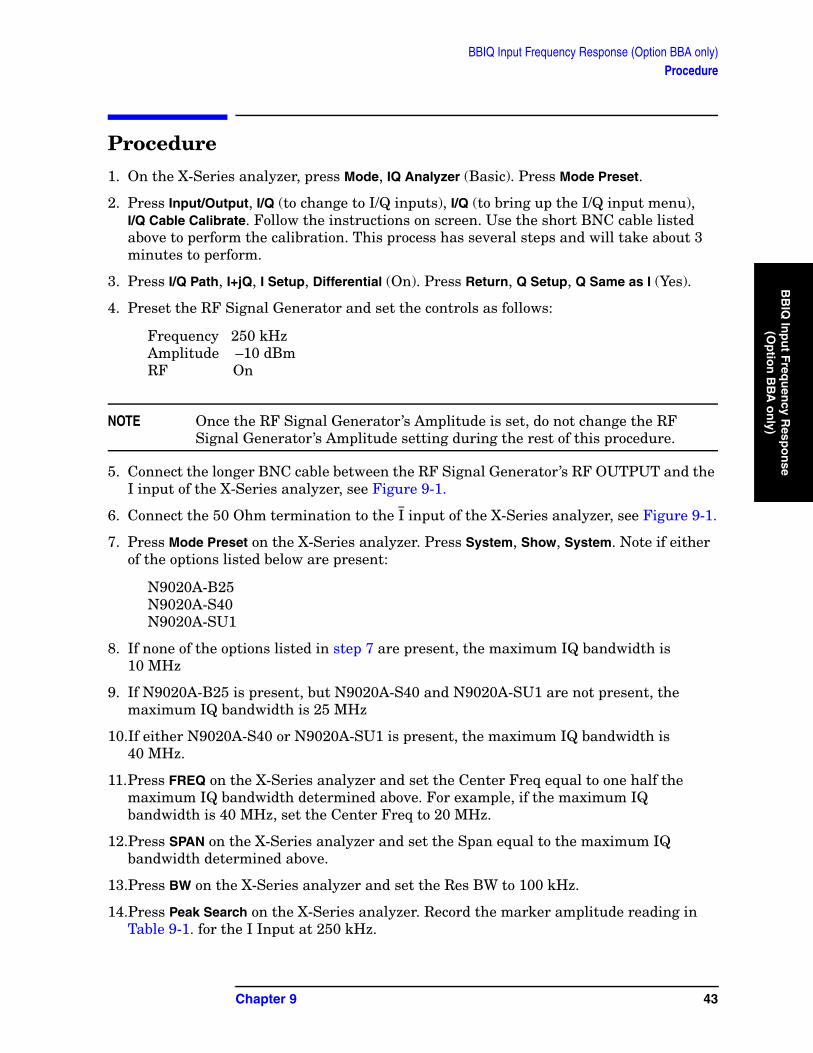
Figure 9-2. BBIQ Input Frequency Response Setup (I Input)
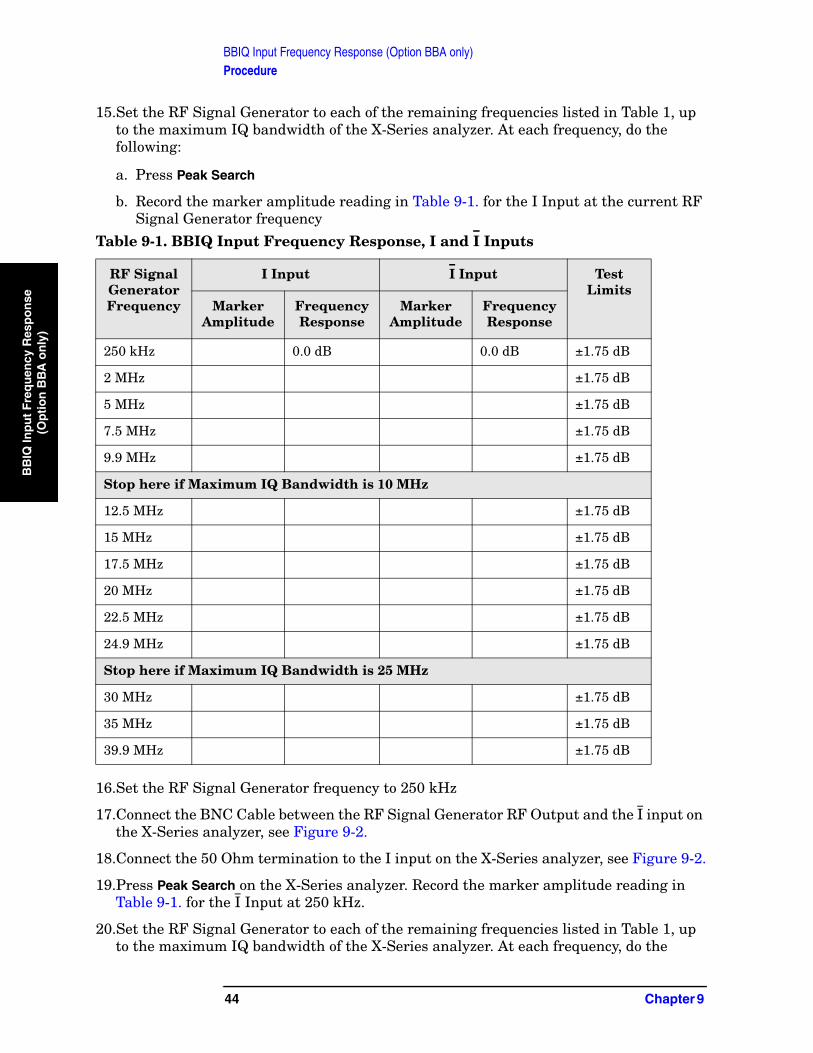
Figure 9-3. BBIQ Input Frequency Response Setup (Q Input)
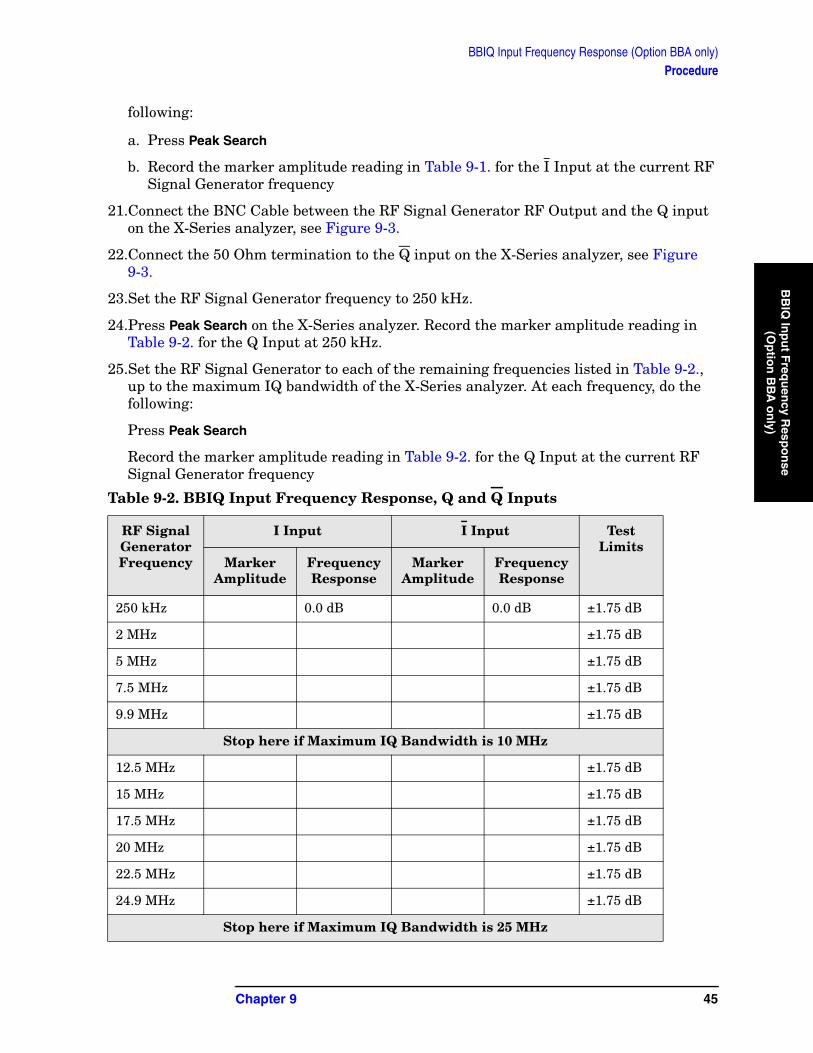
Figure 9-4. BBIQ Input Frequency Response Setup (Q Input)
42 Chapter 9
BBIQ Input Frequency Response (Option BBA only)Procedure
BB
IQ In
pu
t Freq
uen
cy Resp
on
se (O
ptio
n B
BA
on
ly)
Procedure
1. On the X-Series analyzer, press Mode, IQ Analyzer (Basic). Press Mode Preset.
2. Press Input/Output, I/Q (to change to I/Q inputs), I/Q (to bring up the I/Q input menu), I/Q Cable Calibrate. Follow the instructions on screen. Use the short BNC cable listed above to perform the calibration. This process has several steps and will take about 3 minutes to perform.
3. Press I/Q Path, I+jQ, I Setup, Differential (On). Press Return, Q Setup, Q Same as I (Yes).
4. Preset the RF Signal Generator and set the controls as follows:
Frequency 250 kHzAmplitude –10 dBmRF On
NOTE Once the RF Signal Generator’s Amplitude is set, do not change the RF Signal Generator’s Amplitude setting during the rest of this procedure.
5. Connect the longer BNC cable between the RF Signal Generator’s RF OUTPUT and the I input of the X-Series analyzer, see Figure 9-1.
6. Connect the 50 Ohm termination to the I input of the X-Series analyzer, see Figure 9-1.
7. Press Mode Preset on the X-Series analyzer. Press System, Show, System. Note if either of the options listed below are present:
N9020A-B25N9020A-S40N9020A-SU1
8. If none of the options listed in step 7 are present, the maximum IQ bandwidth is 10 MHz
9. If N9020A-B25 is present, but N9020A-S40 and N9020A-SU1 are not present, the maximum IQ bandwidth is 25 MHz
10.If either N9020A-S40 or N9020A-SU1 is present, the maximum IQ bandwidth is 40 MHz.
11.Press FREQ on the X-Series analyzer and set the Center Freq equal to one half the maximum IQ bandwidth determined above. For example, if the maximum IQ bandwidth is 40 MHz, set the Center Freq to 20 MHz.
12.Press SPAN on the X-Series analyzer and set the Span equal to the maximum IQ bandwidth determined above.
13.Press BW on the X-Series analyzer and set the Res BW to 100 kHz.
14.Press Peak Search on the X-Series analyzer. Record the marker amplitude reading in Table 9-1. for the I Input at 250 kHz.
Chapter 9 43
BBIQ Input Frequency Response (Option BBA only)Procedure
BB
IQ In
pu
t F
req
uen
cy R
esp
on
se
(Op
tio
n B
BA
on
ly)
15.Set the RF Signal Generator to each of the remaining frequencies listed in Table 1, up to the maximum IQ bandwidth of the X-Series analyzer. At each frequency, do the following:
a. Press Peak Search
b. Record the marker amplitude reading in Table 9-1. for the I Input at the current RF Signal Generator frequency
16.Set the RF Signal Generator frequency to 250 kHz
17.Connect the BNC Cable between the RF Signal Generator RF Output and the I input on the X-Series analyzer, see Figure 9-2.
18.Connect the 50 Ohm termination to the I input on the X-Series analyzer, see Figure 9-2.
19.Press Peak Search on the X-Series analyzer. Record the marker amplitude reading in Table 9-1. for the I Input at 250 kHz.
20.Set the RF Signal Generator to each of the remaining frequencies listed in Table 1, up to the maximum IQ bandwidth of the X-Series analyzer. At each frequency, do the
Table 9-1. BBIQ Input Frequency Response, I and I Inputs
RF Signal Generator Frequency
I Input I Input Test Limits
Marker Amplitude
Frequency Response
Marker Amplitude
Frequency Response
250 kHz 0.0 dB 0.0 dB ±1.75 dB
2 MHz ±1.75 dB
5 MHz ±1.75 dB
7.5 MHz ±1.75 dB
9.9 MHz ±1.75 dB
Stop here if Maximum IQ Bandwidth is 10 MHz
12.5 MHz ±1.75 dB
15 MHz ±1.75 dB
17.5 MHz ±1.75 dB
20 MHz ±1.75 dB
22.5 MHz ±1.75 dB
24.9 MHz ±1.75 dB
Stop here if Maximum IQ Bandwidth is 25 MHz
30 MHz ±1.75 dB
35 MHz ±1.75 dB
39.9 MHz ±1.75 dB
44 Chapter 9
BBIQ Input Frequency Response (Option BBA only)Procedure
BB
IQ In
pu
t Freq
uen
cy Resp
on
se (O
ptio
n B
BA
on
ly)
following:
a. Press Peak Search
b. Record the marker amplitude reading in Table 9-1. for the I Input at the current RF Signal Generator frequency
21.Connect the BNC Cable between the RF Signal Generator RF Output and the Q input on the X-Series analyzer, see Figure 9-3.
22.Connect the 50 Ohm termination to the Q input on the X-Series analyzer, see Figure 9-3.
23.Set the RF Signal Generator frequency to 250 kHz.
24.Press Peak Search on the X-Series analyzer. Record the marker amplitude reading in Table 9-2. for the Q Input at 250 kHz.
25.Set the RF Signal Generator to each of the remaining frequencies listed in Table 9-2., up to the maximum IQ bandwidth of the X-Series analyzer. At each frequency, do the following:
Press Peak Search
Record the marker amplitude reading in Table 9-2. for the Q Input at the current RF Signal Generator frequency
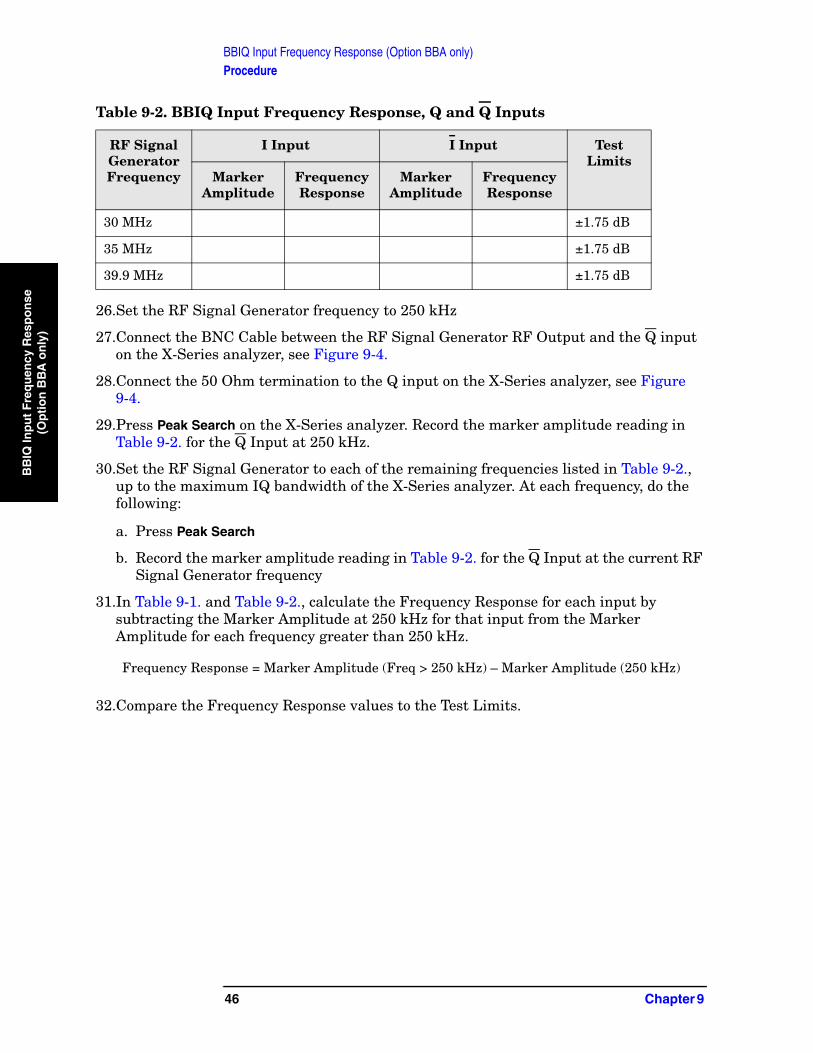
Table 9-2. BBIQ Input Frequency Response, Q and Q Inputs
RF Signal Generator Frequency
I Input I Input Test Limits
Marker Amplitude
Frequency Response
Marker Amplitude
Frequency Response
250 kHz 0.0 dB 0.0 dB ±1.75 dB
2 MHz ±1.75 dB
5 MHz ±1.75 dB
7.5 MHz ±1.75 dB
9.9 MHz ±1.75 dB
Stop here if Maximum IQ Bandwidth is 10 MHz
12.5 MHz ±1.75 dB
15 MHz ±1.75 dB
17.5 MHz ±1.75 dB
20 MHz ±1.75 dB
22.5 MHz ±1.75 dB
24.9 MHz ±1.75 dB
Stop here if Maximum IQ Bandwidth is 25 MHz
Chapter 9 45
BBIQ Input Frequency Response (Option BBA only)Procedure
BB
IQ In
pu
t F
req
uen
cy R
esp
on
se
(Op
tio
n B
BA
on
ly)
26.Set the RF Signal Generator frequency to 250 kHz
27.Connect the BNC Cable between the RF Signal Generator RF Output and the Q input on the X-Series analyzer, see Figure 9-4.
28.Connect the 50 Ohm termination to the Q input on the X-Series analyzer, see Figure 9-4.
29.Press Peak Search on the X-Series analyzer. Record the marker amplitude reading in Table 9-2. for the Q Input at 250 kHz.
30.Set the RF Signal Generator to each of the remaining frequencies listed in Table 9-2., up to the maximum IQ bandwidth of the X-Series analyzer. At each frequency, do the following:
a. Press Peak Search
b. Record the marker amplitude reading in Table 9-2. for the Q Input at the current RF Signal Generator frequency
31.In Table 9-1. and Table 9-2., calculate the Frequency Response for each input by subtracting the Marker Amplitude at 250 kHz for that input from the Marker Amplitude for each frequency greater than 250 kHz.
32.Compare the Frequency Response values to the Test Limits.
30 MHz ±1.75 dB
35 MHz ±1.75 dB
39.9 MHz ±1.75 dB
Frequency Response = Marker Amplitude (Freq > 250 kHz) – Marker Amplitude (250 kHz)
Table 9-2. BBIQ Input Frequency Response, Q and Q Inputs
RF Signal Generator Frequency
I Input I Input Test Limits
Marker Amplitude
Frequency Response
Marker Amplitude
Frequency Response
46 Chapter 9
Index
Ind
ex
AAgilent Technologies URL, 2amplitude accuracy test, 23
option 1DS, 27amplitude linearity test, 37
BBBIQ frequency response, 41
DDANL test, 13displayed average noise level. See
DANL, 13
Eequipment
functional tests, 9warm-up time, 8
Ffrequency readout accuracy test,
17frequency response
(flatness) test, 29BBIQ, 41
frequency response (flatness) testpreamp on, 33
functional testingperformance verification, 6
functional testsbefore performing, 8equipment list, 9introduction, 5vs performance verification
tests, 6warm-up time, 8See also individual functional
tests, 5
Pperformance verification tests vs
functional tests, 6
Ssecond harmonic distortion test,
19
Ttests. See functional tests
UURL (Agilent Technologies), 2
URL (Agilent Technologies), 2
Index 47
Index
Ind
ex
48 Index
Recommended