INTERNATIONAL JOURNAL ON SMART SENSING AND INTELLIGENT SYSTEMS VOL.10, NO.3, SEPTEMBER 2017
696
INTELLIGENT ENVIRONMENTAL SENSING WITH
AN UNMANNED AERIAL SYSTEM IN A WIRELESS
SENSOR NETWORK
Ching-Ju Chen1, Jou-An Chen2 and Yueh-Min Huang2
1Department of Engineering & Management of Advanced Technology, Chang Jung Christian
University, 396 Chang Jung Rd., Sec.1, Kway Jen, Tainan 711, Taiwan, ROC 2Department of Engineering Science, National Cheng Kung University, No. 1, Ta-Hsueh
Road, Tainan 701, Taiwan, ROC
Emails: [email protected], [email protected]
Submitted: May 28, 2017 Accepted: July 28, 2017 Published: Sep. 1, 2017
Abstract - This paper proposes a novel environmental monitoring mechanism to integrate recently-
established development of an Unmanned Aerial System (UAS) with WSNs for remote monitoring.
The high mobility of UASs can solve the limitations associated with using WSNs in hazardous areas.
In this paper, the WSN node, the Wireless Environmental Monitoring Station (WEMS), is based on
ZigBee protocol for long-duration monitoring. Furthermore, to ensure the integrity of collected
environmental data, an algorithm is designed in WEMS for verification. Finally, a detailed analysis
of packet transmission efficiency based on ranges of flight distance is proposed to examine the effect
of environmental monitoring.
Index terms: Wireless Sensor Networks, Unmanned Aerial System, ZigBee, Remote monitoring, Remote
Sensing, Data collection

Ching-Ju Chen, Jou-An Chen and Yueh-Min Huang, INTELLIGENT ENVIRONMENTAL SENSING WITH AN UNMANNED AERIAL SYSTEM IN A WIRELESS SENSOR NETWORK
697
I. INTRODUCTION
Wireless Sensor Networks(WSNs) have been an active research topic for a few decades [1], but
have currently become of importance to the broader application of sensor data collection as
well as to society in general. In recent years, climate change, intensive farming, air pollution,
and so on, have become environmental issues that heavily concern human beings [2]. Currently,
WSNs consist of autonomous devices that are used to monitor environmental data and
environmental sensor data transmitted through network protocols such as Wi-Fi, Bluetooth, and
ZigBee.
With the development of technology and the miniaturization of sensor devices shown in Figure
1, approaches are being adopted for the collection of environmental information such as
temperature, pressure, and pollutants at different locations. These data from the environment
can be valuable, especially when they are obtained in large amounts or analyzed over time.
Figure 1. Environmental sensors
INTERNATIONAL JOURNAL ON SMART SENSING AND INTELLIGENT SYSTEMS VOL.10, NO.3, SEPTEMBER 2017
698
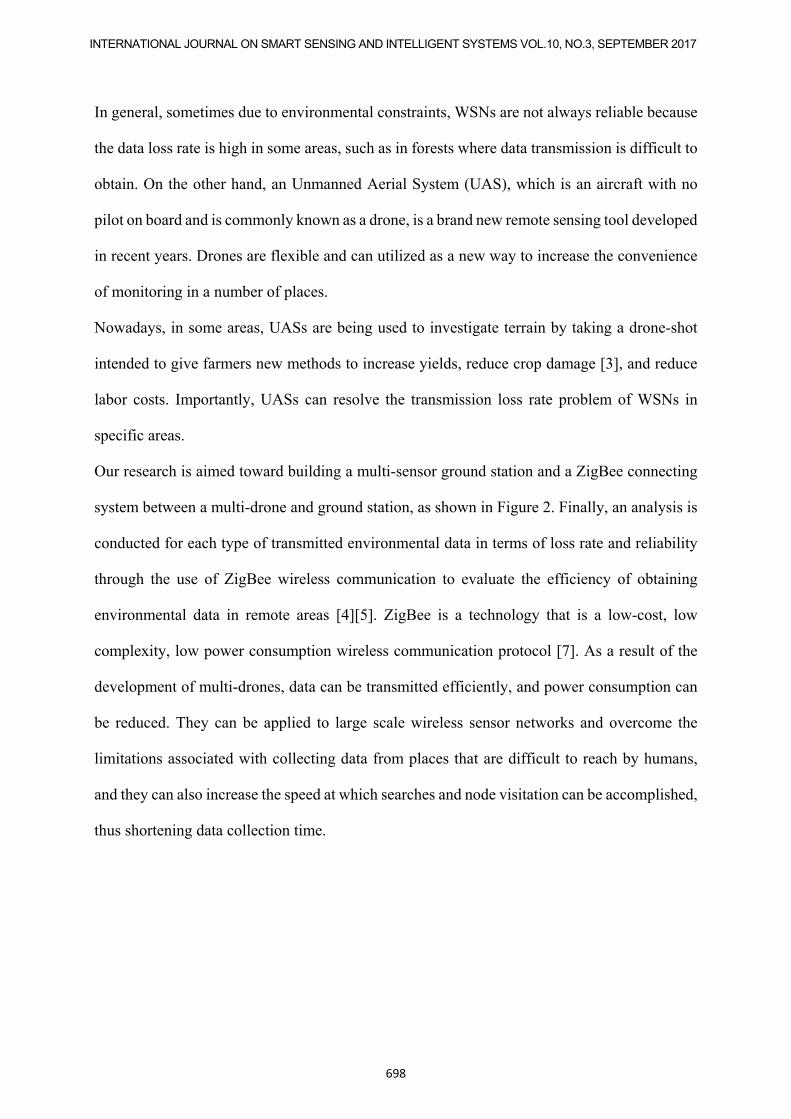
In general, sometimes due to environmental constraints, WSNs are not always reliable because
the data loss rate is high in some areas, such as in forests where data transmission is difficult to
obtain. On the other hand, an Unmanned Aerial System (UAS), which is an aircraft with no
pilot on board and is commonly known as a drone, is a brand new remote sensing tool developed
in recent years. Drones are flexible and can utilized as a new way to increase the convenience
of monitoring in a number of places.
Nowadays, in some areas, UASs are being used to investigate terrain by taking a drone-shot
intended to give farmers new methods to increase yields, reduce crop damage [3], and reduce
labor costs. Importantly, UASs can resolve the transmission loss rate problem of WSNs in
specific areas.
Our research is aimed toward building a multi-sensor ground station and a ZigBee connecting
system between a multi-drone and ground station, as shown in Figure 2. Finally, an analysis is
conducted for each type of transmitted environmental data in terms of loss rate and reliability
through the use of ZigBee wireless communication to evaluate the efficiency of obtaining
environmental data in remote areas [4][5]. ZigBee is a technology that is a low-cost, low
complexity, low power consumption wireless communication protocol [7]. As a result of the
development of multi-drones, data can be transmitted efficiently, and power consumption can
be reduced. They can be applied to large scale wireless sensor networks and overcome the
limitations associated with collecting data from places that are difficult to reach by humans,
and they can also increase the speed at which searches and node visitation can be accomplished,
thus shortening data collection time.

Ching-Ju Chen, Jou-An Chen and Yueh-Min Huang, INTELLIGENT ENVIRONMENTAL SENSING WITH AN UNMANNED AERIAL SYSTEM IN A WIRELESS SENSOR NETWORK
699
Figure 2. UAS for WSNs for data collection
While the multi-drone is in the sky, a nearby sensor ground station, which we call a Wireless
Environmental Monitoring Station (WEMS), is monitoring environmental data from the
WEMS that can be transmitted through ZigBee to multi-drones to reduce storage demands. The
contributions of this research is to describe the implementation of such a transmission
mechanism accomplished by integrating a multi-drone and WEMS. Finally, an analysis of the
transfer correction data between the multi-drone and WEMS is conducted.
II. Related Work
Climate change, intensive farming, and air pollution, among other concerns, are environmental
issues that have become a serious concern in recent years. A significant amount of analysis of
environmental data is required by the government to support policy decisions related to these
issues. For example, when debris flow occurs, it is essential for the government to understand
what caused it to occur and to determine how to prevent it. To obtain this information, it is
necessary to collect environmental data [7].

INTERNATIONAL JOURNAL ON SMART SENSING AND INTELLIGENT SYSTEMS VOL.10, NO.3, SEPTEMBER 2017
700
Generally, data collection using a wireless sensor network can be categorized into three
mainstream methods: static data collection, data collection with a ground-based mobile sink,
and data collection with aerial mobile sensor nodes [8]. The static data collection method is
accomplished by transmitting data through satellites or localized Wi-Fi stations. When the
scope of the collected information expanded, Topological Structure be Layered
Configurations(TSLC) routing algorithms came into use, which are based on the topological
structural characteristics and optimization of network layers and are used to improve the
performance of wireless sensor network data transmission [9]. However, static data collection
may be limited by excessive energy consumption and the relatively high cost of satellite
transmission and therefore is not ideal for data transmission in large scale wireless sensor
networks.
Secondly, another method, data collection with a ground-based mobile sink, takes advantage of
the vehicle mobility to obtain environmental data. It solves the incapacity of constructing larger
wireless sensor networks, overcomes the disadvantage of using the static method, and the
executes data collection mission more efficiently because the path of the data carrier can be
planned in advance [10]. In addition, wireless sensor networks can remain inactive most of the
time to maintain power and only are triggered by the mobile carrier to process data when
necessary. With this type of data transmission method, wireless sensor nodes can reduce the
associated power costs [11]. In [12], the authors combined an artificial bee colony (ABC)
algorithm and ant colony optimization (ACO) to improve the energy efficiency of a wireless
sensor network. However, this method cannot be used in places like swamps or dense primeval
forests, and it is also a time-consuming method because neither traditional vehicles nor
unmanned vehicles can travel at high speeds during the collection process.
Finally, the development of UASs, or drones, has made it possible for data to be transmitted
more efficiently. They can be applied to large scale wireless sensor networks, can overcome
the limitations associated with collecting data from places that are difficult for humans to reach,

Ching-Ju Chen, Jou-An Chen and Yueh-Min Huang, INTELLIGENT ENVIRONMENTAL SENSING WITH AN UNMANNED AERIAL SYSTEM IN A WIRELESS SENSOR NETWORK
701
can increase the speed related to searching for and visiting nodes, and can reduce human
resources, therefore shortening the data collection time [13].
A combination of UASs and wireless sensor networks for large-scale data collection has been
proposed [14]. Considering the cooperation between the wireless sensor network transmission,
UAS route planning, and data acquisition performance, an efficient path planning algorithm for
UAS was proposed and compared with the traditional static transmission method. Using this
method, it is possible to extend the battery life of wireless sensors, which has also been validated
in several field trials conducted by Bellavista in Seville, Spain. The authors referenced in [8]
proposed an architecture for flight data acquisition that was also based on data collection by a
UAS. It included five important parts: a wireless network layout, a wireless sensor location, a
search of connected data points, fast UAS path planning, and data collection through a wireless
network. The authors discussed the key points and put forward a set of corresponding solutions
for the problems they encountered. They proposed an effective path planning algorithm, which
is calculated by block cutting called the Fast Path Planning with Rules (FPPWR) algorithm,
which ensures that data collection can be performed in relatively short paths in most situations.
Finally, the total time spent on data collection, the total distance of the trajectory path, and the
amount of data collected were used to validate the measurement.
The above two methods focus on a structure designed for the UAS as a mobile data carrier in a
wireless sensor network. The former emphasizes that the proposed method uses the correlation
between trajectory planning for the UAS and wireless sensor network placement to reduce flight
time and extend battery life. The latter focuses on dealing with the relevance between the flight
path and the application scenario. Both of them involve the use of a UAS with a basic prototype
for large-scale sensor network data collection. Nevertheless, they did not provide a detailed
discussion on how the data was collected or on the correctness and completeness of data
transmission. Thus, this paper focuses on combining the UAS and the WEMS based on the
ZigBee protocol [15], and an algorithm is designed to ensure the integrity and correctness of

INTERNATIONAL JOURNAL ON SMART SENSING AND INTELLIGENT SYSTEMS VOL.10, NO.3, SEPTEMBER 2017
702
the transmitted data. In addition, experiments examining the proper transmission distance for
wireless data transmission were conducted as well. Based on the experimental results, the
research demonstrates a more detailed system integration implementation and feasible
transmission model in reality.
III. Design Methods
In the case of most UASs on the market, the application functions and flight control are done
by the same processor. This may cause inefficient computation and instability of the drone when
handling tasks because the application program has to share the processor resources with the
Flight Control Unit. Therefore, we design a Wireless Communication Platform with another
processor on the UAS. The UAS can thus be used as a data collector.
Because UAS power is limited, determining how to transmit and receive is very important as
well as how to build verification and retransmission in a WEMS, which will be described the
next chapters in detail.
a. Wireless Environmental Monitoring Station (WEMS)
The implementation of the WEMS is described in this section. In order to provide a
multifunctional data collection platform, the WEMS is combined with sensors for different
environmental monitoring purposes, as described in a.i. The following parts, a.ii, a.iii, and a.iv,
provide a detailed discussion of the environmental monitoring sensors.
a.i WEMS system overview
Arduino UNO is utilized as the MCU (Micro Control Unit) on the platform. Figures 3 and 4
show implementation of the WEMS. In addition, the DHT11 Temperature and Humidity Sensor
and the Plantower PMS 5003 Air Quality Sensor is connected to the MCU for the environmental
Ching-Ju Chen, Jou-An Chen and Yueh-Min Huang, INTELLIGENT ENVIRONMENTAL SENSING WITH AN UNMANNED AERIAL SYSTEM IN A WIRELESS SENSOR NETWORK
703
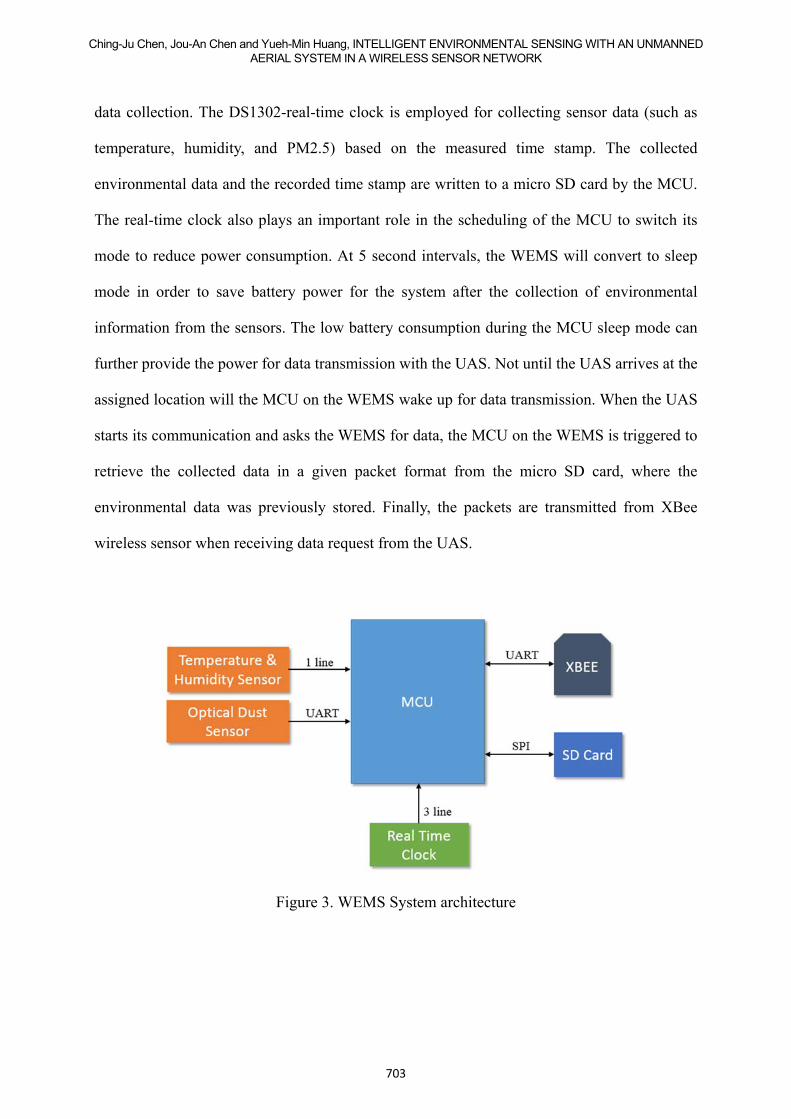
data collection. The DS1302-real-time clock is employed for collecting sensor data (such as
temperature, humidity, and PM2.5) based on the measured time stamp. The collected
environmental data and the recorded time stamp are written to a micro SD card by the MCU.
The real-time clock also plays an important role in the scheduling of the MCU to switch its
mode to reduce power consumption. At 5 second intervals, the WEMS will convert to sleep
mode in order to save battery power for the system after the collection of environmental
information from the sensors. The low battery consumption during the MCU sleep mode can
further provide the power for data transmission with the UAS. Not until the UAS arrives at the
assigned location will the MCU on the WEMS wake up for data transmission. When the UAS
starts its communication and asks the WEMS for data, the MCU on the WEMS is triggered to
retrieve the collected data in a given packet format from the micro SD card, where the
environmental data was previously stored. Finally, the packets are transmitted from XBee
wireless sensor when receiving data request from the UAS.
Figure 3. WEMS System architecture

INTERNATIONAL JOURNAL ON SMART SENSING AND INTELLIGENT SYSTEMS VOL.10, NO.3, SEPTEMBER 2017
704
Figure 4. Implementation of WEMS
a.ii Humidity and Temperature Sensor
The DHT11 Temperature and Humidity Sensor is chosen in this study. It includes an NTC
temperature measurement component and a resistive type humidity measurement component
and connects to an excellent performance 8-bit microcontroller, offering good average quality,
fast detection response, anti-interference ability, and is cheaper than other sensors. In addition
to these advantages, it can be integrated to an MCU easily and quickly. The specifications for
the DHT11 measurement instruments are listed in Table 1.
Table 1: Specifications of DHT 11
Instrument DHT11 sensor adopts
Humidity measurement range 20% ~ 90%
Humidity measurement error ± 5%
Temperature measurement range 0℃ ~ 50℃
Temperature measurement error ±2 ℃
Interface Analog

Ching-Ju Chen, Jou-An Chen and Yueh-Min Huang, INTELLIGENT ENVIRONMENTAL SENSING WITH AN UNMANNED AERIAL SYSTEM IN A WIRELESS SENSOR NETWORK
705
a.iii PM2.5 Sensor
Atmospheric particulate matter, which is also known as particulate matter (PM) or particulates,
are microscopic solid or liquid matter suspended in the atmosphere. Particulates are one of the
main sources of air pollution. Among them, aerodynamic or 2.5 microns of suspended particles
are known as fine particles (PM2.5). Particulates can remain in the atmosphere for a very long
time.
They have impacts on climate and precipitation that adversely affect human health. The
Plantower PMS 5003 Air Quality Sensor is chosen in this study to utilize the properties of
absorption and light scattering to measure particle count, size, and concentration. The
specifications of the PMS5003 measurement instruments are listed in Table 2.
Table 2: Specifications of PMS5003
Instrument PMS 5003
Method Light scattering
Measuring range 0.3 to 1.0; 1.0 to 2.5; 2.5 to 10 (μm)
Counting efficiency 50%@0.3um 98% @> = 0.5 um
Volume 0.1 (L)
a.iv XBee
ZigBee is a wireless technology developed as an open global standard to address the unique
needs of low-cost, low-power wireless M2M networks. The ZigBee standard operates on the
IEEE 802.15.4 physical radio specification and operates in unlicensed bands including 2.4 GHz,
900 MHz, and 868 MHz.
XBee sensor standards operating within the ISM 2.4 GHz frequency band on IEEE 802.15.4
are chosen for this study. XBee supports the need for low-cost, low-power wireless sensor

INTERNATIONAL JOURNAL ON SMART SENSING AND INTELLIGENT SYSTEMS VOL.10, NO.3, SEPTEMBER 2017
706
networks, and it is very easy to construct the WEMS communication. The specifications for
XBee performance are listed in Table 3.
Table 3: XBee Specifications
Instrument XBee
Indoor/Urban Range Up to 133 ft. (40 m)
Outdoor RF line-of-sight Range Up to 400 ft. (120 m)
Transmit Power Output 2 mW (+3dBm), boost mode enabled
1.25 mW (+1dBm), boost mode disabled
RF Data Rate 250,000 bps
Serial Interface Data Rate 1200 bps - 1 Mbps
Receiver Sensitivity -96 dBm, boost mode enabled
-95 dBm, boost mode disabled
b. Data Transmission between the UAS and the Ground Platform
b.i Triggering the Inactive WEMS Node
The GPS coordinates of the WEMS are assigned to the intelligent flight control system of the
UAS in a waypoint list before the UAS starts its route for data collection. Upon reaching the
WEMS on the ground, for which the coordinates are on the list, the UAS will descend in altitude
to about 30 meters above the WEMS, as shown in Figure 5. Most of the time, the WEMS on
the ground remains in sleep mode in order to maintain the battery power for transmission
purposes. Figure 6 shows the general time usage of the WEMS on the ground. The sensor nodes
will only be in active mode when it is on duty for data collection or communication with
wireless sensor devices. Thus, the UAS will have to trigger the WEMS to be active by
transmitting a signal acknowledging that the data collection task should be ready. After the

Ching-Ju Chen, Jou-An Chen and Yueh-Min Huang, INTELLIGENT ENVIRONMENTAL SENSING WITH AN UNMANNED AERIAL SYSTEM IN A WIRELESS SENSOR NETWORK
707
WEMS on the ground receives the triggering message, it will begin its transmission of
environmental sensor data recently obtained by the WEMS.
Figure 5. The schematic diagram of the UAS collecting data from the WEMS
Figure 6. Triggering the inactive WEMS
A schematic diagram of the data transmission between the UAS and the WEMS is shown in
Figure 7. The wireless sensor on the UAS first transmits a beacon message to trigger the inactive
WEMS on the ground. After waking up the WEMS in sleep mode, the wireless sensor on the
UAS will send a data request. The “ACK” label in Figure 7 stands for acknowledgement, which
is the “tx_status” command frame for notifying the source wireless node that the packet it has
sent out has been transmitted. Upon receiving the sensor data from the ground, the verification
and retransmission algorithm will begin handling the receiving data in time. After all the sensor
data from the ground is collected and verified, the wireless sensor on the WEMS will send a

INTERNATIONAL JOURNAL ON SMART SENSING AND INTELLIGENT SYSTEMS VOL.10, NO.3, SEPTEMBER 2017
708
message to declare that the communication process is over. Finally, the UAS can navigate itself
to another assigned destination.
Figure 7. Schematic diagram for the data transmission
b.ii Transmitted Frame Format
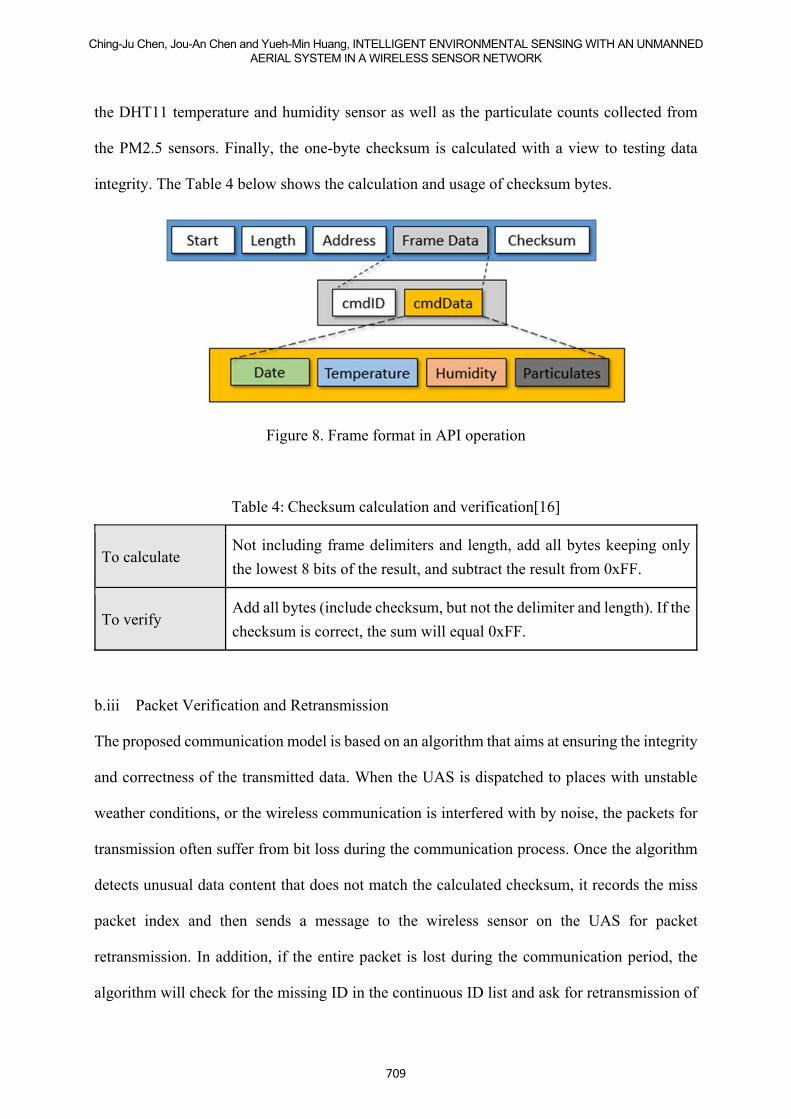
The content of each transmitted packet is formatted as in Figure 8 below. The Application
Programming Interface(API) mode operation in XBee requires that communication is done
through a structured interface, in which the data is communicated in frames in a defined order.
The data frame comprises a start delimiter, a length field, address of the source node, frame
data and checksum. The start delimiter has a one-byte value, and the purpose of holding it is to
mark the start of a new frame. That is to say, any data received prior to the start delimiter is
silently discarded. The length field has a two-byte value that specifies the number of bytes that
will be contained in the frame data field.
The frame data field is composed of the command ID (cmdID) and command data (cmdData).
The cmdID frame (or API-identifier) indicates which type of API command will be contained
in the cmdData frame (or Identifier-specific data). In our communication model, the cmdID tx
and cmdID rx is adopted for sending and receiving the packet, respectively. On the other hand,
the cmdData consists of the date stamp, the temperature, and the humidity data collected from
Ching-Ju Chen, Jou-An Chen and Yueh-Min Huang, INTELLIGENT ENVIRONMENTAL SENSING WITH AN UNMANNED AERIAL SYSTEM IN A WIRELESS SENSOR NETWORK
709
the DHT11 temperature and humidity sensor as well as the particulate counts collected from
the PM2.5 sensors. Finally, the one-byte checksum is calculated with a view to testing data
integrity. The Table 4 below shows the calculation and usage of checksum bytes.
Figure 8. Frame format in API operation
Table 4: Checksum calculation and verification[16]
To calculate Not including frame delimiters and length, add all bytes keeping only
the lowest 8 bits of the result, and subtract the result from 0xFF.
To verify Add all bytes (include checksum, but not the delimiter and length). If the
checksum is correct, the sum will equal 0xFF.
b.iii Packet Verification and Retransmission
The proposed communication model is based on an algorithm that aims at ensuring the integrity
and correctness of the transmitted data. When the UAS is dispatched to places with unstable
weather conditions, or the wireless communication is interfered with by noise, the packets for
transmission often suffer from bit loss during the communication process. Once the algorithm
detects unusual data content that does not match the calculated checksum, it records the miss
packet index and then sends a message to the wireless sensor on the UAS for packet
retransmission. In addition, if the entire packet is lost during the communication period, the
algorithm will check for the missing ID in the continuous ID list and ask for retransmission of

INTERNATIONAL JOURNAL ON SMART SENSING AND INTELLIGENT SYSTEMS VOL.10, NO.3, SEPTEMBER 2017
710
the entire packet as well. The algorithm will repeatedly verify the data content until the given
expiration time of 5 seconds.
IV. Experiment and Results
In order to set up a proper transmission distance for communication between the UAS and the
WEMS on the ground, we conducted an experiment to verify the capability of the transmission
system we designed. In the experiment, we examine the interference to packet transmission and
to the transmission signal during the flight. The experiment details are provided in Section 4.1.
By measuring two values: the success rate of the packet transmission and the RSSI value
(indicates the signal strength of wireless transmission) of specific transmission distances, we
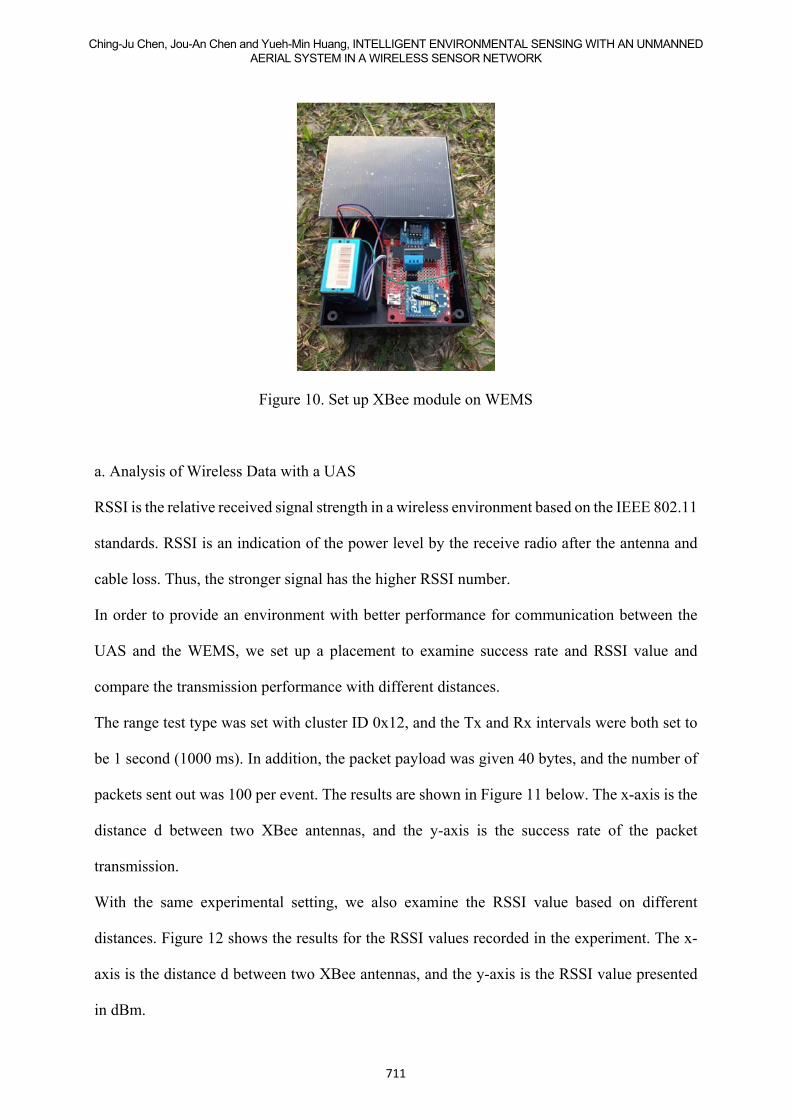
therefore determine the transmission range available for the communication. Figures 9 and 10
show the equipment utilized to complete the experiment, including the tested UAS and the
WEMS built using the method we designed.
Figure 9. Set up XBee module on UAS
Ching-Ju Chen, Jou-An Chen and Yueh-Min Huang, INTELLIGENT ENVIRONMENTAL SENSING WITH AN UNMANNED AERIAL SYSTEM IN A WIRELESS SENSOR NETWORK
711
Figure 10. Set up XBee module on WEMS
a. Analysis of Wireless Data with a UAS
RSSI is the relative received signal strength in a wireless environment based on the IEEE 802.11
standards. RSSI is an indication of the power level by the receive radio after the antenna and
cable loss. Thus, the stronger signal has the higher RSSI number.
In order to provide an environment with better performance for communication between the
UAS and the WEMS, we set up a placement to examine success rate and RSSI value and
compare the transmission performance with different distances.
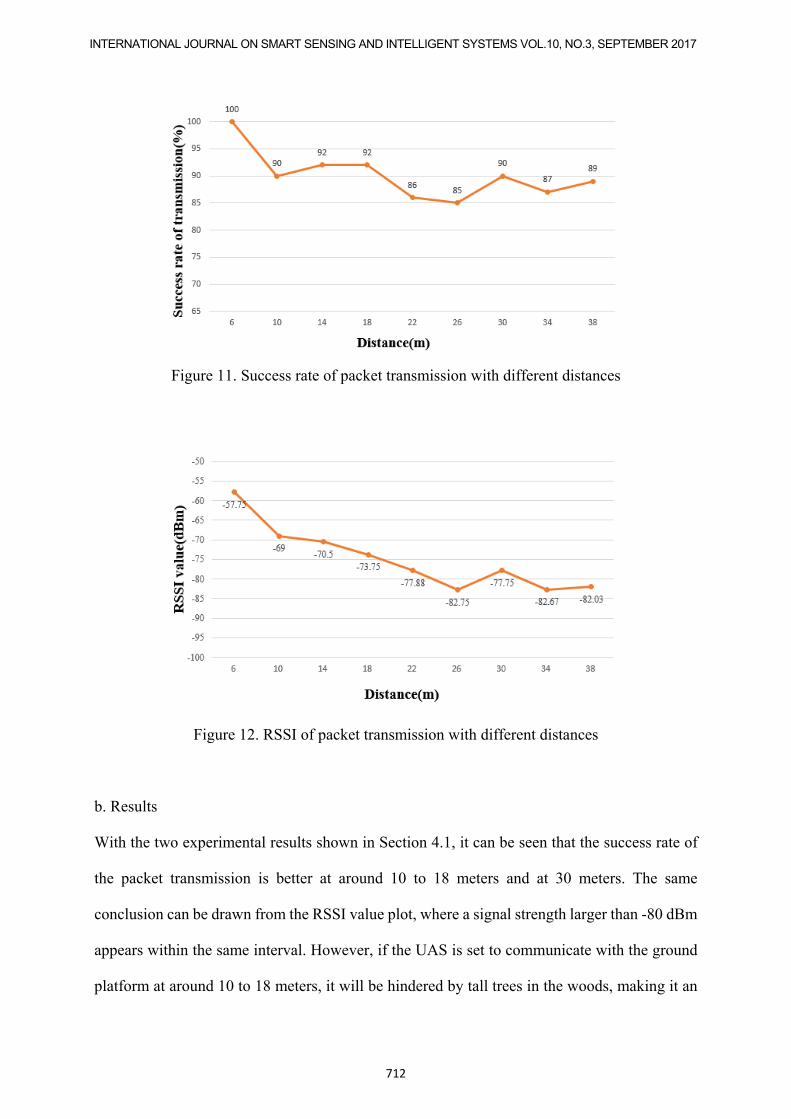
The range test type was set with cluster ID 0x12, and the Tx and Rx intervals were both set to
be 1 second (1000 ms). In addition, the packet payload was given 40 bytes, and the number of
packets sent out was 100 per event. The results are shown in Figure 11 below. The x-axis is the
distance d between two XBee antennas, and the y-axis is the success rate of the packet
transmission.
With the same experimental setting, we also examine the RSSI value based on different
distances. Figure 12 shows the results for the RSSI values recorded in the experiment. The x-
axis is the distance d between two XBee antennas, and the y-axis is the RSSI value presented
in dBm.
INTERNATIONAL JOURNAL ON SMART SENSING AND INTELLIGENT SYSTEMS VOL.10, NO.3, SEPTEMBER 2017
712
Figure 11. Success rate of packet transmission with different distances
Figure 12. RSSI of packet transmission with different distances
b. Results
With the two experimental results shown in Section 4.1, it can be seen that the success rate of
the packet transmission is better at around 10 to 18 meters and at 30 meters. The same
conclusion can be drawn from the RSSI value plot, where a signal strength larger than -80 dBm
appears within the same interval. However, if the UAS is set to communicate with the ground
platform at around 10 to 18 meters, it will be hindered by tall trees in the woods, making it an
Ching-Ju Chen, Jou-An Chen and Yueh-Min Huang, INTELLIGENT ENVIRONMENTAL SENSING WITH AN UNMANNED AERIAL SYSTEM IN A WIRELESS SENSOR NETWORK
713
impractical solution for the application of our system. Thus, we select a distance of 30 meters
as the range for data transmission as shown in the schematic diagram in Figure 5 above.
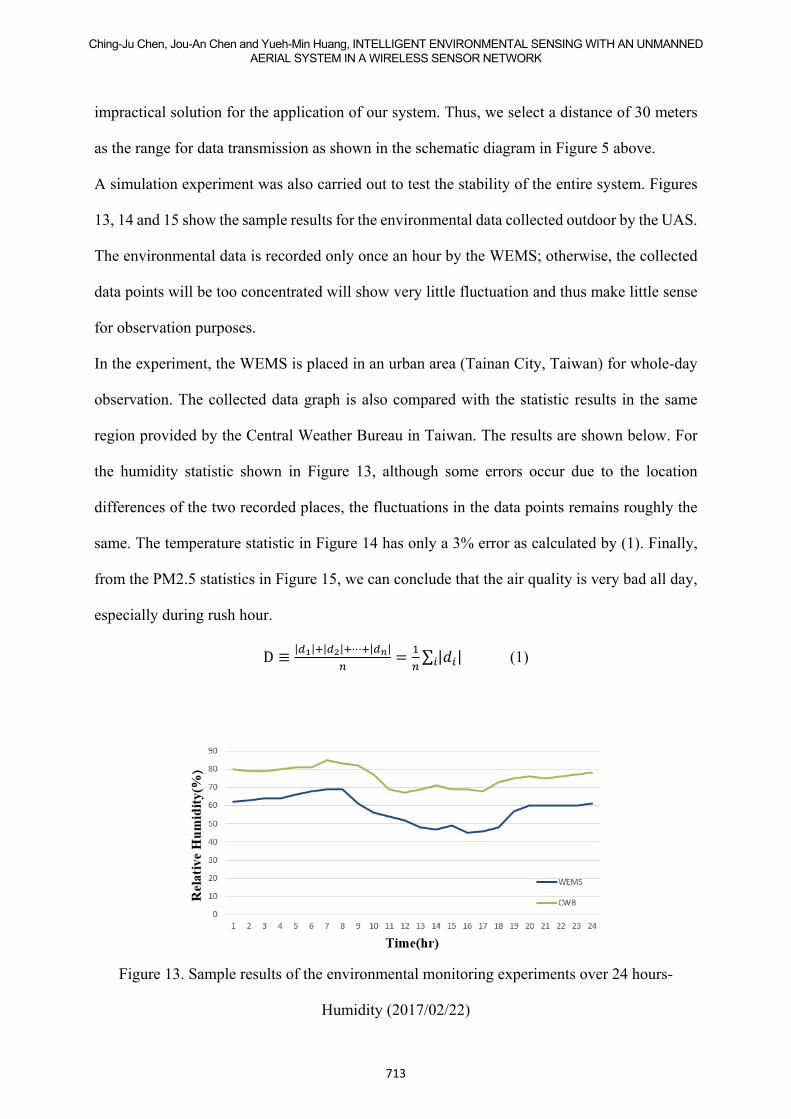
A simulation experiment was also carried out to test the stability of the entire system. Figures
13, 14 and 15 show the sample results for the environmental data collected outdoor by the UAS.
The environmental data is recorded only once an hour by the WEMS; otherwise, the collected
data points will be too concentrated will show very little fluctuation and thus make little sense
for observation purposes.
In the experiment, the WEMS is placed in an urban area (Tainan City, Taiwan) for whole-day
observation. The collected data graph is also compared with the statistic results in the same
region provided by the Central Weather Bureau in Taiwan. The results are shown below. For
the humidity statistic shown in Figure 13, although some errors occur due to the location
differences of the two recorded places, the fluctuations in the data points remains roughly the
same. The temperature statistic in Figure 14 has only a 3% error as calculated by (1). Finally,
from the PM2.5 statistics in Figure 15, we can conclude that the air quality is very bad all day,
especially during rush hour.
D ≡| | | | ⋯ | | ∑ | | (1)
Figure 13. Sample results of the environmental monitoring experiments over 24 hours-
Humidity (2017/02/22)

INTERNATIONAL JOURNAL ON SMART SENSING AND INTELLIGENT SYSTEMS VOL.10, NO.3, SEPTEMBER 2017
714
Figure 14. Sample results of the environmental monitoring experiments over 24 hours-
Temperature (2017/02/22)
Figure 15. Sample results of the environmental monitoring experiments over 24 hours-
PM2.5 (2017/02/22)
V. Conclusion
This paper proposed a method for communication between a UAS and a WEMS using ZigBee
protocol. In order to guarantee the correctness and completeness of the transmitted sensor data,
there is an acknowledgement and retransmission mechanism in between during the transmission
of sensor data. In addition, considering a scenario in which a WEMS is located in areas that are
difficult to reach by humans, a power-saving approach is implemented in the WEMS to
effectively manage the processing schedule of the MCU. Finally, an experiment is carried out
Ching-Ju Chen, Jou-An Chen and Yueh-Min Huang, INTELLIGENT ENVIRONMENTAL SENSING WITH AN UNMANNED AERIAL SYSTEM IN A WIRELESS SENSOR NETWORK
715
to decide a suitable distance for data transmission between the UAS above and the WEMS on
the ground. After examining the success rate of packet transmission and RSSI values for
different distances, 30 meters is selected as the proper distance for transmission.
The detailed implementation of the environmental monitoring mechanism in this paper takes
advantage of the high mobility of a UAS to reach places such as steep mountains or even places
that have been previously unreachable. In this way, the cost of dispatching workers to hazardous
regions and operating rugged handhelds for data collection can be eliminated. On the other hand,
areas with low wireless signal coverage obtain environmental monitoring data using the
proposed methods. All in all, the proposed method and the application scenario brings about a
revolutionized approach for the future of environmental monitoring.
REFERENCES
[1] I. F. Akyildiz, W. Su, Y. Sankarasubramaniam, and E. Cayirci, “Wireless sensor networks:
a survey,” Computer Networks, Vol. 38, No. 4, pp. 393–422, 2002.
[2] R. E. Dunlap and A. K. Jorgenson, “Environmental Problems,” in The Wiley-Blackwell
Encyclopedia of Globalization, John Wiley & Sons, Ltd, 2012.
[3] F. G. Costa, J. Ueyama, T. Braun, G. Pessin, F. S. Osório, and P. A. Vargas, “The use of
unmanned aerial vehicles and wireless sensor network in agricultural applications,” in
Geoscience and Remote Sensing Symposium (IGARSS), 2012 IEEE International, pp. 5045–
5048, 2012.
[4] J. R. Martinez-de Dios, K. Lferd, A. de San Bernabé, G. Núñez, A. Torres-González, and
A. Ollero, “Cooperation Between UAS and Wireless Sensor Networks for Efficient Data
Collection in Large Environments,” Journal of Intelligent & Robotic Systems, Vol. 70, No. 1,
pp. 491–508, 2013.

INTERNATIONAL JOURNAL ON SMART SENSING AND INTELLIGENT SYSTEMS VOL.10, NO.3, SEPTEMBER 2017
716
[5] S. H. Lee, S. Lee, H. Song, and H. S. Lee, “Wireless sensor network design for tactical
military applications: Remote large-scale environments,” in Military Communications
Conference, 2009. MILCOM 2009. IEEE, pp. 1–7, 2009.
[6] K. Pothuganti and A. Chitneni, “A comparative study of wireless protocols: Bluetooth,
UWB, ZigBee, and Wi-Fi,” Advance in Electronic and Electric Engineering, Vol. 4, No. 6, pp.
655–662, 2014.
[7] Q. Jiang et al., “Citizen Sensing for Improved Urban Environmental Monitoring,” Journal
of Sensors, Vol. 2016, Article ID 5656245, 9 pages, 2016.
[8] C. Wang, F. Ma, J. Yan, D. De, and S. K. Das, “Efficient Aerial Data Collection with UAV
in Large-Scale Wireless Sensor Networks,” International Journal of Distributed Sensor
Networks, Vol. 2015, Article ID 286080, 19 pages, 2015.
[9] J. Yu and X. Zhang, “A Cross-Layer Wireless Sensor Network Energy-Efficient
Communication Protocol for Real-Time Monitoring of the Long-Distance Electric
Transmission Lines,” Journal of Sensors, Vol. 2015, Article ID 515247, 13 pages, 2015.
[10] R. C. Shah, S. Roy, S. Jain, and W. Brunette, “Data mules: Modeling and analysis of a
three-tier architecture for sparse sensor networks,” Ad Hoc Networks, Vol. 1, No. 2, pp. 215–
233, 2003.
[11] P. Le-Huy and S. Roy, “Low-Power Wake-Up Radio for Wireless Sensor Networks,” Mob.
Netw. Appl., Vol. 15, No. 2, pp. 226–236, Apr. 2010.
[12] R. Kumar and D. Kumar, “Hybrid Swarm Intelligence Energy Efficient Clustered Routing
Algorithm for Wireless Sensor Networks,” Journal of Sensors, Vol. 2016, Article ID 5836913,
19 pages, 2016.
[13] S. K. Teh, L. Mejias, P. Corke, and W. Hu, “Experiments in Integrating Autonomous
Uninhabited Aerial Vehicles(UAVs) and Wireless Sensor Networks,” in 2008 Australasian
Conference on Robotics and Automation (ACRA 08), Canberra, 2008.
Ching-Ju Chen, Jou-An Chen and Yueh-Min Huang, INTELLIGENT ENVIRONMENTAL SENSING WITH AN UNMANNED AERIAL SYSTEM IN A WIRELESS SENSOR NETWORK
717
[14] J. R. Martinez-de Dios, K. Lferd, A. de San Bernabé, G. Núñez, A. Torres-González, and
A. Ollero, “Cooperation Between UAS and Wireless Sensor Networks for Efficient Data
Collection in Large Environments,” Journal of Intelligent & Robotic Systems, Vol. 70, No. 1,
pp.491–508, 2013.
[15] H. H. R. Sherazi, R. Iqbal, S. Ul Hassan, M. H. Chaudary, and S. A. Gilani, “ZigBee’s
Received Signal Strength and Latency Evaluation under Varying Environments,” Journal of
Computer Networks and Communications, Vol. 2016, Article ID 9409402, 8 pages, 2016.
[16] B. Lo and G.-Z. Yang, “Appendix A: Wireless Sensor Development Platforms,” Body
Sensor Networks, 37 pages, 2014.
[17] Juliana, M. Roseline, and S. Srinivasan. "SELADG: Secure Energy Efficient Location
Aware Data Gathering Approach for Wireless Sensor Networks," International Journal on
Smart Sensing and Intelligent Systems, Vol. 8, No. 3, pp. 1748-1767, September 2015.
[18] S. K. Gharghan, R. Nordin, and M. Ismail. "Development and validation of a track bicycle
instrument for torque measurement using the zigbee wireless sensor network, " International
Journal on Smart Sensing and Intelligent Systems, Vol. 10, No. 1, pp. 124-145, March 2017.
[19] Bhattacharjee, D., and R. Bera. "Development of smart detachable wireless sensing system
for environmental monitoring," International Journal on Smart Sensing and Intelligent Systems,
Vol. 7, No. 3, pp 1239-1253, September 2014.
Recommended