Technical Workshops |
Esri International User Conference San Diego, California
Introduction to ArcGIS Spatial Analyst
Steve Kopp Elizabeth Graham
July 2011
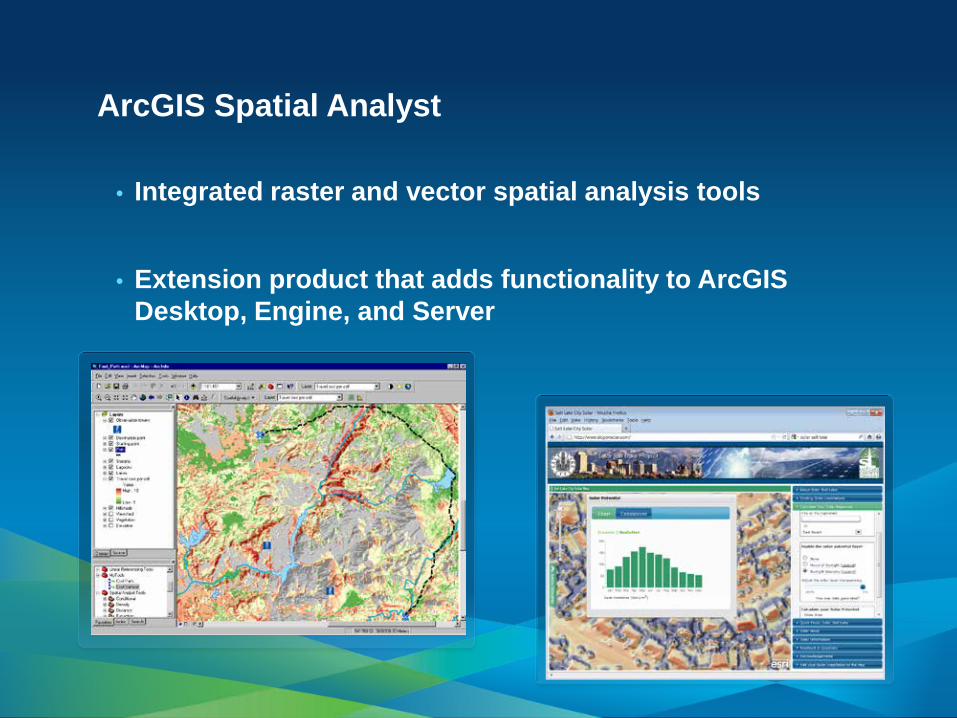
ArcGIS Spatial Analyst
• Integrated raster and vector spatial analysis tools
• Extension product that adds functionality to ArcGIS Desktop, Engine, and Server
Key Features of Spatial Analyst
• Over 170 geoprocessing tools • Analysis on all raster formats • Analysis on all vector formats • Calculator with Map Algebra syntax • Great developer experience
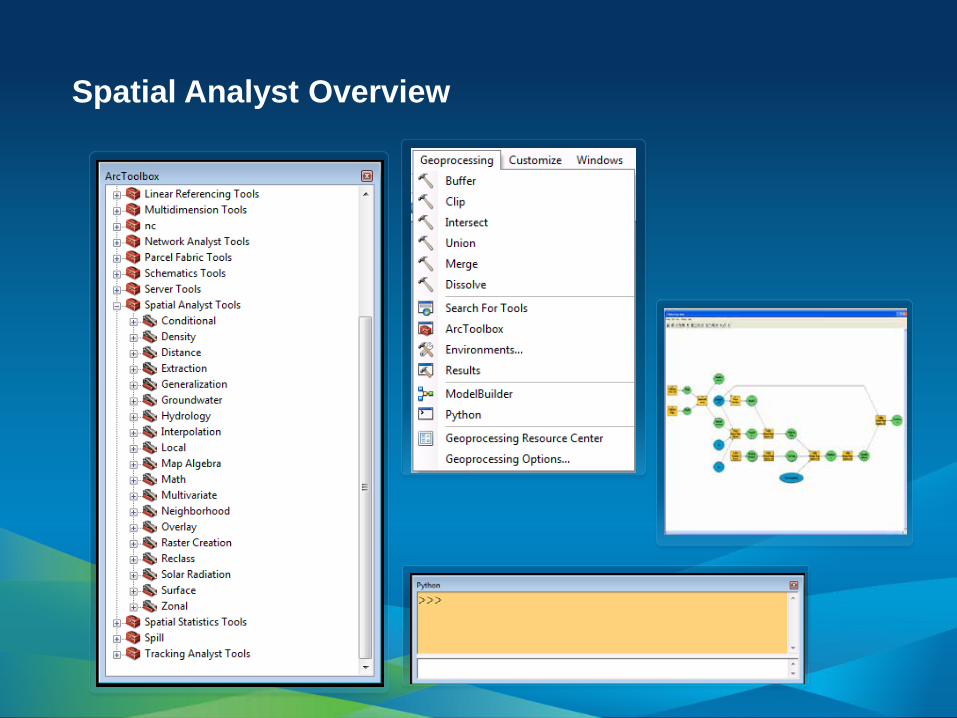
Spatial Analyst Overview
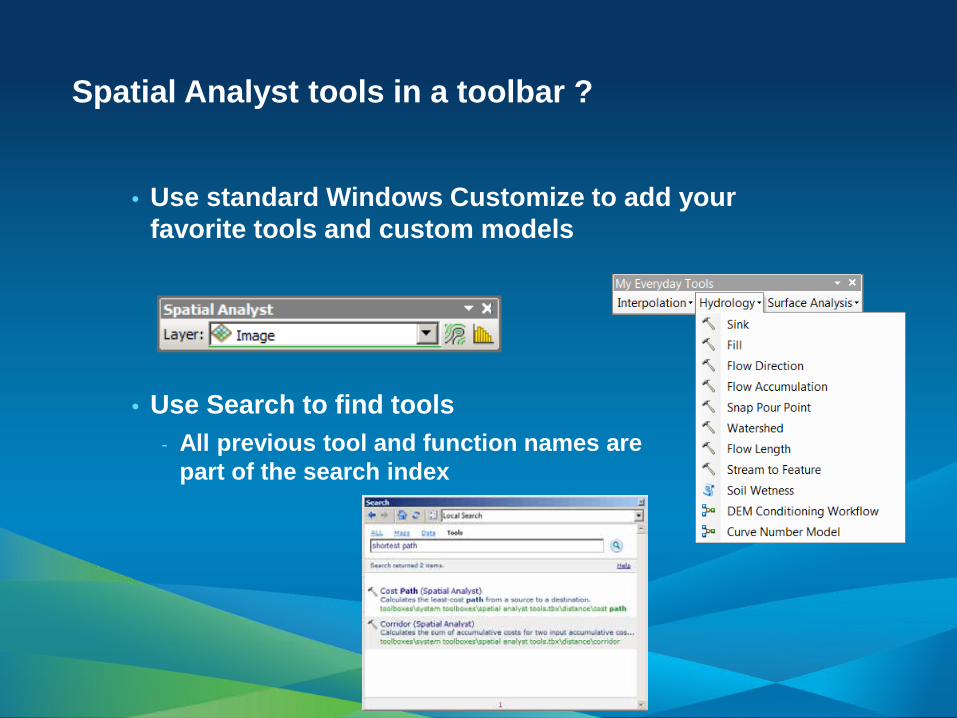
Spatial Analyst tools in a toolbar ?
• Use standard Windows Customize to add your favorite tools and custom models
• Use Search to find tools - All previous tool and function names are
part of the search index
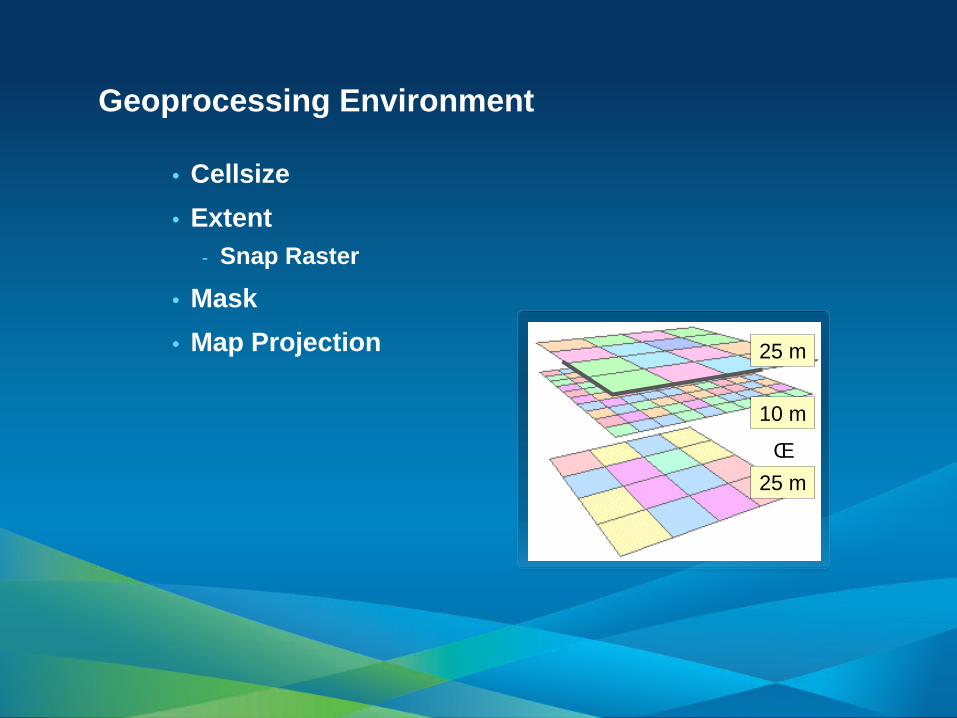
Geoprocessing Environment
• Cellsize • Extent
- Snap Raster
• Mask • Map Projection 25 m
10 m
25 m ê
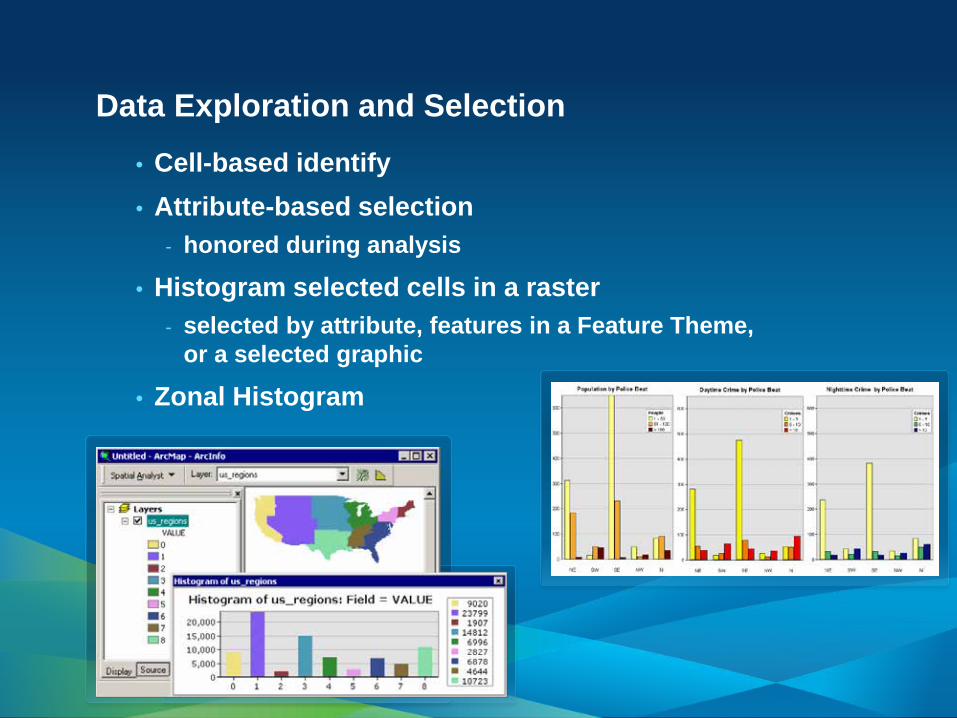
Data Exploration and Selection • Cell-based identify • Attribute-based selection
- honored during analysis
• Histogram selected cells in a raster - selected by attribute, features in a Feature Theme,
or a selected graphic
• Zonal Histogram
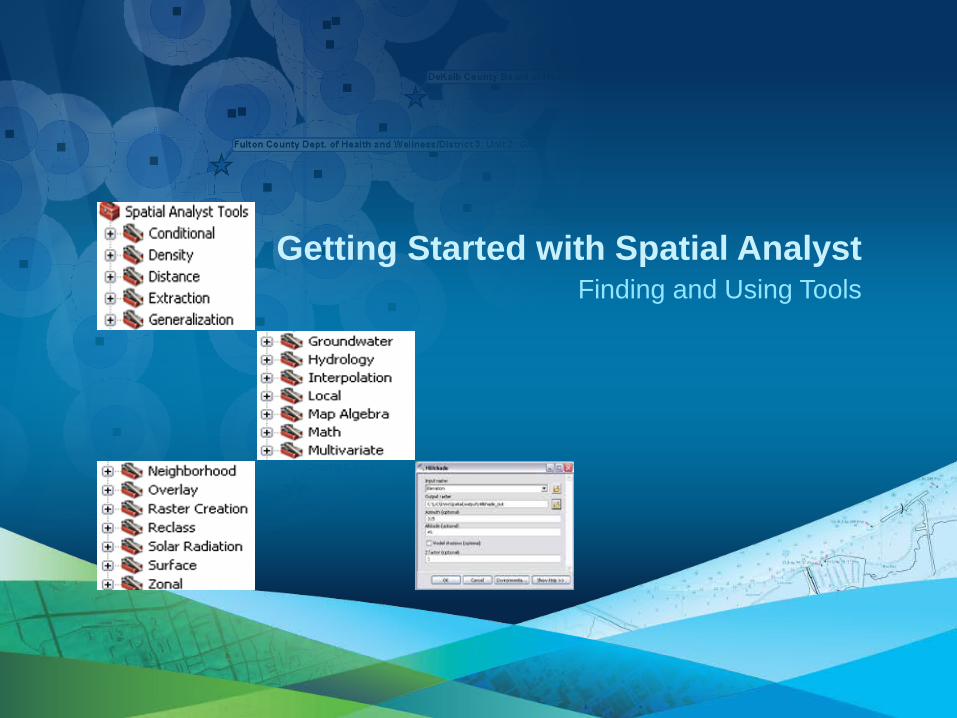
Getting Started with Spatial Analyst Finding and Using Tools
Analysis Tools • Mathematical Operators and Functions • Distance and Proximity Analysis • Density Mapping • Neighborhood and Block Statistics • Zonal Overlay • Interpolation and Contouring • Surface Analysis • Hydrologic and Groundwater Analysis • Reclassification • Geometric Transformation • Morphological Analysis • Multivariate Statistical Analysis
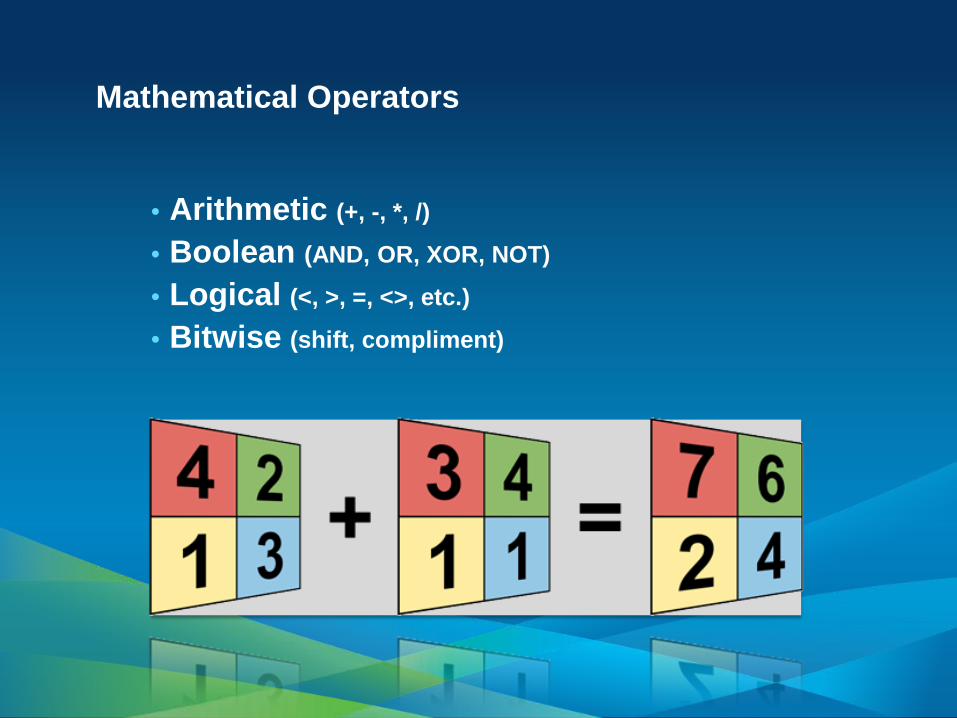
Mathematical Operators
• Arithmetic (+, -, *, /)
• Boolean (AND, OR, XOR, NOT)
• Logical (<, >, =, <>, etc.)
• Bitwise (shift, compliment)
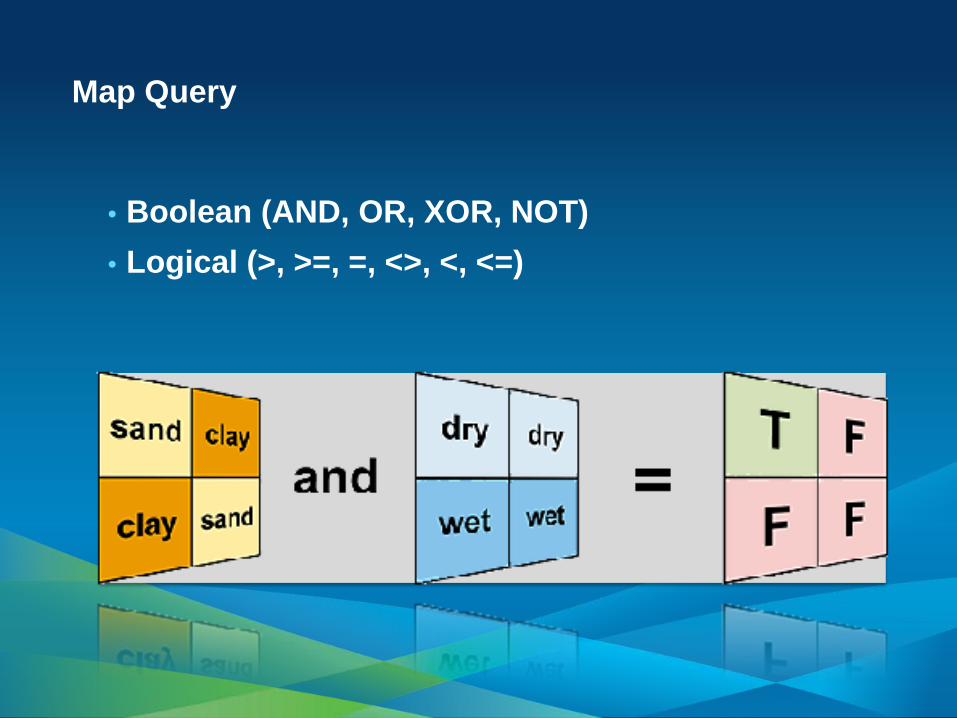
Map Query
• Boolean (AND, OR, XOR, NOT) • Logical (>, >=, =, <>, <, <=)
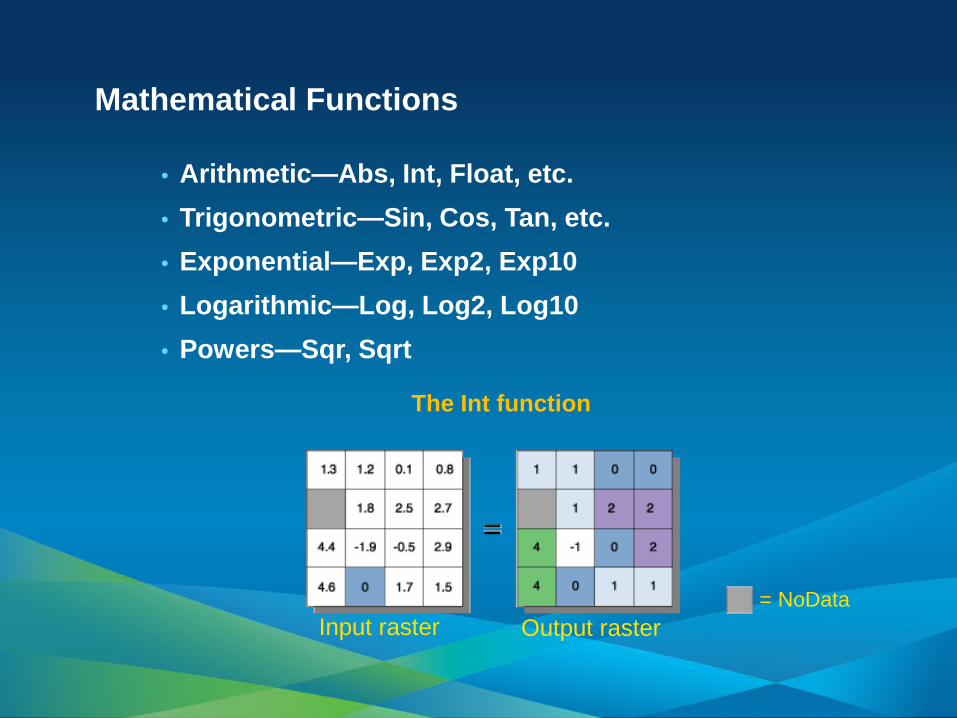
Mathematical Functions
• Arithmetic—Abs, Int, Float, etc. • Trigonometric—Sin, Cos, Tan, etc. • Exponential—Exp, Exp2, Exp10 • Logarithmic—Log, Log2, Log10 • Powers—Sqr, Sqrt
The Int function
Input raster Output raster = NoData
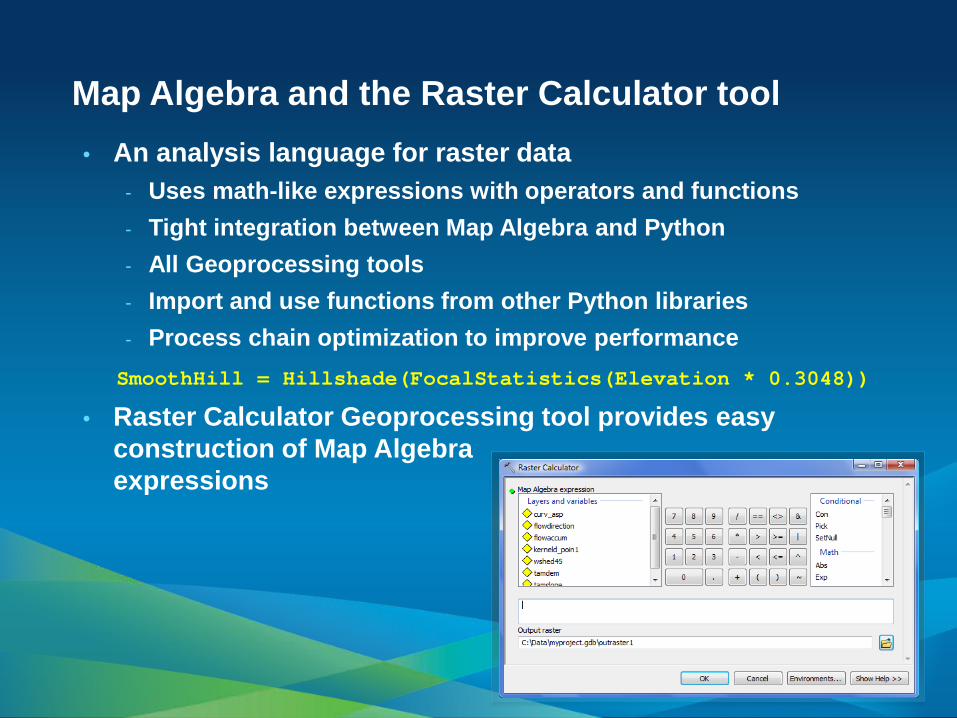
Map Algebra and the Raster Calculator tool • An analysis language for raster data
- Uses math-like expressions with operators and functions - Tight integration between Map Algebra and Python - All Geoprocessing tools - Import and use functions from other Python libraries - Process chain optimization to improve performance
• Raster Calculator Geoprocessing tool provides easy construction of Map Algebra expressions
SmoothHill = Hillshade(FocalStatistics(Elevation * 0.3048))
Distance and Proximity Analysis
• Straight line distance and allocation - Create distance buffers from features. - Allocate resources to distribution centers.
• Cost weighted distance and allocation - Include a weight or impedance surface to constrain movement.
• Shortest path - Find least cost path between two points. - Identify corridors of predicted travel.
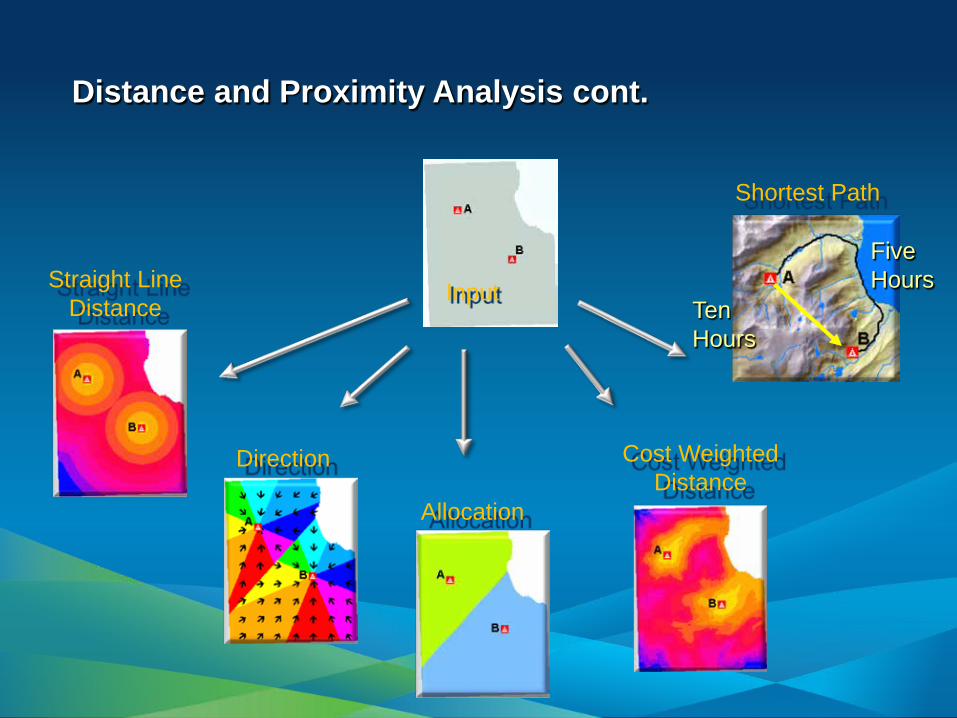
Allocation
Straight Line Distance
Direction
Input
Shortest Path
Five Hours
Ten Hours
Cost Weighted Distance
Distance and Proximity Analysis cont.

Corridor Cost
Distance B
Cost Distance
A Corridor(s)
From: Cost Distance Path Distance
Cost A Cost B Corridor of low cost
Alternate route?
Adds two accumulative travel cost layers together
Corridor Analysis

Density Mapping
• Simple Density and Kernel Density
• Count occurrences of a phenomenon within an area and distribute it through the area.
“Magnitude per unit area”
• Use points or lines as input.
- Population per Km2 - Road density per Mi2
Neighborhood and Block Statistics
• Calculates a statistic for a neighborhood - Majority, Maximum, Mean, Median, Minimum, Minority,
Range, Sum, Standard Deviation, Variety
• Used for filtering, data smoothing, and data aggregation

Neighborhood Statistics
3.22
2 6 3 4 6
5 3 7 4 5
7 2 4 1 9
2 5
5 6 2 1 9
1 6 7
Mean of 3x3 neighborhood
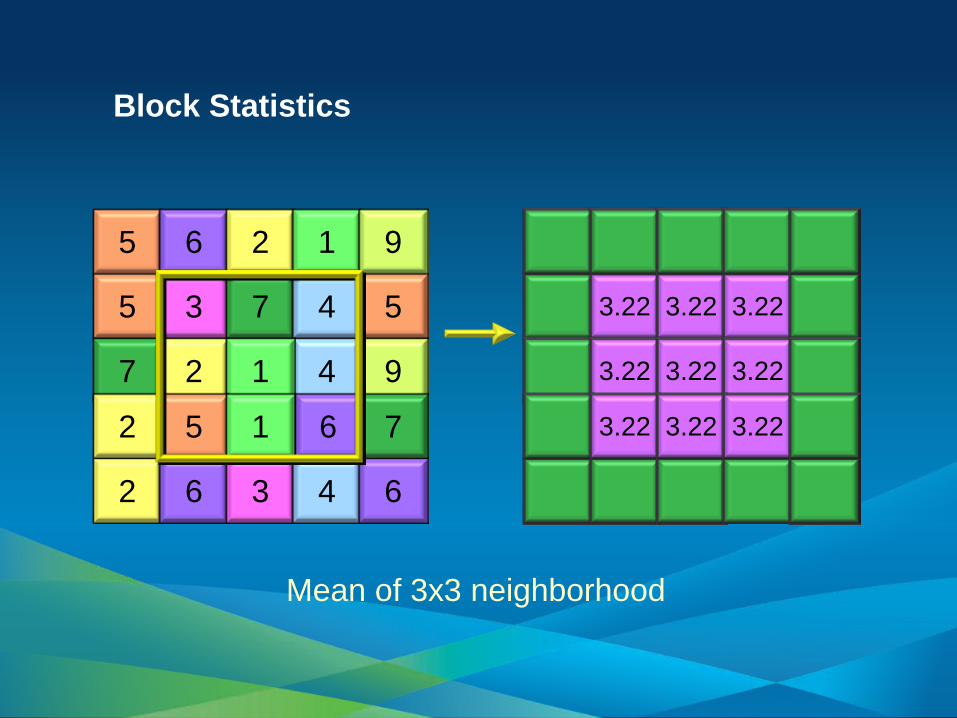
Block Statistics
3.22 3.22 3.22
3.22 3.22 3.22
3.22 3.22 3.22
2 6 3 4 6
5 3 7 4 5
7 2 4 1 9
2 5
5 6 2 1 9
1 6 7
Mean of 3x3 neighborhood
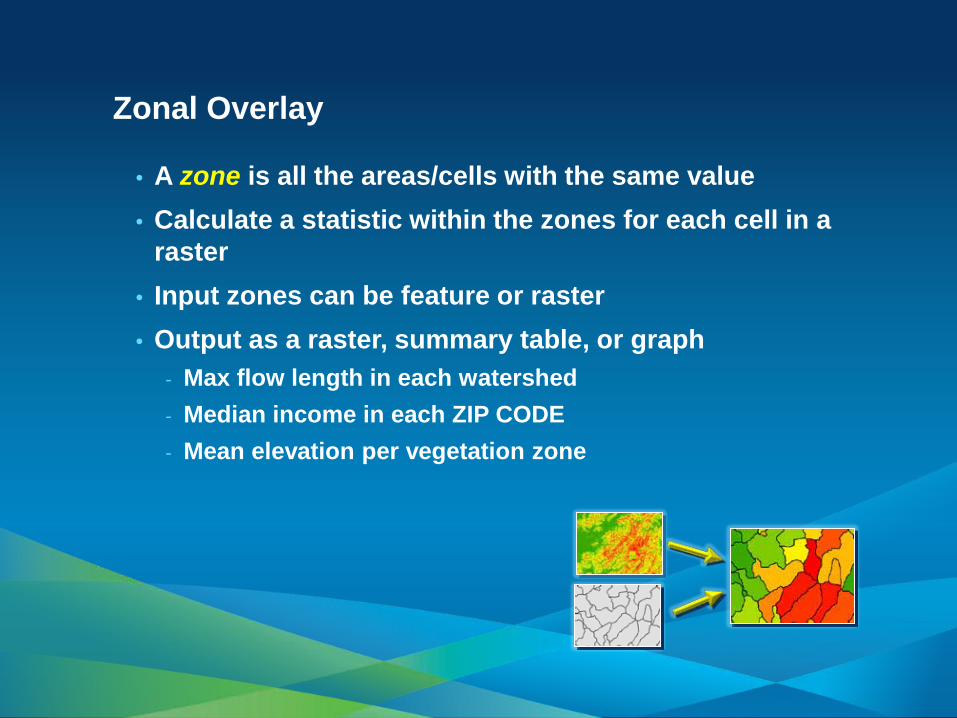
Zonal Overlay
• A zone is all the areas/cells with the same value • Calculate a statistic within the zones for each cell in a
raster • Input zones can be feature or raster • Output as a raster, summary table, or graph
- Max flow length in each watershed - Median income in each ZIP CODE - Mean elevation per vegetation zone
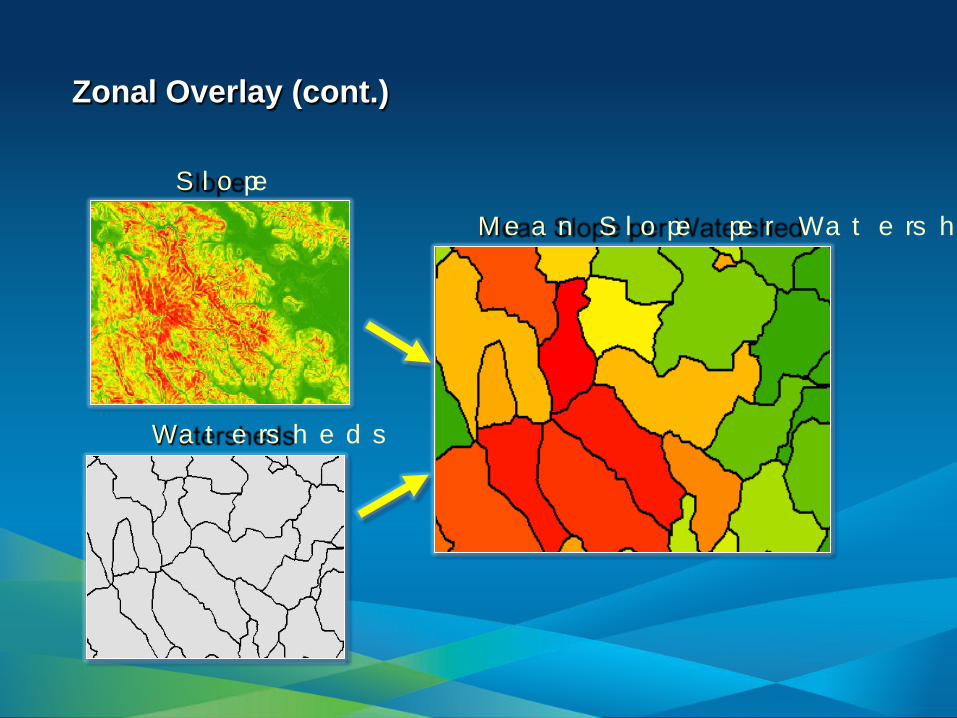
Slope
Watersheds
Mean Slope per Watershed
Zonal Overlay (cont.)
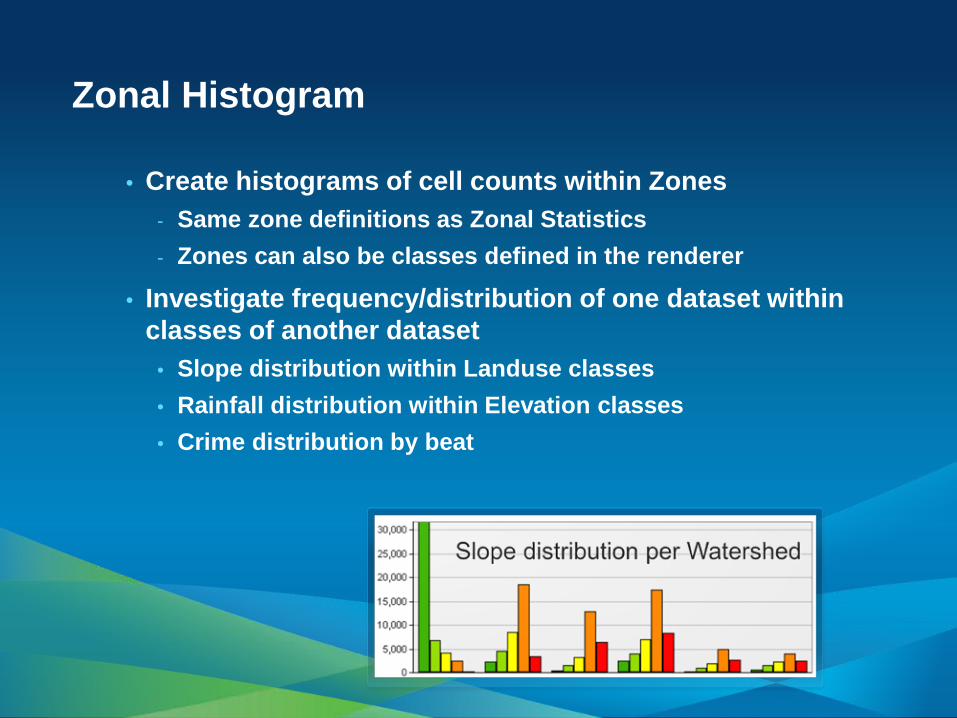
Zonal Histogram
• Create histograms of cell counts within Zones - Same zone definitions as Zonal Statistics - Zones can also be classes defined in the renderer
• Investigate frequency/distribution of one dataset within classes of another dataset
• Slope distribution within Landuse classes • Rainfall distribution within Elevation classes • Crime distribution by beat
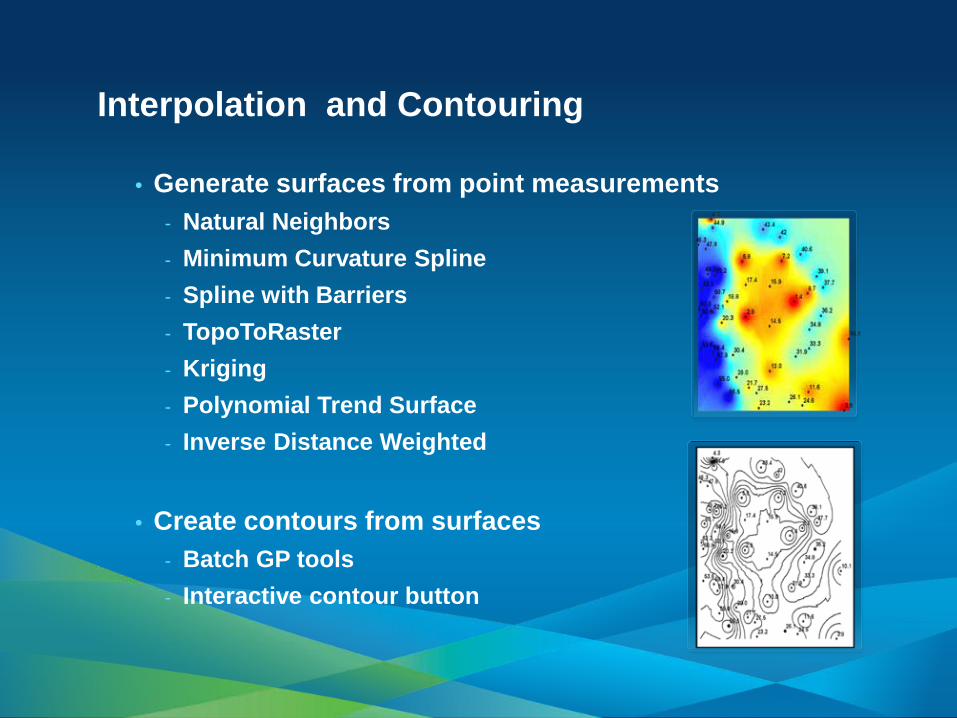
Interpolation and Contouring
• Generate surfaces from point measurements - Natural Neighbors - Minimum Curvature Spline - Spline with Barriers - TopoToRaster - Kriging - Polynomial Trend Surface - Inverse Distance Weighted
• Create contours from surfaces - Batch GP tools - Interactive contour button
Choosing an interpolation method
• You know nothing about your data… - Use Natural Neighbors. It is the most conservative. Assumes all
highs and lows are sampled, will not create artifacts. • Your input data is contours…
- Use TopoToRaster. It is optimized for contour input. If not creating a DEM, turn off the drainage enforcement option.
• You know the highs and lows are not sampled… - Use Spline. Be careful of points that are near in space but very
different in value creating unnatural artifacts. - Use Geostatistical Analyst Local Polynomial Interpolation
• Your surface is not continuous… - Use Spline with Barriers if you know there are faults or other
discontinuities in the surface. • You want or need a geostatistical technique
- Use Geostatistical Analyst Empirical Bayesian Kriging
Creating Surfaces Wednesday 8:30 in Rm 15A
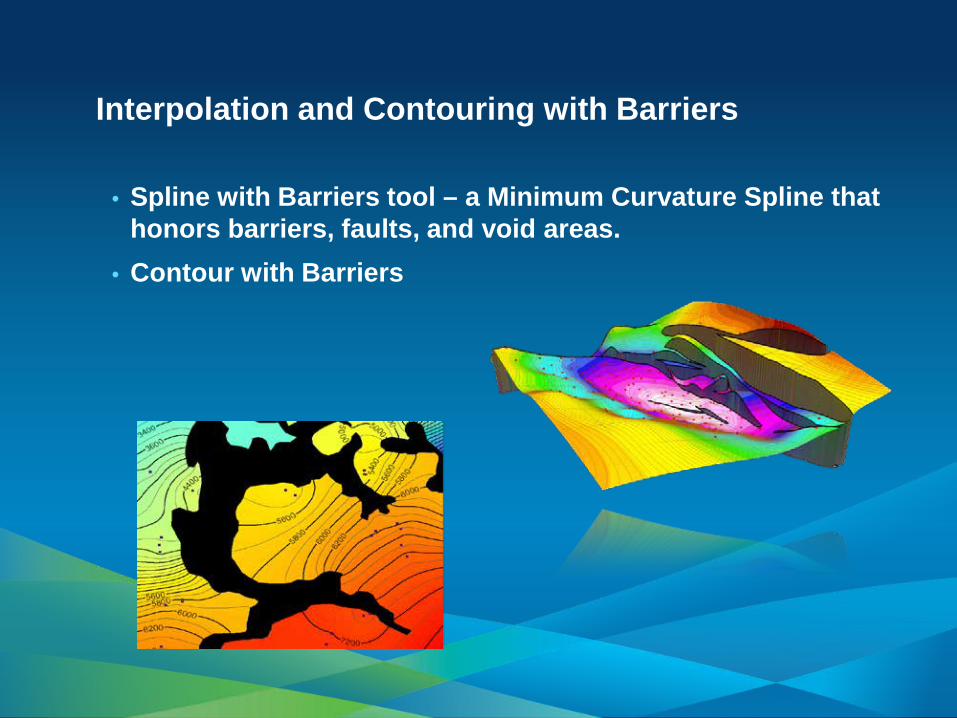
Interpolation and Contouring with Barriers
• Spline with Barriers tool – a Minimum Curvature Spline that honors barriers, faults, and void areas.
• Contour with Barriers
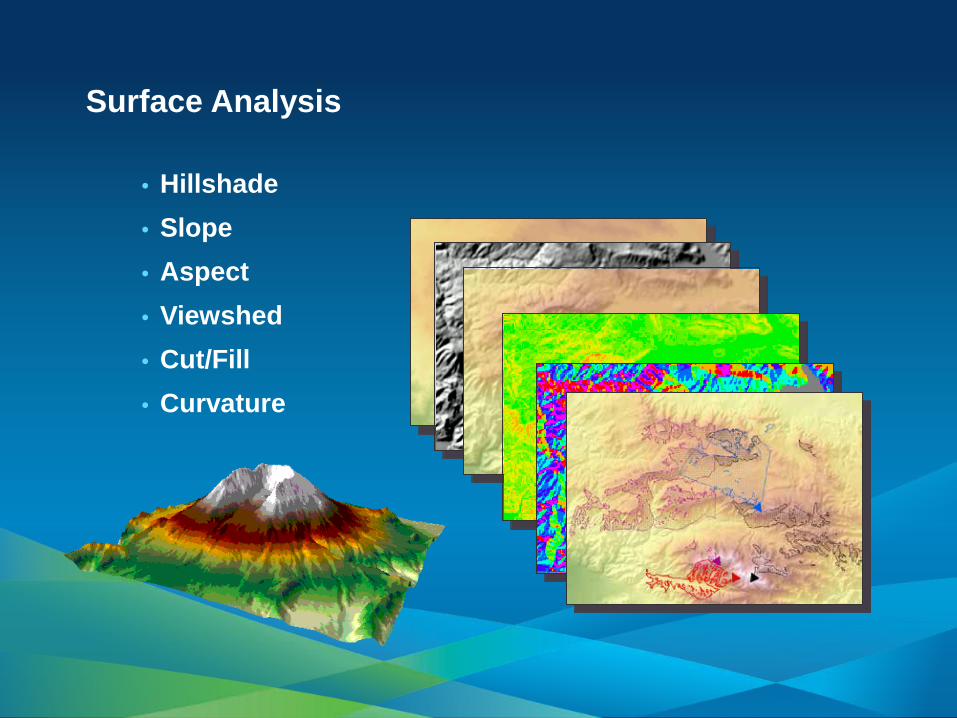
Surface Analysis
• Hillshade • Slope • Aspect • Viewshed • Cut/Fill • Curvature
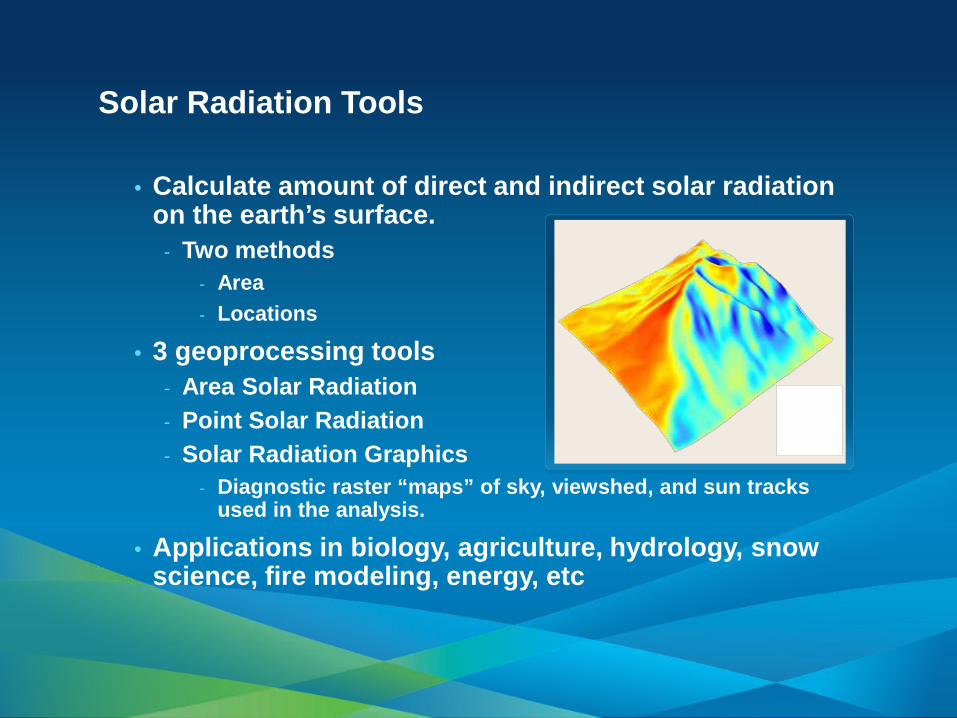
Solar Radiation Tools
• Calculate amount of direct and indirect solar radiation on the earth’s surface.
- Two methods - Area - Locations
• 3 geoprocessing tools - Area Solar Radiation - Point Solar Radiation - Solar Radiation Graphics
- Diagnostic raster “maps” of sky, viewshed, and sun tracks used in the analysis.
• Applications in biology, agriculture, hydrology, snow science, fire modeling, energy, etc
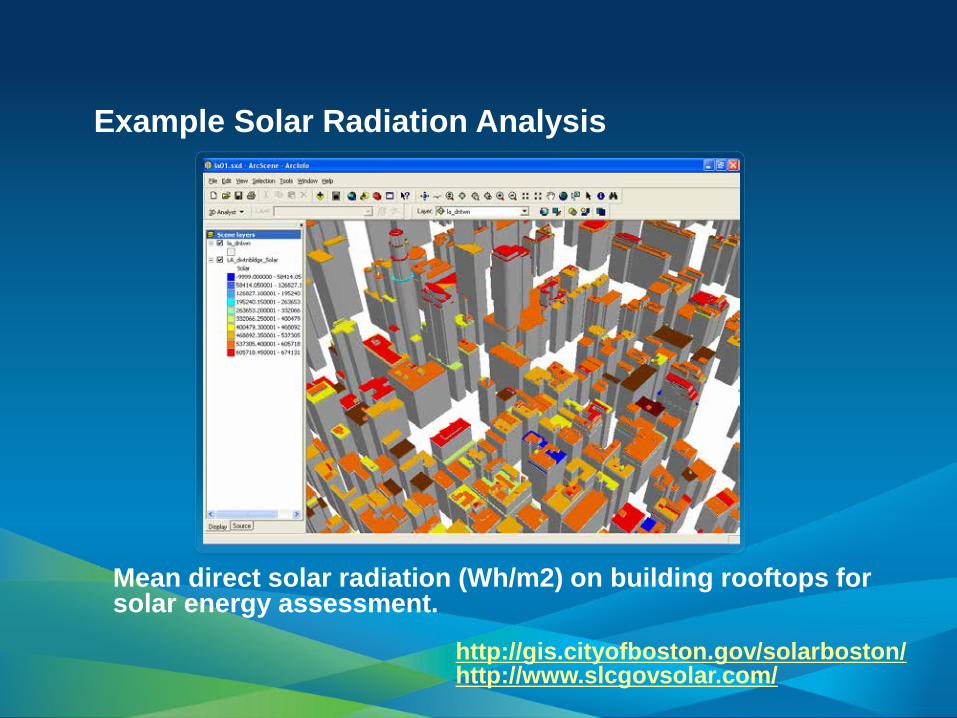
Example Solar Radiation Analysis
Mean direct solar radiation (Wh/m2) on building rooftops for solar energy assessment.
http://gis.cityofboston.gov/solarboston/ http://www.slcgovsolar.com/
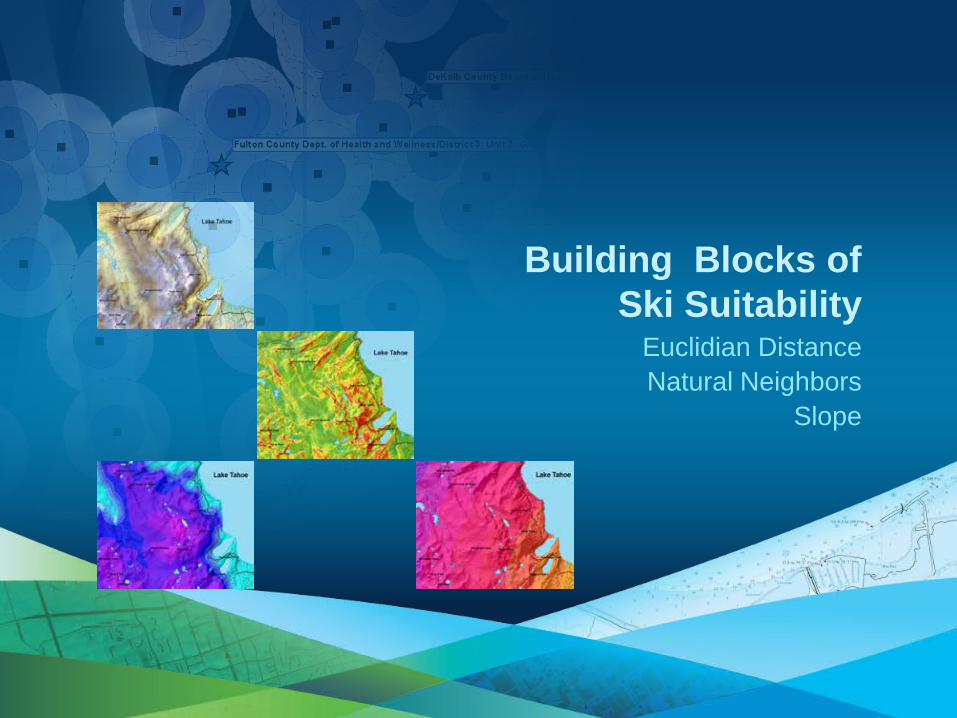
Euclidian Distance Natural Neighbors
Slope
Building Blocks of Ski Suitability
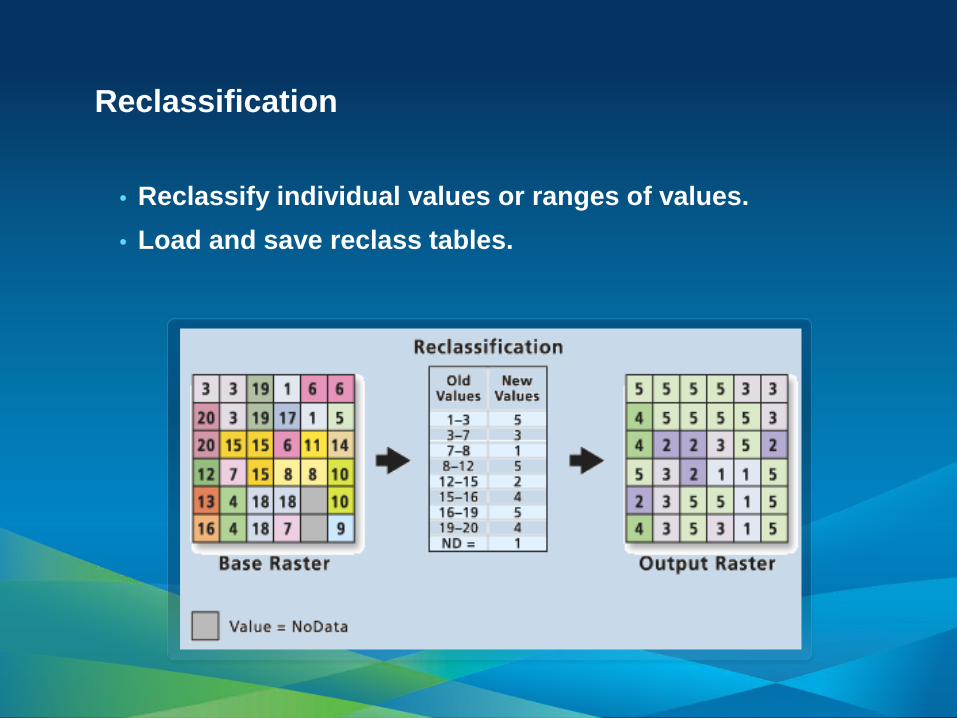
Reclassification
• Reclassify individual values or ranges of values. • Load and save reclass tables.
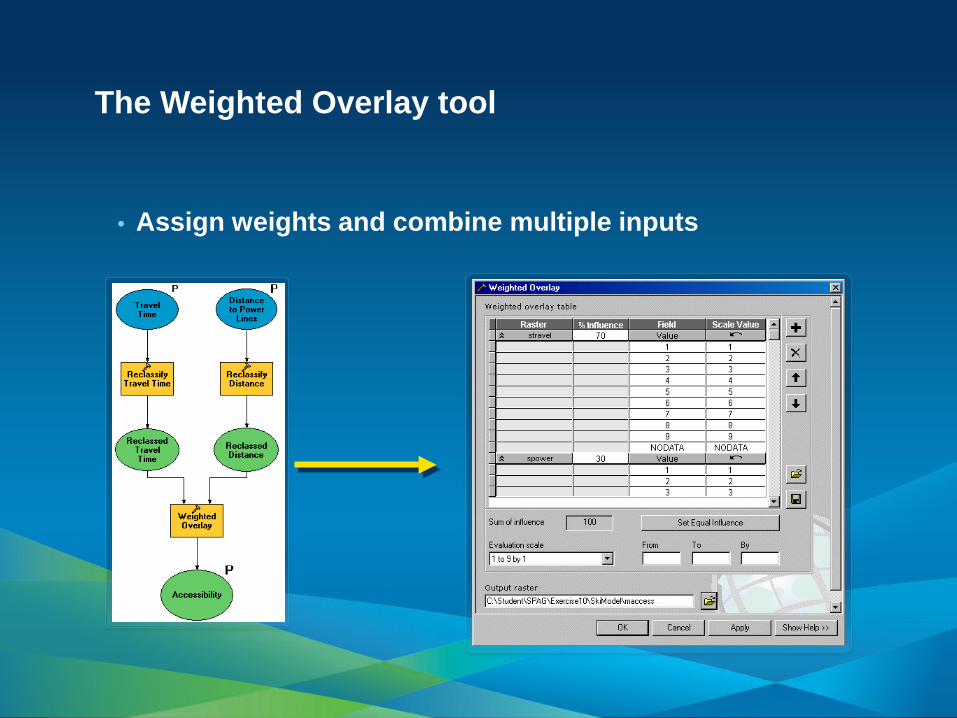
The Weighted Overlay tool
• Assign weights and combine multiple inputs
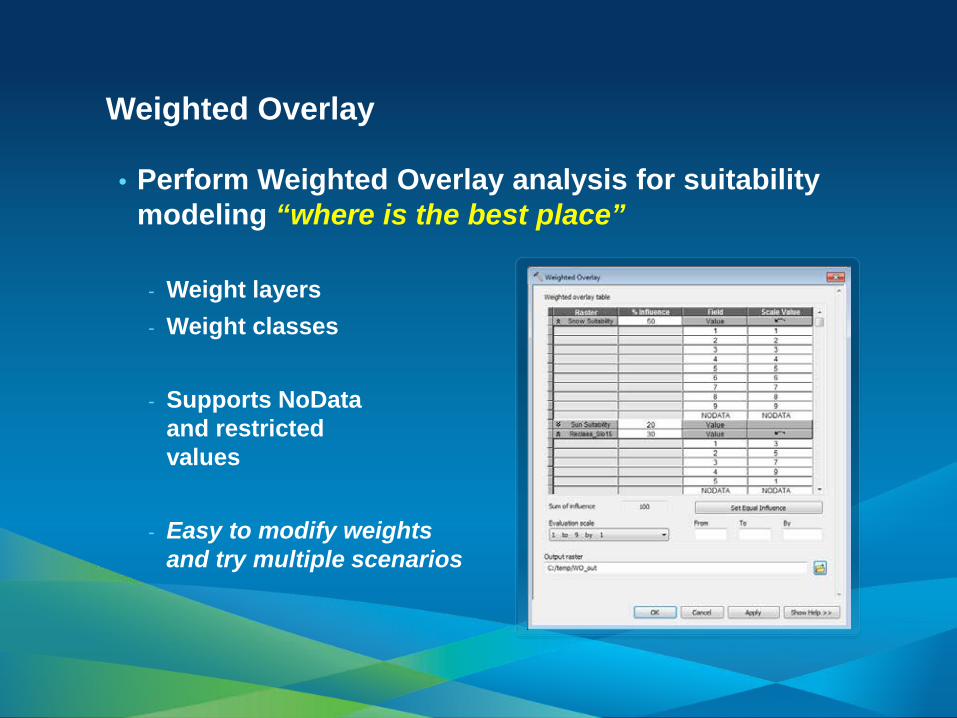
Weighted Overlay
• Perform Weighted Overlay analysis for suitability modeling “where is the best place”
- Weight layers - Weight classes - Supports NoData
and restricted values
- Easy to modify weights and try multiple scenarios
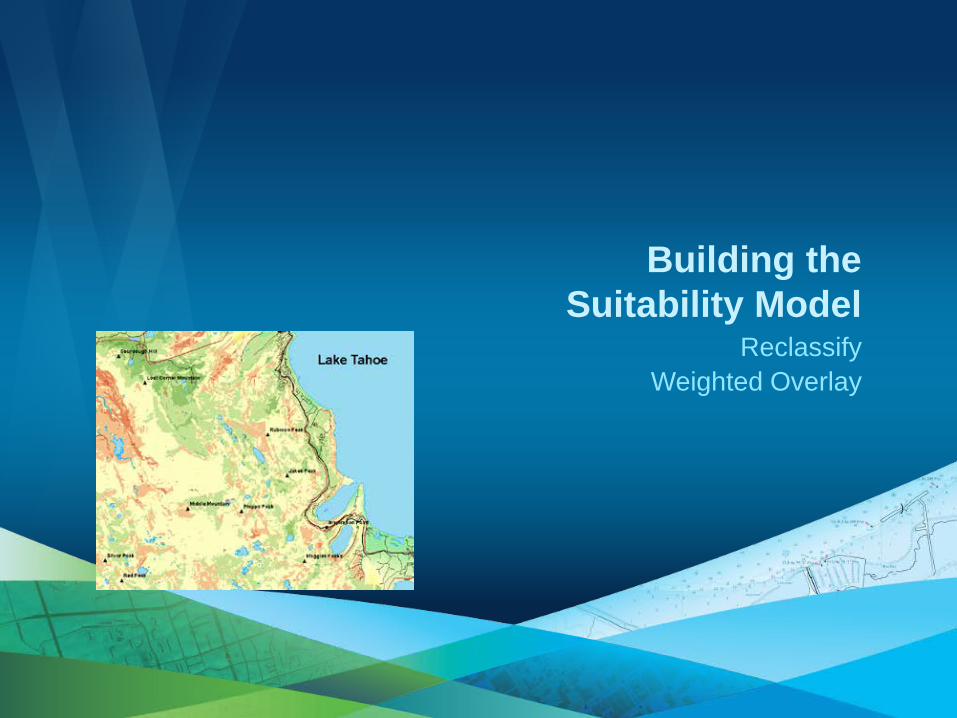
Reclassify Weighted Overlay
Building the Suitability Model
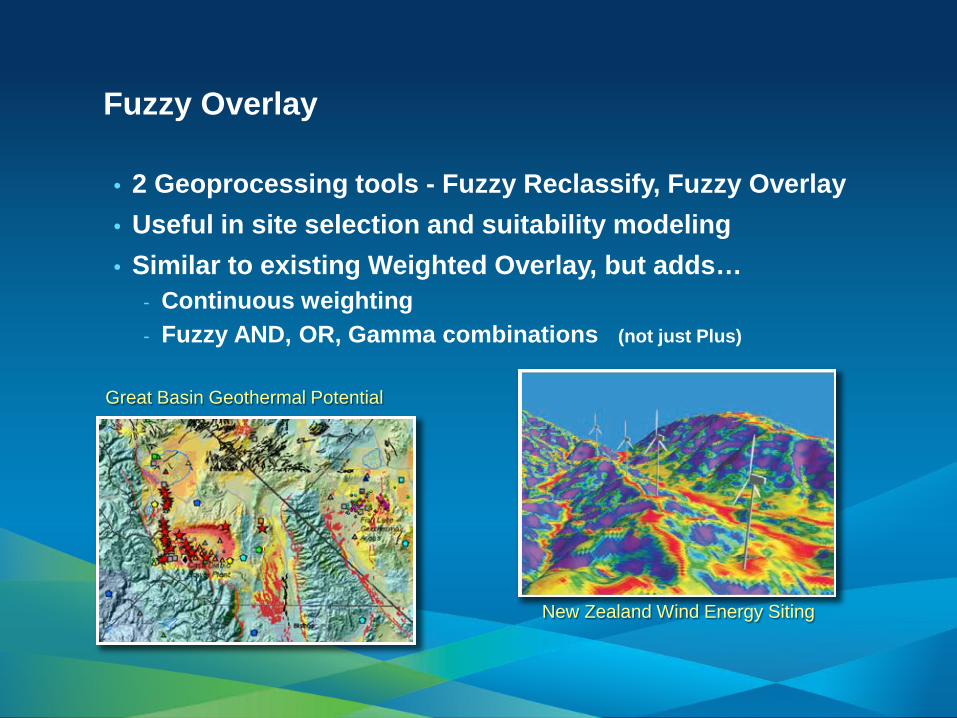
Fuzzy Overlay
• 2 Geoprocessing tools - Fuzzy Reclassify, Fuzzy Overlay • Useful in site selection and suitability modeling • Similar to existing Weighted Overlay, but adds…
- Continuous weighting - Fuzzy AND, OR, Gamma combinations (not just Plus)
Great Basin Geothermal Potential
New Zealand Wind Energy Siting
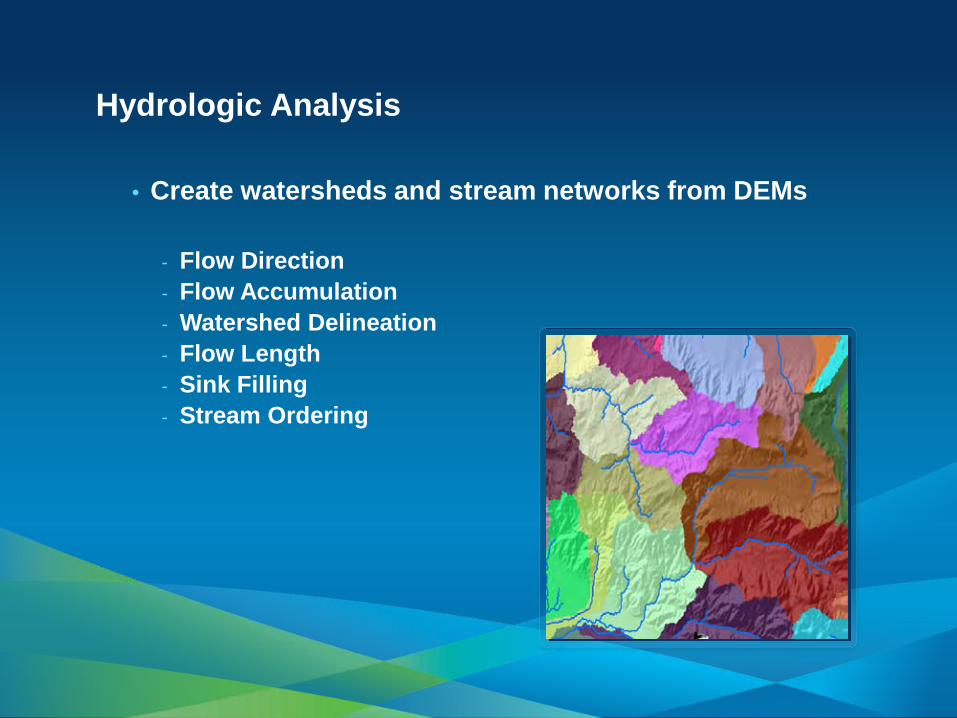
Hydrologic Analysis
• Create watersheds and stream networks from DEMs
- Flow Direction - Flow Accumulation - Watershed Delineation - Flow Length - Sink Filling - Stream Ordering
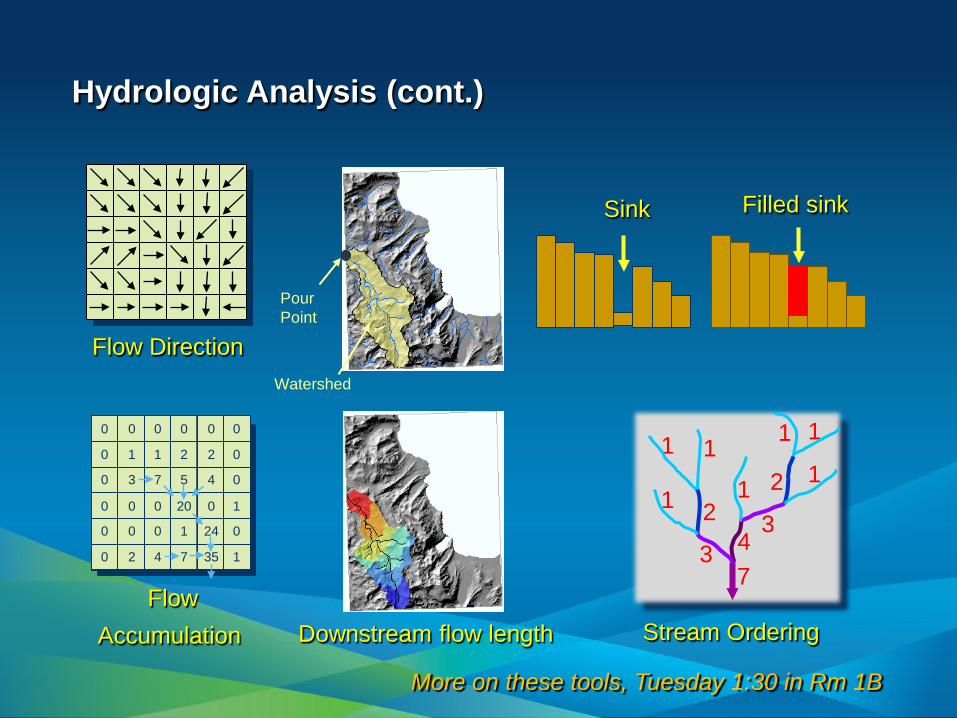
Flow Direction
Flow Accumulation
0 0
0
0 0 0
0
0
1 1 2 2 0
0 3 7 5 4 0
1 0 0 20 0 0
0 1 0 0 0 24
7 4 2 35 1
Sink Filled sink
4 7
1
1
1
1 1
1 1
2 2
3 3
Stream Ordering Downstream flow length
Pour Point
Watershed
Hydrologic Analysis (cont.)
More on these tools, Tuesday 1:30 in Rm 1B
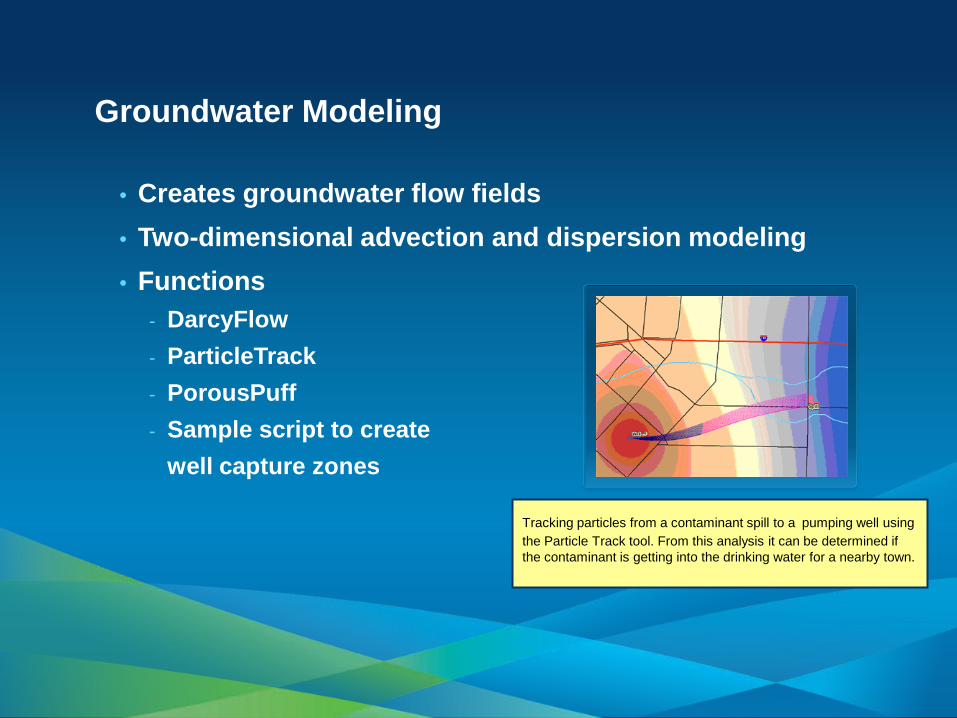
Groundwater Modeling
• Creates groundwater flow fields • Two-dimensional advection and dispersion modeling • Functions
- DarcyFlow - ParticleTrack - PorousPuff - Sample script to create well capture zones
Tracking particles from a contaminant spill to a pumping well using the Particle Track tool. From this analysis it can be determined if the contaminant is getting into the drinking water for a nearby town.
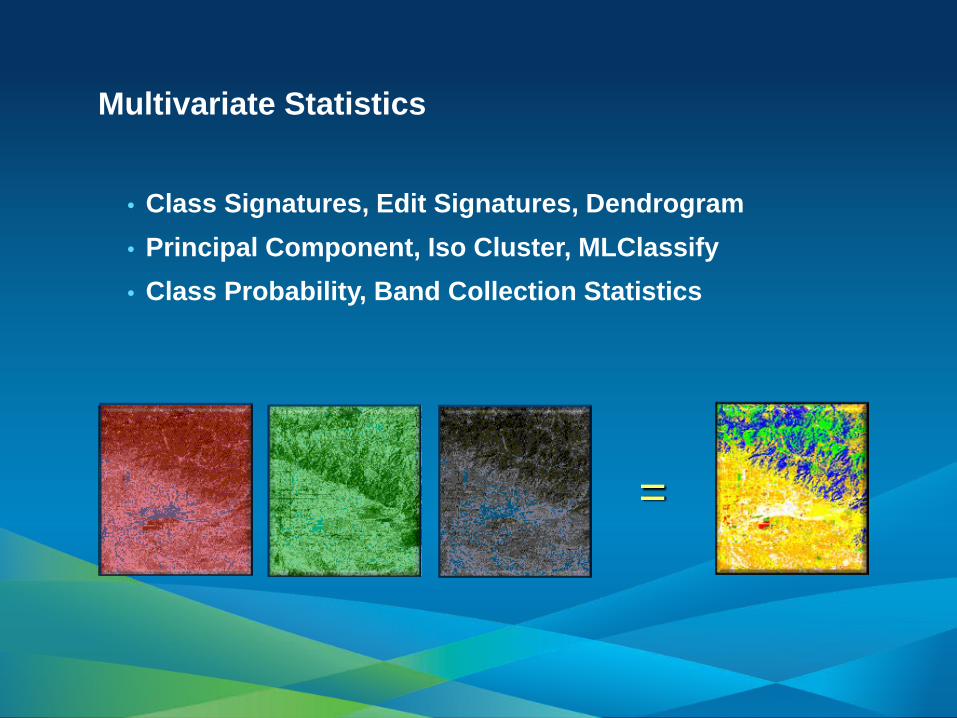
Multivariate Statistics
• Class Signatures, Edit Signatures, Dendrogram • Principal Component, Iso Cluster, MLClassify • Class Probability, Band Collection Statistics
=
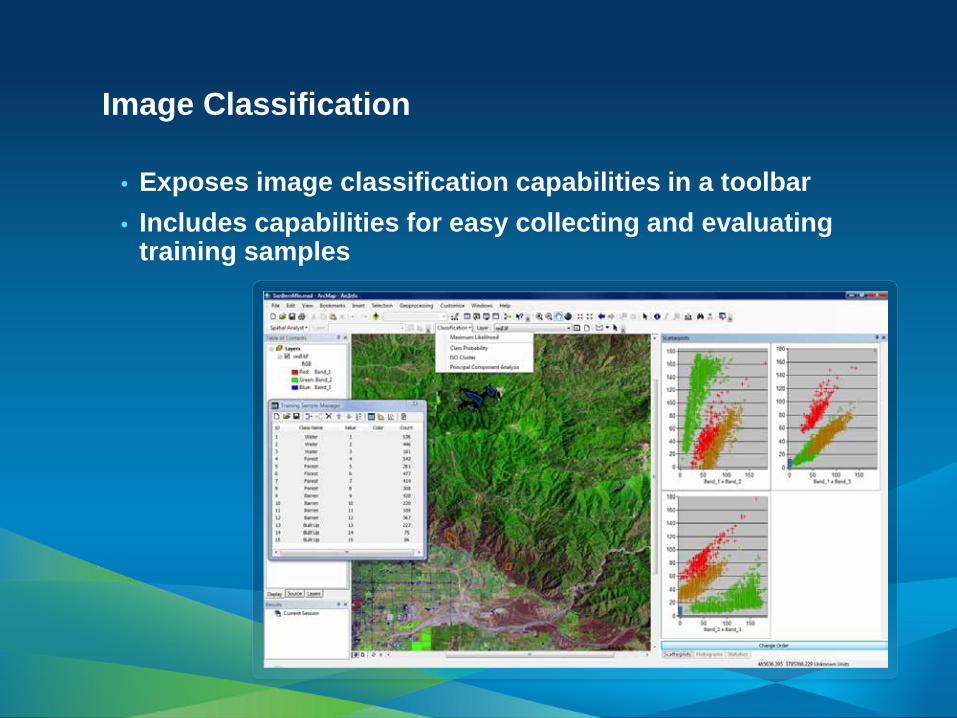
Image Classification • Exposes image classification capabilities in a toolbar • Includes capabilities for easy collecting and evaluating
training samples
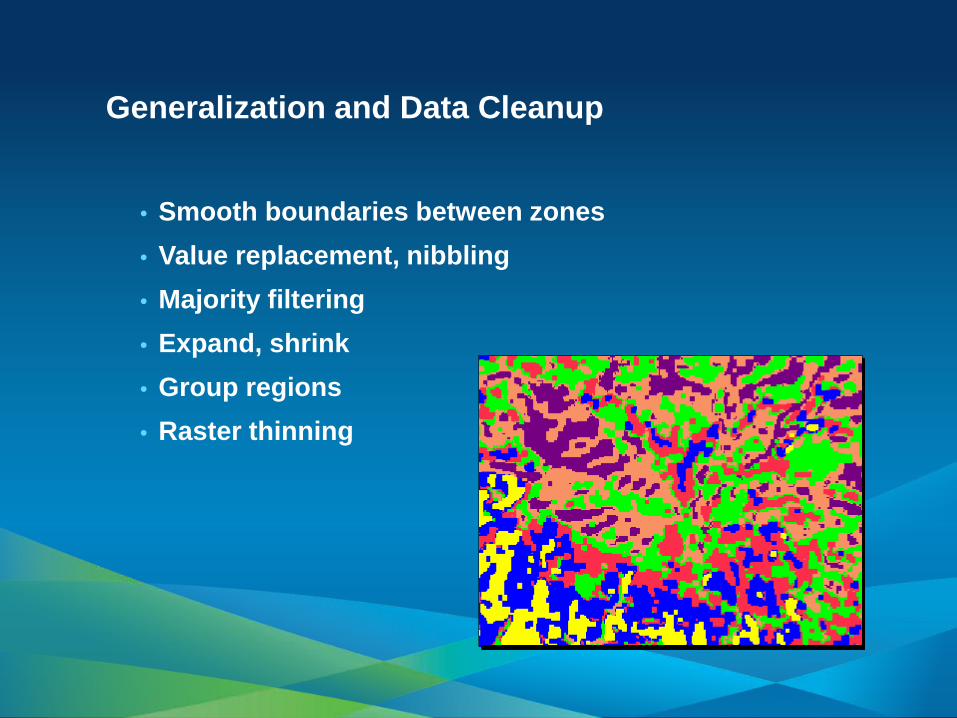
Generalization and Data Cleanup
• Smooth boundaries between zones • Value replacement, nibbling • Majority filtering • Expand, shrink • Group regions • Raster thinning

Supervised Classification
Image Classification Toolbar
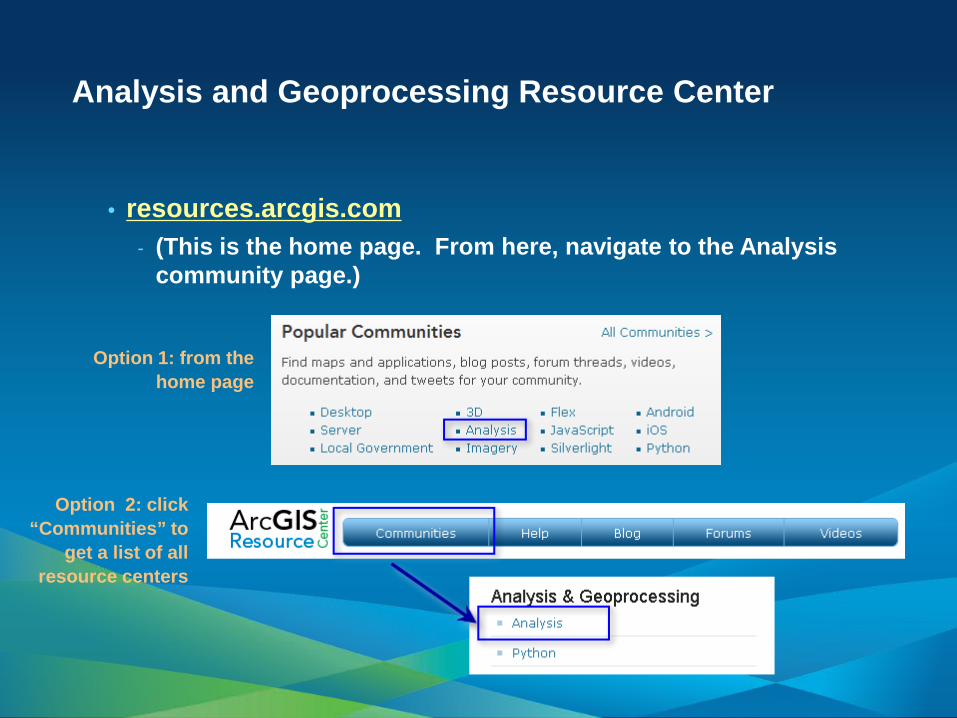
Analysis and Geoprocessing Resource Center
• resources.arcgis.com - (This is the home page. From here, navigate to the Analysis
community page.)
Option 1: from the home page
Option 2: click “Communities” to
get a list of all resource centers
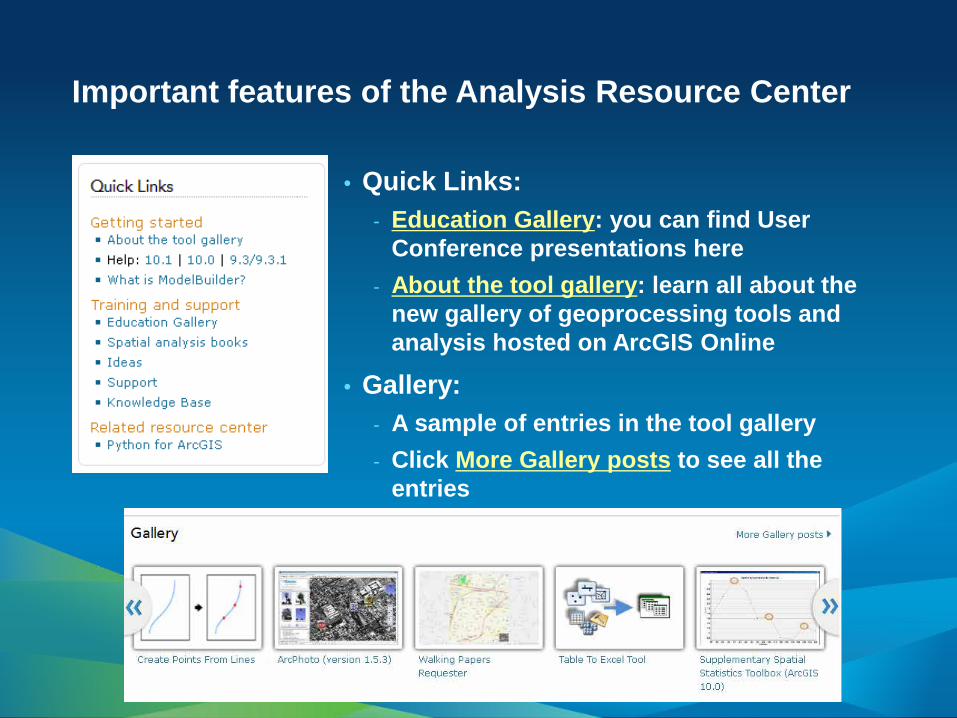
Important features of the Analysis Resource Center
• Quick Links: - Education Gallery: you can find User
Conference presentations here - About the tool gallery: learn all about the
new gallery of geoprocessing tools and analysis hosted on ArcGIS Online
• Gallery: - A sample of entries in the tool gallery - Click More Gallery posts to see all the
entries
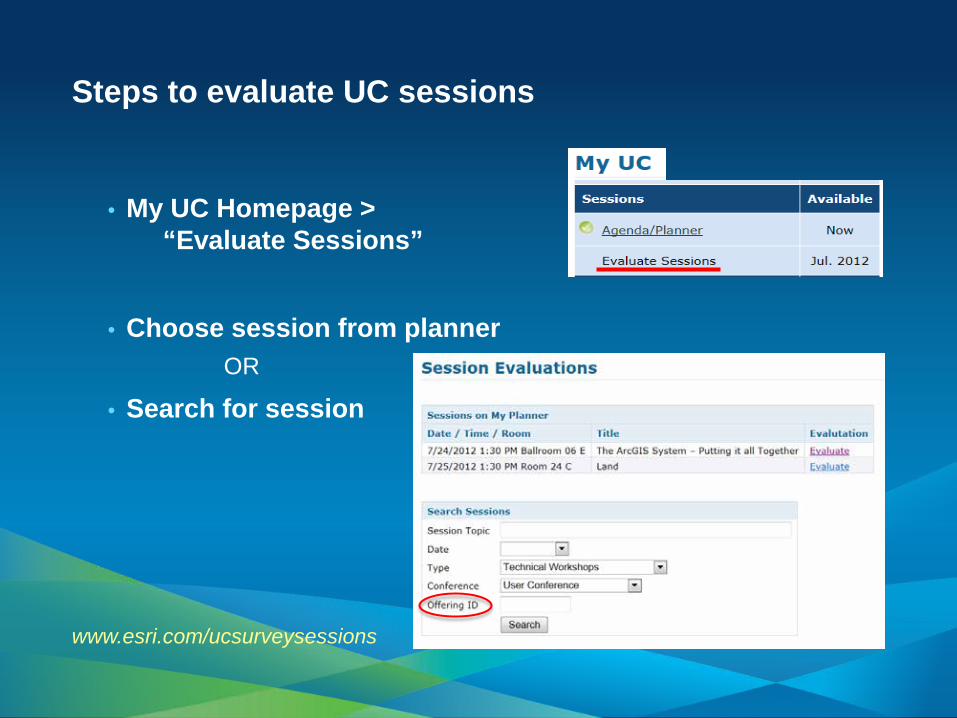
Steps to evaluate UC sessions
• My UC Homepage > “Evaluate Sessions”
• Choose session from planner OR
• Search for session
www.esri.com/ucsurveysessions

• Thank you for attending
• Have fun at UC2012
• Open for Questions
• Please fill out the evaluation:
www.esri.com/ucsessionsurveys
First Offering ID: 641
Second Offering ID: 811

ArcGIS Spatial Analyst Technical Sessions
• An Introduction - Rm 15B Tuesday, July 24, 8:30AM – 9:45AM Wed, July 25, 1:30PM – 2:45PM • Suitability Modeling - Rm 15A Tuesday, July 24, 10:15AM – 11:30AM Thursday, July 26, 3:15PM – 4:30PM • Raster Analysis with Python – Ballroom 6E Tuesday, July 23, 3:15PM – 4:30PM Thursday, July 25, 3:15PM – 4:30PM • Creating Surfaces – Rm 15A Wednesday, July 25, 8:30PM – 9:45PM
ArcGIS Spatial Analyst Short Technical Sessions
• Creating Watersheds and Stream Networks – Rm 01B Tuesday, July 24, 1:30 PM – 1:50PM • Performing Regression Analysis Using Raster Data – 01A Tuesday, July 24, 9:20AM – 9:40AM
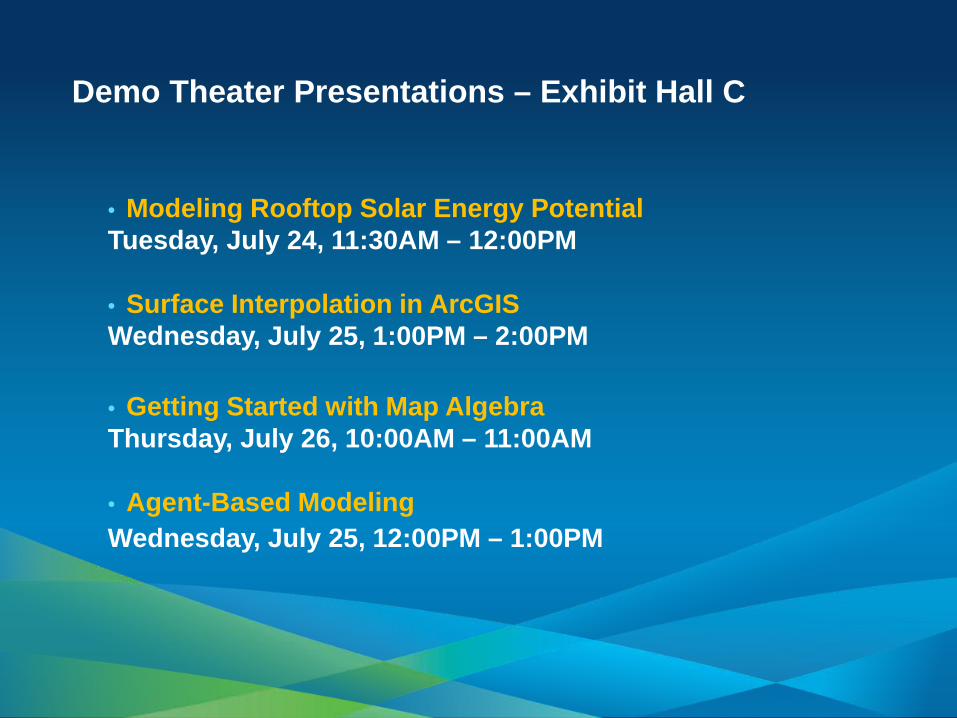
Demo Theater Presentations – Exhibit Hall C
• Modeling Rooftop Solar Energy Potential Tuesday, July 24, 11:30AM – 12:00PM • Surface Interpolation in ArcGIS Wednesday, July 25, 1:00PM – 2:00PM • Getting Started with Map Algebra Thursday, July 26, 10:00AM – 11:00AM • Agent-Based Modeling Wednesday, July 25, 12:00PM – 1:00PM

Recommended