1
Edward A. Keller
Introduction to Environmental Geology, 5e
Chapter 7Tsunami
© 2012 Pearson Education, Inc.
Lecture Presentationprepared byX. Mara Chen, Salisbury University
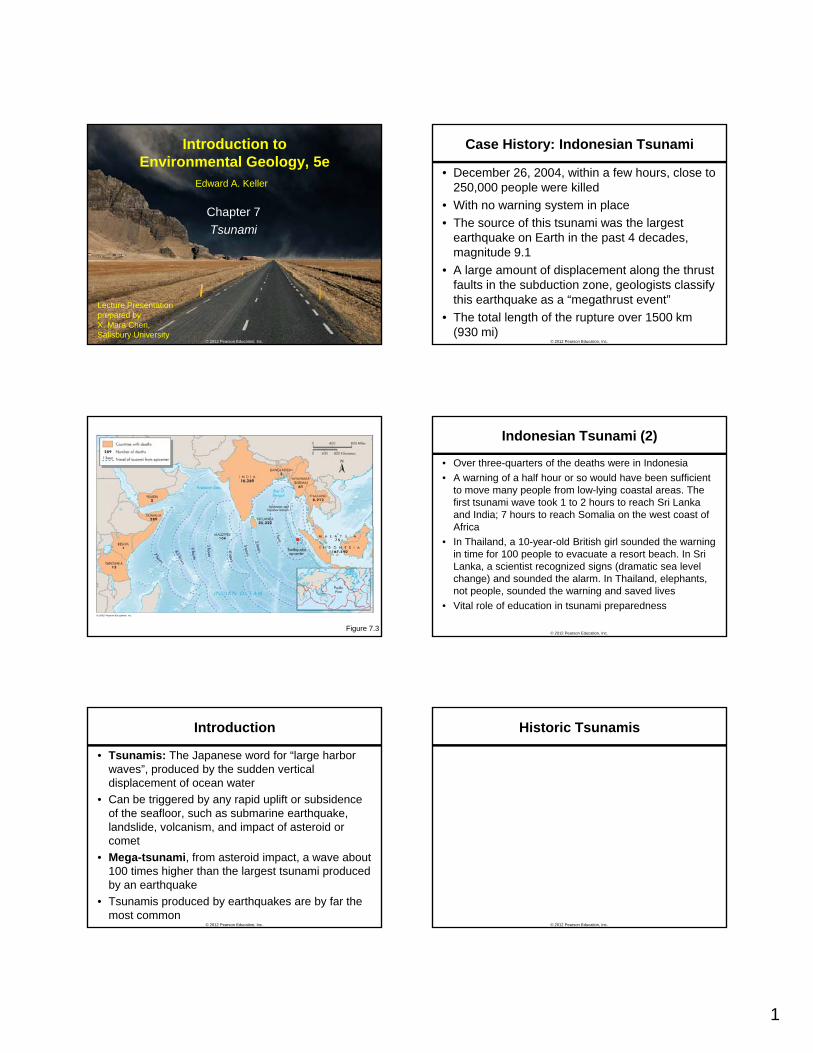
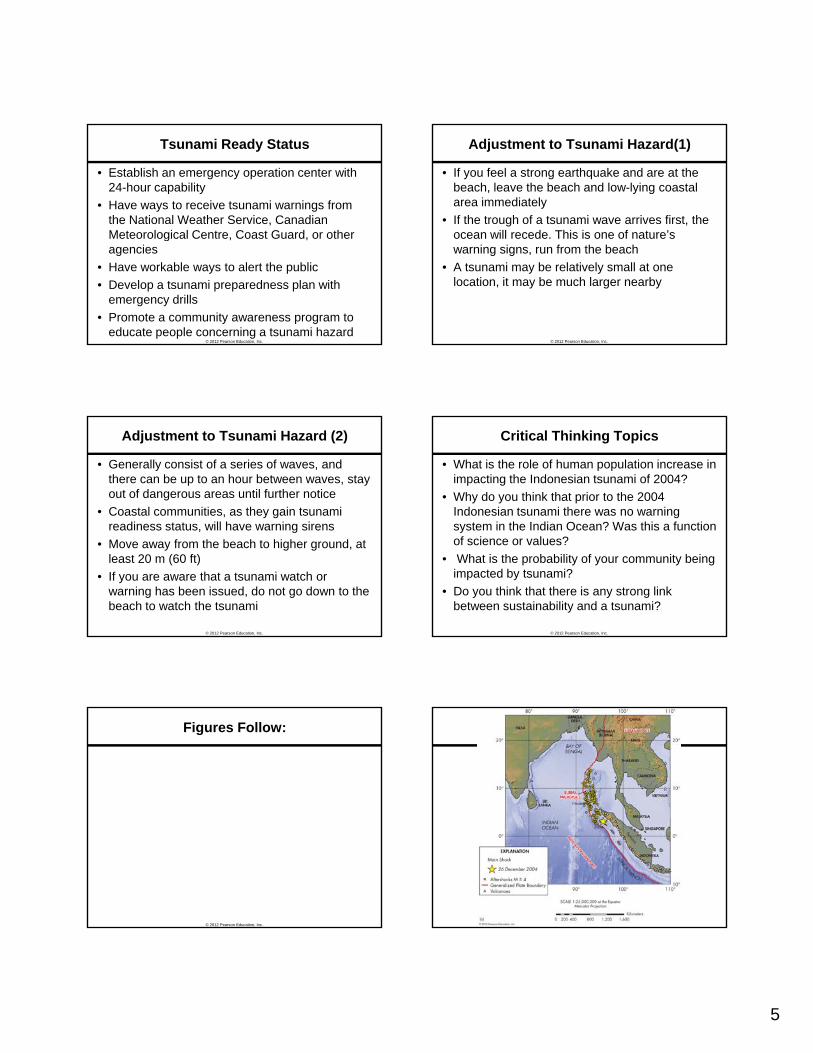
Case History: Indonesian Tsunami
• December 26, 2004, within a few hours, close to 250,000 people were killed
• With no warning system in place• The source of this tsunami was the largest
th k E th i th t 4 d d
© 2012 Pearson Education, Inc.
earthquake on Earth in the past 4 decades, magnitude 9.1
• A large amount of displacement along the thrust faults in the subduction zone, geologists classify this earthquake as a “megathrust event”
• The total length of the rupture over 1500 km (930 mi)
Figure 7.3
Indonesian Tsunami (2)
• Over three-quarters of the deaths were in Indonesia• A warning of a half hour or so would have been sufficient
to move many people from low-lying coastal areas. The first tsunami wave took 1 to 2 hours to reach Sri Lanka and India; 7 hours to reach Somalia on the west coast of Africa
© 2012 Pearson Education, Inc.
Africa • In Thailand, a 10-year-old British girl sounded the warning
in time for 100 people to evacuate a resort beach. In Sri Lanka, a scientist recognized signs (dramatic sea level change) and sounded the alarm. In Thailand, elephants, not people, sounded the warning and saved lives
• Vital role of education in tsunami preparedness
Introduction
• Tsunamis: The Japanese word for “large harbor waves”, produced by the sudden vertical displacement of ocean water
• Can be triggered by any rapid uplift or subsidence of the seafloor, such as submarine earthquake,
© 2012 Pearson Education, Inc.
, q ,landslide, volcanism, and impact of asteroid or comet
• Mega-tsunami, from asteroid impact, a wave about 100 times higher than the largest tsunami produced by an earthquake
• Tsunamis produced by earthquakes are by far the most common
Historic Tsunamis
© 2012 Pearson Education, Inc.
2
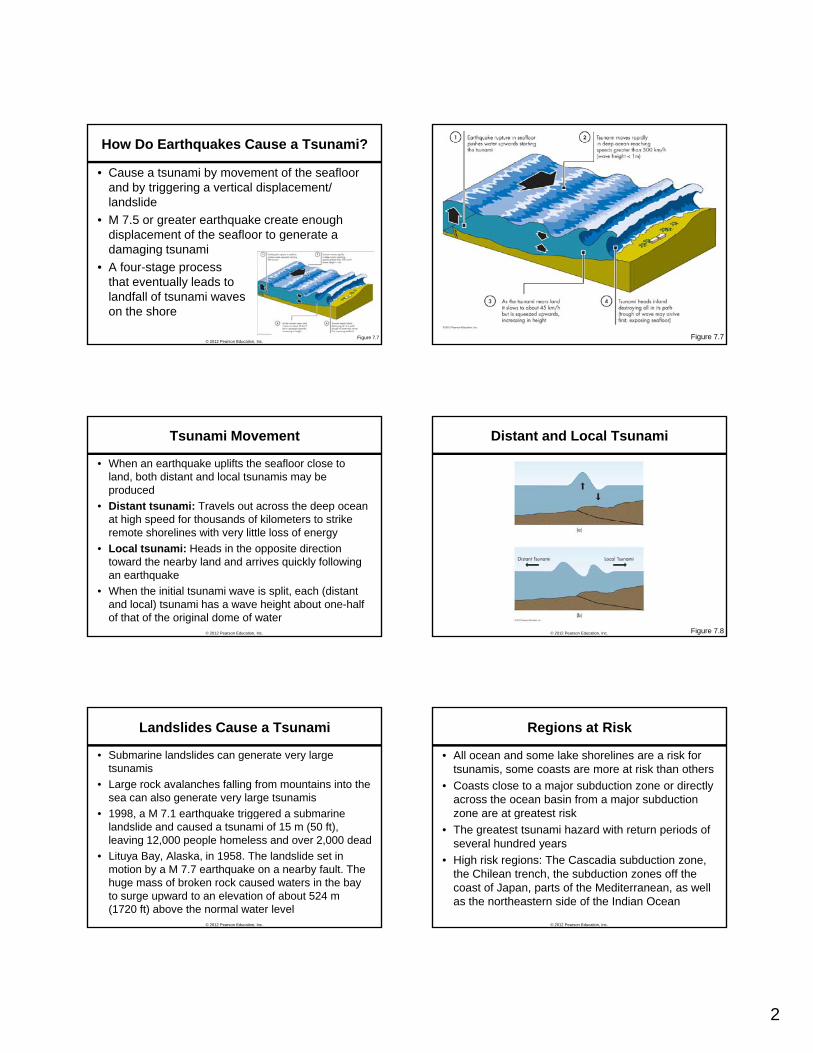
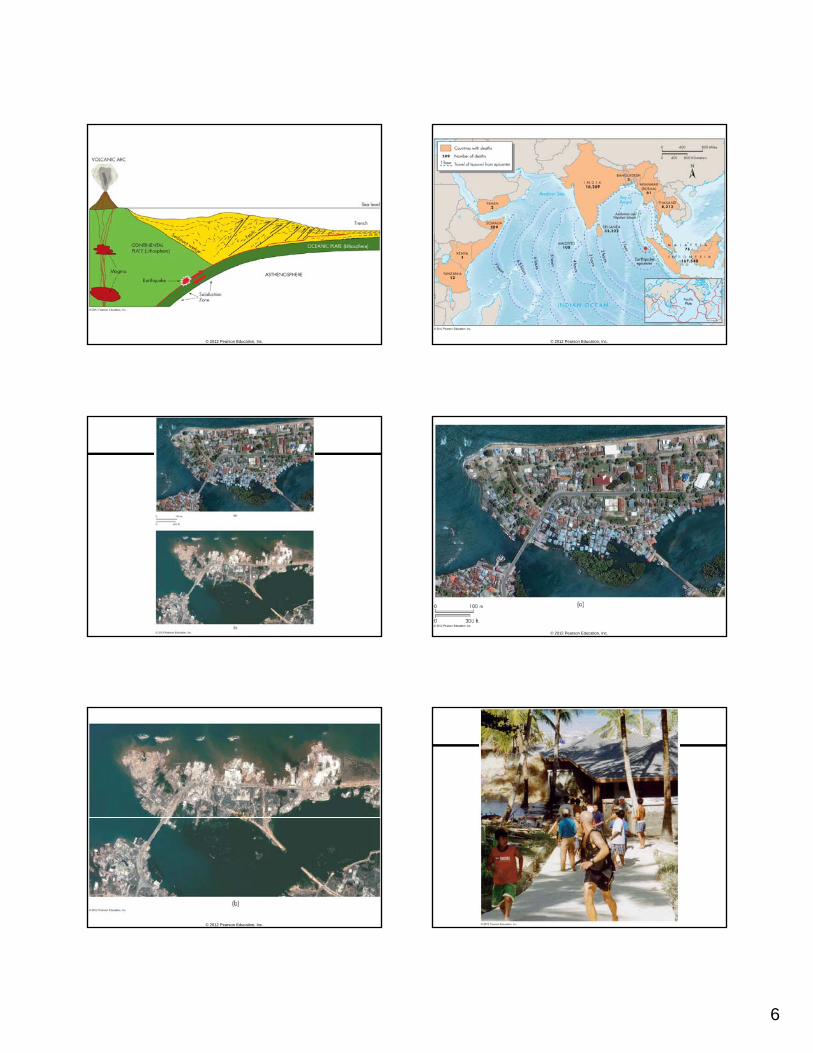
How Do Earthquakes Cause a Tsunami?
• Cause a tsunami by movement of the seafloor and by triggering a vertical displacement/ landslide
• M 7.5 or greater earthquake create enough displacement of the seafloor to generate a
© 2012 Pearson Education, Inc.
displacement of the seafloor to generate a damaging tsunami
• A four-stage process that eventually leads to landfall of tsunami waves on the shore
Figure 7.7 Figure 7.7
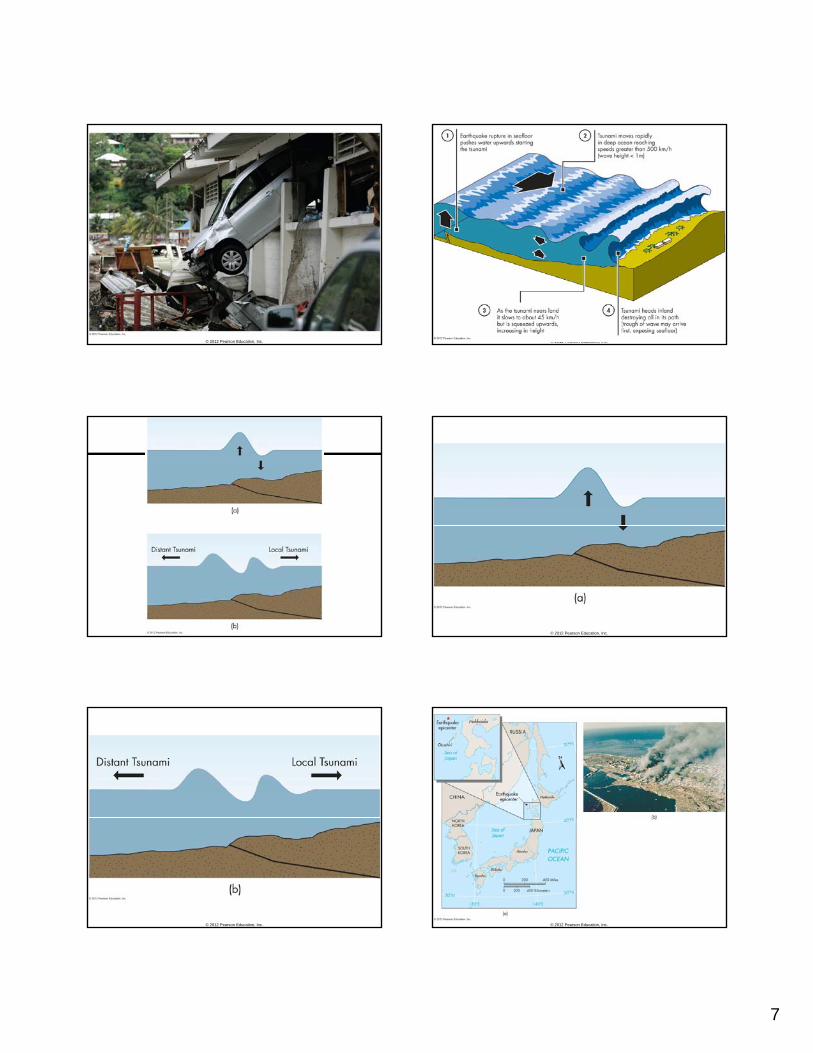
Tsunami Movement
• When an earthquake uplifts the seafloor close to land, both distant and local tsunamis may be produced
• Distant tsunami: Travels out across the deep ocean at high speed for thousands of kilometers to strike
© 2012 Pearson Education, Inc.
remote shorelines with very little loss of energy• Local tsunami: Heads in the opposite direction
toward the nearby land and arrives quickly following an earthquake
• When the initial tsunami wave is split, each (distant and local) tsunami has a wave height about one-half of that of the original dome of water
Distant and Local Tsunami
© 2012 Pearson Education, Inc. Figure 7.8
Landslides Cause a Tsunami
• Submarine landslides can generate very large tsunamis
• Large rock avalanches falling from mountains into the sea can also generate very large tsunamis
• 1998, a M 7.1 earthquake triggered a submarine
© 2012 Pearson Education, Inc.
, q gglandslide and caused a tsunami of 15 m (50 ft), leaving 12,000 people homeless and over 2,000 dead
• Lituya Bay, Alaska, in 1958. The landslide set in motion by a M 7.7 earthquake on a nearby fault. The huge mass of broken rock caused waters in the bay to surge upward to an elevation of about 524 m (1720 ft) above the normal water level
Regions at Risk
• All ocean and some lake shorelines are a risk for tsunamis, some coasts are more at risk than others
• Coasts close to a major subduction zone or directly across the ocean basin from a major subduction zone are at greatest risk
© 2012 Pearson Education, Inc.
g• The greatest tsunami hazard with return periods of
several hundred years• High risk regions: The Cascadia subduction zone,
the Chilean trench, the subduction zones off the coast of Japan, parts of the Mediterranean, as well as the northeastern side of the Indian Ocean
3
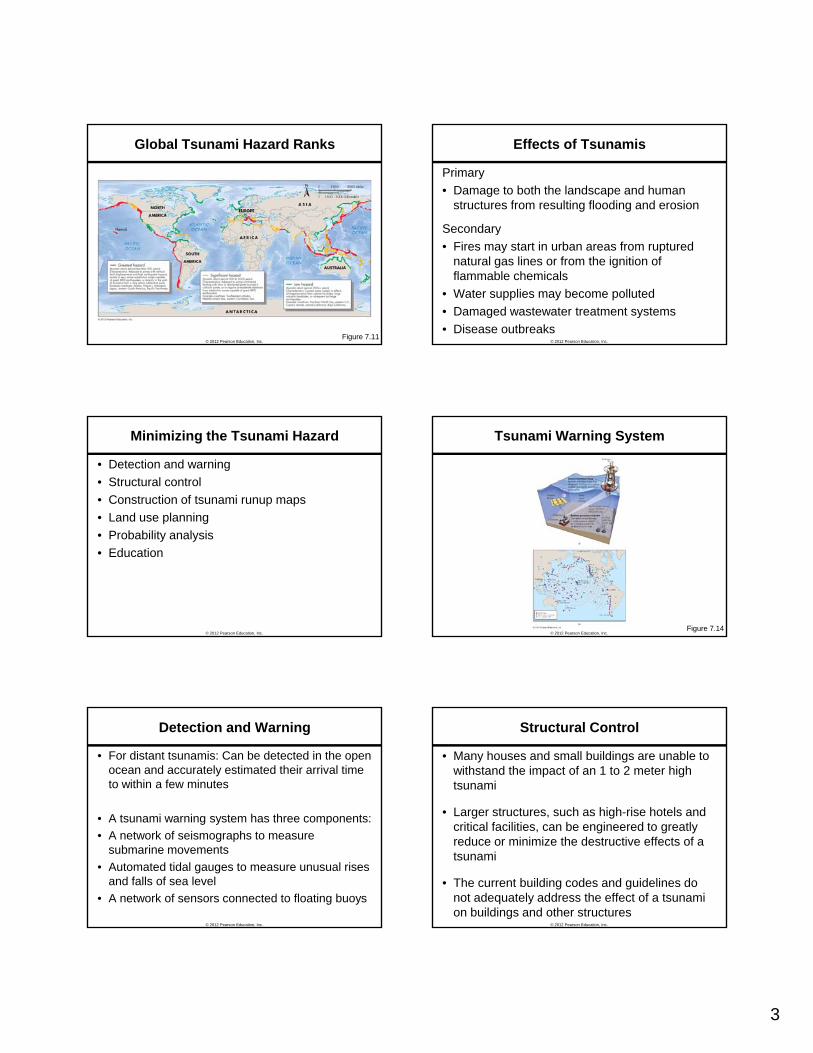
Global Tsunami Hazard Ranks
© 2012 Pearson Education, Inc.Figure 7.11
Effects of Tsunamis
Primary • Damage to both the landscape and human
structures from resulting flooding and erosion
Secondary
© 2012 Pearson Education, Inc.
y• Fires may start in urban areas from ruptured
natural gas lines or from the ignition of flammable chemicals
• Water supplies may become polluted • Damaged wastewater treatment systems• Disease outbreaks
Minimizing the Tsunami Hazard
• Detection and warning • Structural control • Construction of tsunami runup maps • Land use planning
© 2012 Pearson Education, Inc.
• Probability analysis • Education
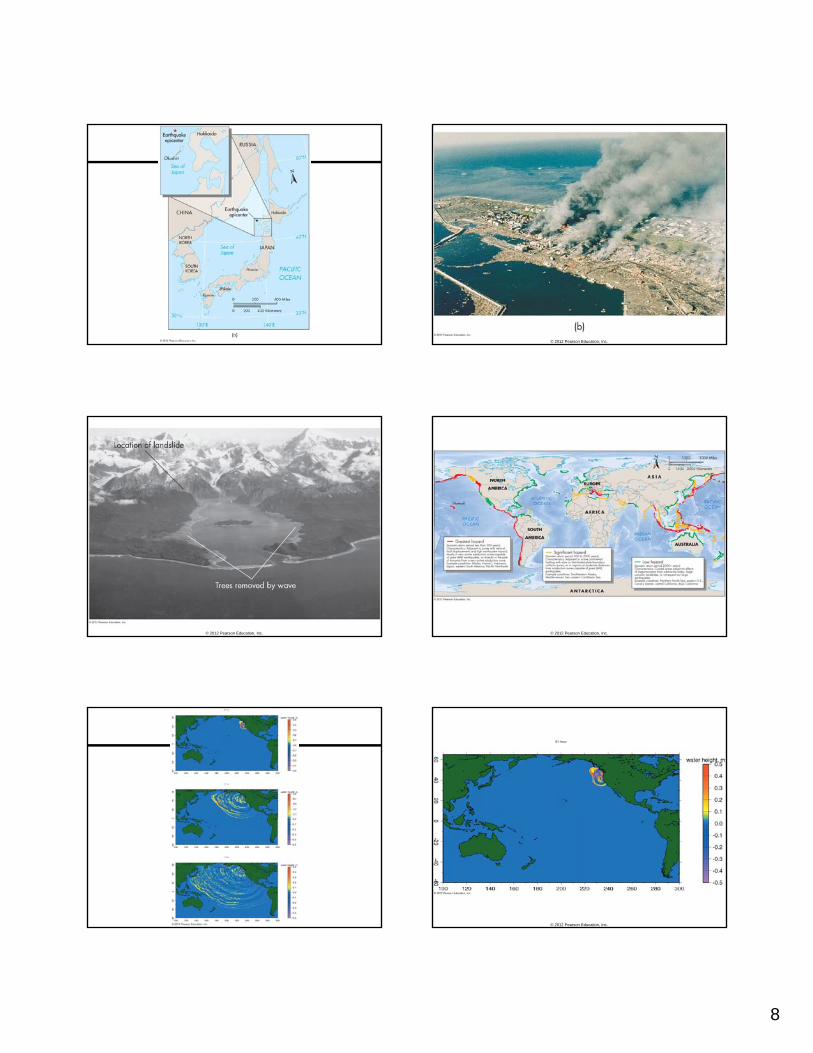
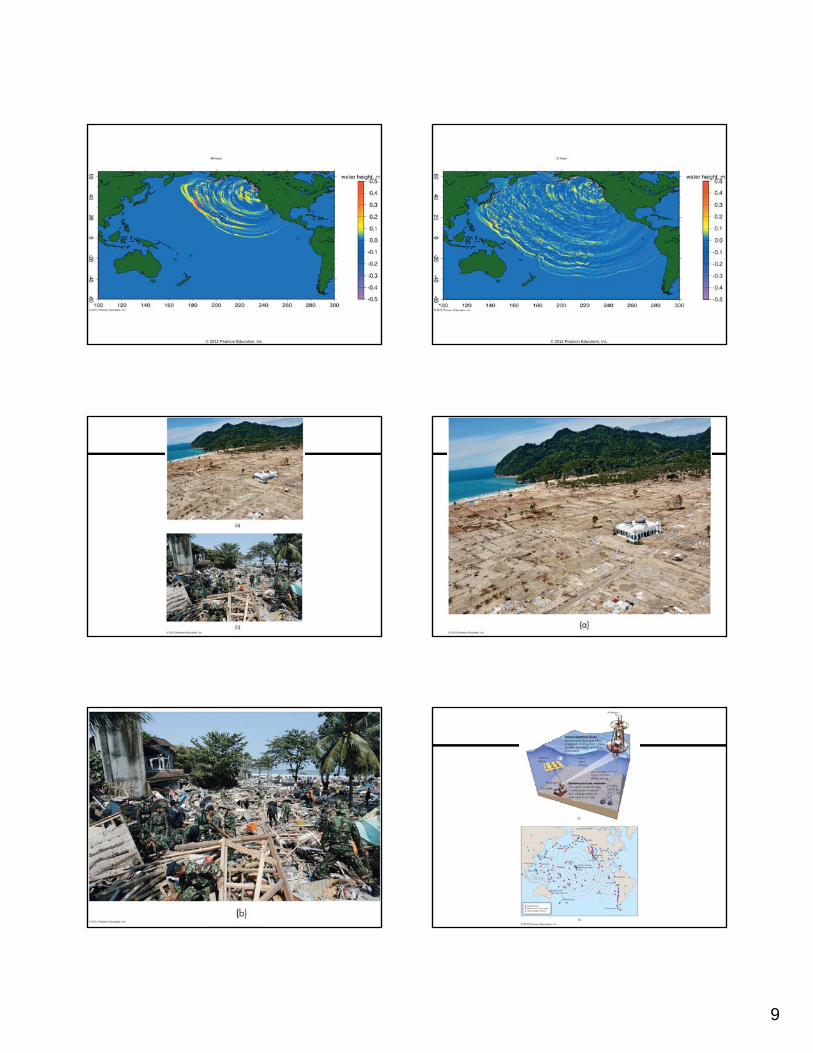
Tsunami Warning System
© 2012 Pearson Education, Inc.Figure 7.14
Detection and Warning
• For distant tsunamis: Can be detected in the open ocean and accurately estimated their arrival time to within a few minutes
• A tsunami warning system has three components:
© 2012 Pearson Education, Inc.
• A tsunami warning system has three components: • A network of seismographs to measure
submarine movements • Automated tidal gauges to measure unusual rises
and falls of sea level • A network of sensors connected to floating buoys
Structural Control
• Many houses and small buildings are unable to withstand the impact of an 1 to 2 meter high tsunami
• Larger structures, such as high-rise hotels and
© 2012 Pearson Education, Inc.
g gcritical facilities, can be engineered to greatly reduce or minimize the destructive effects of a tsunami
• The current building codes and guidelines do not adequately address the effect of a tsunami on buildings and other structures
4
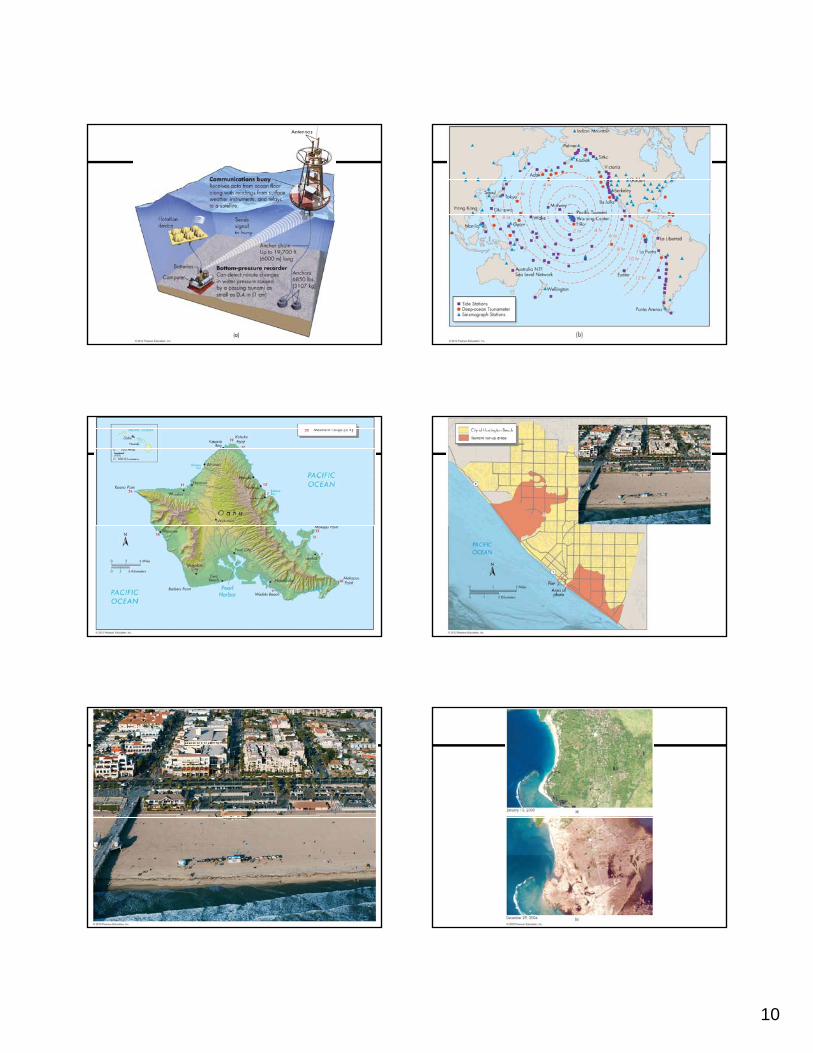
Tsunami Runup Maps
• Shows the level to which the water traveled inland
• Before a tsunami strikes, a community can d h d th t h th th t
© 2012 Pearson Education, Inc.
produce a hazard map that shows the area that is likely to be inundated by a given height
• Many coastal cities and areas have produced tsunami runup maps, and this trend will undoubtedly continue
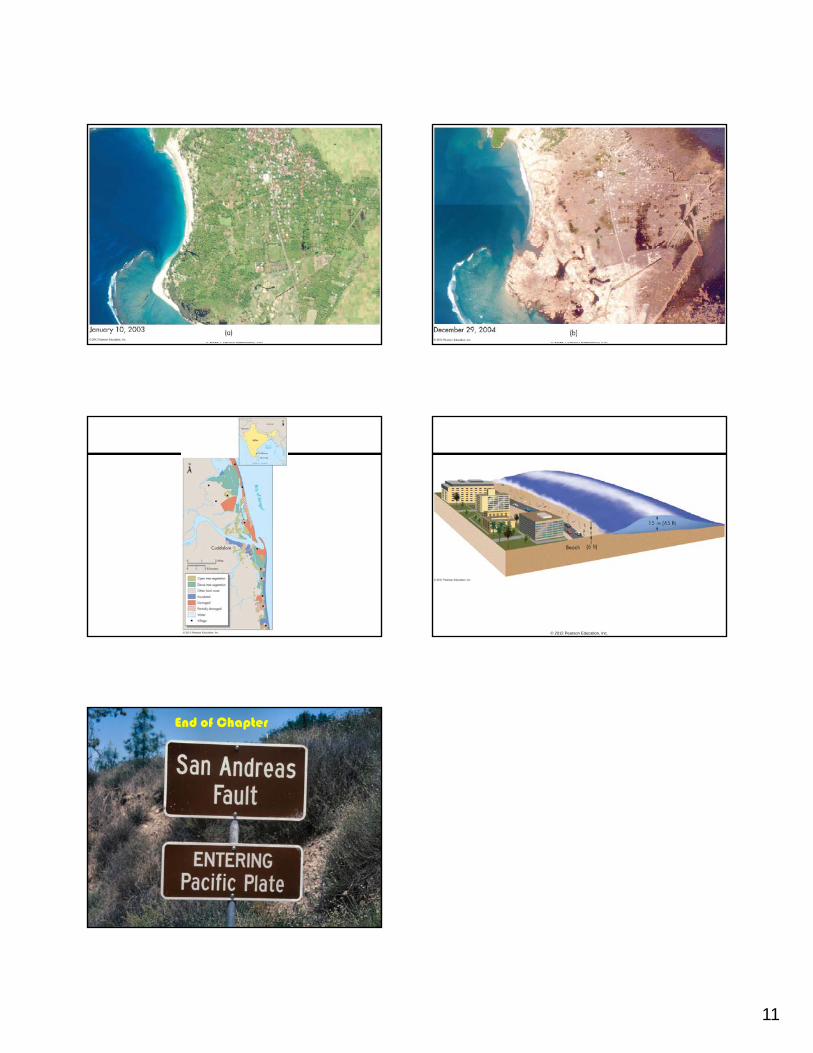
Land Use Planning
• The 2004 Indonesian tsunami showed tropical ecology played a role in determining tsunami damage
• Villages spared from destruction were partly protected from the energy of the tsunami by either a coastal mangrove forest or several rows of plantation
© 2012 Pearson Education, Inc.
g ptrees that reduced the velocity of incoming water
• Planting or retaining native vegetation could provide a partial buffer from a small to moderate tsunami attack
• Don’t rely on land use planning, the best and safest approach to lessen the tsunami hazard is quick evacuation. Trees cannot stop large tsunami
Probability Analysis
• The risk of a particular event may be defined as the product of the probability of that event occurring and the consequences
• Developing a probabilistic analysis of the tsunami hazard is to:Id tif d if th t ti l th k
© 2012 Pearson Education, Inc.
• Identify and specify the potential earthquake sources • Specify relationships that will either attenuate or reduce
tsunami waves • Apply probabilistic analysis to the tsunami hazard similar
to what is currently being done for earthquake hazard analysis
• Probabilistic approach to tsunami hazard assessment is still being developed
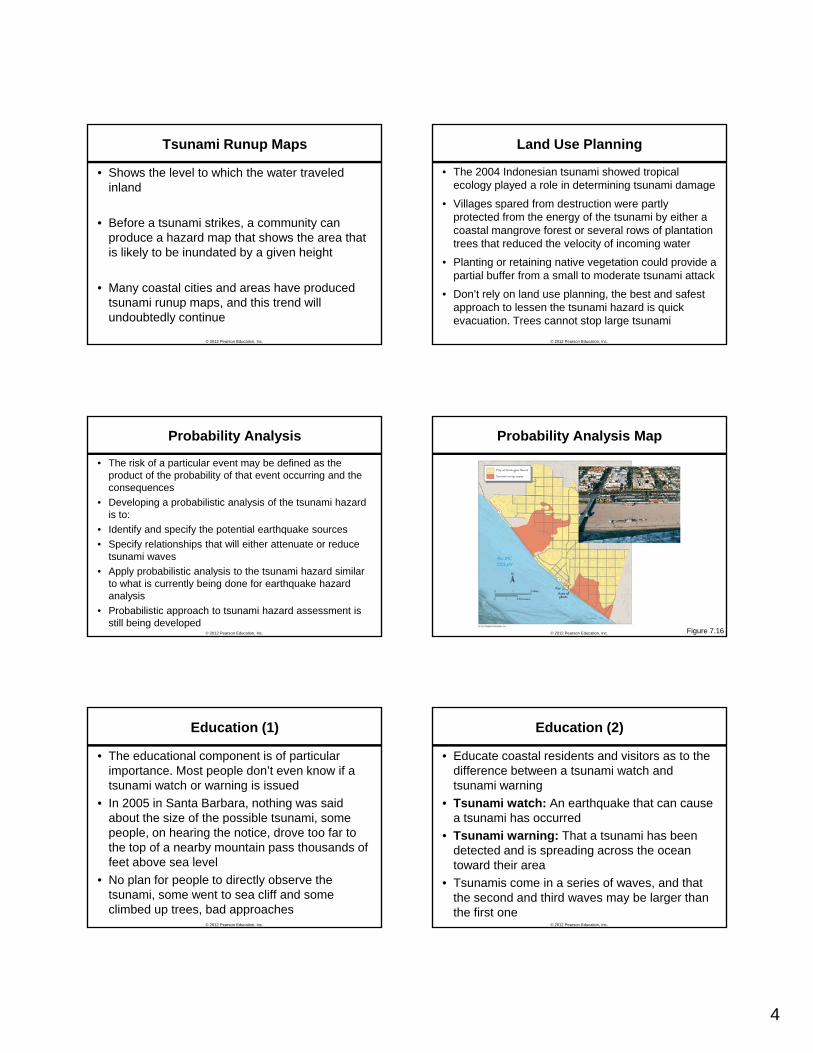
Probability Analysis Map
© 2012 Pearson Education, Inc. Figure 7.16
Education (1)
• The educational component is of particular importance. Most people don’t even know if a tsunami watch or warning is issued
• In 2005 in Santa Barbara, nothing was said about the size of the possible tsunami some
© 2012 Pearson Education, Inc.
about the size of the possible tsunami, some people, on hearing the notice, drove too far to the top of a nearby mountain pass thousands of feet above sea level
• No plan for people to directly observe the tsunami, some went to sea cliff and some climbed up trees, bad approaches
Education (2)
• Educate coastal residents and visitors as to the difference between a tsunami watch and tsunami warning
• Tsunami watch: An earthquake that can cause a tsunami has occurred
© 2012 Pearson Education, Inc.
a tsunami has occurred• Tsunami warning: That a tsunami has been
detected and is spreading across the ocean toward their area
• Tsunamis come in a series of waves, and that the second and third waves may be larger than the first one
5
Tsunami Ready Status
• Establish an emergency operation center with 24-hour capability
• Have ways to receive tsunami warnings from the National Weather Service, Canadian Meteorological Centre Coast Guard or other
© 2012 Pearson Education, Inc.
Meteorological Centre, Coast Guard, or other agencies
• Have workable ways to alert the public • Develop a tsunami preparedness plan with
emergency drills • Promote a community awareness program to
educate people concerning a tsunami hazard
Adjustment to Tsunami Hazard(1)
• If you feel a strong earthquake and are at the beach, leave the beach and low-lying coastal area immediately
• If the trough of a tsunami wave arrives first, the ocean will recede This is one of nature’s
© 2012 Pearson Education, Inc.
ocean will recede. This is one of nature s warning signs, run from the beach
• A tsunami may be relatively small at one location, it may be much larger nearby
Adjustment to Tsunami Hazard (2)
• Generally consist of a series of waves, and there can be up to an hour between waves, stay out of dangerous areas until further notice
• Coastal communities, as they gain tsunami readiness status will have warning sirens
© 2012 Pearson Education, Inc.
readiness status, will have warning sirens• Move away from the beach to higher ground, at
least 20 m (60 ft) • If you are aware that a tsunami watch or
warning has been issued, do not go down to the beach to watch the tsunami
Critical Thinking Topics
• What is the role of human population increase in impacting the Indonesian tsunami of 2004?
• Why do you think that prior to the 2004 Indonesian tsunami there was no warning system in the Indian Ocean? Was this a function
© 2012 Pearson Education, Inc.
system in the Indian Ocean? Was this a function of science or values?
• What is the probability of your community being impacted by tsunami?
• Do you think that there is any strong link between sustainability and a tsunami?
Figures Follow:
© 2012 Pearson Education, Inc. © 2012 Pearson Education, Inc.
6
© 2012 Pearson Education, Inc. © 2012 Pearson Education, Inc.
© 2012 Pearson Education, Inc. © 2012 Pearson Education, Inc.
© 2012 Pearson Education, Inc. © 2012 Pearson Education, Inc.
7
© 2012 Pearson Education, Inc. © 2012 Pearson Education, Inc.
© 2012 Pearson Education, Inc. © 2012 Pearson Education, Inc.
© 2012 Pearson Education, Inc. © 2012 Pearson Education, Inc.
8
© 2012 Pearson Education, Inc. © 2012 Pearson Education, Inc.
© 2012 Pearson Education, Inc. © 2012 Pearson Education, Inc.
© 2012 Pearson Education, Inc. © 2012 Pearson Education, Inc.
9
© 2012 Pearson Education, Inc. © 2012 Pearson Education, Inc.
© 2012 Pearson Education, Inc. © 2012 Pearson Education, Inc.
© 2012 Pearson Education, Inc. © 2012 Pearson Education, Inc.
10
© 2012 Pearson Education, Inc. © 2012 Pearson Education, Inc.
© 2012 Pearson Education, Inc. © 2012 Pearson Education, Inc.
© 2012 Pearson Education, Inc. © 2012 Pearson Education, Inc.
11
© 2012 Pearson Education, Inc. © 2012 Pearson Education, Inc.
© 2012 Pearson Education, Inc. © 2012 Pearson Education, Inc.
End of Chapter
© 2012 Pearson Education, Inc.
Recommended