Introduction to mmwave Sensing: FMCW Radars
Sandeep Rao, Texas Instruments
1
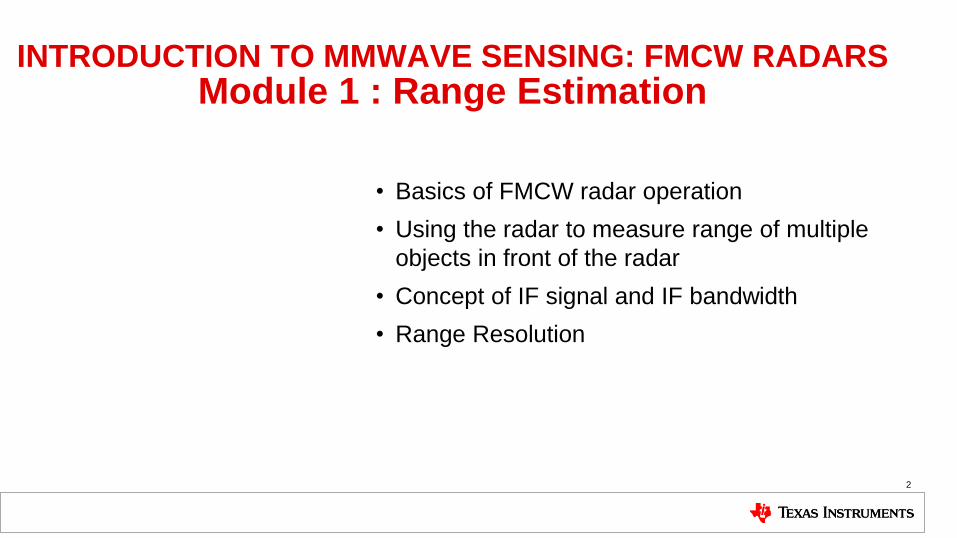
• Basics of FMCW radar operation
• Using the radar to measure range of multiple
objects in front of the radar
• Concept of IF signal and IF bandwidth
• Range Resolution
2
INTRODUCTION TO MMWAVE SENSING: FMCW RADARS Module 1 : Range Estimation
3
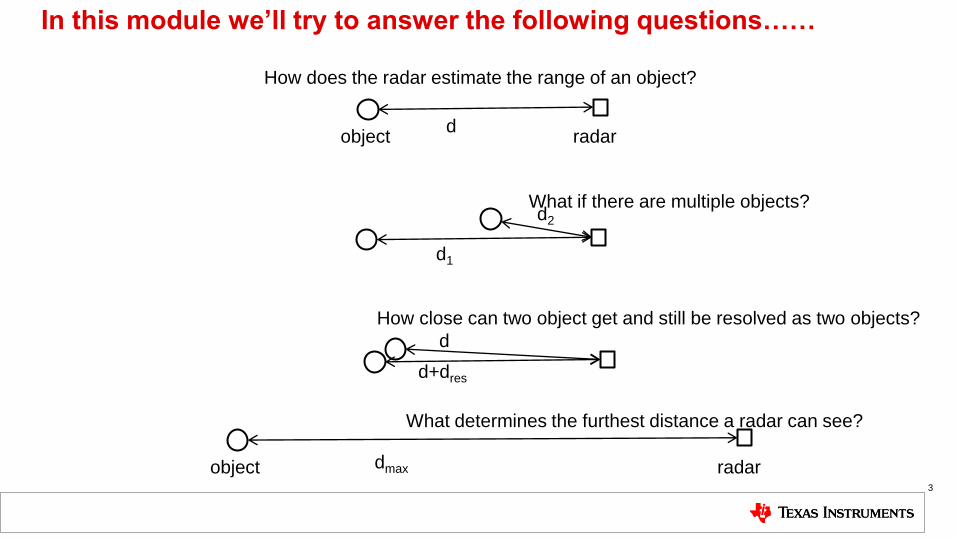
radar object
How does the radar estimate the range of an object?
How close can two object get and still be resolved as two objects?
What if there are multiple objects?
radar object
What determines the furthest distance a radar can see?
d
d1
d2
dmax
d
d+dres
In this module we’ll try to answer the following questions……
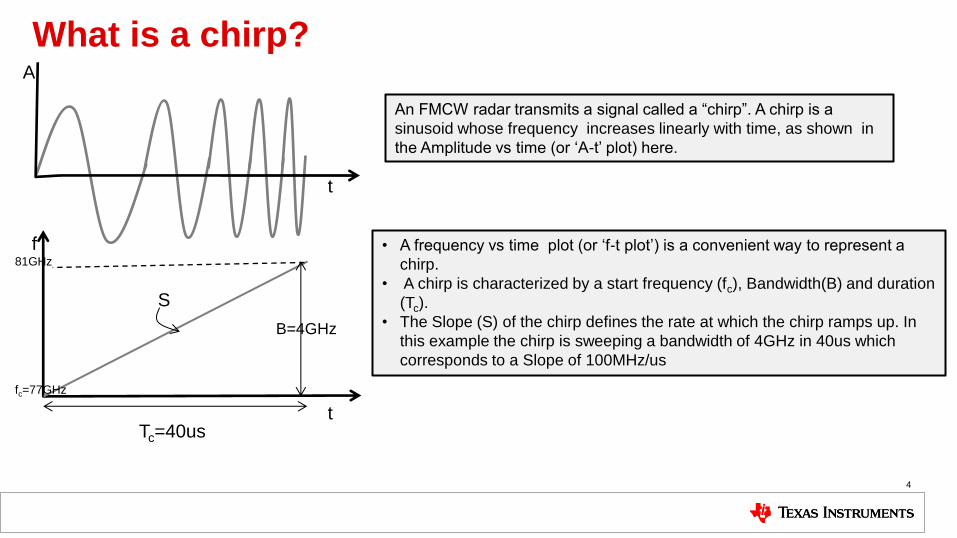
What is a chirp?
4
An FMCW radar transmits a signal called a “chirp”. A chirp is a
sinusoid whose frequency increases linearly with time, as shown in
the Amplitude vs time (or ‘A-t’ plot) here.
t
t
f • A frequency vs time plot (or ‘f-t plot’) is a convenient way to represent a
chirp.
• A chirp is characterized by a start frequency (fc), Bandwidth(B) and duration
(Tc).
• The Slope (S) of the chirp defines the rate at which the chirp ramps up. In
this example the chirp is sweeping a bandwidth of 4GHz in 40us which
corresponds to a Slope of 100MHz/us
fc=77GHz
81GHz
Tc=40us
A
B=4GHz
S

A 1TX-1RX FMCW radar
1. A synthesizer (synth) generates a chirp
2. The chirp is transmitted by the TX antenna
3. The chirp is reflected off an object and the reflected chirp is received at the RX
antenna.
4. The RX signal and TX signal are ‘mixed’ and the resulting signal is called an ‘IF signal’.
We’ll analyze the IF signal in more detail in the next slide
5
1 2
3
4
IF signal
Synth
TX ant.
RX ant. mixer
𝑥𝑜𝑢𝑡 = sin 𝑤1 − 𝑤2 𝑡 + (ϕ1−ϕ2)
A mixer is a 3 port device with 2 inputs and 1 output. For our purposes, a mixer can be
modelled as follows. For two sinusoids x1 and x2 input at the two input ports, the output
is a sinusoid with:
• Instantaneous frequency equal to the difference of the instantaneous frequencies of
the two input sinusoids.
• Phase equal to the difference of the phase of the two input sinusoids
𝑥2 = sin𝑤2𝑡 + ϕ2)
𝑥1 = sin𝑤1𝑡 + ϕ1)
x1
x2 xout
What is a mixer?

The IF signal
• The top figure shows the TX-signal and the RX-signal that is reflected from an object. Note that
the RX-signal is just a delayed version of the TX signal. ( τ denotes the round-trip time between
the radar and the object. Also S denotes the slope of the chirp )
• Recall that the frequency of the signal at the mixers output is the difference of the instantaneous
frequency of the TX-chirp and RX-chirp. As shown in the figure below, this is a straight line.
• Hence: A single object in front of the radar produces an IF signal that is a constant frequency tone.
– The frequency of this tone is Sτ = S2d/c; [Since τ = 2d/c , where d is distance of the object
and c is the speed of light]
6
τ
Sτ
t
t
f
f
TX chirp
RX chirp
IF signal
A single object in front of the radar produces
an IF signal with a constant frequency of S2d/c Note that τ is typically a small fraction of the total chirp
time =>non-overlapping segment of the TX chirp is
usually negligible. E.g. For a radar with a max distance
of 300m and Tc=40us. τ/Tc =5%
Tc
The mixers operation can be understood easily using the f-t plot.
Sτ
τ
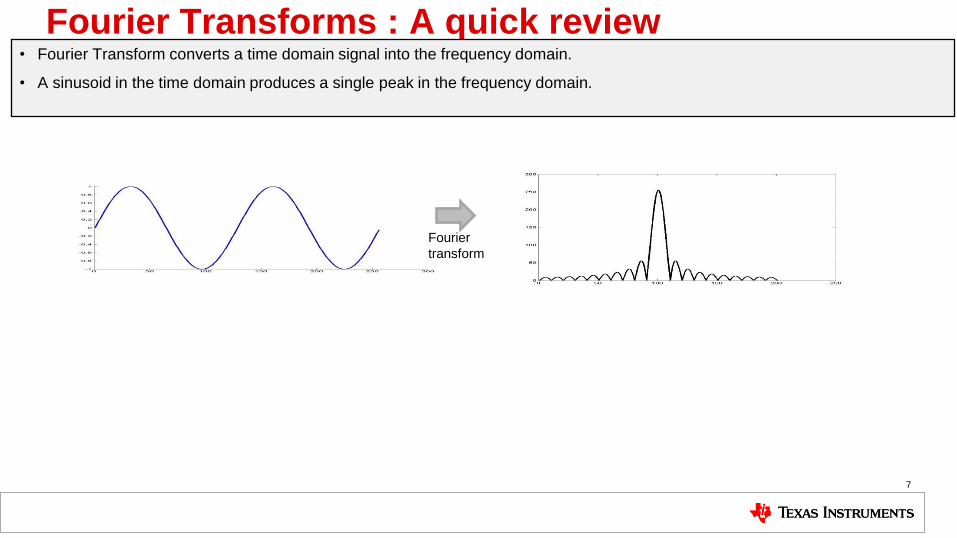
Fourier Transforms : A quick review
7
Fourier
transform
• Fourier Transform converts a time domain signal into the frequency domain.
• A sinusoid in the time domain produces a single peak in the frequency domain.
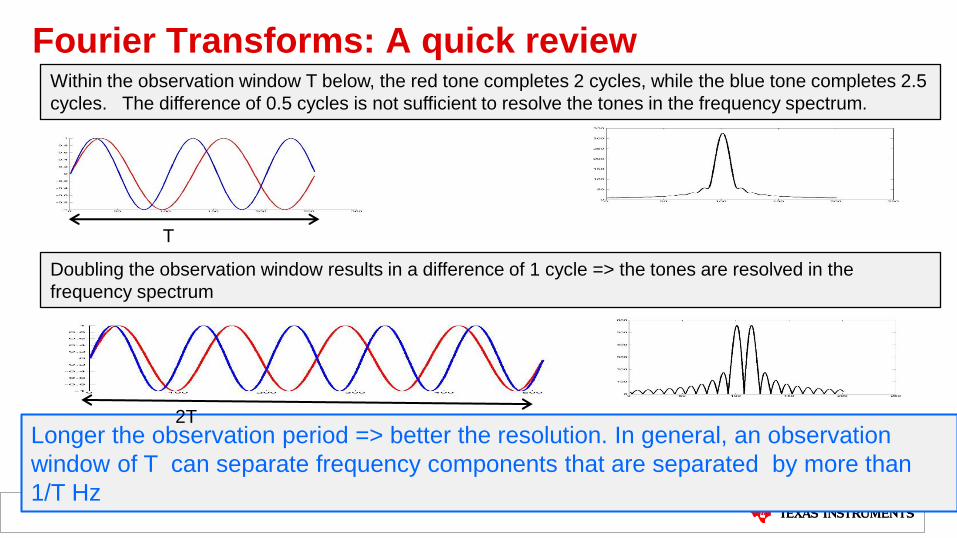
Fourier Transforms: A quick review
8
Longer the observation period => better the resolution. In general, an observation
window of T can separate frequency components that are separated by more than
1/T Hz
Within the observation window T below, the red tone completes 2 cycles, while the blue tone completes 2.5
cycles. The difference of 0.5 cycles is not sufficient to resolve the tones in the frequency spectrum.
Doubling the observation window results in a difference of 1 cycle => the tones are resolved in the
frequency spectrum
T
2T
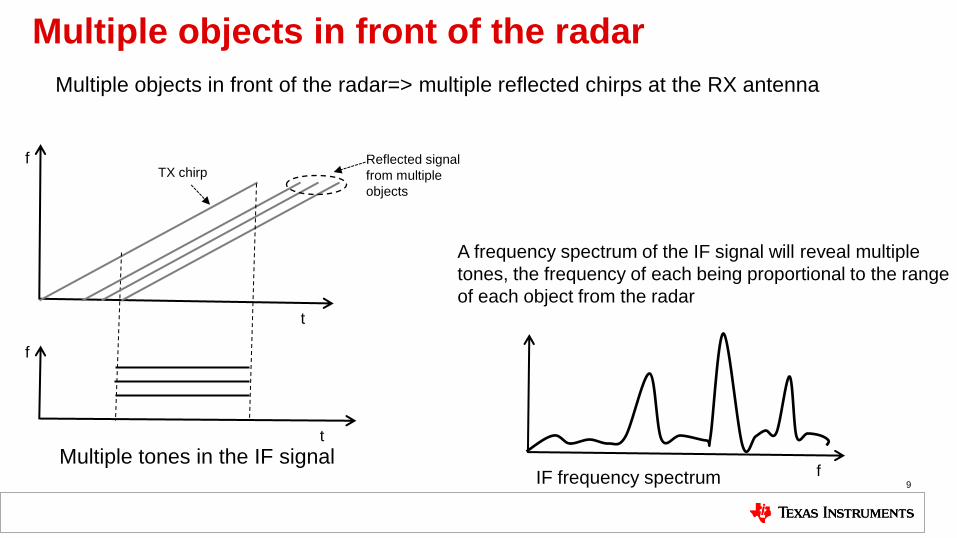
Multiple objects in front of the radar
9
f
f
TX chirp Reflected signal
from multiple
objects
Multiple objects in front of the radar=> multiple reflected chirps at the RX antenna
Multiple tones in the IF signal
A frequency spectrum of the IF signal will reveal multiple
tones, the frequency of each being proportional to the range
of each object from the radar t
t
f IF frequency spectrum
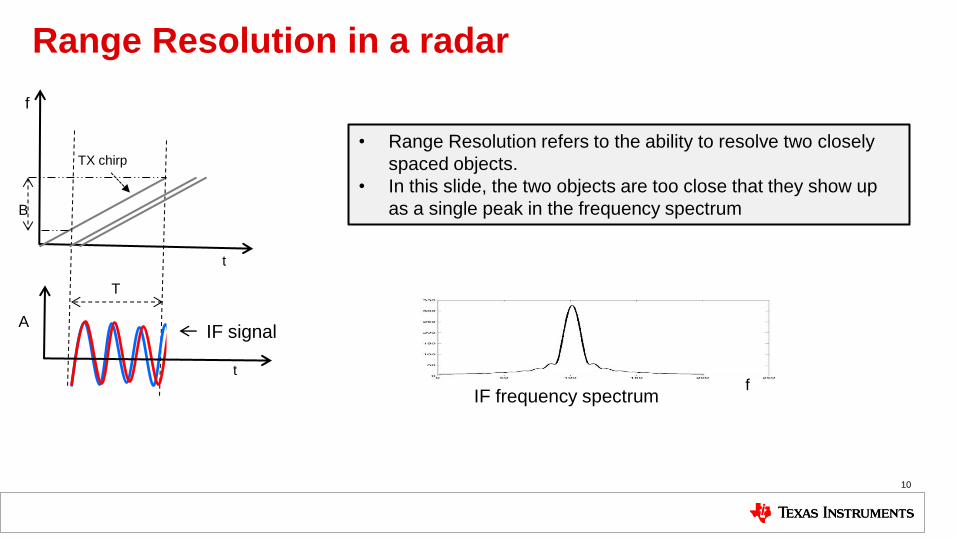
Range Resolution in a radar
10
f
A
TX chirp
B
T
t
t
• Range Resolution refers to the ability to resolve two closely
spaced objects.
• In this slide, the two objects are too close that they show up
as a single peak in the frequency spectrum
f IF frequency spectrum
IF signal
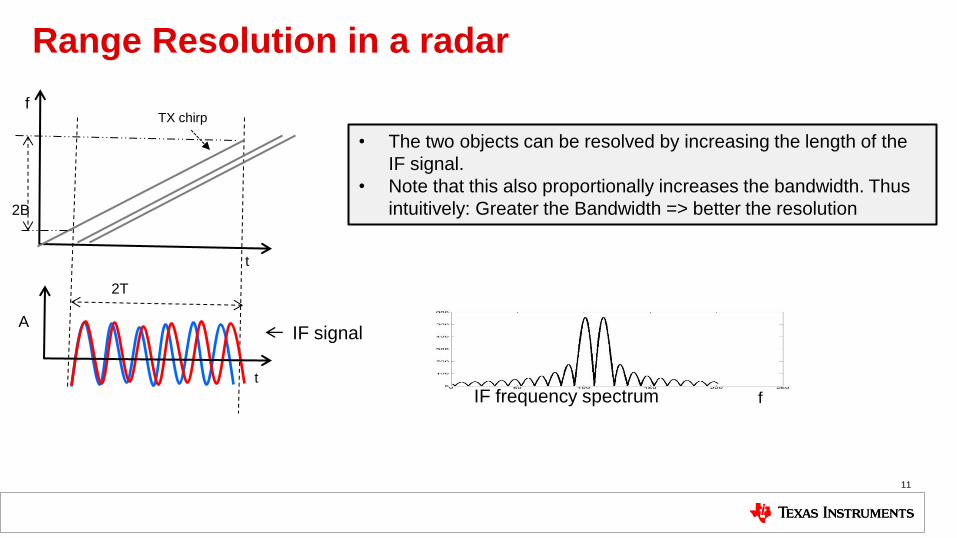
Range Resolution in a radar
11
f
A
TX chirp
2B
2T
t
t
• The two objects can be resolved by increasing the length of the
IF signal.
• Note that this also proportionally increases the bandwidth. Thus
intuitively: Greater the Bandwidth => better the resolution
IF frequency spectrum
IF signal
f
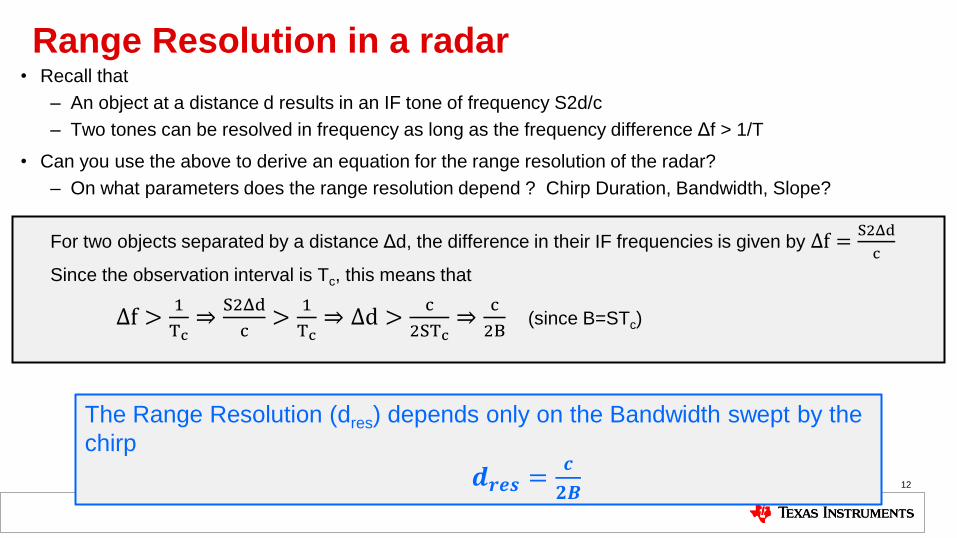
Range Resolution in a radar • Recall that
– An object at a distance d results in an IF tone of frequency S2d/c
– Two tones can be resolved in frequency as long as the frequency difference Δf > 1/T
• Can you use the above to derive an equation for the range resolution of the radar?
– On what parameters does the range resolution depend ? Chirp Duration, Bandwidth, Slope?
12
For two objects separated by a distance Δd, the difference in their IF frequencies is given by Δf =S2Δd
c
Since the observation interval is Tc, this means that
Δf >1
Tc⇒
S2Δd
c>
1
Tc⇒ Δd >
c
2STc⇒
c
2B (since B=STc)
The Range Resolution (dres) depends only on the Bandwidth swept by the
chirp
𝒅𝒓𝒆𝒔 =𝒄
𝟐𝑩
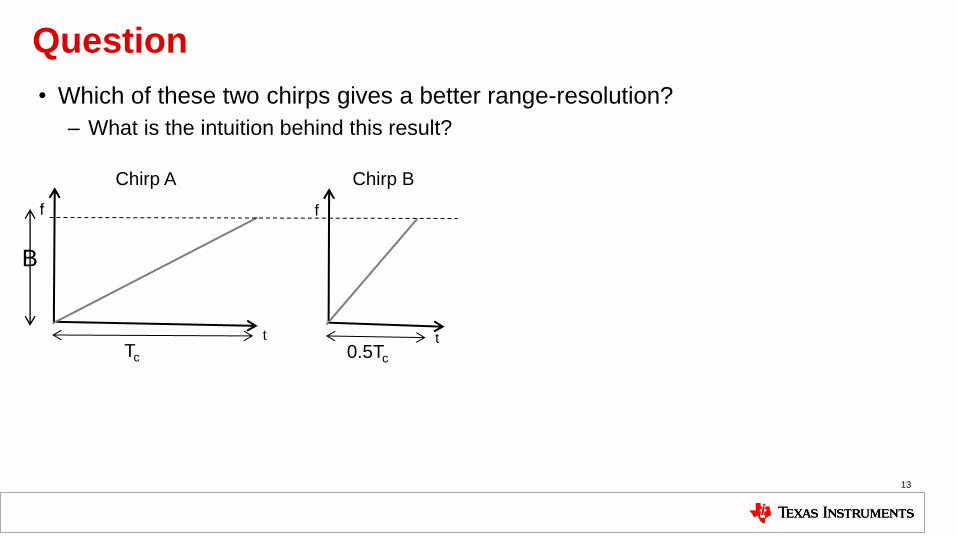
Question
• Which of these two chirps gives a better range-resolution?
– What is the intuition behind this result?
13
f
t
f
t Tc 0.5Tc
Chirp A Chirp B
B

Question
• Which of these two chirps gives a better range-resolution?
– What is the intuition behind this result?
14
f
t
f
t Tc 0.5Tc
Chirp A Chirp B
Some typical numbers
Bandwidth Range Resolution
4GHz 3.75cm
2GHz 7.5cm
1GHz 15cm
600MHz 25cm
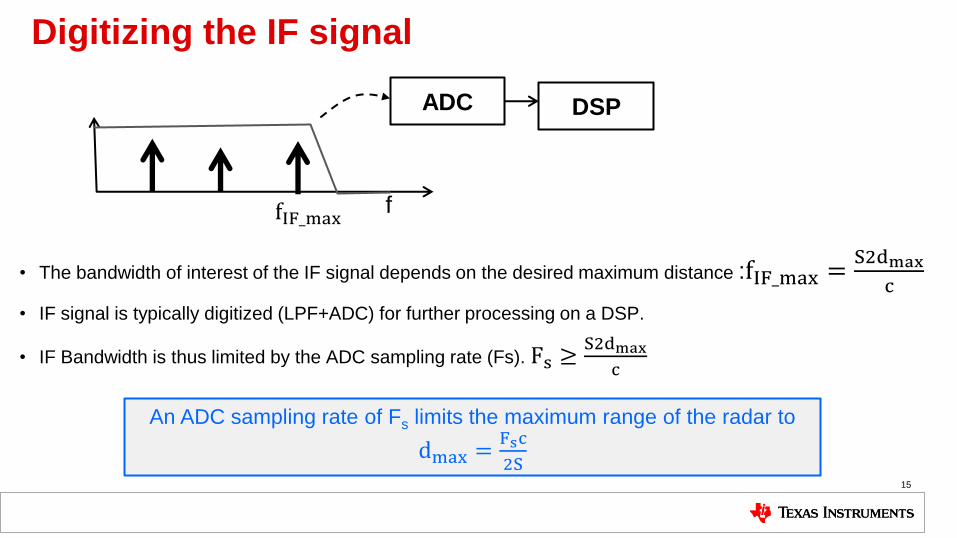
• The bandwidth of interest of the IF signal depends on the desired maximum distance :fIF_max =S2dmax
c
• IF signal is typically digitized (LPF+ADC) for further processing on a DSP.
• IF Bandwidth is thus limited by the ADC sampling rate (Fs). Fs ≥S2dmax
c
15
Digitizing the IF signal
ADC DSP
An ADC sampling rate of Fs limits the maximum range of the radar to
dmax =Fsc
2S
f fIF_max

Question
• Revisiting our earlier example, what more can we now say about these two chirps?
16
f
t
f
t Tc 0.5Tc
Chirp A Chirp B
While both Chirp A and B have the same range
resolution:
• For the same dmax, Chirp A requires only half
the IF bandwidth (=> smaller Fs on the ADC).
• But Chirp B has the advantage of requiring half
the measurement time.
An FFT is performed on the ADC data. The
location of peaks in the frequency spectrum
directly correspond to the range of objects
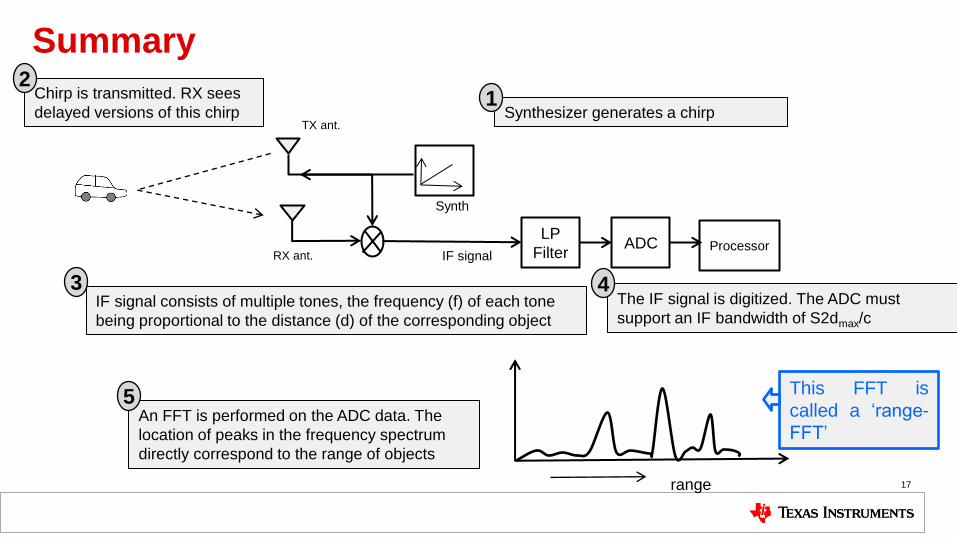
Summary
17
IF signal
Synth
TX ant.
RX ant.
LP
Filter ADC Processor
Synthesizer generates a chirp
Chirp is transmitted. RX sees
delayed versions of this chirp
IF signal consists of multiple tones, the frequency (f) of each tone
being proportional to the distance (d) of the corresponding object
The IF signal is digitized. The ADC must
support an IF bandwidth of S2dmax/c
range
1 2
3 4
5 This FFT is
called a ‘range-
FFT’

Key concepts /formulas
• An object at a distance d produces an IF frequency of:
– fIF =S2d
c
• Range resolution (dres) depends on the bandwidth (B):
– dres =c
2B
• The ADC sampling rate Fs, limits the max range (dmax) to
– dmax =Fsc
2S
18
Chirp Bandwidth vs IF bandwidth?
Larger Chirp Bandwidth => better range resolution
Larger IF Bandwidth => faster chirps , better maximum distance
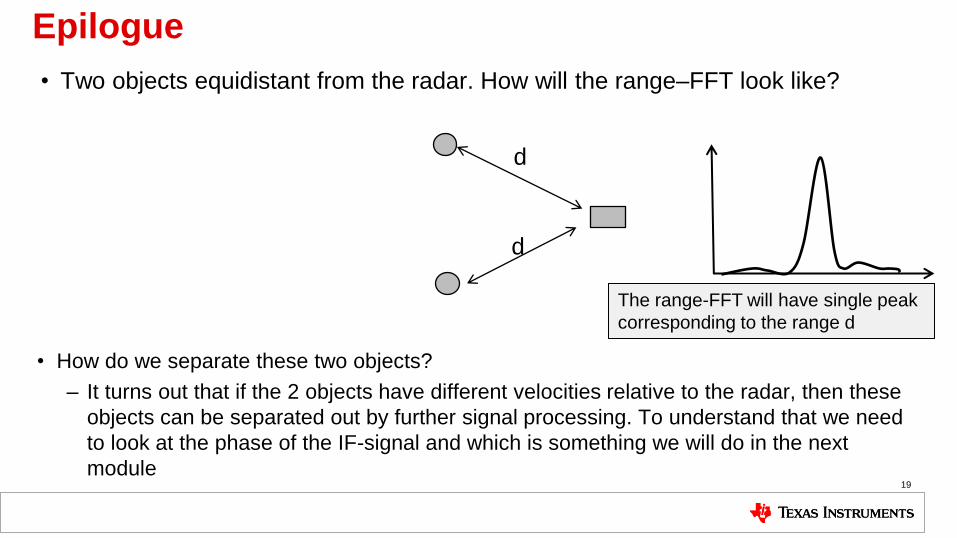
Epilogue
• How do we separate these two objects?
– It turns out that if the 2 objects have different velocities relative to the radar, then these
objects can be separated out by further signal processing. To understand that we need
to look at the phase of the IF-signal and which is something we will do in the next
module 19
d
d
The range-FFT will have single peak
corresponding to the range d
• Two objects equidistant from the radar. How will the range–FFT look like?

INTRODUCTION TO MMWAVE SENSING: FMCW RADARS Module 2 : The Phase of the IF signal
20

Fourier Transforms : A quick review
21
Fourier
transform
• Fourier Transform converts a time domain signal into the frequency domain.
• A sinusoid in the time domain produces a peak in the frequency domain. In general, the signal in the Frequency domain is
complex (i.e. each value is a phasor with a amplitude and a phase)
A θ
Aejθ
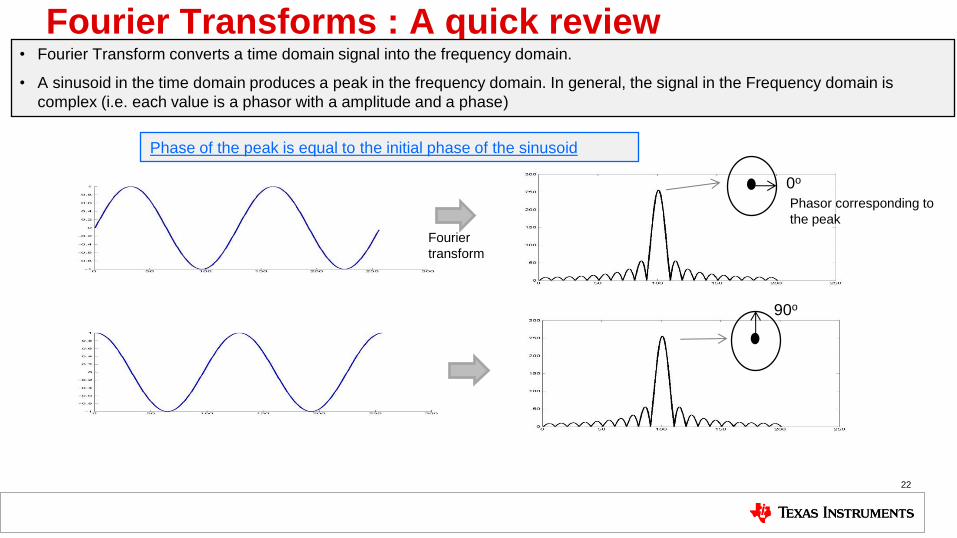
Fourier Transforms : A quick review
22
0o
90o
Phasor corresponding to
the peak
Fourier
transform
• Fourier Transform converts a time domain signal into the frequency domain.
• A sinusoid in the time domain produces a peak in the frequency domain. In general, the signal in the Frequency domain is
complex (i.e. each value is a phasor with a amplitude and a phase)
Phase of the peak is equal to the initial phase of the sinusoid

Frequency of the IF signal : Recap from module 1
23
τ t
f
f
TX chirp
IF signal
Sτ
t
RX chirp
A single object in front of the radar
produces an IF signal with a
constant frequency of S2d/c
Let us quickly recap material from module 1.
We saw that an FMCW radar transmits a
chirp, which can be represented using an freq
vs time (or f-t) plot as shown here or
equivalenltly using an (Ampltitude vs time ) or
A-t plot here. Focussing on the f-t plot, the
radar receives a reflected chirp from an
object, after a round-trip delay of tau. The
transmit signal and the reflected signal are
mixed in a mixer,to create an IF signal which
has a constant frequency of Stau (or
equivalently S2d/c, where d is the distance to
the object). PAUSE
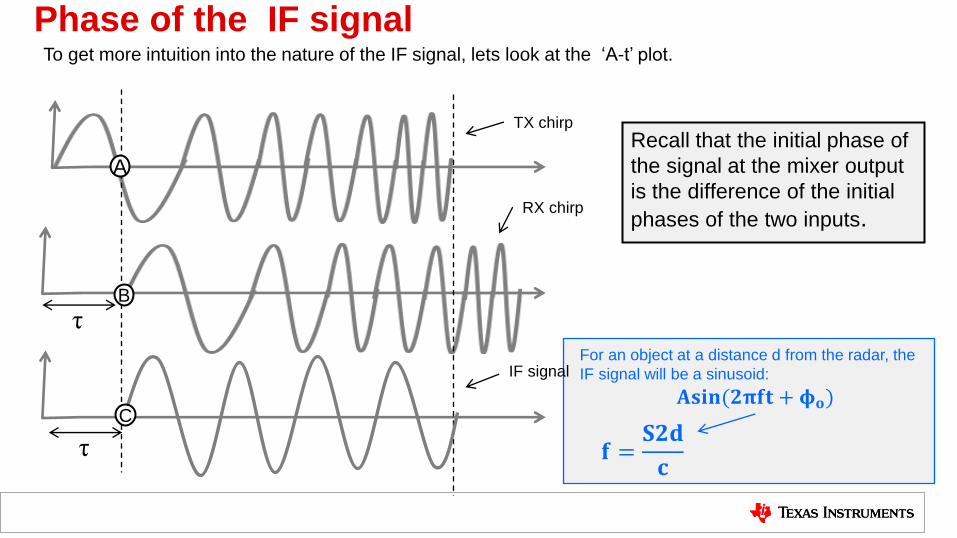
Phase of the IF signal
Recall that the initial phase of
the signal at the mixer output
is the difference of the initial
phases of the two inputs.
24
For an object at a distance d from the radar, the
IF signal will be a sinusoid:
𝐀𝐬𝐢𝐧(𝟐𝛑𝐟𝐭 + 𝛟𝐨)
𝐟 =𝐒𝟐𝐝
𝐜
To get more intuition into the nature of the IF signal, lets look at the ‘A-t’ plot.
TX chirp
RX chirp
IF signal
A
B
C
τ
τ
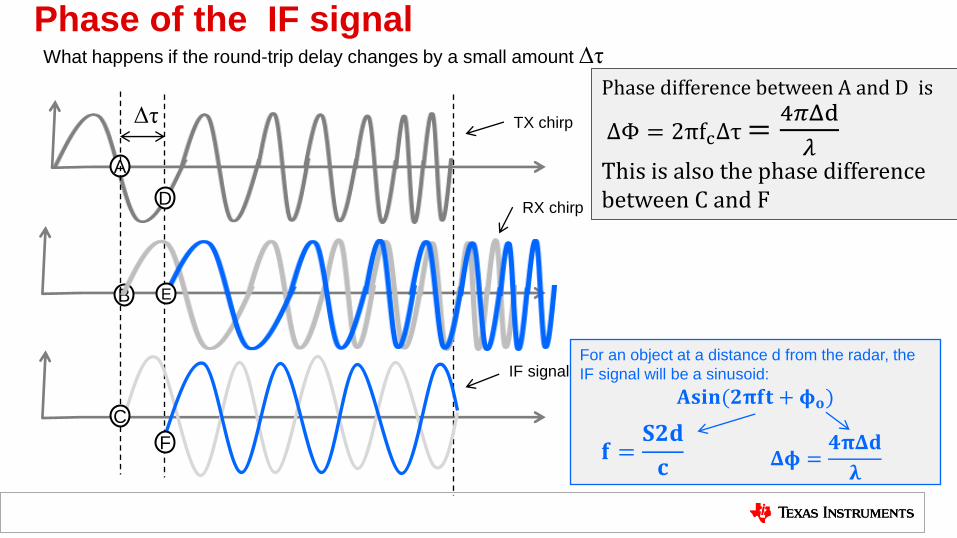
Phase of the IF signal
25
For an object at a distance d from the radar, the
IF signal will be a sinusoid:
𝐀𝐬𝐢𝐧(𝟐𝛑𝐟𝐭 + 𝛟𝐨)
𝐟 =𝐒𝟐𝐝
𝐜
What happens if the round-trip delay changes by a small amount Δτ
TX chirp
RX chirp
IF signal
A
B
D
E
Phase difference between A and D is
ΔΦ = 2πfcΔτ =4𝜋Δd
𝜆
This is also the phase difference between C and F
Δτ
C
F 𝚫𝛟 =
𝟒𝛑𝚫𝐝
𝛌
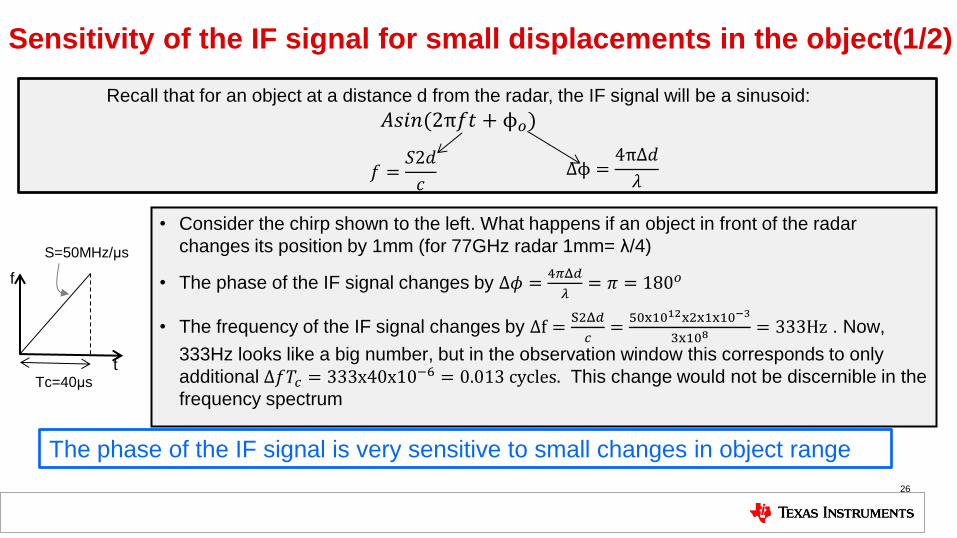
Sensitivity of the IF signal for small displacements in the object(1/2)
• Consider the chirp shown to the left. What happens if an object in front of the radar
changes its position by 1mm (for 77GHz radar 1mm= λ/4)
• The phase of the IF signal changes by Δ𝜙 =4𝜋Δ𝑑
𝜆= 𝜋 = 180𝑜
• The frequency of the IF signal changes by Δf =S2Δ𝑑
𝑐=
50x1012x2x1x10−3
3x108= 333Hz . Now,
333Hz looks like a big number, but in the observation window this corresponds to only
additional Δ𝑓𝑇𝑐 = 333x40x10−6 = 0.013cycles. This change would not be discernible in the
frequency spectrum
26
Recall that for an object at a distance d from the radar, the IF signal will be a sinusoid:
𝐴𝑠𝑖𝑛(2π𝑓𝑡 + ϕ𝑜)
𝑓 =𝑆2𝑑
𝑐 Δϕ =
4πΔ𝑑
𝜆
Tc=40μs
S=50MHz/μs
t
f
The phase of the IF signal is very sensitive to small changes in object range

27
Sensitivity of the IF signal for small displacements in the object(2/2)
An object at certain distance produces an IF signal with a certain frequency and phase
Fourier
transform
Fourier
transform
t
t
f
f
Small motion in the object changes the phase of the IF signal but not the frequency
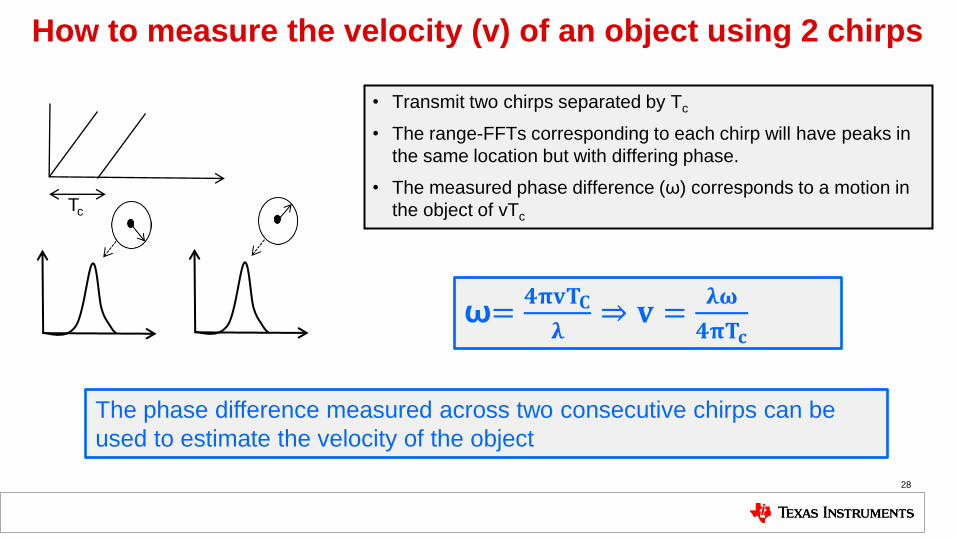
How to measure the velocity (v) of an object using 2 chirps
• Transmit two chirps separated by Tc
• The range-FFTs corresponding to each chirp will have peaks in
the same location but with differing phase.
• The measured phase difference (ω) corresponds to a motion in
the object of vTc
28
Tc
ω=𝟒𝛑𝐯𝐓𝐂
𝛌⇒ 𝐯 =
𝛌𝛚
𝟒𝛑𝐓𝐜
The phase difference measured across two consecutive chirps can be
used to estimate the velocity of the object
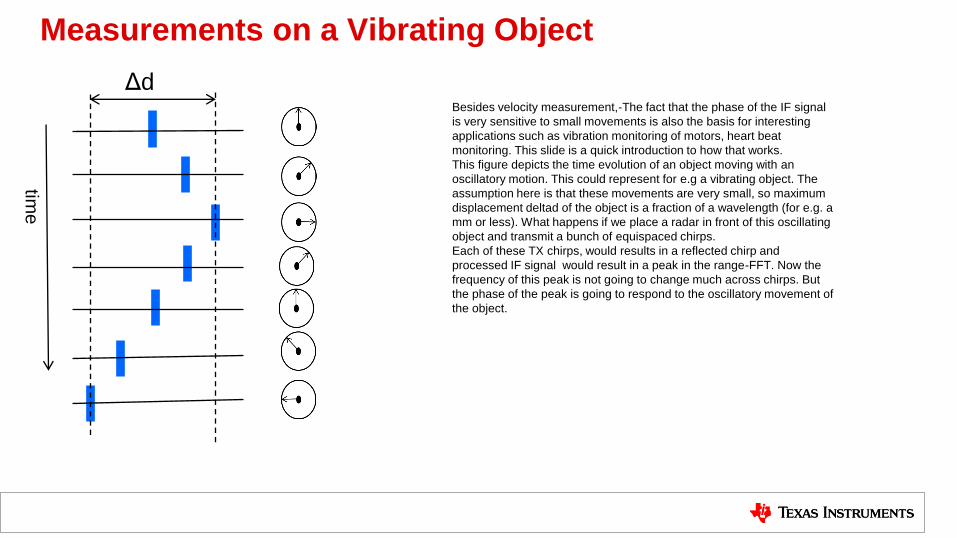
Measurements on a Vibrating Object
Δd Besides velocity measurement,-The fact that the phase of the IF signal
is very sensitive to small movements is also the basis for interesting
applications such as vibration monitoring of motors, heart beat
monitoring. This slide is a quick introduction to how that works.
This figure depicts the time evolution of an object moving with an
oscillatory motion. This could represent for e.g a vibrating object. The
assumption here is that these movements are very small, so maximum
displacement deltad of the object is a fraction of a wavelength (for e.g. a
mm or less). What happens if we place a radar in front of this oscillating
object and transmit a bunch of equispaced chirps.
Each of these TX chirps, would results in a reflected chirp and
processed IF signal would result in a peak in the range-FFT. Now the
frequency of this peak is not going to change much across chirps. But
the phase of the peak is going to respond to the oscillatory movement of
the object.
time
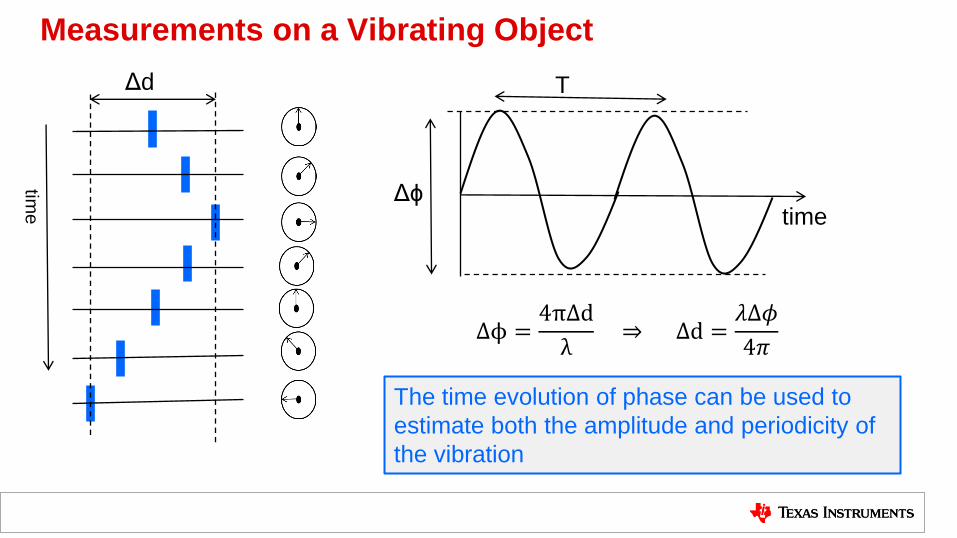
Measurements on a Vibrating Object
Δd
Δϕ
T
Δϕ =4πΔd
λ⇒ Δd =
𝜆Δ𝜙
4𝜋
The time evolution of phase can be used to
estimate both the amplitude and periodicity of
the vibration
time
time

Epilogue
• How do we separate these objects?
– Equi-range objects which have differing velocities relative to the radar can be separated
out using a “Doppler-FFT”. This is something we will look at in the next module.
31
d
The range-FFT will have single peak
corresponding to the range d
• Multiple objects equidistant from the radar, but with differing velocities relative to
the radar.

• Quick review of background material on
FFT’s
• Measuring Velocity
• Maximum measurable velocity
• Velocity Resolution and concept of frame
32
INTRODUCTION TO MMWAVE SENSING: FMCW RADARS Module 3 : Velocity Estimation

FFT’s on a complex sequence : A quick review (1/3)
• Consider a discrete signal corresponding to a phasor rotating a constant rate of ω radians per sample.
An FFT on these series of samples produces a peak with the location of the peak at ω
33
If the signal consists of the sum of two phasors, the FFT has two peaks (each phasor rotating at the rate of
ω1 and ω2 radians per sample , respectively)
ω1 ω2
ω
FFT
FFT
AAejωAej2𝜔Ae3𝜔 -------
𝐴1𝑒𝑗𝑘𝜔1 + 𝐴2𝑒
𝑗𝑘𝜔2

FFT’s on a complex sequence : A quick review (2/3) • ω1=0, ω2=π/N. Over N samples, the 2nd phasor has traversed half a cycle (π rads) more than the 1st
phasor => not sufficient to resolve the two objects in the frequency domain
34
1 2 3 N
1 2 3 N 2N-1 2N
FFT
FFT
• Over 2N samples, the 2nd phasor has traversed a complete cycle (2π rads)
more than the 1st phasor => two objects are resolved in the frequency domain
Longer the sequence length => better the resolution. In general, a sequence of length N can
separate angular frequencies that are separated by more than 2π/N rad/sample

FFT’s on a complex sequence : A quick review (3/3)
35
Comparing the frequency domain resolution criteria for
continuous and discrete signals
• Continuous signals : Δf =1
Tcycles/sec
• Discrete signals: Δω =2π
Nradians/sample
=1
Ncycles/sample

How to measure the velocity (v) of an object using 2 chirps
• Transmit two chirps separated by Tc
• The range-FFTs corresponding to each chirp will have peaks in
the same location but with differing phase.
• The measured phase difference (ω) corresponds to a motion in
the object of vTc
36
Tc
ω=𝟒𝛑𝐯𝐓𝐂
𝛌⇒ 𝐯 =
𝛌𝛚
𝟒𝛑𝐓𝐜
The phase difference measured across two consecutive chirps can be
used to estimate the velocity of the object
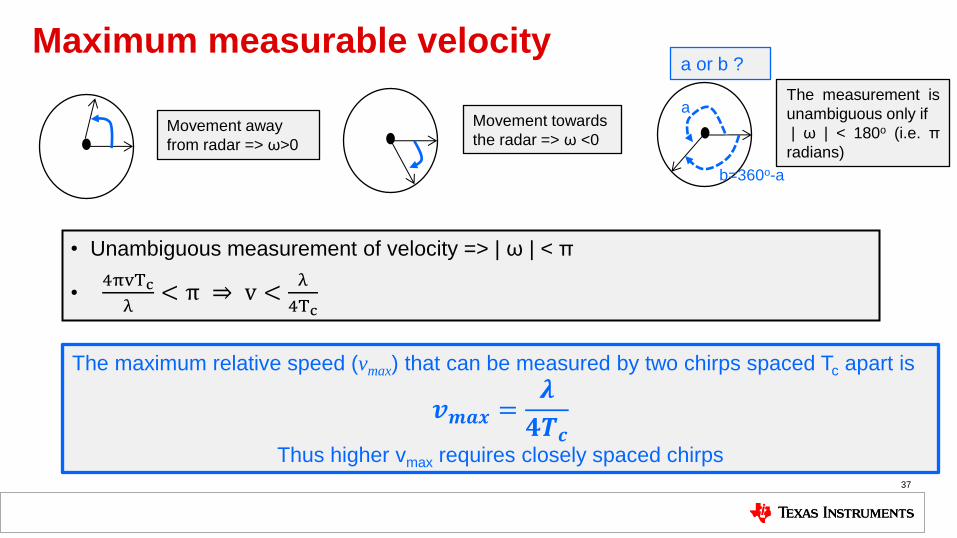
Maximum measurable velocity
• Unambiguous measurement of velocity => | ω | < π
• 4πvTc
λ< π ⇒ v <
λ
4Tc
37
Movement away
from radar => ω>0
Movement towards
the radar => ω <0
The measurement is
unambiguous only if
| ω | < 180o (i.e. π
radians)
a or b ?
The maximum relative speed (vmax) that can be measured by two chirps spaced Tc apart is
𝒗𝒎𝒂𝒙 =𝝀
𝟒𝑻𝒄
Thus higher vmax requires closely spaced chirps
a
b=360o-a
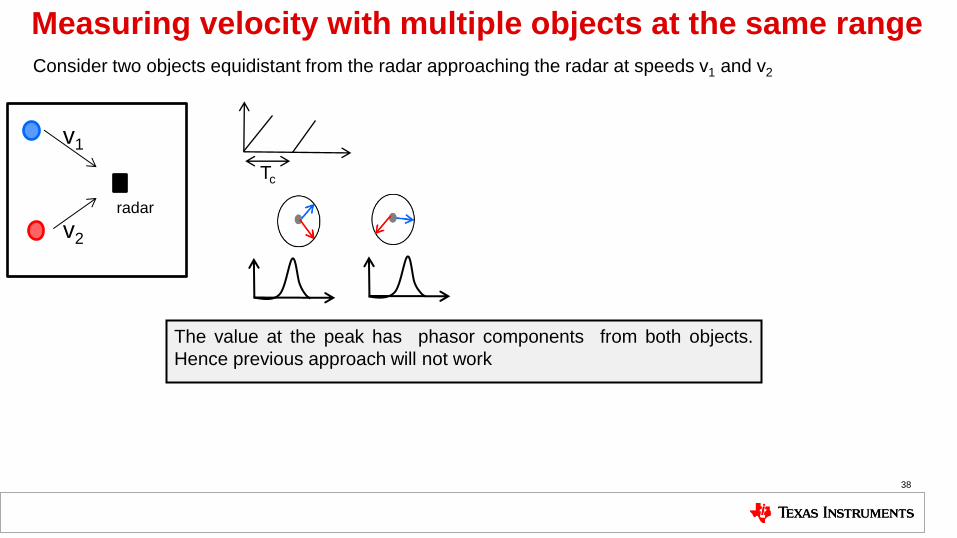
Measuring velocity with multiple objects at the same range
The value at the peak has phasor components from both objects.
Hence previous approach will not work
38
v1
v2
radar
Consider two objects equidistant from the radar approaching the radar at speeds v1 and v2
Tc

Measuring velocity with multiple objects at the same range
39
Solution : Transmit N equi-spaced chirps. (This unit is typically called a ‘frame’) F
FT
An FFT on the sequence of phasors corresponding to the range-FFT
peaks resolves the two objects. This is called a doppler-FFT
ω1 ω2
ω1 and ω2 correspond to the phase difference between consecutive
chirps for the respective objects
𝑣1 =𝜆𝜔1
4𝜋𝑇𝑐, 𝑣2 =
𝜆𝜔2
4𝜋𝑇𝑐
Tc
1 2 3 N
v1
v2
radar

Velocity resolution • What is the velocity resolution (vres) capability of the “doppler-FFT”?
– i.e., what is the minimum separation between v1 and v2 for them to show up as two peaks in the doppler-
FFT
– Recall that an FFT on a sequence of length N, can separate two frequencies ω1 and ω2 as long |ω1 – ω2 |
> 2π/N. This can be used to derive vres as shown in the box (left below)
40
Δω =4πΔvTc
λ
Δω >2π
N
⇒ Δv >λ
2NTc
40
The velocity resolution of the radar is inversely
proportional to the frame time (Tf)and is given by
𝐯𝐫𝐞𝐬 =𝛌
𝟐𝐓𝐟
Tc
Tf t
f
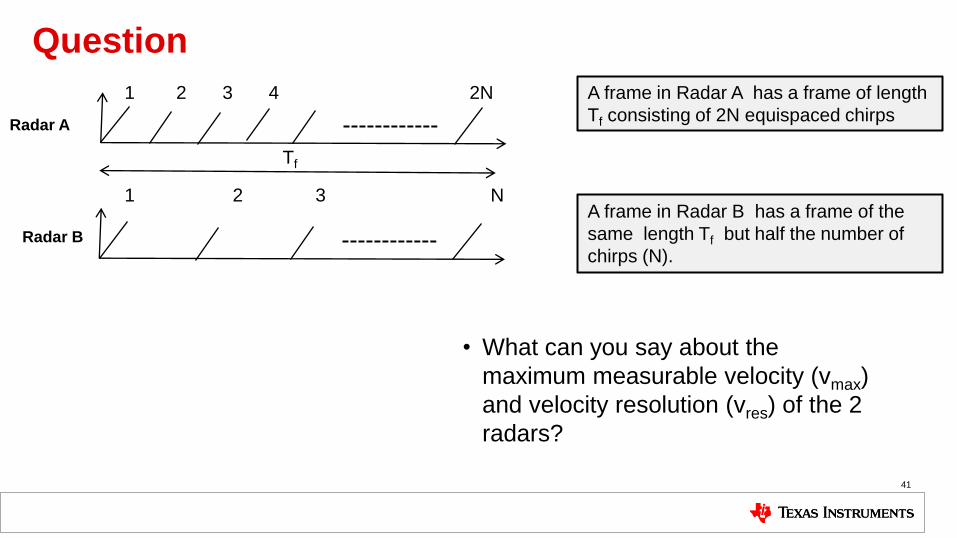
Question
• What can you say about the
maximum measurable velocity (vmax)
and velocity resolution (vres) of the 2
radars?
41
1 2 3 4 2N
1 2 3 N
A frame in Radar A has a frame of length
Tf consisting of 2N equispaced chirps
A frame in Radar B has a frame of the
same length Tf but half the number of
chirps (N).
Radar A
Radar B
Tf
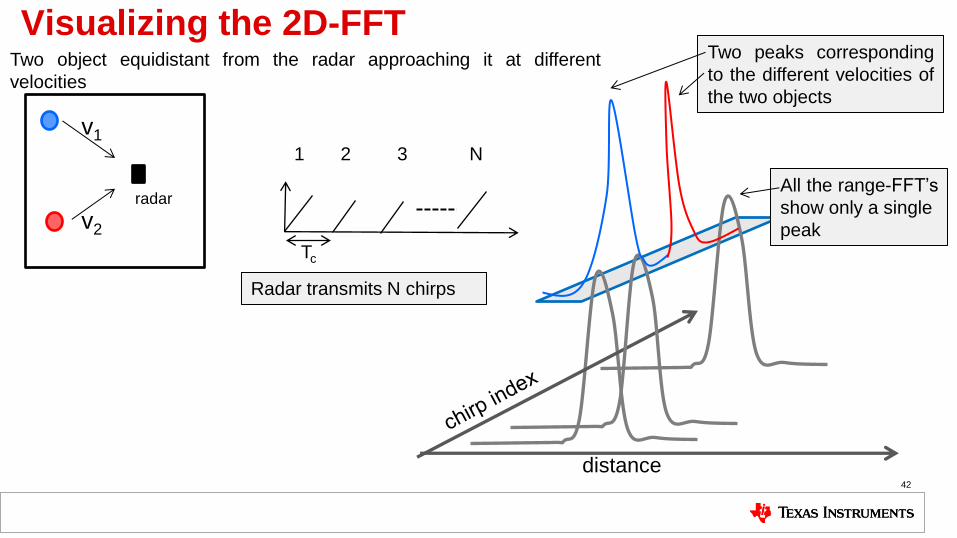
Visualizing the 2D-FFT
42
Tc
1 2 3 N
v1
v2
radar
distance
Two peaks corresponding
to the different velocities of
the two objects
All the range-FFT’s
show only a single
peak
Two object equidistant from the radar approaching it at different
velocities
Radar transmits N chirps

• 2D-FFT processing
• Trade-offs involved in designing a frame
• Radar range equation
43
INTRODUCTION TO MMWAVE SENSING: FMCWRADARS Module 4 : Some System Design topics
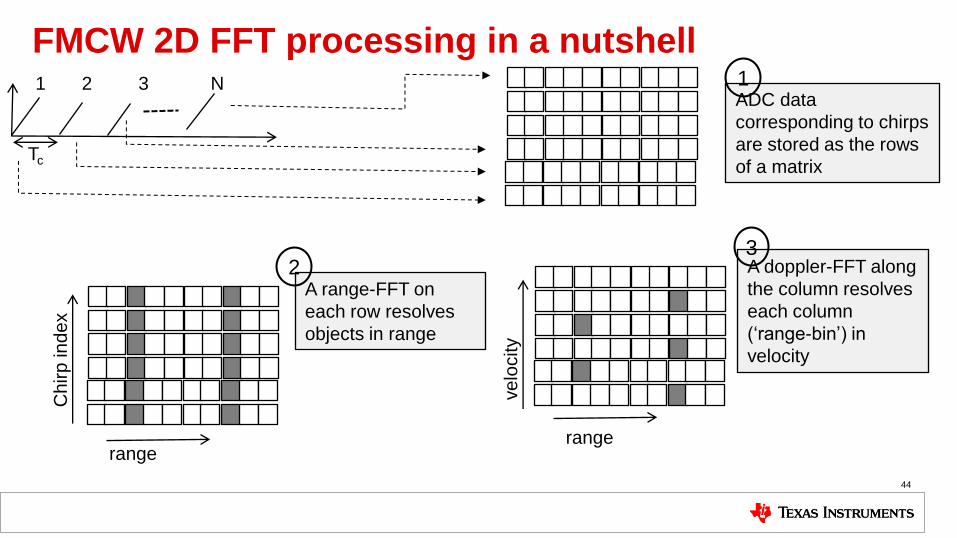
FMCW 2D FFT processing in a nutshell
44
Tc
1 2 3 N ADC data
corresponding to chirps
are stored as the rows
of a matrix
A range-FFT on
each row resolves
objects in range
A doppler-FFT along
the column resolves
each column
(‘range-bin’) in
velocity
1
2 3
range range
Ch
irp
in
de
x
ve
locity
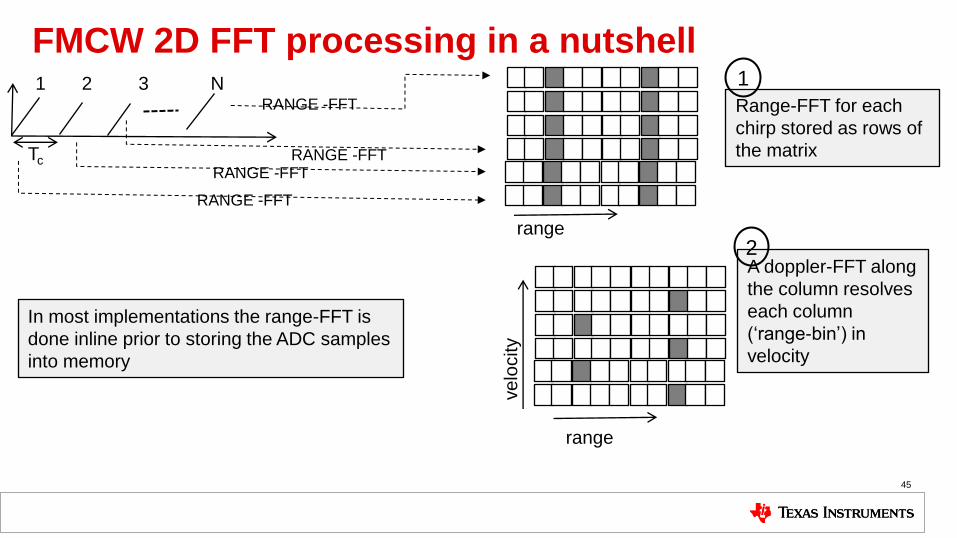
FMCW 2D FFT processing in a nutshell
45
Tc
1 2 3 N
FF
Range-FFT for each
chirp stored as rows of
the matrix
A doppler-FFT along
the column resolves
each column
(‘range-bin’) in
velocity
1
2
RANGE -FFT
RANGE -FFT RANGE -FFT
RANGE -FFT
In most implementations the range-FFT is
done inline prior to storing the ADC samples
into memory
range
ve
locity
range

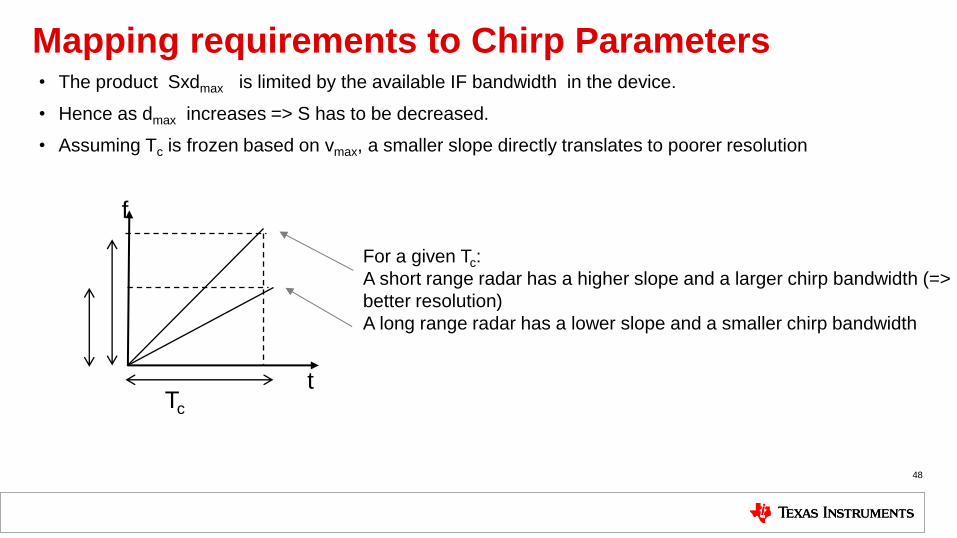
Mapping requirements to Chirp Parameters
46
vmax
λ =
Tc 4
dres
c =
B 2
Given range resolution (dres), max range (dmax), velocity resolution (vres), max velocity (vmax), how do we
design a frame?. Lets sketch a possible design method
Tc
1. Tc determined using vmax
vres
λ =
Tf 2
Fif_max
S2dmax =
c
2. B determined using dres. Note that with B and Tc
known, the slope S is now determined by S= B/Tc
3. Frame Time Tf can be determined using vres
B
Tf
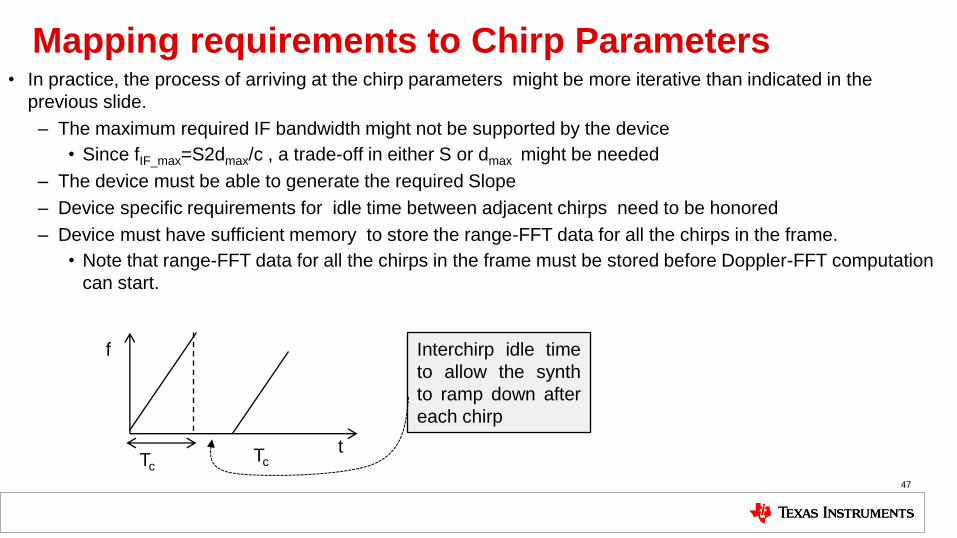
• In practice, the process of arriving at the chirp parameters might be more iterative than indicated in the
previous slide.
– The maximum required IF bandwidth might not be supported by the device
• Since fIF_max=S2dmax/c , a trade-off in either S or dmax might be needed
– The device must be able to generate the required Slope
– Device specific requirements for idle time between adjacent chirps need to be honored
– Device must have sufficient memory to store the range-FFT data for all the chirps in the frame.
• Note that range-FFT data for all the chirps in the frame must be stored before Doppler-FFT computation
can start.
47
Mapping requirements to Chirp Parameters
Tc Tc
t
f Interchirp idle time
to allow the synth
to ramp down after
each chirp
48
Mapping requirements to Chirp Parameters • The product Sxdmax is limited by the available IF bandwidth in the device.
• Hence as dmax increases => S has to be decreased.
• Assuming Tc is frozen based on vmax, a smaller slope directly translates to poorer resolution
t
f
For a given Tc:
A short range radar has a higher slope and a larger chirp bandwidth (=>
better resolution)
A long range radar has a lower slope and a smaller chirp bandwidth
Tc

The Radar Range Equation
49
Radiated Power Density= 𝑃𝑡
4𝜋𝑑2𝑊/𝑚2
Power captured at RX ant = 𝑃𝑡𝐺𝑇𝑋σ𝐴𝑅𝑋
(4𝜋)2𝑑4W
= 𝑃𝑡𝐺𝑇𝑋σ𝐺𝑅𝑋𝜆
2
(4𝜋)3𝑑4W
Power reflected by object = 𝑃𝑡𝐺𝑇𝑋σ
4𝜋𝑑2𝑊
Power density at RX ant= 𝑃𝑡𝐺𝑇𝑋σ
(4𝜋)2𝑑4𝑊/𝑚2
Radiated Power Density= 𝑃𝑡𝐺𝑇𝑋
4𝜋𝑑2𝑊/𝑚2
Pt: Output power of device
GTX/RX: TX/RX Antenna Gain
σ: Radar Cross Section of the Target (RCS)
ARX: Effective aperture area of RX antenna 𝐴𝑅𝑋 =𝐺𝑅𝑋𝜆
2
4𝜋
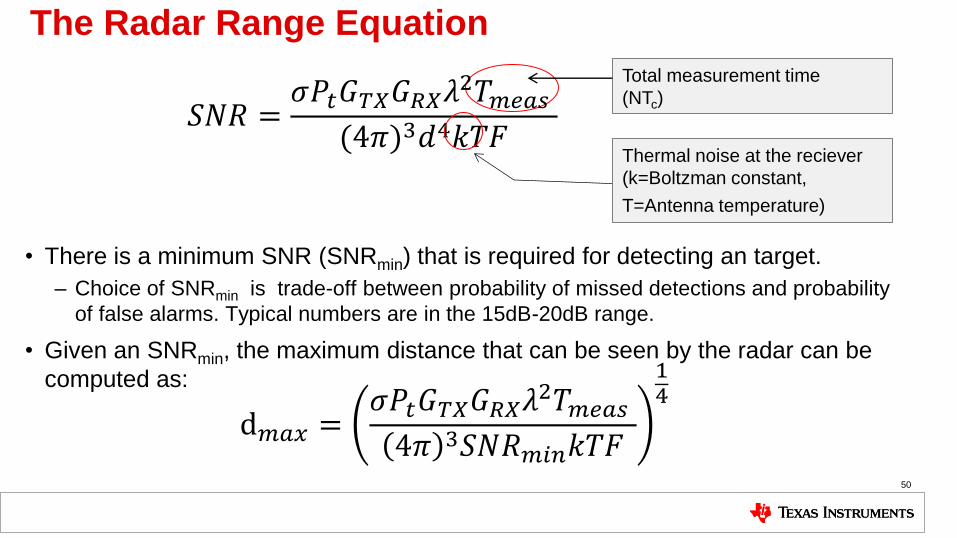
• There is a minimum SNR (SNRmin) that is required for detecting an target.
– Choice of SNRmin is trade-off between probability of missed detections and probability
of false alarms. Typical numbers are in the 15dB-20dB range.
• Given an SNRmin, the maximum distance that can be seen by the radar can be
computed as:
50
d𝑚𝑎𝑥 =𝜎𝑃𝑡𝐺𝑇𝑋𝐺𝑅𝑋𝜆
2𝑇𝑚𝑒𝑎𝑠
4𝜋 3𝑆𝑁𝑅𝑚𝑖𝑛𝑘𝑇𝐹
14
Total measurement time
(NTc) 𝑆𝑁𝑅 =
𝜎𝑃𝑡𝐺𝑇𝑋𝐺𝑅𝑋𝜆2𝑇𝑚𝑒𝑎𝑠
(4𝜋)3𝑑4𝑘𝑇𝐹
The Radar Range Equation
Thermal noise at the reciever
(k=Boltzman constant,
T=Antenna temperature)

Epilogue
• How do we separate these two objects?
– Need multiple antennas to estimate the angle of arrival. Discussed in the next module
51
d
d
The range-
velocity plot
resulting from the
2D-FFT will have
single peak,
since they have
the same range
and velocity
• Two objects equidistant from the radar and with the same velocity relative to the
radar. How will the range-velocity plot look like?
range
velo
city
52
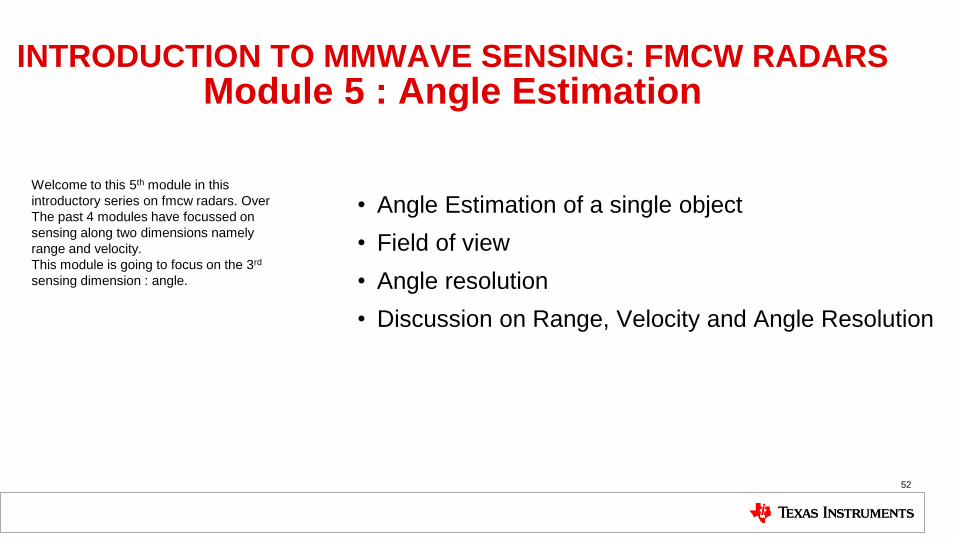
INTRODUCTION TO MMWAVE SENSING: FMCW RADARS Module 5 : Angle Estimation
• Angle Estimation of a single object
• Field of view
• Angle resolution
• Discussion on Range, Velocity and Angle Resolution
Welcome to this 5th module in this
introductory series on fmcw radars. Over
The past 4 modules have focussed on
sensing along two dimensions namely
range and velocity.
This module is going to focus on the 3rd
sensing dimension : angle.
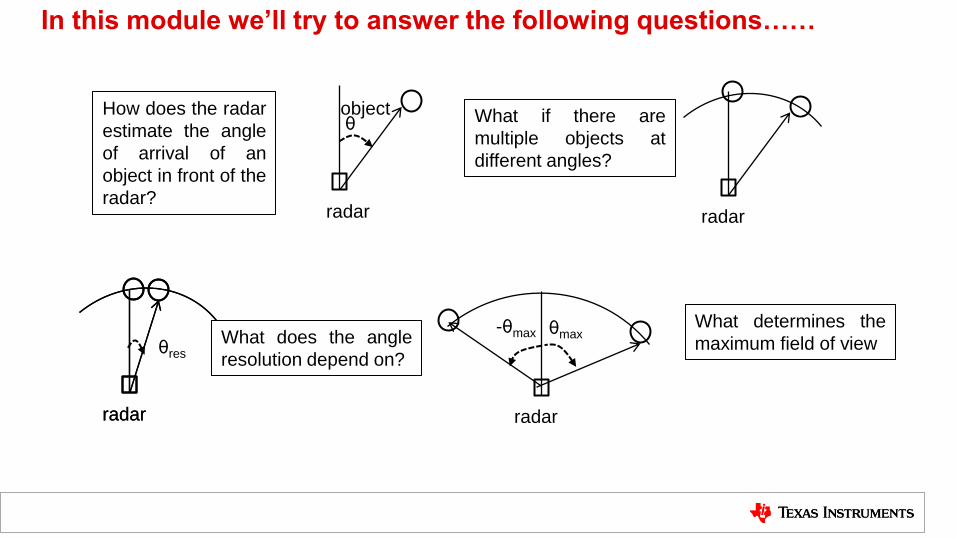
In this module we’ll try to answer the following questions……
radar
object v
radar
θ
v
radar
v
radar radar
θres
-θmax θmax
How does the radar
estimate the angle
of arrival of an
object in front of the
radar?
What if there are
multiple objects at
different angles?
What determines the
maximum field of view What does the angle
resolution depend on?

Basis of Angle of Arrival (AoA) estimation
54
d Δd ω =
4𝜋Δd
𝜆
TX
antenna RX
antennas
d d+Δd
ω =2𝜋Δd
𝜆
Recall that a small change in the distance of the object result in a phase change (ω) in the peak of the range-FFT
Angle Estimation requires at least 2 RX antennas. The differential distance from the object to each of the antennas
results in a phase change in the 2D-FFT peak which is exploited to estimate the angle of arrival
Why are these two expressions
off by a factor of 2?
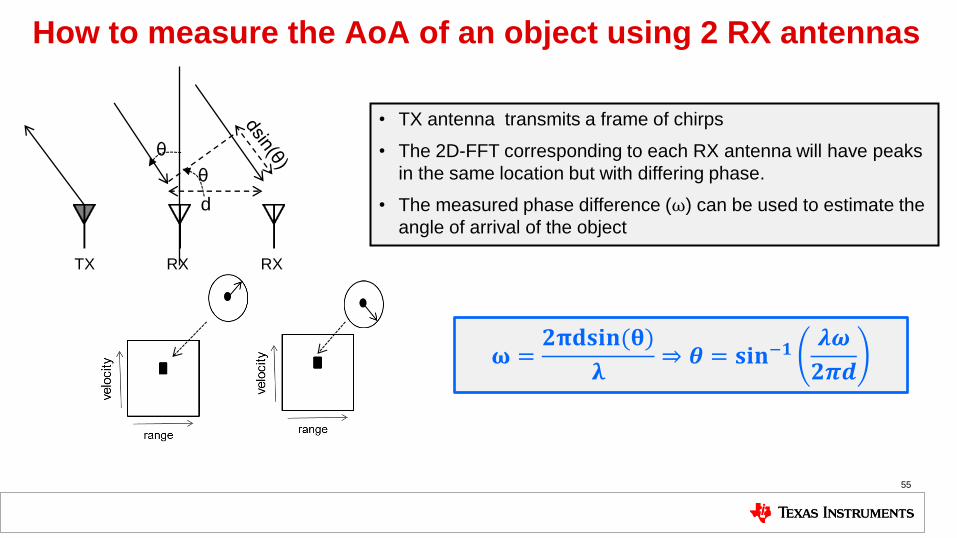
How to measure the AoA of an object using 2 RX antennas
55
dsin(θ)
d
• TX antenna transmits a frame of chirps
• The 2D-FFT corresponding to each RX antenna will have peaks
in the same location but with differing phase.
• The measured phase difference (ω) can be used to estimate the
angle of arrival of the object
𝛚 =𝟐𝛑𝐝𝐬𝐢𝐧(𝛉)
𝛌⇒ 𝜽 = 𝐬𝐢𝐧−𝟏
𝝀𝝎
𝟐𝝅𝒅
θ
θ
TX RX RX

Estimation accuracy depends AoA
ω =2πdsin(θ)
λ
• Note that the relationship between ω and θ is a non-linear
relationship. (unlike in the case of velocity where ω=𝟒𝛑𝐯𝐓𝐂
𝛌)
• At θ =0, ω is most sensitive to changes in θ. The sensitivity of ω to
theta reduces as θ increases (becoming 0 at θ=90o)
• Hence estimation of θ is more error prone as θ increases.
56 radar
Angle estimation is most accurate at θ close to zero
Estimation accuracy degrades as θ approaches 90o
Sensitivity of sin(θ) to θ
degrades as θ increases
θ
sin
(θ)

Angular Field of View
• Unambiguous measurement of velocity => |ω| < 180o
•2πdsin(θ)
λ< π ⇒ θ < sin−1
λ
2d
57
Objects to the left of
the radar => ω>0
Objects to the right
of the radar=> ω<0
The measurement is
unambiguous only if
|ω| < 180o (i.e. π
radians)
a or b ?
The maximum field of view that can be serviced by two antennas spaced d apart is
𝛉𝐦𝐚𝐱 = 𝐬𝐢𝐧−𝟏𝛌
𝟐𝐝
A spacing d of λ/2 results in the largest field of view (+/- 90o )
a
b
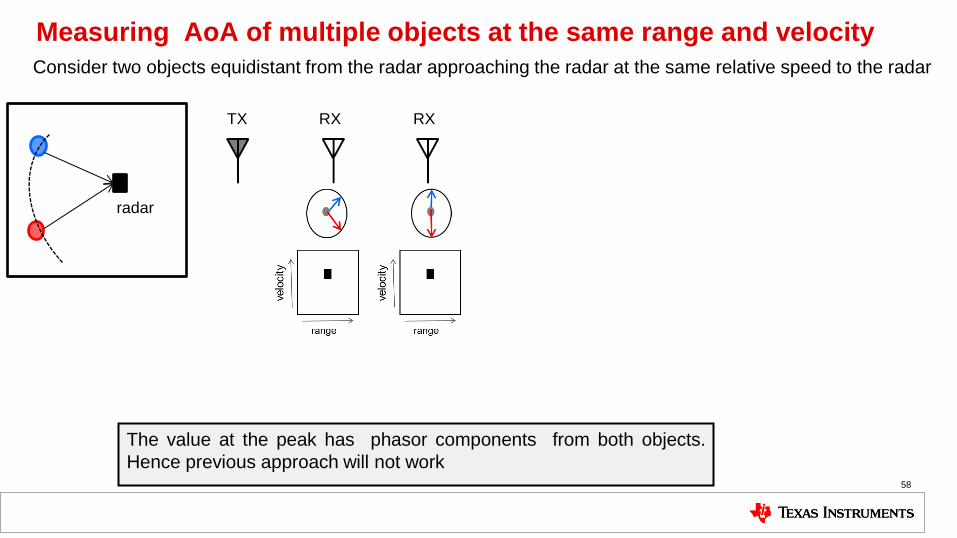
The value at the peak has phasor components from both objects.
Hence previous approach will not work 58
Consider two objects equidistant from the radar approaching the radar at the same relative speed to the radar
Measuring AoA of multiple objects at the same range and velocity
TX RX RX
radar
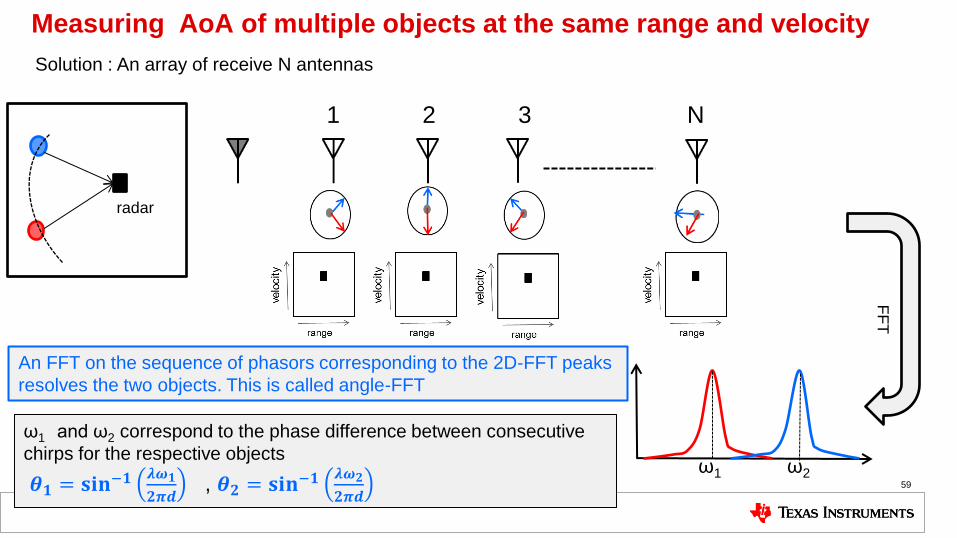
Measuring AoA of multiple objects at the same range and velocity
59
Solution : An array of receive N antennas F
FT
An FFT on the sequence of phasors corresponding to the 2D-FFT peaks
resolves the two objects. This is called angle-FFT
ω1 ω2
ω1 and ω2 correspond to the phase difference between consecutive
chirps for the respective objects
𝜽𝟏 = 𝐬𝐢𝐧−𝟏𝝀𝝎𝟏
𝟐𝝅𝒅 , 𝜽𝟐 = 𝐬𝐢𝐧−𝟏
𝝀𝝎𝟐
𝟐𝝅𝒅
radar
1 2 3 N
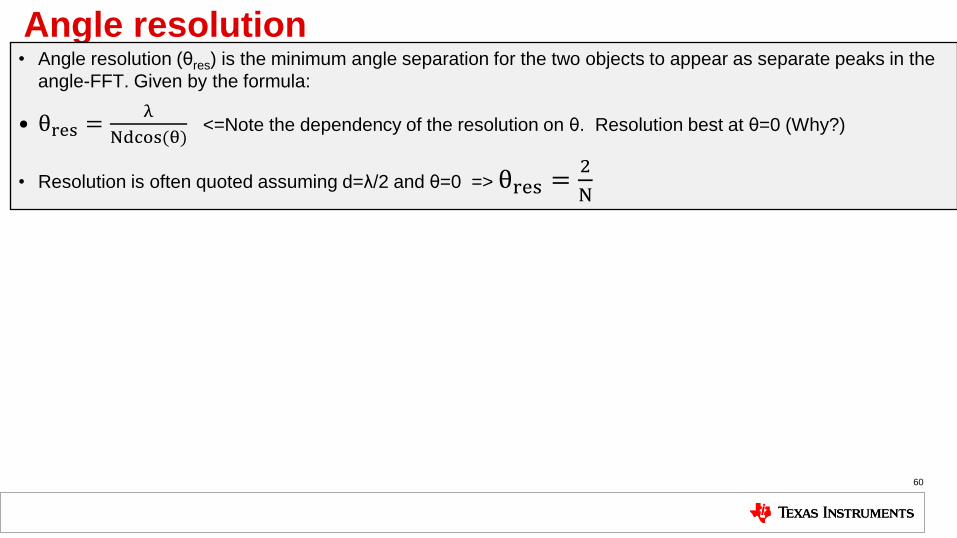
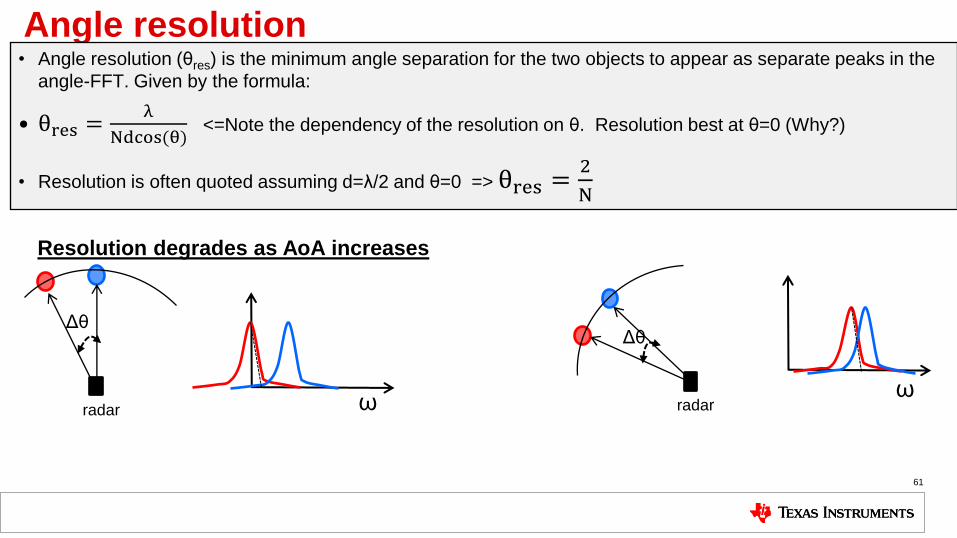
Angle resolution • Angle resolution (θres) is the minimum angle separation for the two objects to appear as separate peaks in the
angle-FFT. Given by the formula:
• θres =λ
Ndcos(θ) <=Note the dependency of the resolution on θ. Resolution best at θ=0 (Why?)
• Resolution is often quoted assuming d=λ/2 and θ=0 => θres =2
N
60
Angle resolution • Angle resolution (θres) is the minimum angle separation for the two objects to appear as separate peaks in the
angle-FFT. Given by the formula:
• θres =λ
Ndcos(θ) <=Note the dependency of the resolution on θ. Resolution best at θ=0 (Why?)
• Resolution is often quoted assuming d=λ/2 and θ=0 => θres =2
N
61
radar radar
Δθ Δθ
ω ω
Resolution degrades as AoA increases
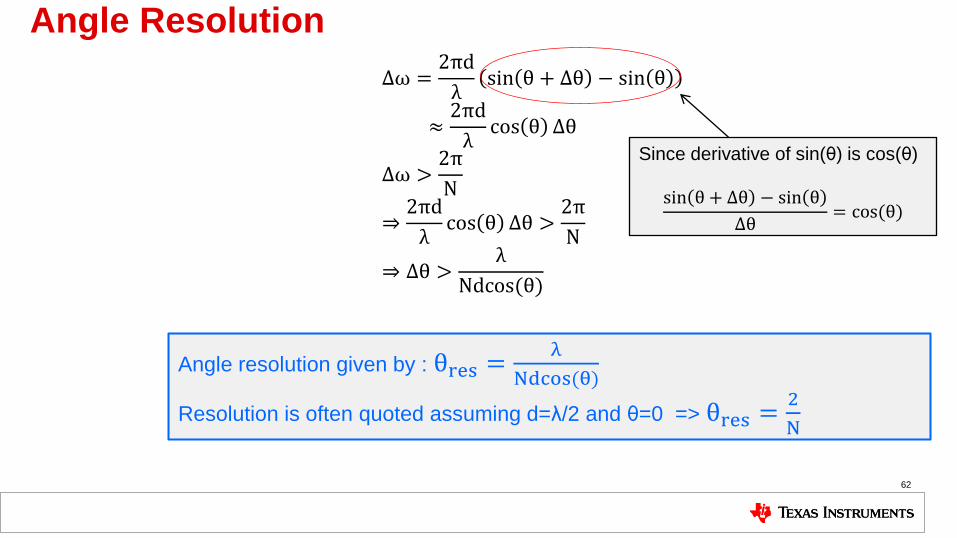
Angle Resolution
Δω =2πd
λsin θ + Δθ − sin θ
≈2πd
λcos θ Δθ
Δω >2π
N
⇒2πd
λcos θ Δθ >
2π
N
⇒ Δθ >λ
Ndcos(θ)
62
Since derivative of sin(θ) is cos(θ)
sin θ + Δθ − sin θ
Δθ= cos(θ)
Angle resolution given by : θres =λ
Ndcos(θ)
Resolution is often quoted assuming d=λ/2 and θ=0 => θres =2
N

VELOCITY ESTIMATION
• Exploits phase change across chirps
separated in time
• Resolution depends on Frame length
(vres =λ
2Tf)
• Maximum velocity that can be unambiguously
measured depends on the time Tc between
consecutive chirps (vmax =λ
4Tc)
ANGLE ESTIMATION
• Exploits phase change across chirps
separated in space
• Resolution depends on Antenna array length
(Nd is array length) (θres =λ
Ndcos(θ))
• Maximum angle that can be unambiguously
measured depends on the distance d
between consecutive antennas (𝜃𝑚𝑎𝑥 =𝜆
2𝑑)
Comparision of Angle & Velocity Estimation Both angle estimation and velocity estimation rely on similar concepts and hence its instructive to compare our
discussion on these two
63
d
Tf
Nd
64
range
ve
locity
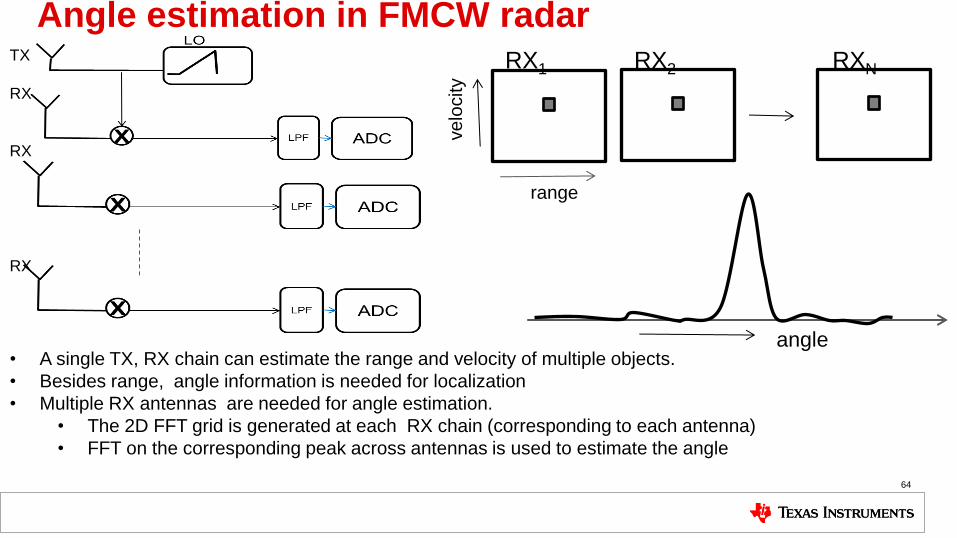
• A single TX, RX chain can estimate the range and velocity of multiple objects.
• Besides range, angle information is needed for localization
• Multiple RX antennas are needed for angle estimation.
• The 2D FFT grid is generated at each RX chain (corresponding to each antenna)
• FFT on the corresponding peak across antennas is used to estimate the angle
angle
Angle estimation in FMCW radar RX1 RX2 RXN TX
RX
RX
RX

Question • Two stationary objects are at the same range from a radar which has 1 TX and 2 RX antennas.
• Is it possible to estimate the angle of arrival of both the objects
65
radar
TX RX RX
Both the objects
appear in the same
bin in both RX’s.
Cannot be
separated out using
only 2 antennas

Question • What about if one of the objects has non-zero velocity?
66
radar
TX RX RX
Both objects now
appear in different
‘bins’ in the 2D-
FFT. Angle
Estimation can now
be performed by
comparing the
phase of blue/red
bins

Range, Velocity and Angle Resolution • Range resolution:
– Directly proportional to the bandwidth (B) spanned by the chirp.
– A good synthesizer should be able to span a large bandwidth. (4GHz=> 4cm)
• Velocity resolution:
– Velocity resolution can be improved by increasing frame time (Tf)=> No
hardware cost.
– A Tf of 5ms => vres of 1.5 kmph
• Angle resolution:
– Improving angle resolution requires increasing the number of receive antennas.
Each receive antenna has its own receive chain (LNA, mixer,LPF, ADC).
– Cost and area constraints limit most radar on a chip solutions to a small
number RX chains (Further improvements possible via multi-chip cascading)
67
dres =c
2B
vres =𝜆
2Tf
𝜃res =2
𝑁
Range and Velocity resolution are the native strengths of radar
68
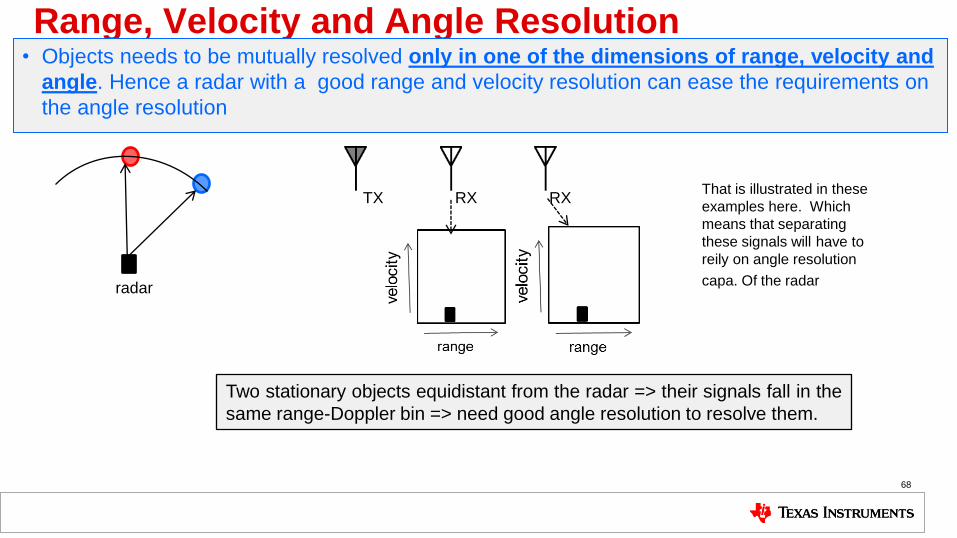
Range, Velocity and Angle Resolution
TX RX RX
Two stationary objects equidistant from the radar => their signals fall in the
same range-Doppler bin => need good angle resolution to resolve them.
radar
• Objects needs to be mutually resolved only in one of the dimensions of range, velocity and
angle. Hence a radar with a good range and velocity resolution can ease the requirements on
the angle resolution
That is illustrated in these
examples here. Which
means that separating
these signals will have to
reily on angle resolution
capa. Of the radar
69
Range, Velocity and Angle Resolution
TX RX RX
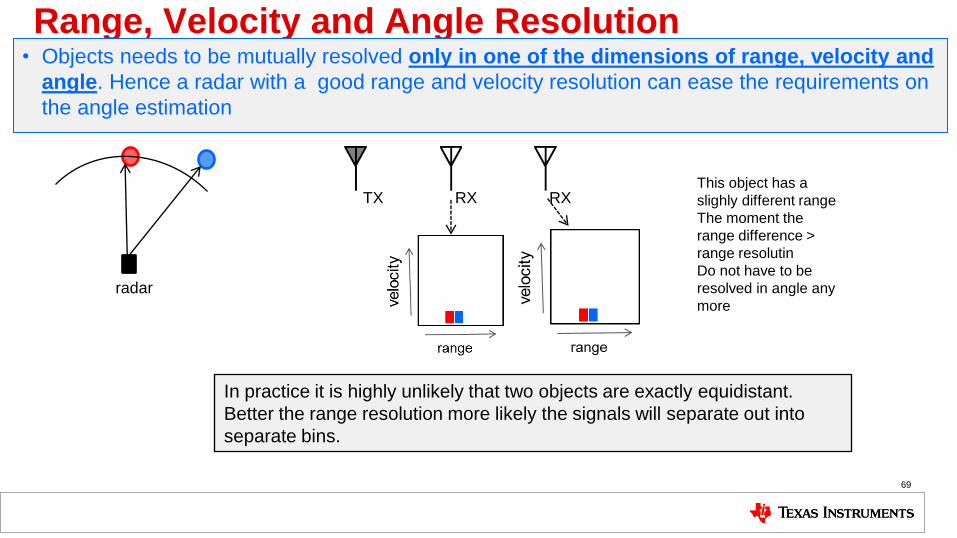
In practice it is highly unlikely that two objects are exactly equidistant.
Better the range resolution more likely the signals will separate out into
separate bins.
radar
• Objects needs to be mutually resolved only in one of the dimensions of range, velocity and
angle. Hence a radar with a good range and velocity resolution can ease the requirements on
the angle estimation
This object has a
slighly different range
The moment the
range difference >
range resolutin
Do not have to be
resolved in angle any
more
70
Range, Velocity and Angle Resolution
radar
TX RX RX
• Objects needs to be mutually resolved only in one of the dimensions of range, velocity and
angle. Hence a radar with a good range and velocity resolution can ease the requirements on
the angle estimation
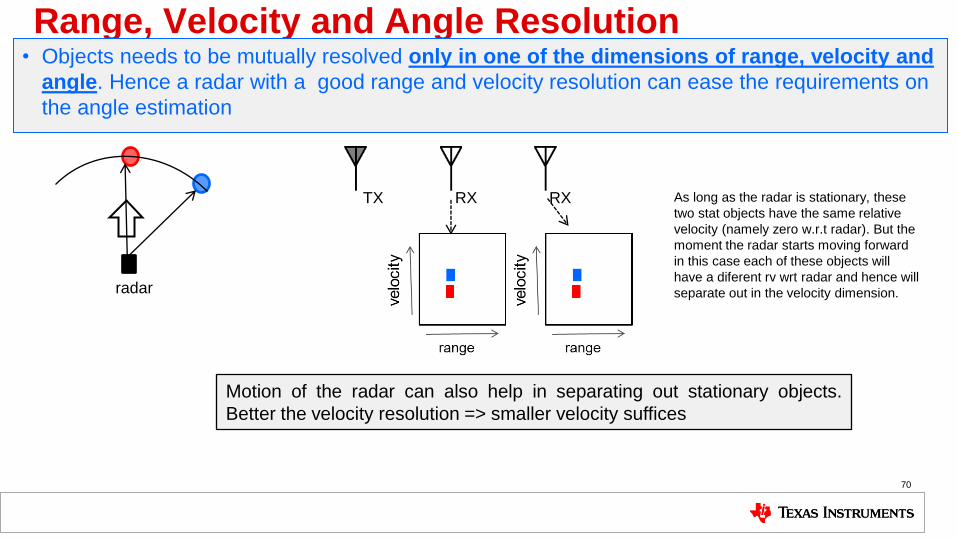
Motion of the radar can also help in separating out stationary objects.
Better the velocity resolution => smaller velocity suffices
As long as the radar is stationary, these
two stat objects have the same relative
velocity (namely zero w.r.t radar). But the
moment the radar starts moving forward
in this case each of these objects will
have a diferent rv wrt radar and hence will
separate out in the velocity dimension.
Recommended