Presented by
Investment fundamentals
A picture book of investment fundamentals.
Contents
Title of slide Illustrating Page
IOOF – Proud of our heritage Our long history in helping Australians secure their financial future 3
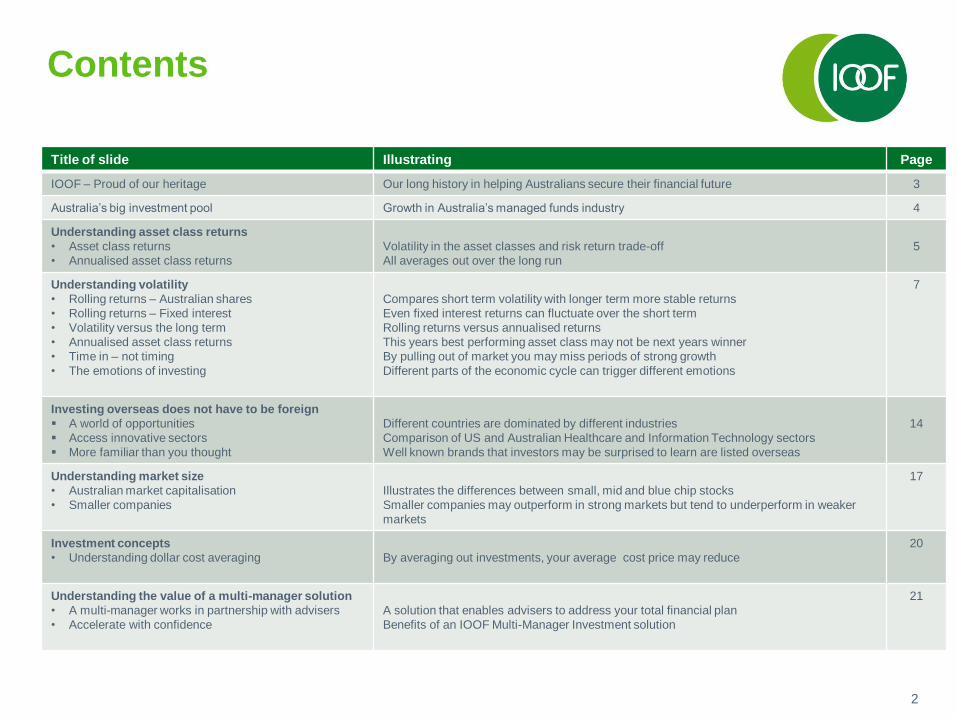
Australia’s big investment pool Growth in Australia’s managed funds industry 4
Understanding asset class returns
• Asset class returns
• Annualised asset class returns
Volatility in the asset classes and risk return trade-off
All averages out over the long run
5
Understanding volatility
• Rolling returns – Australian shares
• Rolling returns – Fixed interest
• Volatility versus the long term
• Annualised asset class returns
• Time in – not timing
• The emotions of investing
Compares short term volatility with longer term more stable returns
Even fixed interest returns can fluctuate over the short term
Rolling returns versus annualised returns
This years best performing asset class may not be next years winner
By pulling out of market you may miss periods of strong growth
Different parts of the economic cycle can trigger different emotions
7
Investing overseas does not have to be foreign
A world of opportunities
Access innovative sectors
More familiar than you thought
Different countries are dominated by different industries
Comparison of US and Australian Healthcare and Information Technology sectors
Well known brands that investors may be surprised to learn are listed overseas
14
Understanding market size
• Australian market capitalisation
• Smaller companies
Illustrates the differences between small, mid and blue chip stocks
Smaller companies may outperform in strong markets but tend to underperform in weaker
markets
17
Investment concepts
• Understanding dollar cost averaging By averaging out investments, your average cost price may reduce
20
Understanding the value of a multi-manager solution
• A multi-manager works in partnership with advisers
• Accelerate with confidence
A solution that enables advisers to address your total financial plan
Benefits of an IOOF Multi-Manager Investment solution
21
2

3
IOOFProud of our heritage – excited by our future
4
Australia’s big investment pool
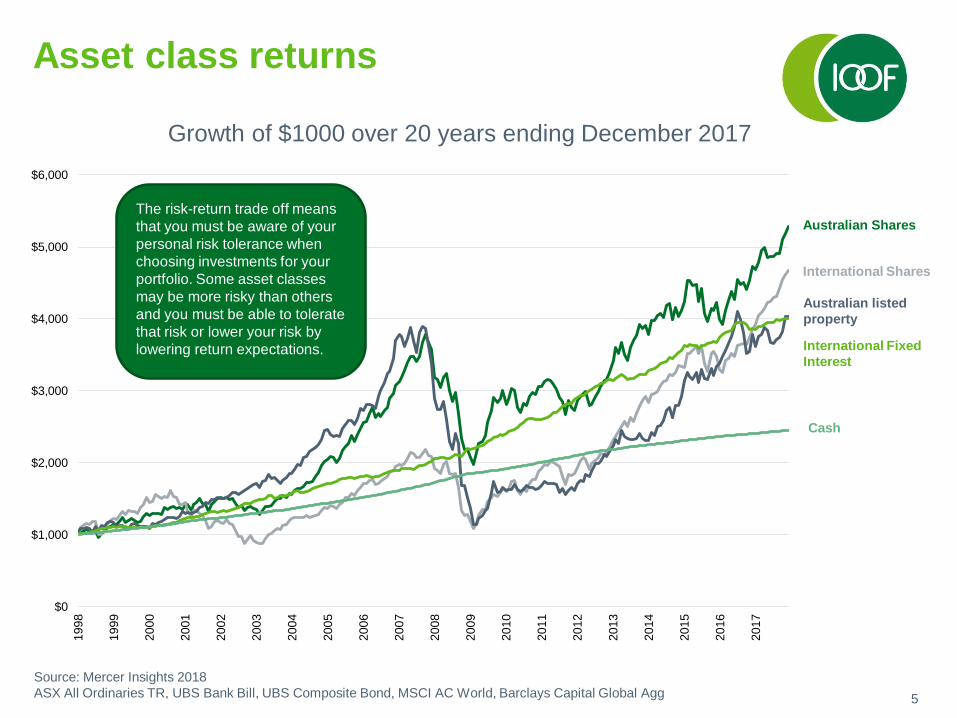
Asset class returns
Source: Mercer Insights 2018
ASX All Ordinaries TR, UBS Bank Bill, UBS Composite Bond, MSCI AC World, Barclays Capital Global Agg
$0
$1,000
$2,000
$3,000
$4,000
$5,000
$6,000
1998
1999
2000
2001
2002
2003
2004
2005
2006
2007
2008
2009
2010
2011
2012
2013
2014
2015
2016
2017
The risk-return trade off means
that you must be aware of your
personal risk tolerance when
choosing investments for your
portfolio. Some asset classes
may be more risky than others
and you must be able to tolerate
that risk or lower your risk by
lowering return expectations.
Growth of $1000 over 20 years ending December 2017
Australian Shares
International Shares
Australian listed
property
International Fixed
Interest
Cash
5

Annualised asset class returns
Source: Bloomberg
Past performance is not a reliable indicator of future performance.
8.4%
5.8%
5.7%
7.6%
6.3%
7.5%
4.7%
0% 2% 4% 6% 8% 10%
Australian Shares
International Shares
International Shares (hedged)
Australian Listed Property
Australian Fixed Interest
International Fixed Interest
Cash
Annualised return over 20 years ending May 2017
6
Understanding volatility
7
“Investment markets by their own nature are
volatile. That’s why we always recommend
that investors seek professional financial
advice and are prepared to invest for the long-
term (ie five years or more) to ride out
periods of volatility. Investors who remain
focused on their investment approach despite
periods of volatility, have a greater chance of
achieving their goals.”
Dan FarmerChief Investment Officer
IOOF

8
Rolling returns – Australian shares
Rolling returns are useful for examining the behaviour of returns for different periods. We can see the
volatility experienced over a one year period versus the smoother experience over a longer period of time.
Source: Mercer Insight 2018
Past performance is not a reliable indicator of future performance.
-50.0
-30.0
-10.0
10.0
30.0
50.0
1995
1996
1997
1998
1999
2000
2001
2002
2003
2004
2005
2006
2007
2008
2009
2010
2011
2012
2013
2014
2015
2016
2017
Rolling 1 yr Rolling 5 yrs
ASX All Ords

9
Rolling returns – Fixed interest
Source: Mercer Insight 2018
Past performance is not a reliable indicator of future performance.
-2
0
2
4
6
8
10
12
14
1996
1997
1998
1999
2000
2001
2002
2003
2004
2005
2006
2007
2008
2009
2010
2011
2012
2013
2014
2015
2016
2017
Rolling 1 yr Rolling 5 yrs
Barclays Capital Global Aggregate Bond Index ($A hedged)

10
Volatility and the long term
* MSCI World Ex Australia (Un-hedged) Index
Source: Mercer Insight 2018
-40%
-30%
-20%
-10%
0%
10%
20%
30%
40%
1999
2000
2001
2002
2003
2004
2005
2006
2007
2008
2009
2010
2011
2012
2013
2014
2015
2016
2017
Calendar Year Return (%) Rolling 3 year returns
-30%
-20%
-10%
0%
10%
20%
30%
40%
50%
1999
2000
2001
2002
2003
2004
2005
2006
2007
2008
2009
2010
2011
2012
2013
2014
2015
2016
2017
Calendar Year Return (%) Rolling 3 year returns
Annualised S&P/ASX 300 returns
and rolling one year returns
Annualised MSCI World returns
and rolling one year returns*

11
Calendar year returns
Source: FactSet – Australian Shares: S&P/ASX300 Accumulation Index, Australian Property: S&P/ASX300 A-REIT Accumulation Index,
International Shares: MSCI World Ex Australia (un-hedged), Fixed Interest: UBS Composite Bond Index 0+YR, Cash: UBS Bank Bill Index 90 day
Calendar year returns. Past performance is not a reliable indicator of future performance.
Many investors consider
changing asset classes to chase
the next return.
But as you can see, it’s very
difficult to predict which asset
class will perform strongest in
the following year.
This years winner may not
necessarily be next years.
Australian
Shares (%)
Australian
Listed
Property (%)
International
Shares (%)
Australian
Fixed Interest
(%)
Cash (%)
2000 5 19 2 12 6
2001 10 15 -10 5 5
2002 -9 12 -27 9 5
2003 15 9 -1 3 5
2004 28 32 10 7 6
2005 22 13 17 6 6
2006 25 34 11 3 6
2007 16 -8 -3 3 7
2008 -39 -55 -25 15 8
2009 38 10 0 2 3
2010 2 -1 -2 6 5
2011 -11 -2 -5 11 5
2012 20 33 14 8 4
2013 20 7 48 2 3
2014 5 27 15 10 3
2015 3 14 12 3 2
2016 12 13 8 3 3
2017 12 6 13 4 2

12
Time in – not timing
3.99%
-0.67%
-4.29%
-7.27%
-9.81%
-12.02%
-14% -12% -10% -8% -6% -4% -2% 0% 2% 4% 6%
S&P ASX 300 Accumulation Index
Missed best 10 days
Missed best 20 days
Missed best 30 days
Missed best 40 days
Missed best 50 days
Annualised 10 year return to 31 December 2017
Many people try to pick when
the best time to invest will be.
Unfortunately markets are
unpredictable and none of us
can be sure.
What we can be certain
about however is that by
trying to time the market, you
could in fact miss out on
periods of strong returns.
Source: Bloomberg (ASX300 accumulation index)
Annualised 10 year returns to 31 December 2017
Past performance is not a reliable indicator of future performance.

2006 2007 2008 2009
Despair
Positive
CautiousCautious
Content
Concern
Panic
Unsure
Source: Mercer Insight S&P/ASX300 2006 – 2009 Actual data
A cycle of emotions
13

Australia’s share of global listed stocks
Source: Bloomberg – December 2017
The Australian market represents just 3 per cent of the world’s listed stocks
US41%
Canada5%
Brazil2%
Mexico1%
Chile0%
UK13%
France3%
Germany4%
Istanbul0%
Italy1%
Switzerland3%
Australia3%
Japan11%
Taiwan2%
S.Korea3%
Hong Kong8%
14

Global share markets by sectors
Source: Bloomberg - December 2017
The Australian market is dominated by financials. By looking overseas to invest, you may benefit from access to
industries not represented domestically and add further diversification to your portfolio.
0
20
40
60
80
100
120
Australia EU China United States Japan Brazil Canada UK Germany
Real Estate
Utilities
Energy
Consumer Discretionaries
Telecommunication Services
Health care
Information Technology
Consumer Staples
Industrials
Materials
Financials
15

Access innovative sectors
Source: Bloomberg as at March 2018
40%
35%
30%
25%
20%
15%
10%
5%
0%
Healthcare
Amgen
Gilead Sciences
Pfizer
Johnson & Johnson
Information
Technology
Microsoft
eBay
Apple
Intel Healthcare
Cochlear
CSL
ResMed
United States Australia
S&P 500 Index S&P / ASX 200
ComputerShare
Index Weight
16

17
More familiar than you thoughtMany well-known brands are actually listed on overseas
share markets, so they are really not that foreign to you
after all!

Top 50
Mid Caps
Small Companies
Australian market capitalisation
Market Cap - $1,290 billion
• Cochlear
• CSL
Stocks 50-100
Market Cap - $264 billion
• Resmed
• Seek
• Carsales.com
Stocks 100-300
Market Cap - $254 billion
• Early stage innovators
Market
capitalisation
is the total
dollar market
value of all of
a company's
outstanding
shares. We
tend to use
this figure to
determine a
company's
size, as
opposed to
sales or total
asset figures.
Source: ASX 2018
18

Smaller companies
Source: Mercer Insight 2017
Past performance is not a reliable indicator of future performance.
%
Smaller companies by their nature tend to outperform during periods when the market is rising and
underperform when the market is falling. Investors have the potential to be rewarded for riding out
periods of volatility.
Rolling 1 year returns
-60
-40
-20
0
20
40
60
80
199
8
199
9
200
0
200
1
200
2
200
3
200
4
200
5
200
6
200
7
200
8
200
9
201
0
201
1
201
2
201
3
201
4
201
5
201
6
201
7
S&P/ASX Small Ords median S&P/ASX 300 median
19

20
Understanding dollar cost averaging
If you had invested $6,000 each in of June and July, he would
have only been able to buy 338 units, against 417 by investing
steadily over the whole year.
Amount invested Unit price Number of units
January $1,000 $22 45.45
February $1,000 $24 41.67
March $1,000 $27 37.04
April $1,000 $32 31.25
May $1,000 $31 32.26
June $1,000 $36 27.78
July $1,000 $35 28.57
August $1,000 $34 29.41
September $1,000 $32 31.25
October $1,000 $27 37.04
November $1,000 $26 38.46
December $1,000 $27 37.04
Average $29.42 Total units 417

Where is your time
best spent?Role of your financial
adviser
Multi-Manager solutions work in
partnership with your adviser
Retirement planning
Asset allocation
Manager selection
Portfolio construction
Manager research
Investment research
Estate planning
Aged care advice
Wealth accumulation
Wealth protection
Cashflowmanagement
Asset allocation
Manager selection
Portfolio construction
Manager research
Investment research
21

Manage diversified portfolios of
high quality managers
Manage asset allocation
Manage risk
22
IOOF Multi-Manager InvestmentsMultiple sources of value-add

25 years of multi-manager experience
• IOOF has its origins in one of the first multi-managers
in Australia.
• Depth of experience in process.
The right scale not too big; not too small
• $17.6 billion in FUM.
• Big enough to access the very best managers.
• Small enough to derive meaningful value from boutiques.
IOOF MultiMix
23
Pick the right speed… and
accelerate with confidence
Source: IOOF

24
Important Note: This booklet is issued by IOOF Investment Management Limited (IIML) ABN 53 006 695 021, AFS Licence
No. 230524, as Responsible Entity for IOOF MultiSeries and IOOF MultiMix. IIML is a company within the IOOF group which
consists of IOOF Holdings Ltd ABN 49 100 103 722 and its related bodies corporate.
Past performance is not a reliable indicator of future performance. Performance is net of fund manager fees and
charges and is based on exit price to exit price for the period and assumes that all distributions are reinvested. Investment
management fees, other fees, expenses and tax (where applicable) are accounted for in the exit prices. Unit prices may rise
and fall in line with the value of the underlying assets. IIML does not guarantee the performance or any rate of return of the
investments.
This booklet contains general advice which does not take into account your taxation and financial circumstances, needs and
objectives. Before making any decision based on this booklet, you should assess your own circumstances or seek advice
from a financial adviser. You should also obtain and consider a copy of the relevant formal offer documents available from us
or your financial adviser. The information in this document has been given in good faith and has been prepared based on
information that is believed to be accurate and reliable at the time of publication.
March 2017
Recommended