Investor Presentation
May 2018
DisclaimerThis presentation contains statements that constitute “forward looking statements” under the Private Securities Litigation Reform Act of 1995. All statements other than
statements of historical facts contained in this presentation, including statements regarding our short-term and long-term growth strategies, efforts to develop and
commercialize our products, future operations, future financial position, future capacity, future revenue, future Adjusted EBITDA, projected costs, prospects, plans,
objectives of management and expected market growth are forward-looking statements. These statements involve known and unknown risks, uncertainties and other
important factors that may cause our actual results, performance or achievements to be materially different from any future results, performance or achievements
expressed or implied by the forward-looking statements. The words “anticipate,” “believe,” “could,” “estimate,” “expect,” “guidance,” “intend,” “may,” “plan,”
“potential,” “predict,” “project,” “should,” “target,” “will,” “would” and similar expressions are intended to identify forward-looking statements, although not all forward-
looking statements contain these identifying words.
These forward looking statements are only predictions and we may not actually achieve the plans, intentions or expectations disclosed in our forward-looking statements,
so you should not rely on our forward-looking statements. Actual results or events could differ materially from the plans, intentions and expectations disclosed in the
forward-looking statements we make. We have based these forward-looking statements largely on our current expectations and projections about future events and
trends that we believe may affect our business, financial condition and operating results.
The information in this presentation is current as of May 11, 2018 and speaks only as of such date. We expressly disclaim any obligation to release any updates or
revisions to any information presented herein, including any forward-looking statements, to reflect any change in our expectations or projections or any changes in
events, conditions or circumstances on which any such information or statements are based for any reason, except as required by law, even as new information becomes
available. All information and forward-looking statements in this presentation are qualified in their entirety by this cautionary statement.
In addition to results presented in accordance with U.S. GAAP, this presentation and related tables include Adjusted EBIDTA, a non-GAAP financial measure. We have
provided a reconciliation of this measure to net income (loss) the most directly comparable GAAP measure, which is available in “Reconciliations” starting on slide 20. We
use Adjusted EBITDA as a measure of operating performance, because it does not include the impact of items that we do not consider indicative of our core operating
performance, for planning purposes, including the preparation of our annual operating budget, to allocate resources, to enhance the financial performance of our
business, and as a performance measure under our bonus plan. We also believe that the presentation of Adjusted EBITDA provides useful information to investors with
respect to our results of operations and in assessing the performance and value of our business. Although we believe this non-GAAP financial measure enhances
investors’ understanding of our business and performance, this non-GAAP financial measure should not be considered an alternative to or substitute for the
accompanying GAAP financial measures. The discussion of non-GAAP financial measures set forth in our Annual Report on Form 10-K for the year ended December 31,
2017 and filed with the SEC on March 1, 2018, as amended by the discussion of non-GAAP financial measures set forth in our Quarterly Report on Form 10-Q for the
quarterly period ended March 31, 2018 and filed with the SEC on May 4, 2018, pursuant to the Securities Exchange Act of 1934, as amended, are incorporated by
reference into this presentation and should be read in their entirety alongside this presentation
The risk factors set forth in our Annual Report on Form 10-K for the year ended December 31, 2017 and filed with the SEC on March 1, 2018 pursuant to the Securities
Exchange Act of 1934, as amended, are incorporated by reference into this presentation and should be read in their entirety alongside this presentation.
2© 2018 Aspen Aerogels
DisclaimerThis presentation contains market data and industry forecasts that were obtained from industry publications, third party market research and publicly available
information. These publications generally state that the information contained therein has been obtained from sources believed to be reliable, but the accuracy and
completeness of such information is not guaranteed. This presentation also contains estimates and other statistical data made by independent parties and by us relating
to market size and growth and other data about our industry. We obtained the industry and market data in this presentation from our own research as well as from
industry and general publications, surveys and studies conducted by third parties, some of which may not be publicly available. For example, this presentation includes
statistical data extracted from an off-the-shelf market research report (World Insulation - #3435) by The Freedonia Group, an independent international market research
firm, and a separate custom market research report by Freedonia Custom Research, Inc., a wholly-owned subsidiary of The Freedonia Group, or Freedonia, which was
commissioned by us and was issued in January 2017. Such data may be outdated and involves a number of assumptions and limitations and contains projections and
estimates of the future performance of the industries in which we operate that are subject to a high degree of uncertainty. We caution you not to give undue weight to
such projections, assumptions and estimates.
The Freedonia Custom Research, Inc. Report, or the Freedonia Report, represents data, research opinion or viewpoints developed independently on our behalf and does
not constitute a specific guide to action. In preparing the Freedonia Report, Freedonia used various sources, including publicly available third party financial statements;
government statistical reports; press releases; industry magazines; and interviews with manufacturers of related products (including us), manufacturers of competitive
products, distributors of related products and government and trade associations. The Freedonia Report speaks as of its final publication date (and not as of the date of
this presentation).
3© 2018 Aspen Aerogels
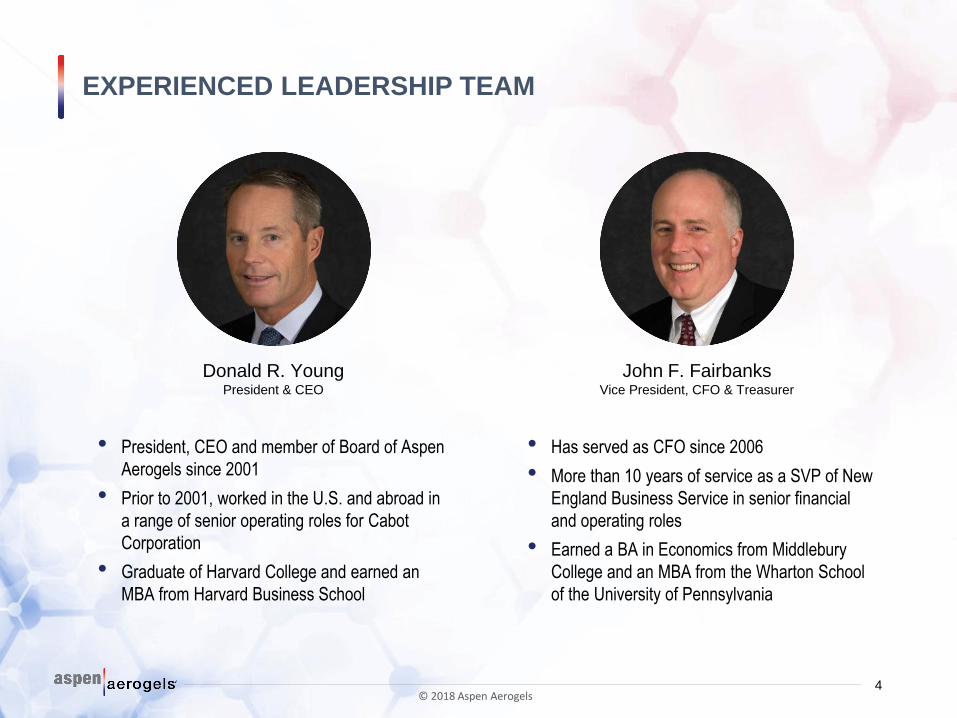
EXPERIENCED LEADERSHIP TEAM
4
• President, CEO and member of Board of Aspen
Aerogels since 2001
• Prior to 2001, worked in the U.S. and abroad in
a range of senior operating roles for Cabot
Corporation
• Graduate of Harvard College and earned an
MBA from Harvard Business School
Donald R. YoungPresident & CEO
• Has served as CFO since 2006
• More than 10 years of service as a SVP of New
England Business Service in senior financial
and operating roles
• Earned a BA in Economics from Middlebury
College and an MBA from the Wharton School
of the University of Pennsylvania
John F. FairbanksVice President, CFO & Treasurer
© 2018 Aspen Aerogels
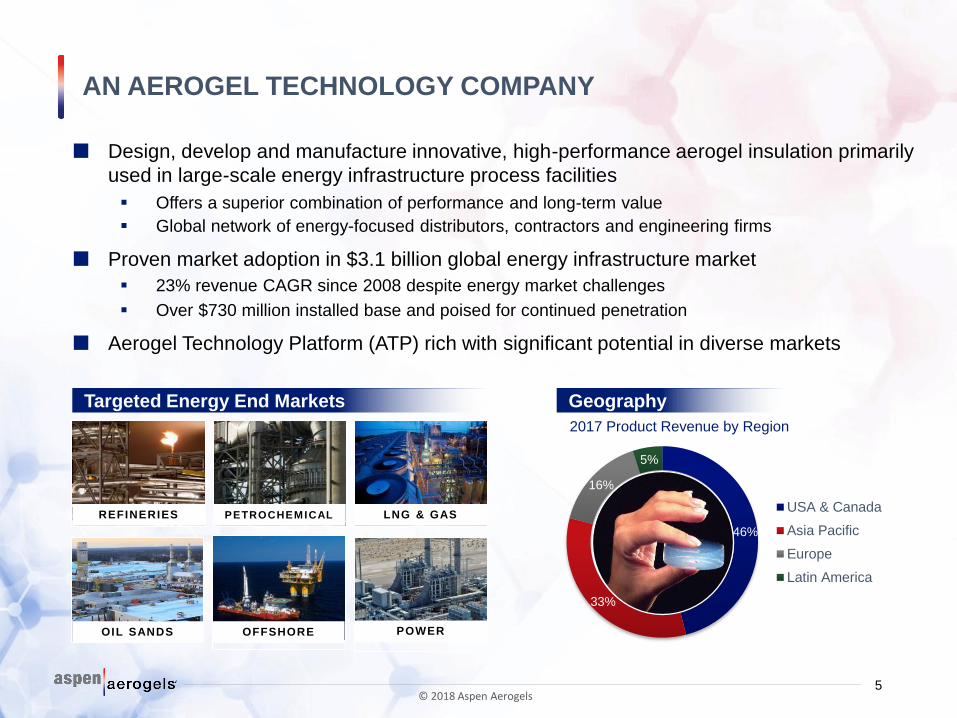
46%
33%
16%
5%
USA & Canada
Asia Pacific
Europe
Latin America
GeographyTargeted Energy End Markets
2017 Product Revenue by Region
Design, develop and manufacture innovative, high-performance aerogel insulation primarily
used in large-scale energy infrastructure process facilities
Offers a superior combination of performance and long-term value
Global network of energy-focused distributors, contractors and engineering firms
Proven market adoption in $3.1 billion global energy infrastructure market
23% revenue CAGR since 2008 despite energy market challenges
Over $730 million installed base and poised for continued penetration
Aerogel Technology Platform (ATP) rich with significant potential in diverse markets
AN AEROGEL TECHNOLOGY COMPANY
5
REFINERIES PETROCHEMICAL
POWER
LNG & GAS
OFFSHOREOIL SANDS
© 2018 Aspen Aerogels
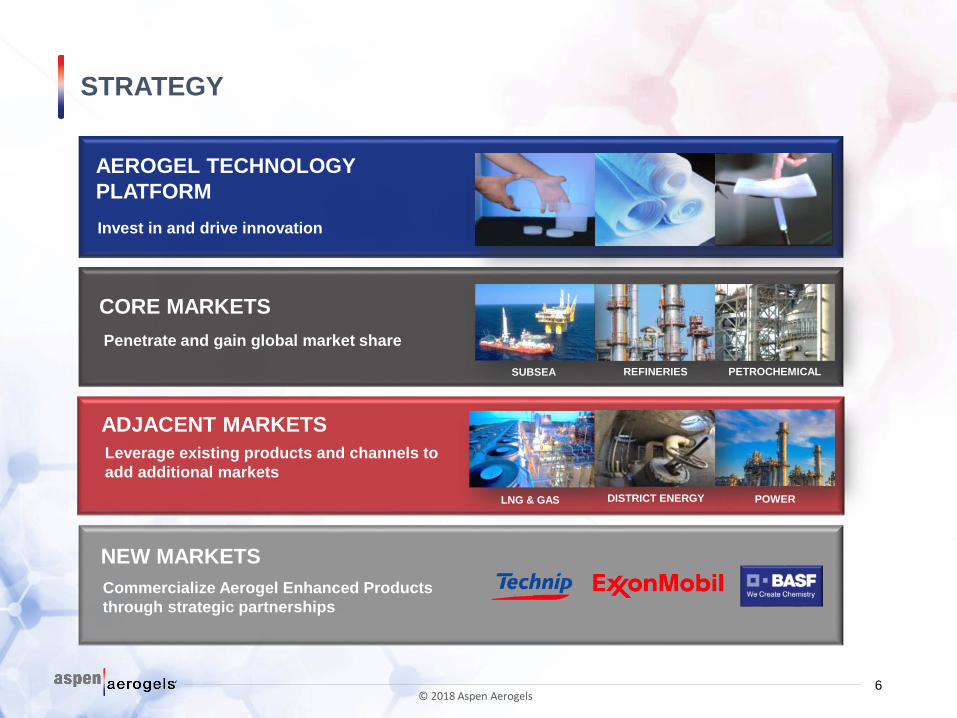
STRATEGY
AEROGEL TECHNOLOGY
PLATFORM
CORE MARKETS
ADJACENT MARKETS
NEW MARKETS
Invest in and drive innovation
Penetrate and gain global market share
Leverage existing products and channels to
add additional markets
Commercialize Aerogel Enhanced Products
through strategic partnerships
6
SUBSEA REFINERIES PETROCHEMICAL
LNG & GAS DISTRICT ENERGY POWER
© 2018 Aspen Aerogels
CORE MARKETS
7
REFINERIES
DISTRICT ENERGY
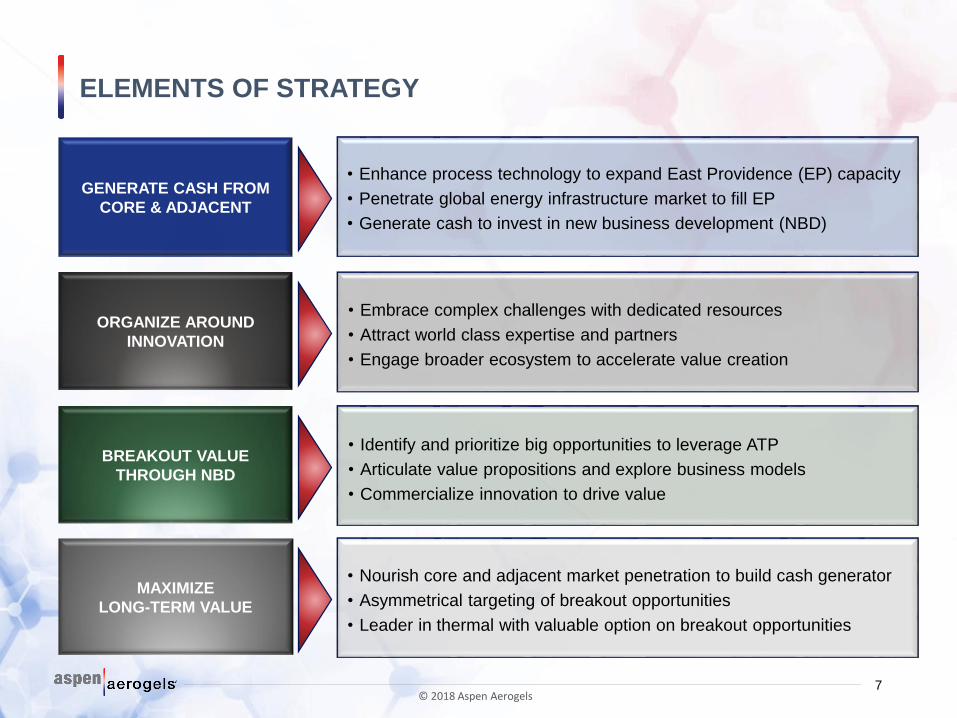
ELEMENTS OF STRATEGY
GENERATE CASH FROM
CORE & ADJACENT
MAXIMIZE
LONG-TERM VALUE
ORGANIZE AROUND
INNOVATION
BREAKOUT VALUE
THROUGH NBD
• Enhance process technology to expand East Providence (EP) capacity
• Penetrate global energy infrastructure market to fill EP
• Generate cash to invest in new business development (NBD)
• Identify and prioritize big opportunities to leverage ATP
• Articulate value propositions and explore business models
• Commercialize innovation to drive value
• Nourish core and adjacent market penetration to build cash generator
• Asymmetrical targeting of breakout opportunities
• Leader in thermal with valuable option on breakout opportunities
• Embrace complex challenges with dedicated resources
• Attract world class expertise and partners
• Engage broader ecosystem to accelerate value creation
© 2018 Aspen Aerogels
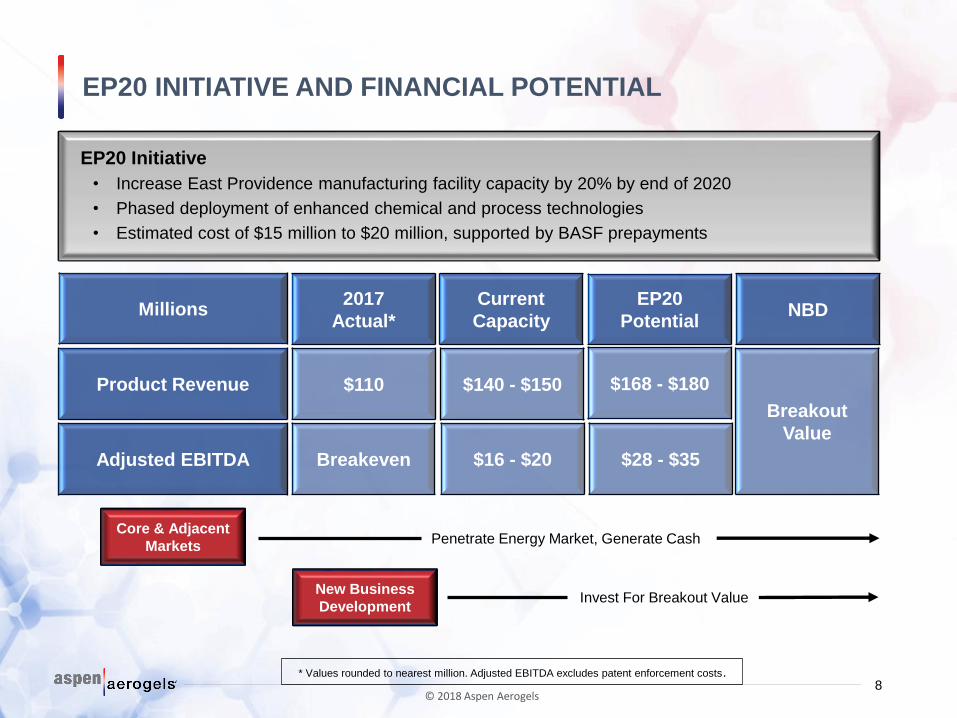
EP20 INITIATIVE AND FINANCIAL POTENTIAL
8© 2018 Aspen Aerogels
Core & Adjacent
Markets
$110 $140 - $150 $168 - $180
NBD
EP20 Initiative
• Increase East Providence manufacturing facility capacity by 20% by end of 2020
• Phased deployment of enhanced chemical and process technologies
• Estimated cost of $15 million to $20 million, supported by BASF prepayments
Penetrate Energy Market, Generate Cash
Invest For Breakout Value
Breakout
Value
New Business
Development
Product Revenue
EP20
Potential
Current
Capacity
2017
Actual*Millions
Adjusted EBITDA Breakeven $16 - $20 $28 - $35
* Values rounded to nearest million. Adjusted EBITDA excludes patent enforcement costs.
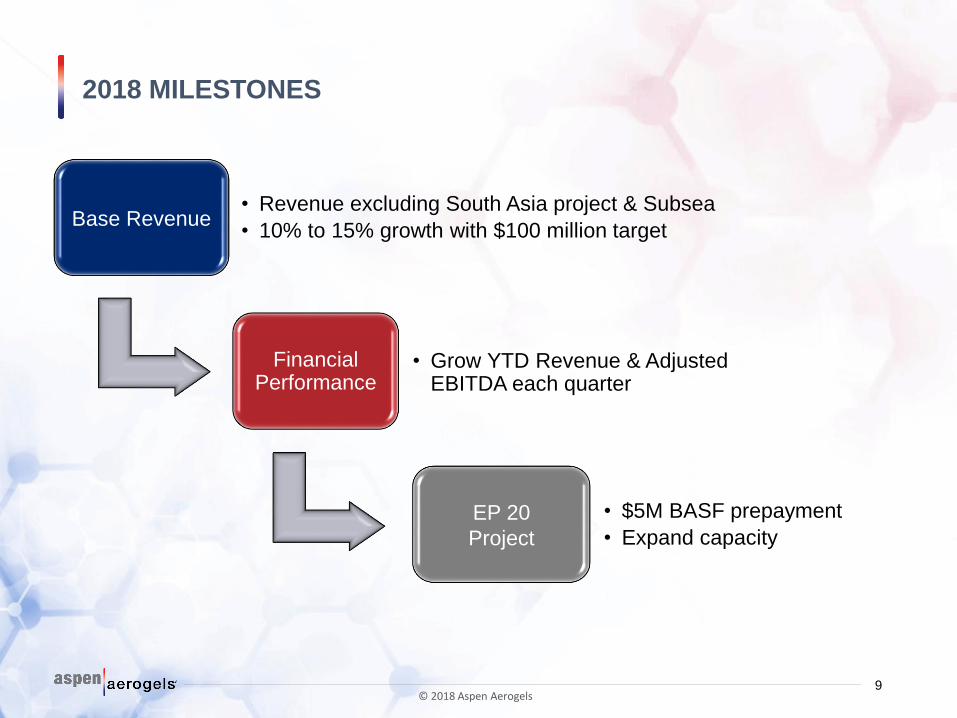
2018 MILESTONES
Base Revenue• Revenue excluding South Asia project & Subsea
• 10% to 15% growth with $100 million target
Financial Performance
• Grow YTD Revenue & Adjusted EBITDA each quarter
EP 20
Project
• $5M BASF prepayment
• Expand capacity
9© 2018 Aspen Aerogels
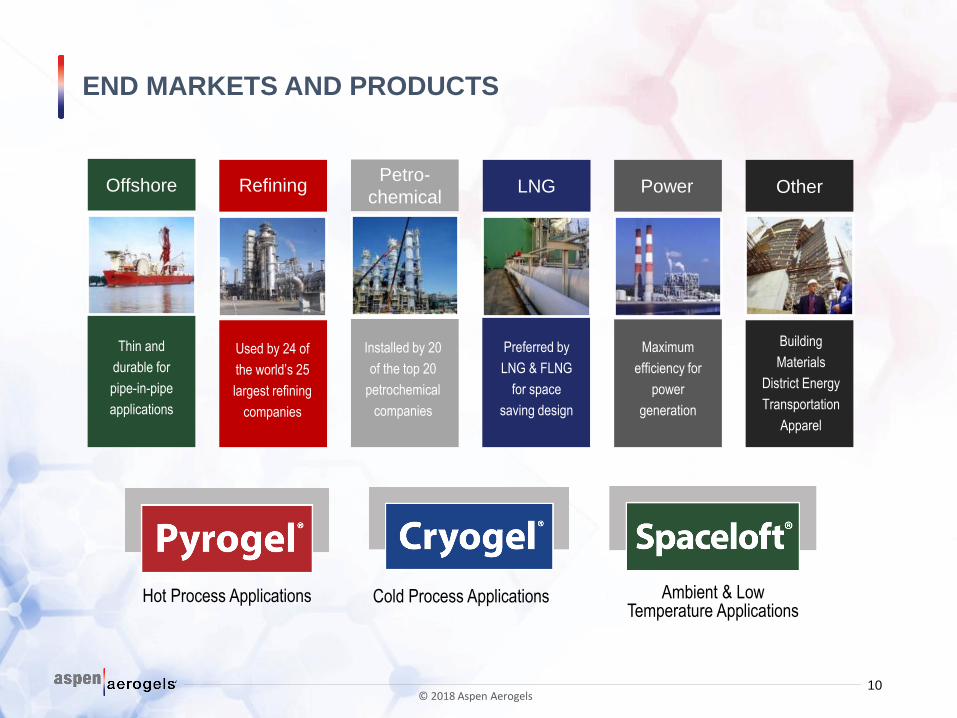
END MARKETS AND PRODUCTS
Refining
Used by 24 of
the world’s 25
largest refining
companies
Petro-
chemical
Installed by 20
of the top 20
petrochemical
companies
LNG
Preferred by
LNG & FLNG
for space
saving design
Power
Maximum
efficiency for
power
generation
Offshore
Thin and
durable for
pipe-in-pipe
applications
Other
Building
Materials
District Energy
Transportation
Apparel
Hot Process Applications Cold Process Applications Ambient & LowTemperature Applications
10© 2018 Aspen Aerogels
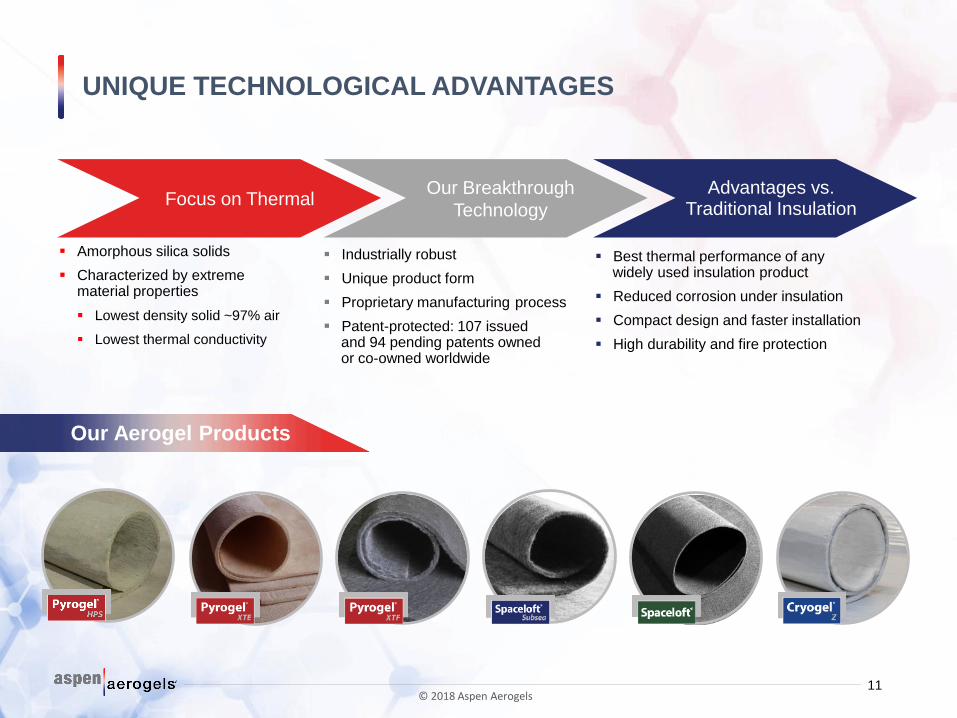
UNIQUE TECHNOLOGICAL ADVANTAGES
11
Amorphous silica solids
Characterized by extreme material properties
Lowest density solid ~97% air
Lowest thermal conductivity
Best thermal performance of any widely used insulation product
Reduced corrosion under insulation
Compact design and faster installation
High durability and fire protection
Industrially robust
Unique product form
Proprietary manufacturing process
Patent-protected: 107 issued and 94 pending patents owned or co-owned worldwide
Focus on ThermalOur Breakthrough
Technology
Advantages vs. Traditional Insulation
Our Aerogel Products
© 2018 Aspen Aerogels
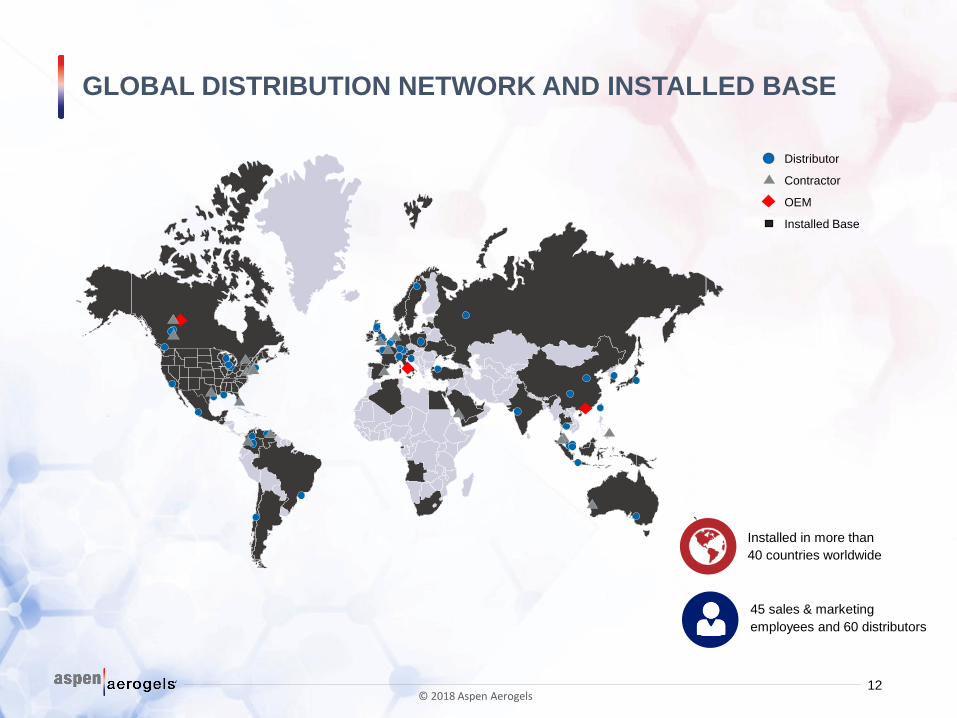
GLOBAL DISTRIBUTION NETWORK AND INSTALLED BASE
Distributor
Contractor
OEM
Installed Base
Installed in more than
40 countries worldwide
45 sales & marketing
employees and 60 distributors
12© 2018 Aspen Aerogels
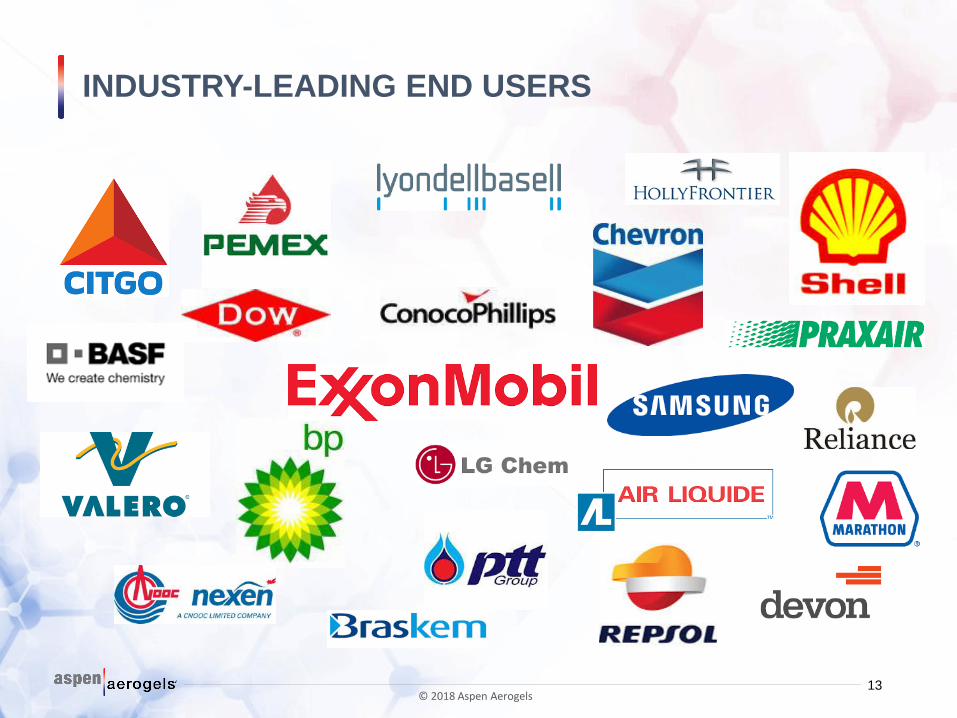
INDUSTRY-LEADING END USERS
13© 2018 Aspen Aerogels

Financial Overview
14
15
For the Year Ended December 31,
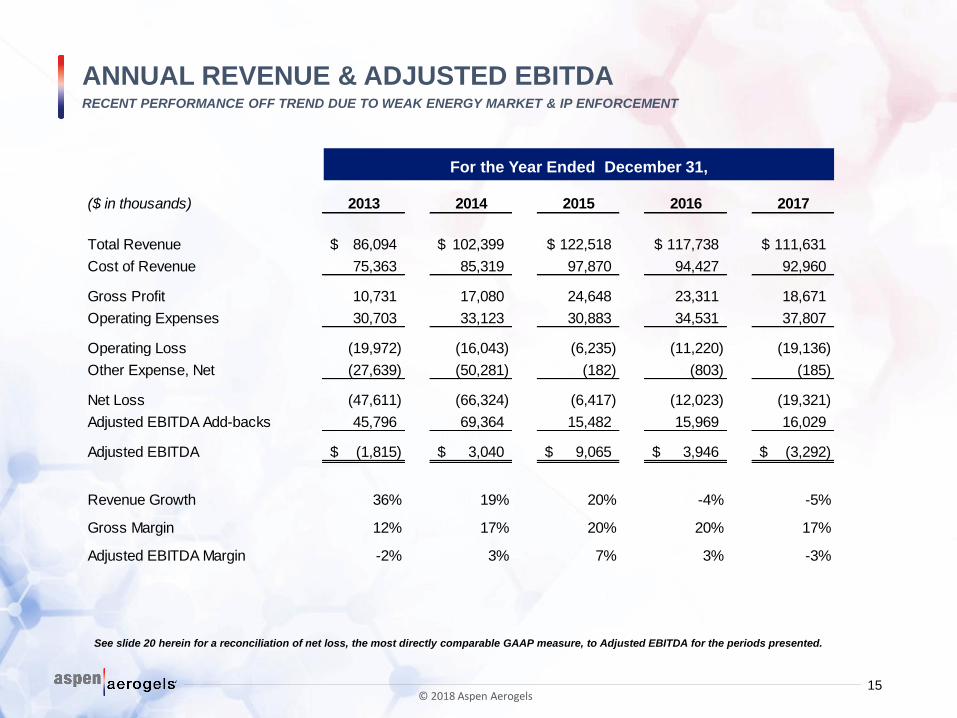
See slide 20 herein for a reconciliation of net loss, the most directly comparable GAAP measure, to Adjusted EBITDA for the periods presented.
($ in thousands) 2013 2014 2015 2016 2017
86,094$ 102,399$ 122,518$ 117,738$ 111,631$
75,363 85,319 97,870 94,427 92,960
10,731 17,080 24,648 23,311 18,671
Operating Expenses 30,703 33,123 30,883 34,531 37,807
(19,972) (16,043) (6,235) (11,220) (19,136)
Other Expense, Net (27,639) (50,281) (182) (803) (185)
Net Loss (47,611) (66,324) (6,417) (12,023) (19,321)
Adjusted EBITDA Add-backs 45,796 69,364 15,482 15,969 16,029
(1,815)$ 3,040$ 9,065$ 3,946$ (3,292)$
Revenue Growth 36% 19% 20% -4% -5%
Gross Margin 12% 17% 20% 20% 17%
Adjusted EBITDA Margin -2% 3% 7% 3% -3%
Adjusted EBITDA
Operating Loss
Cost of Revenue
Gross Profit
Total Revenue
ANNUAL REVENUE & ADJUSTED EBITDARECENT PERFORMANCE OFF TREND DUE TO WEAK ENERGY MARKET & IP ENFORCEMENT
© 2018 Aspen Aerogels
16
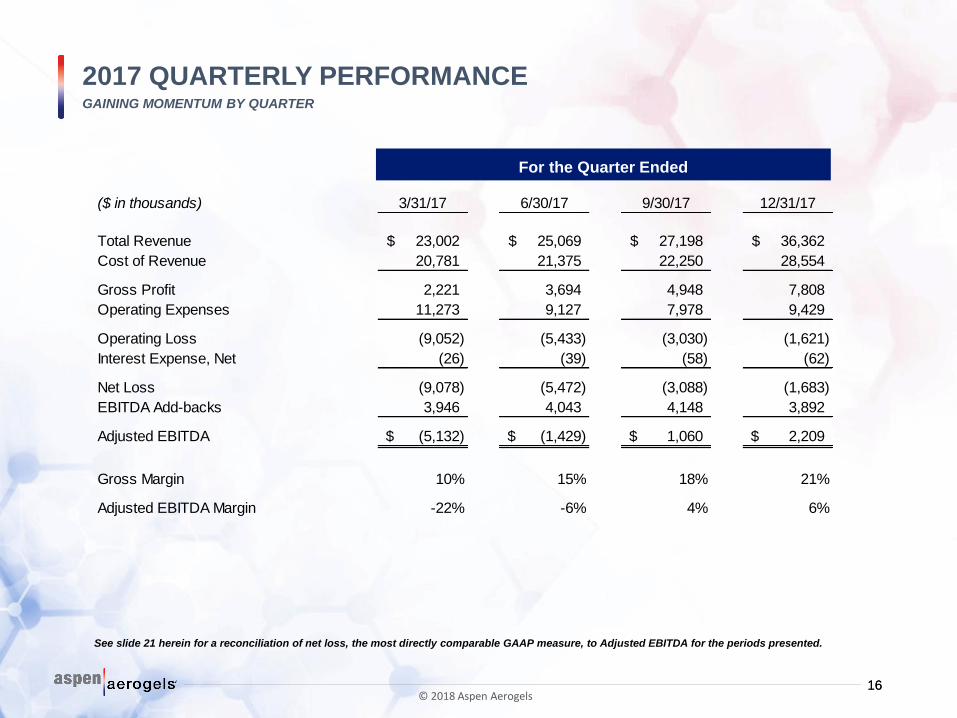
2017 QUARTERLY PERFORMANCEGAINING MOMENTUM BY QUARTER
16
($ in thousands) 3/31/17 6/30/17 9/30/17 12/31/17
23,002$ 25,069$ 27,198$ 36,362$
20,781 21,375 22,250 28,554
2,221 3,694 4,948 7,808
Operating Expenses 11,273 9,127 7,978 9,429
(9,052) (5,433) (3,030) (1,621)
(26) (39) (58) (62)
Net Loss (9,078) (5,472) (3,088) (1,683)
EBITDA Add-backs 3,946 4,043 4,148 3,892
(5,132)$ (1,429)$ 1,060$ 2,209$
Gross Margin 10% 15% 18% 21%
Adjusted EBITDA Margin -22% -6% 4% 6%
Adjusted EBITDA
Operating Loss
Gross Profit
Total Revenue
Cost of Revenue
Interest Expense, Net
© 2018 Aspen Aerogels
For the Quarter Ended
See slide 21 herein for a reconciliation of net loss, the most directly comparable GAAP measure, to Adjusted EBITDA for the periods presented.
17
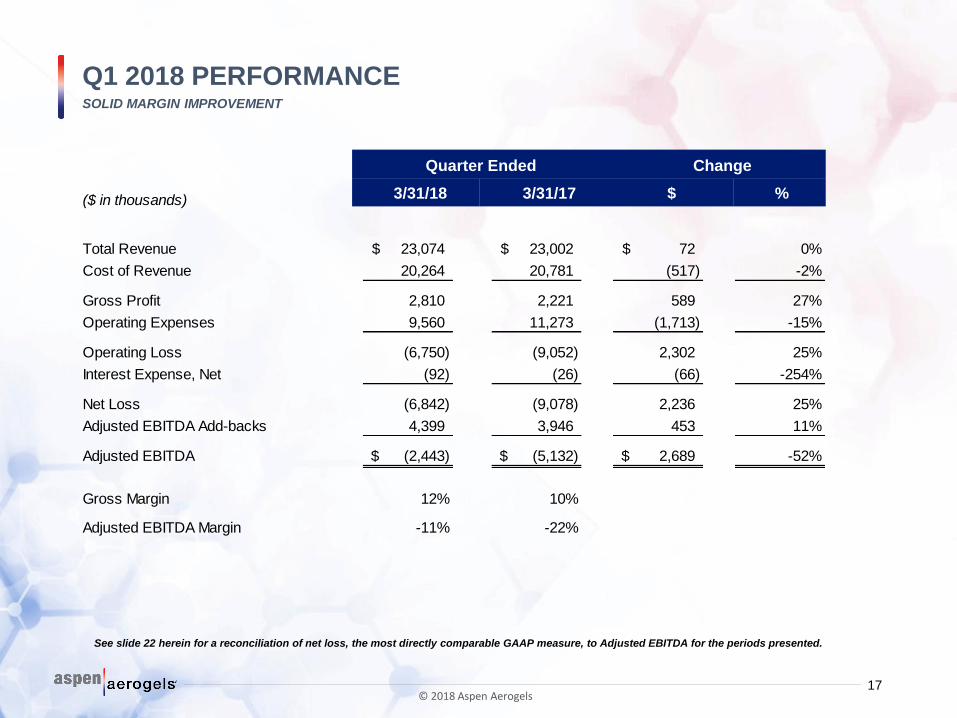
($ in thousands)
23,074$ 23,002$ 72$ 0%
20,264 20,781 (517) -2%
2,810 2,221 589 27%
Operating Expenses 9,560 11,273 (1,713) -15%
(6,750) (9,052) 2,302 25%
(92) (26) (66) -254%
Net Loss (6,842) (9,078) 2,236 25%
Adjusted EBITDA Add-backs 4,399 3,946 453 11%
(2,443)$ (5,132)$ 2,689$ -52%
Gross Margin 12% 10%
Adjusted EBITDA Margin -11% -22%
Total Revenue
Adjusted EBITDA
Operating Loss
Cost of Revenue
Gross Profit
Interest Expense, Net
Quarter Ended Change
3/31/18 3/31/17 $ %
See slide 22 herein for a reconciliation of net loss, the most directly comparable GAAP measure, to Adjusted EBITDA for the periods presented.
Q1 2018 PERFORMANCESOLID MARGIN IMPROVEMENT
© 2018 Aspen Aerogels
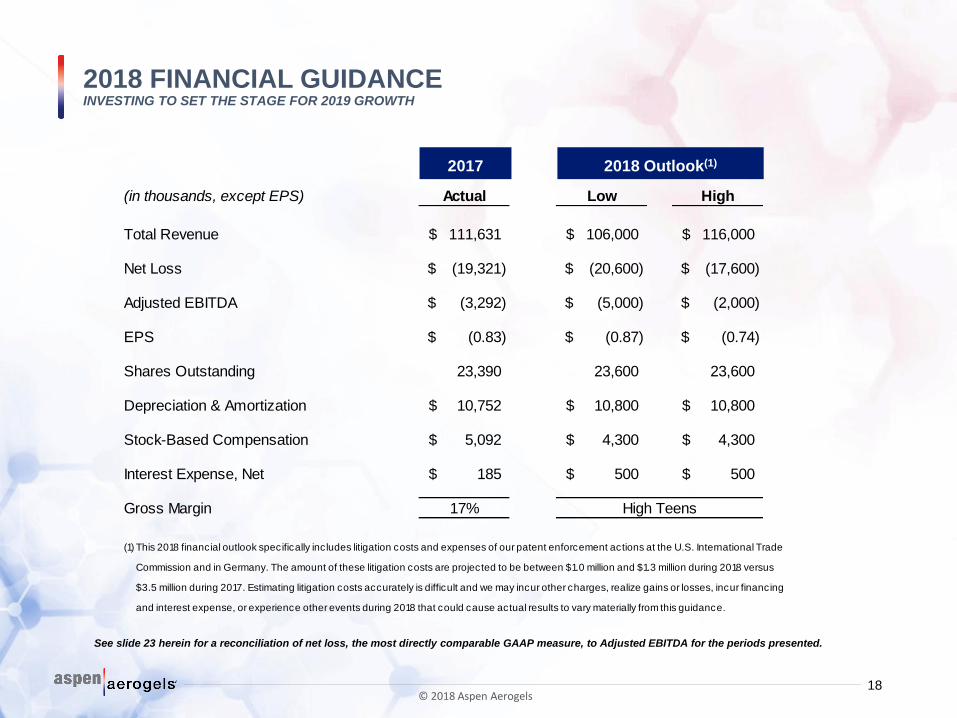
2018 FINANCIAL GUIDANCEINVESTING TO SET THE STAGE FOR 2019 GROWTH
18
2018 Outlook(1)
(in thousands, except EPS) Actual Low High
111,631$ 106,000$ 116,000$
Net Loss (19,321)$ (20,600)$ (17,600)$
(3,292)$ (5,000)$ (2,000)$
EPS (0.83)$ (0.87)$ (0.74)$
Shares Outstanding 23,390 23,600 23,600
Depreciation & Amortization 10,752$ 10,800$ 10,800$
Stock-Based Compensation 5,092$ 4,300$ 4,300$
Interest Expense, Net 185$ 500$ 500$
Gross Margin 17% High Teens
(1) This 2018 financial outlook specifically includes litigation costs and expenses of our patent enforcement actions at the U.S. International Trade
Commission and in Germany. The amount of these litigation costs are projected to be between $1.0 million and $1.3 million during 2018 versus
$3.5 million during 2017. Estimating litigation costs accurately is difficult and we may incur other charges, realize gains or losses, incur financing
and interest expense, or experience other events during 2018 that could cause actual results to vary materially from this guidance.
Adjusted EBITDA
Total Revenue
2017
© 2018 Aspen Aerogels
See slide 23 herein for a reconciliation of net loss, the most directly comparable GAAP measure, to Adjusted EBITDA for the periods presented.
Appendices
19
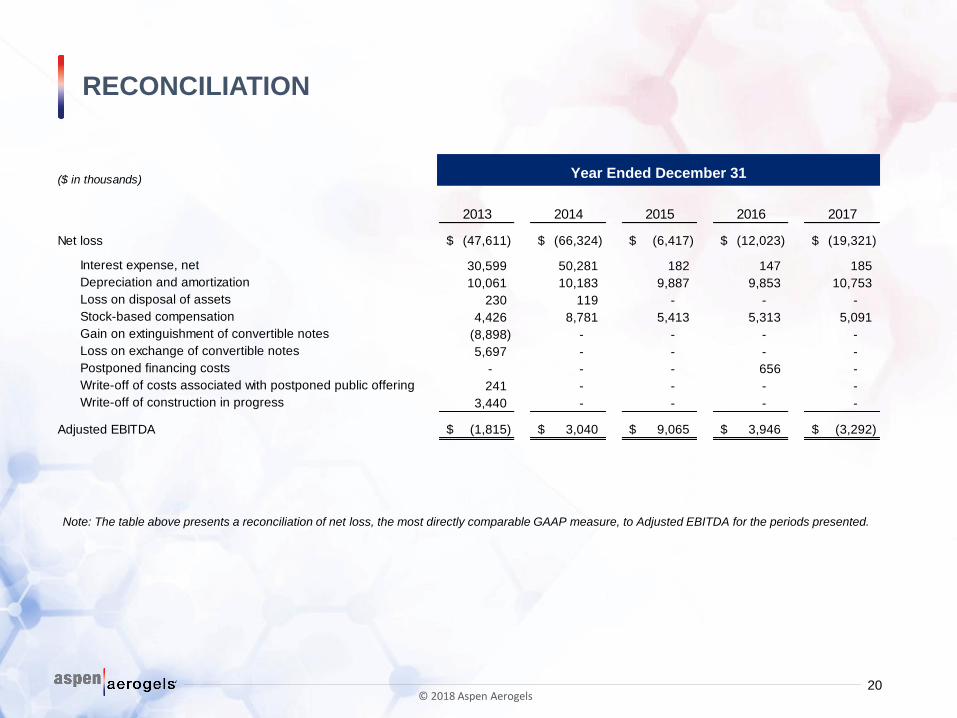
RECONCILIATION
20
Note: The table above presents a reconciliation of net loss, the most directly comparable GAAP measure, to Adjusted EBITDA for the periods presented.
Year Ended December 31($ in thousands)
2013 2014 2015 2016 2017
Net loss (47,611)$ (66,324)$ (6,417)$ (12,023)$ (19,321)$
Interest expense, net 30,599 50,281 182 147 185
Depreciation and amortization 10,061 10,183 9,887 9,853 10,753
Loss on disposal of assets 230 119 - - -
Stock-based compensation 4,426 8,781 5,413 5,313 5,091
Gain on extinguishment of convertible notes (8,898) - - - -
Loss on exchange of convertible notes 5,697 - - - -
Postponed financing costs - - - 656 -
Write-off of costs associated with postponed public offering 241 - - - -
Write-off of construction in progress 3,440 - - - -
Adjusted EBITDA (1,815)$ 3,040$ 9,065$ 3,946$ (3,292)$
© 2018 Aspen Aerogels
21
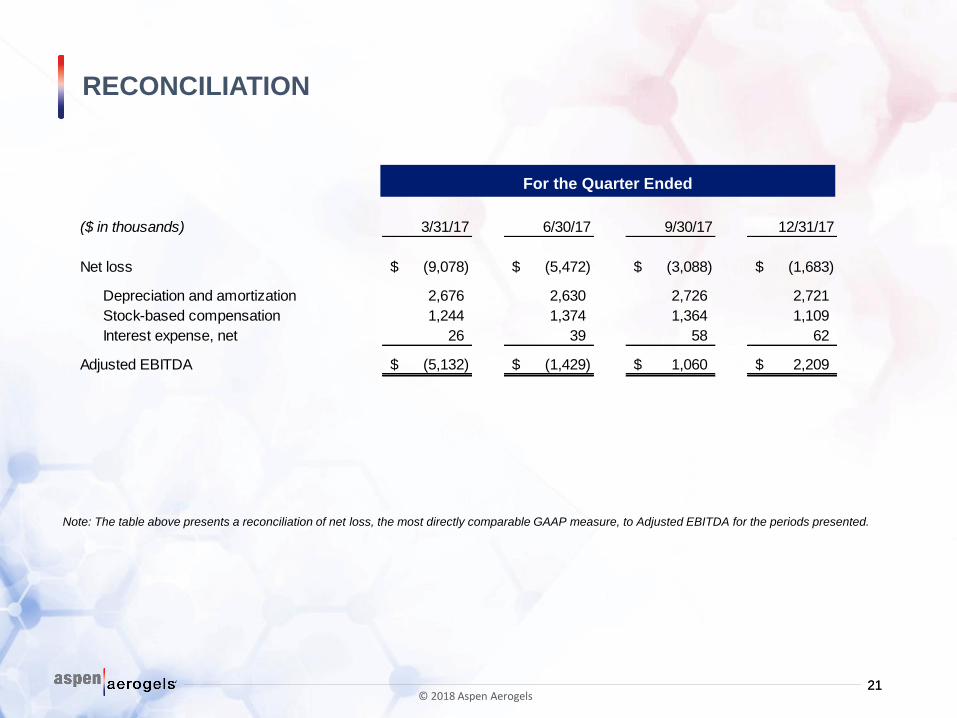
RECONCILIATION
21
($ in thousands) 3/31/17 6/30/17 9/30/17 12/31/17
Net loss (9,078)$ (5,472)$ (3,088)$ (1,683)$
Depreciation and amortization 2,676 2,630 2,726 2,721
Stock-based compensation 1,244 1,374 1,364 1,109
Interest expense, net 26 39 58 62
Adjusted EBITDA (5,132)$ (1,429)$ 1,060$ 2,209$
© 2018 Aspen Aerogels
For the Quarter Ended
Note: The table above presents a reconciliation of net loss, the most directly comparable GAAP measure, to Adjusted EBITDA for the periods presented.
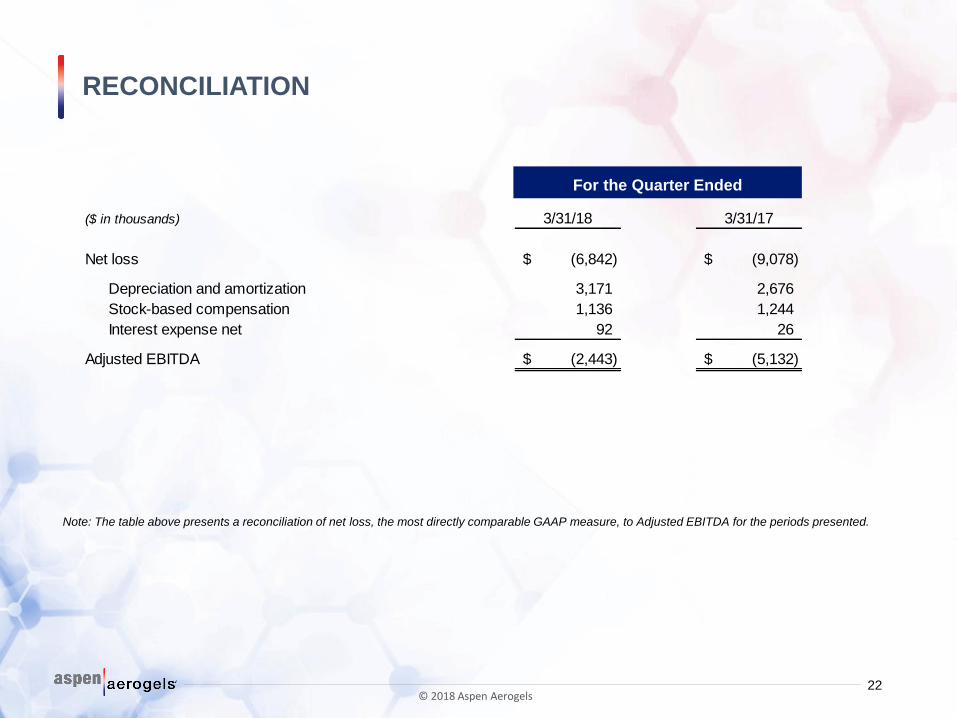
22
($ in thousands) 3/31/18 3/31/17
Net loss (6,842)$ (9,078)$
Depreciation and amortization 3,171 2,676
Stock-based compensation 1,136 1,244
Interest expense net 92 26
Adjusted EBITDA (2,443)$ (5,132)$
For the Quarter Ended
Note: The table above presents a reconciliation of net loss, the most directly comparable GAAP measure, to Adjusted EBITDA for the periods presented.
RECONCILIATION
© 2018 Aspen Aerogels
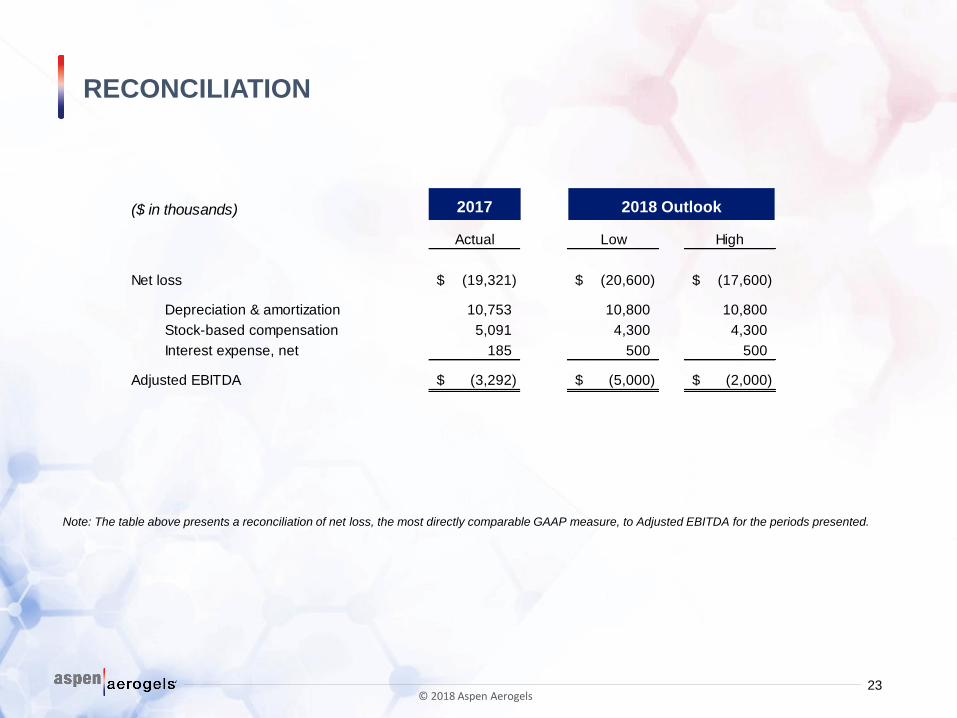
RECONCILIATION
23
($ in thousands)
Actual Low High
Net loss (19,321)$ (20,600)$ (17,600)$
Depreciation & amortization 10,753 10,800 10,800
Stock-based compensation 5,091 4,300 4,300
Interest expense, net 185 500 500
Adjusted EBITDA (3,292)$ (5,000)$ (2,000)$
© 2018 Aspen Aerogels
2018 Outlook2017
Note: The table above presents a reconciliation of net loss, the most directly comparable GAAP measure, to Adjusted EBITDA for the periods presented.

Investor Presentation
May 2018
Recommended