CEO, Juice AnalyticsZach Gemignani
Is the Big Data Revolution Handicapped by “Design”?
7 Design Principles for Communicating with Data
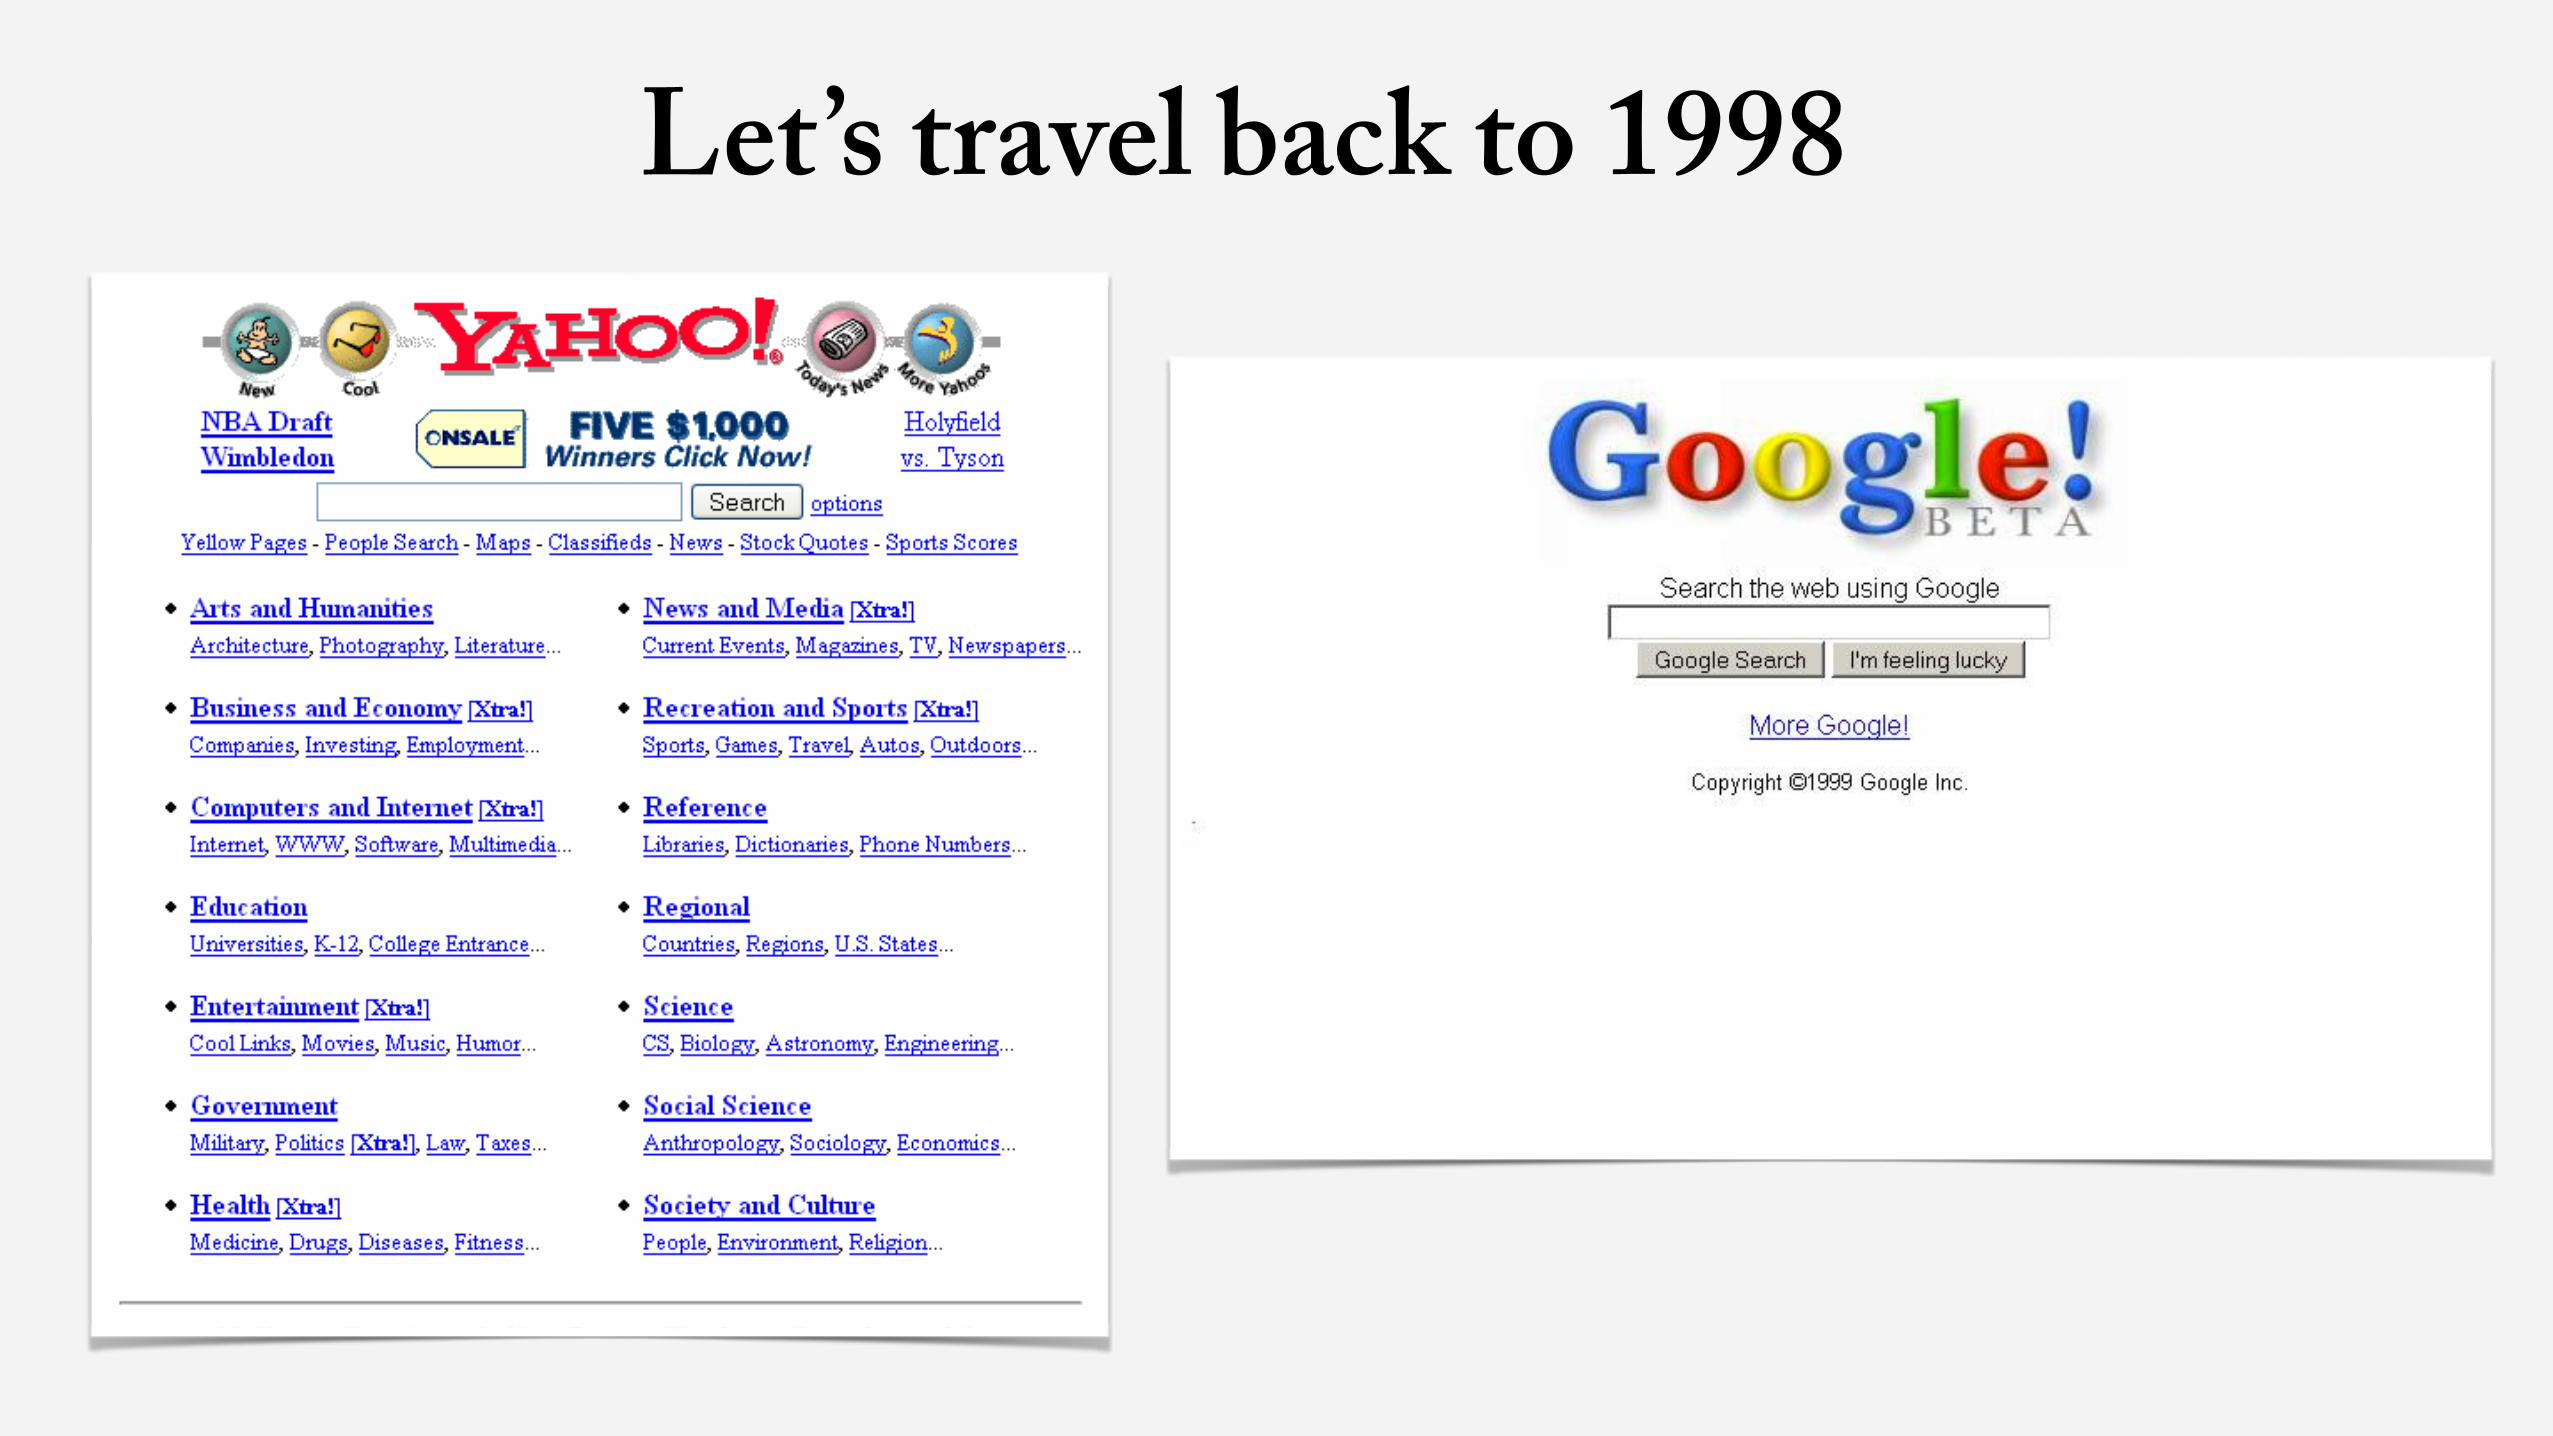
Let’s travel back to 1998
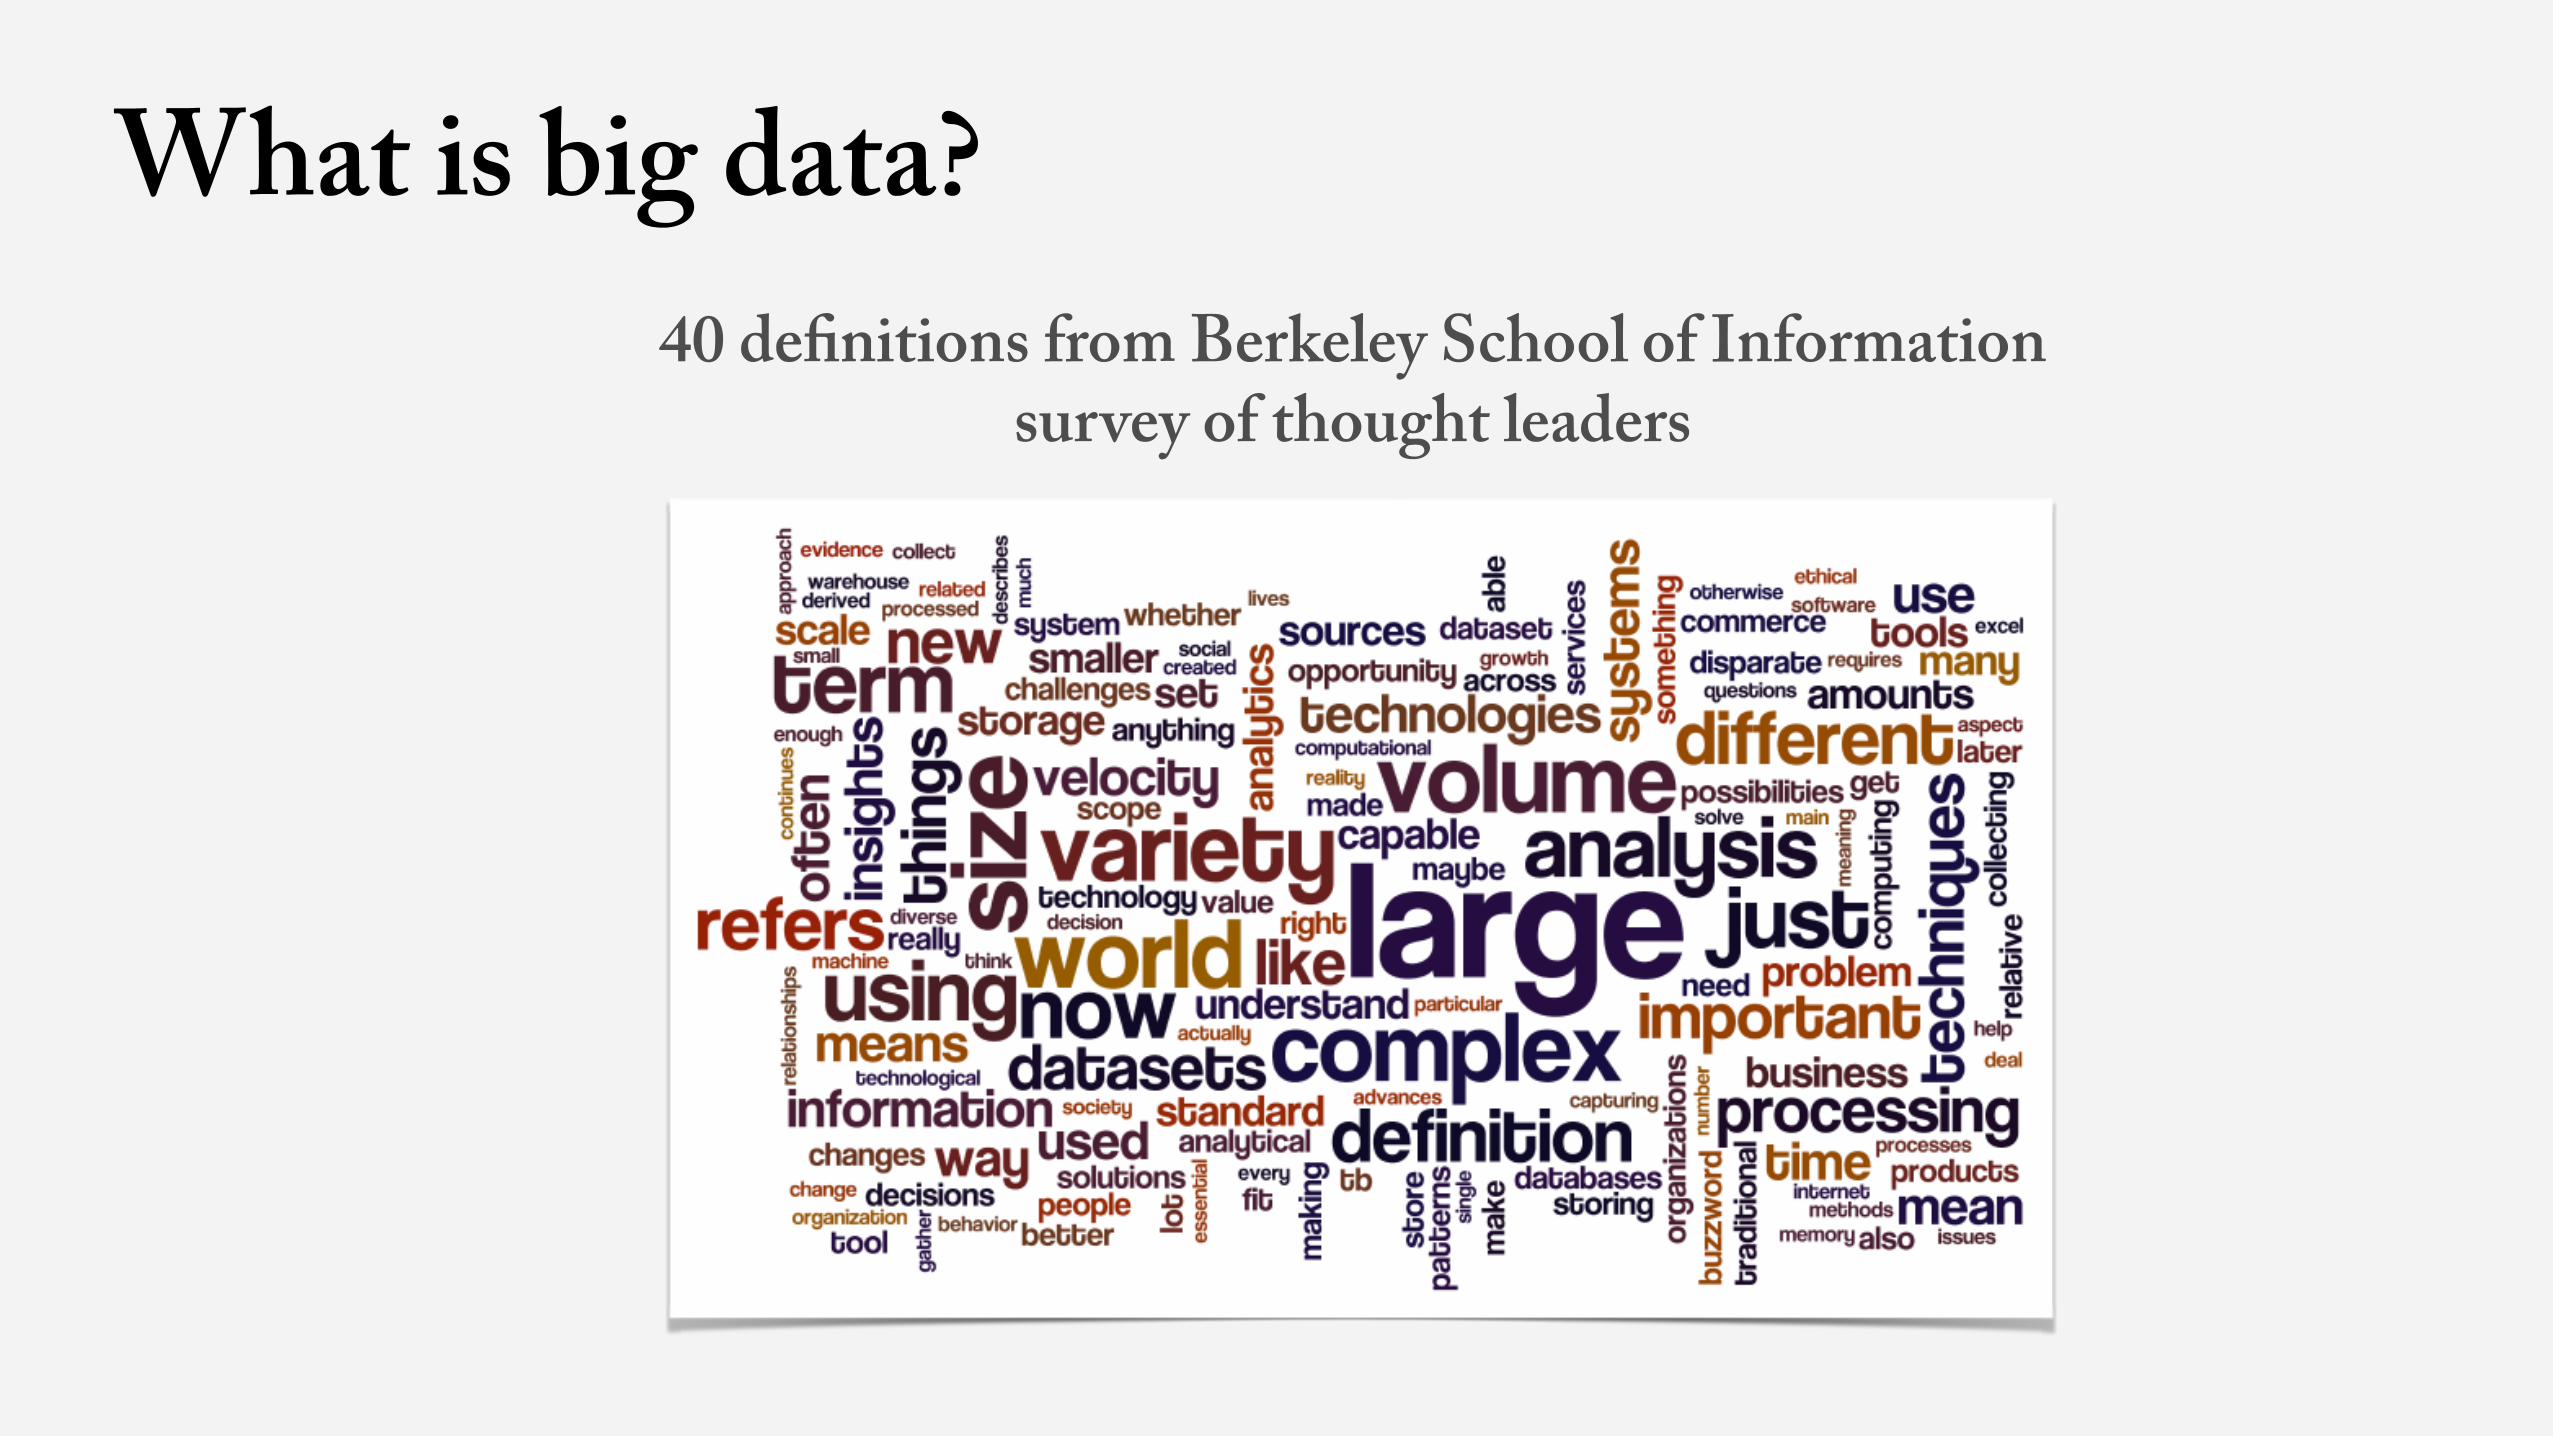
What is big data?
volume variety velocity
Gartner’s 3-Vs
40 definitions from Berkeley School of Information survey of thought leaders

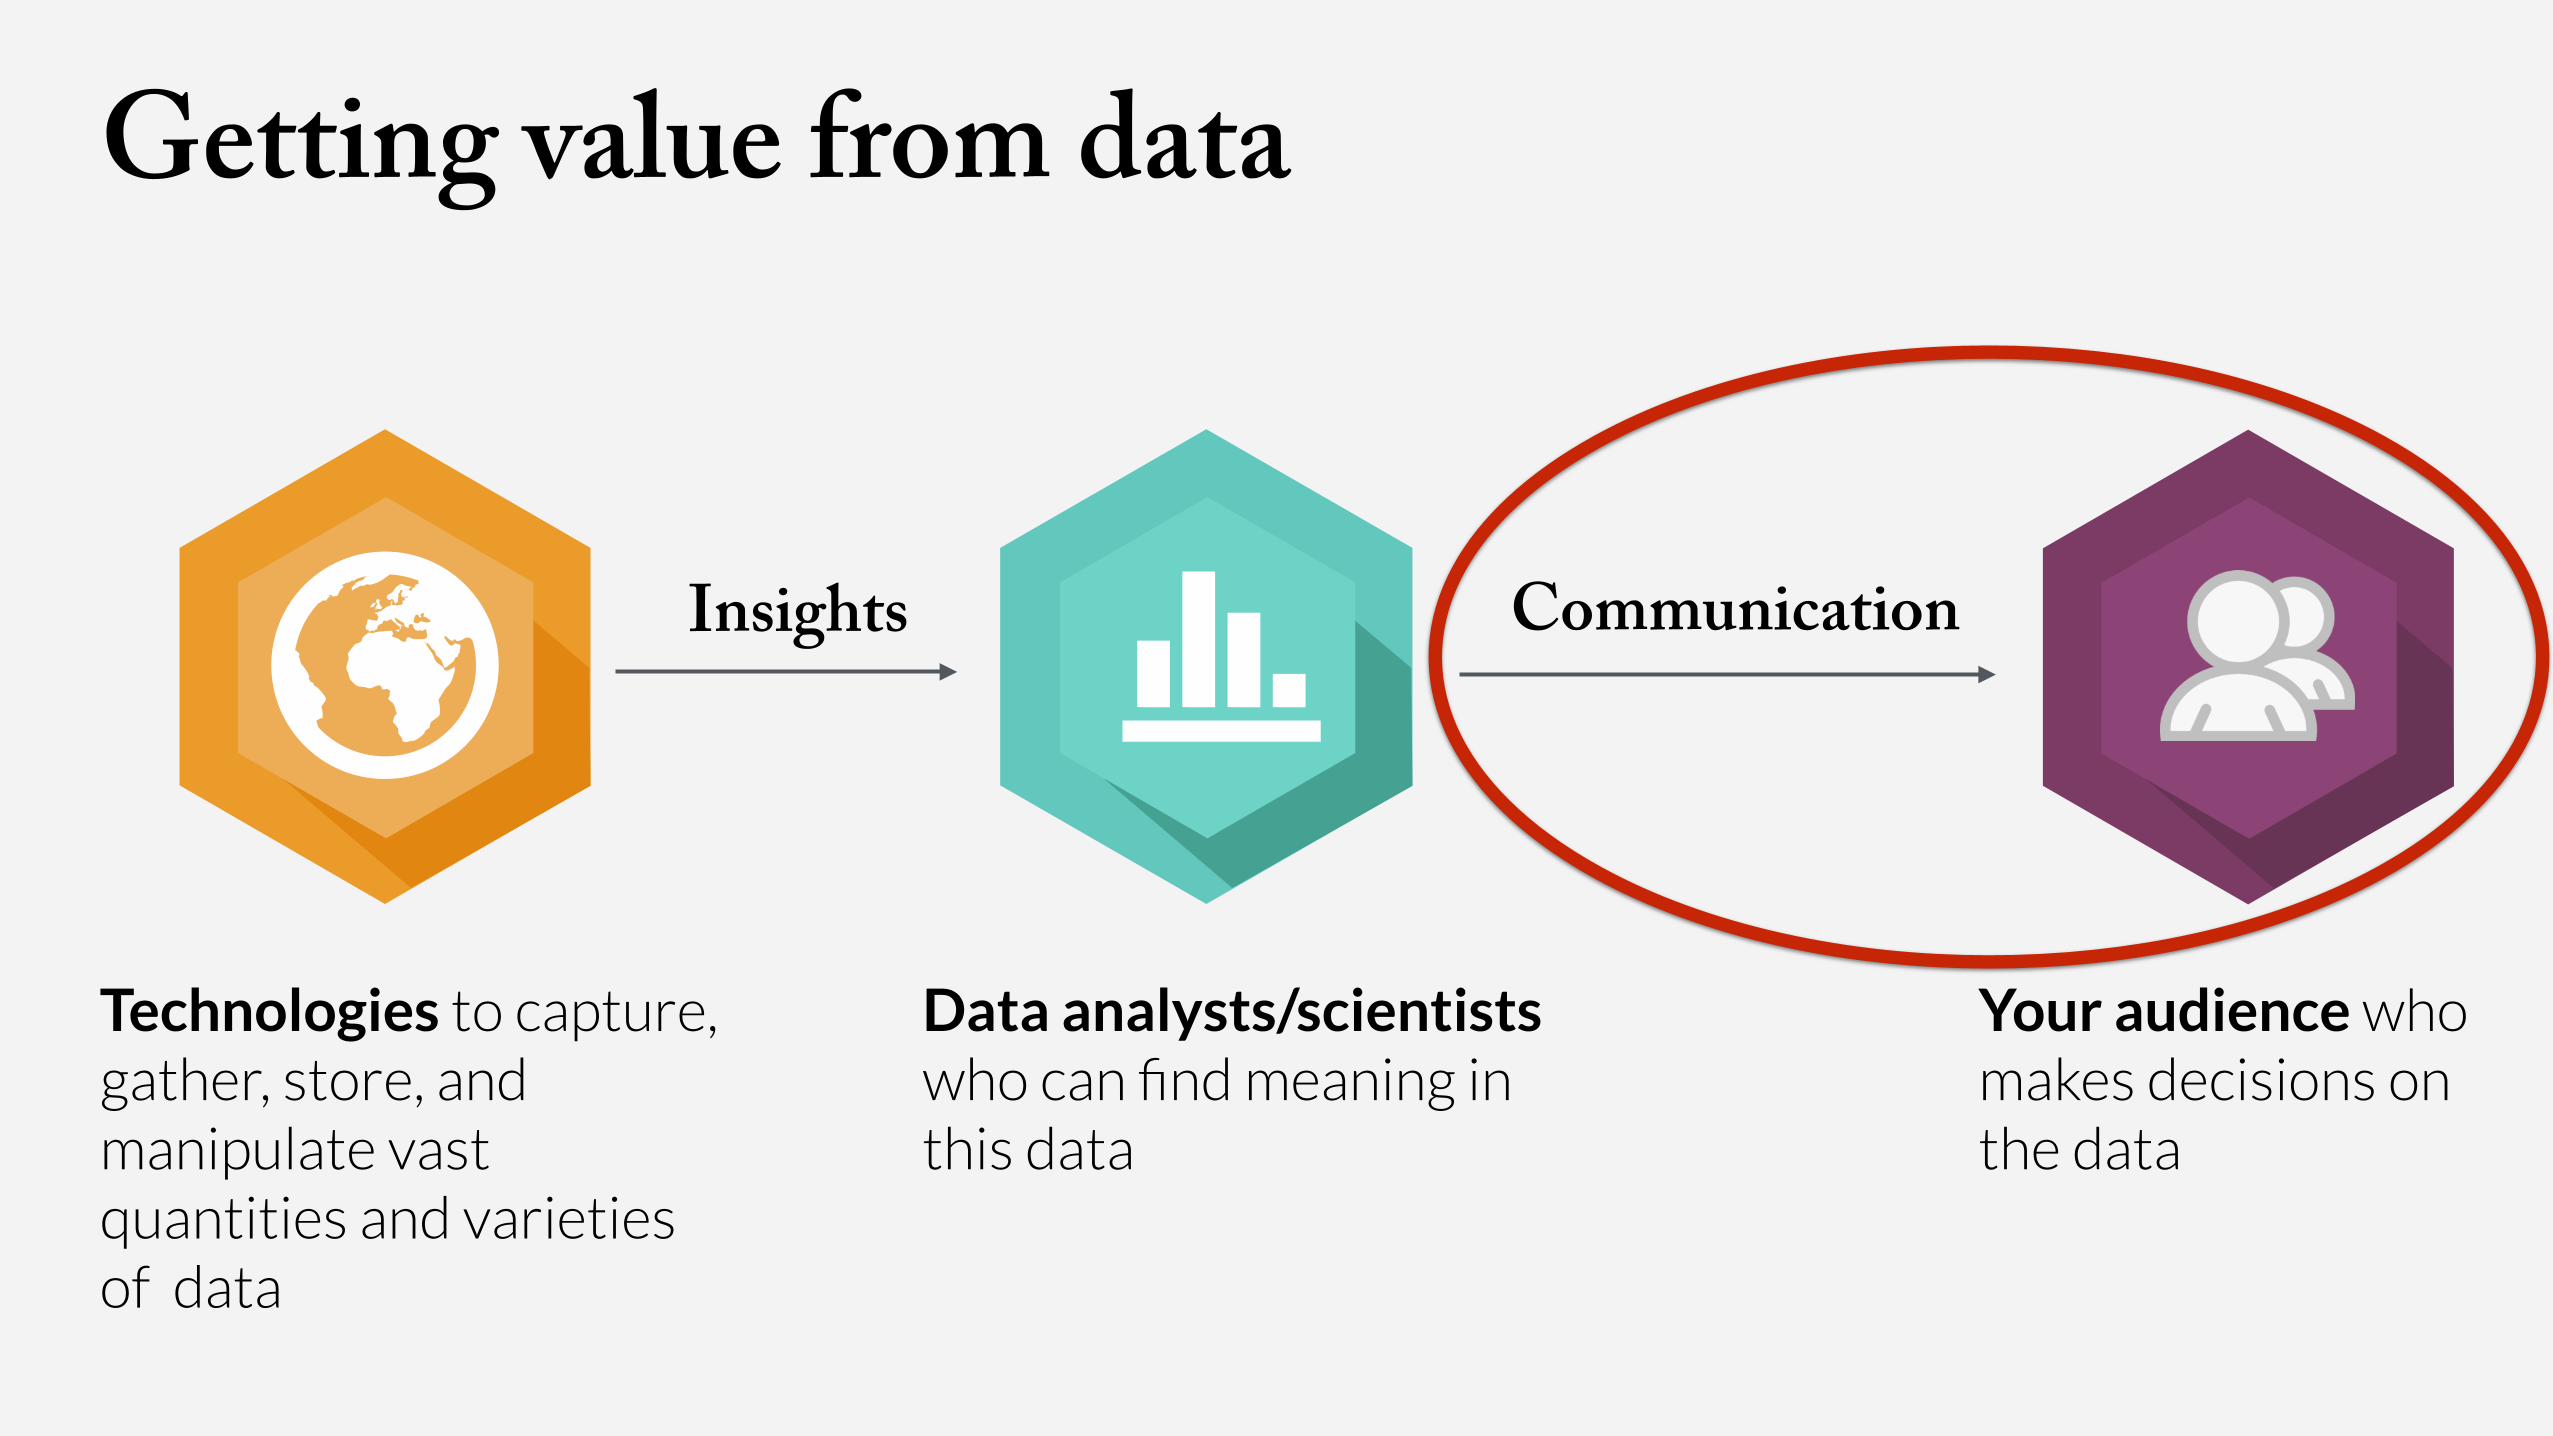
Technologies to capture, gather, store, and manipulate vast quantities and varieties of data
Data analysts/scientists who can find meaning in this data
Insights
Your audience who makes decisions on the data
Communication
Getting value from data
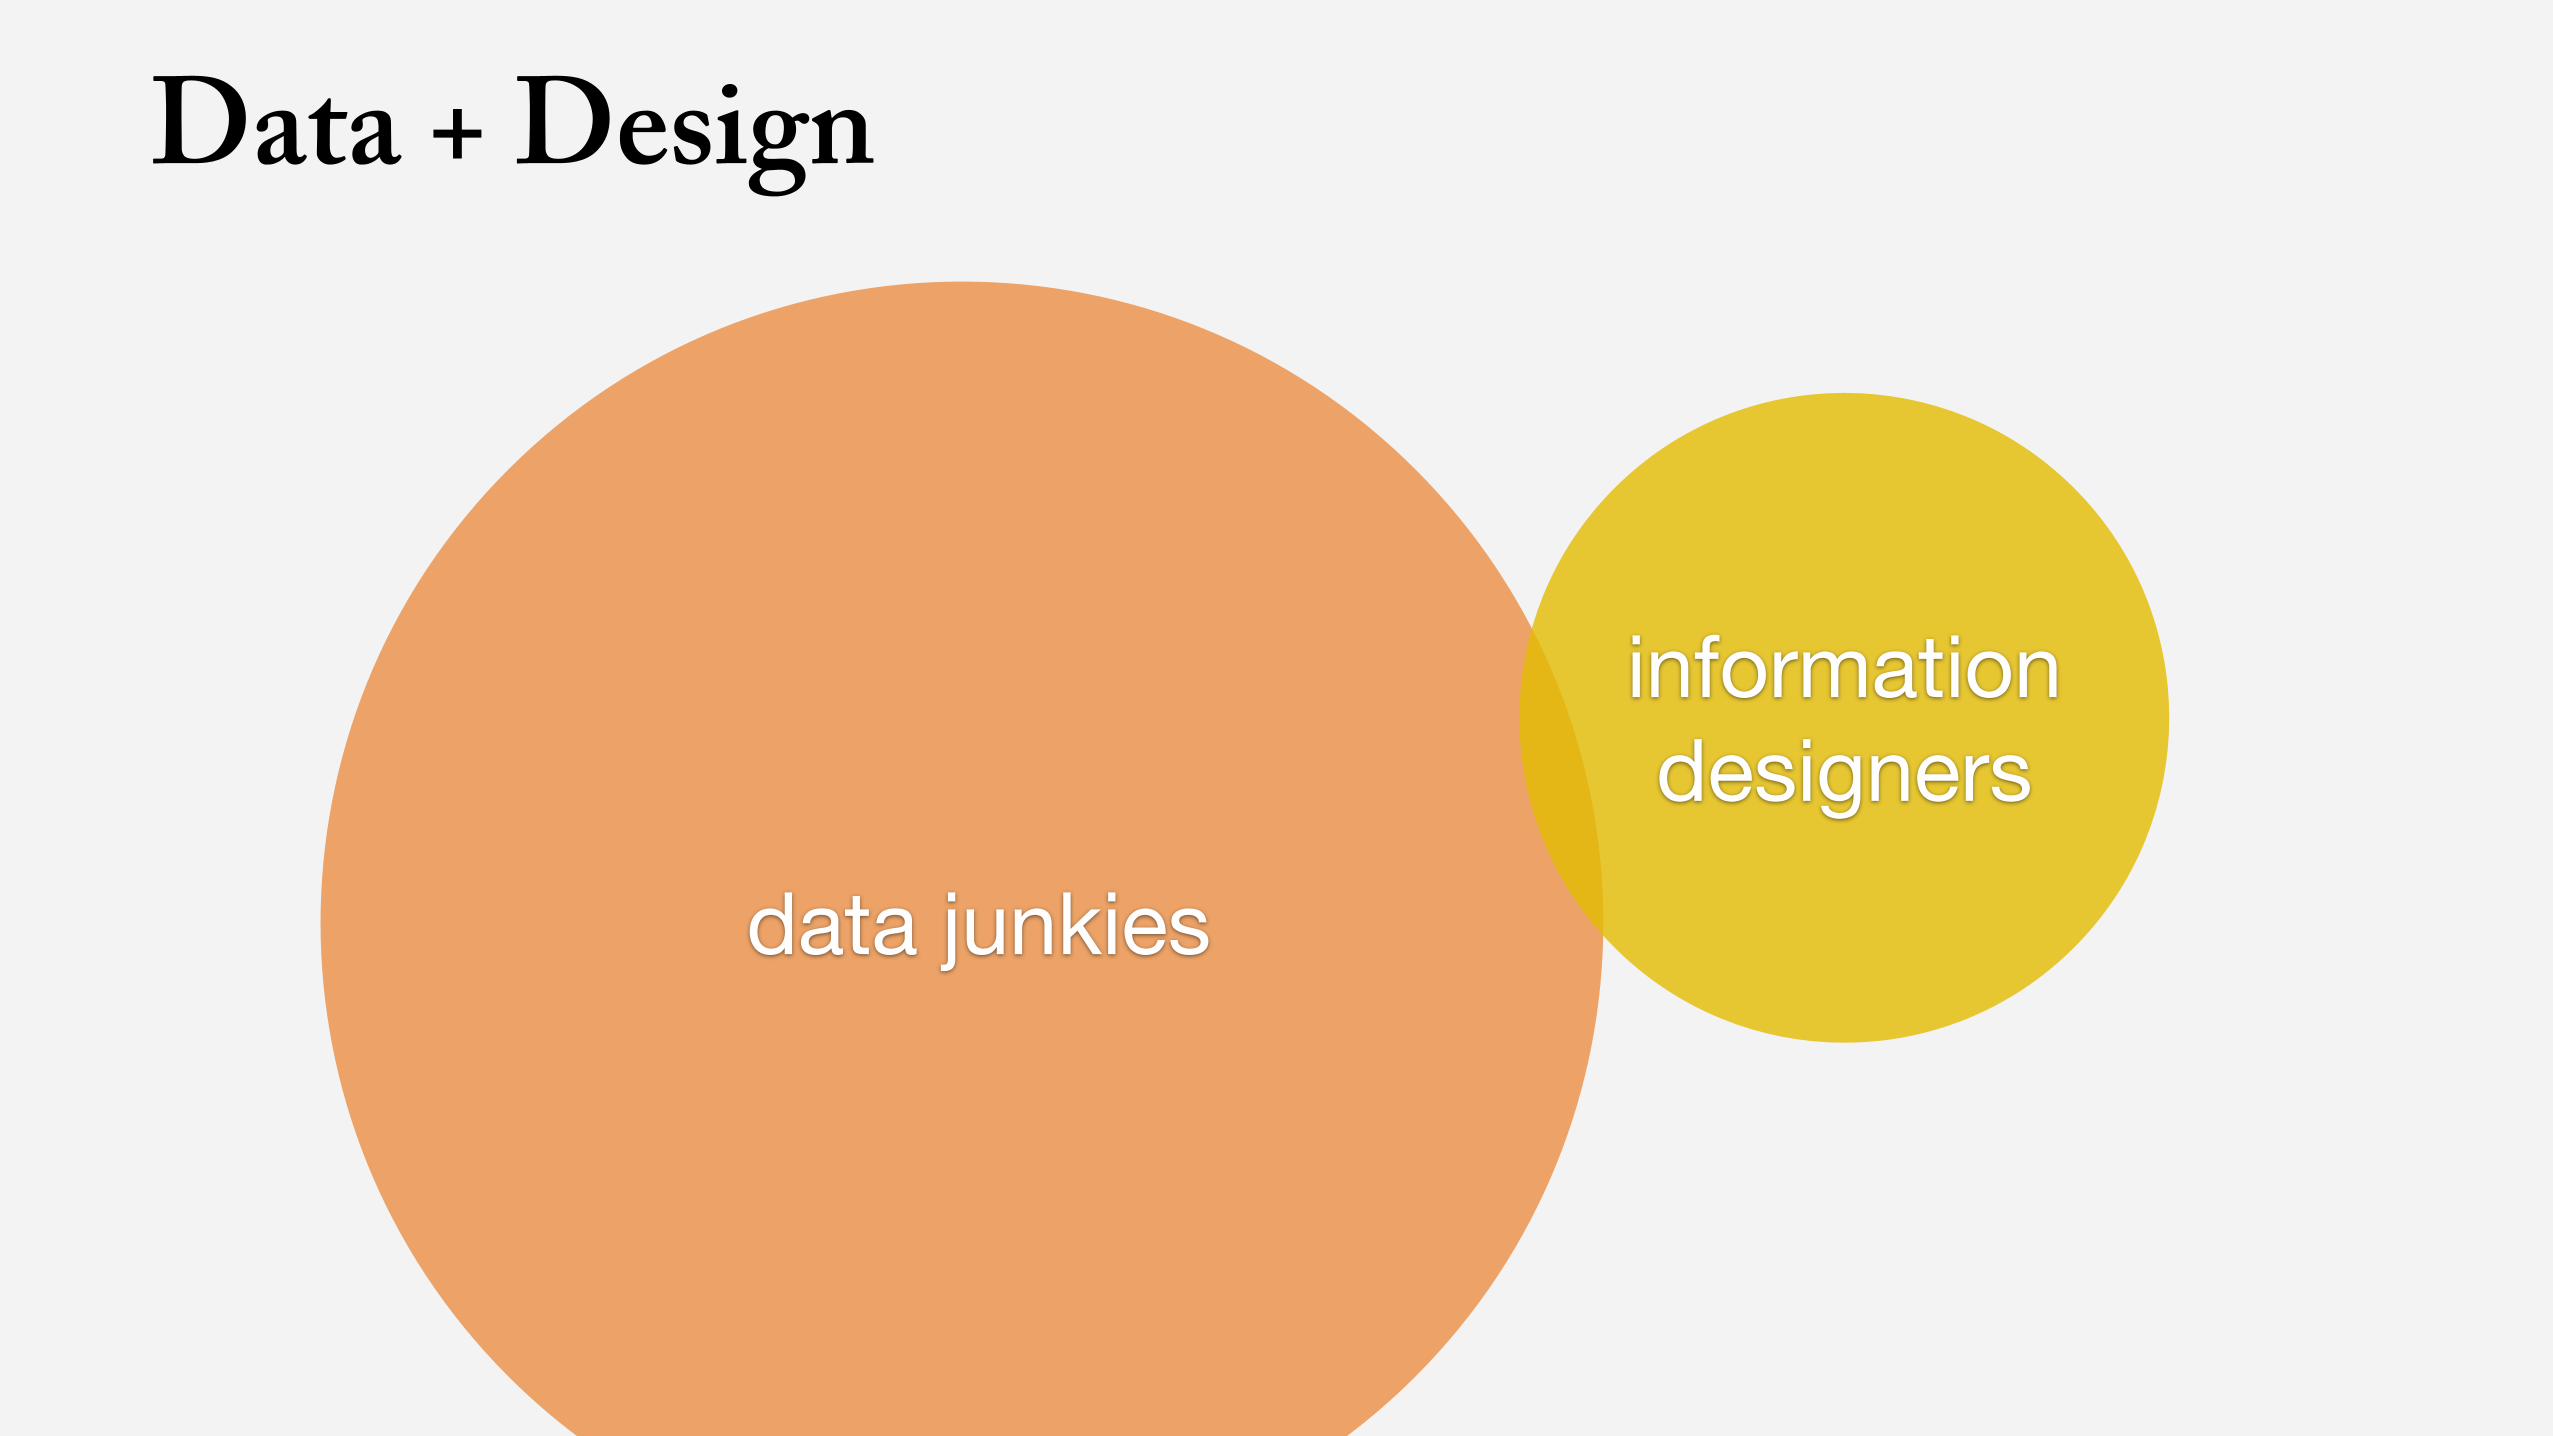
data junkies
information designers
Data + Design
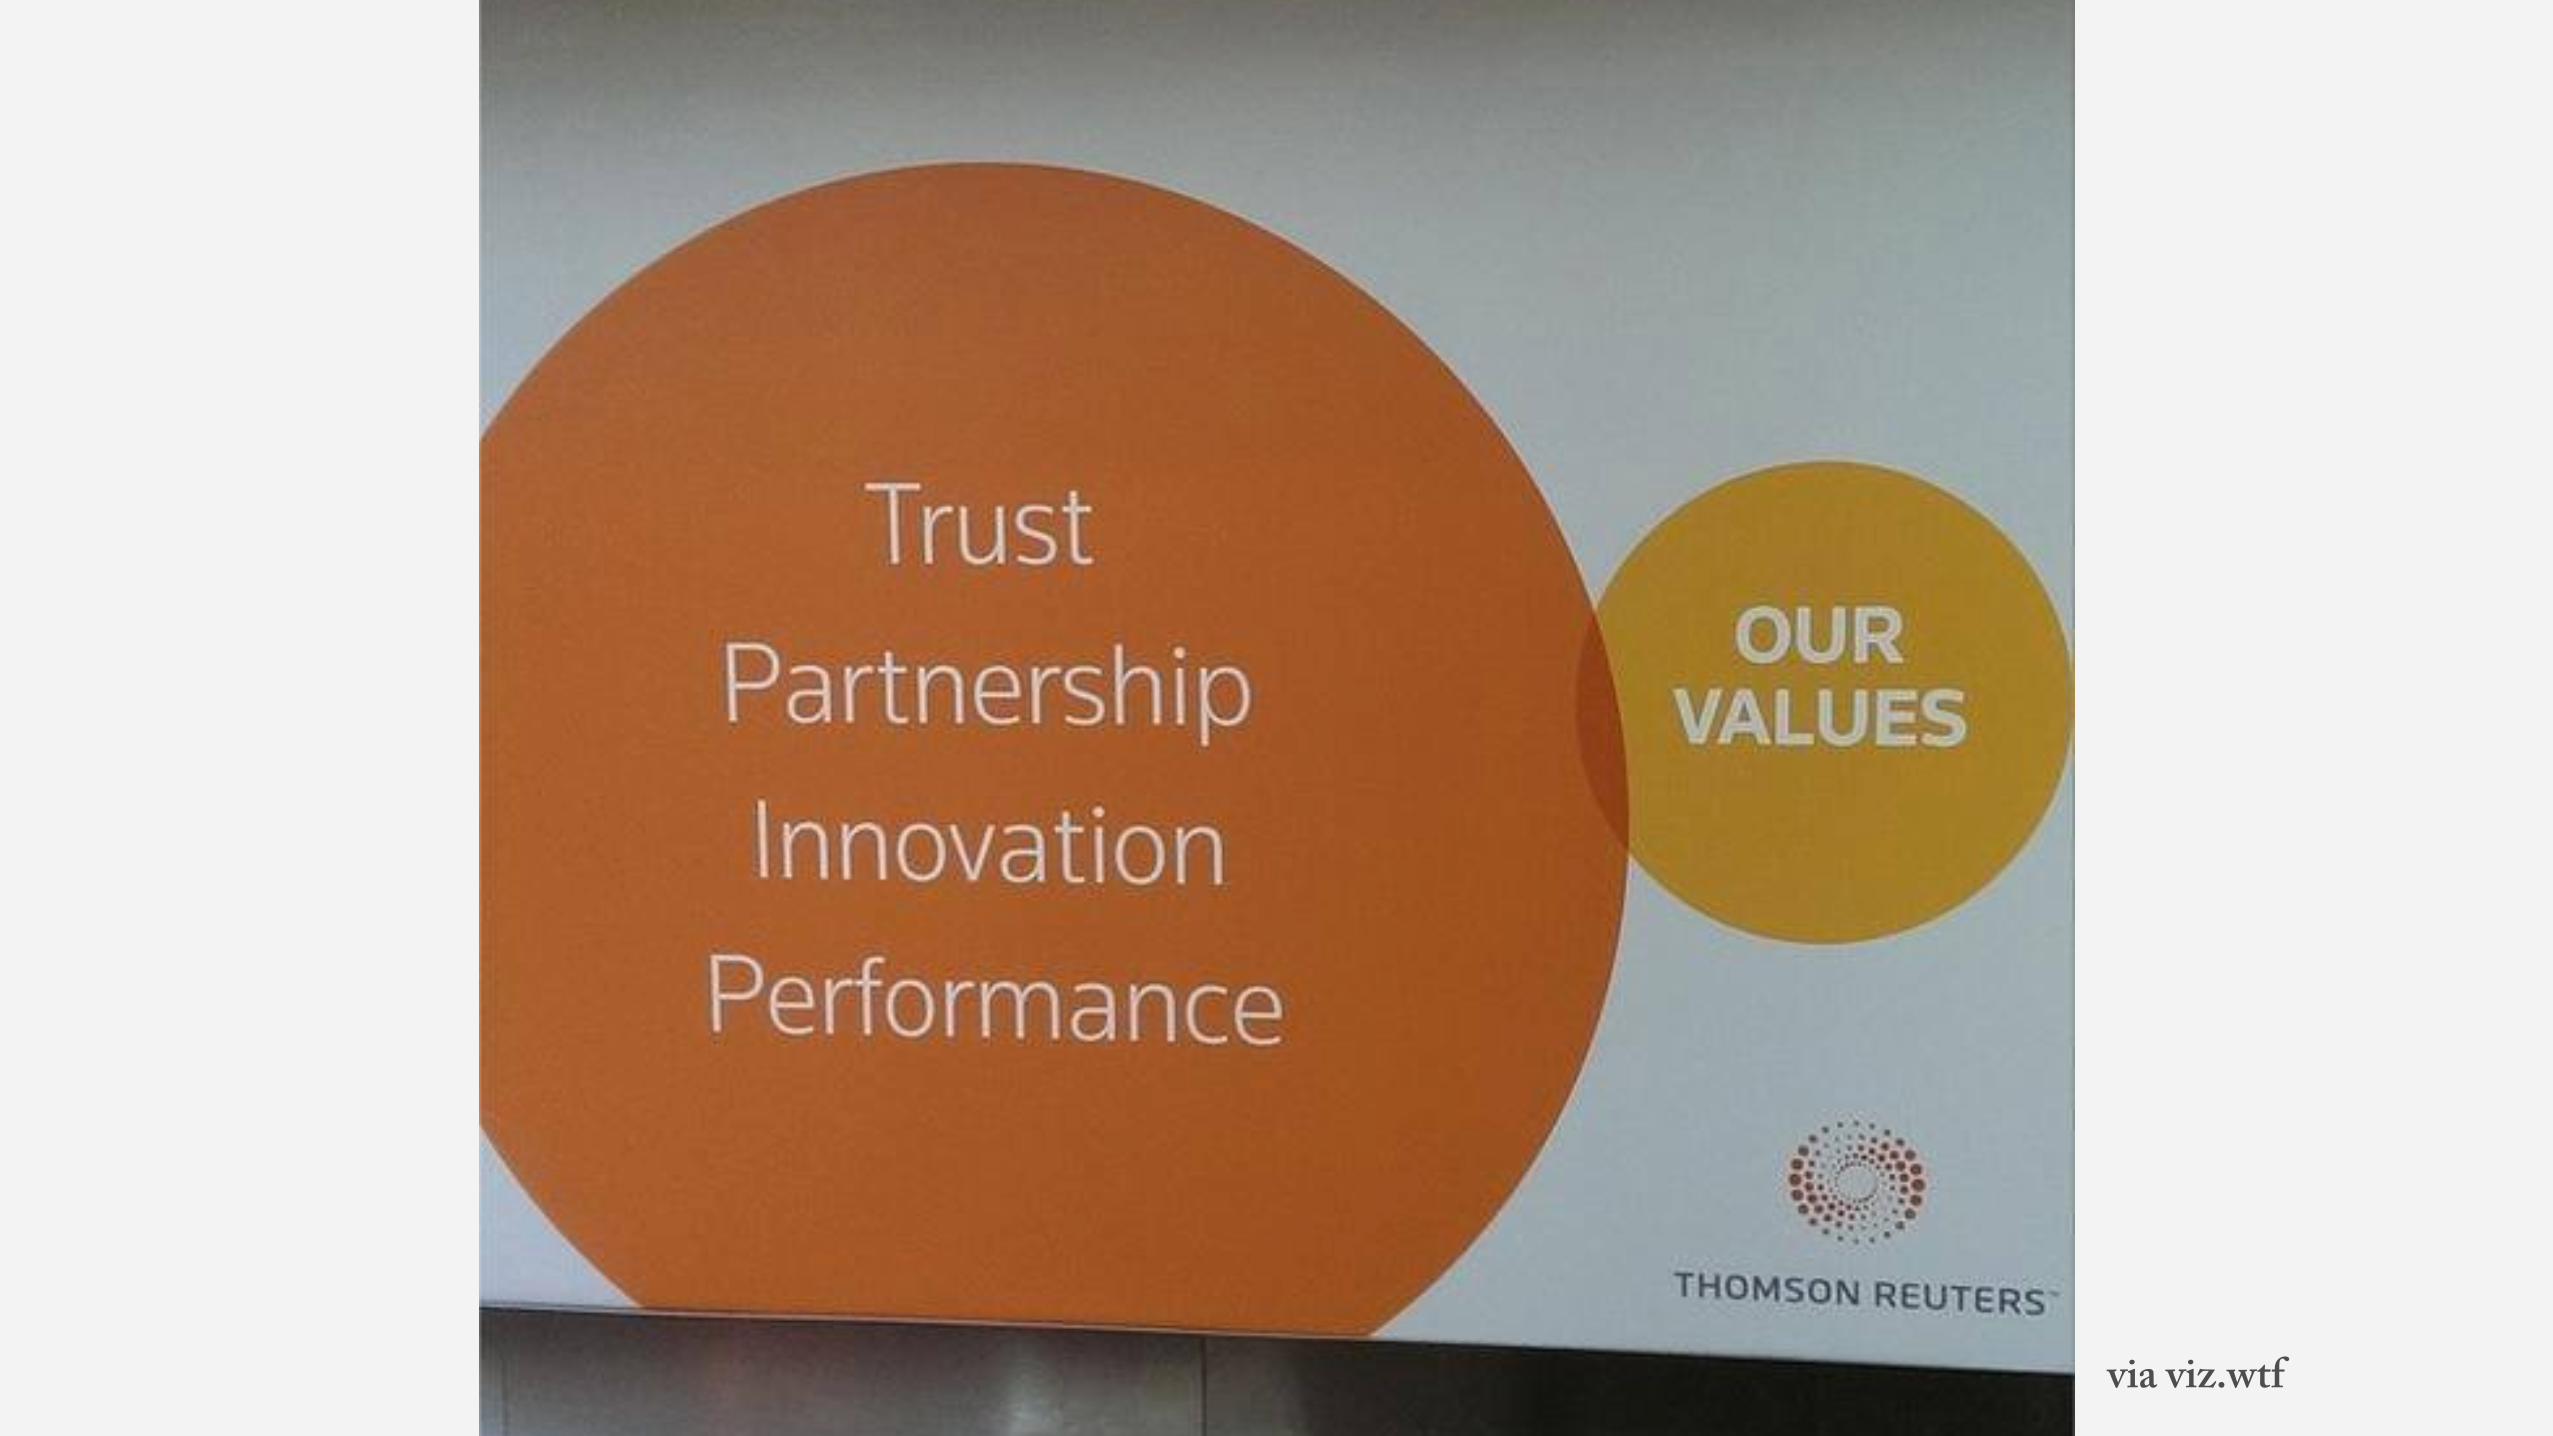
via viz.wtf


“…learn how to double your effectiveness as an analyst"
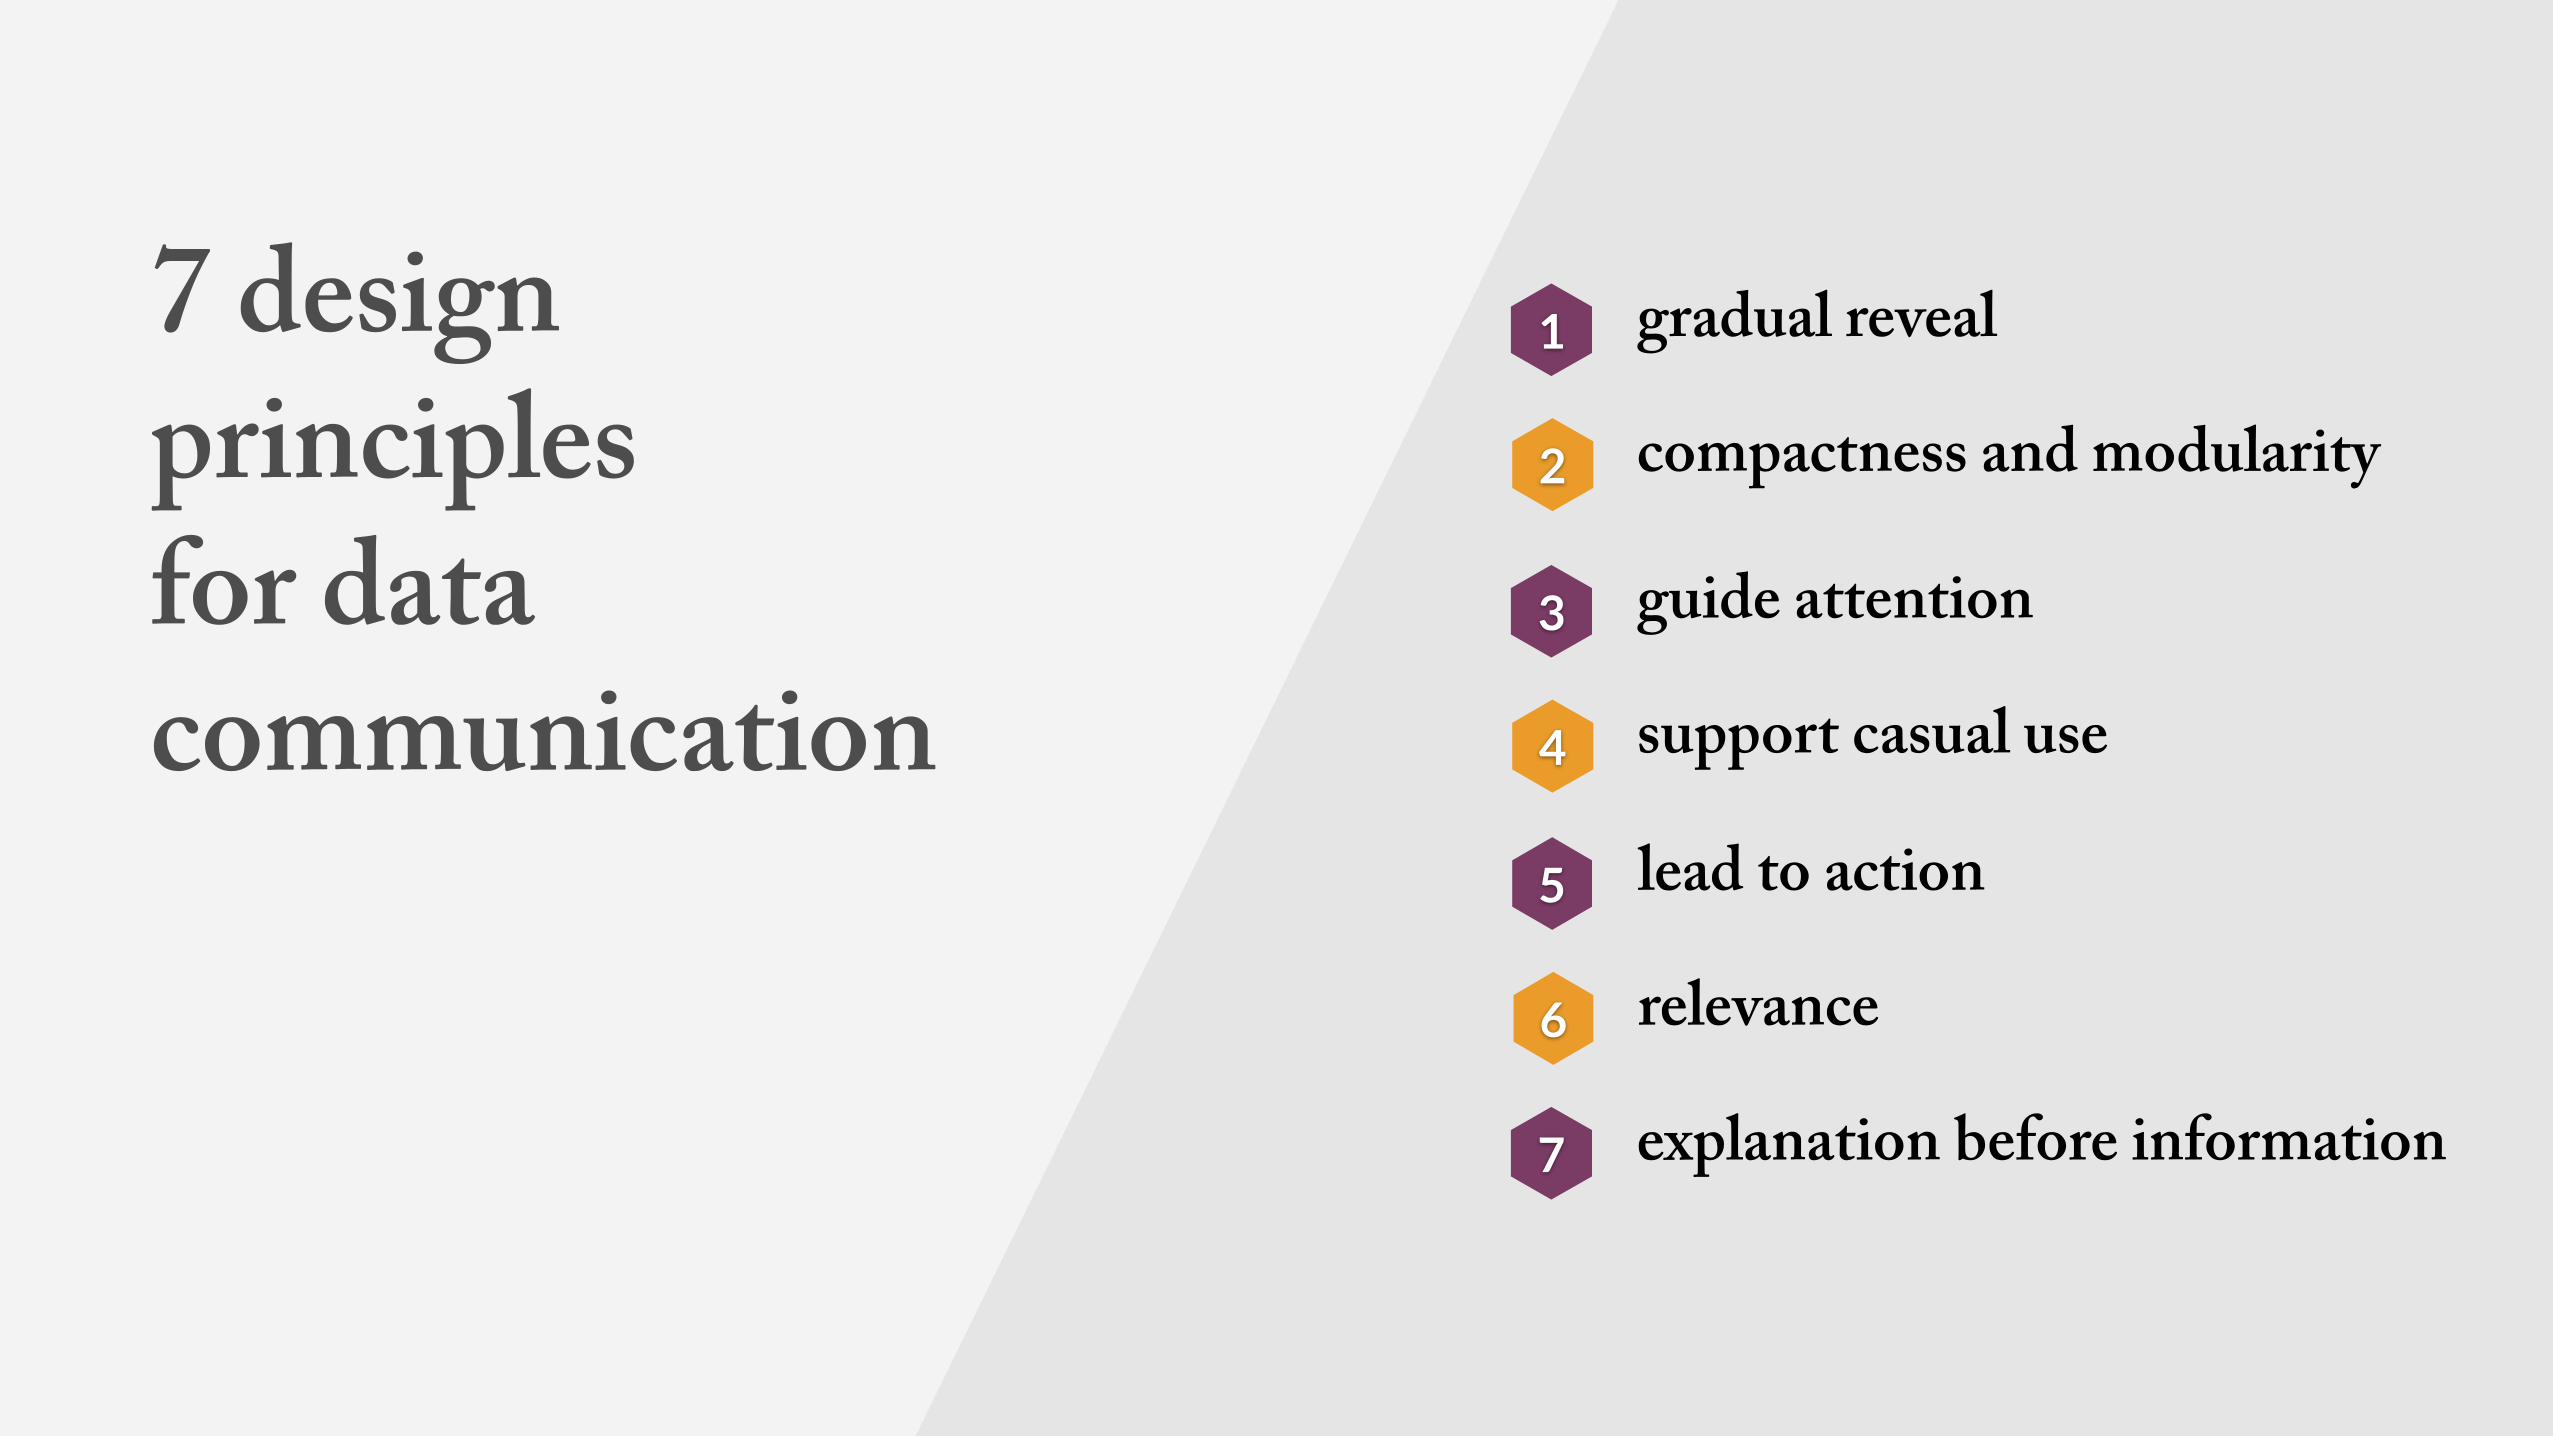
7 design principles for data communication
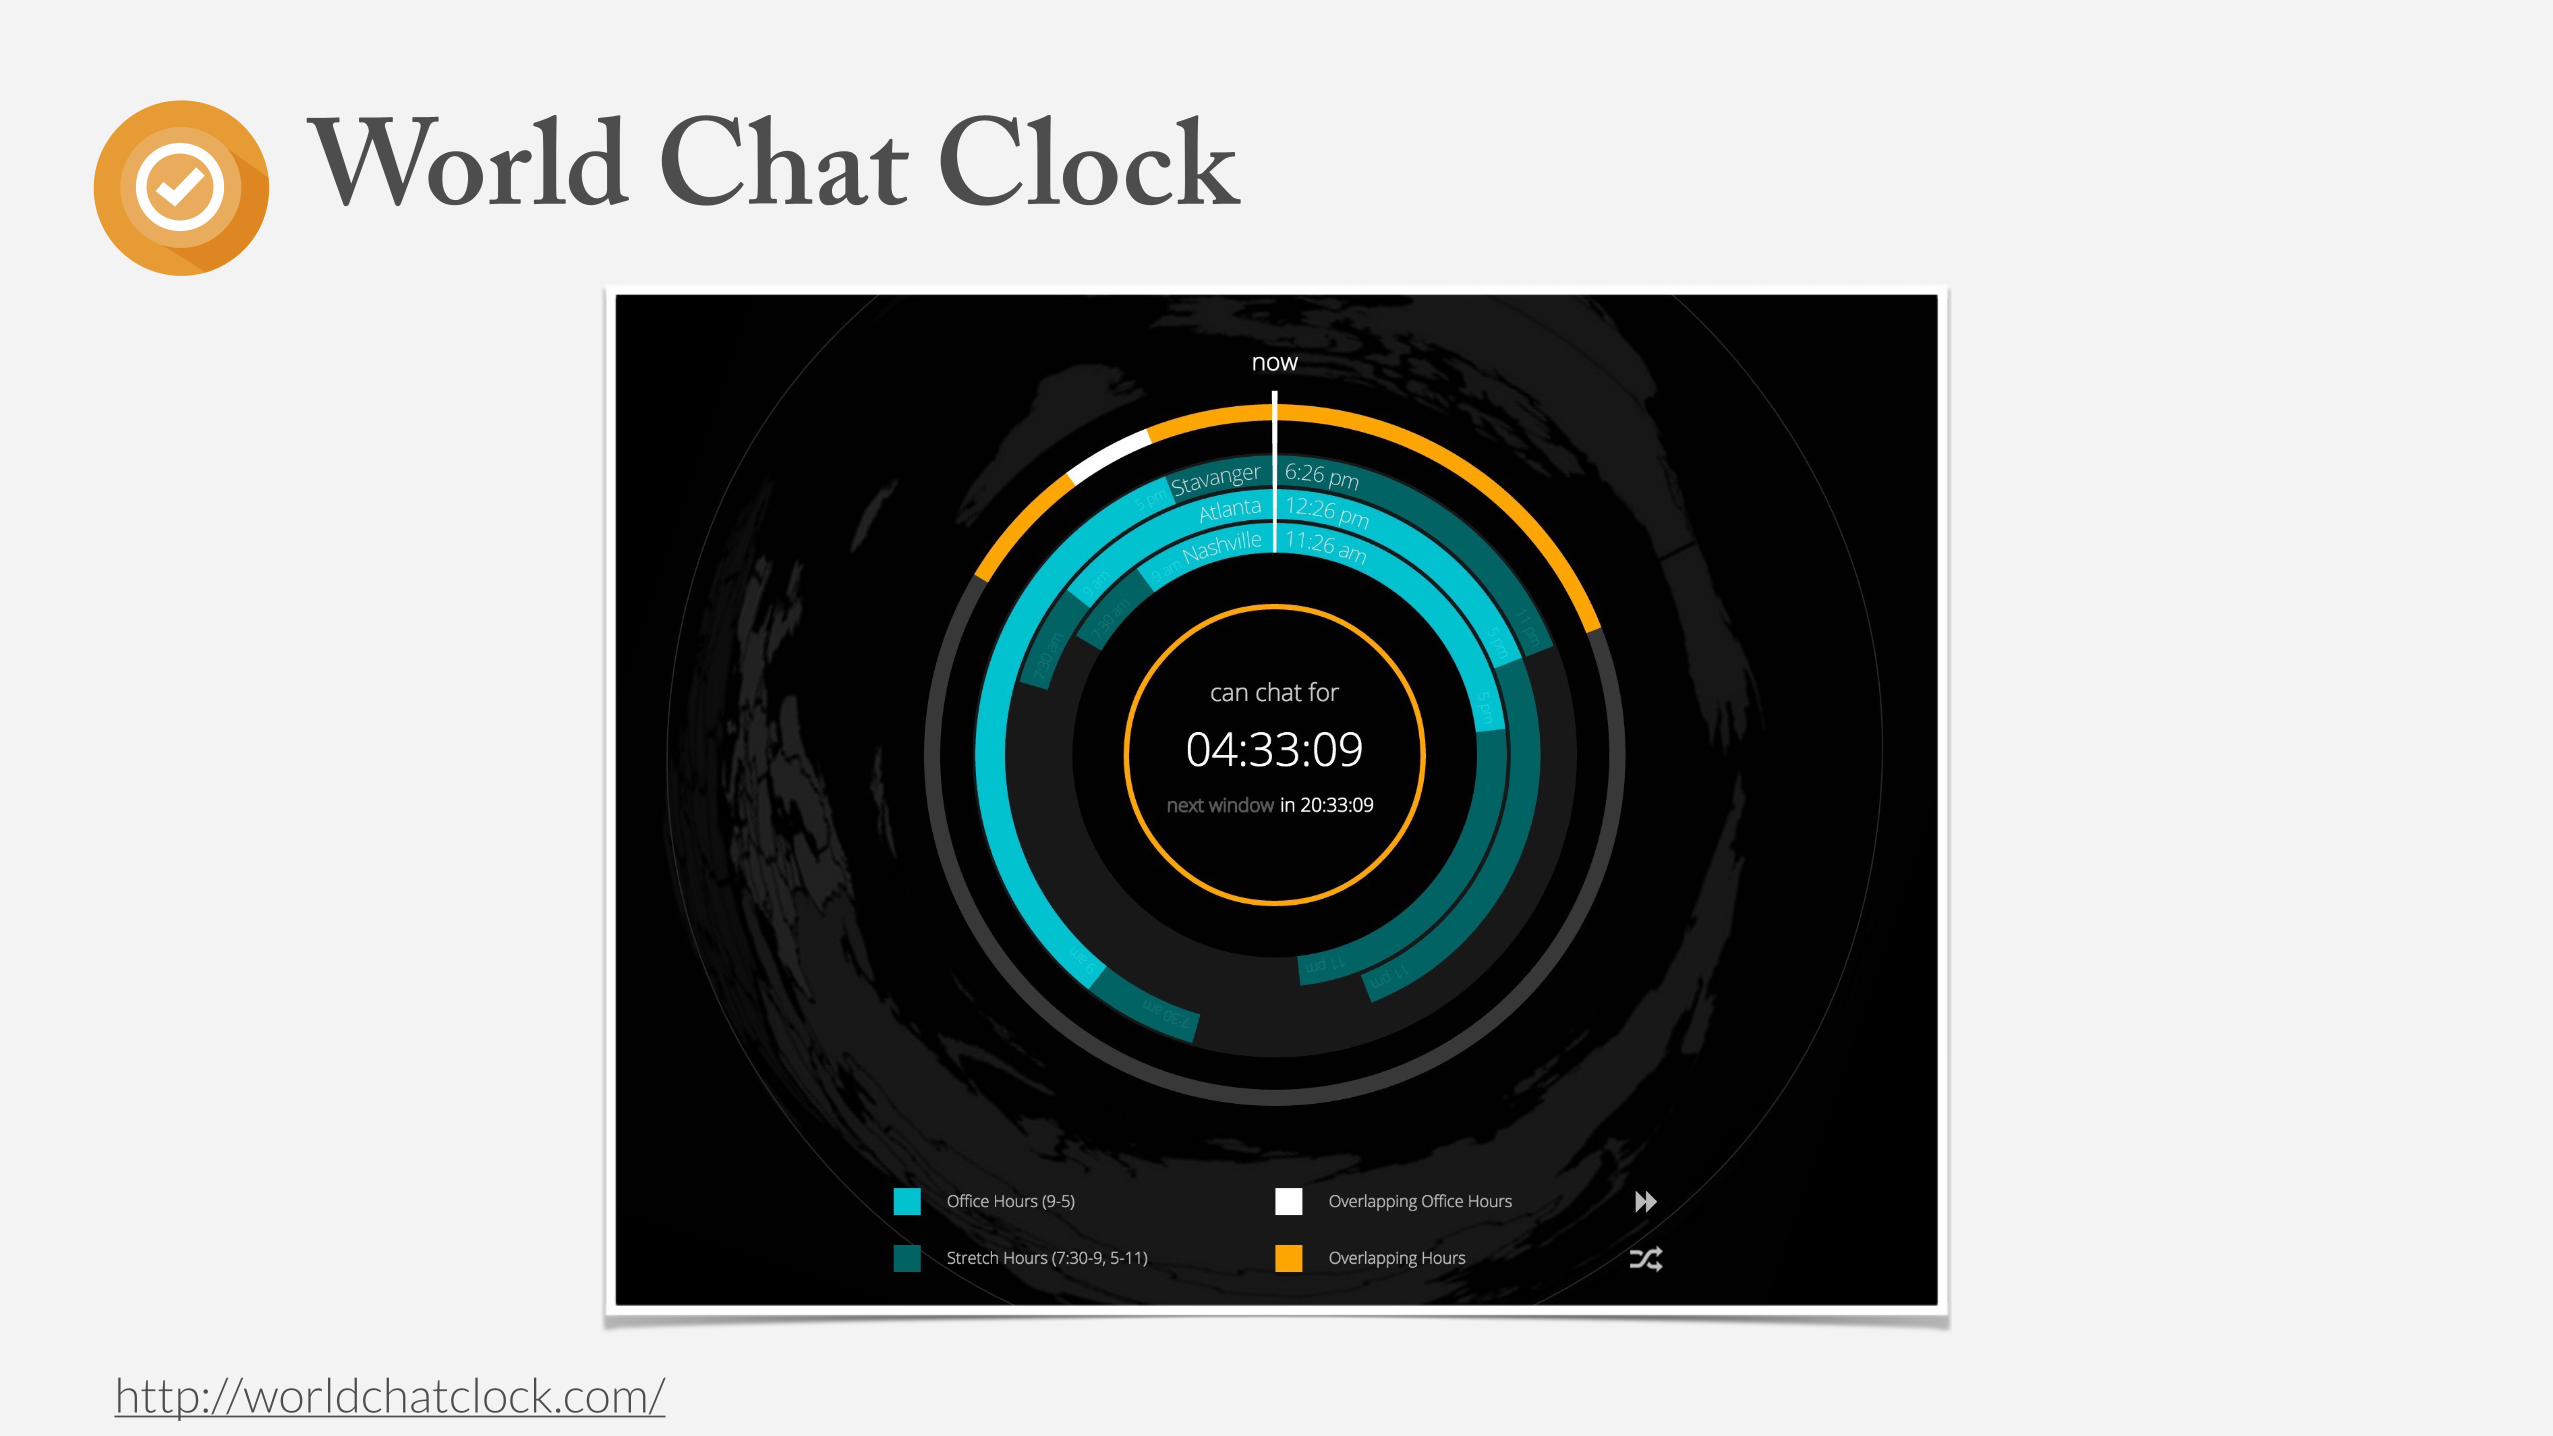
1 gradual reveal
2 compactness and modularity
3 guide attention
4 support casual use
5 lead to action
6 relevance
explanation before information7

Gradual Reveal
Draw the audience in
Reveal information as the user expresses interest
Build understanding piece by piece
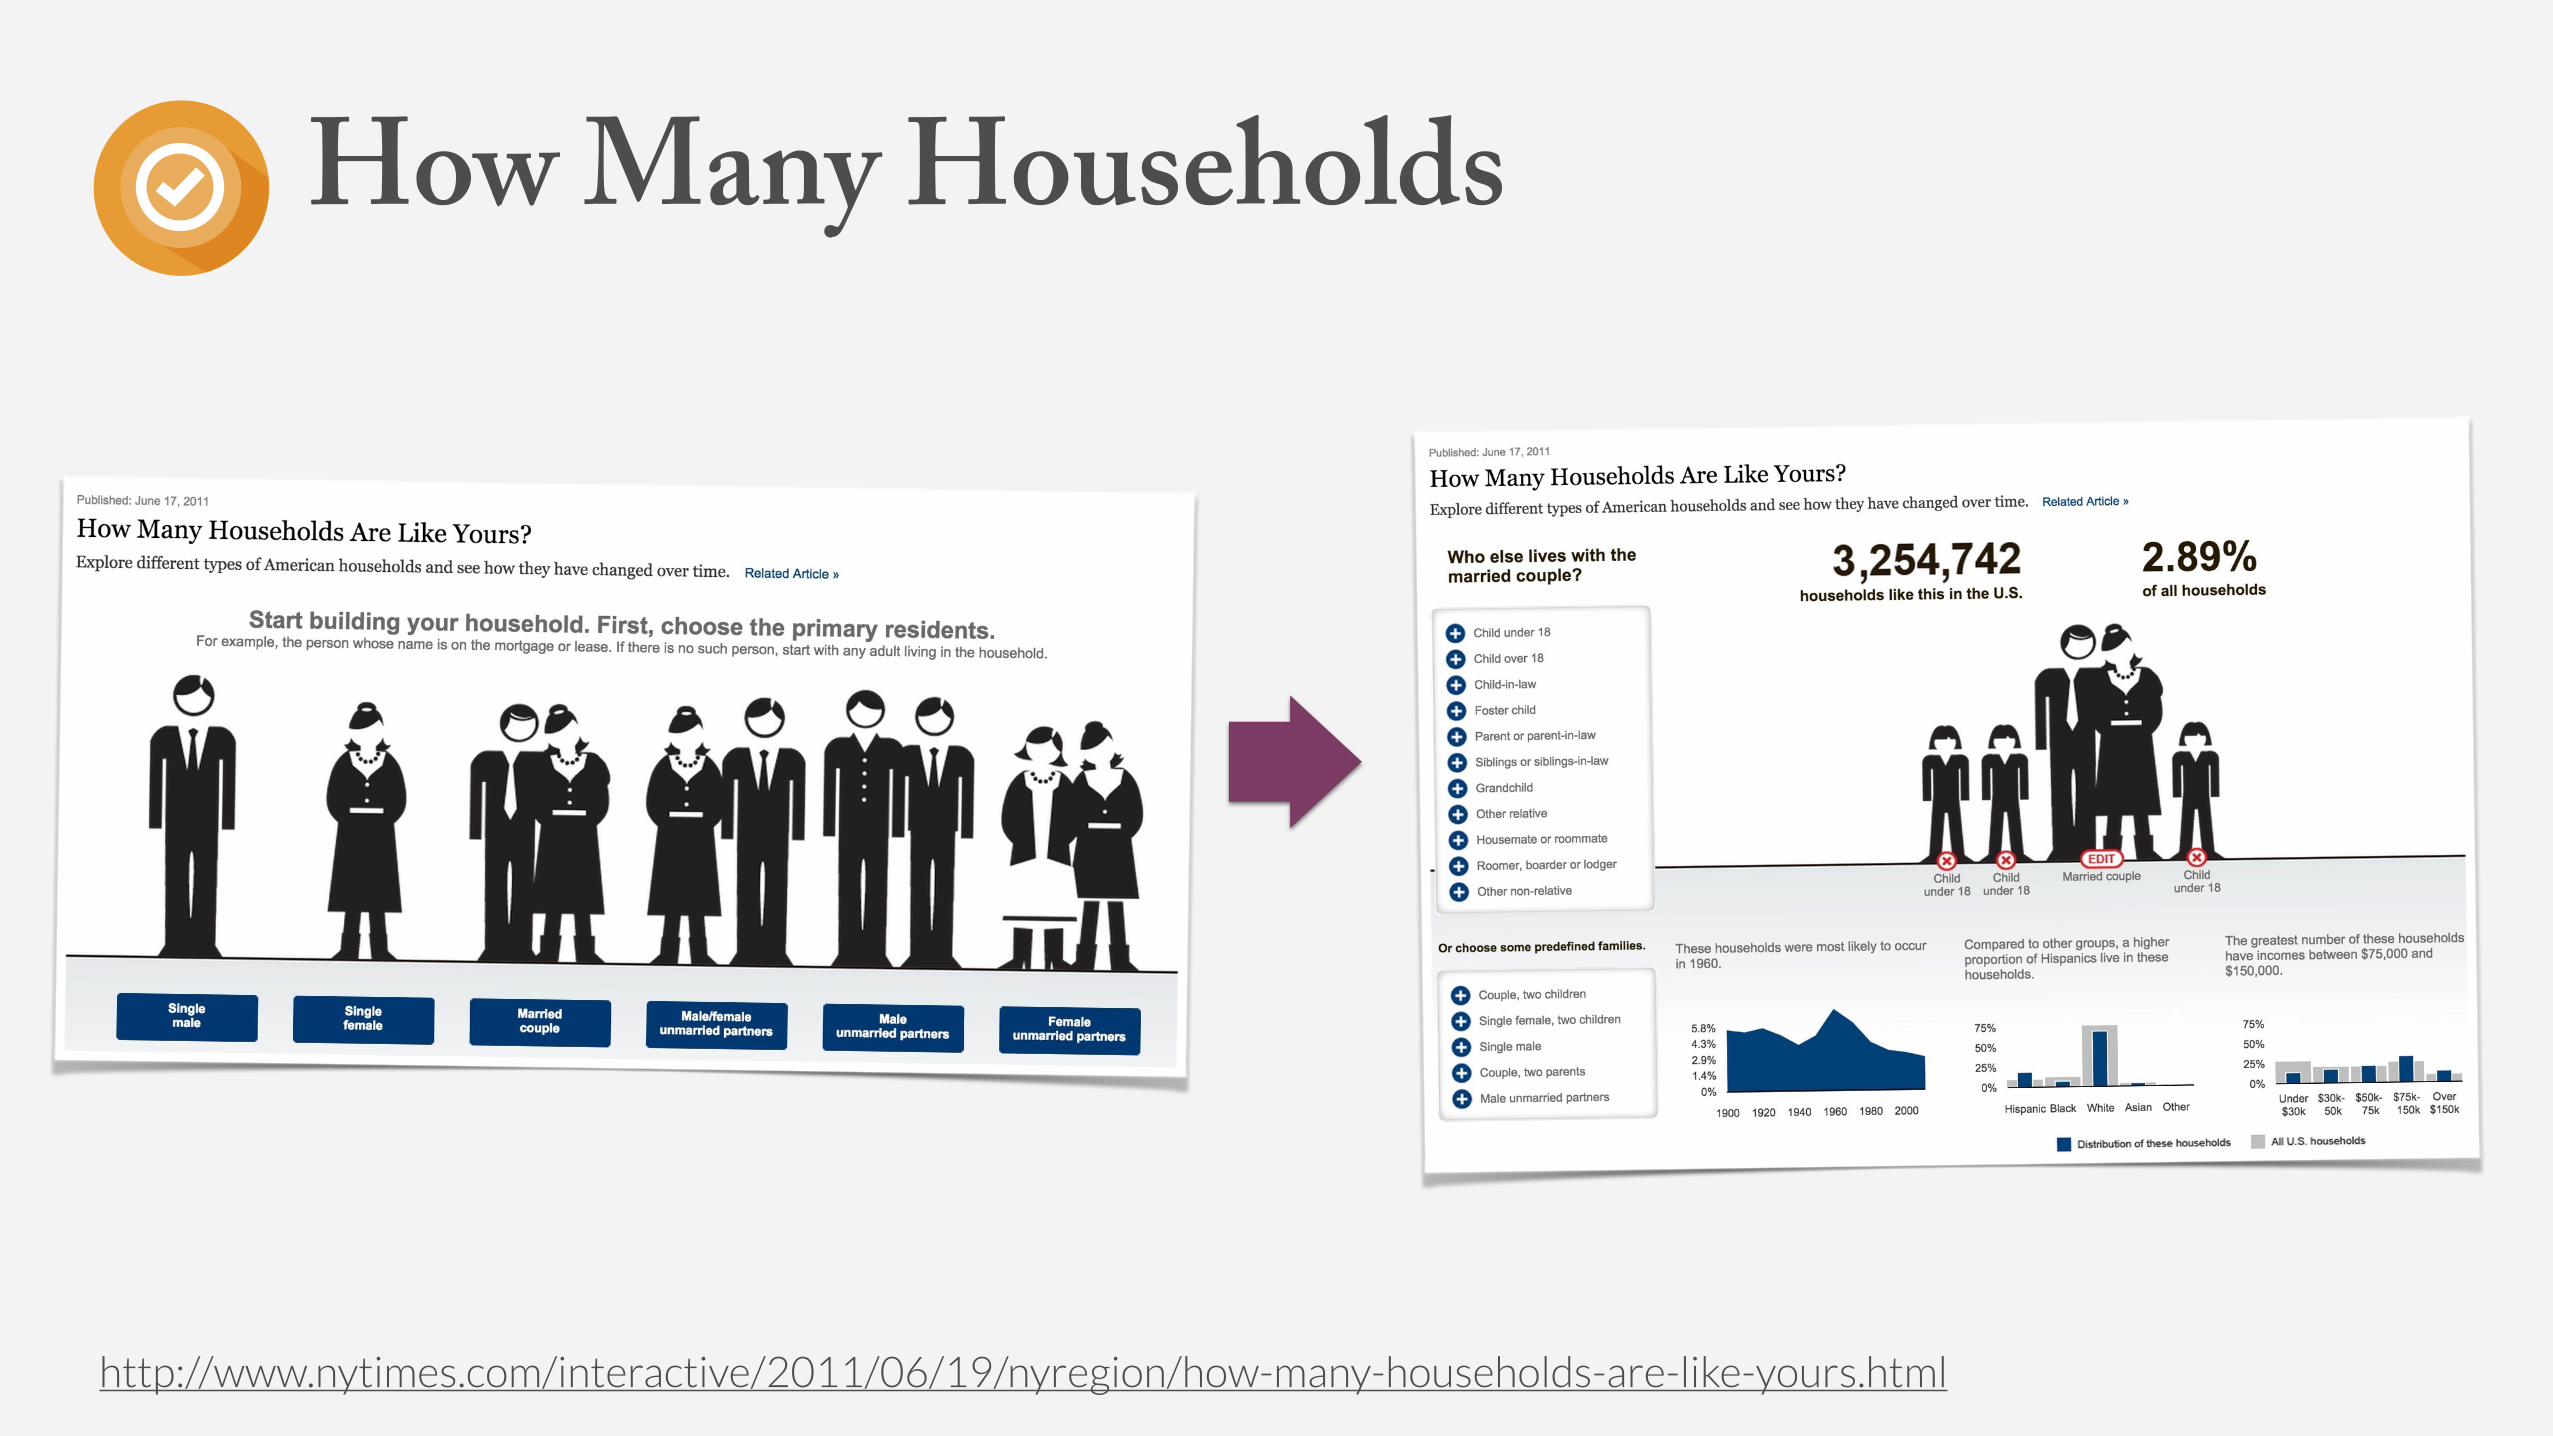
How Many Households
http://www.nytimes.com/interactive/2011/06/19/nyregion/how-many-households-are-like-yours.html
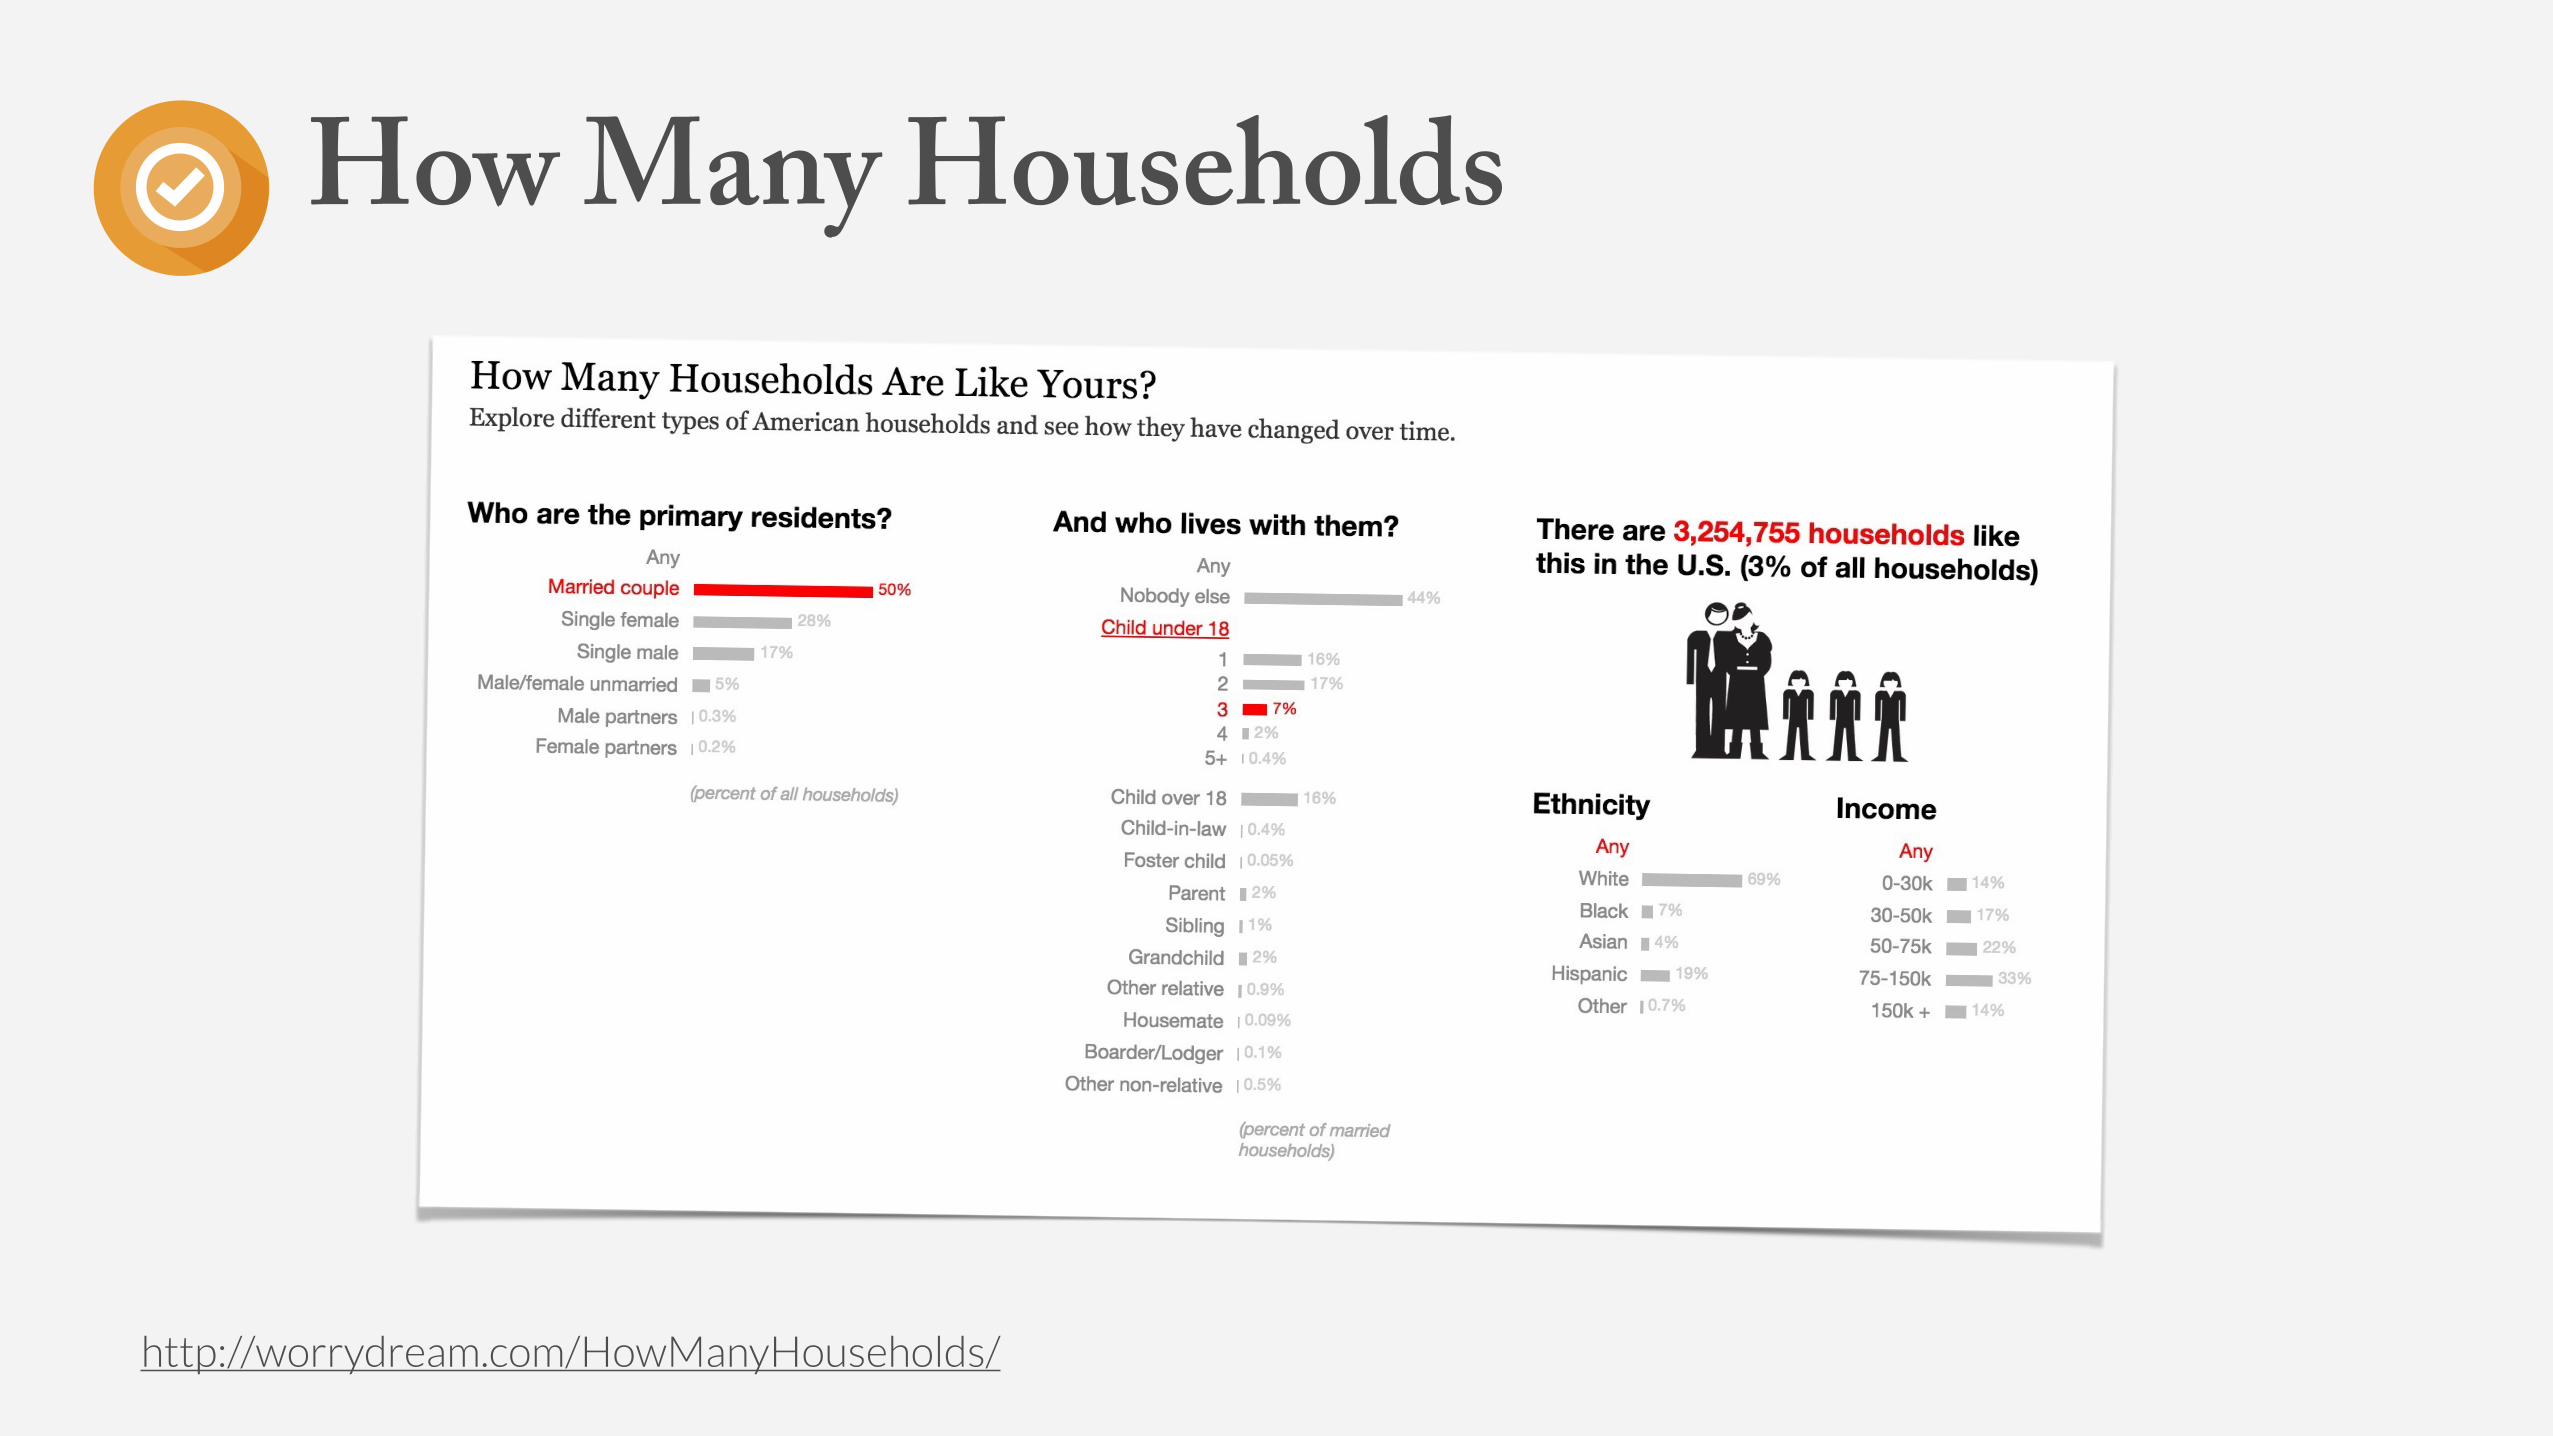
How Many Households
http://worrydream.com/HowManyHouseholds/
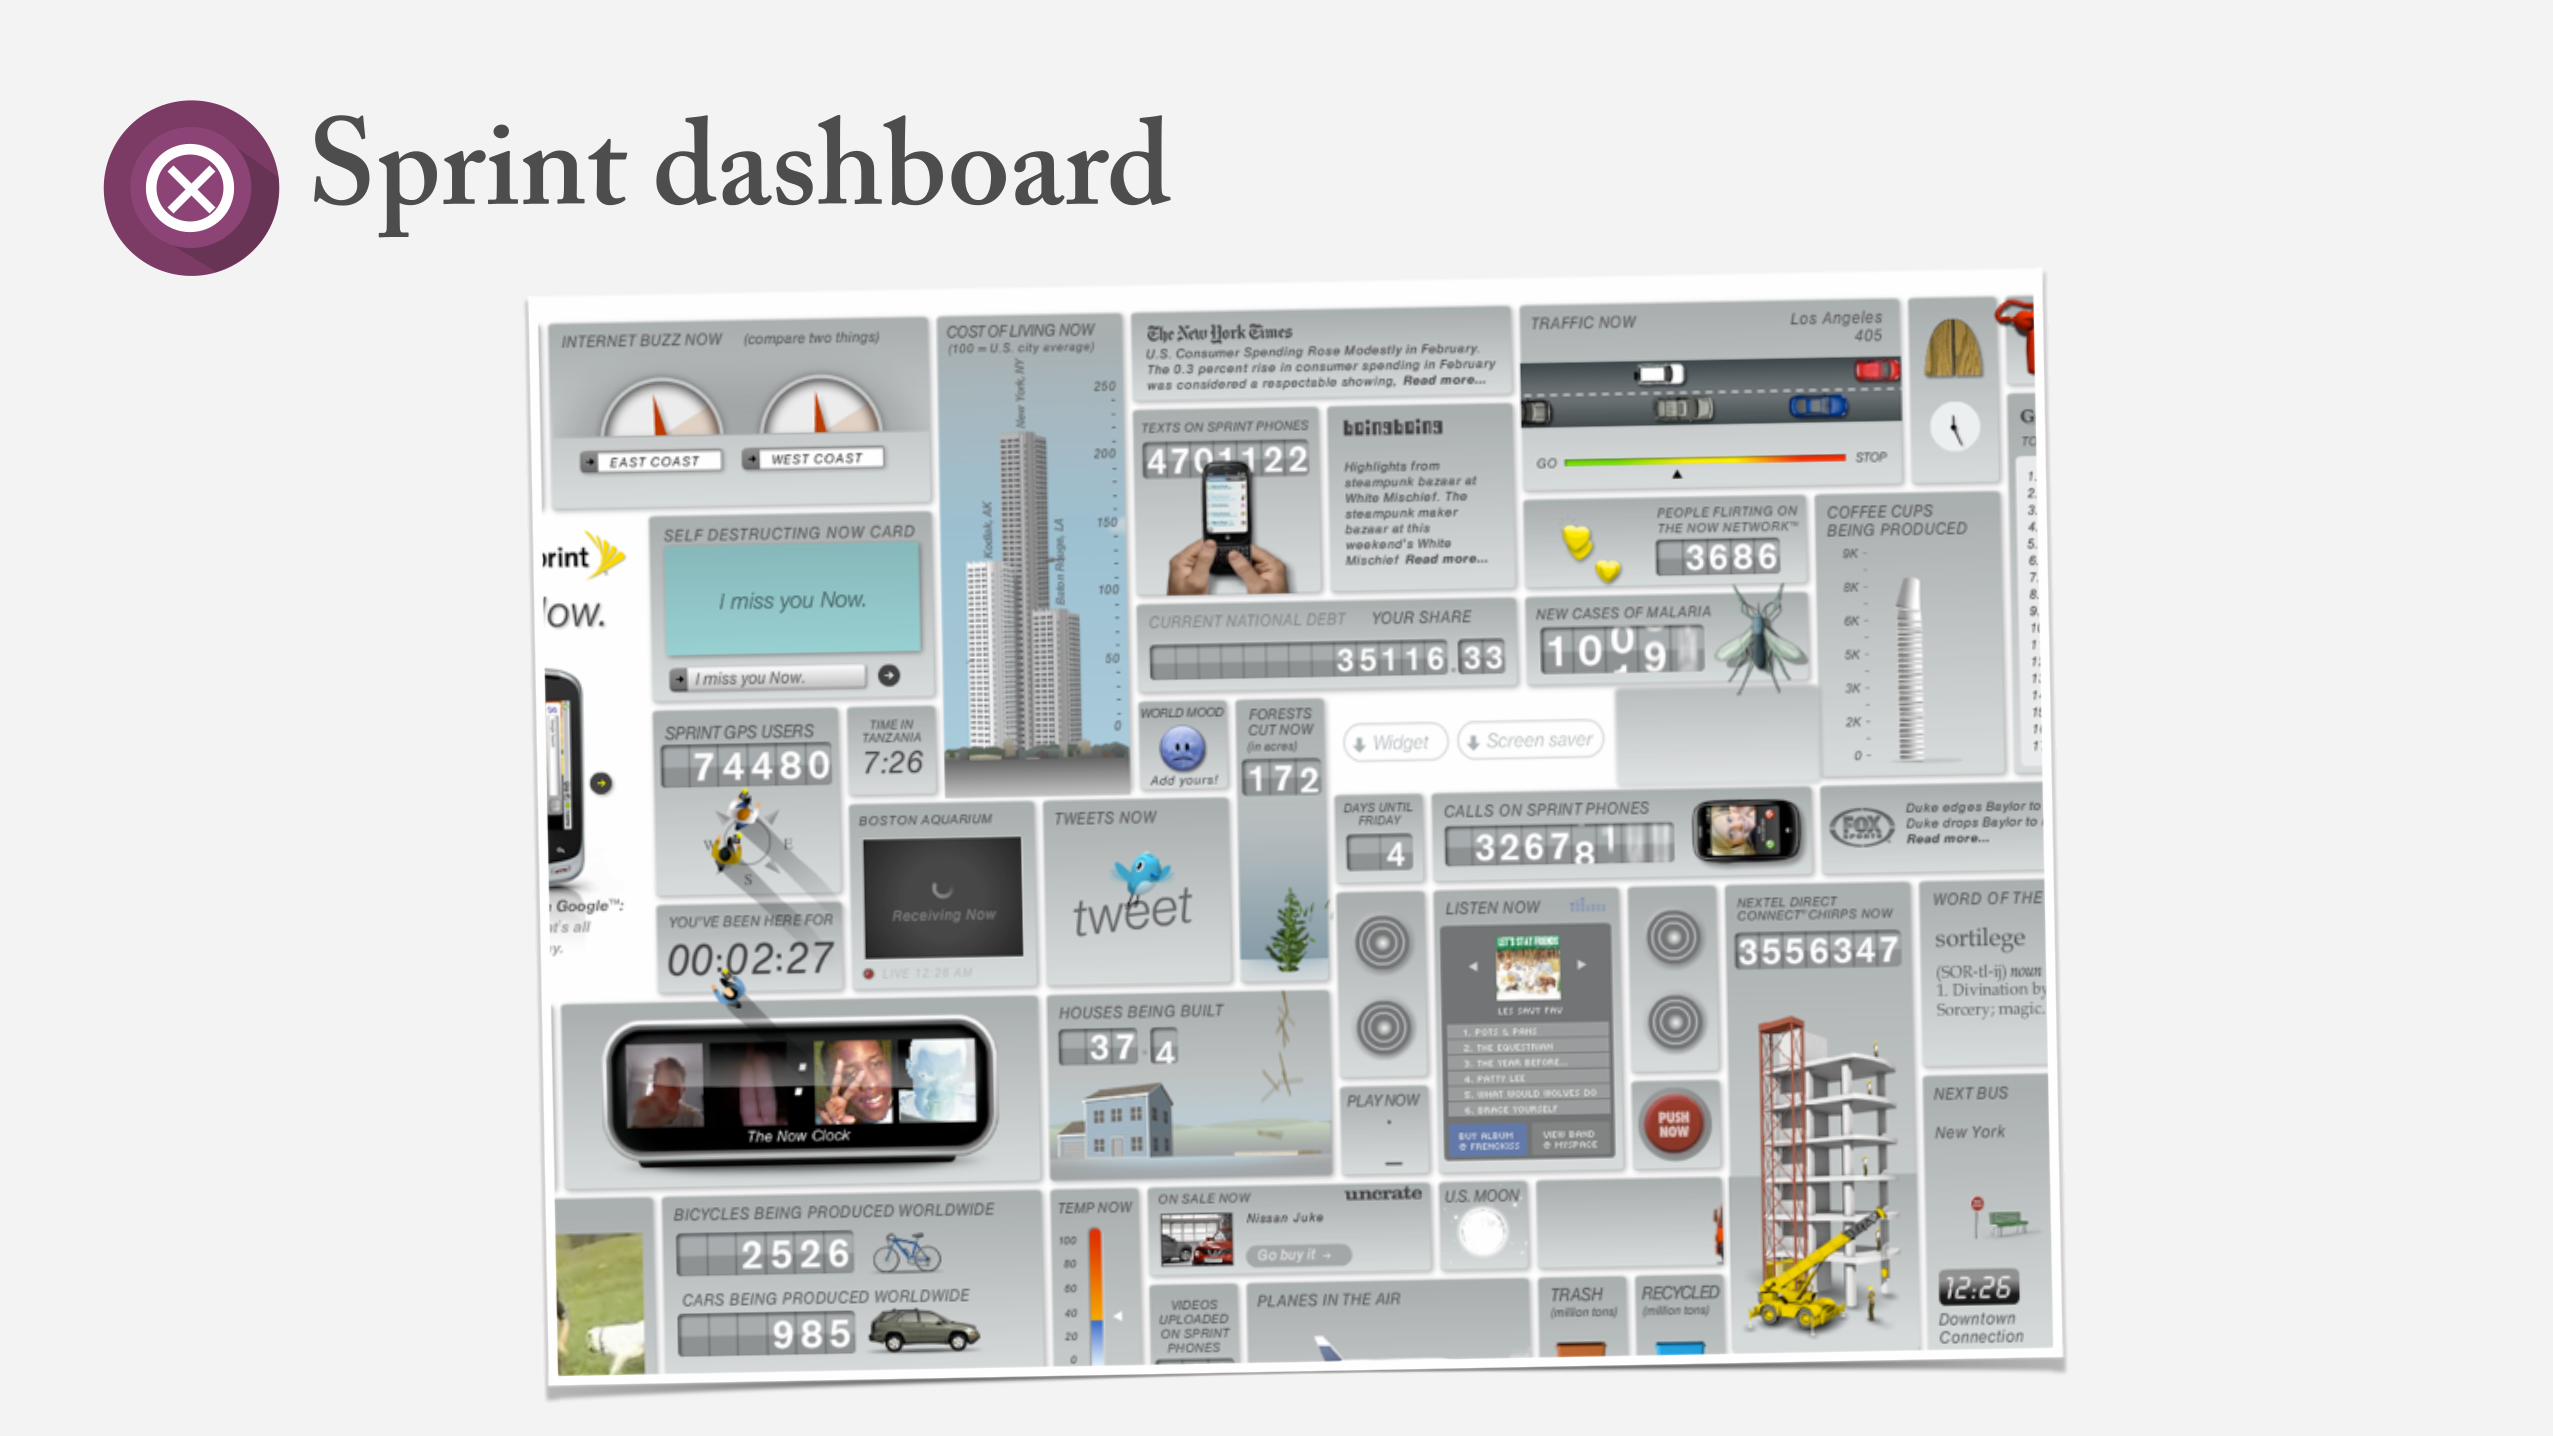
Sprint dashboard

https://www.youtube.com/watch?v=v57sUtvNa5o
Phenominal cosmic powers…
…itty bitty living space!
Compactness and Modularity“Compact software tools have all the virtues of physical tools that fit well in the hand. They feel pleasant to use, they don’t obtrude themselves between your mind and your work, [and] they make you more productive.”
- Eric Steven Raymond, “The Art of Unix Programming.”
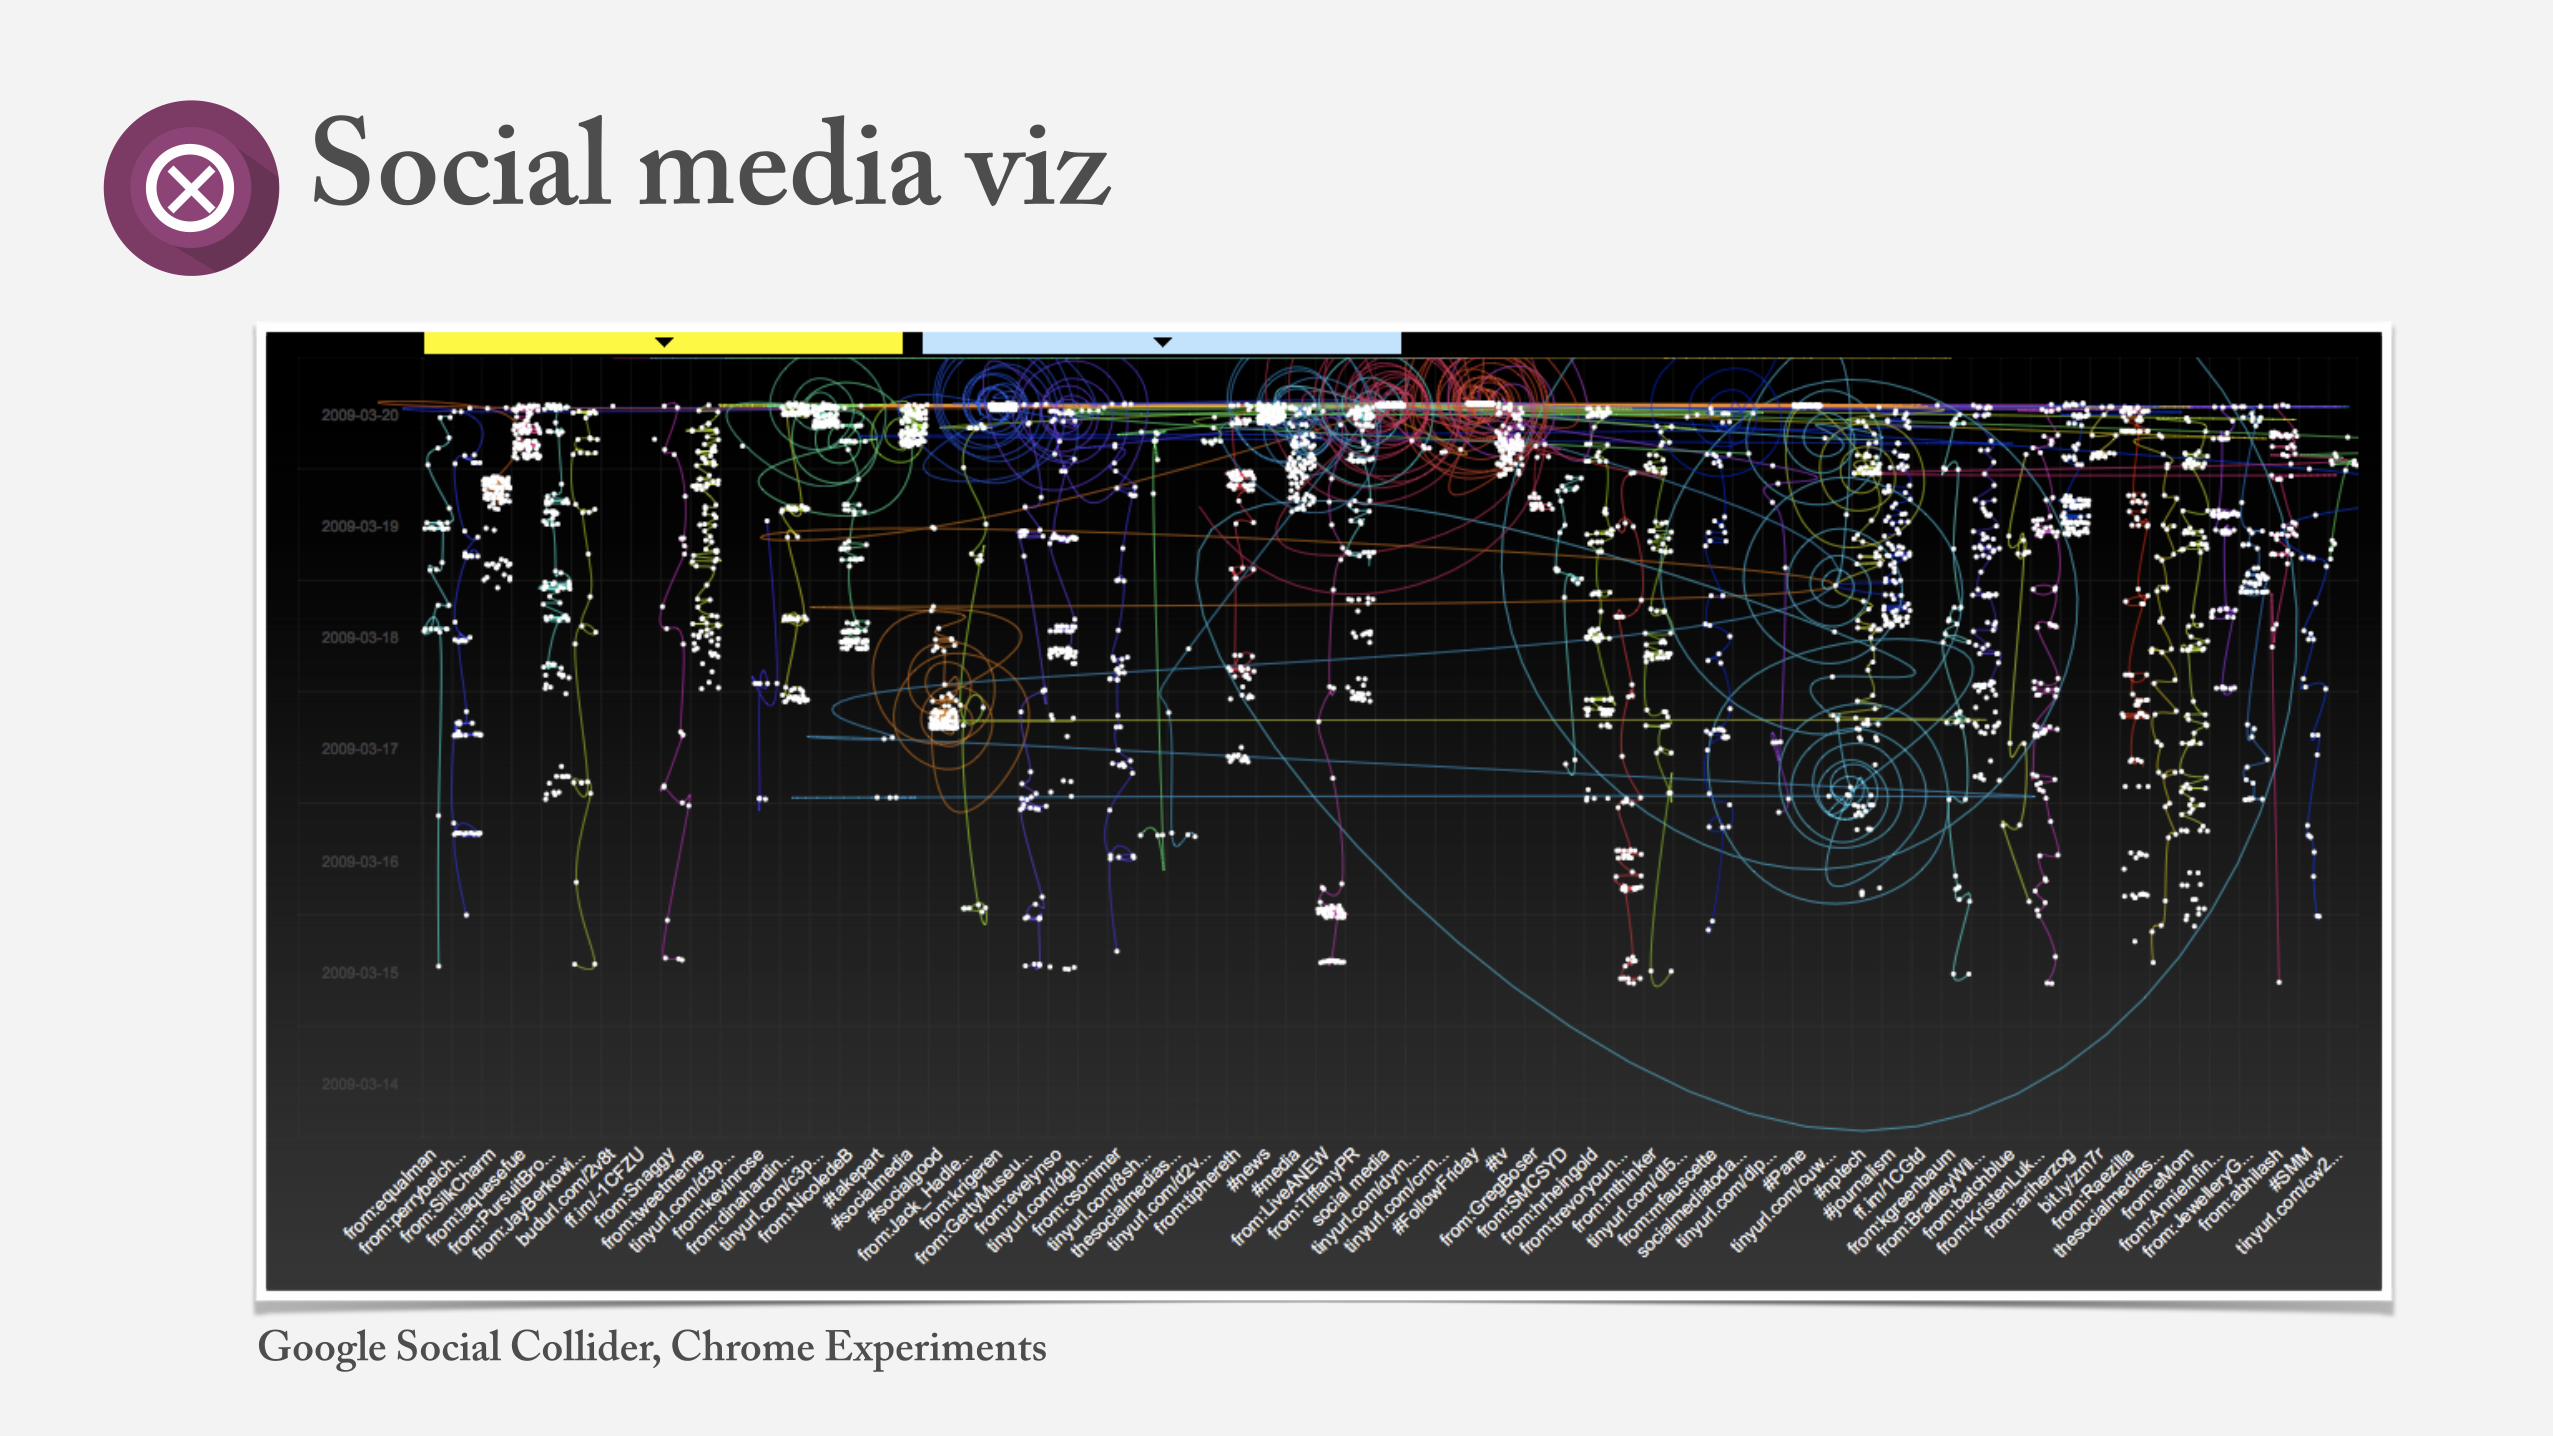
Social media viz
Google Social Collider, Chrome Experiments
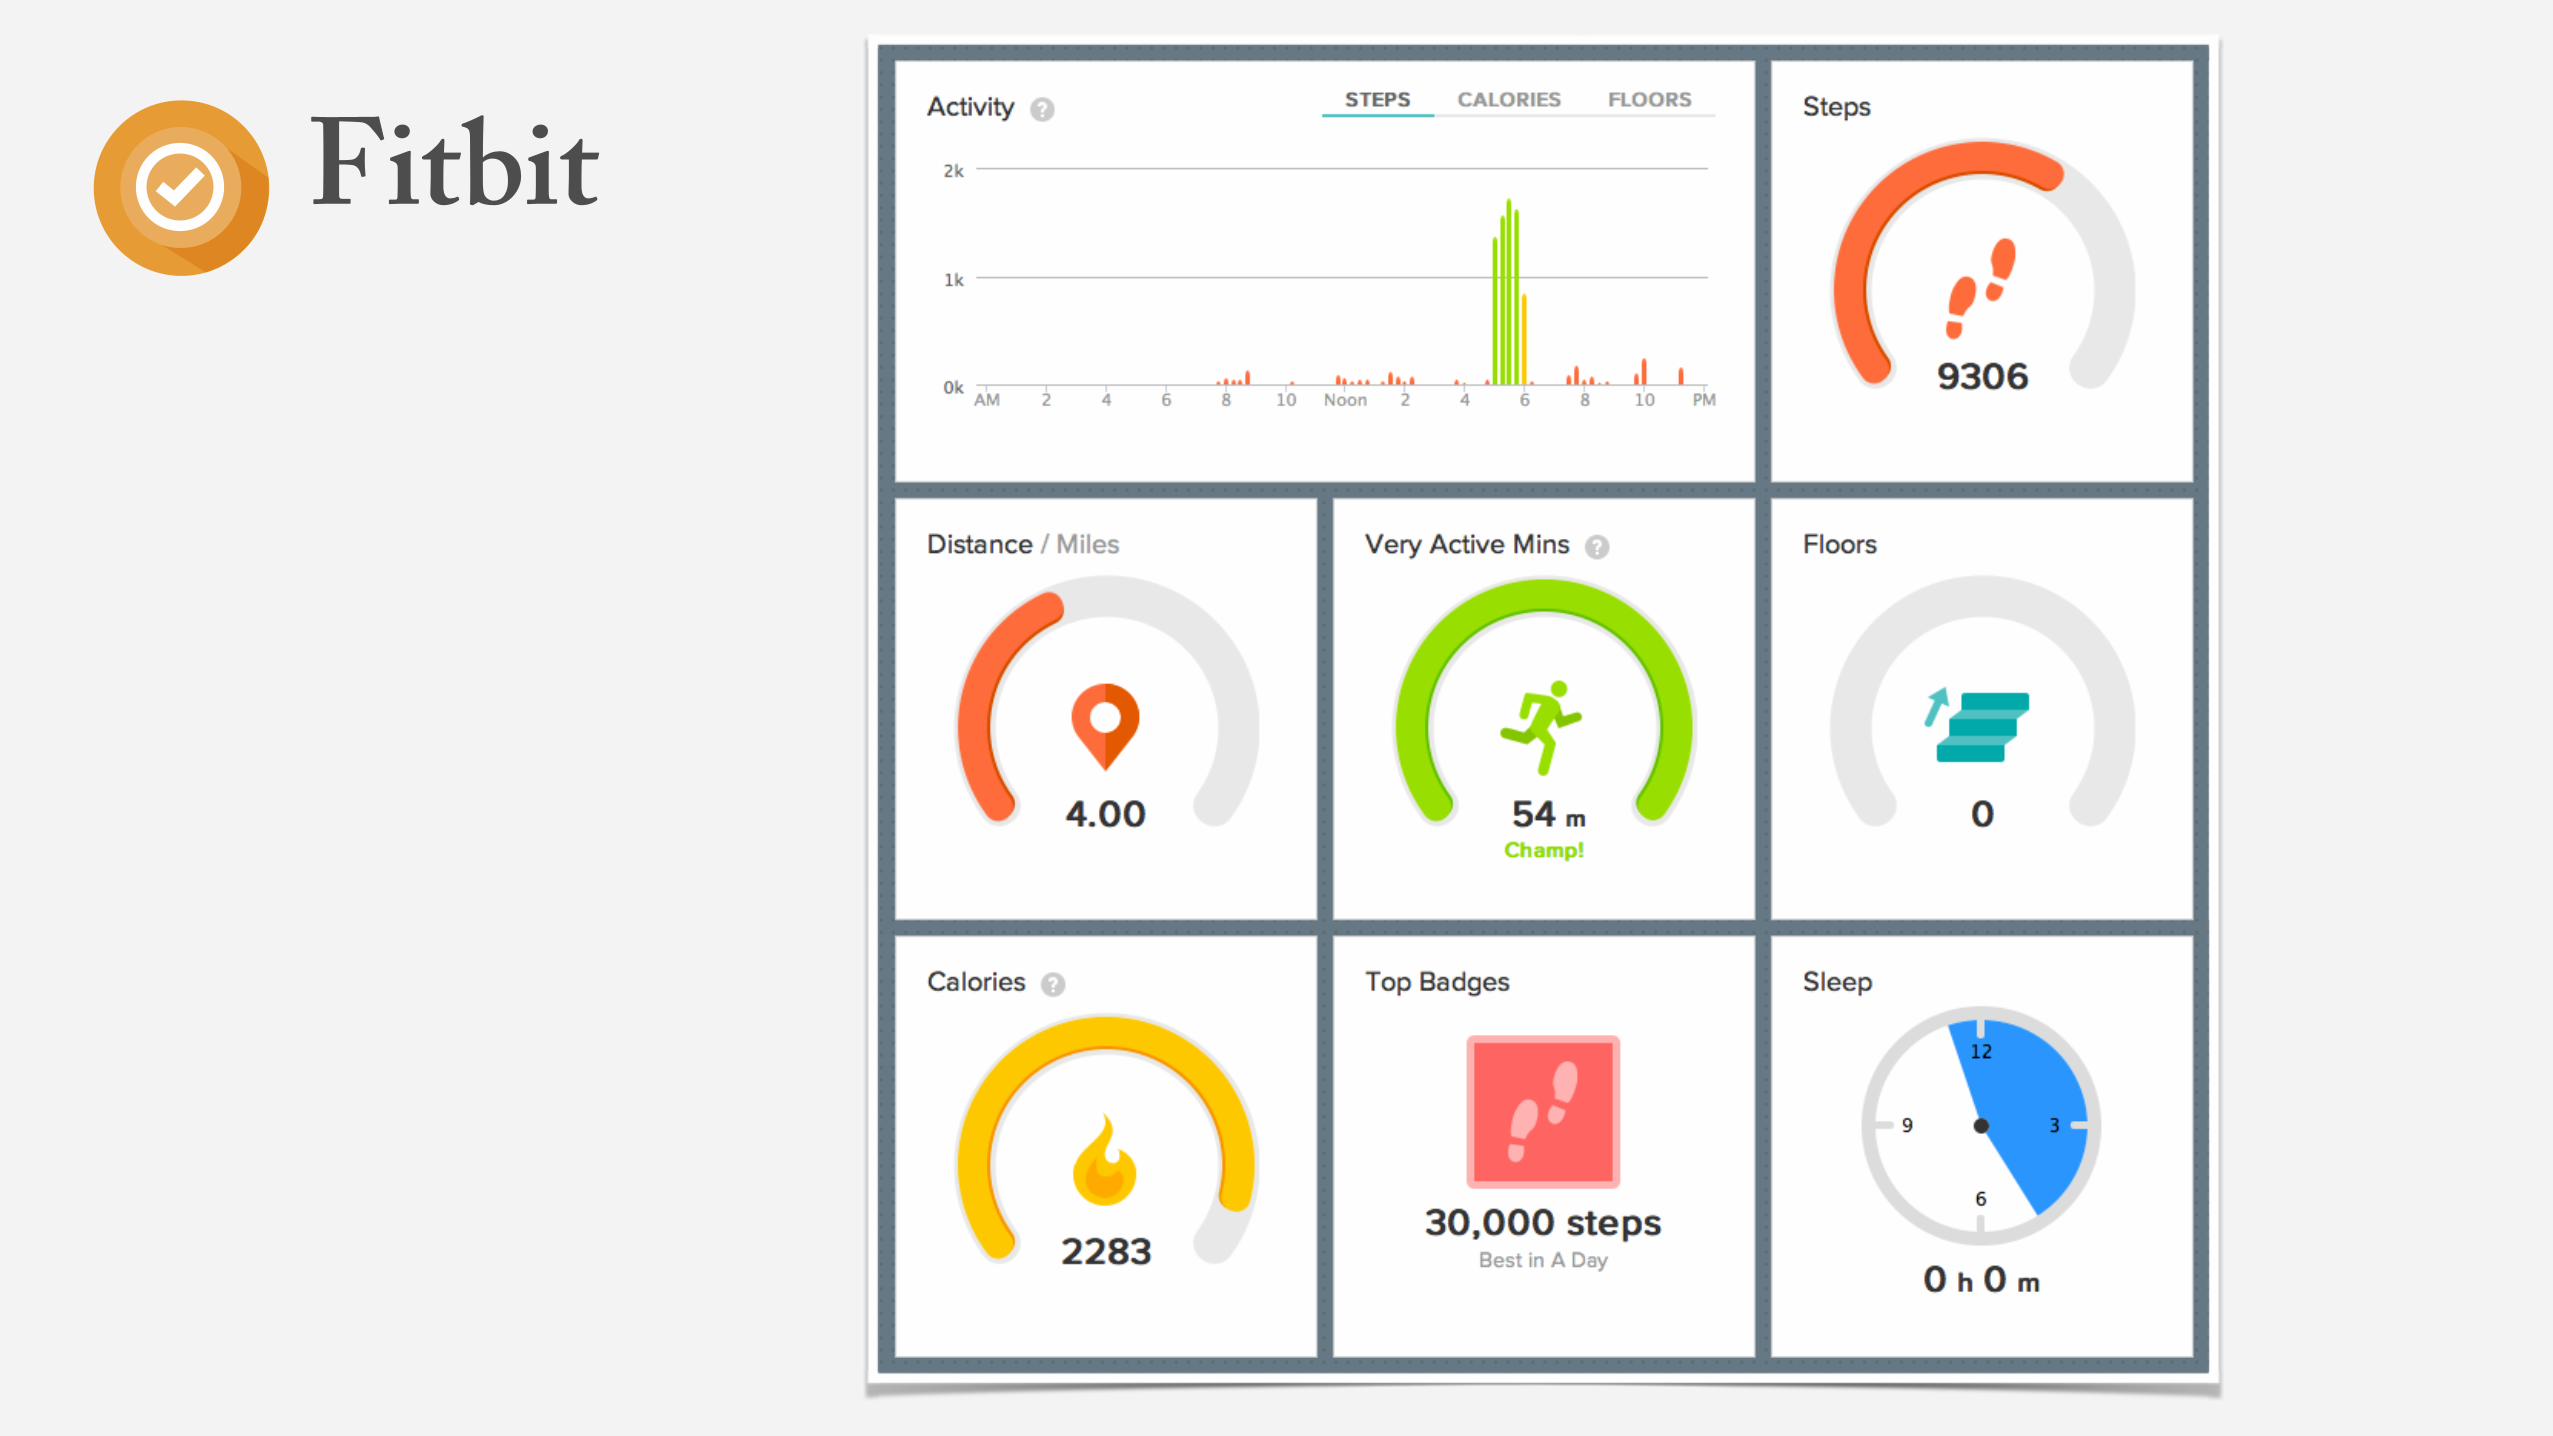
Fitbit
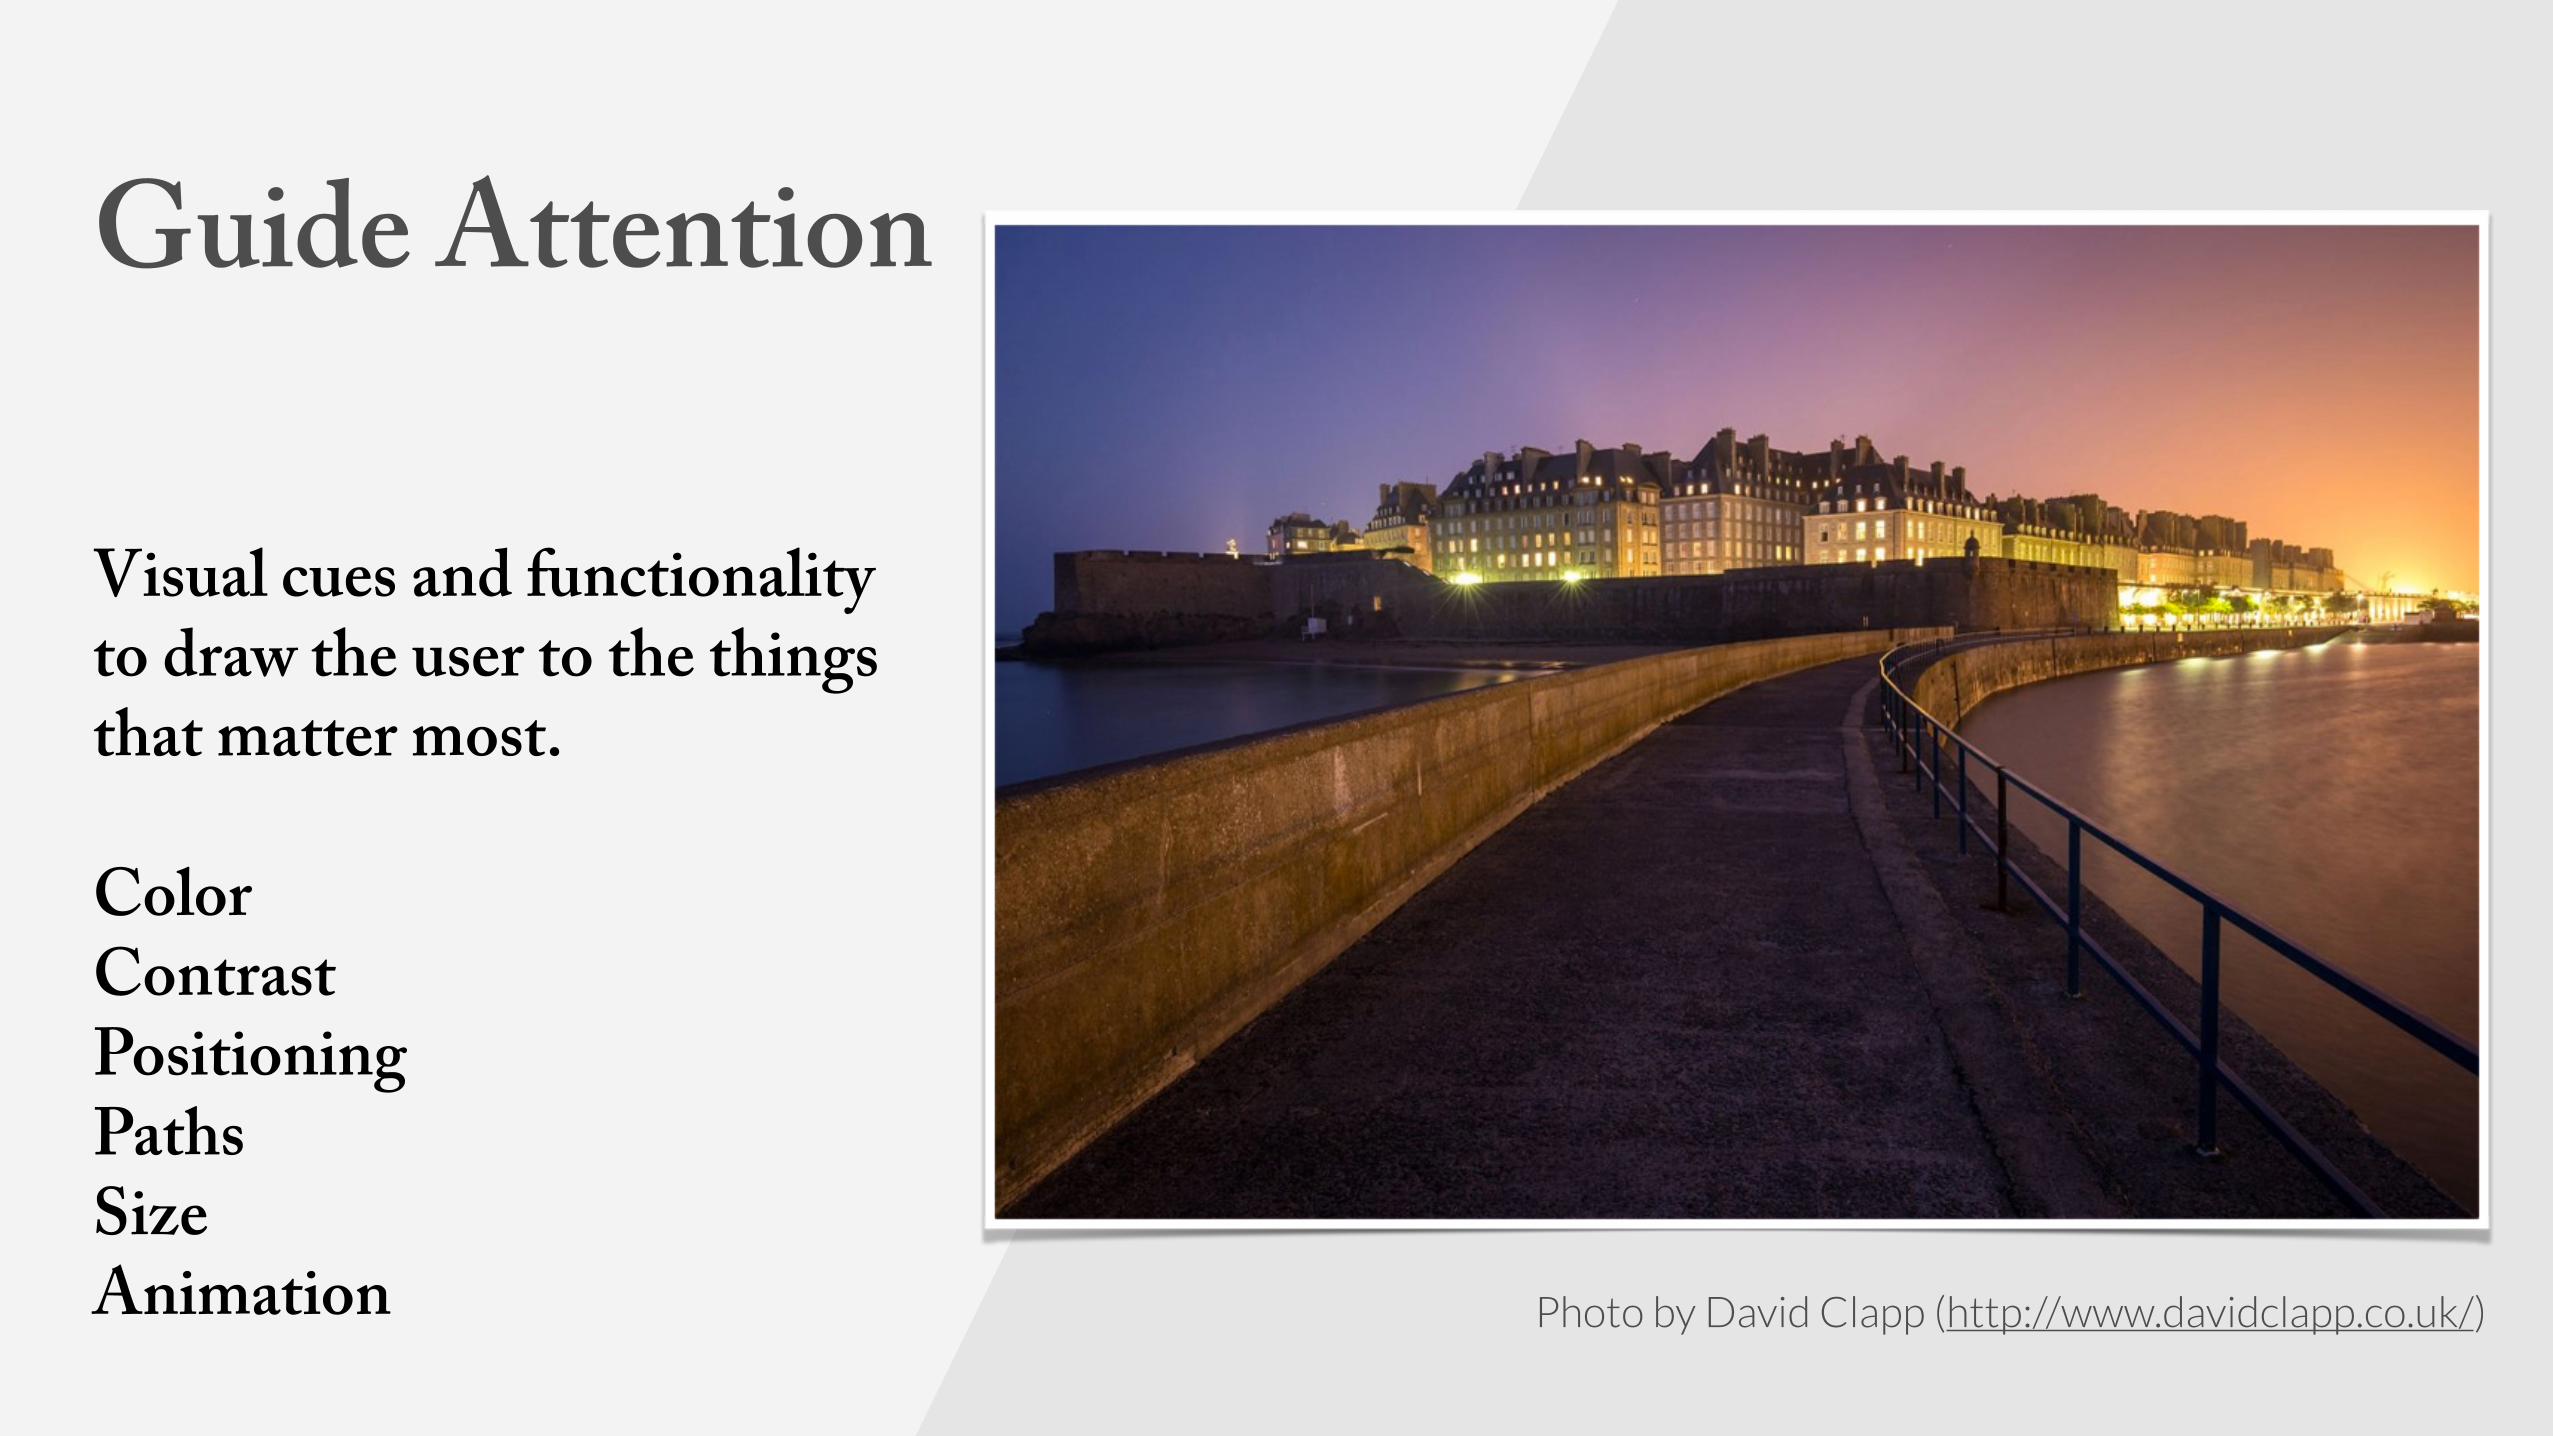
Guide Attention
Visual cues and functionality to draw the user to the things that matter most.
Color Contrast Positioning Paths Size Animation Photo by David Clapp (http://www.davidclapp.co.uk/)
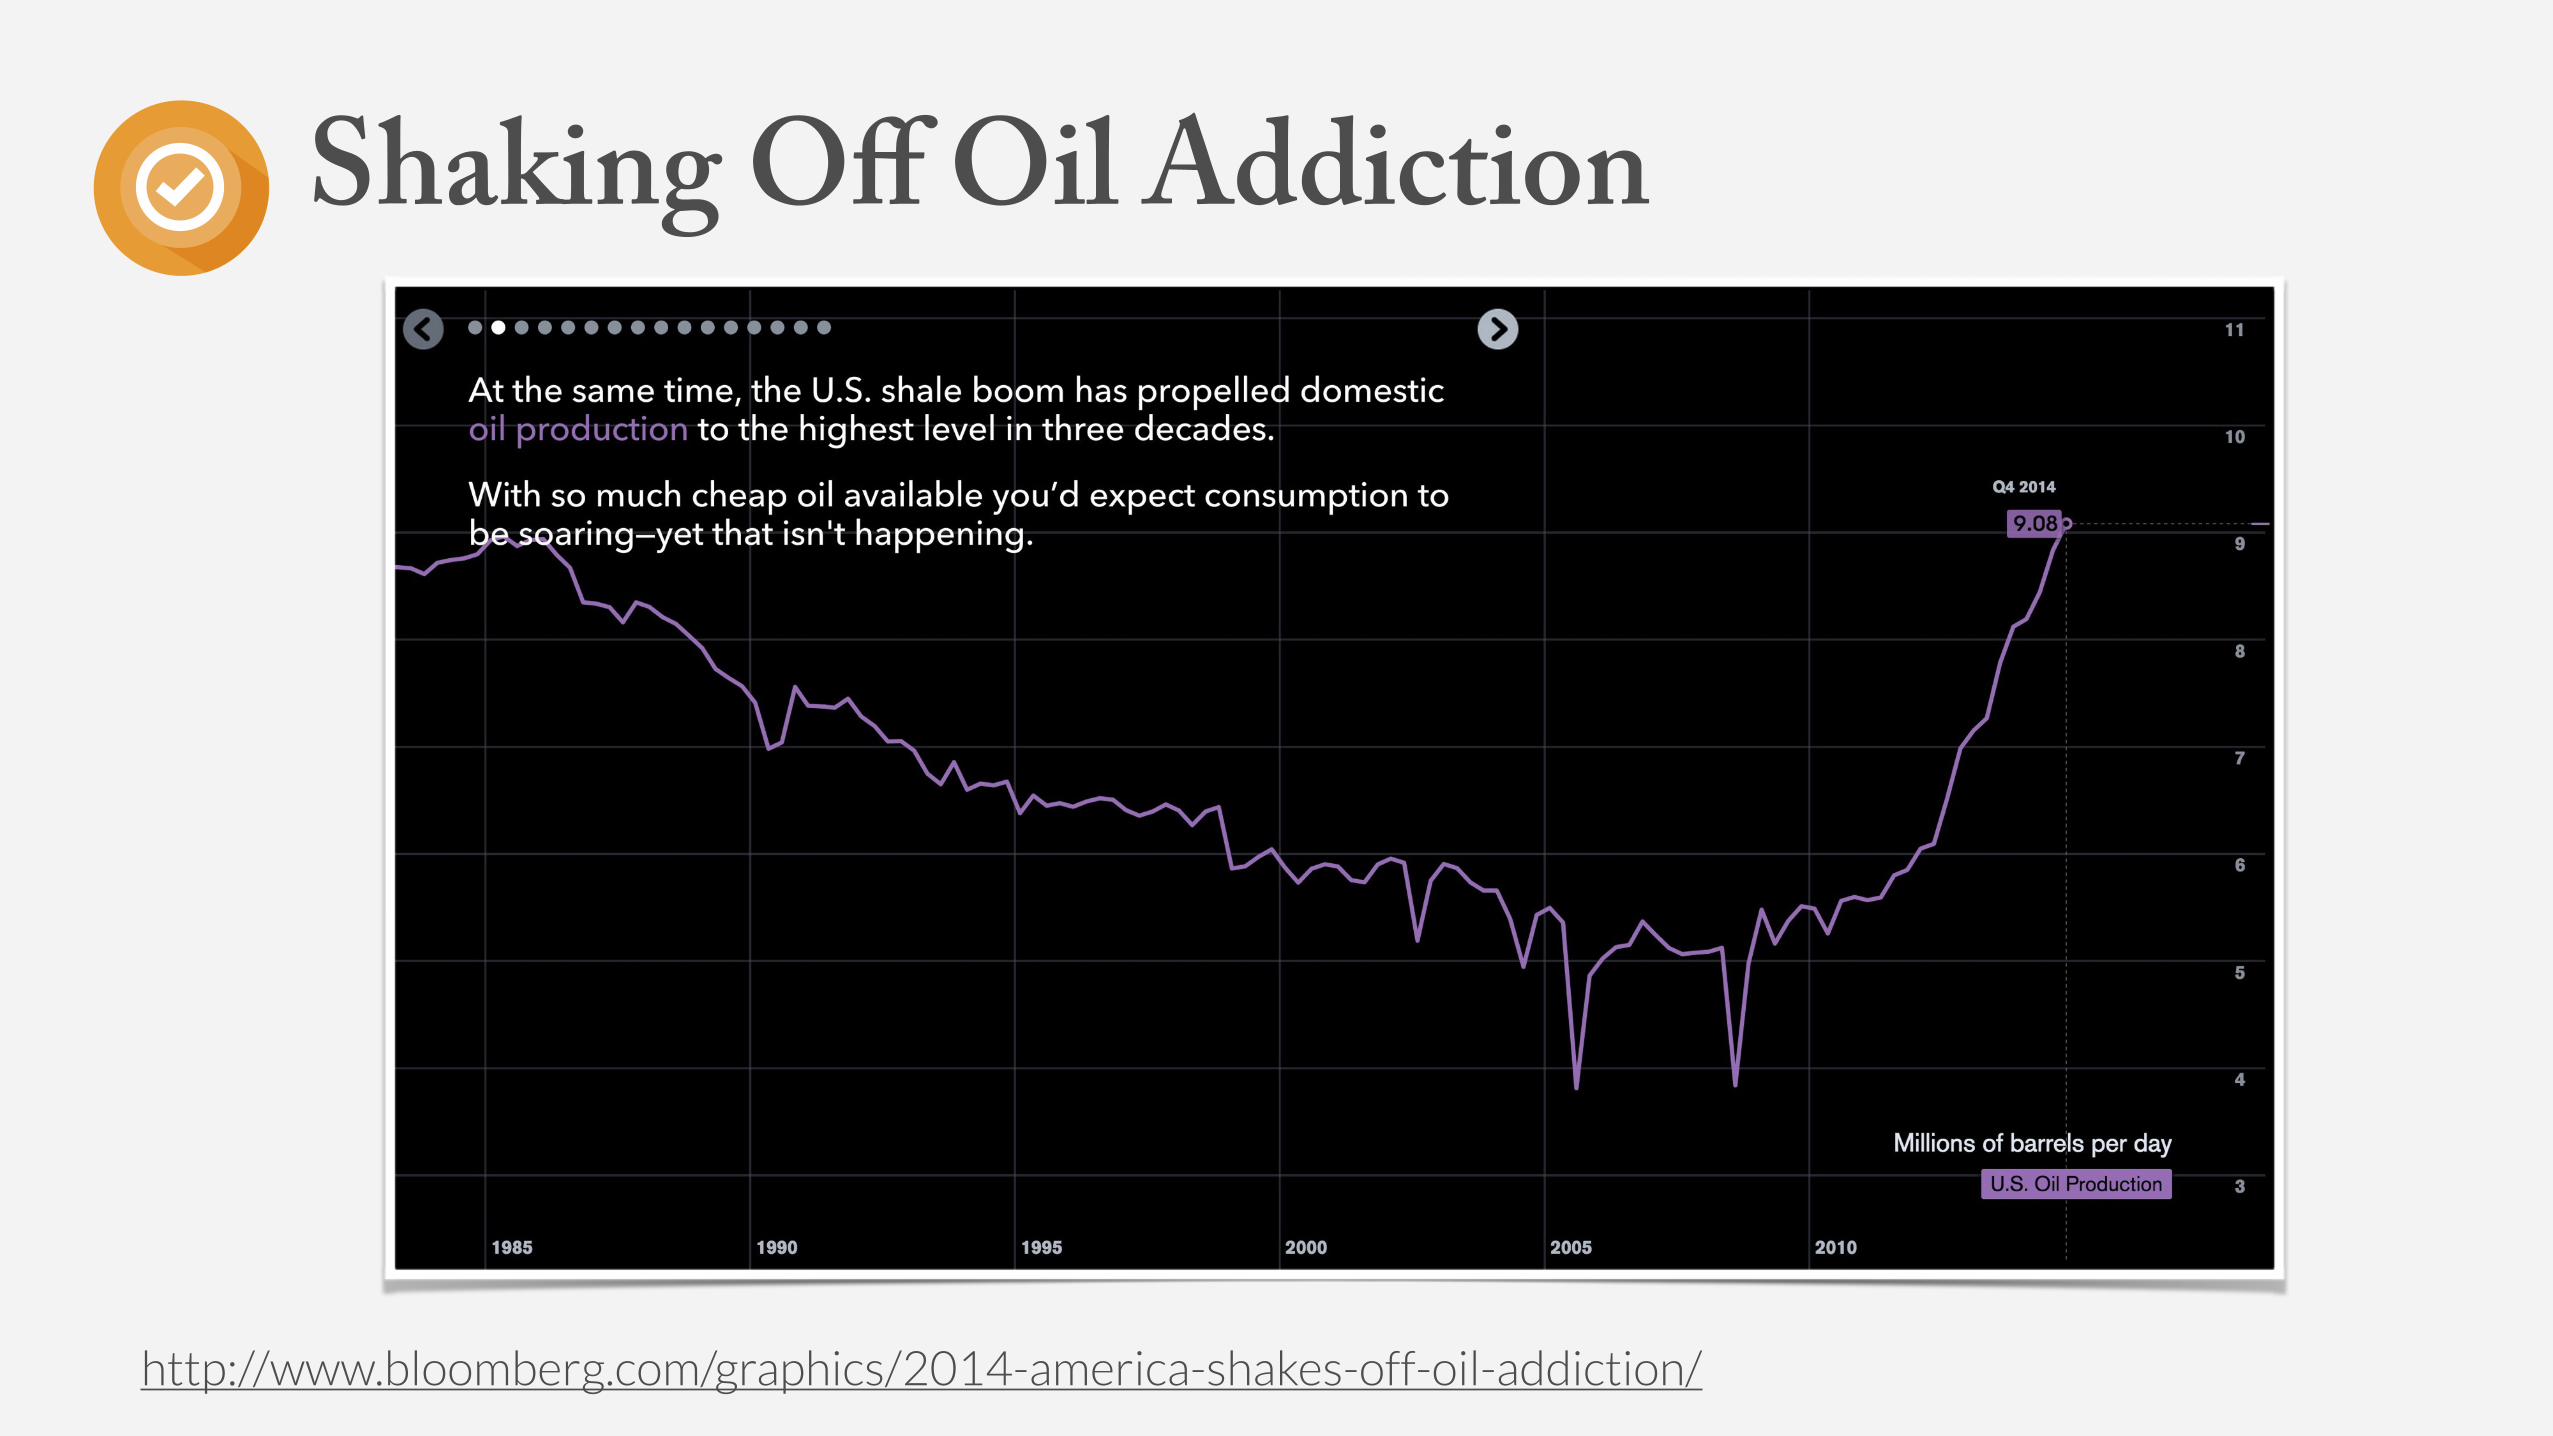
Shaking Off Oil Addiction
http://www.bloomberg.com/graphics/2014-america-shakes-off-oil-addiction/
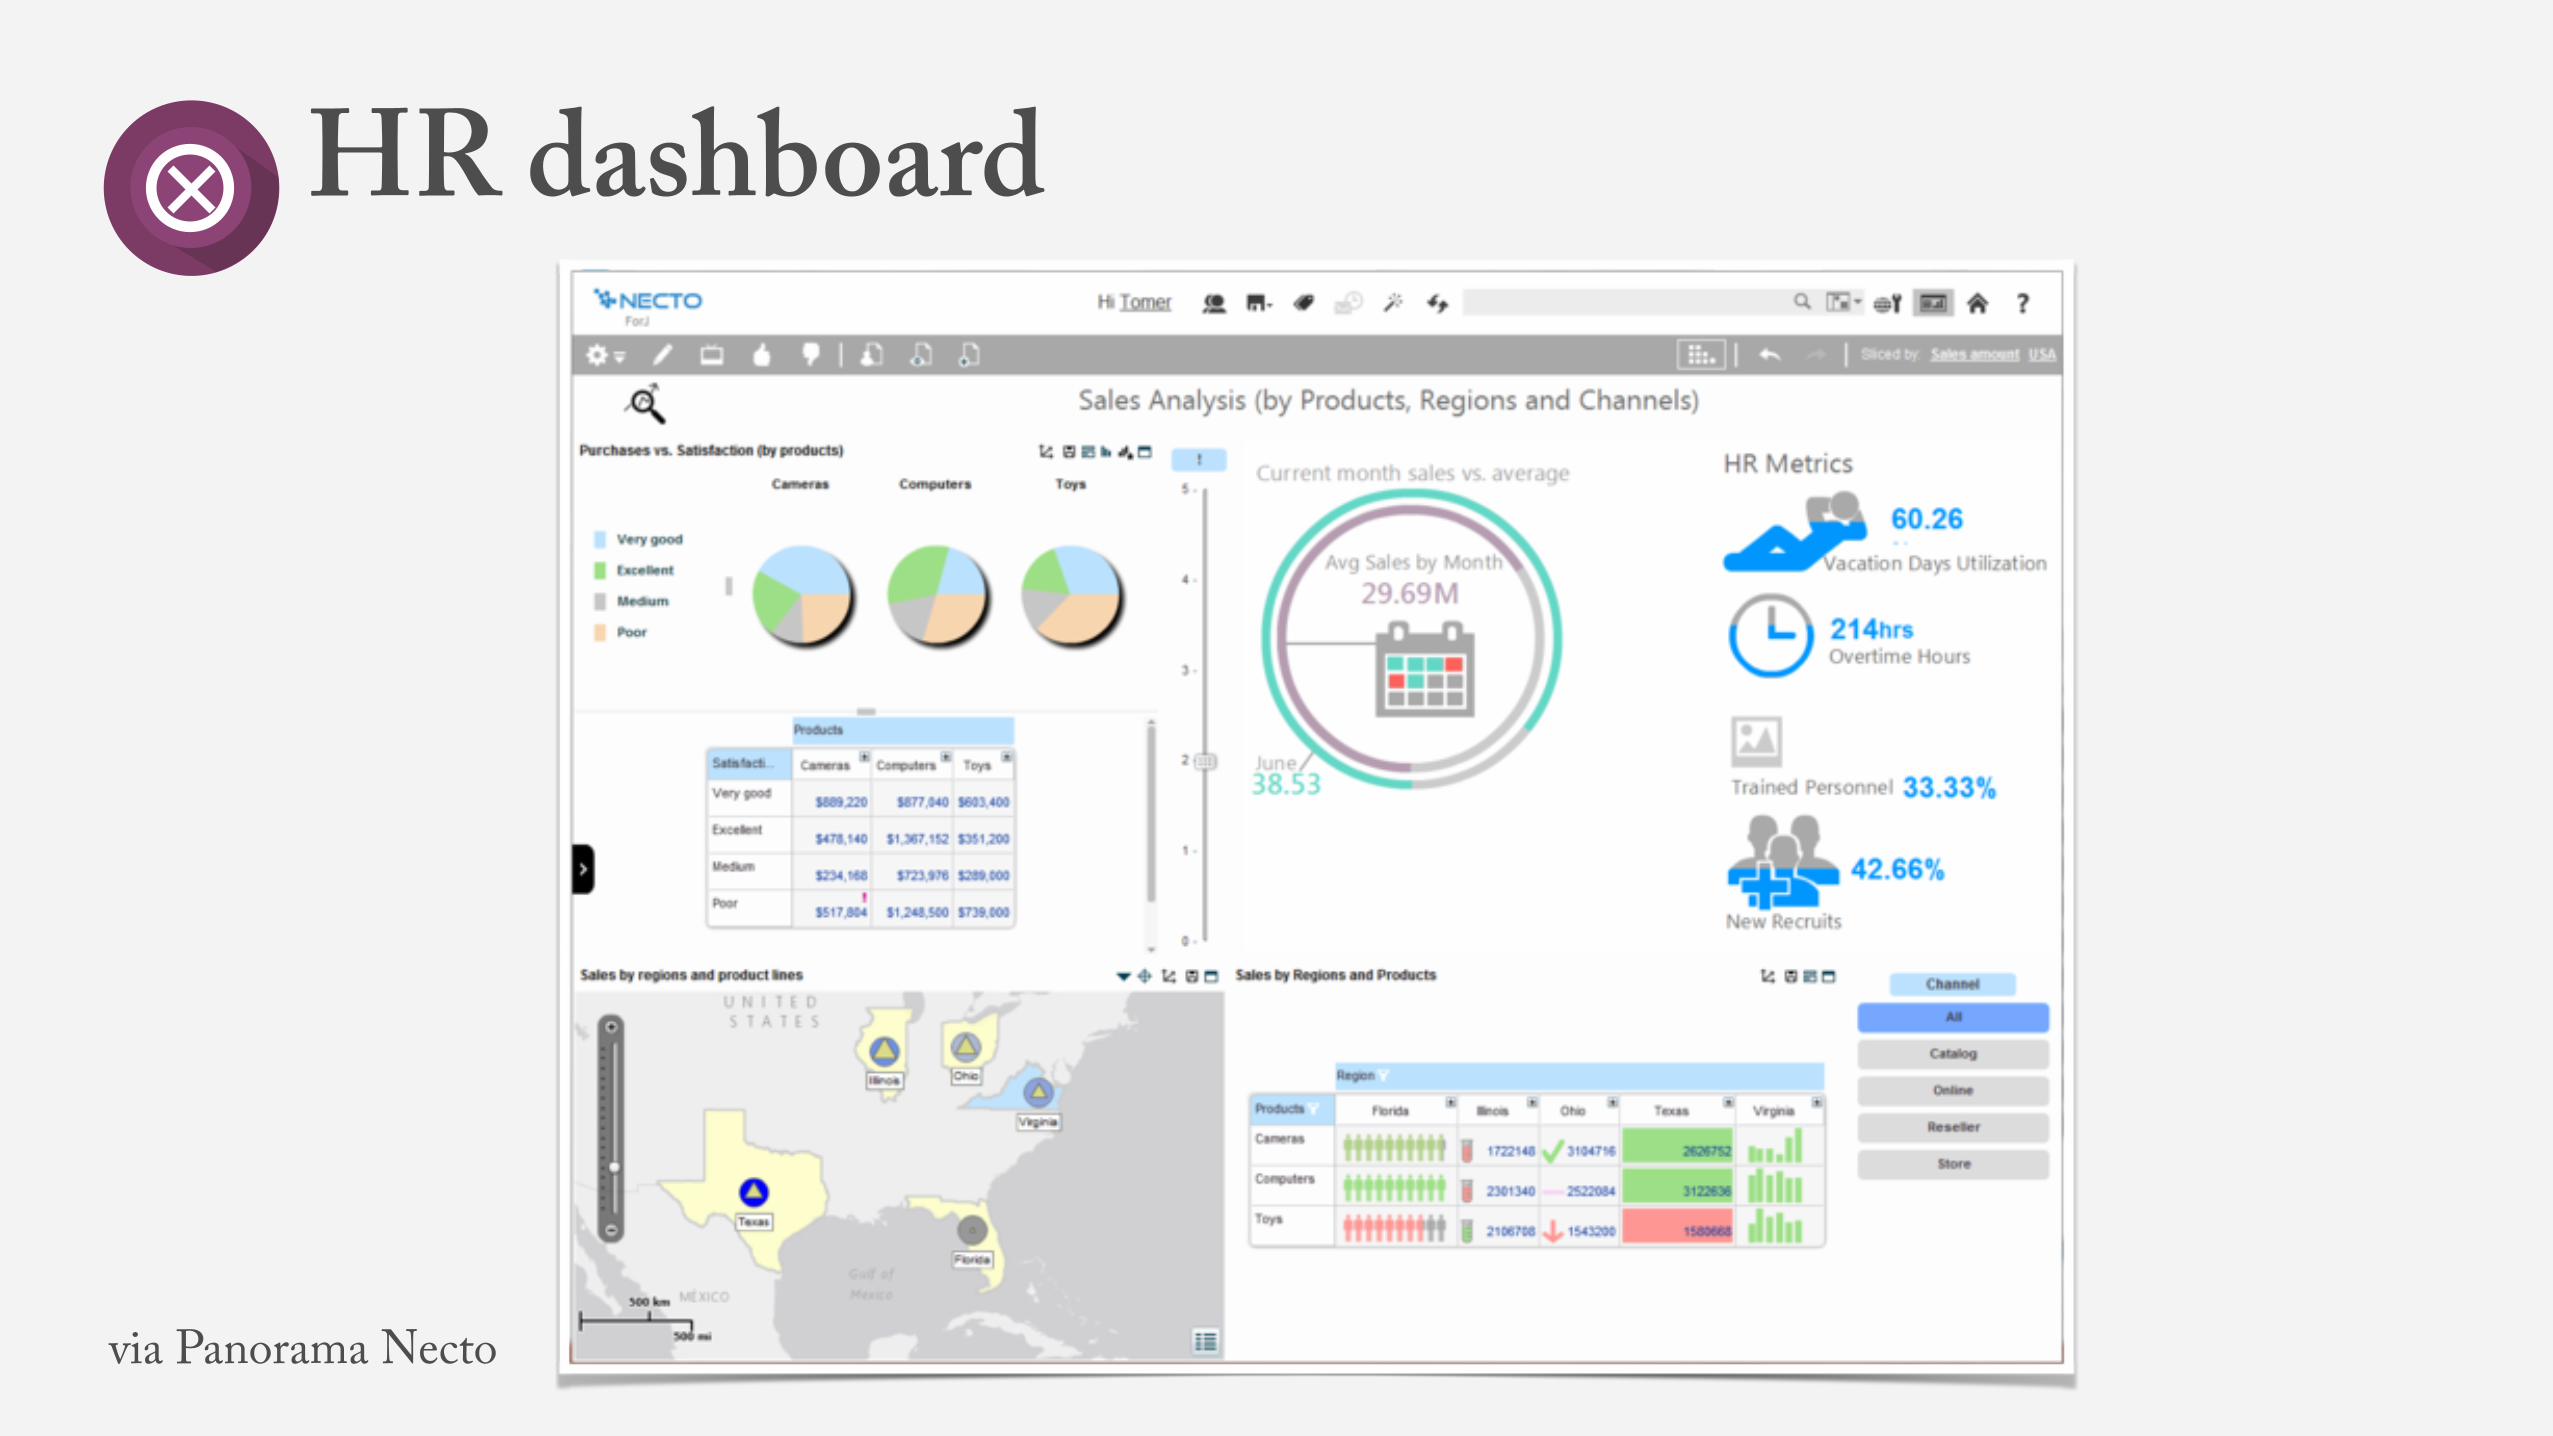
HR dashboard
via Panorama Necto
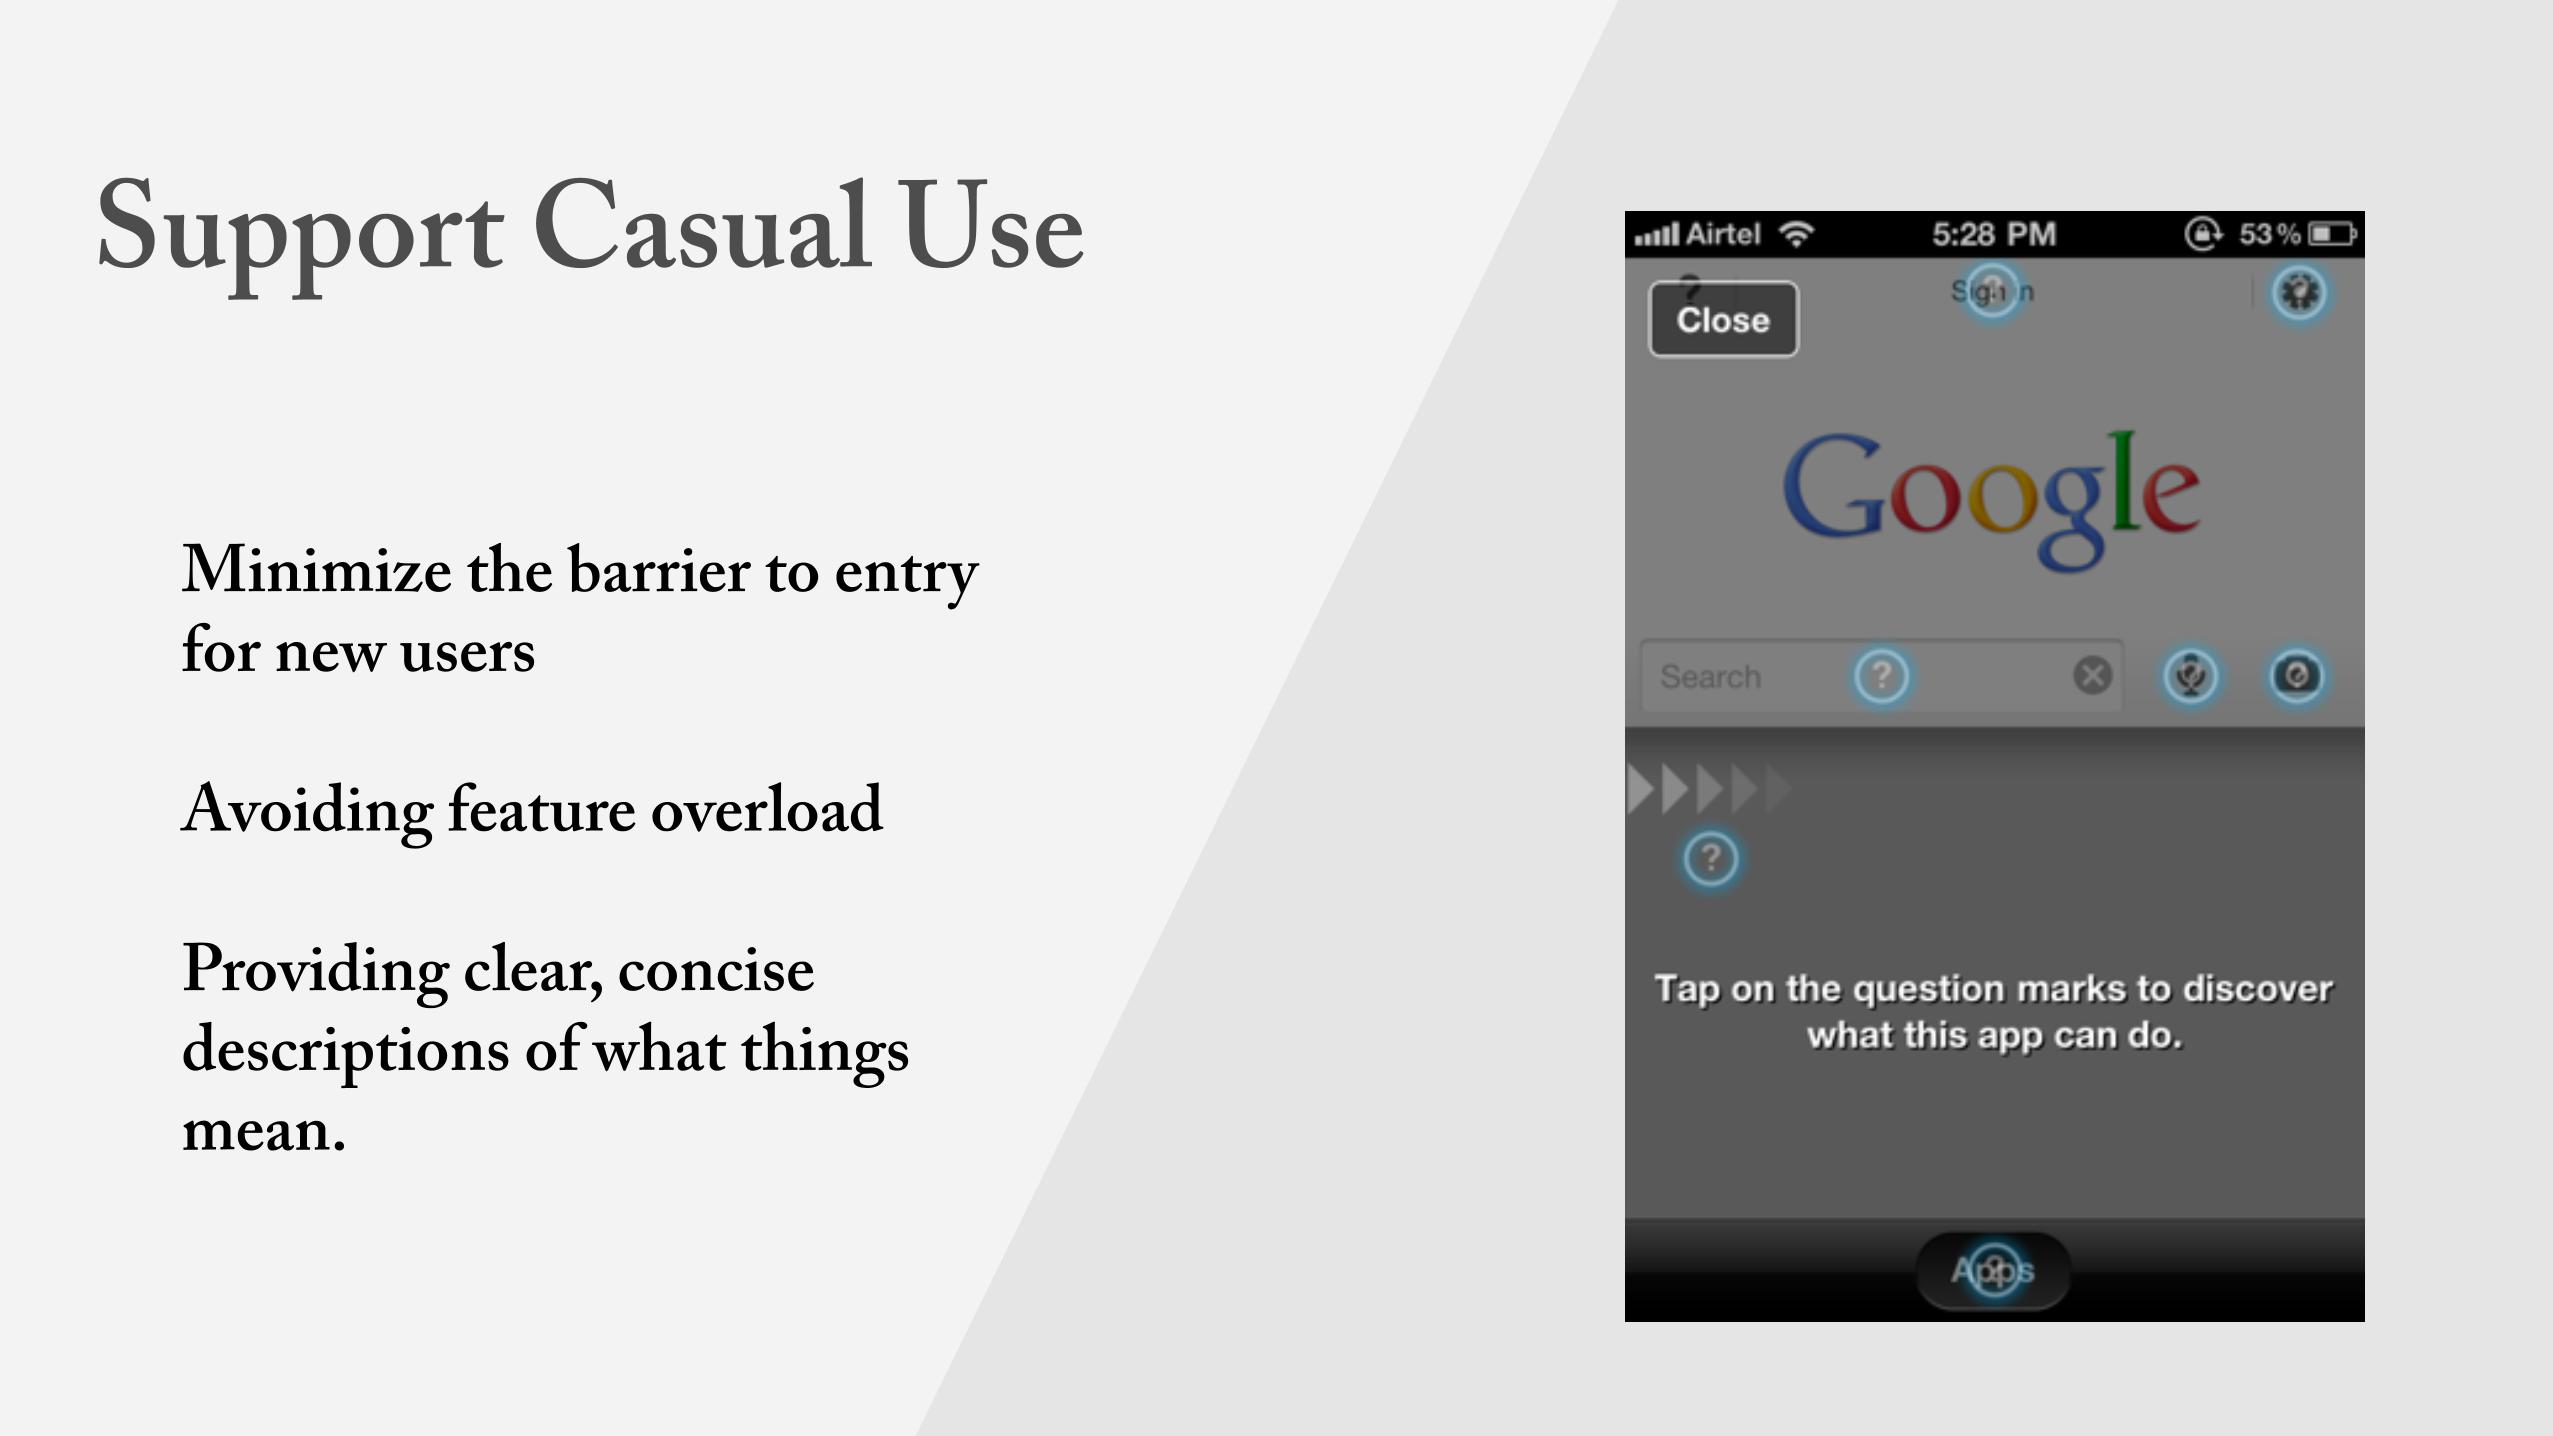
Support Casual Use
Minimize the barrier to entry for new users
Avoiding feature overload
Providing clear, concise descriptions of what things mean.

Lead to Action
Empower users to finish their task quickly
Direct users to the action that should be taken based on the results
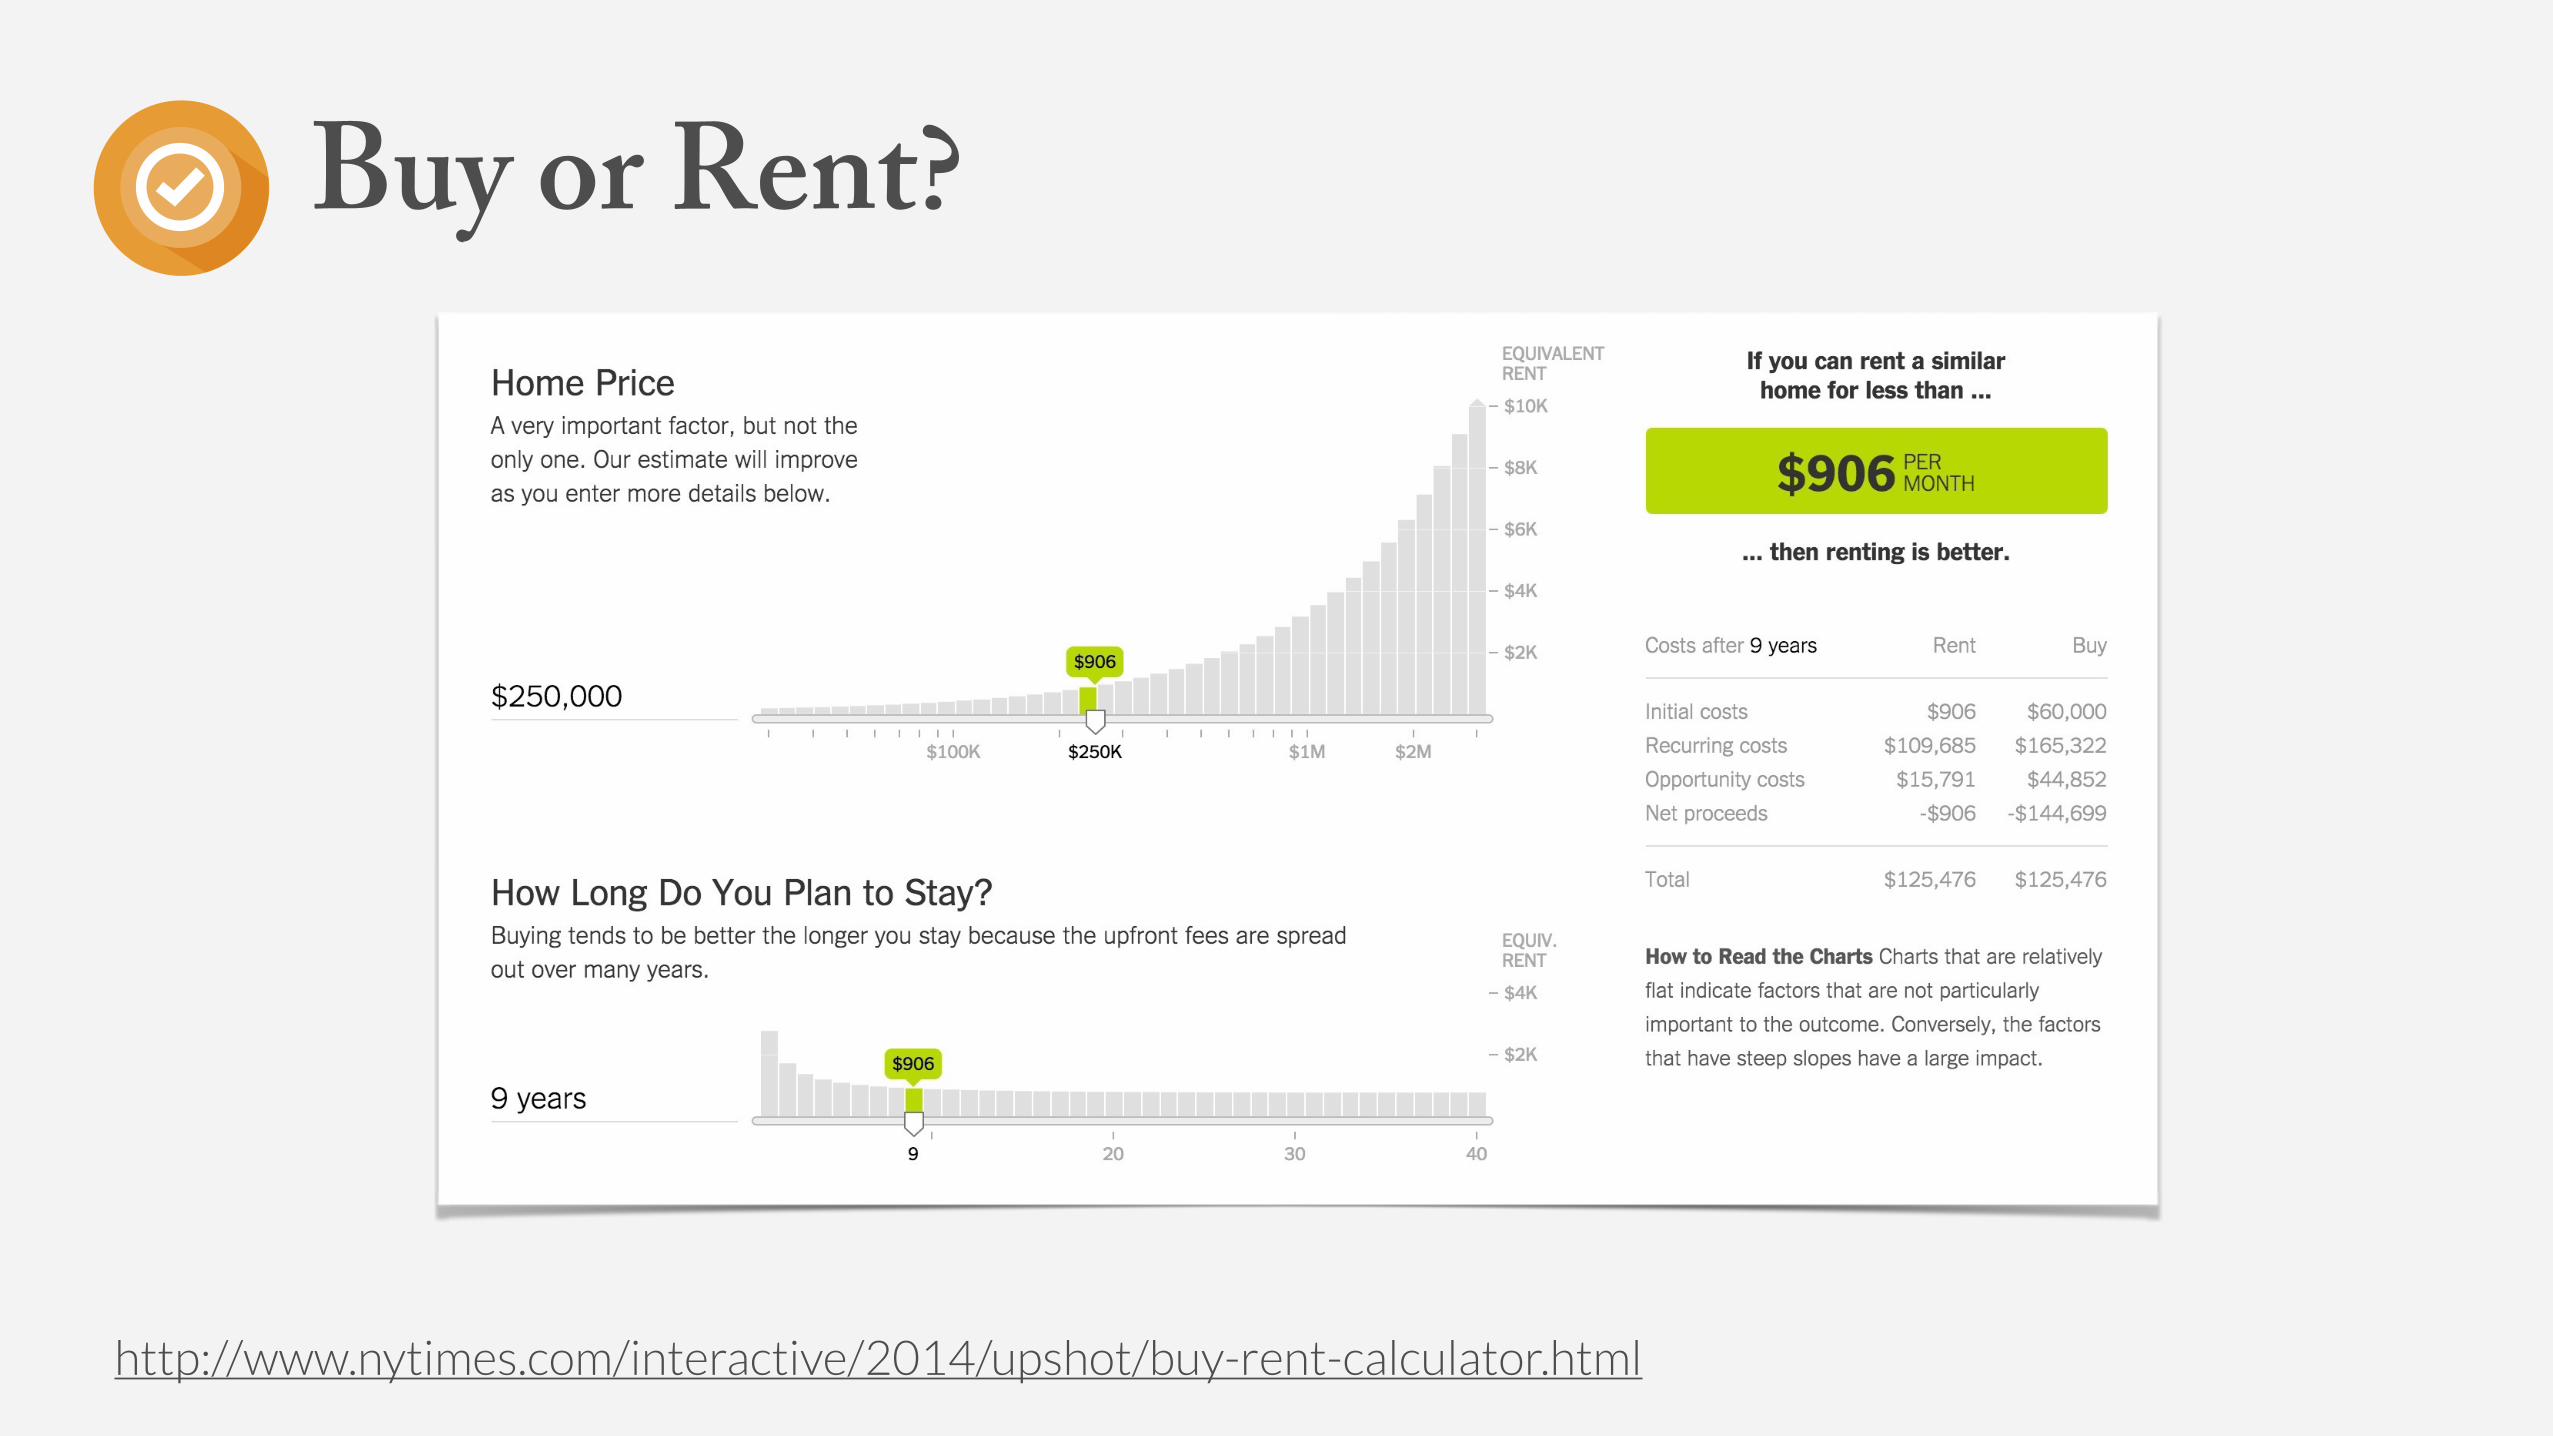
Buy or Rent?
http://www.nytimes.com/interactive/2014/upshot/buy-rent-calculator.html
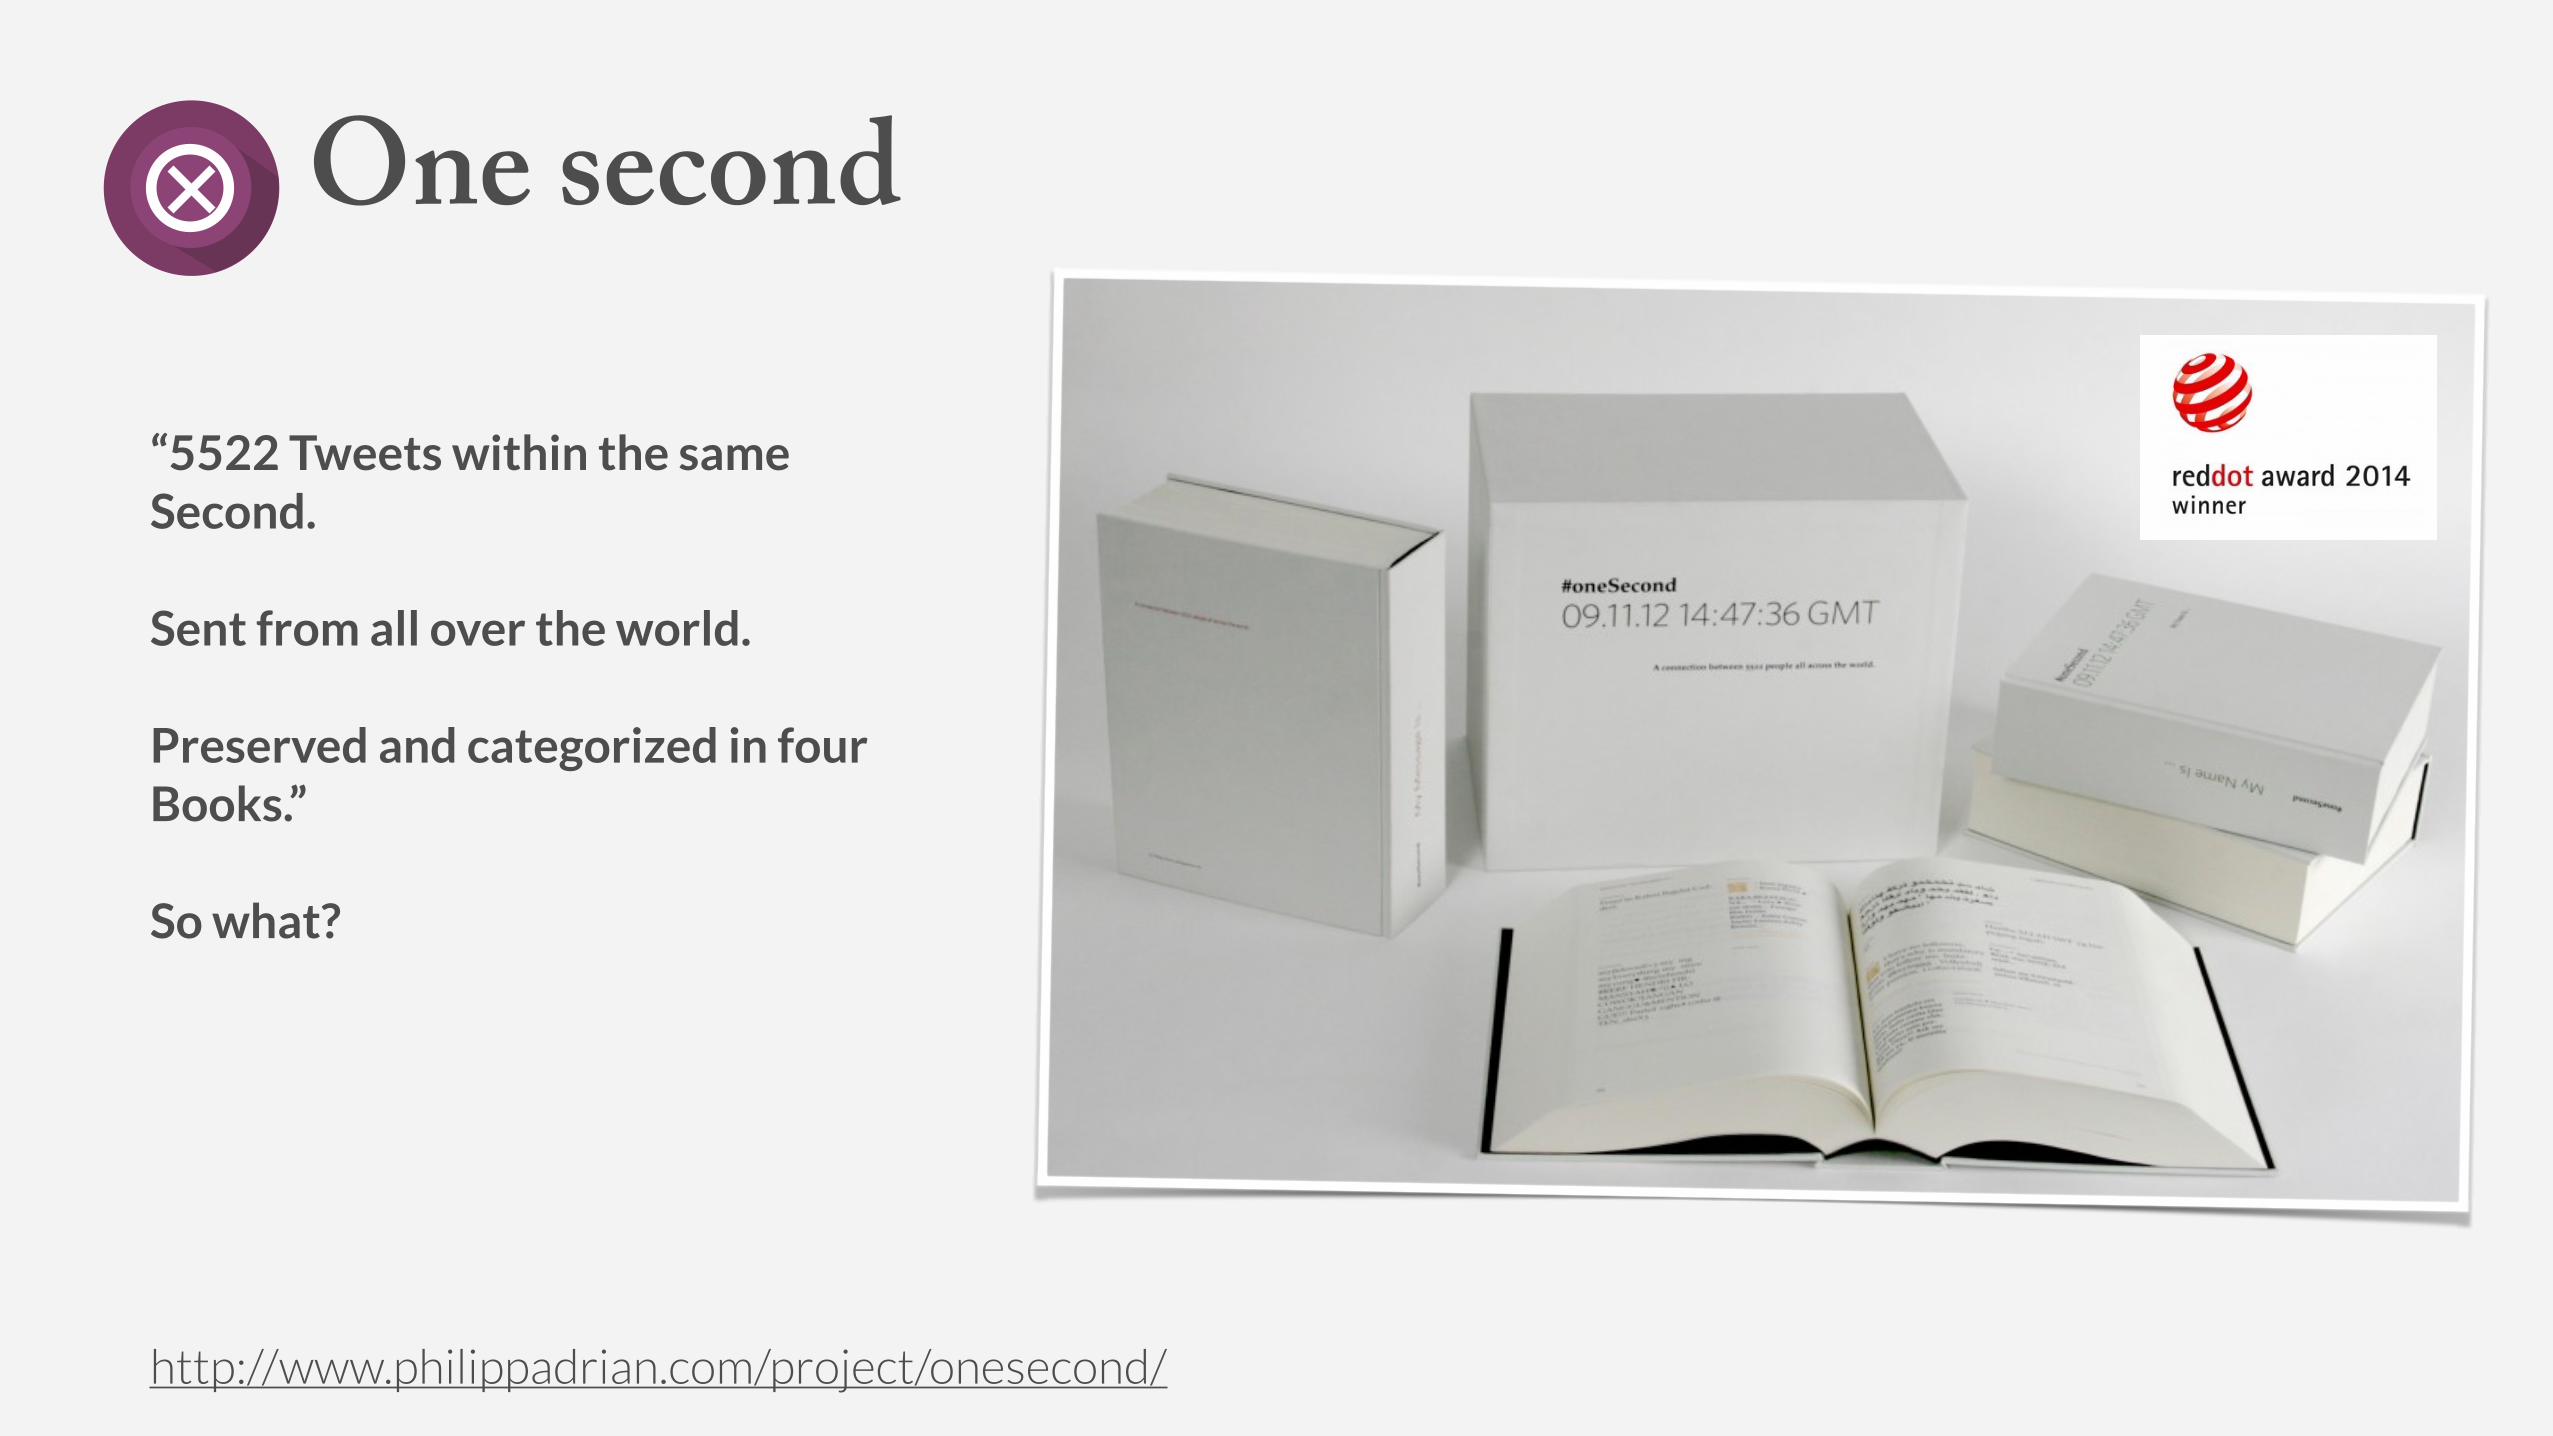
“5522 Tweets within the same Second.
Sent from all over the world.
Preserved and categorized in four Books.”
So what?
One second
http://www.philippadrian.com/project/onesecond/
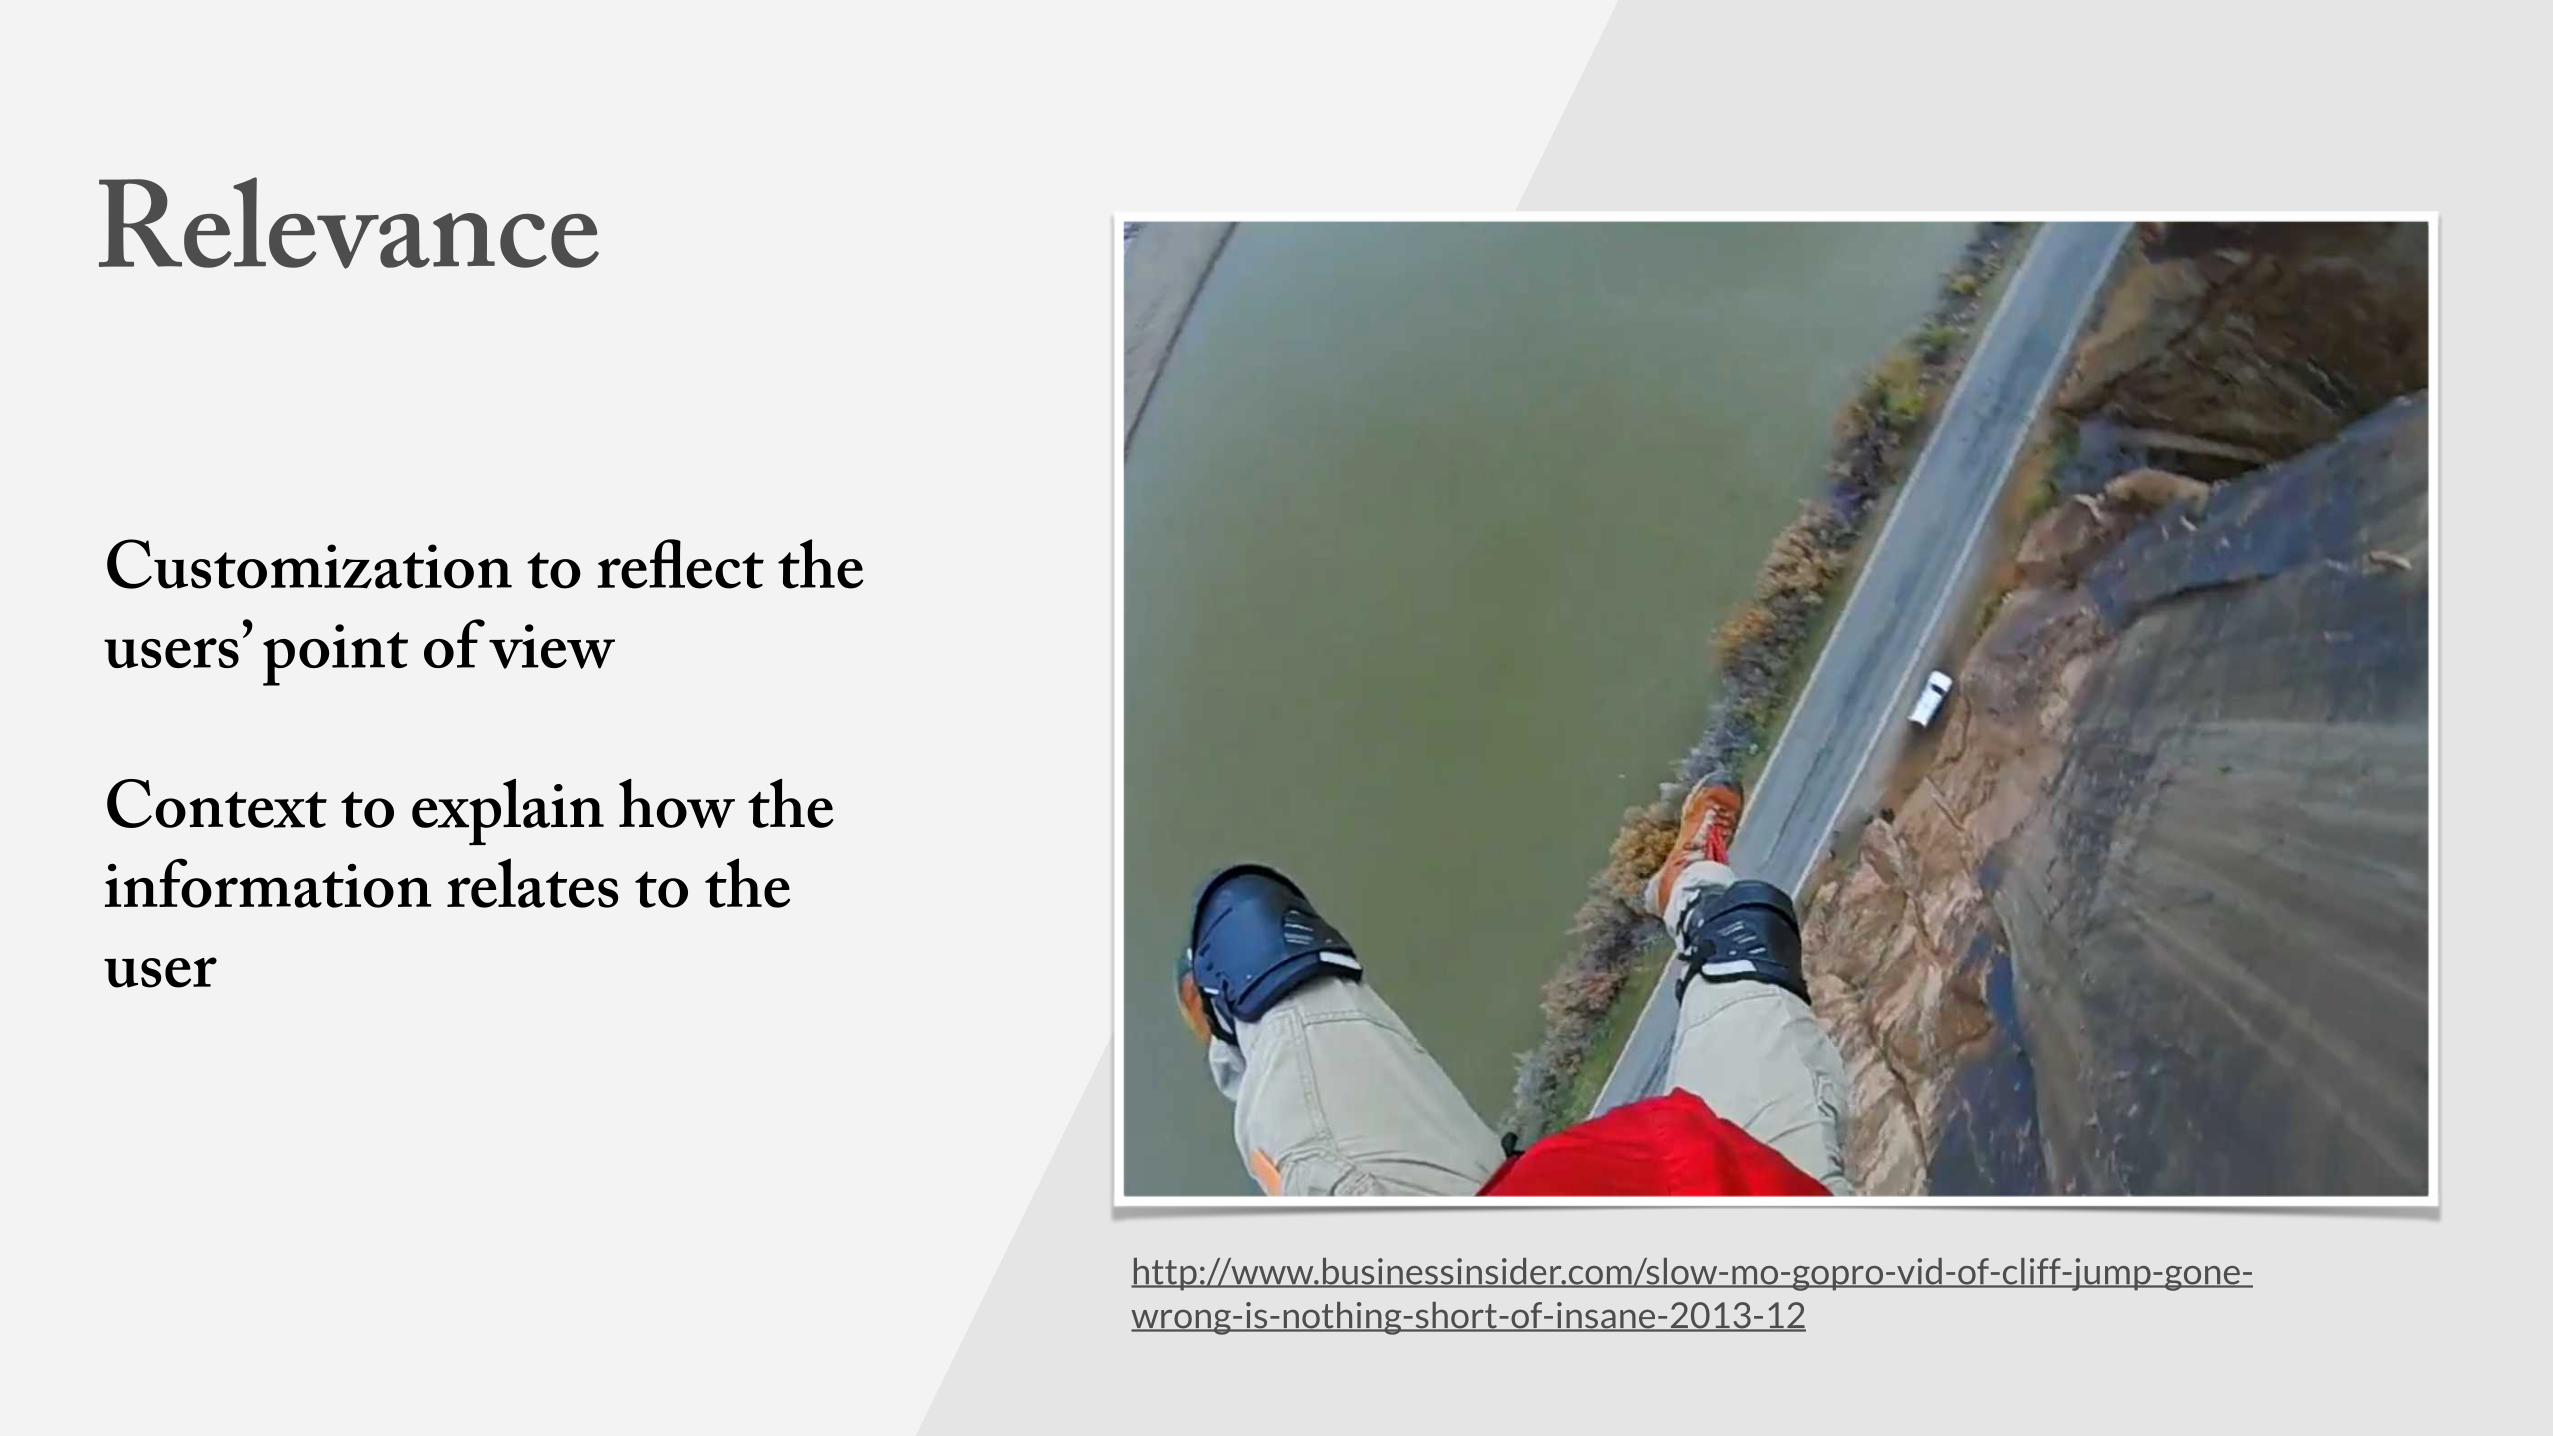
Relevance
Customization to reflect the users’ point of view
Context to explain how the information relates to the user
http://www.businessinsider.com/slow-mo-gopro-vid-of-cliff-jump-gone-wrong-is-nothing-short-of-insane-2013-12

Valuation Analyzer
http://labs.juiceanalytics.com/valuation/index.html
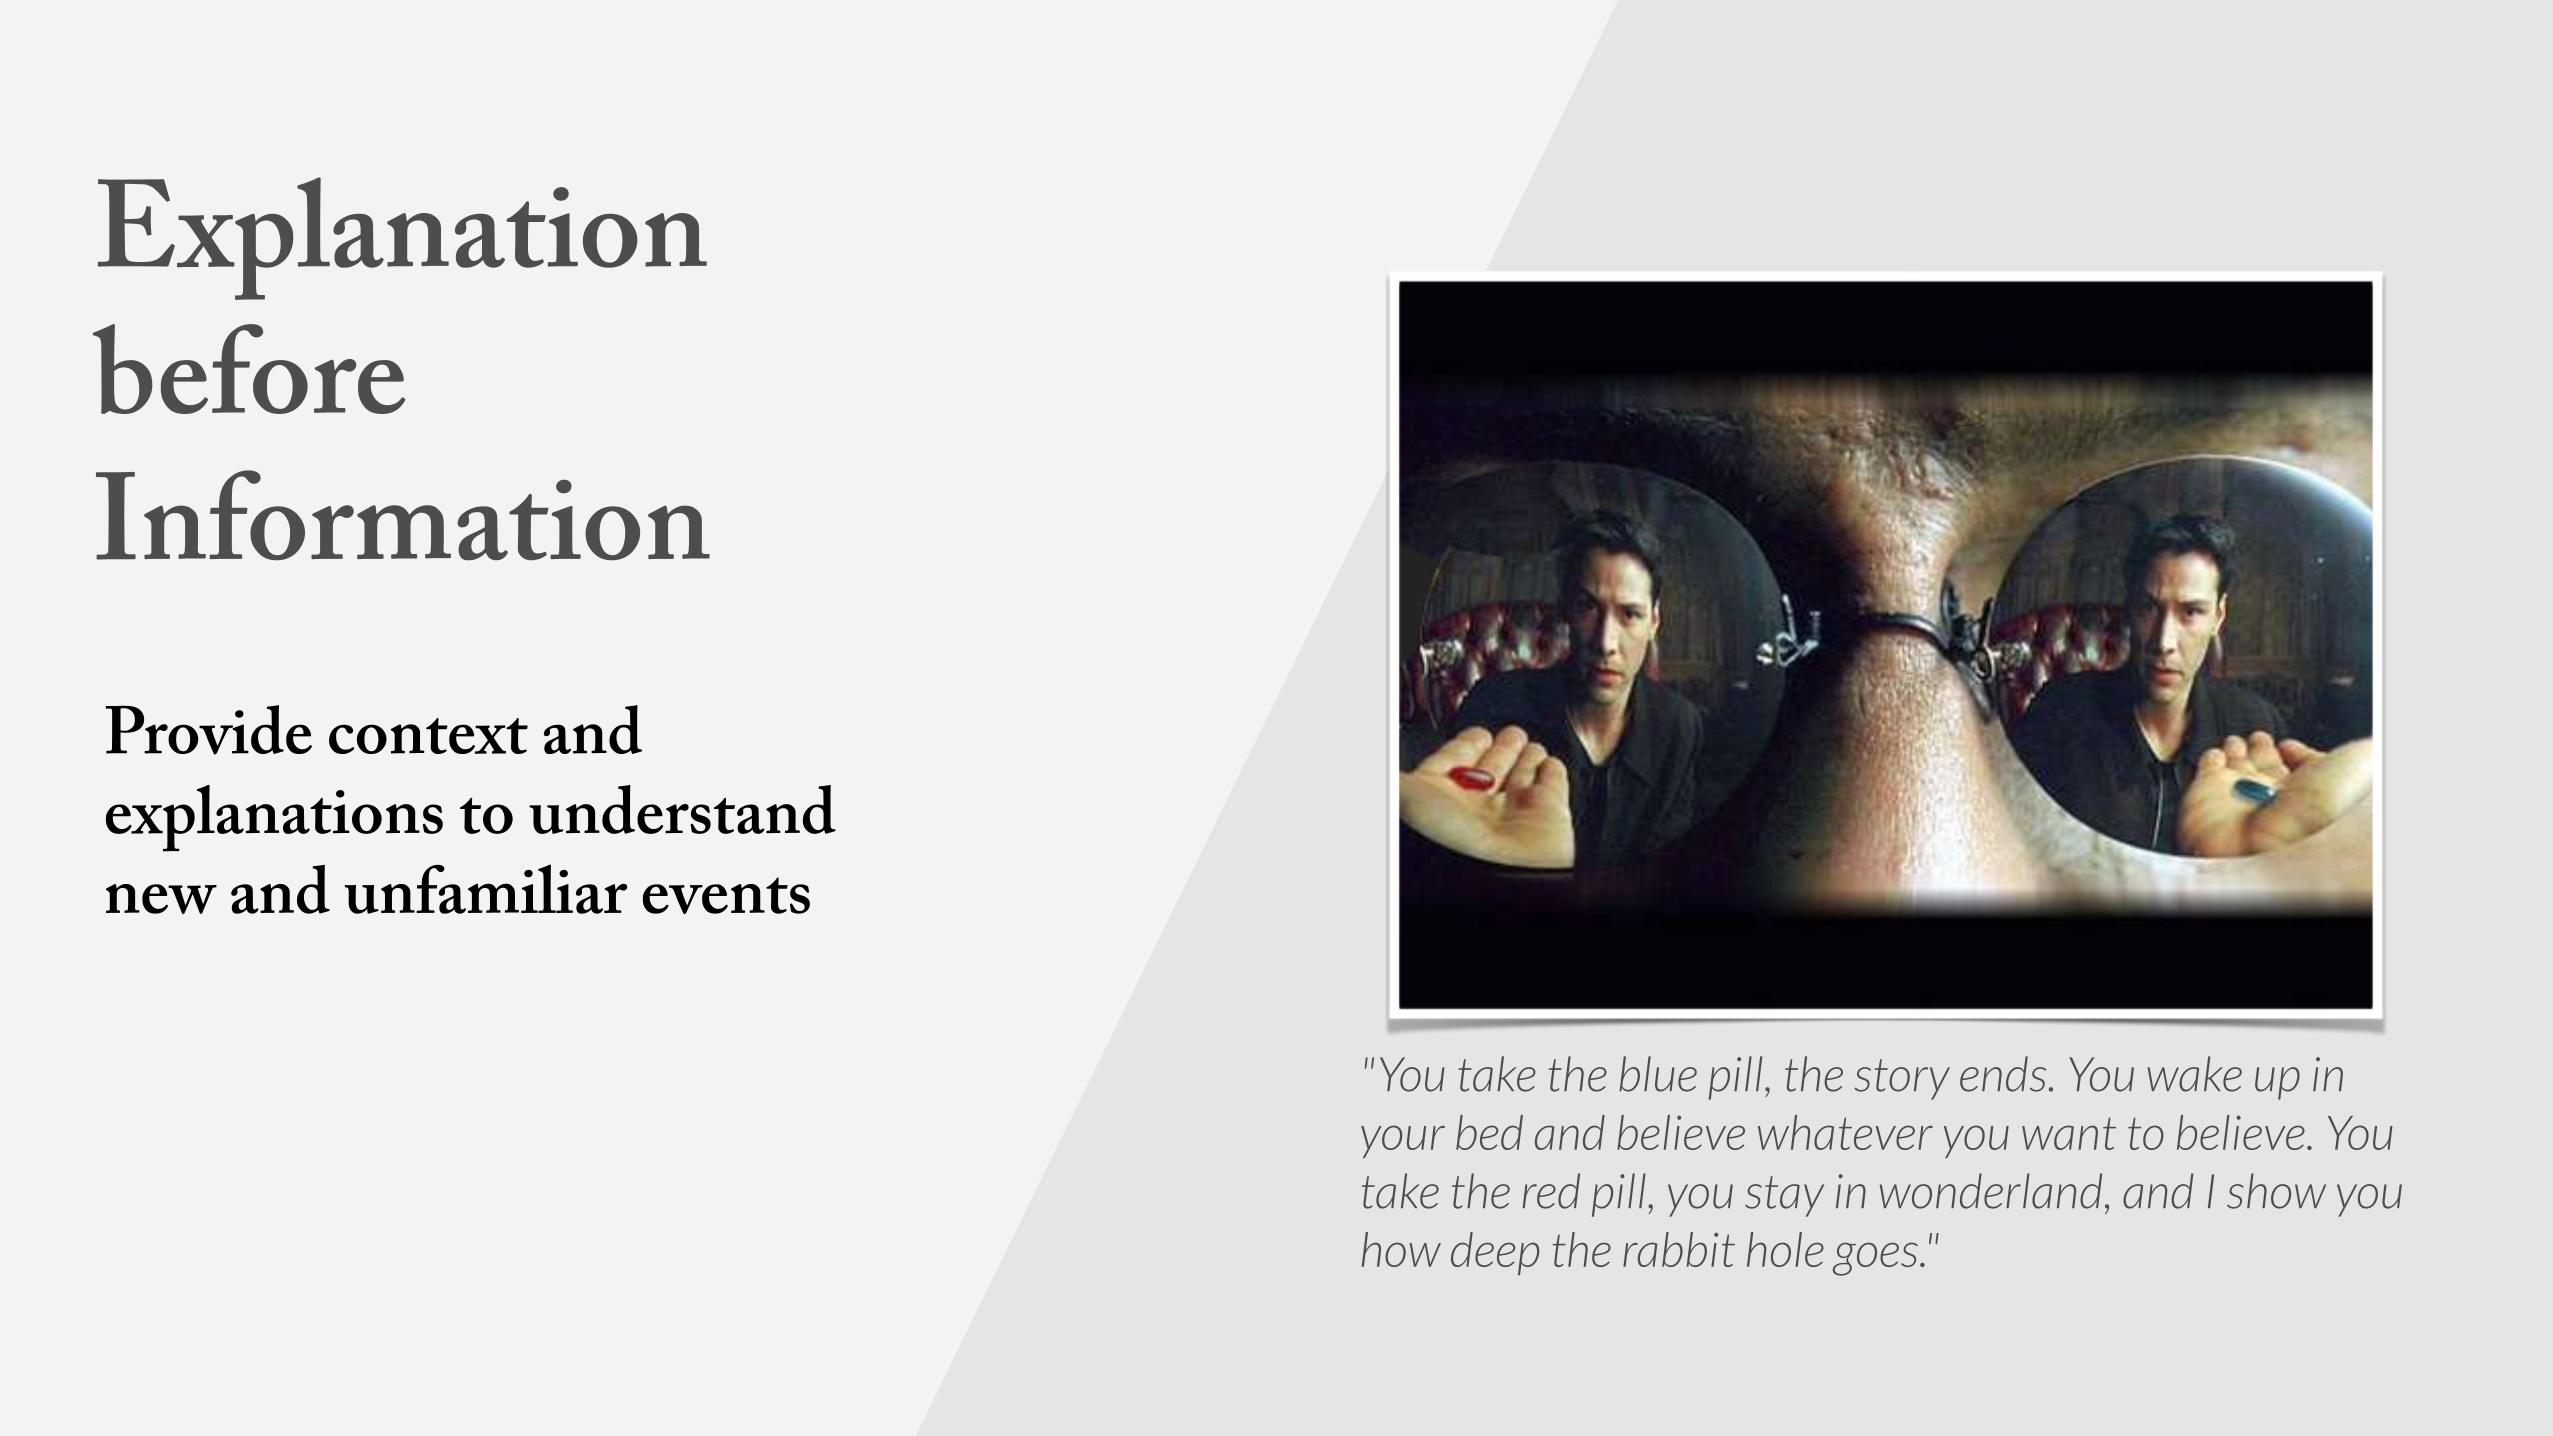
Explanation before InformationProvide context and explanations to understand new and unfamiliar events
"You take the blue pill, the story ends. You wake up in your bed and believe whatever you want to believe. You take the red pill, you stay in wonderland, and I show you how deep the rabbit hole goes."
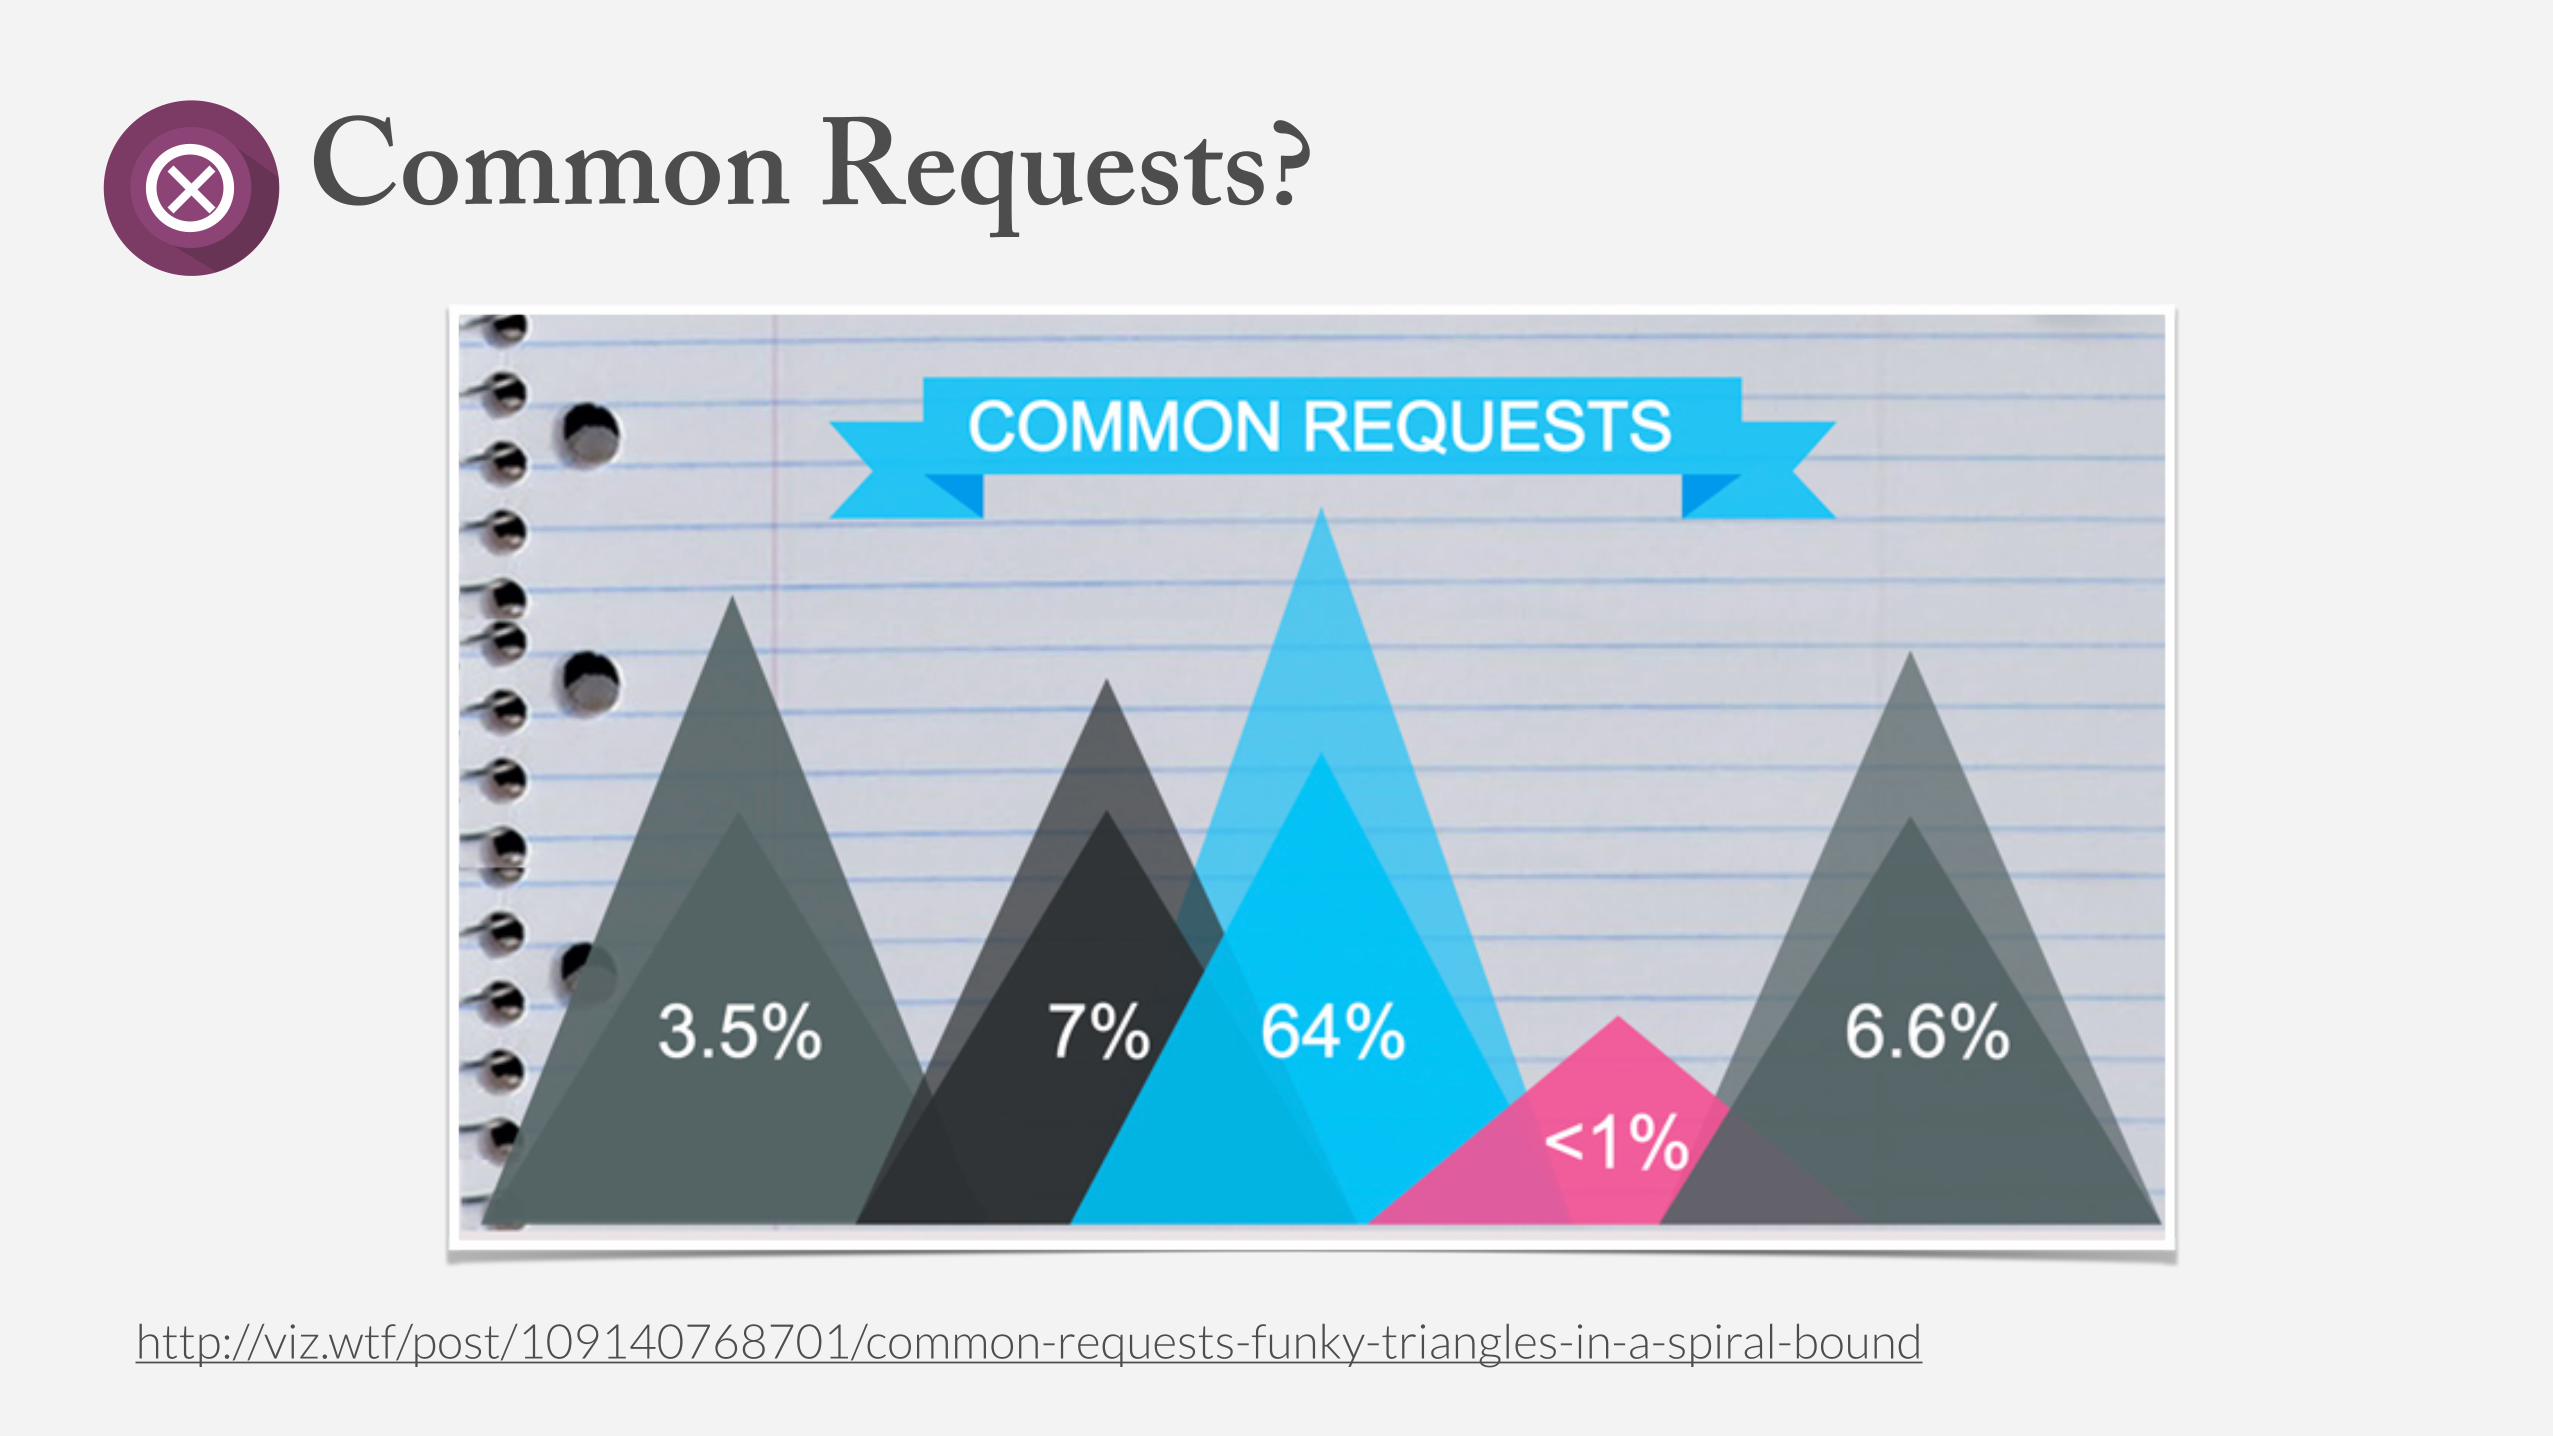
http://viz.wtf/post/109140768701/common-requests-funky-triangles-in-a-spiral-bound
Common Requests?
Technologies to capture, gather, store, and manipulate vast quantities and varieties of data
Data analysts/scientists who can find meaning in this data
Insights
Your audience who makes decisions on the data
Communication
Getting value from data
Data isn’t like your kids. You don’t have to pretend to love them equally.
“”
» Amanda Cox, New York Times

I don’t like food. I love it. If I don’t love it, I don’t swallow
“”
» Anton Ego, Food Critic, Ratatouille
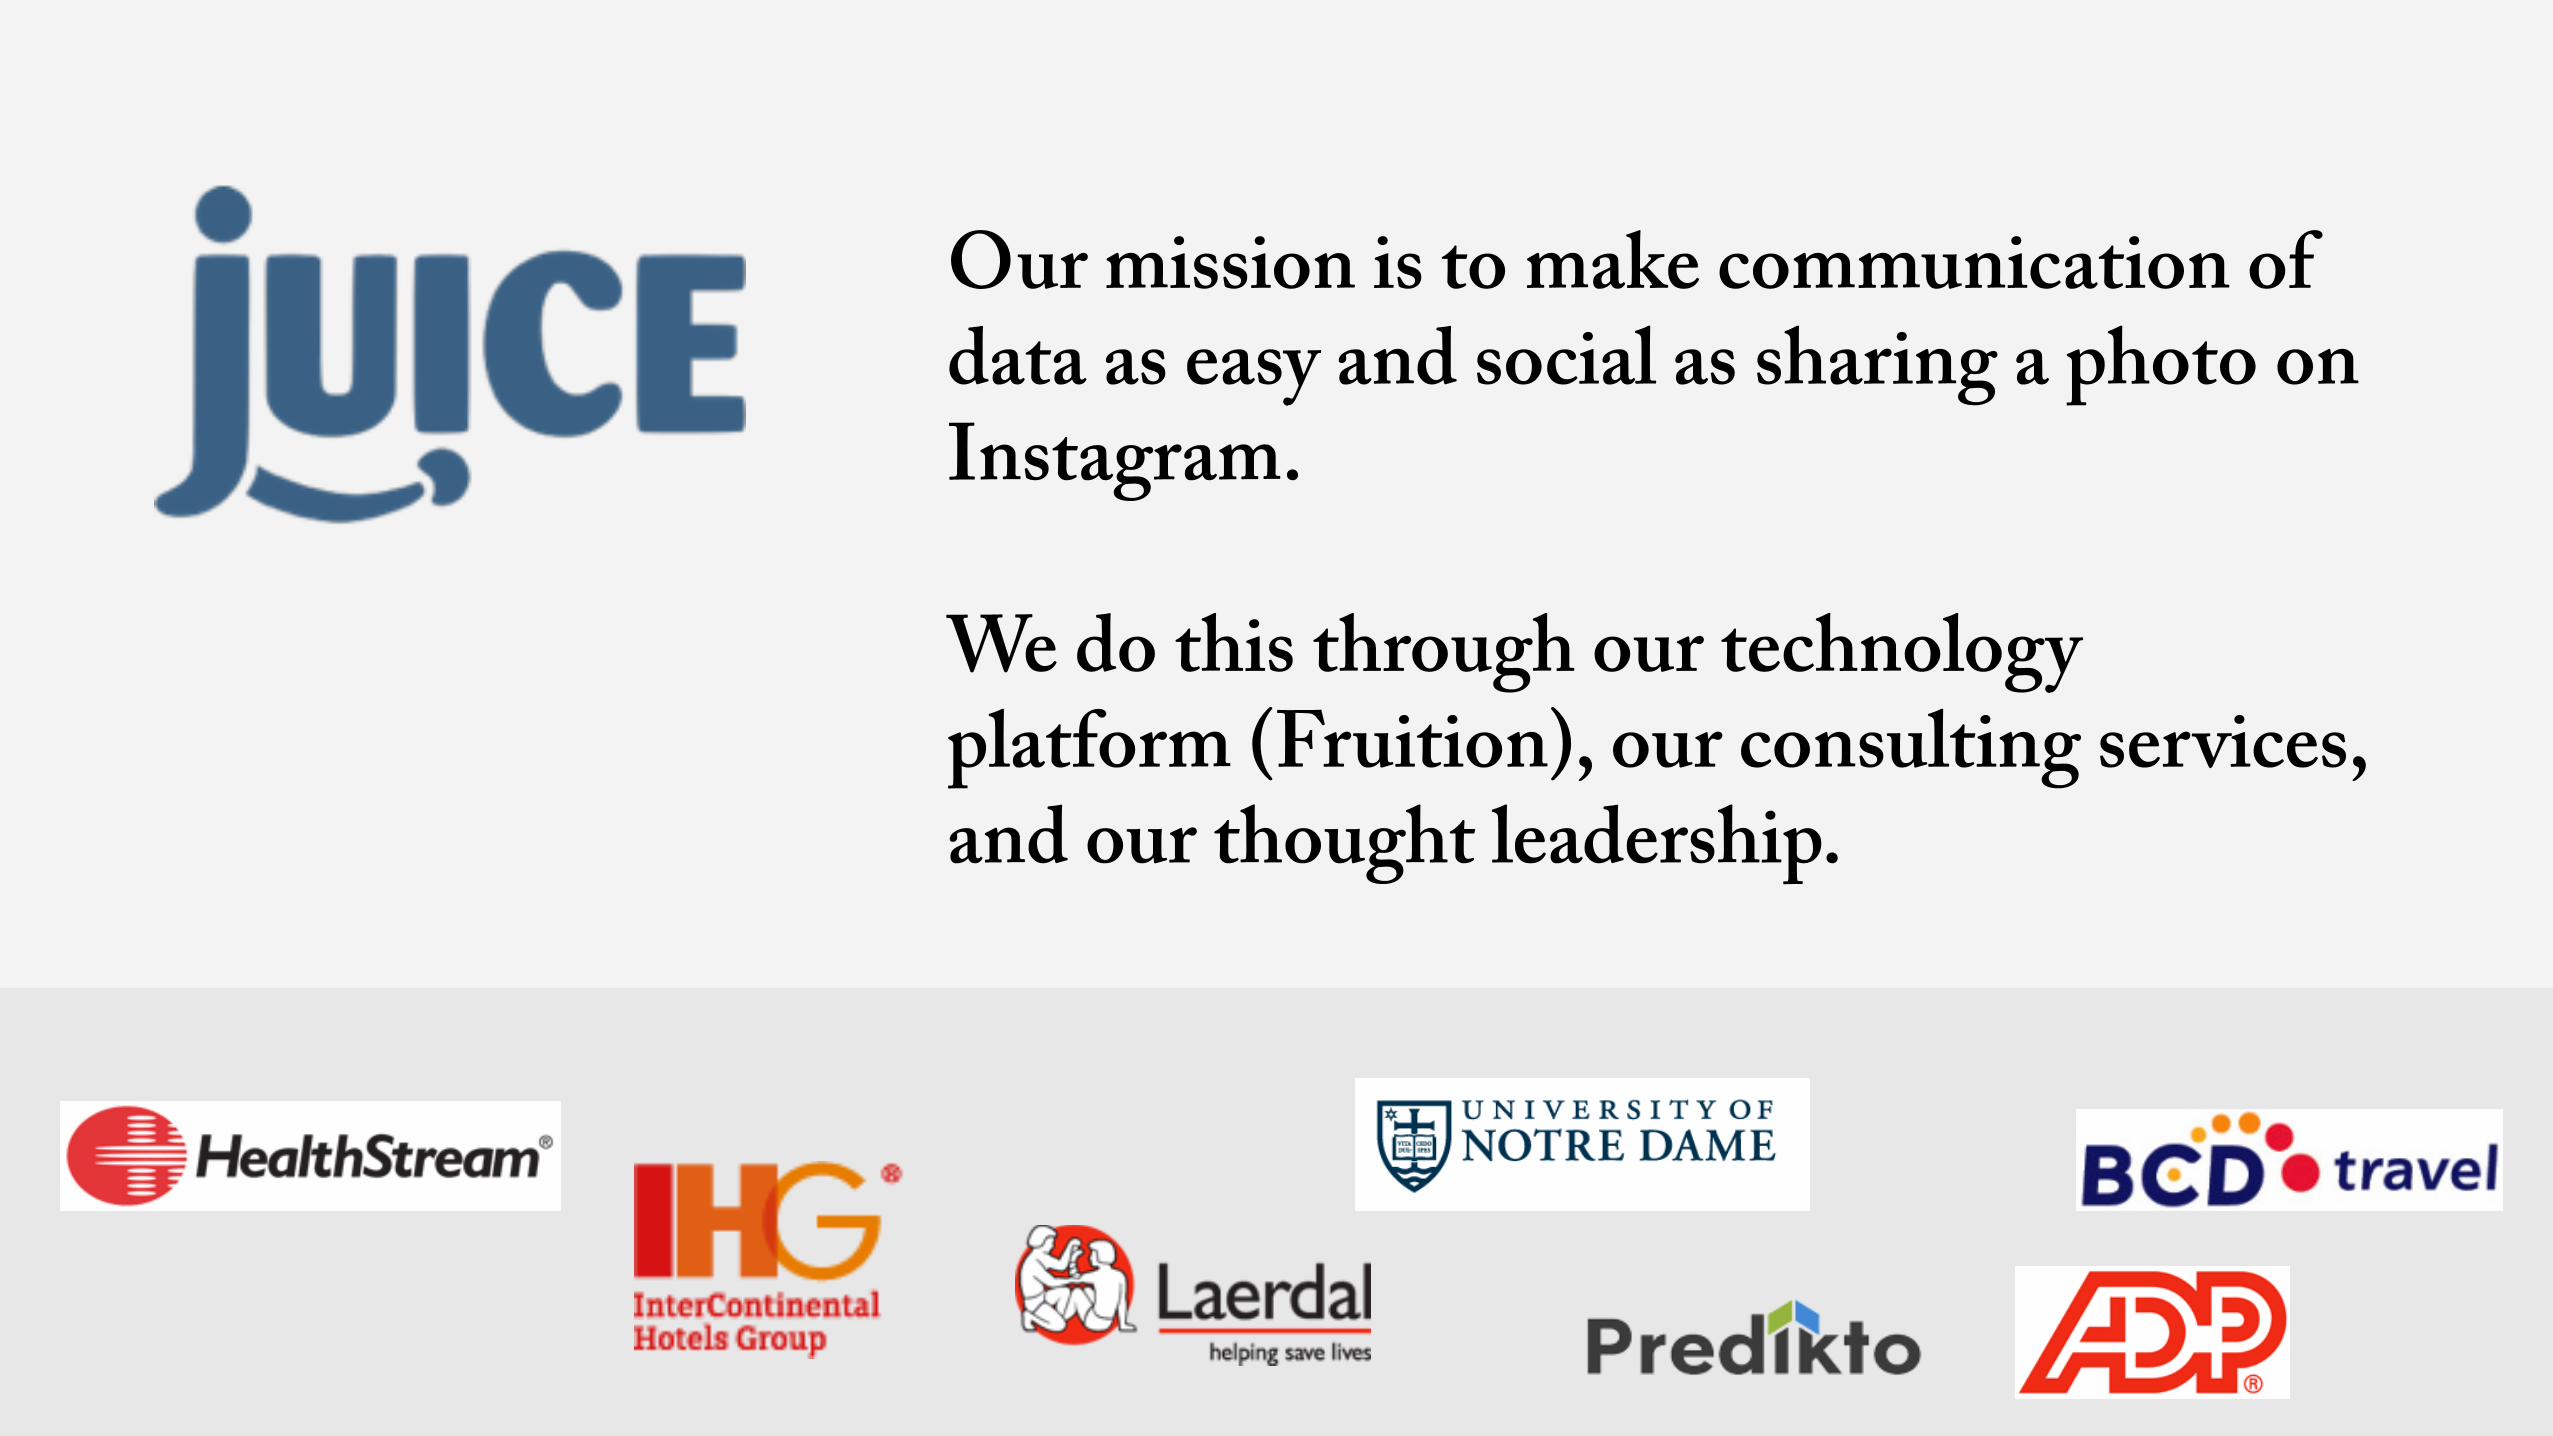
Our mission is to make communication of data as easy and social as sharing a photo on Instagram.
We do this through our technology platform (Fruition), our consulting services, and our thought leadership.
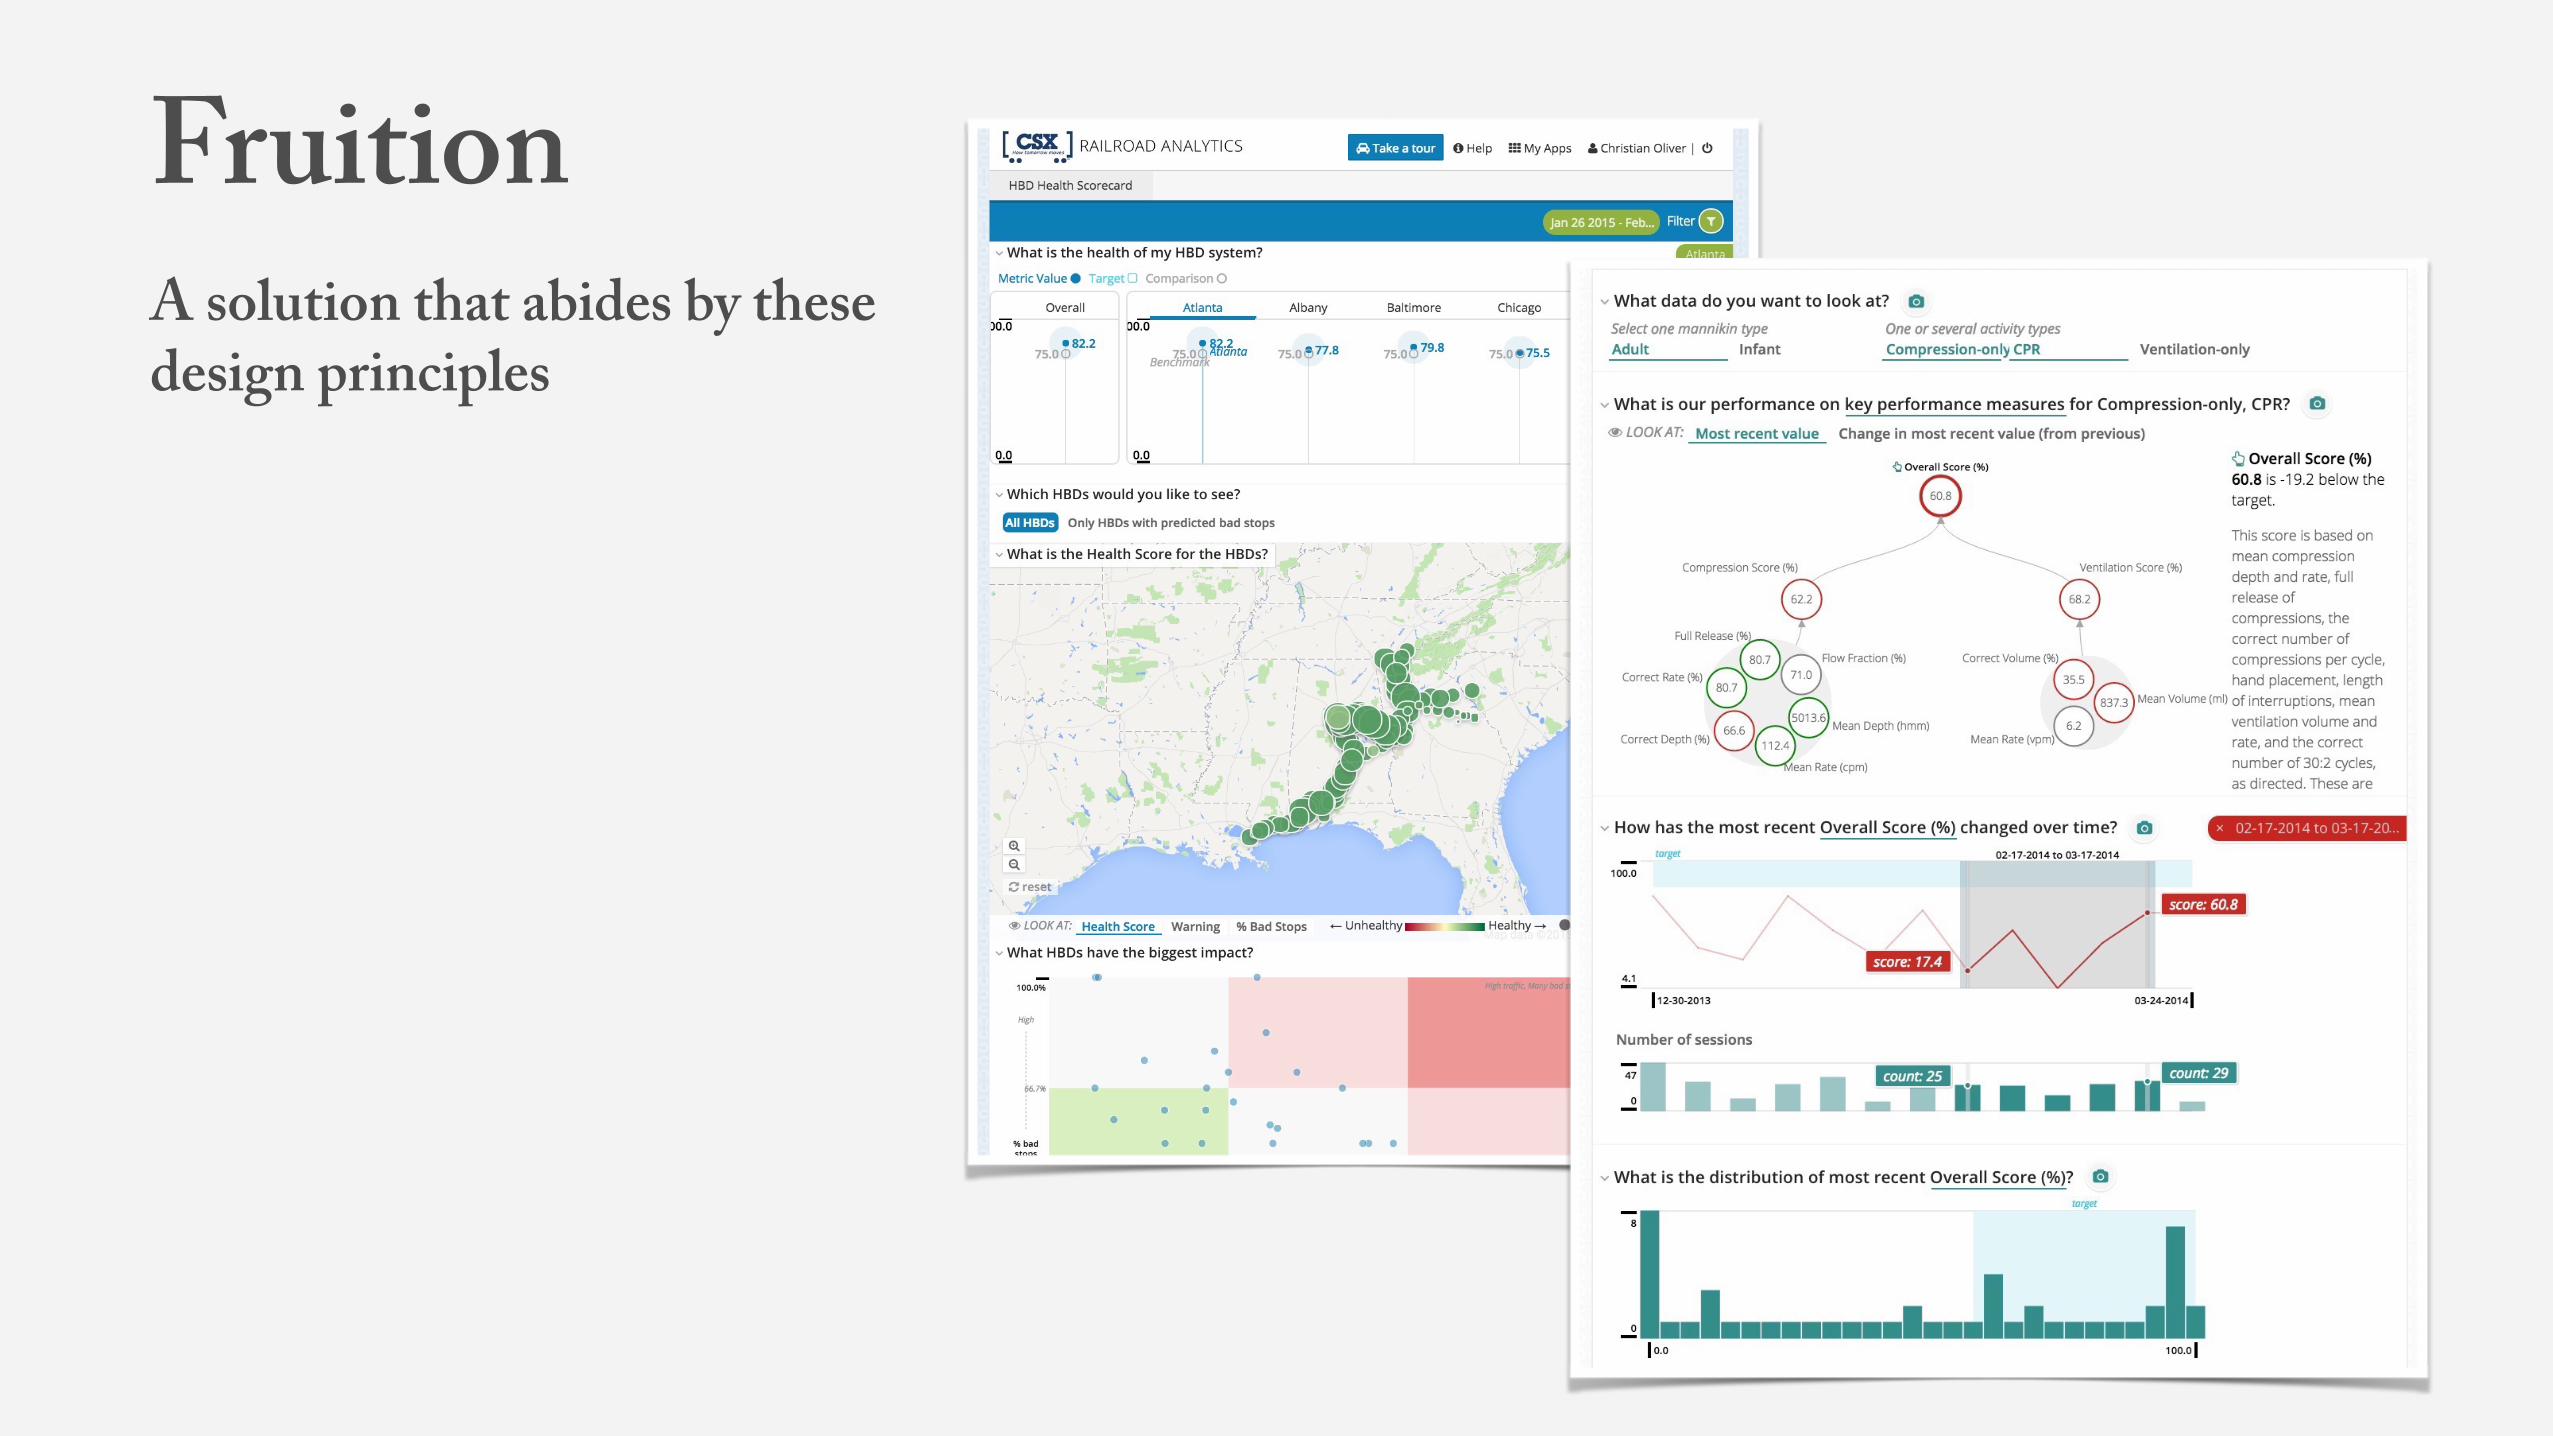
FruitionA solution that abides by these design principles
Data fluency: the ability to use the language of data to fluidly exchange and explore ideas within your organization
Recommended