VOLUME 7 NUMBER 4 Nov 2015
International Journal of Information,
Business and Management
ISSN 2076-9202 (Print)
ISSN 2218-046X (Online)
International Journal of Information, Business and Management, Vol. 7, No.4, 2015
ISSN 2076-9202
i
International Journal of Information, Business and Management
ABOUT JOURNAL
The International Journal of Information, Business and Management (IJIBM) was first published in 2009,
and is published 4 issues per year. IJIBM is indexed and abstracted in EBSCO, DOAJ, Ulrich's
Periodicals Directory, Cabell's Directory, ProQuest (ABI/INFORM Global) , ZORA (Zurich Open
Repository and Archive), IndexCopernicus, JournalSeek, New Jour, getCITED, Directory of
Research Journals Indexing, Open J-Gate, Universal Impact Factor, CiteFactor, ResearchBib,
EBSCO Open Access Journals, Scientific Indexing Service, InnoSpace - SJIF Scientific Journal
Impact Factor, The Index of Information Systems Journals, National Central Library Taiwan,
National Library of Australia. Since 2011, the IJIBM is listed and inedxed in the Cabell's Directory in
Computer Science and Business Information Systems (www.cabells.com), which is accepted in many
universities for credit towards tenure and promotion. Since 2013, the IJIBM has been included into the
EBSCO (Business Source Corporate Plus database), one of the largest full-text databases around the
world. Since 2013, the IJIBM has been included into the ProQuest (ABI/INFORM Global) list.
IJIBM is an international journal that brings together research papers on all aspects of Information,
Business and Management in all areas. The journal focuses on research that stems from academic and
industrial need and can guide the activities of managers, consultants, software developers and
researchers. It publishes accessible articles on research and industrial applications, new techniques and
development trends.
IJIBM serves the academic and professional purposes for those such as scientists, professionals,
educators, social workers and managers. It provides new methodology, techniques, models and practical
applications in various areas.
International Journal of Information, Business and Management, Vol. 7, No.4, 2015
ISSN 2076-9202
ii
International Journal of Information, Business and Management
CONTENTS
1 Publisher, Editor in Chief, Managing Editor and Editorial Board
2 REAL OPTIONS VALUATION FRAMEWORKS AND ADOPTION ISSUES
GEORGE RIGOPOULOS
3 BANK PECULIAR, MACROECONOMIC CAUSES AND PROFITABILITY OF BANKS: AN
EVIDENCE FROM PAKISTAN
ROBINA MALIK, SAJJAD AHMED BAIG, ZAHEER ABBASS, MUHAMMAD ZIA-UR-REHMAN
4 DYNAMIC LINKAGES BETWEEN BSE SENSEX AND CRUDE OIL PRICE - AN EMPIRICAL
STUDY IN INDIA
M.SRIRAM
5 FRENCH BANK MERGERS AND ACQUISITIONS AND VALUE CREATION: THE ROLE OF
STRATEGIC SIMILARITIES
HOUDA BEN SAID, ABDELFETTAH BOURI
6 BIBLIOMETRIC ANALYSIS OF THEJOURNAL OF LAW AND SOCIETY:A THIRTY ONE YEAR’S
STUDY FROM 1982-2012
NAVEEDA ILAHIA, MUHAMMAD RAFIQB, HAROON IDREESA, RAHIM JANA, IHSAN ILAHIC
7 SOCIAL MEDIA MARKETING (SMM) STRATEGIES FOR SMALL TO MEDIUM ENTERPRISES
(SMES)
SOHRAB KARIMI, HENGAMEH SADAT NAGHIBI
8 TRADE BALANCE OF PAKISTAN AND ITS DETERMINANTS
ABDUL QADIR SHAH
9 LABOUR CASUALIZATION AND TRADE UNIONISM IN NIGERIA
OLUDELE MAYOWA SOLAJA
10 LIBERALISATION AND INDIA’S MIDDLE CLASS ECONOMY: A CRITIQUE
A.SOMALINGAM, R.SHANTHAKUMARI
11 ASSESSING THE EFFECT OF DEMOGRAPHIC FACTORS ON CONFLICT SITUATIONS IN
GHANA GOVERNMENT HOSPITALS
GABRIEL DWOMOH, KOFI KWARTENG, EVELYN FREMPONG, REGINA ANIMA FREMPONG
12 THE ROLE OF BRAND CREDIBILITY ON PURCHASE INTENTION ON FAST FOOD SECTOR IN
PAKISTAN
AYESHA SHAKEEL
13 CSR Practices in Asia: Case Study of Multinational Companies in SMEs
AYESHA SHAKEEL
International Journal of Information, Business and Management, Vol. 7, No.4, 2015
ISSN 2076-9202
iii
14 FULL COMMITEMENT OF TOP MANAGEMENT IN MACEDONIAN HIGH EDUCATION
INSTITUTIONS
ELIZABETA MITREVA, NAKO TASKOV, JULIJANA SAZDOVA
15 STOCK SELECTION ABILITIES AND THE MARKET TIMING SKILLS OF FUND MANAGERS: A
STUDY WITH REFERENCE TO BANKING SECTOR FUNDS IN INDIA
VIJAYALAKSHMI SUNDAR, ARAVAZHI IRISAPPANE
16 THE IMPACT OF SERVICE QUALITY AND CUSTOMER SATISFACTION ON CUSTOMER’S
LOYALTY: EVIDENCE FROM FAST FOOD RESTAURANT OF MALAYSIA
INTAN MAIZURA ABD RASHID, MOHD JURAIJ ABD RANI, BIBI NORAINI MOHD YUSUF, MOHD SHAHIDAN SHAARI
17 IMPACT OF SUPERVISORY SUPPORT ON ORGANIZATIONAL COMMITMENT IN THE
PRESENCE OF POWER DISTANCE: A QUANTITATIVE STUDY OF TEXTILE SECTOR OF
FAISALABAD, PAKISTAN
SAJJAD RASHID KHAN, MOHSIN BASHIR, GHULAM ABBAS, NADEEM NAZIR
18 THE ROLE OF ONLINE SERVICE QUALITY IN ENHANCING CUSTOMER SATISFACTION: AN
EMPIRICAL INVESTIGATION OF PAKISTANI BANKS
AHSAN AKBAR, ABDUL MANNAN
19 IMPACT OF WORKING CAPITAL MANAGEMENT ON FIRM PROFITABILITY: AN EMPIRICAL
STUDY OF ITC LTD.
S.K.KHATIK, TITTO VARGHESE
20 THE IMPACT OF PRACTICING EARNINGS MANAGEMENT ON BORROWING COSTS IN
PHARMACEUTICAL COMPANIES LISTED IN AMMAN BURSA
IBRAHIM H. FATTOUH, NOUR ALDEEN M. GHAFEER, ABDUL AZIZ A. ABDUL RAHMAN
21 THE DETERMINANTS OF MANUFACTURER FIRM VALUE IN INDONESIA STOCK EXCHANGE
JACINTA WINARTO
International Journal of Information, Business and Management, Vol. 7, No.4, 2015
ISSN 2076-9202
iv
International Journal of Information, Business and Management
Publisher: Elite Hall Publishing House
Editor in Chief: Managing Editor:
Dr. Muzaffar Ahmed (Bangladesh)
E-mail:[email protected]
Dr. Jia Chi Tsou
Associate Professor, Department of Business Administration
China University of Technology, Taiwan
E-mail: [email protected]
Editorial Board:
Dr. Claudio De Stefano
Professor, Department of Computer Science
University of Cassino, Italy.
E-mail: [email protected]
Prof. Paolo Pietro Biancone
Professor of Financial Accounting, Faculty of Management
and Economics
University of Turin, Italy
Email: [email protected]
Dr. Michael A. Hignite, Ph.D.
Professor, Department of Computer Information Systems,
College of Business
Missouri State University, USA
Email: [email protected]
Dr. Jen Ming Chen
Professor, Institute of Industrial Management
National Central University, Taiwan
E-mail: [email protected]
Dr. Morteza Rasti Barzoki
Assistant Professor, Department of Industrial Engineering
Isfahan University of Technology, Iran
E-mail: [email protected]
Mr. Mohsen Fathollah Bayati
Department of Industrial Engineering
Iran University of Science and Technology, Iran
E-mail: [email protected]
Dr. Edgardo Palza Vargas
Telfer School of Management
University of Ottawa, Canada
Email: [email protected]
Dr. Solomon Markos
Assistant Professor, Department of Management
Arbaminch University, Ethiopia
Email: [email protected]
Mr. Olu Ojo
Lecturer, Department of Business Administration
Osun State University, Nigeria
Email: [email protected]
Dr. Mohammed-Aminu Sanda
Visiting Research Fellow, Lulea University of Technology,
Sweden
Senior Lecturer, Department of Organization and Human
Resource Management, University of Ghana, Ghana
Email: [email protected]
Dr. Khalid Zaman
Assistant Professor, Department of Management Sciences
COMSATS Institute of Information Technology, Pakistan
Email: [email protected]
Dr. Kartinah Ayupp
Deputy Dean, Economics and Business
Universiti Malaysia Sarawak, Malaysia
Email: [email protected]
Dr. Malyadri. Pacha
Principal, Government Degree College
Affiliated to Osmania University, India
Email: [email protected]
Dr. Arif Anjum
Assistant Professor, M.S.G. Arts, Science & Commerce
College, Malegaon, India
Managing Editor, International Journal of Management
Studies
Email: [email protected]
Mr. Andrew McCalister
Global Research Awardee, Royal Academy of Engineering,
University of Cambridge, UK
Email: [email protected]
Dr. Mohsin Shaikh
Professor & Head, Department of Management Studies
SKN College of Engineering, Pune, India
Email: [email protected]
Dr. M. Razaullah Khan
Associate Professor, Department of Commerce &
Management Science
Maulana Azad College, Aurangabad, India
Email: [email protected]
Mr. Kai Pan
Research Assistant & Ph.D. Candidate, Department of
Software and Information Systems
University of North Carolina (UNC Charlotte), USA
Email: [email protected]
Dr. Sundar Kumararaj
Associate Professor, Commerce Wing, Directorate of
Distance Education,
Annamalai University, Annamalai Nagar, Tamil Nadu, India
E-Mail: [email protected]
Dr. Mohammad Alawin
Associate Professor, Business Economics Department
The University of Jordan, Amman, Jordan
E-mail: [email protected]
Mr. Dinh Tran Ngoc Huy
Visiting lecturer, PhD candidate , Banking University HCMC,
Vietnam
Email: [email protected]
Dr. Seema Varshney
Assistant Professor, Waljat college of applied sciences
Muscat, Oman
E-mail: [email protected]
Web: http://ijibm.elitehall.com
ISSN 2076-9202 (Print) ISSN 2218-046X (Online)
International Journal of Information, Business and Management, Vol. 7, No.4, 2015
ISSN 2076-9202
1
Real Options valuation frameworks and adoption issues
Dr. G. Rigopoulos
Department of Informatics,
Technological Educational Institute (TEI) of Athens
Athens, Greece
E-mail: [email protected]
Abstract
This paper reviews existing literature on real options valuation frameworks and refers to their main
characteristics. It begins with basic overview on real options and proceeds to the valuation methods that
have been proposed so far. Its main objective is to depict the plurality of the approaches which along with
the complexity of the methods leads to increasing sophistication and thus reduces intuition among
practitioners. It also highlights some of the criticism found in relevant literature against real options and
as conclusion discusses possible remedies to assist real options’ adoption.
Keywords: Real options; valuation modes
Overview Overview Overview Overview
Financial options theory led to the initiation of real option theory as similarities were found between the
two and theorists built real option models mostly upon financial options models. Myers was the one that
introduced the term real options back in 1977 as an opportunity to buy real assets and pointed out the
similarities between the financial options and real options (Myers, 1977). He introduced the concept that
investment opportunities can be viewed as call options on real assets. Alternative definitions of real
options are found in various authors since then, depending on the viewpoint of each author, however the
common factor is that a real option models the future decision opportunities as flexibility. Following
Myers, real options approach evolved and was further used for the study of investment under uncertainty
by various authors. For the next decades the development of this new field resulted into a substantial body
of literature which span across many domains in theory and practice. However, only after the influential
contributions of Dixit and Pindyck, Tirgeorgis, and Amram and Kulatilaka, who actually established the
initial theoretical framework for the application of real option theory and pricing of real options the field
was accessible to the financial practitioners and the public (Dixit and Pindyck, 1977; Tirgeorgis, 1996;
Amram and Kulatilaka, 1998; Copeland and Antikarov, 2003).
Following this, large corporations included the real options methodological framework to their investment
valuation techniques resulting thus to further development of the domain (Leslie and Michaels, 1997;
Mathews and Nakamoto, 2004; He, 2007). Theorists were also at the same time promoting the theoretical
International Journal of Information, Business and Management, Vol. 7, No.4, 2015
ISSN 2076-9202
2
superiority of real options theory against DCF methods for investment valuation and considered the
approach as the tool to replace legacy DCF methods for capital planning and asset valuation. Real options
applications can be found in a variety of sectors and settings. Research publications in real options
applications are numerous and span across many diverse domains. To name a few, we can identify
publications in the fields of strategic investment decisions, energy, competition and business strategy, real
estate, environment, natural resources, production, research and development, advertising, corporate
behavior, and mergers and acquisition (Lander and Pinches, 1998).
In the following years the adoption from theorists was quite extended resulting in a variety of approaches,
while adoption in the field of practice was not so remarkable. From a more contemporary point of view it
seems that the penetration of real options does not follow the theoretical hype. This paper reviews the
literature on real options valuation approaches along with some basic overview on real options. Its main
objective is to depict the plurality of the approaches which along with the complexity of the methods
leads to increasing sophistication and thus reduces intuition among practitioners. It also highlights some
of the criticism found in relevant literature against real options and discusses some remedies to assist their
adoption.
Real options and finReal options and finReal options and finReal options and financial options ancial options ancial options ancial options
In its roots real options analysis is the application of financial options theory to the evaluation of real
assets (Trigeorgis, 2005; Miller and Park, 2002). A financial option is a security whose value changes
along with the market value of some underlying assets, while a real option is a kind of derivative on a
project or investment contingent upon time, uncertainty, costs and yield. A financial option provides the
holder with the right, but not the obligation, to buy or sell a specified quantity of an asset at a fixed price
(exercise price), at the expiration date of the option or before. In case the holder does not want to exercise
the option, then it expires. The underlying asset can be stocks, indices, currencies, commodities, future
contracts or debt instruments. On the other hand, a real option is the right, but not the obligation, to take
an action on a project or an asset (expand, defer, contract, abandon etc.) at a predetermined cost (exercise
price), for a predetermined period of time. A Real option models and expresses in general the flexibility
value that exists for a real asset or investment project.
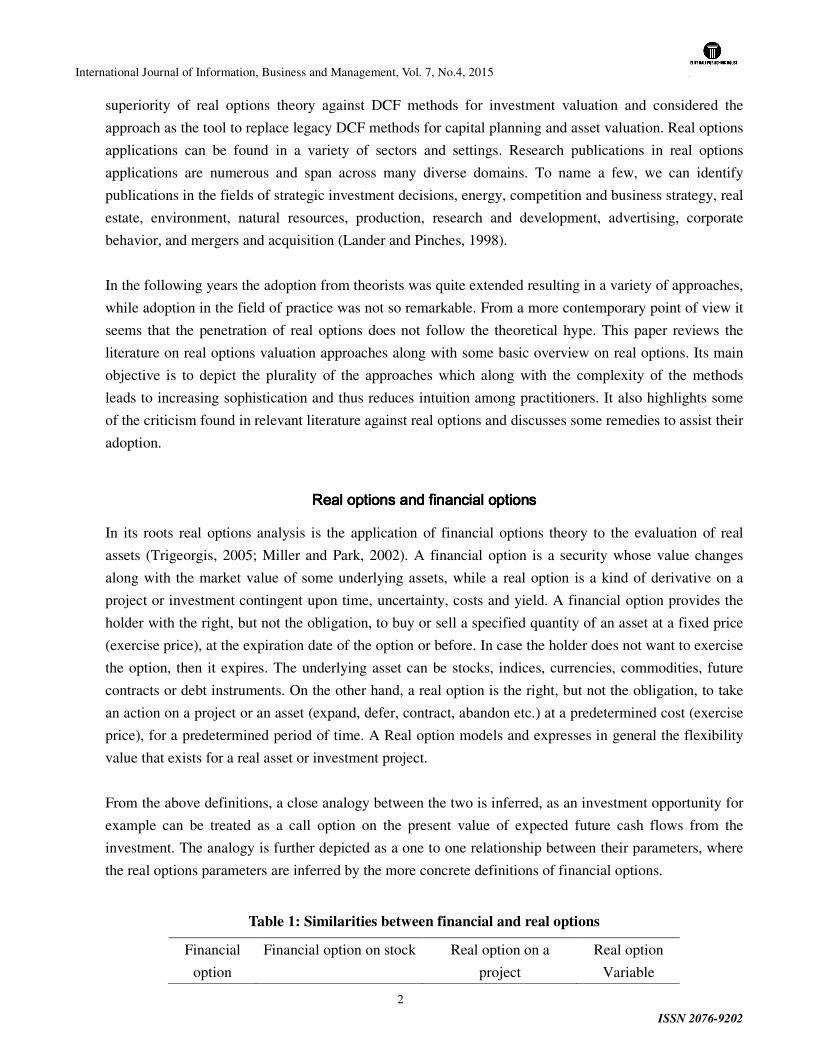
From the above definitions, a close analogy between the two is inferred, as an investment opportunity for
example can be treated as a call option on the present value of expected future cash flows from the
investment. The analogy is further depicted as a one to one relationship between their parameters, where
the real options parameters are inferred by the more concrete definitions of financial options.
Table 1: Similarities between financial and real options
Financial
option
Financial option on stock Real option on a
project
Real option
Variable
International Journal of Information, Business and Management, Vol. 7, No.4, 2015
ISSN 2076-9202
3
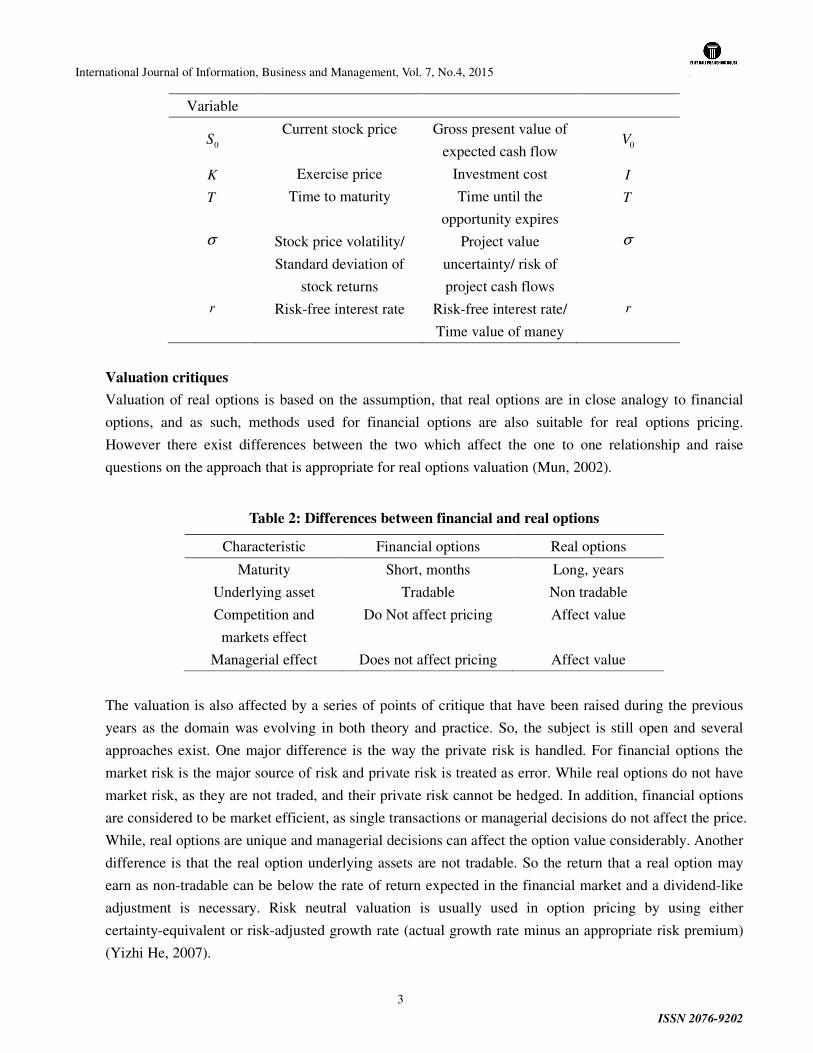
Variable
0S Current stock price Gross present value of
expected cash flow 0V
K Exercise price Investment cost I
T Time to maturity Time until the
opportunity expires
T
σ Stock price volatility/
Standard deviation of
stock returns
Project value
uncertainty/ risk of
project cash flows
σ
r Risk-free interest rate Risk-free interest rate/
Time value of maney
r
Valuation critiques
Valuation of real options is based on the assumption, that real options are in close analogy to financial
options, and as such, methods used for financial options are also suitable for real options pricing.
However there exist differences between the two which affect the one to one relationship and raise
questions on the approach that is appropriate for real options valuation (Mun, 2002).
Table 2: Differences between financial and real options
Characteristic Financial options Real options
Maturity Short, months Long, years
Underlying asset Tradable Non tradable
Competition and
markets effect
Do Not affect pricing Affect value
Managerial effect Does not affect pricing Affect value
The valuation is also affected by a series of points of critique that have been raised during the previous
years as the domain was evolving in both theory and practice. So, the subject is still open and several
approaches exist. One major difference is the way the private risk is handled. For financial options the
market risk is the major source of risk and private risk is treated as error. While real options do not have
market risk, as they are not traded, and their private risk cannot be hedged. In addition, financial options
are considered to be market efficient, as single transactions or managerial decisions do not affect the price.
While, real options are unique and managerial decisions can affect the option value considerably. Another
difference is that the real option underlying assets are not tradable. So the return that a real option may
earn as non-tradable can be below the rate of return expected in the financial market and a dividend-like
adjustment is necessary. Risk neutral valuation is usually used in option pricing by using either
certainty-equivalent or risk-adjusted growth rate (actual growth rate minus an appropriate risk premium)
(Yizhi He, 2007).
International Journal of Information, Business and Management, Vol. 7, No.4, 2015
ISSN 2076-9202
4
In addition, according to Brealey and Myers the covariance between real assets and financial assets has
not been investigated in the way that has been done for financial assets and overall market so it is almost
impossible to find a portfolio to diversify the risk of a project (Brealey and Myers 2000). Another fact is
that many real options include more than one risk factor, unlike the Black and Scholes model, and many
uncertainties do not follow Brownian motion with normal distribution or cannot be modeled in a
simplified way. In addition, real investments can be considered as a nested American option which is
harder to valuate by classic approach (Cortazar, 2001). Another issue is that the efficient market
hypothesis is not valid for many investment projects since many factors are considered, such as
socioeconomic, political etc., which are not aligned with the hypothesis that all investors aim to maximize
their economic utility. For all the above reasons valuation of real options is still subject to debates
(Borison, 2005).
Valuation frameworks Valuation frameworks Valuation frameworks Valuation frameworks
The methods that are used for real options valuation can be grouped in various categories and
subcategories according to different criteria. The reason that the methods are of importance is that as
Borison analyzes there exist different assumptions for every method which leads to different results and
lead to different managerial decision thus. So it is imperative to have an understanding of underlying
principles in order to apply the method and get valid results.
Borison classifies real options approaches in terms of assumptions, mechanics and applicability, in the
following categories, which are also related to the method employed to price the real option (Borison,
2005):
1. The classic approach. It assumes that the capital market is complete and absent of arbitrage
opportunities and there exists an identical twin asset or portfolio for every real asset under evaluation
that perfectly tracks the underlying asset. This approach is based on the arguments and the
assumptions, underlying the Black-Scholes model. In its practical application, it makes explicit use of
the no-arbitrage argument and applies the Black-Shores formula directly. The input data source is
assumed to be the capital market.
2. The subjective approach. In overall, this approach relies on the classic assumptions and the
Black-Sholes model as well, and it assumes, similar to the classic approach, that the capital market is
complete. However the input data are subjective estimations. The main argument supporting the
approach is that even if Black-Scholes assumptions hold, there exist some difficulties to implement it,
such as the ability of the investors to continually adjust their portfolios, tradability and so forth. So
even if the Black-Scholes still holds, the numbers are less reliable. So, it relies on subjective judgment
for input, as opposed to the classic approach where data come from traded markets. This makes it an
inconsistent approach, and limits it to qualitative result (Hubalek and Schachermyer, 1999).
3. The Market Asset Disclaimer (MAD) approach. It was introduced as a proposal against the flaws of
traditional Black-Scholes methodology and its assumptions, especially the fact that in many cases real
International Journal of Information, Business and Management, Vol. 7, No.4, 2015
ISSN 2076-9202
5
assets and consequently real options are not traded so the no-arbitrage arguments do not provide any
satisfactory answer about the value. This approach assumes that the capital market is not complete
with respect to corporate investments. It relies on the estimate value of the asset without flexibility as
the twin asset for the purpose of calculating the option value of the flexibility. The argument
advocating the method is that best-correlated quantity with the real asset is the real asset itself,
therefore for the real asset its NPV value is the best-unbiased estimator of the market value if the asset
were traded. While DCF approach relies on valuating a twin security with the same beta.
Data is derived from traded markets if they are available and subjective judgment if not. In overall,
this method is relied on subjective input data, the only objective input is the market-extracted cost of
capital. Proponents of this approach justified this step explicitly: the same, weaker assumptions that
are used to justify the applications of DCF can be used to justify the applications of option pricing to
flexible corporate investment (Copeland and Antikarov, 2001). Copeland and Antikarov (2001)
suggest a special form of stochastic process for asset prices, namely a Geometric Brownian motion
(Georgiopoulos, 2004).
4. The revised classic approach. This method assumes that the capital market is partially complete and
acknowledges the Black-Scholes assumptions’ difficulties, especially that there isn’t a replicating
portfolio, but segregates real options as Amram and Kulatilaka do. The general approach for this
method is that there are two types of risks, namely public risks, that can be hedged and private risks
unable to be hedged.
For investments that have market equivalents, it applies the classic approach using market data; for
investments that do not have market equivalents, it applies decision analysis using subjective
judgment. So, options dominated by private risks are considered as strategic options and the real
option framework is suitable for market-dominated risks as Black-Scholes approach is applicable. In
the case of strategic options, where no replicating portfolio can be established, dynamic programming
is more suitable, since it is imperative to make subjective assessments concerning probability
distributions.
The method approach is to identify which kind of risks dominates. If private risks dominate, decision
analysis with discounted rate the weight-adjusted cost of capital (WACC) is applied, reflecting
shareholder’s access to investments of comparable risk. If market risks dominate, Black-Scholes
approach is applied. The data for the two uncertainties are based on subjective assessment. While
Borison (2005) unlike Amram and Kulatilaka (1998) considers that quantity is a non-market triggered
risk, thus he suggests a decision tree analysis.
5. The integrated approach. The integrated method combines traditional financial options techniques
and decision analysis. The main idea is that private and market dominated risks should be
incorporated in the real options framework. The integrated approach considers private risk as a factor
for decision-making and each investment has different risk profiles. This approach recognizes that
firms have a variety of shareholders and managers with aligned beliefs and preferences and the idea is
to maximize the utility of managers and owners. This alignment can happen only in complete markets
where investment decisions can be made solely on the basis of market information. While in
International Journal of Information, Business and Management, Vol. 7, No.4, 2015
ISSN 2076-9202
6
incomplete markets, individual assessments of risk and individual preferences are important. It also
assumes that the capital market is partially complete. However, it uses capital market data for market
risk and subjective judgment for private risk in an integrated model.
The above approaches differ in the way they handle private risk (Nga-Na, 2007). In the classic approach
the private risk is ignored and real options are treated like financial options that all risks can be diversified
away by constructing a hypothetical traded twin asset or portfolio. In the subjective approach private risk
is handled by substituting market data by subjective assessment. The revised classic approach admits the
limitations of direct application of option pricing theory to real options and classifies investments into
those dominated by market and private risk. Then the option pricing model is applied only to investments
dominated by market risk, and decision analysis is applied to those dominated by private risk. Although it
is better than the previous, it distinguishes investments into two classes and implements two totally
different approaches (Nga-Na, 2007).
The MAD approach, does not rely on the existence of a traded replicating portfolio. It admits the
difficulty of handling private risk and uses project value without flexibility as the twin security, as if it
were traded in the financial market. To some extent the best correlation with the project is the project
itself (Copeland and Antikarov, 2005). Trigeorgis (1996) also argues that the assumptions underlying the
DCF approach are traded assets of comparable risk (same beta), and MAD assumptions are no stronger
than those of DCF. Contrary to Borison’s understanding, Copeland and Antikarov (2005) clarified that
the MAD approach does not blindly use all subjective assumptions. The integrated approach, similar to
MAD, uses traded market data when they are available and subjective assumptions only when market
estimates are not possible. The MAD approach and the integrated approach are considered to treat private
risk in the same way with technical differences. MAD approach relies on simulations to evaluate project
volatility, and attempts to combine all risks into one variable, whenever possible. While, the integrated
approach relies on utility functions and models market risks and private risks explicitly and separately
(Nga-Na, 2007).
From the above it is obvious that there exist many approaches that determine the way real options can be
valuated and each one affects the selection of the pricing technique that will be used. The selection of the
approach depends on project or investment characteristics on a case-by-case basis. From a historical
perspective, we can see that early approaches on real options were based on the classical approach and its
assumptions and were actually direct implementations of financial options pricing theory to real options.
After this early period, we notice a shift of the leading authors towards different approaches (Zhang,
2010). This phase was followed by critics and discussions on the suitability of classical approach and
initiated the effort towards developing new methods for real options valuation (Borison,2005; Copeland
and Anticarov, 2005). Amram and Kulatilaka and Brealey and Myers among others presented discussions
on the applicability of the classic approach to price real options (Amram and Kulatilaka, 1998; Brealey
and Myers 2000). This lead to the MAD approach which is based on subjective assessment and latest
International Journal of Information, Business and Management, Vol. 7, No.4, 2015
ISSN 2076-9202
7
theoretical discussions on real options theory and critics that empirical evidence do not verify assumption
that a replicated portfolio of financial assets really exists (Borison, 2005; Copeland, 2005; Trigeorgis,
1996).
From the above, it is obvious that valuation approaches is still a matter of debate and no approach is
considered as the dominating method, as the nature of investment projects is very unique (Zhang, 2010).
Amram and Kulatilaka, following a similar approach, propose to classify the methods in two broad
categories based on the risk they face, market or private, where market risk can be hedged and private
cannot (Amram and Kulatilaka, 1999). So if the risk is considered as market risk, then market data from a
market traded replicating portfolio are used and the real option value is the no abitrage value of
investment (Luehrman, 1997). While, if the risk is considered as private, which is not closely correlated
to any investment in capital markets, then real option is valuated using subjective judgment without any
track by traded securities (Trigorgis, 1996; Amram and Kulatilaka, 1999).
In the case where market risk dominates, the analogy between real options and financial options is
considered as valid, replicating portfolios can be easily constructed, real options variables are constructed
in analogy to financial options and financial option valuation methods, such as Black Scholes and
binomial lattices, are employed (Copeland and Antikarov, 2001). Although in this case early works
demonstrate that methods developed for financial options can be ported to real options valuation (Cobb
and Charnes, 2007), it is argued that there exist many practical differences between them usch as the
existence of private risk. In the case where private risk dominates, which is the case for the majority of
projects, there is no corresponding market replicating portfolio and new methods are needed, as presented
before (Borison, 2005). The real options parameters which map to the corresponding financial ones
however needs to be addressed again as the original mapping may be problematic (Luehrman, 1997).
While the financial valuation methods which are based on the no arbitrage theory are well justified, their
assumptions are not so realistic and not appropriate for project valuation, so they usually run into
difficulties (Zhang, 2010).
This is the reason for the development of the alternative MAD approach, which is based on the
assumption that the present value of the project without options is the best unbiased estimator of the
market value of the project (Copeland and Antikarov, 2001). This approach allows greater flexibility in
the application of real options when DCF used to be followed (Dixit and Pindick, 1994). The MAD
approach usually employs Monte Carlo simulations which compute many different possible realizations
of uncertainty and along each path the options are exercised and their value is computed (Zhang, 2010).
Criticism Criticism Criticism Criticism
Findings from empirical surveys reveal that real options are not so popular among managers and firms in
International Journal of Information, Business and Management, Vol. 7, No.4, 2015
ISSN 2076-9202
8
capital budgeting decisions while relative old methods are still used. Opponents argue against real options
at several points, where they identify flaws in the theory and application. Although, it is acceptable that a
real options framework can model the investment uncertainty and flexibility it is however not clear how
its application can be beneficial. In this section we review the most important theoretical objections
towards the application of real options relevant to this study with references to relevant literature.
Underlying principles
As mentioned earlier the real options theory is in close relationship with financial options theory and as
such it is based on the same assumptions. This is however, a subject of criticism, as there is doubt that the
no-arbitrage pricing approach is valid for real assets too due to the non-tradable nature of real assets
(Trigeorgis, 1996; Dixit and Pindyck, 1994). Another assumption that is mentioned is that the stochastic
process is considered as continuous in the Black Scholes model while for real assets this may not be the
case, as jumps may occur. Another criticism comes from the fact that while a financial option can be
exercised in a very short time, almost immediately, a real option may require a long time and preparation
in order to be exercised. So the lifetime may be less than the stated life in some cases (He, 2007). Finally,
the complex mathematical modeling is considered as too sophisticated and not transparent to
non-academics despite the computing advances (He, 2007; Teach, 2003).
Volatility estimation
One of the issues that is often a subject of real options criticism, and is an argument against real options
application, is the volatility estimation. It will be pointed later in chapter 9 of this study that the
application of the real options model requires the definition of the volatility value. Results also show that
the volatility level affects the payoffs and the real option value. As such it is an important parameter and
needs to be estimated accurately. Or else it may result to over investments.
By definition, volatility in financial options reflects the underlying financial asset future price uncertainty,
while in real options volatility reflects the uncertainty of the project value future cash flows. When we
deal with financial options the underlying assets are tradable and option volatility can be estimated by
historical market prices of the financial assets or by using the Black-Scholes formula (implied volatility).
However, in real options setting, assets are not tradable and there exist no historical data. So, it is not so
easy to derive the real option volatility. In general we can group five methods in literature for the
estimation of volatility in real options, which include various assumptions and will be highlighted below.
Often a real option refers to an investment project where there exists some underlying asset, such a
natural resource, which is tradable. In such case the project’s future cash flow is linked to the asset price,
so the volatility of the project cash flow is assumed to be identical to the asset’s price volatility. Such
cases comprise investment projects related to metals such as gold or copper etc. and oil or land on the
other hand. All these assets are market traded and the analyst can find historical prices. In addition the
project’s payoff is related to the price of the asset. So, Cortazar, et al. (2001) use copper price’s volatility
International Journal of Information, Business and Management, Vol. 7, No.4, 2015
ISSN 2076-9202
9
for investments of the copper industry, Armstrong, et al. (2004) use oil price historical volatility and
Quigg (1993) use land price volatility. While, when the underlying asset of the real option project is not
tradable then an alternative is to use the volatility of an asset that is compatible to the one of the project
(Insley and Rollins, 2005). Another approach is the case of perfect project’s volatility correlation to stock
price movement. If such correlation exists then the project’s volatility can be inferred by the stock price
volatility (Miller and Park, 2002). Except this approach, the industry’s index historical volatility has also
been used in cases where historical data were not sufficient. Finally, some relative recent approaches use
Monte Carlo simulation methods in order to estimate project’s volatility. These methods use in general
historical data of the project to compute predicted future cash flows (Copeland and Antikarov, 2005; Mun,
2006). Lately approaches which revise the volatility estimation and eliminate upward bias have been
proposed.
Open issues and future directionsOpen issues and future directionsOpen issues and future directionsOpen issues and future directions
It has been almost four decades since Myers introduced the real options term and during that period a
tremendous development of the finance field has occurred due to the active academic research and
application of models like Black and Scholes. Research publications in finance were numerous and their
proposals were adopted by the international markets resulting in the exponential development of the field
of derivatives. However, real options, despite its promising initiation, the advocacy and research
publications that supported and still support its superiority against legacy DCF methods, has not evolved
into a widespread tool for investment decisions, and not only. It rather seems that still remains a more or
less academic subject, which tries to find its way and position to the market. In the next chapter the
empirical evidence provided in details prove that the adoption rate of real options for investment
decisions is relative low in comparison to the time being to the market. Although some argue that it is not
meant to be a one for all tool, but a niche method with specific target users and cases, it cannot be avoided
to think it as a lost promise as nobody can claim in behalf of its non-maturity. Financial options on the
other hand have flourished and do not face such issues despite the increasing complexity of their pricing
methods and the development of new exotic options, which is not always easily comprehensible. So it is
not surprising that there exists a debate for the gap between theory and practice for the application of real
options. Some reasons for the low rates of real options adoption are discussed below, along with some
proposals for actions from relevant discussions (Georgiopoulos, 2004).
Academia and practice gap
Discussion could be possibly initiated by setting the question, whether real options is just another
academic discipline which is useful only to the academic community or it has some real value to add to
current investment practice. This question is based on the fact that after reviewing relevant research
publications, one can easily identify the increasing mathematical sophistication of financial and real
options valuation models which are presented in brief in previous sections, which requires advanced skills
to be comprehended. On the other hand, markets and corporations are not fond of super complex models
International Journal of Information, Business and Management, Vol. 7, No.4, 2015
ISSN 2076-9202
10
that require advanced studies in mathematics to be comprehensible. Sophistication is welcome when it
can be easy to be implemented, has clear definitions of variables and their links to reality and results can
be conceivable to the less expert management teams. As it is obvious from the above sections as the
complexity of the mathematics increase the intuition behind the model is fading and the link to real
situations is not always possible. Namely, it is hard to provide a non-expert with an intuition of what the
variables or the solution to a simulation solution for example are actually depicting and how their changes
affect the model. This results to a situation where a real option model is more or less a black box for the
practitioner without clear interfaces to reality and the way they interact with it.
Although scientific research requires a continuous building upon previous knowledge, which in turn,
advances sophistication and complexity, this cannot be applied to practice. Except large firms with
established analysis teams the majority of medium size corporations cannot afford to maintain such teams
so they turn to less state of the art methods. So real options area remains a topic for academic publications
with little penetration to the market.
Plurality of valuation models
This issue of theoretical complexity is getting worse by the fact that despite the years of academic
research and application case studies of real options, there is no standard methodology generally
acceptable to follow, at least for the most typical problems. The power of the Black and Scholes model
and its widespread usage is due to the fact that it was clear and simple enough to be employed to any case.
This explains its popularity for the financial options and despite its complexity it was widely adopted by
the market leading to the evolution of the derivatives markets worldwide. Contrary to this, real options
seem problematic. The fact that real options by nature are not like financial options and each case is more
or less unique cannot be underestimated. However, even for similar cases, one can find different
methodologies in literature. A least common factor is necessary between real options theorists so as a
base framework with acceptable elements to be established. On the other hand tight connection to the
financial options may be misleading as there exist substantial differences between them.
Possible actions
In order to advocate in behalf of the real options application one has to initially clarify the scope of
application. Empirical findings suggest that small to medium enterprises do not adopt sophisticated
models and use relative simple methods for investment decisions. Another point of importance is the area
of application, which may also prevent from real options application. Empirical findings suggest that real
options although it was promoted as a successor for the DCF methods, it seems that this is not possible.
Assumptions of real options theory lead to limitations only to a part of investment decisions and lead to
consider real options rather as a complement than a superseding methodology. So firms can have a
portfolio of methods, with real options being one of them for specific cases.
Even so, three decades is more than enough for a new method to become widespread. Low adoption thus
International Journal of Information, Business and Management, Vol. 7, No.4, 2015
ISSN 2076-9202
11
may be attributed to non-appropriate actions form the academic community. In order to gain acceptance
thus some targeted actions may be appropriate (Georgiopoulos, 2004; Borison, 2005). To name a few
1. Education. Real options may need to be included not as an exception but as a mainstream method for
investment decisions to postgraduate and even undergraduate level in order to influence future
management teams.
2. Academia. Work towards the establishment of some common frameworks which would provide
certain roadmaps for every practitioner on some typical cases. Quantitative analysis should also
provide some qualitative publications in order to assist the diffusion of knowledge.
3. Practitioners. Practitioners are in the middle between the theory and practice and act as persuaders and
opinion leaders. They get the theoretical models and reduce them to practical models. This layer must
feedback with cases studies and success stories so as to convince firms for the necessity of using real
options instead of DCF and educate them in parallel.
4. Societies. It is also imperative that a body of societies and institutions should be formed to advance
the diffusion of methodologies to public and attract and fund research and development in the field.
Conclusion
As a conclusion we can say that probably the most important issue for the real options application is the
establishment of standard methods in terms of framework with correspondence to reference cases. This
will reduce the pluralism and reduce the ad hoc approaches.
References
Amram, M. and N. Kulatilaka, 1998. Real Options: Managing Strategic Investment in an Uncertain
World, Oxford University Press.
Amram, M. and N. Kulatilaka, 1999. Real Options - Managing Strategic Investment in an Uncertain
World. Harvard Business School Press, 1999.
Borison, Adam, 2005. Real options analysis: where are the emperor's clothes?. Journal of applied
corporate finance 17.2 (2005): 17-31.
Brealey, R.A. and Myers, S., 2000. Principles of corporate finance. IL: Irwin McGraw- Hill, Publishers,
Boston, MA.
Cobb, Barry R., and John M. Charnes, 2007. Real options valuation. Proceedings of the 39th conference
on Winter simulation: 40 years! The best is yet to come. IEEE Press, 2007.
Copeland Tom and Vladimir Antikarov, 2001. Real Options: A Practitioner’s Guide. TEXERE, New
York, NY, 2001. (Copeland and Antikarov, 2001)
Copeland, Thomas E., and Vladimir Antikarov, 2005. Real Options: Meeting the Georgetown Challenge.
Journal of Applied Corporate Finance 17 (Spring), 32-51.
International Journal of Information, Business and Management, Vol. 7, No.4, 2015
ISSN 2076-9202
12
Cortazar, G., 2001. Simulation and Numerical Methods in Real Options Valuation, in Real Options and
Investment under Uncertainty: Classical Readings and Recent Contributions, Schwartz and Trigeorgis
(Eds), Chapter 27, 601-620, The MIT Press, Cambridge, Massachusetts, USA.
Dixit, A. and R. Pindyck, 1994. Investment under Uncertainty. Princeton University Press.
Georgiopoulos, N., 2004. REAL OPTIONS: AN INTRODUCTION WITH APPLICATIONS. MSc
Thesis.
He, Yizhi, 2007. REAL OPTIONS IN THE ENERGY MARKETS, PhD Thesis, University of Twente.
Hubalek, Friedrich and Walter Schachermayer, 1999. The Limitations of No -Arbitrage Arguments for
Real Options. Working Paper Series. Adaptive Information Systems and Modelling in Economics and
Management Science. Vienna University of Economics and Business Administration, Vienna University
of Technology.
Lander D. M., and G. E. Pinches, 1998. Challenges to the Practical Implementation of Modeling and
Valuing Real Options. The Quarterly Review of Economics and Finance, Vol. 38, No. 3, 1998, pp.
537-567.
Leslie, K. and M. P. Michaels, 1997. The Real Power of Real Options. The MaCkinsey Quarterly, no.3.
Luehrman, Timothy A., 1997. What’s it worth. Harvard Business Review 75.4 (1997): 132-142.
Mathews, S. and K. Nakamoto, 2004. Valuing Real Options at Boeing. Conference Real Options
Valuation In the New Economy, Montreal, Canada.
Miller, Luke T., Chan S. Park, 2002. Decision Making Under Uncertainty – Real Options to the Rescue?
The Engineering Economist 47 (2), 105-150.
Mun, J., 2002. Real Options Analysis: Tools and Techniques for Valuing Strategic Investments and
Decisions. John Wiley & Sons, New York.
NGA-NA LEUNG, 2007. REAL OPTIONS FRAMEWORK FOR ACQUISITION OF REAL ESTATE
PROPERTIES WITH EXCESSIVE LAND. PhD Thesis, UNIVERSITY OF FLORIDA.
Quigg, L., 1993. Empirical Testing of Real Option-Pricing Models. Journal of Finance, vol.48. issue 2,
pp.621-640.
Teach, E., 2003. Will Real Options Take Root? Why Companies Have Been Slow to Adopt the Valuation
Technique. CFO Magazine, July 01.
Trigeorgis, L., 1996. Real Options: Managerial Flexibility and Strategy in Resource Allocation. The MIT
Press, Cambridge.
Trigeorgis, Lenos, 2005. Making Use of Real Options Simple: an Overview and Applications in Flexible /
Modular decision Making. The Engineering Economist 50, 25-53.

International Journal of Information, Business and Management, Vol. 7, No.4, 2015
ISSN 2076-9202
13
Zhang, Stephen, 2010. Decision support for architecting flexible projects and systems: An evolutionary
framework and two case studies. PhD Thesis, National University of Singapore.
International Journal of Information, Business and Management, Vol. 7, No.4, 2015
ISSN 2076-9202
14
Bank Peculiar, Macroeconomic Causes and Profitability of Banks: An
Evidence from Pakistan
Robina Malik
GCU Faisalabad
Dr. Sajjad Ahmed Baig
Assistant Professor, PhD TQM
National Textile University, Faisalabad Pakistan
Dr. Zaheer Abbass
Assistant Professor, PhD Finance
International Islamic University, Islamabad Pakistan
Muhammad Zia-ur-Rehman
MS Finance, PhD Finance (Scholar)
International Islamic University, Islamabad Pakistan
Abstract
Banks play an important and vital role in the development of the economies. Its importance can’t be
neglected. The aim of this study is to investigate the impact of internal and external causes which affect
the profitability. Internal causes include Size (LnTA), Capital (CAP), Liquidity (LQD), debt to equity ratio
(DE), Non performing loan to Gross advances (NPL), portfolio composition (PC), Loan to Total Assets
(LA) whereas external causes include Gross Domestic Product(GDP), Inflation(INF), and Unemployment
(UNMP). Return on Assets and Return on Equity are used as a measure of profitability. Data is collected
for twelve (12) variables of twenty one (21) banks including four (4) public and seventeen (17) private
banks, for the year of 2006-2011, from the annual reports of banks, index mundi and financial statement
analysis of State Bank of Pakistan (SBP). EViews is used for deriving the results of descriptive,
correlation and panel Regression analysis .Results show that size has positive significant effect in both
models (ROA&ROE).
Key words: Profitability; Internal and External causes; Public and Private Banks of Pakistan.
International Journal of Information, Business and Management, Vol. 7, No.4, 2015
ISSN 2076-9202
15
1. Introduction Being a bridge between surplus units and deficit units, financial performance of banks has great
importance in the development of the economy. Banks influence the depositors, borrowers, regulators,
institutional shareholders, corporate owners and potential investors etc. Any bank as an institution is
responsible for taking deposits, repay on demand, through cheques or drafts etc and lending money to
indigent people for making profit. Banks provide safeguard functions and assist the economies in a
variety of ways. They are really life blood of the economy and helpful in the financial growth of the
country. At the time of independence, Pakistan didn’t inherited healthy financial sector. At that time,
financial sector consist of banks, leasing companies, development finance institutions, investment banks,
modaraba companies, mutual funds, exchange companies, housing finance, venture capital and insurance
companies.
In the beginning, there were three controlling authorities, Corporate Law Authorities, State Bank
of Pakistan, and Pakistan Banking Council. They watched over the financial sector. Equity market was
regulated by corporate law authorities. Nationalized commercial banks performance was oversee by
Pakistan Banking Council. State bank was considered as a central bank. History of Pakistani banks started
with the independence of Pakistan. Habib bank was the first bank and established in Bombay in 1941.
State bank established on 1st July 1948 by the Pakistan government. It was in the hand of the government
of Pakistan and intimate parties. But later on, it became as an independent authority. National Bank (NBP)
was established in 1949 and it was first Pakistani bank which was state owned. After the establishment of
NBP, numerous financial institutions were developed.
In the period of nationalization, in 1970 there was a boycott on private possessions and all private
intuitions were transformed in the hand of the state. These organizations were fulfilling the requirement of
public, government and certain large privately own organizations. In 1972 banking sector was
nationalized (1972-1990). NCBs occupied the dominant position in the banking sector. They became the
main player. Due to the ban on private commercial banks, 92% banking assets were hold by these
nationalized banks. During nationalization era private ownership were restricted. The performances of
commercial banks were unsatisfactory, due to the interference of government authorities. Private sector
was intensely disturbed. Their growth, investment and savings, all were badly affected. Due to these
factors, a lot of problem raised. Innovations going to be reduced, less innovative financial products,
customers were dissatisfied and there was high tax rate. In such a critical situation there was a need of a
very effective, healthy and strong system.
In 1991, banking sector reforms were introduced. Dr. Ishrat Hussain was the former governor of
state bank of Pakistan. He told about the financial reforms and their importance. It was a solid need at that
time. Due to the state owned system only government institutions were taking benefits from the banks.
Political forces were effecting the lending, and there was no merit base system. All the top position and
designated people were hired under the influence of the political leaders. They work under their pressure
and there was no freedom. Banks were fulfilling the need of the government organization, trade financing
and big corporate sectors. Small and Medium Enterprises (SME’s) were ignored and there were no
International Journal of Information, Business and Management, Vol. 7, No.4, 2015
ISSN 2076-9202
16
lending to those enterprises. Agriculture sector was badly affected and there was a time when no
agriculture products available. Unemployment was increasing day by day. Nonperforming loan
percentage was arising day by day and there were no recoveries, because 75%
loans are given to the political parties. There were high lending and low deposits. High tax rate is paid by
the banks. There were no opportunity for new entrant, and it was not good situation. Therefore financial
reforms were mandatory and it was implemented in the different phases.
In 1991 ban was removed, and private banks were allowed to start their operation. It was the first
phase of financial reforms, in 1992; ten banks initiated their work properly. Three foreign banks were also
established in this era and two more provisional banks started their operations within this era. MCB and
Allied banks were denationalized in 1993. Due to the financial reforms, era of liberalization of banking
sector started.
SBP became the strong regulatory authority and put a proper check and balance. It advised to
banks that they all had to submit their annual reports, quarterly and annually. So that performance could
be increase.
In 1997, second phase of financial reforms was started. In this phase banking council was
liquidate and overall control was given to the SBP. It was an authority which is responsible for
supervising, oversee and judge the performance of every bank. Five hundred million rupees was
minimum paid up capital which required for the banks. It was also implemented in the second phase of
the financial reforms. Due to implementation of the reforms, banking industry achieved 4 trillion rupees
within 5 years. This was the progress of the banking sector. Return on banking sector increased. World
Bank conducted study and in the competition regarding banking performance of south Asian countries,
the Pakistani banking sector was ranked second in the banking industry. Pakistan banking industry faced a
lot of ups and down and now it is in a very good form and it is playing a vital role in the progress of the
country.
Now a days, there are seven types of banks in Pakistan namely, Public, Private, Islamic, Foreign,
Microfinance, Specialized banks, and Development Financial Institutions. Under these categories,
approximately 50 banks are working in Pakistan.
Various causes affect the bank’s profitability. Some can measure in a quantitative way and some
can’t measure quantitatively. Here, only discuss those causes which affect the profitability of banks in a
quantitative way. There are two causes which affecting the profitability, one is internal and another is the
external. Internal causes are controllable by the management while external causes are not controllable by
the management. Internal causes that include in the study are size, capital, liquidity, debt to equity Ratio,
nonperforming Loans to Gross advances, portfolio composition, and loan to total assets. On the other
hand, external causes include real gross domestic product, inflation rate, and unemployment. Data is
taken for the year of 2006 to 2011 of 17 private sector banks and 5 public sector banks.
1.1. Problem statement
Banks are the backbone of the economies, and profitability is an important parameter, without
which, organizations can’t run. If an organization is earning good profit it will not only survive in the
International Journal of Information, Business and Management, Vol. 7, No.4, 2015
ISSN 2076-9202
17
rainy days but also in intense competition, otherwise it’s tough to survive. Investors are also confused and
want to know about the banks financial performance because they want to invest or deposit money to get
profit. So, by increasing profitability, investment will be increased, employees will be satisfied by getting
good salaries, bonuses, allowances and rewards. So profitability is really very important and manager is
really worried about for getting maximum profit. With the help of this research, banks can get maximum
profit by knowing the causes which affect the profitability of banks. So that investor feel satisfy to invest
in banks and earn profit. Their confusion and ambiguities can be removed.
1.2. Objective of study
The purpose of this research is to investigate the following objectives
i. How much internal factors influence on the profitability of banks
ii. How much external causes impact on the profitability of the banks.
2. Literature Review
A lot of studies had examined the bank peculiar and macroeconomic causes which affect the
profitability of banks. Early studies on banks profitability were provided by Short (1979) and Bourke
(1989). Mostly researchers used ROA and ROE as a profitability measures. They determined the
relationship between dependent and independent variables. They used different approaches to determine
the effect of these factors on banks profitability.
Abreu and Mendes (2002) studied the profitability and net interest margin of banks for some
European countries. They concluded that banks with more capital face less expected cost of bankruptcy
and there, in return more profitability. However there was negative regression and interest rate and
unemployment were according to the explanation of the profitability of banks. At that time, there was few
work conducted on the performance of banking sector of Pakistan however a lot of work is done on the
evolution of banking sector of Pakistan.
Ataullah et al.(2004) investigated on the commercial banks of India and Pakistan and made a
comparative analysis for the period of 1988-1998.They found that efficiency is higher in loan base model
however it is less in income based model. They put an opinion that India and Pakistan banks should
improve the efficiency of their banks
Burki and Niazi (2006) studied the effect of financial reforms on the efficiency of banks of
Pakistan, including foreign, private and state owned. They took the data of 40 banks for 1991-2000.They
concluded that there is positive relation of size, loan to deposit ratio, and interest income to earning assets
on estimated efficiency scores.
Kosmidou, Tanna, and Pasiouras, (2009) conducted research on UK owned commercial banks.
They determined the effect of bank specific, macroeconomic prevailing conditions and structure of
financial market on the performance of banks. They used net interest margins (NIM ) and return on
average assets (ROAA) as a profitability measure.
Ali, Akhter and Prof. Zafar (2011) examined the effect of bank specific and macroeconomic
International Journal of Information, Business and Management, Vol. 7, No.4, 2015
ISSN 2076-9202
18
factors on banks profitability. They reported significant role of capital adequacy ratio, operating efficiency,
asset management, and gross domestic product on banks profitability. They also found very good
performance of assets and returns in conventional banks. They also reported the financial and non
financial risk. They used two regression models (ROA and ROE), for the year of 2006 to 2009 for 28
banks, including public, conventional and private banks. Risk of credit was used to determine the
outcome of financial risk and for knowing the result of non financial risk, they used operational risk. In
case of profitability was measured by ROA model, they concluded that size, portfolio composition,
operating efficiency, asset management effect positively. Credit risk and capital affected negatively. In
case of profitability was evaluated by ROE model profitability influenced positively by capital, asset
management and portfolio composition, and show negative behavior, by operating efficiency, size, and
credit risk. Macroeconomic variables, GDP affected in a positive way on the profitability of banks in both
models (ROA and ROE).
Anber and Alper (2011) did their research on the factors/determinants affecting the profitability of
banks in turkey for the period of 2002-2010.They also measured the profitability of banks by ROA and
ROE. They used balanced data set and showed result that non-interest income and asset size had
significant and positive impact on banks performance. However, loans under follow-up and credit
portfolio size had negatively and significantly affecting the performance of banks. They suggested that
through increasing bank size and non interest income and decreasing credit/assets ratio bank could
improve their profitability. They also found that higher profitability was achieved by higher interest rate.
Gul, Faiza, and Zaman (2011) studied that banks with large amount of Loans, equity capital,
Deposits, Total Assets, and macroeconomic factors i.e., economic growth, stock market
capitalization and inflation were considered safe and result to higher profitability.
Sadaqat, Akhter, and Ali (2011) also analyzed the affect of micro economic determinants on banks
profitability for the years 2006 to 2009. They used multivariate regression analysis for the formation of
two regression models (ROA and ROE). They concluded that gearing ratio, NPLs ratio and asset
management significantly affecting the banks profit in both models. When we used ROA as proxy for
measuring banks profitability, the size of bank showed significant affect and insignificant relation as
measured by ROE.
3. Methodology
Methodology is a set of process. It is a procedure of rules and regulations in which particular ways
and methods derived for solving different problems with the help of specific discipline. Methodology
includes the techniques, methods, and procedures that are used to collect and analyze information.
In order to fulfill the objective of study, descriptive statistics, correlation and regression analysis
are used to check the performance of firms. Descriptive Statistics is the description of a selection of a data.
It aims to summarize a sample representing the whole population. Correlation shows relationship between
two variables. Measure of central tendency includes mean, median and mode while measure of dispersion
includes variances, standard deviation and range.
International Journal of Information, Business and Management, Vol. 7, No.4, 2015
ISSN 2076-9202
19
3.1.Population
Population describes the group of things, persons and events that the researcher wants to
investigate. Population is the kind of data that depicts the whole class from which sample is selected. All
banking sector are the population of the research.
All total banks of Pakistan N= 47
3.2. Sample:
A sample is the subset or subgroup of population. It is extract from the population and portrays
overall population. The sample of the study consists of total twenty one (21) banks, seventeen (17) private
sector banks and four (4) public sector banks of Pakistan. Now a day’s total five public banks are
operating in Pakistan. Banks are selected on the basis of total assets.
Sample n=21
3.3. Sampling technique
Different types of techniques are used in the research. Generally there are two major form of
sampling, non probability sampling and Probability sampling. In probability sampling, stratified random
sampling is used which help to estimate population parameters.
3.4. Data
Data is a combination of characters, information, symbols, numbers, alphabets and that are
collected for a particular purpose that reflects conditions or ideas. Data is infinite and found everywhere.
Raw facts and figures or material is called data. It is processed for getting results. There are two
categories of data.
Primary Data.
Data in which information is gather first hand for the specific purpose. Primary data focus on
group, panels, individuals, and videoconferencing.
Secondary Data.
Secondary data tells about gathered information from existing source that’s already available.
This type of data can also obtain from these secondary sources, e.g. web sites, internet, articles, industry
analysis, company records, and government publication, etc.
3.5. Data collection
Secondary data is used for the research. Financial data is taken from the financial statement analysis
of financial sector of state bank of Pakistan, websites and annual reports of banks and index mundi.
Consecutive six years, 2006 to 2011 is included in the research.
3.6. Variables description
All the variables which affect the profitability cannot include but it is tried to take maximum
variables. Twelve (12) variables are included in the study, two (2) dependent and ten (10) independent
variables.
3.6.1. Dependent variables:
Variables which are changed due to the change in the independent variables are called dependent
variable.
International Journal of Information, Business and Management, Vol. 7, No.4, 2015
ISSN 2076-9202
20
1. Return on Assets (ROA)
When net income after tax is divided by total assets and multiplied by 100 then it is known as
return on assets. This ratio tells us how much profit is generated by the total assets which are employed in
the business. A lot of researcher used return on assets as the tool for the measurement of profitability. It is
expressed as fellows.
��� = ����� ��������/����������� ∗ 100……(1)
2. Return on Equity (ROE)
When net profit after tax is divided by overall shareholder equity and multiplied by 100 then it is
known as return on equity. Total share holder equity is the sum of share holder equity plus share capital
plus inappropriate profit (loss). It tells about that how much profit is generated by the share holder equity.
It also measures the direct return of the shareholders. It is written as fellows
��� = ����� ��������/������ℎ��ℎ������� �� ∗ 100……(2)
3.6.2. Independent variables:
The variables which influence the dependent variables are known as independent variable. A
change in independent variable creates a change in the dependent variables. Following are the
independent variables which is included in this study. Independent variables are divided into two
categories, bank peculiar variable and macroeconomic variable.
A. Bank peculiar variable
3. Capital
It is taken as the ratio when total share holder equity is divided by the total assets and multiply by
hundred then it is known as capital ratio. It tells about how much percentage of equity is included in total
assets. It is expressed as fellows.
�� ����� � = ������ℎ��ℎ������� ��/����������� ∗ 100…… (3)
4. Debt to Equity Ratio
When total debt is divided by total equity and multiply by hundred then it is known as DE ratio.
Total debt is the sum of short term and long term liabilities.
It is expressed as follows:
��������� ���� � = ���������/�������� �� ∗ 100…… (4)
5. Size
Bank size is measured by the total assets. It is depicted as the natural log of all the assets of the
bank.
6. Liquidity
For measuring liquidity means how much assets are in the hand of the bank that is easily
convertible in to cash. The ratio of cash and balances with the banks is used. It is an important measure. It
is expressed as fellows.
$ �� � �� = ���ℎ�%�����%&��' �ℎ��%(�/����������� ∗ 100…… (5)
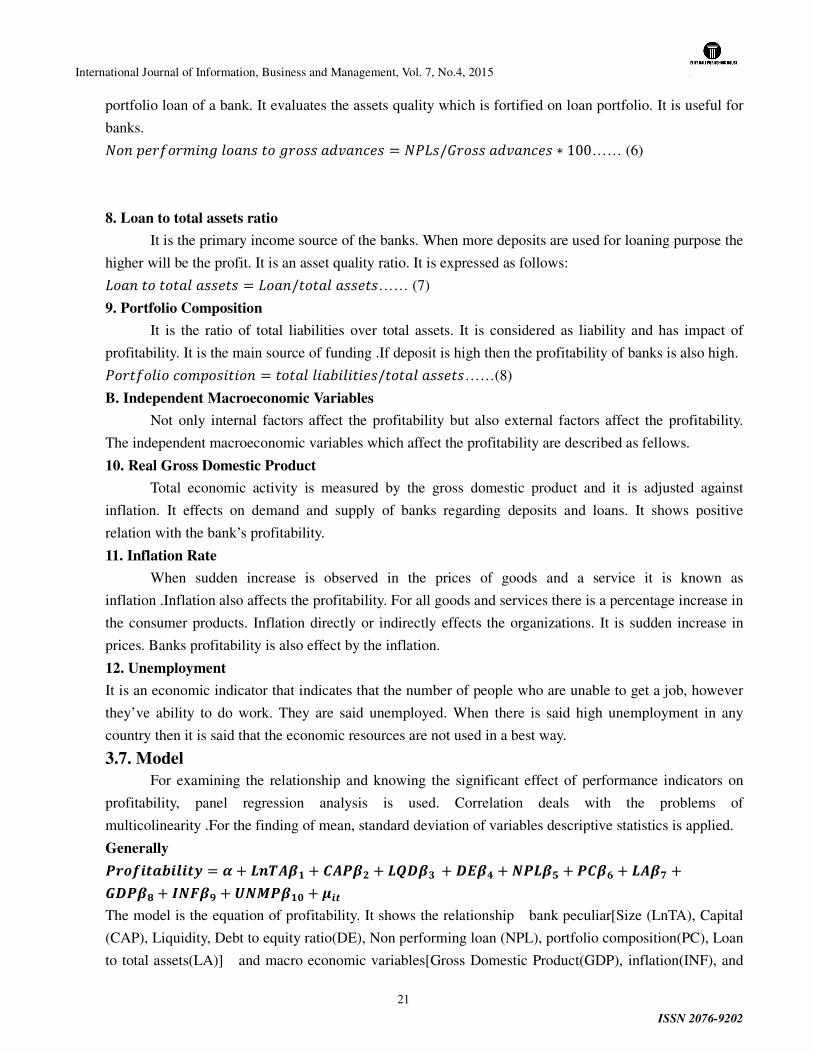
7. Nonperforming loans to gross advances
It is considered as the percentage of nonperforming loan to gross advances. It shows the quality of
International Journal of Information, Business and Management, Vol. 7, No.4, 2015
ISSN 2076-9202
21
portfolio loan of a bank. It evaluates the assets quality which is fortified on loan portfolio. It is useful for
banks.
��%���) %*���%���*�����+�%&�� = �,$�/-�����+�%&�� ∗ 100…… (6)
8. Loan to total assets ratio
It is the primary income source of the banks. When more deposits are used for loaning purpose the
higher will be the profit. It is an asset quality ratio. It is expressed as follows:
$��%������������� = $��%/�����������…… (7)
9. Portfolio Composition
It is the ratio of total liabilities over total assets. It is considered as liability and has impact of
profitability. It is the main source of funding .If deposit is high then the profitability of banks is also high.
,����� �&�)�� � �% = ������ �� � � ��/�����������……(8)
B. Independent Macroeconomic Variables
Not only internal factors affect the profitability but also external factors affect the profitability.
The independent macroeconomic variables which affect the profitability are described as fellows.
10. Real Gross Domestic Product
Total economic activity is measured by the gross domestic product and it is adjusted against
inflation. It effects on demand and supply of banks regarding deposits and loans. It shows positive
relation with the bank’s profitability.
11. Inflation Rate
When sudden increase is observed in the prices of goods and a service it is known as
inflation .Inflation also affects the profitability. For all goods and services there is a percentage increase in
the consumer products. Inflation directly or indirectly effects the organizations. It is sudden increase in
prices. Banks profitability is also effect by the inflation.
12. Unemployment
It is an economic indicator that indicates that the number of people who are unable to get a job, however
they’ve ability to do work. They are said unemployed. When there is said high unemployment in any
country then it is said that the economic resources are not used in a best way.
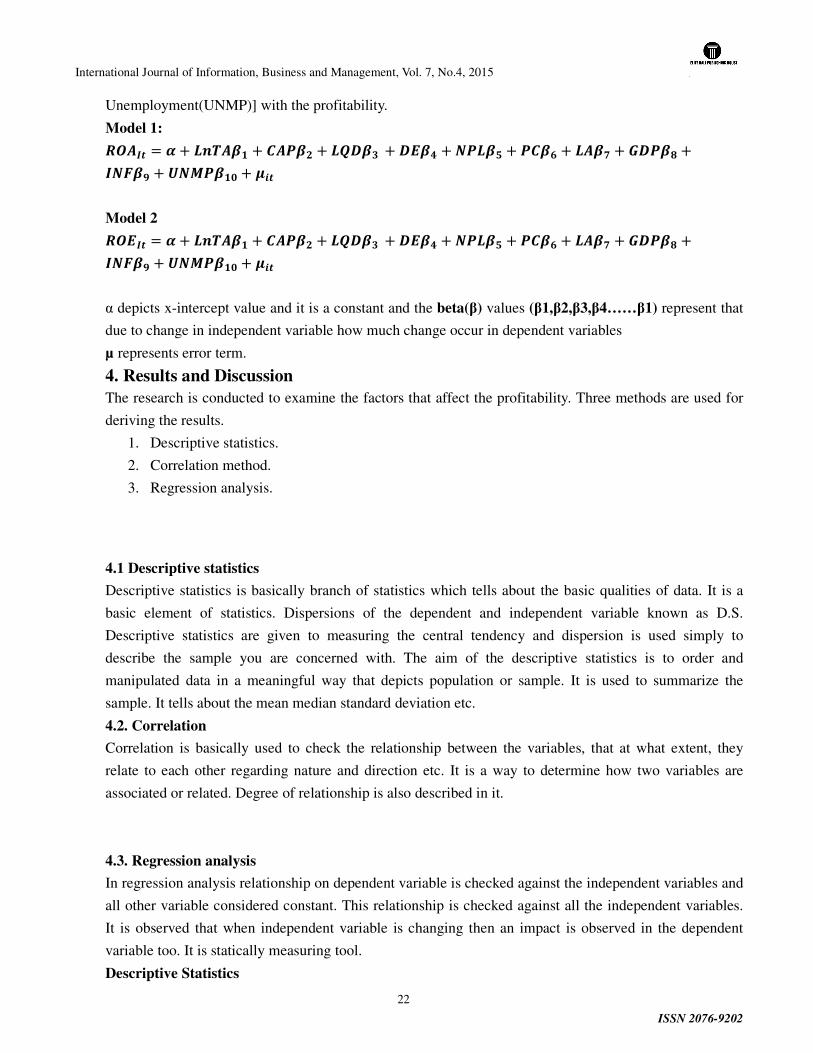
3.7. Model For examining the relationship and knowing the significant effect of performance indicators on
profitability, panel regression analysis is used. Correlation deals with the problems of
multicolinearity .For the finding of mean, standard deviation of variables descriptive statistics is applied.
Generally
./01234526237 = 8 + :;<=>? + @=.>A + :BC>D + CE>F +G.:>H +.@>I + :=>J +
KC.>L + MGN>O +PGQ.>?R + S23
The model is the equation of profitability. It shows the relationship bank peculiar[Size (LnTA), Capital
(CAP), Liquidity, Debt to equity ratio(DE), Non performing loan (NPL), portfolio composition(PC), Loan
to total assets(LA)] and macro economic variables[Gross Domestic Product(GDP), inflation(INF), and
International Journal of Information, Business and Management, Vol. 7, No.4, 2015
ISSN 2076-9202
22
Unemployment(UNMP)] with the profitability.
Model 1:
TU=M3 = 8 + :;<=>? + @=.>A + :BC>D +CE>F +G.:>H + .@>I + :=>J + KC.>L +
MGN>O +PGQ.>?R + S23
Model 2
TUEM3 = 8 + :;<=>? + @=.>A + :BC>D +CE>F +G.:>H + .@>I + :=>J + KC.>L +
MGN>O +PGQ.>?R + S23
α depicts x-intercept value and it is a constant and the beta(β) values (β1,β2,β3,β4……β1) represent that
due to change in independent variable how much change occur in dependent variables
µ represents error term.
4. Results and Discussion
The research is conducted to examine the factors that affect the profitability. Three methods are used for
deriving the results.
1. Descriptive statistics.
2. Correlation method.
3. Regression analysis.
4.1 Descriptive statistics
Descriptive statistics is basically branch of statistics which tells about the basic qualities of data. It is a
basic element of statistics. Dispersions of the dependent and independent variable known as D.S.
Descriptive statistics are given to measuring the central tendency and dispersion is used simply to
describe the sample you are concerned with. The aim of the descriptive statistics is to order and
manipulated data in a meaningful way that depicts population or sample. It is used to summarize the
sample. It tells about the mean median standard deviation etc.
4.2. Correlation
Correlation is basically used to check the relationship between the variables, that at what extent, they
relate to each other regarding nature and direction etc. It is a way to determine how two variables are
associated or related. Degree of relationship is also described in it.
4.3. Regression analysis
In regression analysis relationship on dependent variable is checked against the independent variables and
all other variable considered constant. This relationship is checked against all the independent variables.
It is observed that when independent variable is changing then an impact is observed in the dependent
variable too. It is statically measuring tool.
Descriptive Statistics
International Journal of Information, Business and Management, Vol. 7, No.4, 2015
ISSN 2076-9202
23
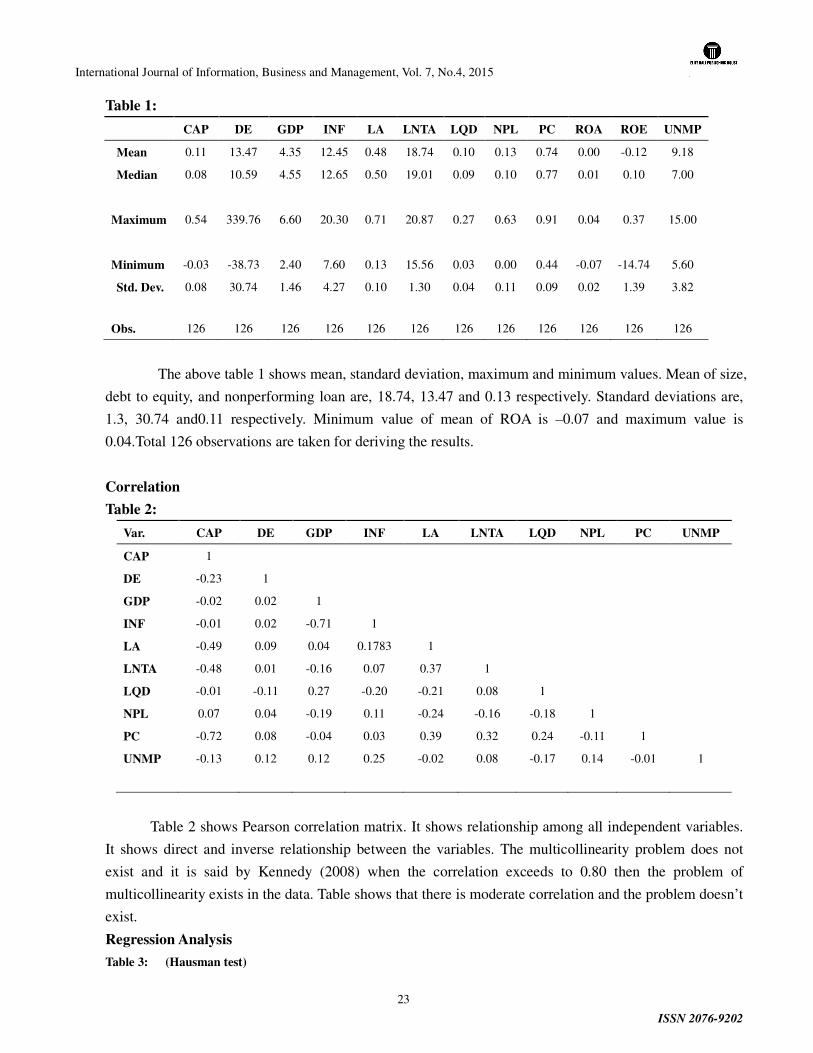
Table 1:
CAP DE GDP INF LA LNTA LQD NPL PC ROA ROE UNMP
Mean 0.11 13.47 4.35 12.45 0.48 18.74 0.10 0.13 0.74 0.00 -0.12 9.18
Median 0.08 10.59 4.55 12.65 0.50 19.01 0.09 0.10 0.77 0.01 0.10 7.00
Maximum 0.54 339.76 6.60 20.30 0.71 20.87 0.27 0.63 0.91 0.04 0.37 15.00
Minimum -0.03 -38.73 2.40 7.60 0.13 15.56 0.03 0.00 0.44 -0.07 -14.74 5.60
Std. Dev. 0.08 30.74 1.46 4.27 0.10 1.30 0.04 0.11 0.09 0.02 1.39 3.82
Obs. 126 126 126 126 126 126 126 126 126 126 126 126
The above table 1 shows mean, standard deviation, maximum and minimum values. Mean of size,
debt to equity, and nonperforming loan are, 18.74, 13.47 and 0.13 respectively. Standard deviations are,
1.3, 30.74 and0.11 respectively. Minimum value of mean of ROA is –0.07 and maximum value is
0.04.Total 126 observations are taken for deriving the results.
Correlation
Table 2:
Var. CAP DE GDP INF LA LNTA LQD NPL PC UNMP
CAP 1
DE -0.23 1
GDP -0.02 0.02 1
INF -0.01 0.02 -0.71 1
LA -0.49 0.09 0.04 0.1783 1
LNTA -0.48 0.01 -0.16 0.07 0.37 1
LQD -0.01 -0.11 0.27 -0.20 -0.21 0.08 1
NPL 0.07 0.04 -0.19 0.11 -0.24 -0.16 -0.18 1
PC -0.72 0.08 -0.04 0.03 0.39 0.32 0.24 -0.11 1
UNMP -0.13 0.12 0.12 0.25 -0.02 0.08 -0.17 0.14 -0.01 1
Table 2 shows Pearson correlation matrix. It shows relationship among all independent variables.
It shows direct and inverse relationship between the variables. The multicollinearity problem does not
exist and it is said by Kennedy (2008) when the correlation exceeds to 0.80 then the problem of
multicollinearity exists in the data. Table shows that there is moderate correlation and the problem doesn’t
exist.
Regression Analysis
Table 3: (Hausman test)
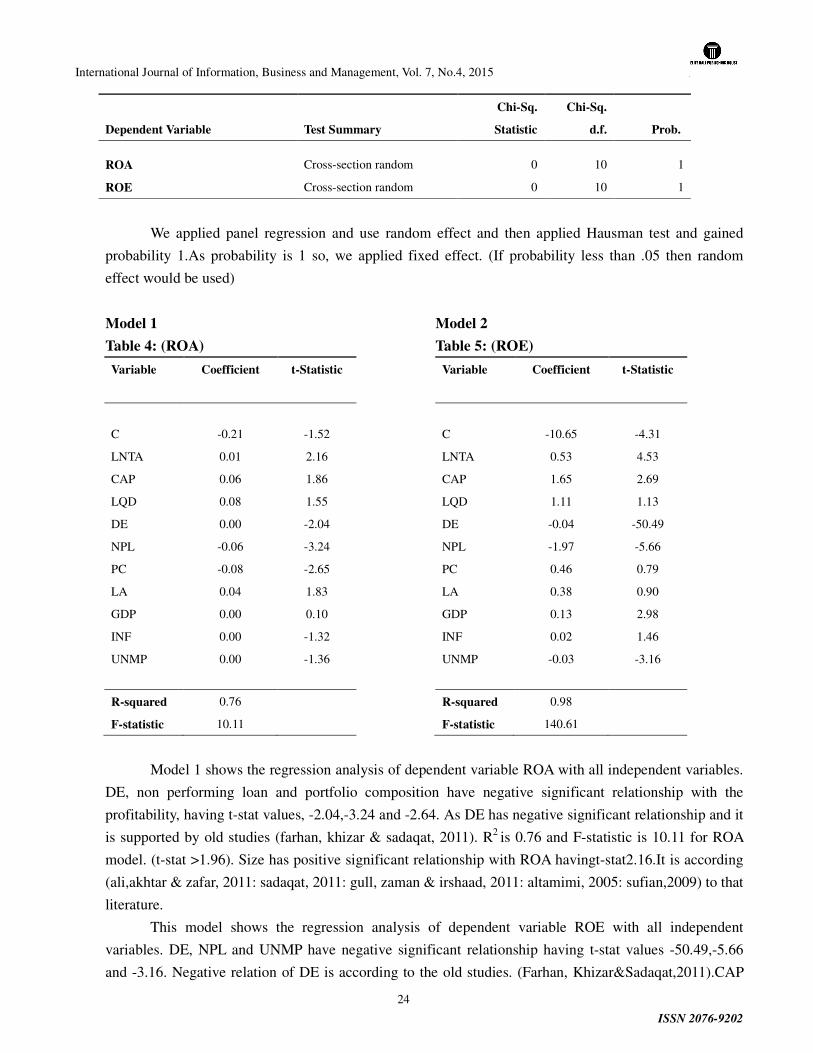
International Journal of Information, Business and Management, Vol. 7, No.4, 2015
ISSN 2076-9202
24
Dependent Variable Test Summary
Chi-Sq.
Statistic
Chi-Sq.
d.f. Prob.
ROA Cross-section random 0 10 1
ROE Cross-section random 0 10 1
We applied panel regression and use random effect and then applied Hausman test and gained
probability 1.As probability is 1 so, we applied fixed effect. (If probability less than .05 then random
effect would be used)
Model 1 Model 2
Table 4: (ROA) Table 5: (ROE)
Variable Coefficient t-Statistic Variable Coefficient t-Statistic
C -0.21 -1.52 C -10.65 -4.31
LNTA 0.01 2.16 LNTA 0.53 4.53
CAP 0.06 1.86 CAP 1.65 2.69
LQD 0.08 1.55 LQD 1.11 1.13
DE 0.00 -2.04 DE -0.04 -50.49
NPL -0.06 -3.24 NPL -1.97 -5.66
PC -0.08 -2.65 PC 0.46 0.79
LA 0.04 1.83 LA 0.38 0.90
GDP 0.00 0.10 GDP 0.13 2.98
INF 0.00 -1.32 INF 0.02 1.46
UNMP 0.00 -1.36 UNMP -0.03 -3.16
R-squared 0.76 R-squared 0.98
F-statistic 10.11 F-statistic 140.61
Model 1 shows the regression analysis of dependent variable ROA with all independent variables.
DE, non performing loan and portfolio composition have negative significant relationship with the
profitability, having t-stat values, -2.04,-3.24 and -2.64. As DE has negative significant relationship and it
is supported by old studies (farhan, khizar & sadaqat, 2011). R2 is 0.76 and F-statistic is 10.11 for ROA
model. (t-stat >1.96). Size has positive significant relationship with ROA havingt-stat2.16.It is according
(ali,akhtar & zafar, 2011: sadaqat, 2011: gull, zaman & irshaad, 2011: altamimi, 2005: sufian,2009) to that
literature.
This model shows the regression analysis of dependent variable ROE with all independent
variables. DE, NPL and UNMP have negative significant relationship having t-stat values -50.49,-5.66
and -3.16. Negative relation of DE is according to the old studies. (Farhan, Khizar&Sadaqat,2011).CAP
International Journal of Information, Business and Management, Vol. 7, No.4, 2015
ISSN 2076-9202
25
and GDP has positive significant relationship and UNMP engaged in negative significant relationship. R2
is 0.97 and F-statistic is 140 for the ROE model. Size has positive significant effect and it is also
supported by literature (ali,akhtar & zafar, 2011: sadaqat, 2011: gull, zaman &
irshaad,2011:altamimi,2005: sufian,2009).
5. Conclusion
Profitability is considered as an important indicator for measuring the performance of banks. There are a
lot of causes which affect the profitability. Internal causes include Size, Capital, Liquidity, Debt to equity ,
Non performing loan, portfolio composition , Loan to Total Assets whereas external causes include Gross
Domestic Product, Inflation, and Unemployment. Return on Assets and Return on Equity are used as
profitability measure. These causes are examined and discussed in regarding the 4 public and 17 private
banks using balanced panel data in regression analysis, for the year of 2006-2011.There are three
significant variables, one positive significant and two negative significant variables. DE, and NPL have
negative significant relationship in both models (ROA and ROE). Size has positive significant
relationship in both models. Debt to equity, and non performing loan have negative significant
relationship with the bank’s profitability in both models (ROA&ROE).PC has negative significant
relationship in ROA model. CAP, and GDP has positive significant effect in ROE model. UNMP has
positive significant effect in ROE model.
Recommendations
It is recommended that:
1. The size of assets should increase and the banks should use maximum assets for earning
maximum profit. More assets utilization enhances the profitability.
2. Advancing should not from the equity portion of the banks.
3. Inflation should be adjusted in such a way that the profitability of banks doesn’t effect.
4. Liquidity should be maintained by the banks as it effects directly to the profitability of banks. If
liquidity is not sufficient then it leads to the failure of banks.
5. Deposits of the banks should increase so that profitability increases.
6. Government should try to reduce unemployment rate.
7. Gross domestic product should enhance.
8. Capital should enhance as increase in capital will increase the profitability.
9. Banks should control over the NPL’s so that loss avoided.
8. References
[1] Adem Anber and Deger Alper (2011).Bank specific and macroeconomic determinants of
commercial bank profitability: empirical evidence from turkey. Business andeconomic
research journal Volume 2 number2-2011, pp.139-152 ISSN: 1309- 2448, www.berjournal.com
[2] Akhter, Ali & Sadaqat.(2011).Factors influencing the profitability of conventional banks of
Pakistan. International research journal of finance and economics ISSN:1450-2887 Issue
66(2011)©Eurojournals pub.inc.2011http://www.euro Journals.com/finance.htm
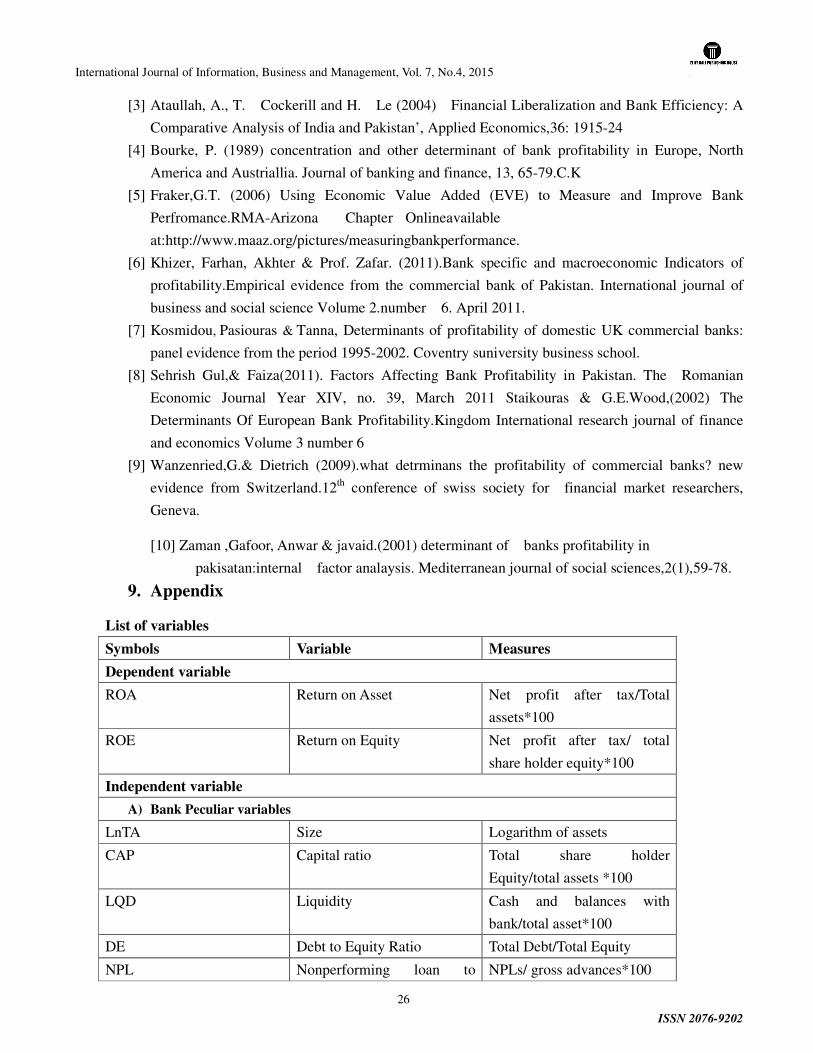
International Journal of Information, Business and Management, Vol. 7, No.4, 2015
ISSN 2076-9202
26
[3] Ataullah, A., T. Cockerill and H. Le (2004) Financial Liberalization and Bank Efficiency: A
Comparative Analysis of India and Pakistan’, Applied Economics,36: 1915-24
[4] Bourke, P. (1989) concentration and other determinant of bank profitability in Europe, North
America and Austriallia. Journal of banking and finance, 13, 65-79.C.K
[5] Fraker,G.T. (2006) Using Economic Value Added (EVE) to Measure and Improve Bank
Perfromance.RMA-Arizona Chapter Onlineavailable
at:http://www.maaz.org/pictures/measuringbankperformance.
[6] Khizer, Farhan, Akhter & Prof. Zafar. (2011).Bank specific and macroeconomic Indicators of
profitability.Empirical evidence from the commercial bank of Pakistan. International journal of
business and social science Volume 2.number 6. April 2011.
[7] Kosmidou, Pasiouras & Tanna, Determinants of profitability of domestic UK commercial banks:
panel evidence from the period 1995-2002. Coventry suniversity business school.
[8] Sehrish Gul,& Faiza(2011). Factors Affecting Bank Profitability in Pakistan. The Romanian
Economic Journal Year XIV, no. 39, March 2011 Staikouras & G.E.Wood,(2002) The
Determinants Of European Bank Profitability.Kingdom International research journal of finance
and economics Volume 3 number 6
[9] Wanzenried,G.& Dietrich (2009).what detrminans the profitability of commercial banks? new
evidence from Switzerland.12th conference of swiss society for financial market researchers,
Geneva.
[10] Zaman ,Gafoor, Anwar & javaid.(2001) determinant of banks profitability in
pakisatan:internal factor analaysis. Mediterranean journal of social sciences,2(1),59-78.
9. Appendix
List of variables
Symbols Variable Measures
Dependent variable
ROA Return on Asset Net profit after tax/Total
assets*100
ROE Return on Equity Net profit after tax/ total
share holder equity*100
Independent variable
A) Bank Peculiar variables
LnTA Size Logarithm of assets
CAP Capital ratio Total share holder
Equity/total assets *100
LQD Liquidity Cash and balances with
bank/total asset*100
DE Debt to Equity Ratio Total Debt/Total Equity
NPL Nonperforming loan to NPLs/ gross advances*100
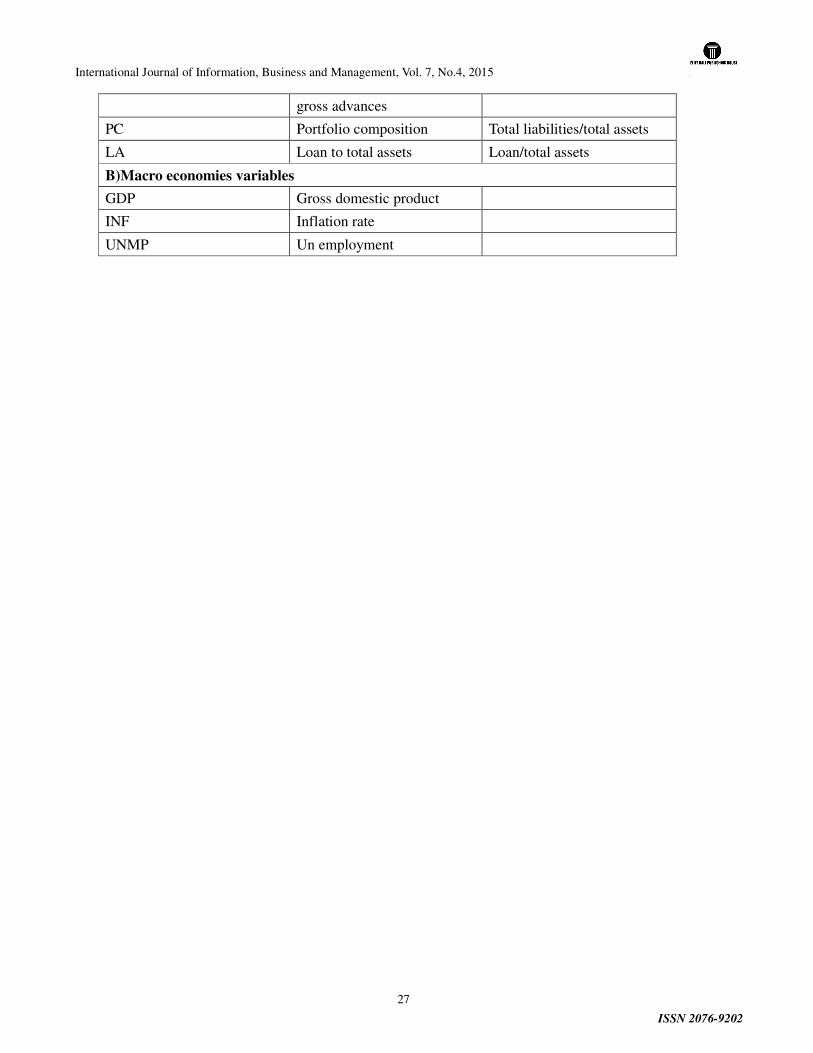
International Journal of Information, Business and Management, Vol. 7, No.4, 2015
ISSN 2076-9202
27
gross advances
PC Portfolio composition Total liabilities/total assets
LA Loan to total assets Loan/total assets
B)Macro economies variables
GDP Gross domestic product
INF Inflation rate
UNMP Un employment
International Journal of Information, Business and Management, Vol. 7, No.4, 2015
ISSN 2076-9202
28
Dynamic Linkages between BSE Sensex and Crude Oil Price - An
Empirical Study in India
Dr.M.Sriram**
**Assistant Professor-Finance, SDM Institute of Management Development, Chamundi Hill Road,
Siddarthanagar, Mysuru-570011,
Abstract
The present study has analysed the short term and long term relationship between crude oil prices and BSE Sensex for the
period from 05/03/07 to 27/02/15. The data sets are not normally distributed and unit root was present and the data sets
became stationary at first difference for the period of study. Using Johansen’s Co integration test, the study finds the
presence of long term relationship between crude oil prices and BSE Sensex. Error correction results have shown that it is
crude oil price which correct the movements in BSE Sensex and the shocks that occur to crude oil prices have negative
impact on the movements of BSE Sensex. Impulse response function indicates that there is significant and higher response
of BSE Sensex to a shock in crude oil prices. Granger Causality test is applied to study the presence of short term
relationship. It is found that the causality was one way, from crude oil prices to BSE Sensex.
Key words- BSE Sensex, Crude oil price, Impulse Response function, Causality, Johnasen’s Co integration
JEL Classification code-G15, F36
Introduction
Petroleum products are a hydrocarbon-rich mixture of crude oil and gases. They not only run factories,
cars, heats some homes but drive economies. Petroleum has provided Americans with an unprecedented
standard of living since its discovery in America in 1859. Oil is a heterogeneous commodity. Crude oil
has varied characteristics, quality and market penetration which determines price mechanism globally
through values of underlying assets. Crude oil is considered to be the world’s most influential physical
commodity that plays a prominent role in all the economies by way of trade mobilisation and production
of basic commodities (Vishal Sood et al., 2014). The price fluctuations in crude oil price during the recent
years have generated a lot of interest in analysing its relationship with macro-economic variables and
equity markets. The fluctuating crude oil price effects an economy, particularly a country like India in
International Journal of Information, Business and Management, Vol. 7, No.4, 2015
ISSN 2076-9202
29
many ways. For instance, rising crude oil price will become a burden to the exchequer as a country will
have to pay more on importing crude oil in terms of dollars. This, as a result will widen the current
account deficit (CAD) and its impact will be felt on the exchange rate instantly. The local currency starts
depreciating against the dollar, the margins of oil marketing companies gets reduced as a result of
increasing oil prices. On the other hand, a fall in crude oil prices (which was witnessed in 2013-14 and till
date) will bring huge relief as the Country’s import bill comes down and the deficit on account of current
account transactions will narrow down in the short to medium term period. Also, a fall in the crude oil
prices may bring down the earnings of those countries whose primary source of revenue is from sale of
oil. This as a result would curb their spending and fall in revenue might force such countries to withdraw
money from the stock markets of emerging economies like India. The Indices will also tend to fall with a
fall in crude oil prices. Theoretically, oil prices can affect stock prices in several ways: expensive fuel
translates into higher cost of carrying, production and heating costs which can put a drag on corporate
earnings or rising fuel prices can stir up concerns about inflation and curtail consumers discretionary
spending thereby reducing the demand for final goods and services and corporate profits (Pescatori et al.,
2008). Rising oil prices are often seen as inflationary by policy-makers and the central banks
automatically responds to inflationary pressures by raising interest rates which affect the discount rate
used in the stock pricing formula (Basher et al., 2010). The change in crude oil prices can create both
direct and indirect pressure on the worlds' economy and its volatility drives many companies away and it
affects the stock market also. India satisfies its major crude oil requirements by importing from oil
producing nations. Therefore, any upward and downward movements in prices are closely tracked in the
domestic market by international factors. Many times it had been recorded that prices of essential
products like, crude also acts as a prime driver for such volatility in price of various commodities
(Sharma, et al, 2012). The relationship between crude oil price and equity market is in the spotlight in the
last few years. With the introduction of futures trading in crude oil in the year 2005, derivatives trading in
the equity market and trading in crude oil futures have started creating some tidal waves, the present has
become important to study the association between crude oil price and a Stock Index. The objectives of
International Journal of Information, Business and Management, Vol. 7, No.4, 2015
ISSN 2076-9202
30
the present study is to analyse the short term and long term relationship between BSE Sensex and crude
oil prices and interpret the results thereof.
Review of Literature
Maghyereh (2004) looked into the interaction between shocks that occurred in oil prices and stock
markets of relevant countries. According to the results of the study, it was found that shocks that occurred
in oil prices did not have meaningful effect on stock index returns of developing countries. (Sari et al.,
2006) examined the relationship between crude oil price, stock return, interest rate and output within the
period 1987 -2004 in the scope of Istanbul Stock Exchange (ISE). According to the results of the research,
shocks that occurred in oil prices did not have meaningful effect on stock returns. (Anoruo et al., 2007)
looked into the relationship between oil and stock market returns from 1993 -2006 in U.S.A. According to
the result of the study, in which co-integration test and VECM model were used, it was revealed that there
was a long term relationship (co-integration) between stock market and oil market and there was a one
way causality relationship from stock market returns to oil market returns. (Cong et al., 2008) examined
the interactive relationship between shocks that occurred in oil prices and stock market in China. In the
study performed in the period between 1996 and 2007 and where VAR model was used, it was revealed
that shocks that occurred in oil prices did not have meaningful effect on stock returns and some important
shocks that occurred, negatively affected the stocks of oil companies. (Miller et al., 2009) investigated the
long term relationship between world crude oil prices and international stock exchanges. According to the
results of the study performed within period of 1971-2008 (separated based on periods) in the scope of
OECD countries and in which VECM model was used, it was observed that there had been a long term
relationship between variables between periods 1971-1980 and 1988-1999 and the stock exchange had
responded negatively to the increase in oil prices in the long term. (Arouri et al., 2010) examined the
relationship between shocks that had occurred in oil prices and stock returns by using linear and
non-linear models within the period of 2005-2008 among countries exporting oil. According to the results
of the research, it was revealed that stock returns in Qatar, Oman, Saudi Arabia and United Arab Emirates
International Journal of Information, Business and Management, Vol. 7, No.4, 2015
ISSN 2076-9202
31
had responded to changes in oil prices, though change that had occurred in oil prices in Bahrain and
Kuwait did not affect the stock returns. (Bhunia, 2012) in the study examined the short-term and
long-term relationships between BSE 500, BSE 200 and BSE 100 Index of Bombay Stock Exchange and
crude price by using various econometric techniques. The study covered the period between 02.04.2001
and 31.03.2011 and was performed with data consisting of 2496 days. The empirical results show there
was a co-integrated long-term relationship between the three indices and crude price. Granger causality
results reveal that there was one way causality relationship from all index of the stock market to crude
price, but crude price was not the causal of each of the three indexes.
Data and Methodology
The study is based on the secondary data. The daily closing data of BSE Sensex was collected from
www.bseindia.com and the brent oil prices were collected from www.bloomberg.com . The natural
logarithm of all values was used for analysis. The period of study is from 05-03-2007 to 27-2-2015. A
total of 1982 observations were used for the present study.
Statistical Tools
The following statistical tools are employed for the present study. The tests namely JB test, Unit root test,
Johansen’s Co integration test, Block Exogeneity Test (Wald Test) were conducted using E-views
software (version 7). A brief explanation about various statistical tools are given below-
Normality Test
The Jarque-Bera (JB) test [Gujarati (2003)] is used to test whether stock returns and exchange rates
individually follow the normal probability distribution. The JB test of normality is an asymptotic, or
large-sample, test. This test computes the skewness and kurtosis measures and uses the following test
statistic:
JB = n [S2 /6 + (K-3)2 /24]
Where n = sample size, S = skewness coefficient, and K = kurtosis coefficient. For a normally distributed
International Journal of Information, Business and Management, Vol. 7, No.4, 2015
ISSN 2076-9202
32
variable, S = 0 and K = 3. Therefore, the JB test of normality is a test of the joint hypothesis that S and K
are 0 and 3 respectively.
To analyse the pattern of distribution of data skeweness and kurtosis have been calculated. Zero skewness
implies symmetry in the distribution whereas kurtosis indicates the extent to which probability is
concentrated in the centre and especially at the tail of the distribution. Kurtosis measures the peakedness
of a distribution relative to the normal distribution. A distribution with equal kurtosis as normal
distribution is called ‘mesokurtic’; a distribution with small tails is called ‘platykurtic’ and a distribution
with a large tail is called ‘leptokurtic’.
Unit Root Test (Stationarity Test)
Empirical work based on time series data assumes that the underlying time series is stationary. Broadly
speaking a data series is said to be stationary if its mean and variance are constant (non-changing) over
time and the value of covariance between two time periods depends only on the distance or lag between
the two time periods and not on the actual time at which the covariance is computed [Gujarati (2003)].A
unit root test has been applied to check whether a series is stationary or not. Stationarity condition has
been tested using Augmented Dickey Fuller (ADF).
Augmented Dickey–Fuller (ADF) Test
Augmented Dickey-Fuller (ADF) test has been carried out which is the modified version of Dickey-Fuller
(DF) test. ADF makes a parametric correction in the original DF test for higher-order correlation by
assuming that the series follows an AR (p) process. The ADF approach controls for higher-order
correlation by adding lagged difference terms of the dependent variable to the right-hand side of the
regression. The Augmented Dickey-Fuller test specification used here is as follows:
Yt = b0 + β∆ Yt-1 + µ1 ∆Yt-1 + µ2 ∆Yt-2 +….. + µp ∆Yt-p + et
Yt represents time series to be tested, b0 is the intercept term, β is the coefficient of interest in the unit
root test, µi is the parameter of the augmented lagged first difference of Yt to represent the pth-order
autoregressive process, and et is the white noise error term.
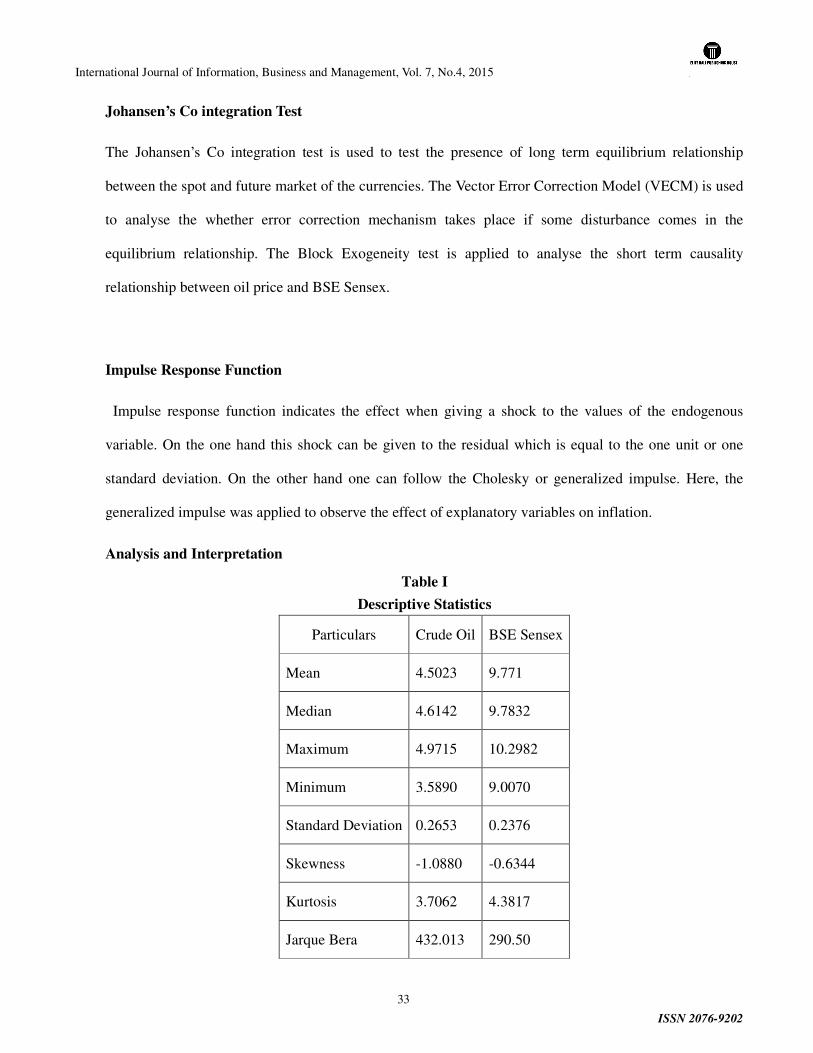
International Journal of Information, Business and Management, Vol. 7, No.4, 2015
ISSN 2076-9202
33
Johansen’s Co integration Test
The Johansen’s Co integration test is used to test the presence of long term equilibrium relationship
between the spot and future market of the currencies. The Vector Error Correction Model (VECM) is used
to analyse the whether error correction mechanism takes place if some disturbance comes in the
equilibrium relationship. The Block Exogeneity test is applied to analyse the short term causality
relationship between oil price and BSE Sensex.
Impulse Response Function
Impulse response function indicates the effect when giving a shock to the values of the endogenous
variable. On the one hand this shock can be given to the residual which is equal to the one unit or one
standard deviation. On the other hand one can follow the Cholesky or generalized impulse. Here, the
generalized impulse was applied to observe the effect of explanatory variables on inflation.
Analysis and Interpretation
Table I
Descriptive Statistics
Particulars Crude Oil BSE Sensex
Mean 4.5023 9.771
Median 4.6142 9.7832
Maximum 4.9715 10.2982
Minimum 3.5890 9.0070
Standard Deviation 0.2653 0.2376
Skewness -1.0880 -0.6344
Kurtosis 3.7062 4.3817
Jarque Bera 432.013 290.50
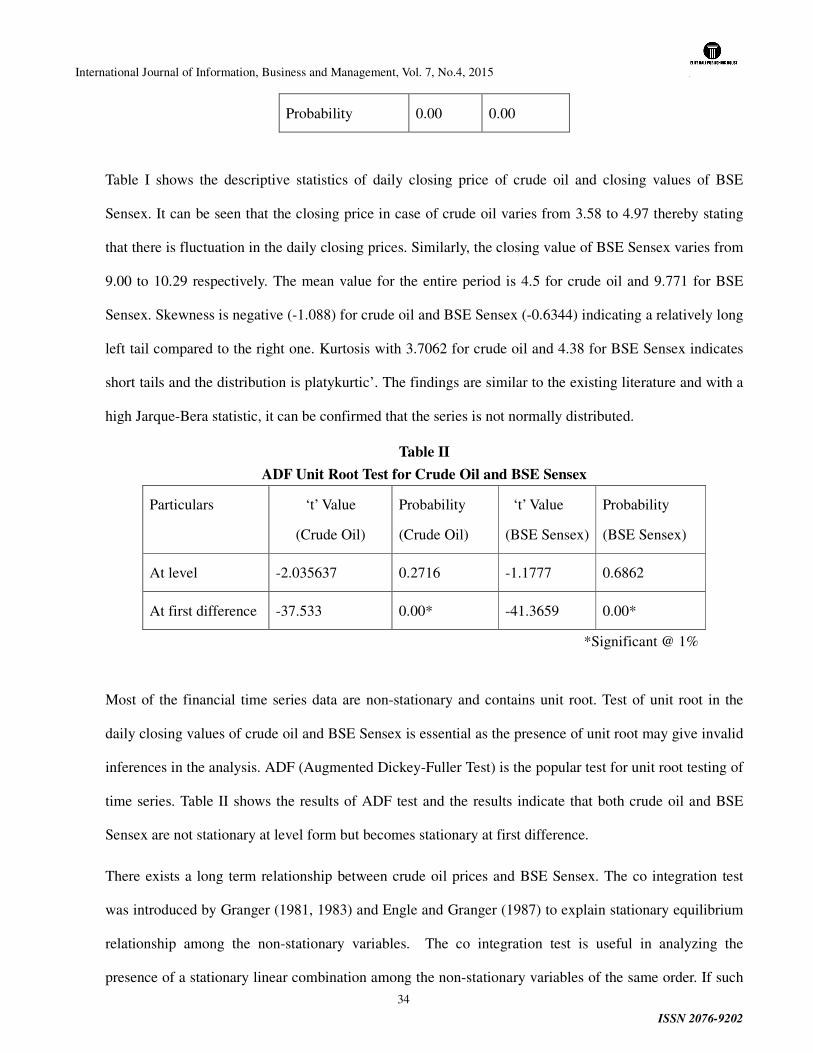
International Journal of Information, Business and Management, Vol. 7, No.4, 2015
ISSN 2076-9202
34
Probability 0.00 0.00
Table I shows the descriptive statistics of daily closing price of crude oil and closing values of BSE
Sensex. It can be seen that the closing price in case of crude oil varies from 3.58 to 4.97 thereby stating
that there is fluctuation in the daily closing prices. Similarly, the closing value of BSE Sensex varies from
9.00 to 10.29 respectively. The mean value for the entire period is 4.5 for crude oil and 9.771 for BSE
Sensex. Skewness is negative (-1.088) for crude oil and BSE Sensex (-0.6344) indicating a relatively long
left tail compared to the right one. Kurtosis with 3.7062 for crude oil and 4.38 for BSE Sensex indicates
short tails and the distribution is platykurtic’. The findings are similar to the existing literature and with a
high Jarque-Bera statistic, it can be confirmed that the series is not normally distributed.
Table II
ADF Unit Root Test for Crude Oil and BSE Sensex
Particulars ‘t’ Value
(Crude Oil)
Probability
(Crude Oil)
‘t’ Value
(BSE Sensex)
Probability
(BSE Sensex)
At level -2.035637 0.2716 -1.1777 0.6862
At first difference -37.533 0.00* -41.3659 0.00*
*Significant @ 1%
Most of the financial time series data are non-stationary and contains unit root. Test of unit root in the
daily closing values of crude oil and BSE Sensex is essential as the presence of unit root may give invalid
inferences in the analysis. ADF (Augmented Dickey-Fuller Test) is the popular test for unit root testing of
time series. Table II shows the results of ADF test and the results indicate that both crude oil and BSE
Sensex are not stationary at level form but becomes stationary at first difference.
There exists a long term relationship between crude oil prices and BSE Sensex. The co integration test
was introduced by Granger (1981, 1983) and Engle and Granger (1987) to explain stationary equilibrium
relationship among the non-stationary variables. The co integration test is useful in analyzing the
presence of a stationary linear combination among the non-stationary variables of the same order. If such
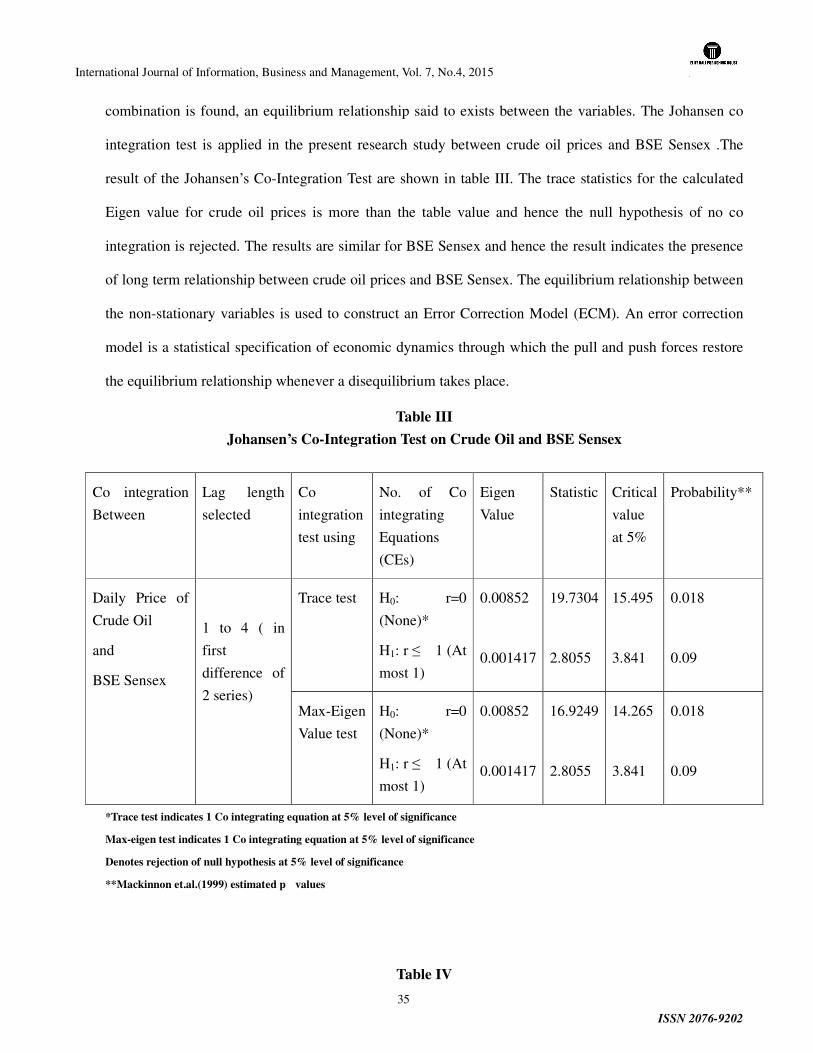
International Journal of Information, Business and Management, Vol. 7, No.4, 2015
ISSN 2076-9202
35
combination is found, an equilibrium relationship said to exists between the variables. The Johansen co
integration test is applied in the present research study between crude oil prices and BSE Sensex .The
result of the Johansen’s Co-Integration Test are shown in table III. The trace statistics for the calculated
Eigen value for crude oil prices is more than the table value and hence the null hypothesis of no co
integration is rejected. The results are similar for BSE Sensex and hence the result indicates the presence
of long term relationship between crude oil prices and BSE Sensex. The equilibrium relationship between
the non-stationary variables is used to construct an Error Correction Model (ECM). An error correction
model is a statistical specification of economic dynamics through which the pull and push forces restore
the equilibrium relationship whenever a disequilibrium takes place.
Table III
Johansen’s Co-Integration Test on Crude Oil and BSE Sensex
Co integration
Between
Lag length
selected
Co
integration
test using
No. of Co
integrating
Equations
(CEs)
Eigen
Value
Statistic Critical
value
at 5%
Probability**
Daily Price of
Crude Oil
and
BSE Sensex
1 to 4 ( in
first
difference of
2 series)
Trace test H0: r=0
(None)*
H1: r ≤ 1 (At
most 1)
0.00852
0.001417
19.7304
2.8055
15.495
3.841
0.018
0.09
Max-Eigen
Value test
H0: r=0
(None)*
H1: r ≤ 1 (At
most 1)
0.00852
0.001417
16.9249
2.8055
14.265
3.841
0.018
0.09
*Trace test indicates 1 Co integrating equation at 5% level of significance
Max-eigen test indicates 1 Co integrating equation at 5% level of significance
Denotes rejection of null hypothesis at 5% level of significance
**Mackinnon et.al.(1999) estimated p values
Table IV
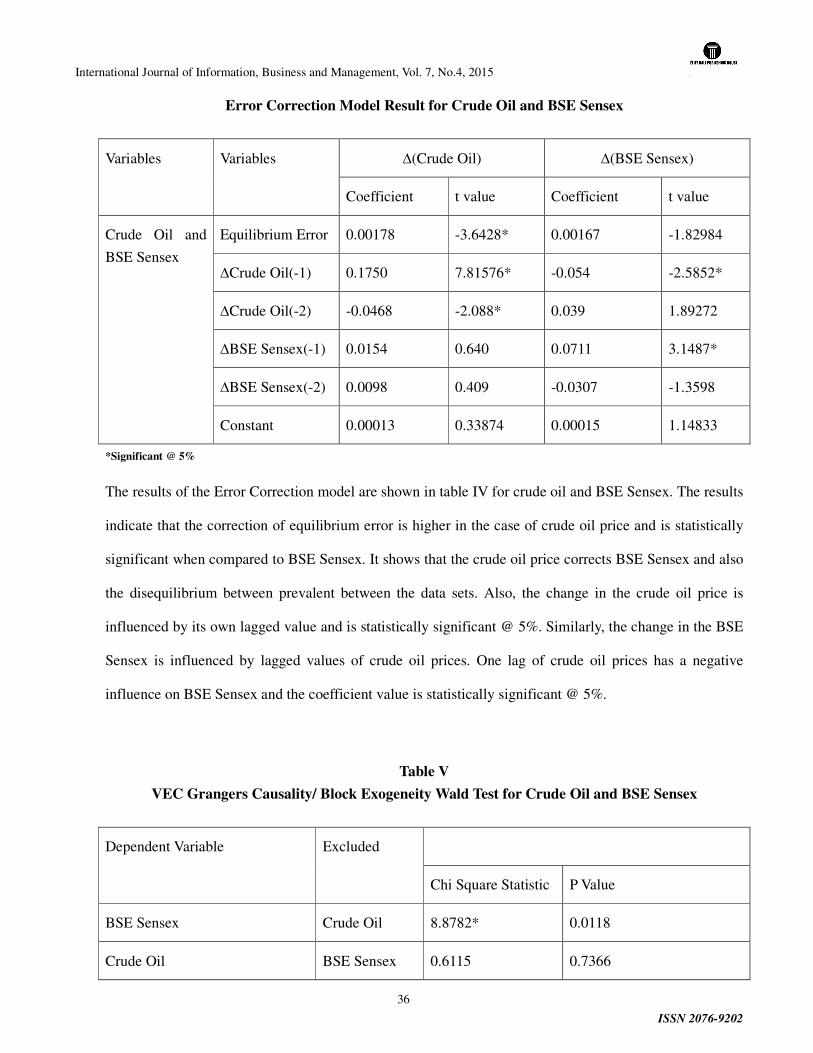
International Journal of Information, Business and Management, Vol. 7, No.4, 2015
ISSN 2076-9202
36
Error Correction Model Result for Crude Oil and BSE Sensex
Variables Variables ∆(Crude Oil) ∆(BSE Sensex)
Coefficient t value Coefficient t value
Crude Oil and
BSE Sensex
Equilibrium Error 0.00178 -3.6428* 0.00167 -1.82984
∆Crude Oil(-1) 0.1750 7.81576* -0.054 -2.5852*
∆Crude Oil(-2) -0.0468 -2.088* 0.039 1.89272
∆BSE Sensex(-1) 0.0154 0.640 0.0711 3.1487*
∆BSE Sensex(-2) 0.0098 0.409 -0.0307 -1.3598
Constant 0.00013 0.33874 0.00015 1.14833
*Significant @ 5%
The results of the Error Correction model are shown in table IV for crude oil and BSE Sensex. The results
indicate that the correction of equilibrium error is higher in the case of crude oil price and is statistically
significant when compared to BSE Sensex. It shows that the crude oil price corrects BSE Sensex and also
the disequilibrium between prevalent between the data sets. Also, the change in the crude oil price is
influenced by its own lagged value and is statistically significant @ 5%. Similarly, the change in the BSE
Sensex is influenced by lagged values of crude oil prices. One lag of crude oil prices has a negative
influence on BSE Sensex and the coefficient value is statistically significant @ 5%.
Table V
VEC Grangers Causality/ Block Exogeneity Wald Test for Crude Oil and BSE Sensex
Dependent Variable Excluded
Chi Square Statistic P Value
BSE Sensex Crude Oil 8.8782* 0.0118
Crude Oil BSE Sensex 0.6115 0.7366
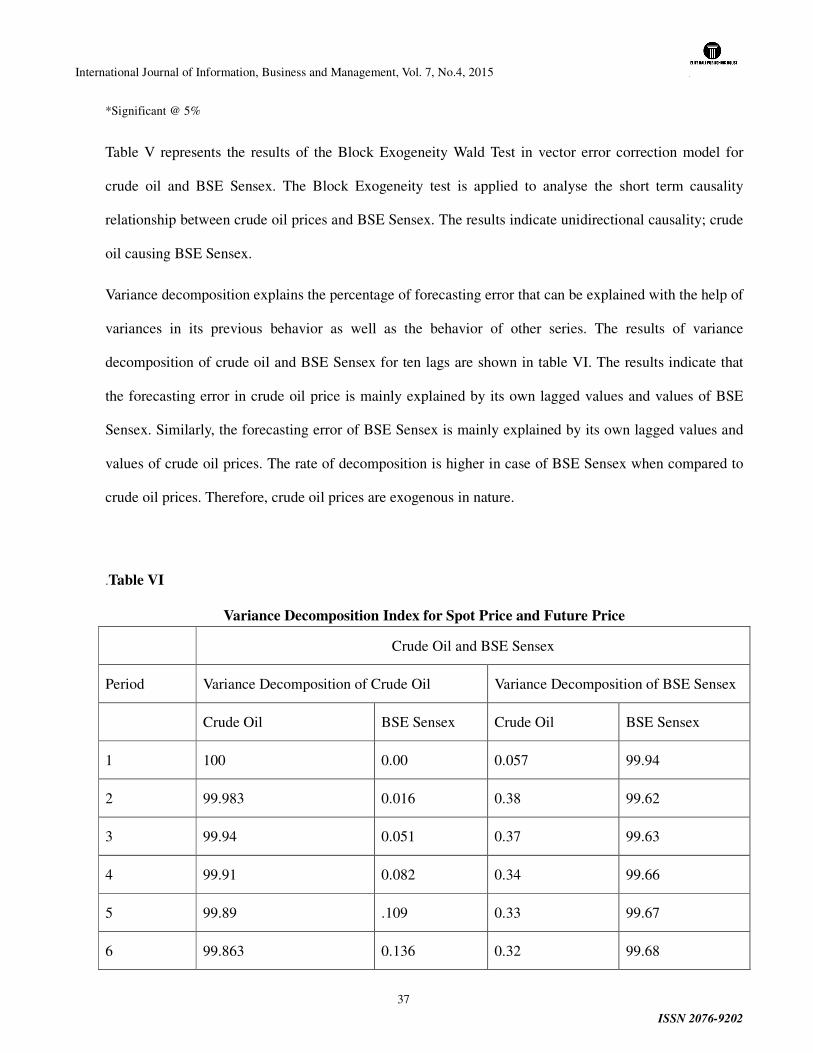
International Journal of Information, Business and Management, Vol. 7, No.4, 2015
ISSN 2076-9202
37
*Significant @ 5%
Table V represents the results of the Block Exogeneity Wald Test in vector error correction model for
crude oil and BSE Sensex. The Block Exogeneity test is applied to analyse the short term causality
relationship between crude oil prices and BSE Sensex. The results indicate unidirectional causality; crude
oil causing BSE Sensex.
Variance decomposition explains the percentage of forecasting error that can be explained with the help of
variances in its previous behavior as well as the behavior of other series. The results of variance
decomposition of crude oil and BSE Sensex for ten lags are shown in table VI. The results indicate that
the forecasting error in crude oil price is mainly explained by its own lagged values and values of BSE
Sensex. Similarly, the forecasting error of BSE Sensex is mainly explained by its own lagged values and
values of crude oil prices. The rate of decomposition is higher in case of BSE Sensex when compared to
crude oil prices. Therefore, crude oil prices are exogenous in nature.
.Table VI
Variance Decomposition Index for Spot Price and Future Price
Crude Oil and BSE Sensex
Period Variance Decomposition of Crude Oil Variance Decomposition of BSE Sensex
Crude Oil BSE Sensex Crude Oil BSE Sensex
1 100 0.00 0.057 99.94
2 99.983 0.016 0.38 99.62
3 99.94 0.051 0.37 99.63
4 99.91 0.082 0.34 99.66
5 99.89 .109 0.33 99.67
6 99.863 0.136 0.32 99.68
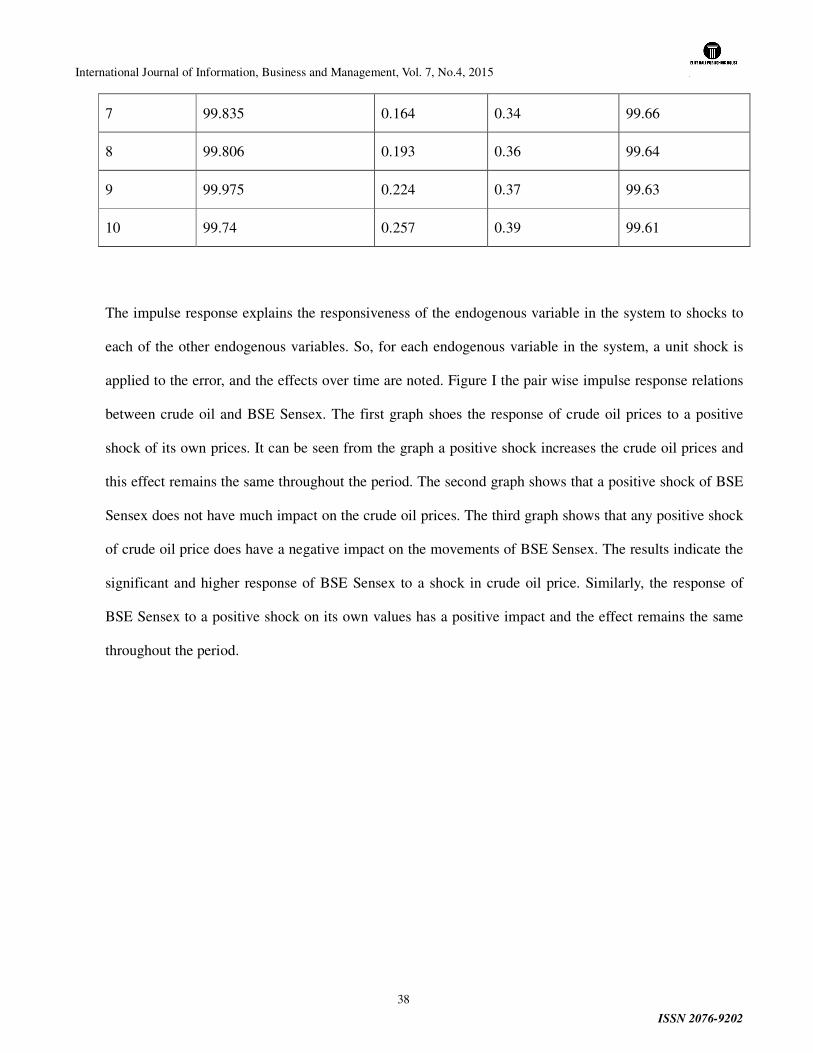
International Journal of Information, Business and Management, Vol. 7, No.4, 2015
ISSN 2076-9202
38
7 99.835 0.164 0.34 99.66
8 99.806 0.193 0.36 99.64
9 99.975 0.224 0.37 99.63
10 99.74 0.257 0.39 99.61
The impulse response explains the responsiveness of the endogenous variable in the system to shocks to
each of the other endogenous variables. So, for each endogenous variable in the system, a unit shock is
applied to the error, and the effects over time are noted. Figure I the pair wise impulse response relations
between crude oil and BSE Sensex. The first graph shoes the response of crude oil prices to a positive
shock of its own prices. It can be seen from the graph a positive shock increases the crude oil prices and
this effect remains the same throughout the period. The second graph shows that a positive shock of BSE
Sensex does not have much impact on the crude oil prices. The third graph shows that any positive shock
of crude oil price does have a negative impact on the movements of BSE Sensex. The results indicate the
significant and higher response of BSE Sensex to a shock in crude oil price. Similarly, the response of
BSE Sensex to a positive shock on its own values has a positive impact and the effect remains the same
throughout the period.
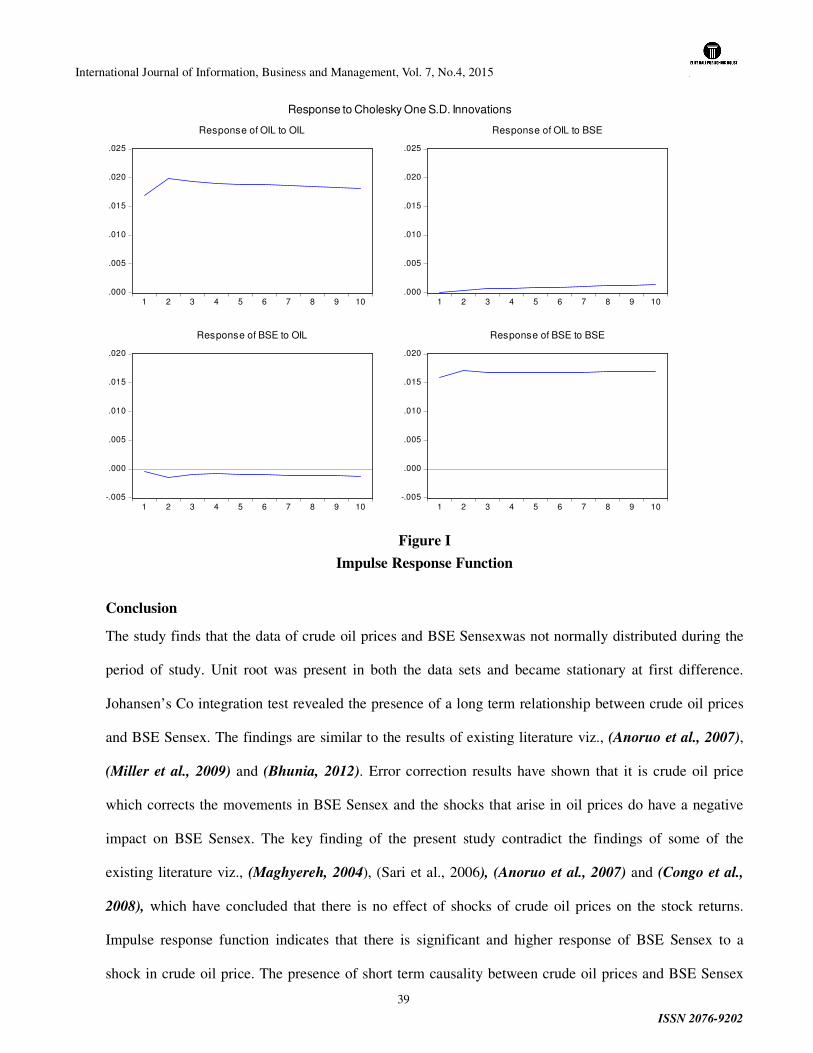
International Journal of Information, Business and Management, Vol. 7, No.4, 2015
ISSN 2076-9202
39
Figure I
Impulse Response Function
Conclusion
The study finds that the data of crude oil prices and BSE Sensexwas not normally distributed during the
period of study. Unit root was present in both the data sets and became stationary at first difference.
Johansen’s Co integration test revealed the presence of a long term relationship between crude oil prices
and BSE Sensex. The findings are similar to the results of existing literature viz., (Anoruo et al., 2007),
(Miller et al., 2009) and (Bhunia, 2012). Error correction results have shown that it is crude oil price
which corrects the movements in BSE Sensex and the shocks that arise in oil prices do have a negative
impact on BSE Sensex. The key finding of the present study contradict the findings of some of the
existing literature viz., (Maghyereh, 2004), (Sari et al., 2006), (Anoruo et al., 2007) and (Congo et al.,
2008), which have concluded that there is no effect of shocks of crude oil prices on the stock returns.
Impulse response function indicates that there is significant and higher response of BSE Sensex to a
shock in crude oil price. The presence of short term causality between crude oil prices and BSE Sensex
.000
.005
.010
.015
.020
.025
1 2 3 4 5 6 7 8 9 10
Response of OIL to OIL
.000
.005
.010
.015
.020
.025
1 2 3 4 5 6 7 8 9 10
Response of OIL to BSE
-.005
.000
.005
.010
.015
.020
1 2 3 4 5 6 7 8 9 10
Response of BSE to OIL
-.005
.000
.005
.010
.015
.020
1 2 3 4 5 6 7 8 9 10
Response of BSE to BSE
Response to Cholesky One S.D. Innovations
International Journal of Information, Business and Management, Vol. 7, No.4, 2015
ISSN 2076-9202
40
was analysed and it was found that there was one way causality from crude oil price to BSE Sensex. The
results were in contrast to the findings of (Bhunia, 2012), where, according to the study, there was one
way causality relationship from all the indices of the stock market to crude oil prices. The study confirms
the presence of short term and long term relationship between crude oil prices and BSE Sensex. From the
investors’ perspective, the implications of the present study is that change in crude oil prices does have an
impact on the movements of BSE Sensex and more so on those companies in the Sensex which use crude
oil as their raw material in the manufacturing process or in any other form. Investors are advised to
consider this factor while taking investment decisions. From a policy perspective, it is highly important
that the Government adopts measures in oil consumption and popularises alternative sources of energy as
it is evident from the current research that change in oil prices does impact stock markets. Future studies
can consider sector specific indices such as BSE Oil and Gas Index and explore their relationship
vis-a-vis crude oil prices. Also, there are other macro-economic factors such as Foreign Institutional
Investments, exchange rates, inflation et al which may affect the index movements. Future studies can
explore as to what extent the crude oil prices along with other factors influence the index movements. The
results of the above suggested studies may add some more dimensions to the existing literature.
References
Anoruo, E., Mustafa, M. (2007). An empirical investigation into the relation of oil to stock markets prices.
North American Journal of Finance and Banking Research, 1 (1), 22-36.
Arouri, M. H. E., Lahiani, A., & Bellalah, M. (2010). Oil price shocks and stock market returns in oil
exporting countries: The case of GCC countries. International Journal of Economics and Finance, 2(5),
pp.132-139.
Basher, S. A.; Haug, A. A. and Sadorsky, P. (2011). Oil Prices, Exchange Rates and Emerging Stock
Markets. MPRA Paper No. 30140, http:// www.business. otago.ac.nz / econ/research/discussion
papers/DP_1014.pdf.
Bhunia, Amalendhu. (2012). Association between Crude Price and Stock Indices: Empirical Evidence
from Bombay Stock Exchange. Journal of Economics and Sustainable Development, 3(3),25-34.
International Journal of Information, Business and Management, Vol. 7, No.4, 2015
ISSN 2076-9202
41
Cong, R-G., Wei, Y-M., Jiao, J-L., & Fan, Y. (2008). Relationships between oil price shocks and stock
market: An empirical analysis from China. Energy Policy, 36, pp. 3544-3553.
http://dx.doi.org/10.1016/j.enpol.2008.06.006.
Maghyereh, A. (2004). Oil price shocks and emerging stock markets: A generalized VAR approach.
International Journal of Applied Econometrics and Quantitative Studies, 1-2, pp. 27-40.
Miller, J. I., Ratti, R. A. (2009). Crude oil and stock markets: Stability, instability and bubbles. Energy
Economics, 31, pp. 559-568. http://dx.doi.org/10.1016/j.eneco.2009.01.009.
Pescatori, A., and Mowry, B. (2008). Do Oil Prices Directly Affect the Stock Market? Working Paper
Series.
Sari, R., Soytas, U. (2006) . The relationship between stock returns, crude oil prices, interest rates and
output: Evidence from a developing economy. The Empirical Economics Letters, 5 (4), pp. 205-220.
Sharma, A.: Singh, G., Sharma, M. and Gupta, P. (2012). Impact of Crude oil Price on Indian Economy.
International Journal of Social Science and Interdisciplinary Research. 1 (4), 95-99.
Sood,Vishal., Bapna, Ira., Totala,N, K., Saluja,H, S.(2014). Crude Oil and Indian Capital Market: An
Empirical Analysis. Pacific Business Review International, 6(7), 20-35
International Journal of Information, Business and Management, Vol. 7, No.4, 2015
ISSN 2076-9202
42
French Bank Mergers and Acquisitions and Value Creation:
The Role of Strategic Similarities
Houda Ben Said
Department of finance
University of Economic and Management, Sfax, Tunisia
E-mail: [email protected]
Abdelfettah Bouri
Professor of Finance
University of Economic and Management, Sfax, Tunisia
E-mail: [email protected]
Abstract
This paper analyses the impact on French bank value creation following mergers-acquisitions
operations of a set of control variables (model 1) and explicative variables measuring strategic
similarities between bidders and targets (model 2). Empirical findings showed that the two
controlling variables (relative size and pre-merger bidder performance) were not significant. For
explicative variables, only three of them (strategic differences in loan ratios, off-sheet activities and
other expenses) provided evidence on the theoretical hypothesis suggesting that strategic differences
between bidder and target affect negatively the value creation ex-post. Strategic differences in terms
of efficiency, capitalization, credit risk, earnings diversification had a positive effect, while
differences in terms of liquidity and deposit activities had no effect.
JEL classification: G21, G34
Keywords: French Banking Sector, Mergers-Acquisitions, Value Creation.
Introduction
The value creation is the objective of all enterprises wanting to satisfy the present investors and to
International Journal of Information, Business and Management, Vol. 7, No.4, 2015
ISSN 2076-9202
43
give out a good signal to the potential investors on the market for the good management. This
objective appears in a movement of rise in power of shareholders in the enterprise piloting. Such
power especially resulted in the requirement by investors of a big transparency on accounts, risks
incurred and committed policies. Indeed, the enterprise that doesn't communicate on the value
creation risks to disappoint financial markets and to have therefore some negative consequences on
its stock value. Thus, the value creation is considered among indicators of measure and assessment
of the performance of an enterprise since, besides information brought on the profitability of the
investment done by the shareholder, the measure of the value created seems to constitute a signal for
the appreciation of the capacity of this enterprise to mobilize funds in order to finance its growth.
The value creation analysis necessarily guides us to study the influence on the value of the
enterprise of any phenomena susceptible to modify its trajectory (Parienté, 1997), such
mergers-acquisitions operations. Like other enterprises, banks worldwide have experienced a
consolidation process mainly via mergers and acquisitions. The main causes for this unprecedented
wave of consolidation are the deregulation, integration of financial markets and technological
innovations. Such reasons are common to most countries and led to accentuate the competition
among banks from now on searching to cut costs and enhance revenues by expanding size via
mergers and acquisitions. Bank mergers and acquisitions are largely justified on value creation
grounds via the exploitation of synergisms and returns to scales between merged banks. This means
to increase the bank market value and to reflect, then, its potential of generating profit.
On an academic plan, the more and more increasing interest of the value creation following the bank
mergers-acquisitions operations resulted in the multiplicity of research in the subject without
conclusive results. Worse again, the experience showed that an important number of consolidation
operations results in a big failure.
Our contribution to the banking literature in this subject consists in verifying empirically the impact
of mergers-acquisitions on the ex-post value creation of the merged French banks. To do this, we
International Journal of Information, Business and Management, Vol. 7, No.4, 2015
ISSN 2076-9202
44
will firstly present the main academic studies in the topic. Secondly, we will present the
methodology and the data sources. Thirdly, we will present and discuss the main empirical results
obtained.
1. Literature review
The traditional argument that supports the value creation following mergers-acquisitions operations
is the hypothesis suggesting that the anticipated value of the group constituted following this type of
operations exceeds, in terms of potential wealth creation, the sum of the respective values of each of
the two groups separated. In another way, 1+1=3. This value creation can be owed to improvements
of efficiency, operational synergisms, financial synergisms and an increased market power.
Empirically, studies in the subject are numerous, using panoply of methods going from the financial
and accounting ratios (ROE, EVA, MVA…) to event studies, but without conclusive results. A
survey reviewing more than 100 studies interested in this topic showed that more that 85% were
interested by the American market, whereas alone few studies projected lights on the European
operations.
Concerning the United States, studies of 1980 years showed that the bank mergers are traduced by a
negative effect for bidders, meaningfully positive for targets and hopeless for the new group
constituted following the transaction. Studies of 1990 years showed that the effect on the target is
meaningfully positive (Hawiwini and Swary, 1990; Houston and Ryngaert, 1994; Madura and Wiant,
1994; Hudgins and Seifert, 1996). Results for bidders don't seem to be clear: most studies showed
some weak effects on the value (Hawawini and Swary, 1990; Houston and Ryngaert, 1994; Madura
and Wiant, 1994) or didn't find any effects (Hudgins and Seifert, 1996; Kane, 2000).
In a survey on the financial globalization and the transnational fusions, Shepherd et al. (2000) tested
the hypothesis of the domestic advantage and the hypothesis of the total advantage. They concluded
that, in some countries, it appears that the domestic banks stay to detain an advantage resulting in a
International Journal of Information, Business and Management, Vol. 7, No.4, 2015
ISSN 2076-9202
45
profit and an efficiency cost more elevated on the foreign banks. In the same year, David. A. Bêcher
examined effects of valorization of 558 American bank mergers on the period 1980-1997. His
results indicated that these operations create wealth. On average, on an event window of 36 days
(-30, +5), targets won more that 22%, bidders achieved neither gain nor loss and the whole group
won 3%. Results also showed that mergers of 90 years had some positive effects. In these years,
targets won meaningfully, bidders won more than those of the 80 years and the combined groups
won meaningfully. In 2003 Cornette and Hovakimian found an abnormal return meaningfully
negative for the transfrontier operations but not for the national operations for bidders in a set of
423 American bank acquisitions on the period 1988-1995.
In Europe, Cybbo – Ottone and Murgia (1996) studied 26 mergers-acquisitions achieved between
financial institutions between 1988 and 1995 in 13 European markets. They found that the average
abnormal returns of targets are positive and those of bidders are essentially hopeless, demonstrating
a transfer of wealth from bidders to targets. In 2000, these two authors studied a sample of 54
mergers-acquisitions from 1988 to 1997 and found meaningfully effects to the combined group at
the date of the transaction announcement.
Tourani-Rad and Van Beek (1999) examined the transfrontier consolidation operations in the
European banking sector in terms of their effects on the wealth of shareholders. They found that
shareholders of target banks showed some positive and meaningful abnormal returns, whereas the
abnormal returns of bidder banks shareholders were not meaningful. More again, results supposed
that returns of bidder banks shareholders are positive when the bidder is bigger and more efficient.
The transfrontier mergers were not more effective than the domestic mergers.
Patrick Beitel and Dirk Schiereck (2001) examined effects on the value of 98 big domestic and
transfrontier mergers-acquisitions of European bidder banks. Authors found that shareholders of
targets received a considerable and meaningfully positive revalorization of their actions. Effects on
bidders were, for most banks, not meaningful.
International Journal of Information, Business and Management, Vol. 7, No.4, 2015
ISSN 2076-9202
46
In 2004, these authors studied 98 European mergers-acquisitions between 1987 and 2000. Their
results showed that the transnational transactions appeared to increase the accumulated abnormal
returns of the target banks whereas bidders created the value in the domestic transactions. For the
combined entity, the geography is not an important factor of value creation.
In 2007, Coby Jérome and Decos Christophe tested the performance of 133 European
mergers-acquisitions on the period 1997-2000. Results showed abnormal returns negative for the
bidder, positive for the target and hopeless for the combined entity. One year after, Yener Altunbas
and David Marquès (2008) examined the strategic similarity impact on mergers-acquisitions
performance of 262 banks of the European Union. 207 transactions were domestic and 55
transfrontier. The performance has been measured by the value creation (variation of ROE). Authors
found that, on average, the bank mergers resulted in an improved performance, and that, for the
domestic transactions, the consolidation of banks with different strategies in terms of credit,
deposits and cost can be very expensive. For the transfrontier transactions, differences between
merged banks in terms of strategies of credits and credit risk can lead in a more improved
performance whereas the differences in terms of capital structure and cost have a negative impact on
the performance.
2. Methodology and data sources
2.1. Data
To be included in the sample, banks (bidders and targets) must be two independent entities in the
time of the consolidation operation and not to make part in any other operation for three years
before and after the operation being part of the sample. These conditions are able to permit us to
precisely examine the effects of every operation in an isolate manner (Ramaswamy, 1997), avoiding
thus any external influences. Thus, the sample to study is composed of 10 mergers-acquisitions (7
domestic and 3 transfrontier) occurring on the period 1996-2006 and implying 20 banks (17 national
and 3 foreign). These operations are: the merger in 1996 between the Paribas and the BNP
International Journal of Information, Business and Management, Vol. 7, No.4, 2015
ISSN 2076-9202
47
resulting in the creation of the BNP Paribas group, the acquisition in 1996 of the Sovac bank by the
American GE Capital, the acquisition in 1997 of the Credit du Nord by the Société Générale, the
acquisition in 1998 of the CIC group by the Credit Mutuel, the acquisition in 1999 of Natexis by the
Banques Populaires, the acquisition in 1999 by the Banques d’Épargne of the Crédit Foncier de
France, the acquisition in 2000 of the Worms bank by the Deutsche Bank AG, the acquisition in
2002 of Crédit Coopératif by the Banques Populaires, the acquisition in 2003 of the Crédit Lyonnais
by the Crédit Agricole and the acquisition in 2006 by the BNP Paribas (group born following the
merger between the BNP and the Paribas) of the Italian the Banca Nazionale Del lavoro. The
acquisition in 2000 by the British HSBC of the Crédit Commercial de France and the acquisition by
this latter of the Hervet bank in 2001 have been excluded from the sample because these two
operations were very near in the time and that it doesn't permit us to study the impact of every
transaction in an isolated way.
Dates of transaction announcement have been obtained from the business daily press and from press
releases of banks constituting the sample. The financial data have been obtained using the
“Bankscope” and “Thomson Financial” databases. All variables of the empirical model are
calculated three years before and after the merger or acquisition operation. This choice is based on
the observation of analysts stipulating that 50% of gains should appear after one year whereas the
totality of these gains would be achieved during three years after the merger-acquisition.
2.2. Model
Like Altunbas and Marquès (2008), we build on the model suggested by Ramaswamy (1997)
analyzing the impact of mergers-acquisitions in the American banking sector on performance
depending on the strategic similarities between targets and bidders. We relate changes in
performance following merger to a set of controlling (model 1) and strategic variables (model 2).
The strategic similarity concept used by the literature supposes that most aspects of the strategy of a
business can be observed in its decisions of allowance of resources. Thus, if two enterprises show
International Journal of Information, Business and Management, Vol. 7, No.4, 2015
ISSN 2076-9202
48
similar decisions of resource allowance measured since some categories in their balances sheets
through some strategic features, they can be considered like being strategically similar (Harrisson et
al., 1991). Like Ramaswamy (1997) and Altunbas and Marquès (2008), the strategic similarity of
merged banks is measured by an indicator including the financial features for each strategic variable
and each merger:
( )2
, , , ,,SI X X
B I K T I Ki k= −
Where: SIi,k : The similarity index for the kth variable for the ith merger
XB,I,K and XT,I,K : The scores of the bidder and the target for the kth variable respectively)
To define the strategic similarities of banks engaged in mergers in France, we use a variety of
financial indicators, such as liquidity, efficiency, capitalization, asset and liability composition, risk
exposure, diversity earnings, off-balance sheet activities and other expenses. We are going to use
two controlling variables of control (X i,j), which are the relative size (RSIZE) and the ex-ante
performance of the bidder (BID-ROE).
The dependent variable in our model is the creation of value (ROE) measured by the difference
between the average of ROE of banks merged three years after the fusion and the one of three years
before the fusion (See table 1. So, the model to estimate is the next one:
10 10 9 10 9
, ,1 1 1 1 1
ROE X SIi i j i k
i i j i j
∆ = +∑ ∑ ∑ ∑ ∑= = = = =
The level of the bidder’s pre-merger performance (BID-ROE), measured as its return on capital, can
influence post-merger performance of the combined entity (∆ROE). If a bidder creates value before
the merger, it is more likely that the value of the new institution will be destructed in the short term
due to the merger process. Alternatively, bidder with a lower level of performance will manage to
create value after the consolidation operation. As a consequence, a negative relationship between
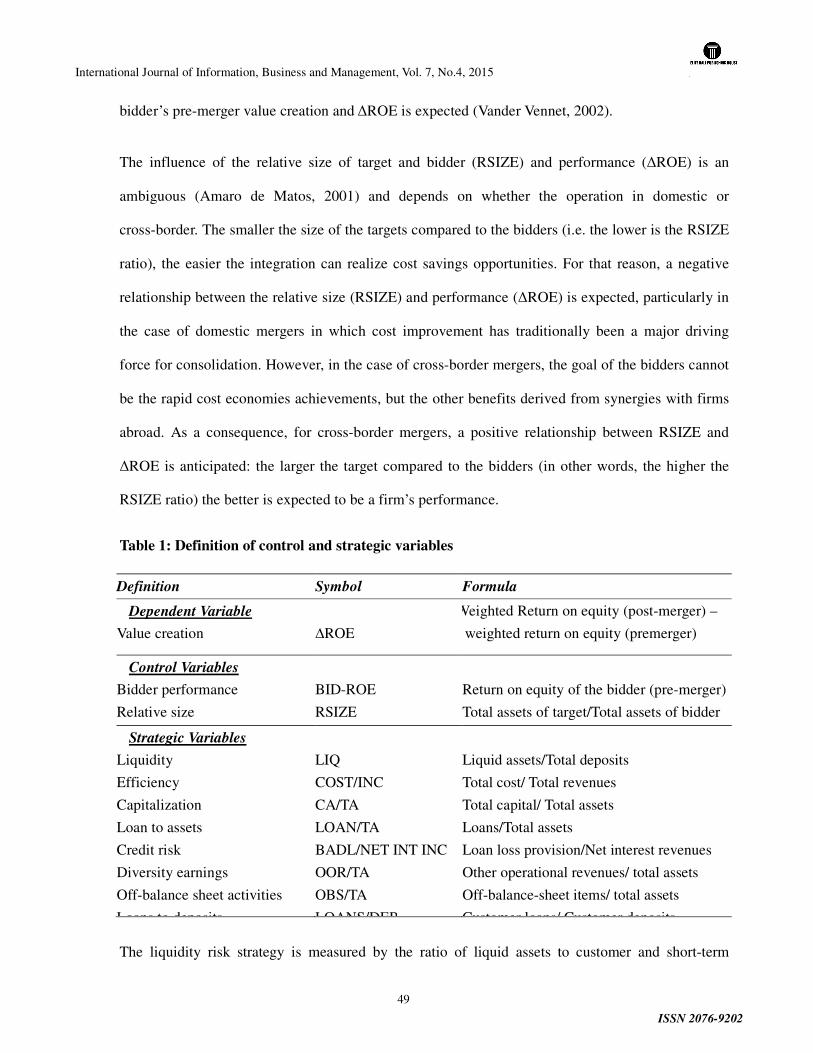
International Journal of Information, Business and Management, Vol. 7, No.4, 2015
ISSN 2076-9202
49
bidder’s pre-merger value creation and ∆ROE is expected (Vander Vennet, 2002).
The influence of the relative size of target and bidder (RSIZE) and performance (∆ROE) is an
ambiguous (Amaro de Matos, 2001) and depends on whether the operation in domestic or
cross-border. The smaller the size of the targets compared to the bidders (i.e. the lower is the RSIZE
ratio), the easier the integration can realize cost savings opportunities. For that reason, a negative
relationship between the relative size (RSIZE) and performance (∆ROE) is expected, particularly in
the case of domestic mergers in which cost improvement has traditionally been a major driving
force for consolidation. However, in the case of cross-border mergers, the goal of the bidders cannot
be the rapid cost economies achievements, but the other benefits derived from synergies with firms
abroad. As a consequence, for cross-border mergers, a positive relationship between RSIZE and
∆ROE is anticipated: the larger the target compared to the bidders (in other words, the higher the
RSIZE ratio) the better is expected to be a firm’s performance.
Table 1: Definition of control and strategic variables
Definition Symbol Formula
Dependent Variable
Value creation
∆ROE
Weighted Return on equity (post-merger) –
weighted return on equity (premerger)
Control Variables
Bidder performance
Relative size
BID-ROE
RSIZE
Return on equity of the bidder (pre-merger)
Total assets of target/Total assets of bidder
Strategic Variables
Liquidity
Efficiency
Capitalization
Loan to assets
Credit risk
Diversity earnings
Off-balance sheet activities
Loans to deposits
LIQ
COST/INC
CA/TA
LOAN/TA
BADL/NET INT INC
OOR/TA
OBS/TA
LOANS/DEP
Liquid assets/Total deposits
Total cost/ Total revenues
Total capital/ Total assets
Loans/Total assets
Loan loss provision/Net interest revenues
Other operational revenues/ total assets
Off-balance-sheet items/ total assets
Customer loans/ Customer deposits
The liquidity risk strategy is measured by the ratio of liquid assets to customer and short-term
International Journal of Information, Business and Management, Vol. 7, No.4, 2015
ISSN 2076-9202
50
funding (LIQ). Since the maintenance of an important liquidity ratio is expensive, the different
strategies of liquidity management can imply that merged bank can improve its management of
liquidity following the merger and realize thus a better performance.
The relation between the value creation (∆ROE) and efficiency (COST/INC) is supposed to be
negative. In fact, a bank competing on the basis of low-cost and operating efficiency is expected to
benefit from merging with another bank with similar competencies (Bollenbacher, 1995), as a result
of economies of scale and scope deriving from the combination of similar skills. However, when
banks characterized by different cost controlling strategies merge, they may realize a worse
performance (Altunbas et al., 1997).
The level of adequacy of the capital is measured by the ratio equity on total assets (CA/TA). This
ratio shows banks’ strategy regarding their capital structure. The effect of the change of this ratio on
the creation of value depends on the theory of the banking firm. According to the signaling
hypothesis, commercial banks specialize in lending information to problematic borrowers (Berger et
al., 1995). Since bank managers usually have a stake in the capital of the bank, it will prove less
costly for a good bank to signal better quality through increased capital than for a bad bank.
Therefore, banks can signal favorable information by merging with banks with larger capital ratio
suggesting a positive relationship between capital structure differences and performance (Berger,
1995). Alternatively, Ross (1977) argues that of weaker capital ratios signal positive information,
since the signaling of the good quality through a big indebtedness can be less expensive for a "good"
bank that for a "bad" bank.
The ratio Net loans on total assets (NL/TA) takes into account the prominence of loans in terms of its
weight on the overall portfolio. In general, it can be argued that when banks with very different asset
quality and overall portfolio strategies merge, value destruction may be expected. Since the scale
returns and the cost integration is an essential goal of a great number of domestic mergers, conflicts
arising from managerial disparities on critical decisions, such as asset quality or the overall portfolio
International Journal of Information, Business and Management, Vol. 7, No.4, 2015
ISSN 2076-9202
51
strategy, may be an obstacle to creating such synergies. Then, the greater the difference among
merged bank strategies, the lower the performance after merging is initially expected to be. The
opposite may happen in cross-border mergers as one of the goals of these operations may be to
improve revenues derived from including new portfolio strategies or reduce the risk profile of one of
the merging partners (Demsetz and Strahan, 1997).
The strategy followed by the bank regarding its asset quality profile is measured as the level of loan
loss provisions divided by interest revenues. The earnings diversification strategy referred to the
emphasis on other sources of income deriving from potential new revenues, diversification and
access to financial innovation possibilities from producing new products and services. Maximization
of non-interest revenue as a general strategy is measured by the ratio of other operational revenue to
total assets (OOR/TA). Differences in other operational revenue to total assets may enhance the value
creation following merger. So a positive relation is expected between this ratio and the value creation
post-merger.
The off-balance-sheet activities are measured as the ratio of off-balance-sheet activity to total assets
(OBS/TA). Dissimilarities in off-balance-sheet activities are expected to enhance post-merger
performance (∆ROE) as they could help spreading access to financial innovation and new sources of
revenues (Gande et al., 1997). This positive relationship is expected to be particularly strong in the
case of domestic mergers where homogeneity among merging entities tends to be higher and the
difficulties associated with the integration of the new products are normally lower than in the case of
cross-border mergers (Harrison et al., 1991). The total loans to total customer deposits ratio (L/D)
provides a proxy for the use of relatively low-cost deposits in relation to the amount of loans. Finally,
banks’ strategy in terms of technology and innovation is measured as other expenses as a proportion
of total assets used for investment in technology and innovation (TECH). Dissimilarities in
investments in technology among bidders and targets are expected to produce better performance as
each of the merging partners may benefit from returns to scale and scope derived from the
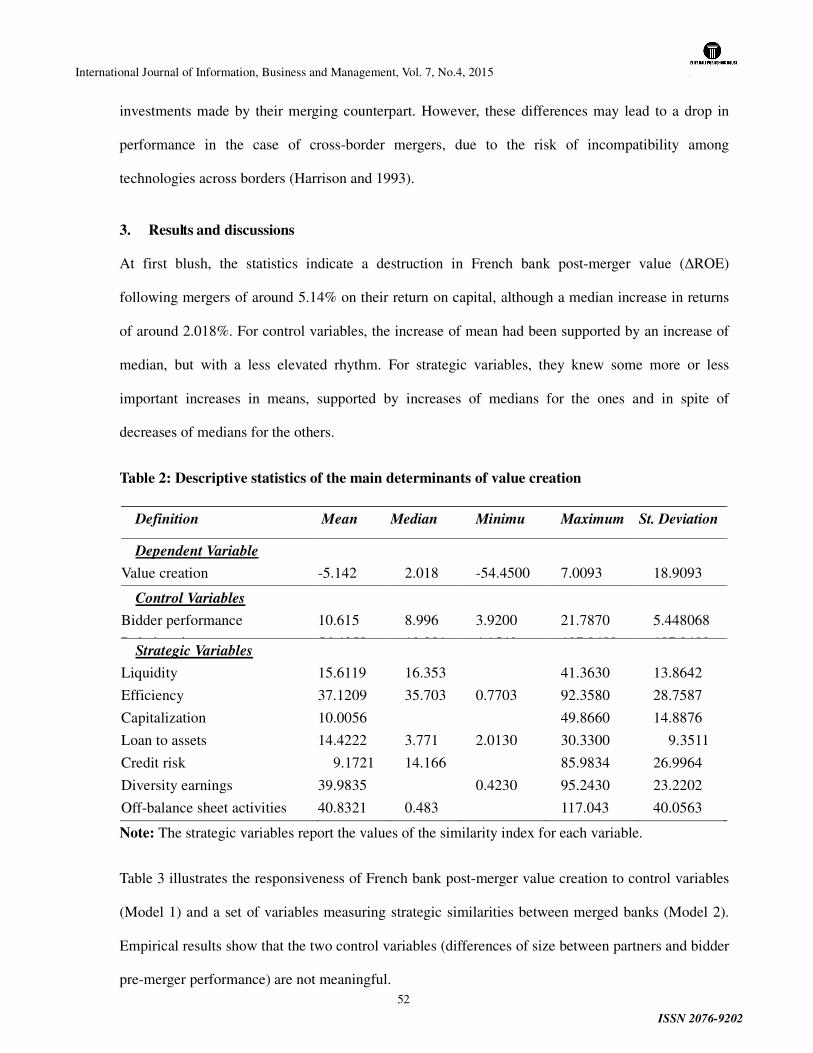
International Journal of Information, Business and Management, Vol. 7, No.4, 2015
ISSN 2076-9202
52
investments made by their merging counterpart. However, these differences may lead to a drop in
performance in the case of cross-border mergers, due to the risk of incompatibility among
technologies across borders (Harrison and 1993).
3. Results and discussions
At first blush, the statistics indicate a destruction in French bank post-merger value (∆ROE)
following mergers of around 5.14% on their return on capital, although a median increase in returns
of around 2.018%. For control variables, the increase of mean had been supported by an increase of
median, but with a less elevated rhythm. For strategic variables, they knew some more or less
important increases in means, supported by increases of medians for the ones and in spite of
decreases of medians for the others.
Table 2: Descriptive statistics of the main determinants of value creation
Definition Mean Median Minimu
m
Maximum St. Deviation
Dependent Variable
Value creation
-5.142
2.018
-54.4500
7.0093
18.9093
Control Variables
Bidder performance
Relative size
10.615
56.4358
8.996
19.381
3.9200
4.1540
21.7870
107.9480
5.448068
107.9480 Strategic Variables
Liquidity
Efficiency
Capitalization
Loan to assets
Credit risk
Diversity earnings
Off-balance sheet activities
15.6119
37.1209
10.0056
14.4222
9.1721
39.9835
40.8321
16.353
35.703
3.771
14.166
0.483
0.7703
2.0130
0.4230
41.3630
92.3580
49.8660
30.3300
85.9834
95.2430
117.043
13.8642
28.7587
14.8876
9.3511
26.9964
23.2202
40.0563
Note: The strategic variables report the values of the similarity index for each variable.
Table 3 illustrates the responsiveness of French bank post-merger value creation to control variables
(Model 1) and a set of variables measuring strategic similarities between merged banks (Model 2).
Empirical results show that the two control variables (differences of size between partners and bidder
pre-merger performance) are not meaningful.
International Journal of Information, Business and Management, Vol. 7, No.4, 2015
ISSN 2076-9202
53
This result is contradictory with Altunbas and Marquès (2008) result supposing that a relatively
elevated level of bidder pre–merger performance tends to affect negatively the level of post-merger
performance of merged banks. According these authors too, differences of size between merged
banks play a major role in the influence of the performance, but that this influence differs extensively
depending on whether the operation is domestic or transnational. For the first, more the target is
bigger than the bidder, more the ex-post performance will be worse, due to difficulties to assimilate
some bigger institutions. On the contrary, for the second, more the size of the target is big in
comparison with the bidder, more the ex-post performance will be better. It is explained by the
authors by the fact that for the cross-border operations the bidder's goal is not to achieve fast cost
savings but rather to win profits coming from other synergisms.
The nine strategic variables explain 98% of the variance in the change of the creation of value
following fusions. The relation between differences in efficiency levels measured as the cost to
income ratio and value creation is positive. This result doesn’t support the banking theory suggesting
that difficulties in integrating banks with very different cost structure, particularly in the short-term
will influence negatively the value creation following merger (Altunbas and al, 1997). A positive
relation also existed between differences in capital structure and value creation. On the contrary, Y.
Altunbas and D. Marqués (2008) found that the impact of this strategic variable on the value creation
varies depending on whether the operation is domestic or transnational.
This impact is positive for the first and negative for the second. The negative effect is explained by
the two authors by the fact that, since the capital is sometimes used by banks to signal the good
quality of assets, it decorated to be more difficult for the transnational operations to integrate
institutions to different structures of capital, seen that asymmetries of information between the
merged parts are raised more than those in the domestic operations. Differences in terms of
loan-to-assets ratio among merged banks affect positively the exp-post value creation. This result
doesn't validate the hypothesis according to which the value is supposed to deteriorate when merge
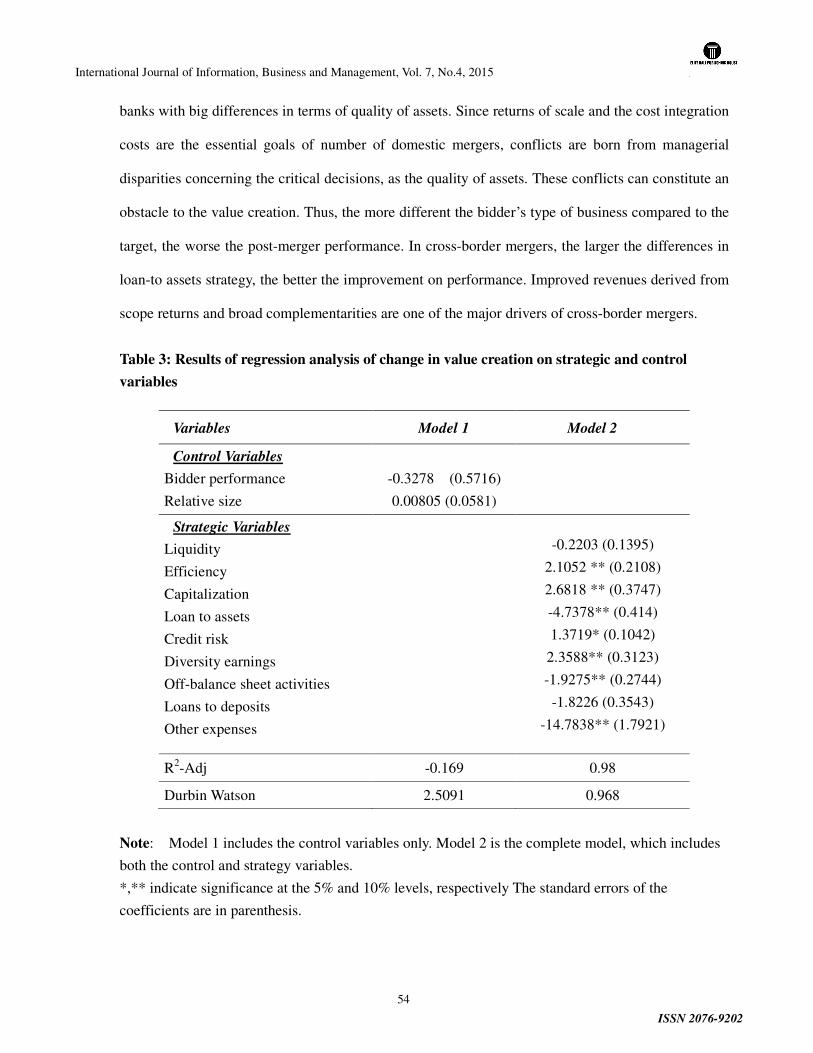
International Journal of Information, Business and Management, Vol. 7, No.4, 2015
ISSN 2076-9202
54
banks with big differences in terms of quality of assets. Since returns of scale and the cost integration
costs are the essential goals of number of domestic mergers, conflicts are born from managerial
disparities concerning the critical decisions, as the quality of assets. These conflicts can constitute an
obstacle to the value creation. Thus, the more different the bidder’s type of business compared to the
target, the worse the post-merger performance. In cross-border mergers, the larger the differences in
loan-to assets strategy, the better the improvement on performance. Improved revenues derived from
scope returns and broad complementarities are one of the major drivers of cross-border mergers.
Table 3: Results of regression analysis of change in value creation on strategic and control
variables
Variables Model 1 Model 2
Control Variables
Bidder performance
Relative size
-0.3278 (0.5716)
0.00805 (0.0581)
Strategic Variables
Liquidity
Efficiency
Capitalization
Loan to assets
Credit risk
Diversity earnings
Off-balance sheet activities
Loans to deposits
Other expenses
-0.2203 (0.1395)
2.1052 ** (0.2108)
2.6818 ** (0.3747)
-4.7378** (0.414)
1.3719* (0.1042)
2.3588** (0.3123)
-1.9275** (0.2744)
-1.8226 (0.3543)
-14.7838** (1.7921)
R2-Adj -0.169 0.98
Durbin Watson 2.5091 0.968
Note: Model 1 includes the control variables only. Model 2 is the complete model, which includes
both the control and strategy variables.
*,** indicate significance at the 5% and 10% levels, respectively The standard errors of the
coefficients are in parenthesis.
International Journal of Information, Business and Management, Vol. 7, No.4, 2015
ISSN 2076-9202
55
Our empirical results also showed a positive relation between differences in strategies among merged
banks in terms of credit risk and the creation of value. This result supports those of Altunbas and
Marquès (2008) in the case of cross-border transactions where improved revenues derived from
scope returns and broad complementarities among merging institutions are one of the major drivers.
For domestic deals, it could be quite costly to integrate heterogeneous institutions in terms of loan
strategies. In other words, the more different the bidder’s type of business compared to the target, the
worse the post-merger performance. Our empirical findings stipulate a positive relation between
differences in terms of diversity earnings and value creation ex-post. This result is consisting with the
theoretical hypothesis stipulating that these differences are able to improve the value creation since
they can help to reach the financial innovation and the new sources of income.
Dissimilarities in off-balance-sheet activities affect negatively the ex-post value creation. This result
is contradictory with the hypothesis suggesting that these dissimilarities will enhance post-merger
performance as they could help spreading access to financial innovation and new sources of revenues.
The differences in other expenses strategy among merged partners affect negatively the potential of
post-merger value creation. Interpretation of this result differs depending on whether the operation is
domestic or cross-border. In the first case, these differences strategy are supposed to create the value.
In the second case, these differences are able to destroy the value due to the risk of incompatibility
among technologies strategies.
Differences in terms of the deposit strategies of merging partners have any impact on post-merger
value creation. This result is contradictory with those of Altunbas and Marquès (2008) suggesting a
positive relation both for the domestic and cross-border mergers, with the effects being stronger for
cross-country mergers, which are normally more difficult to integrate. Differences in liquidity
strategies of merging partners are not meaningful too. It is contradictory to our hypothesis stipulating
that different strategies of liquidity management can imply that one of the two merged banks can
improve its management of liquidity after the merger and enhance thus its performance.
International Journal of Information, Business and Management, Vol. 7, No.4, 2015
ISSN 2076-9202
56
Thus, our empirical findings could not provide us complete evidence on the effect of strategic
differences between the bidder and the target on the value creation following mergers-acquisitions
operations.
5. Conclusion
The objective of this study was to project lights on the bank mergers-acquisitions operations in France
while analyzing the impact of differences between acquirers and targets of two control variables (model 1)
and nine explanatory variables (model 2) on the creation of the value ex post. Variables of control were the
bidder pre-merger performance and the relative size. The explanatory variables were differences in
strategies of liquidity, efficiency, capitalization, loans ratio, loan risk, diversity of incomes, off-balance sheet
activities, deposits activity and other expenses,.
This study has been driven by the importance of the value creation for the shareholders among
indicators of measure and assessment of the bank performance and by the necessity to study the
influence on the value of the French banks of a merger or an acquisition, an important phenomenon
able to modify their trajectory.
Results of the descriptive statistics analysis showed that the banking consolidation operations were
translated, on average, by a destruction of the value of 5.14%, in spite of an increase of the median of
2.018%. So, these operations didn't succeed in getting the discounted results.
The empirical findings showed that the two variable of control (bidder pre-merger value creation and
relative size) were not meaningful. For the explanatory variables, although having a good
explanatory power (R2 adjusted of 98%), they could not provide us complete evidence on the effect
of strategic differences between the bidder and the target on the value creation following
consolidation operations. In fact, only three of them had a negative effect. These variables are the
strategic differences in terms of loans ratio, off-balance sheet activities and other expenses. The
strategic differences in terms of efficiency, capitalization, loan risk, income diversities had a positive
effect. Differences in terms of liquidity and activity of deposits didn't have any impact.
International Journal of Information, Business and Management, Vol. 7, No.4, 2015
ISSN 2076-9202
57
References
� Ahmad, I. and Davidson, I 2005. Further analysis of mergers and shareholder wealth effects in European
banking. Applied Financial Economics.
� Altunbas, Y. and Marques, D. 2008. Mergers and acquisitions and bank performance in Europe: the role of
strategic similarities. Journal of Economics and Business.
� Ayadi, R. and Pujals, G. 2005. Banking mergers and acquisitions in the EU: Overview, assessment and
prospects. SUERF – The European Money and Finance
� Beitel, P. Schiereck, D and Wahrenburg, M. 2004. Explaining M&A success in European Banks. European
Financial Management.
� Beitel, P. and Schiereck, D. 2001. Value Creation at the ongoing consolidation of the European Banking
Market. Institute for Mergers and Acquisitions, working paper 05/01.
� Berger, A.N. Demsetz, R and Strahan, P. 1999. The consolidation of the financial service industry: causes,
consequences and implication for the future. Journal of Banking and Finance.
� Berger, A.N. DeYoung, R. Genay, H. and Udell, G. 2000. Globalization of Financial Institutions: Evidence from
Cross-Border Banking Performance. The Brookings-Wharton Papers on Financial Services.
� Buch, C. and DeLong, G. 2002. Determinants of cross-border mergers: Is Europe different?. In: Herrmann, H.
� Campa, J.M. and Hernando, I. 2004. Shareholder value creation in European M&As. European Financial
Management, 10.
� Cornett, M.M. and Tehranian, H. 1992. Changes in corporate performance as associated with bank
acquisitions. Journal of Financial Economics, 31.
� De Long, G. 2001. Stockholder gains from focusing versus diversifying bank mergers’, Journal of Financial
Economics.
� De Long, G. 2003. Does long term performance of mergers match market expectations? Evidence from the
US Banking Industry. Financial Management.
� Diaz, B. Garcia, M. and Sanfilippo, S. 2004. Bank acquisitions and performance: Evidence from a panel of
European credit entities. Journal of Economics and Business.
� European Central Bank. 2000. Mergers and Acquisitions involving the EU Banking Institutions: Facts and
Implications. European Central Bank, Frankfurt.
� Focarelli, D. Panetta, F and Salleo, C. 2002. Why Do Banks Merge? Journal of Money, Credit and Banking.
� Gual, J. (2004). The integration of E U banking markets. CEPR Discussion Paper. 4212.
� Houston, J.H., and Ryngeart, M.1994. The overall gains from large bank mergers. Journal of banking and
finance.
� Moeller, S. Schlingemann, F. and Stulz, R. 2003. Do shareholders of acquiring firms gain from acquisitions?
NBER Working Paper, 9523.
� Piloff, S.J.1996. Performance changes and shareholder wealth creation associated with mergers of publicly
traded institutions. Journal of Money Banking and Finance.
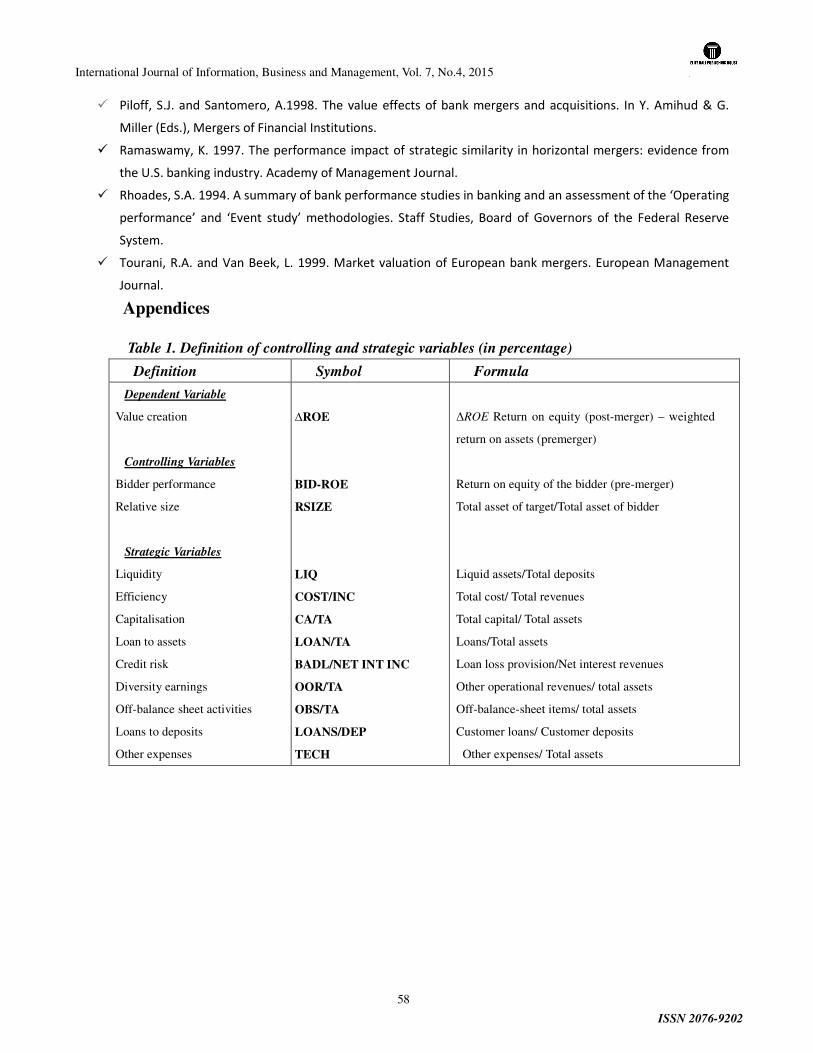
International Journal of Information, Business and Management, Vol. 7, No.4, 2015
ISSN 2076-9202
58
� Piloff, S.J. and Santomero, A.1998. The value effects of bank mergers and acquisitions. In Y. Amihud & G.
Miller (Eds.), Mergers of Financial Institutions.
� Ramaswamy, K. 1997. The performance impact of strategic similarity in horizontal mergers: evidence from
the U.S. banking industry. Academy of Management Journal.
� Rhoades, S.A. 1994. A summary of bank performance studies in banking and an assessment of the ‘Operating
performance’ and ‘Event study’ methodologies. Staff Studies, Board of Governors of the Federal Reserve
System.
� Tourani, R.A. and Van Beek, L. 1999. Market valuation of European bank mergers. European Management
Journal.
Appendices
Table 1. Definition of controlling and strategic variables (in percentage)
Definition Symbol Formula
Dependent Variable
Value creation
Controlling Variables
Bidder performance
Relative size
Strategic Variables
Liquidity
Efficiency
Capitalisation
Loan to assets
Credit risk
Diversity earnings
Off-balance sheet activities
Loans to deposits
Other expenses
∆ROE
BID-ROE
RSIZE
LIQ
COST/INC
CA/TA
LOAN/TA
BADL/NET INT INC
OOR/TA
OBS/TA
LOANS/DEP
TECH
∆ROE Return on equity (post-merger) – weighted
return on assets (premerger)
Return on equity of the bidder (pre-merger)
Total asset of target/Total asset of bidder
Liquid assets/Total deposits
Total cost/ Total revenues
Total capital/ Total assets
Loans/Total assets
Loan loss provision/Net interest revenues
Other operational revenues/ total assets
Off-balance-sheet items/ total assets
Customer loans/ Customer deposits
Other expenses/ Total assets
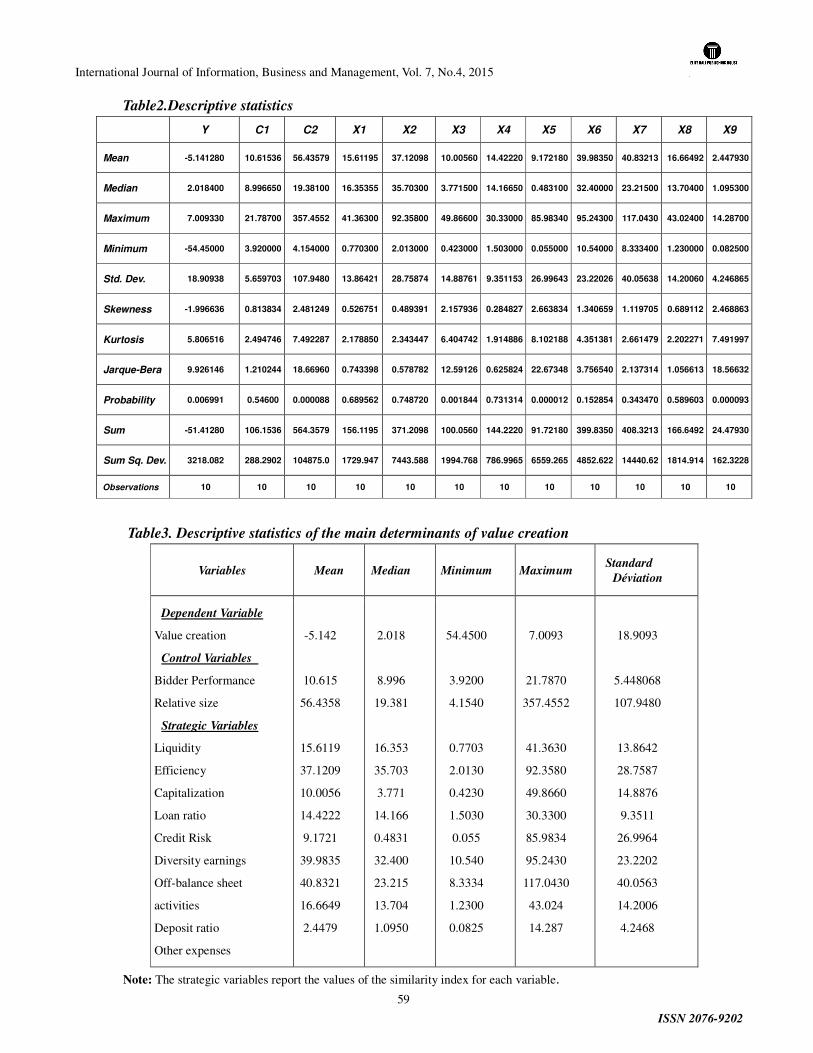
International Journal of Information, Business and Management, Vol. 7, No.4, 2015
ISSN 2076-9202
59
Table2.Descriptive statistics Y C1 C2 X1 X2 X3 X4 X5 X6 X7 X8 X9
Mean -5.141280 10.61536 56.43579 15.61195 37.12098 10.00560 14.42220 9.172180 39.98350 40.83213 16.66492 2.447930
Median 2.018400 8.996650 19.38100 16.35355 35.70300 3.771500 14.16650 0.483100 32.40000 23.21500 13.70400 1.095300
Maximum 7.009330 21.78700 357.4552 41.36300 92.35800 49.86600 30.33000 85.98340 95.24300 117.0430 43.02400 14.28700
Minimum -54.45000 3.920000 4.154000 0.770300 2.013000 0.423000 1.503000 0.055000 10.54000 8.333400 1.230000 0.082500
Std. Dev. 18.90938 5.659703 107.9480 13.86421 28.75874 14.88761 9.351153 26.99643 23.22026 40.05638 14.20060 4.246865
Skewness -1.996636 0.813834 2.481249 0.526751 0.489391 2.157936 0.284827 2.663834 1.340659 1.119705 0.689112 2.468863
Kurtosis 5.806516 2.494746 7.492287 2.178850 2.343447 6.404742 1.914886 8.102188 4.351381 2.661479 2.202271 7.491997
Jarque-Bera 9.926146 1.210244 18.66960 0.743398 0.578782 12.59126 0.625824 22.67348 3.756540 2.137314 1.056613 18.56632
Probability 0.006991 0.54600 0.000088 0.689562 0.748720 0.001844 0.731314 0.000012 0.152854 0.343470 0.589603 0.000093
Sum -51.41280 106.1536 564.3579 156.1195 371.2098 100.0560 144.2220 91.72180 399.8350 408.3213 166.6492 24.47930
Sum Sq. Dev. 3218.082 288.2902 104875.0 1729.947 7443.588 1994.768 786.9965 6559.265 4852.622 14440.62 1814.914 162.3228
Observations 10 10 10 10 10 10 10 10 10 10 10 10
Table3. Descriptive statistics of the main determinants of value creation
Variables Mean Median Minimum Maximum Standard
Déviation
Dependent Variable
Value creation
Control Variables
Bidder Performance
Relative size
Strategic Variables
Liquidity
Efficiency
Capitalization
Loan ratio
Credit Risk
Diversity earnings
Off-balance sheet
activities
Deposit ratio
Other expenses
-5.142
10.615
56.4358
15.6119
37.1209
10.0056
14.4222
9.1721
39.9835
40.8321
16.6649
2.4479
2.018
8.996
19.381
16.353
35.703
3.771
14.166
0.4831
32.400
23.215
13.704
1.0950
54.4500
3.9200
4.1540
0.7703
2.0130
0.4230
1.5030
0.055
10.540
8.3334
1.2300
0.0825
7.0093
21.7870
357.4552
41.3630
92.3580
49.8660
30.3300
85.9834
95.2430
117.0430
43.024
14.287
18.9093
5.448068
107.9480
13.8642
28.7587
14.8876
9.3511
26.9964
23.2202
40.0563
14.2006
4.2468
Note: The strategic variables report the values of the similarity index for each variable.
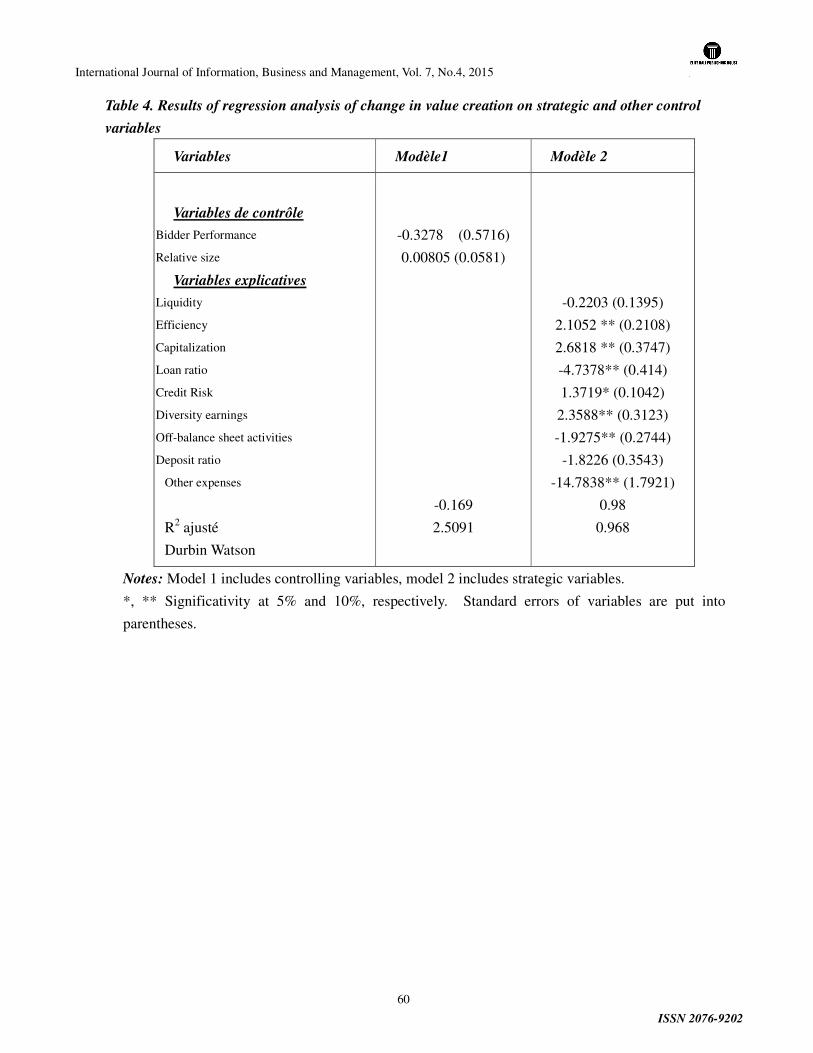
International Journal of Information, Business and Management, Vol. 7, No.4, 2015
ISSN 2076-9202
60
Table 4. Results of regression analysis of change in value creation on strategic and other control
variables
Variables Modèle1 Modèle 2
Variables de contrôle
Bidder Performance
Relative size
Variables explicatives
Liquidity
Efficiency
Capitalization
Loan ratio
Credit Risk
Diversity earnings
Off-balance sheet activities
Deposit ratio
Other expenses
R2 ajusté
Durbin Watson
-0.3278 (0.5716)
0.00805 (0.0581)
-0.169
2.5091
-0.2203 (0.1395)
2.1052 ** (0.2108)
2.6818 ** (0.3747)
-4.7378** (0.414)
1.3719* (0.1042)
2.3588** (0.3123)
-1.9275** (0.2744)
-1.8226 (0.3543)
-14.7838** (1.7921)
0.98
0.968
Notes: Model 1 includes controlling variables, model 2 includes strategic variables.
*, ** Significativity at 5% and 10%, respectively. Standard errors of variables are put into
parentheses.
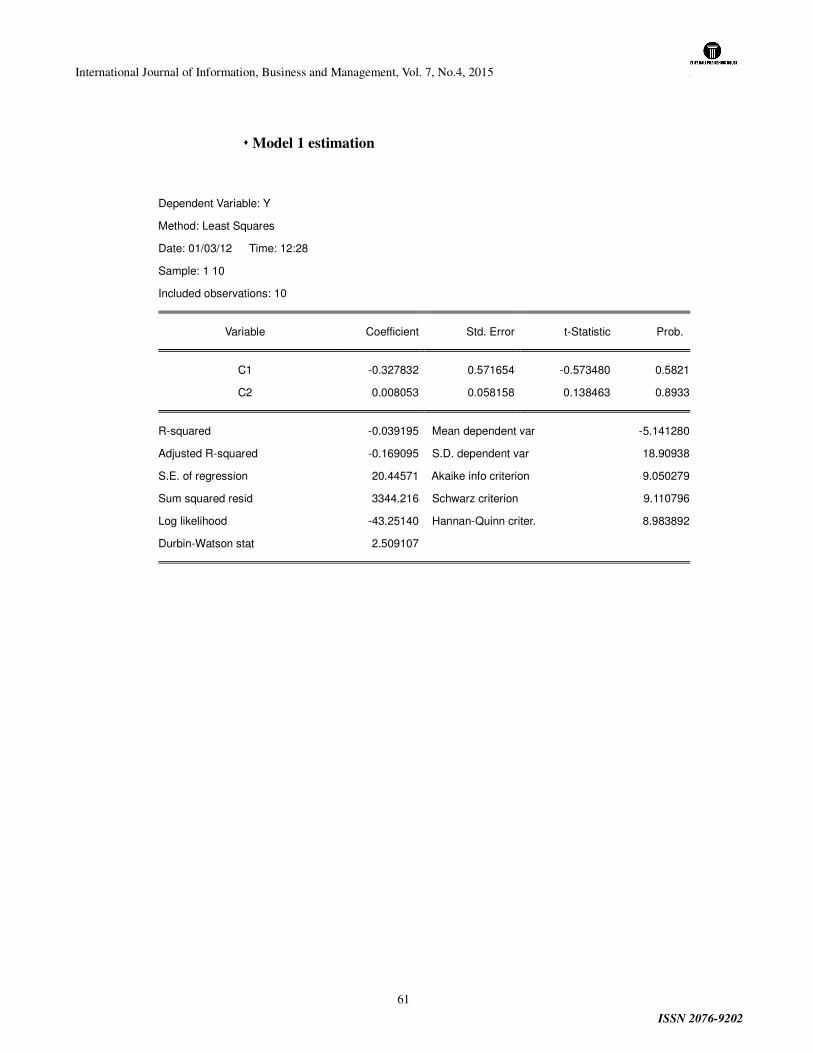
International Journal of Information, Business and Management, Vol. 7, No.4, 2015
ISSN 2076-9202
61
���� Model 1 estimation
Dependent Variable: Y
Method: Least Squares
Date: 01/03/12 Time: 12:28
Sample: 1 10
Included observations: 10
Variable Coefficient Std. Error t-Statistic Prob.
C1 -0.327832 0.571654 -0.573480 0.5821
C2 0.008053 0.058158 0.138463 0.8933
R-squared -0.039195 Mean dependent var -5.141280
Adjusted R-squared -0.169095 S.D. dependent var 18.90938
S.E. of regression 20.44571 Akaike info criterion 9.050279
Sum squared resid 3344.216 Schwarz criterion 9.110796
Log likelihood -43.25140 Hannan-Quinn criter. 8.983892
Durbin-Watson stat 2.509107
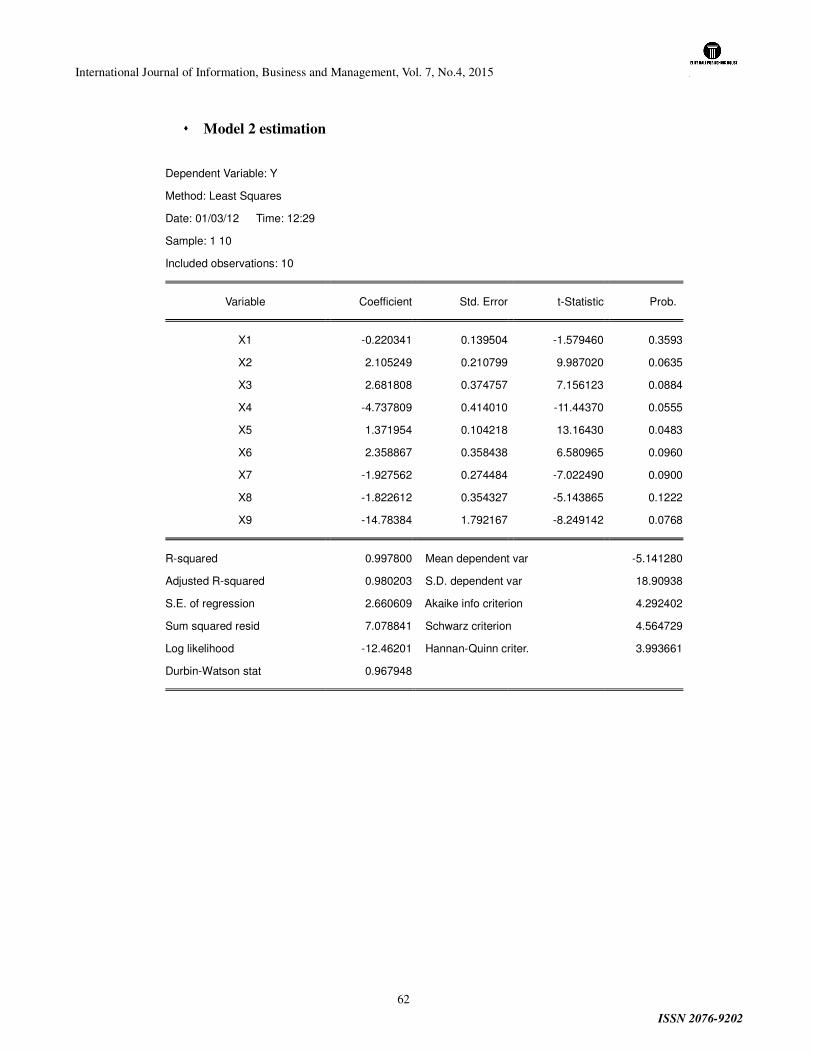
International Journal of Information, Business and Management, Vol. 7, No.4, 2015
ISSN 2076-9202
62
���� Model 2 estimation
Dependent Variable: Y
Method: Least Squares
Date: 01/03/12 Time: 12:29
Sample: 1 10
Included observations: 10
Variable Coefficient Std. Error t-Statistic Prob.
X1 -0.220341 0.139504 -1.579460 0.3593
X2 2.105249 0.210799 9.987020 0.0635
X3 2.681808 0.374757 7.156123 0.0884
X4 -4.737809 0.414010 -11.44370 0.0555
X5 1.371954 0.104218 13.16430 0.0483
X6 2.358867 0.358438 6.580965 0.0960
X7 -1.927562 0.274484 -7.022490 0.0900
X8 -1.822612 0.354327 -5.143865 0.1222
X9 -14.78384 1.792167 -8.249142 0.0768
R-squared 0.997800 Mean dependent var -5.141280
Adjusted R-squared 0.980203 S.D. dependent var 18.90938
S.E. of regression 2.660609 Akaike info criterion 4.292402
Sum squared resid 7.078841 Schwarz criterion 4.564729
Log likelihood -12.46201 Hannan-Quinn criter. 3.993661
Durbin-Watson stat 0.967948
International Journal of Information, Business and Management, Vol. 7, No.4, 2015
ISSN 2076-9202
63
BIBLIOMETRIC ANALYSIS OF THEJOURNAL OF LAW AND
SOCIETY:A THIRTY ONE YEAR’S STUDY FROM 1982-2012
Naveeda Ilahi
Librarian
Abdul Wali Khan University
Mardan
Dr. Muhammad Rafiq
Professor
Department of Information Management
University of Punjab Lahore, Lahore
Dr Haroon Idrees
Assistant Professor
Department of Library & Information Sciences
University of Sargodha, Sargodha
Rahim Jan
Chairman
Department of Library and Information Sciences
KKUK. Karak
Ihsan Ilahi
Mphil Scholar
Department of Management Sciences University of Haripur
Haripur
ABSTARCT
This article describes and analyze the key bibliometrics components of the articles published in
the Journal of Law and Society from 1982-2012. A total of 389 articles were studied in this regard and
resulted that total 224 authors contributed 389 articles either individually or in collaboration. Furthermore
most of the authors were belonging from Peshawar with a very less contribution from other parts of the
country and foreign. Single author’s articles ranked highest. Average citations per article were 5.57
citations and constitutional and administrative law was the most dominant subject of the articles.
International Journal of Information, Business and Management, Vol. 7, No.4, 2015
ISSN 2076-9202
64
INTRODUCTION
The term bibliometrics is usually applied to the quantitative analysis of publications of an
individual, institution or any discipline.All quantitative aspects and models of science communication,
storage, dissemination and retrieval of scientific information come in the circle of bibliometrics.
Bibliometrics developed from the statistical studies of bibliographies. In 1969, Alan Pritchard used the
term bibliometrics in his article Statistical Bibliography or Bibliometrics? That appeared in the December
issue of the Journal of Documentation. He wrote that “Statistical bibliography is awkward, not
descriptive, and can be tangled with statistics itself or bibliographies on statistics” and explained the term
bibliometrics as “thesis of mathematical and statistical methods to books and other media of
communication” (Pritchard, 1969).
The Journal of Law and Society is an HEC (Higher Education Commission) recognized journal
published byLegal Research Centre Law College, University of Peshawar. The college started its
publication in 1982 when it published the first issue of the Journal of Law and Society in July 1982.This
is a bi-annual journal publishing two issues every year in the month of January and July. The scope of the
journal covers issues regarding law and society, their relationship, impact etc. The journal is divided into
three sections: the bulk of the journal is allotted to research articles; the next section “Case Book” is
devoted to the examination of most recent and most important case laws and the last section “Book
Review” is confined to the review of the latest publications in law and social sciences. It is also
interesting to note that the journal is the only law journal published in the country by a public sector
academic institution.
International Journal of Information, Business and Management, Vol. 7, No.4, 2015
ISSN 2076-9202
65
The main purpose of the study is to undertake bibliometric analysis of the articles published in the
Journal of Law and Society from 1982 to 2012. For this purpose standard bibliometric indictors i.e.
authorship patterns including; amount of author’sproductivity, institutional affiliation, collaboration and
country origin along with the subjects covered, number of citations used, number of pages per paper and
year-wise distribution of articles.
REVIEW OF THE RELATED LITERATURE
Bibliometric studies provide an appraisal of the journal literature by making a detail study of
publications in a specific subject. That’s why so much research work has been conducted in this field. In
some bibliometric studies only citations are analyzed while in other studies the bibliographic aspects,
such as quantitative growth of articles by year, authorship pattern, gender distribution, length of paper etc
are studied. Some bibliometric studies under different categories are given below.
Bibliometric Studies in Sciences
Tajuudin (1998) conducted a bibliometric analysis of Journal of Plantation Crops and studied 24
volumes, carrying total 558 articles published from 1973 to 1996; Dihman (2000) analyzed the
Ethnobotony Journal’s volumes from 1989 to 1998 in terms of year-wise distribution, he studied the
nature of authorship, geographic origin of the authors and average length of the papers etc.; Kumar and
Sen (2001) analyzed the articles of Journal of Bio Sciences in respect of citations pattern;Journal of
Structure Chemistry was analyzed by Buznik, Zibareva, and Peletskii & Sorokin in 2004, covering its
volumes published from 1960 to 2002;Narang (2004) conducted study on the bibliometric analysis of
Indian Journal of Pure and Applied Mathematics from 1998 to 2002, covering 8396 citations of 737
International Journal of Information, Business and Management, Vol. 7, No.4, 2015
ISSN 2076-9202
66
articles published in volumes 29 to 33; Bentio, Montesinos, Ferre and Torrento (2005) conducted a study
on differential item functioning to know about the scientific output in the area of differential items
functioning; Indian Journal of Environmental Protection volume 14, 19 & 24 were analyzed through
bibliometric techniques by Braider in 2006; Biswas, Roy &Sen (2007) conducted research on the
Journal of Economics Botany covering its volumes published from 1994 to 2003; Vijay & Raghavan
(2007) analyzed the Journal of Food Sciences & Technologywith its 779 articles along with the citations
in its five volumes 37 (2000) to 41 (2004); Pramama a Physics journal was analyzed by Kumar,
Parakashan & Kalyane(2008), studying its impact factor, types of articles, authorship pattern; Natter
(2009) scientomerically analyzed Indian Journal of Physics covering its volumes from 2004 to 2008 and
observed the authorship pattern, number of pages used per volume etc.; Hamadicharef (2010) conducted
Scientrometric analysis of Journal of Neurolamge. This study covered 11604 articles published from 1992
to 2009.
Bibliometric Studies in Social Sciences
Ching-Chih Chen (1977) carried out citation analysis of the articles of the Bulletin of the
Medical Library Association (BMLA), published in 1966-1975; Tiew (1998) conducted a bibliometric
study of the Journal of Malaysian Branch of the Royal Asiatic society (JAMBRAS),covering all its issues
published from 1987 to 1996; Knight, Hult and Bashaw (2000) analyzed the research productivity in the
Journal of Business Research, covering its articles published from 1985 to 1999; The Bibliometric study
of Malysian Journal of Library and Information Science (1996-2000) was carried out by Tiew (2002);
Mehmood and Sharif (2004) conducted a study on the Pakistani Economic Journals i.e. Pakistan
International Journal of Information, Business and Management, Vol. 7, No.4, 2015
ISSN 2076-9202
67
Development Review (PDR) and Pakistan Economic & Social Review (PESR); Jena (2006) analyzed the
Indian Journal of Fiber and Textile Research (1996-2004); A study was conducted by Katare (2007) on
the Journal of the Indian Society for Cotton Improvement (ISCI); covering its articles published from
1995 to 2004; Verma, Tamrakar and Sharma (2007), conducted study on the contribution in Annals of
Library and Information Studies, which was conceded by covering its issues published from 1999 to 2005;
Naseer & Mehmood (2009) studied Pakistan library and Information Science Journal (1998-2007),
covering 236 articles of 30 issues; Bibliometric review of Korean Journal of Urology, covering the period
from 1960 to 2008 was carried by Yang, Kim & Park (2009); Thanuskodi (2010) conducted a study on
Journal of Social Sciences,covering 273 articles of the issues published during 2003 to 2007; Ahmad
(2011) carried out bibliometric study of the Sarhad Journal of Agriculture, covering its articles published
from 1985 to 2009. Total 2761 articles in its 25 volumes were studied; Pakistan Development Review
(PDR) international economics journal was studied in bibliometric aspects by Jan (2011). Total 1672
articles of the PDRwere studied for this purpose;Electronic Journals in Library and information sciences
were studied by Kaparde (2011) and studied 180 issues of 5 Electronic Journals in library and information
sciences, namely ASLIB, Proceeding Library High Tech, Library Review, Online Information Review,
New Library World from 2005 to 2009; Hussain, Fatima &Kumar (2011), conducted study on Electronic
Journal. They studied total 578 articles published during January 1st 2000 to Dec 31st, 2010; Library
Herald Journal was analyzed by Thanuskodi (2011) and studied the issues published from 2006 to 2010;
Pakistan Journal of Library & Information Science was analyzed by Fatima & Ahmad (2011). Eleven
issues of the journal published from1995 to 2010 were analyzed; Khaparde (2011) studied the
International Journal of Information, Business and Management, Vol. 7, No.4, 2015
ISSN 2076-9202
68
bibliometric aspects of Electronic Journal of Academic and Special Librarianship, covering all the
citations appended to 84 articles published from 2005-2009; Kumar, Tiwari & Deepu (2012) carried out
the bibliometric study of Journal of Contribution to Indian Sociology, covering its issues published from
2000 to 2009. Total 139 articles along with 5386 citations were studied; a bibliometric analysis of the
‘Chinese Librarianship: an International electronic journal was done by Husain & Fatima; Swain carried
out the bibliometric study of Journal of Intellectual Property Rights covering its issues published from
2002 to 2010. Total 1541 journal citations appended to 332 articles were analyzed.
Bibliometric Studies in Law
The only study reported in the literature about law journal was made by Kaur (2006) in order to
study the bibliometric aspects, characteristics and trends of the research articles published in the
Malaysian Law Journal. For this purpose 479 articles from different editorial periods were selected by
stratified random sampling.
STATEMENT OF THE PROBLEM
Literature presents gaps in terms of publication patterns in law publications in Pakistan. No
bibliometric study of any law journal has been conducted so far in the country to assess the patterns of
publications in this domain of scholarship. Hence, keeping in view the importance of the journal in the
field of law, there is intense need to analyze the said journal by using the bibliometrics methods that will
ultimately help us to understand the patterns of publication in this subject. Journal of Law and Society is a
premier scholarly journal published by Legal Research Centre, LawCollege, University of Peshawar. This
study will help to know the authorship pattern, author collaboration, country of origin, topics covered,
International Journal of Information, Business and Management, Vol. 7, No.4, 2015
ISSN 2076-9202
69
number of citation used of this journal.
RESEARCH OBJECTIVES
The main purpose of the study is to undertake bibliometric analysis of the articles published in the
Journal of Law and Society from 1982 to 2012. In order to meet the following research objectives:
1. To understand the authorship pattern of published articles in terms of :
• Authors’ Productivity
• Extent of authors’ collaboration
• Authors’ institutional affiliation
• Authors’ geographic affiliation
2. To assess the subjects, these papers do cover.
3. To know the number of citations these papers are cited.
4. To find out the size of papers in terms of number of pages.
5. To find out year wise distribution of the articles.
LIMITATION OF THE STUDY
This study covered the issues of the journal published during 1982 to 2012.The limitations of the
study were that Journal of Law and Society started it from the July issue (mean the first January issue was
not published), and then college also didn’t publish any issue in the year 1984 due to financial problems.
Furthermore January issue of 1987 and 2008 were missing in the journals record.
SIGNIFICANCE OF THE STUDY
The importance of law in society and social sciences can never be ignored. To govern the system
International Journal of Information, Business and Management, Vol. 7, No.4, 2015
ISSN 2076-9202
70
smoothly, a set of rules is implemented by the government. Law is the soul of all fields of life i.e. politics,
economics and society.
It supports a large source of scholarly inquiry into legal history, philosophy, economic analysis and
sociology. It helps in all the simple and complex issues of life regarding justice and equality, creating a
great literature which is important for the future development of their fields. The law through legislative
and administrative responses to new social conditions and ideas as well as through judicial interpretation
of constitution statutes not only articulate but also set the courses for major changes. All such course
/Literature needs to be analyzed to observe the prevailing needs and trends in the field.
The study is an attempt to examine the characteristics of research trends published in the journal of
Law and Society. It is the first ever bibliometrics study of any law journal in Pakistan. Hence, the study
will be very helpful for the researchers, teachers, students and policy makers to understand current focus
of the authors and researchers in the field of law. The findings of the study will also help us to understand
the publishing trends of the Journal of Law and Society. It will be helpful for editorial team as well as the
university administration. The study will also open up this important area for researchers to conduct such
studies on other journals published in the country.
RESEARCH DESIGN AND METHODOLOGY
Using bibliometric method of analysis this study scanned the characteristics and trendsof the papers
published in the Journal of Law and Society, University of Peshawar. Owing to this all the papers of
Journal of Law and Society published from1982 to 2012 were analyzed. In determining the authors’
institutional and geographic affiliation, addresses given in the papers were considered; however where
International Journal of Information, Business and Management, Vol. 7, No.4, 2015
ISSN 2076-9202
71
this information was not mentioned was considered and marked as unknown. In case of double or triple
authorship if both or all the three authors belong to one place, then the same place was considered only
one time. However if their place of belongings was different then geographical affiliation was considered
different. The subject of the papers were decided and determined by using Dewy Decimal Classification
Scheme (DDC) 22nd edition.. In counting citations, citations and their references whether given in the
footnotes or end notes were counted as references. However, in counting citations ibid and op.cit were
ignored.Where no bibliography or references were given then the material used were considered as
references. Annexure containing any type of data was included in the articles while counting its pages.
Similarly last page of the article whether half or having only one line was considered full page.A total of
389 articles published in 29 volumes of Journal of Law and Society from 1982 to 2012, were the subject
of the study.To record the data, a basic and primary database was created first in MS-Accesswith a
table of columns for different categories of information i.e. year , volume no, issue no, subject of the
articles, keywords, author, institutional affiliations, geographic affiliations’, number of citations, number
of pages etc. To perform calculations on the data, a second and final database was created in MS-Excel
having columns of different categories of information.
FINDINGS AND DISCUSSION
Authorship Patterns
Amount of Author Productivity:
A total of 224 authorscontributed 389 articles in 48 issues of the Journal of Law and Society
published from 1982 to 2009. Table 1 shows the author productivity based on the number of articles an
International Journal of Information, Business and Management, Vol. 7, No.4, 2015
ISSN 2076-9202
72
author has contributed. The maximumnumbers of authors contributing to an article as shared authorship
were five. The data collected shows that majority of authors (118, 52.67%) contributed one article
individually or in collaboration. In addition to this 43 (19.19%) of the authors contributed two articles,
14 (6.25%) contributed three, 13 (65.80%) contributed four and 10 (4.46%) contributed five papers. The
highest numbers of articles contributed by an individual author were 29.
Table 1: Amount of authors’ productivity No of Articles No of Authors Percentage 1 118 52.67 2 43 19.19 3 14 6.25 4 13 5.80 5 10 4.46 6 3 1.33 7 2 0.89 8 5 2.23 9 2 0.89 10 2 0.89 11 2 0.8 12 2 0.89 14 4 1.78 15 1 0.45 19 1 0.45 21 1 0.45 29 1 0.45 Total 224 99.96%
Collaborative Authorship
Out of total 389 articles, 248 (638%) were the result of individual efforts while only 141(36.24%)
papers were the result of collaborative authorship. In this collaborations, two authored papers were
highest with63 (16.2%), following by three authored papers with 47(12.1%), four authored papers were
with27 (6.9%) and five authored papers 4(1.03%). Table 2 present the position of authors’ collaboration in
regard of Journal of Law and Society.
Table 2: State of authors’ collaborations Authorship Number of Papers Percentage
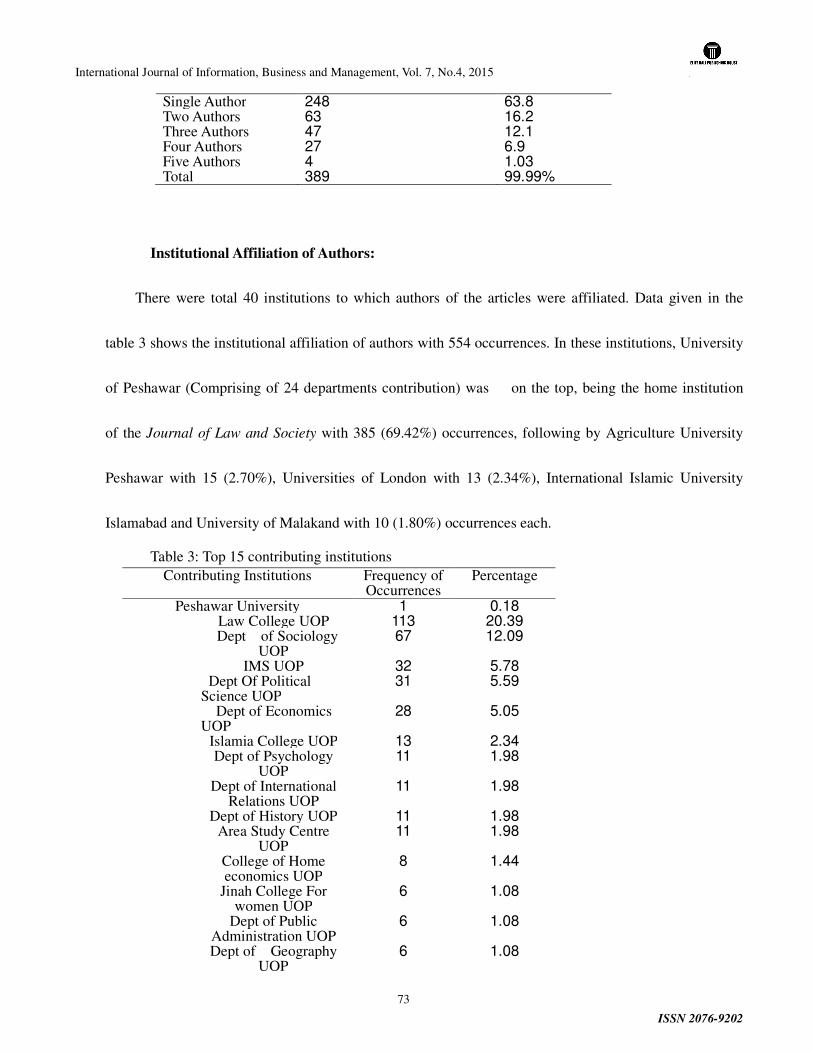
International Journal of Information, Business and Management, Vol. 7, No.4, 2015
ISSN 2076-9202
73
Single Author 248 63.8 Two Authors 63 16.2 Three Authors 47 12.1 Four Authors 27 6.9 Five Authors 4 1.03 Total 389 99.99%
Institutional Affiliation of Authors:
There were total 40 institutions to which authors of the articles were affiliated. Data given in the
table 3 shows the institutional affiliation of authors with 554 occurrences. In these institutions, University
of Peshawar (Comprising of 24 departments contribution) was on the top, being the home institution
of the Journal of Law and Society with 385 (69.42%) occurrences, following by Agriculture University
Peshawar with 15 (2.70%), Universities of London with 13 (2.34%), International Islamic University
Islamabad and University of Malakand with 10 (1.80%) occurrences each.
Table 3: Top 15 contributing institutions Contributing Institutions Frequency of
Occurrences Percentage
Peshawar University 1 0.18 Law College UOP 113 20.39
Dept of Sociology UOP
67 12.09
IMS UOP 32 5.78 Dept Of Political Science UOP
31 5.59
Dept of Economics UOP
28 5.05
Islamia College UOP 13 2.34 Dept of Psychology
UOP 11 1.98
Dept of International Relations UOP
11 1.98
Dept of History UOP 11 1.98 Area Study Centre
UOP 11 1.98
College of Home economics UOP
8 1.44
Jinah College For women UOP
6 1.08
Dept of Public Administration UOP
6 1.08
Dept of Geography UOP
6 1.08
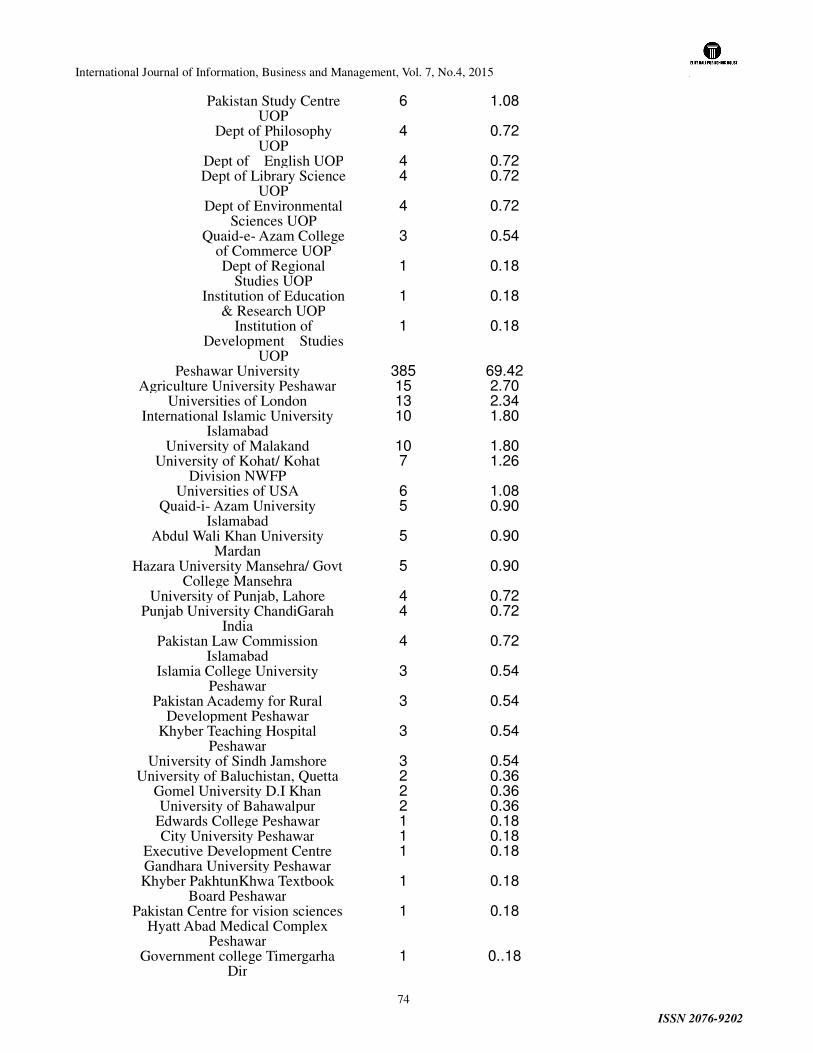
International Journal of Information, Business and Management, Vol. 7, No.4, 2015
ISSN 2076-9202
74
Pakistan Study Centre UOP
6 1.08
Dept of Philosophy UOP
4 0.72
Dept of English UOP 4 0.72 Dept of Library Science
UOP 4 0.72
Dept of Environmental Sciences UOP
4 0.72
Quaid-e- Azam College of Commerce UOP
3 0.54
Dept of Regional Studies UOP
1 0.18
Institution of Education & Research UOP
1 0.18
Institution of Development Studies
UOP
1 0.18
Peshawar University 385 69.42 Agriculture University Peshawar 15 2.70
Universities of London 13 2.34 International Islamic University
Islamabad 10 1.80
University of Malakand 10 1.80 University of Kohat/ Kohat
Division NWFP 7 1.26
Universities of USA 6 1.08 Quaid-i- Azam University
Islamabad 5 0.90
Abdul Wali Khan University Mardan
5 0.90
Hazara University Mansehra/ Govt College Mansehra
5 0.90
University of Punjab, Lahore 4 0.72 Punjab University ChandiGarah
India 4 0.72
Pakistan Law Commission Islamabad
4 0.72
Islamia College University Peshawar
3 0.54
Pakistan Academy for Rural Development Peshawar
3 0.54
Khyber Teaching Hospital Peshawar
3 0.54
University of Sindh Jamshore 3 0.54 University of Baluchistan, Quetta 2 0.36
Gomel University D.I Khan 2 0.36 University of Bahawalpur 2 0.36
Edwards College Peshawar 1 0.18 City University Peshawar 1 0.18
Executive Development Centre Gandhara University Peshawar
1 0.18
Khyber PakhtunKhwa Textbook Board Peshawar
1 0.18
Pakistan Centre for vision sciences Hyatt Abad Medical Complex
Peshawar
1 0.18
Government college Timergarha Dir
1 0..18
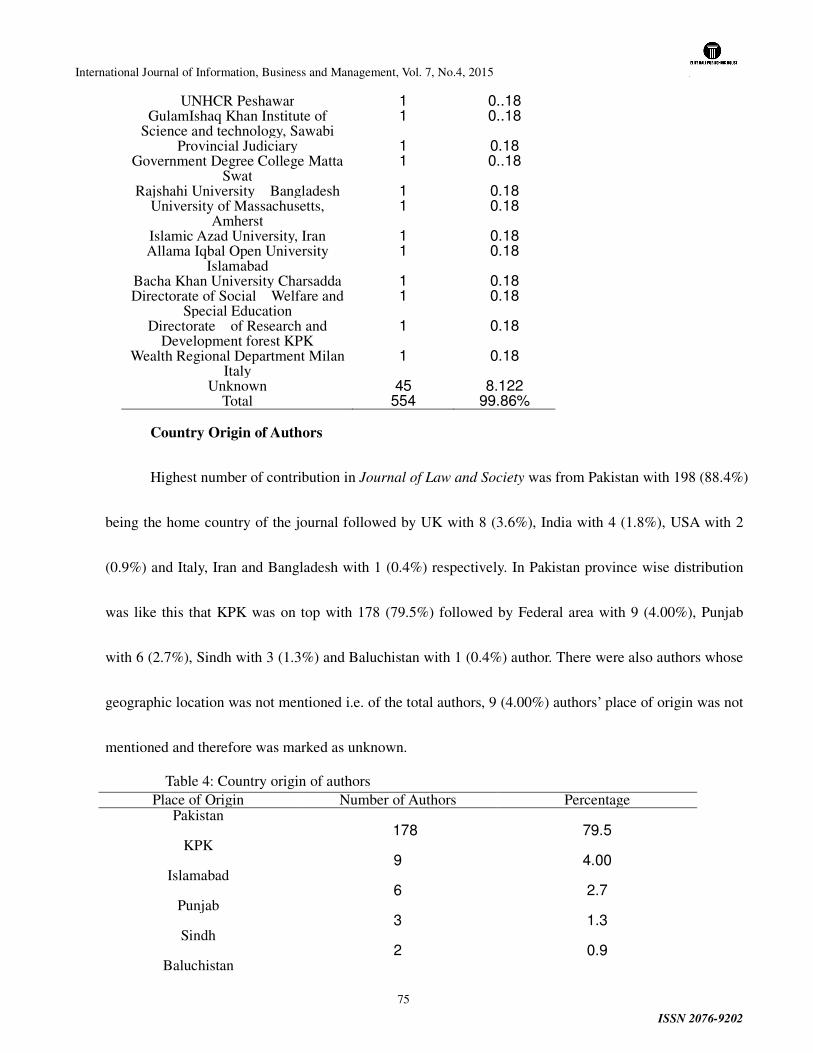
International Journal of Information, Business and Management, Vol. 7, No.4, 2015
ISSN 2076-9202
75
UNHCR Peshawar 1 0..18 GulamIshaq Khan Institute of
Science and technology, Sawabi 1 0..18
Provincial Judiciary 1 0.18 Government Degree College Matta
Swat 1 0..18
Rajshahi University Bangladesh 1 0.18 University of Massachusetts,
Amherst 1 0.18
Islamic Azad University, Iran 1 0.18 Allama Iqbal Open University
Islamabad 1 0.18
Bacha Khan University Charsadda 1 0.18 Directorate of Social Welfare and
Special Education 1 0.18
Directorate of Research and Development forest KPK
1 0.18
Wealth Regional Department Milan Italy
1 0.18
Unknown 45 8.122 Total 554 99.86%
Country Origin of Authors
Highest number of contribution in Journal of Law and Society was from Pakistan with 198 (88.4%)
being the home country of the journal followed by UK with 8 (3.6%), India with 4 (1.8%), USA with 2
(0.9%) and Italy, Iran and Bangladesh with 1 (0.4%) respectively. In Pakistan province wise distribution
was like this that KPK was on top with 178 (79.5%) followed by Federal area with 9 (4.00%), Punjab
with 6 (2.7%), Sindh with 3 (1.3%) and Baluchistan with 1 (0.4%) author. There were also authors whose
geographic location was not mentioned i.e. of the total authors, 9 (4.00%) authors’ place of origin was not
mentioned and therefore was marked as unknown.
Table 4: Country origin of authors Place of Origin Number of Authors Percentage
Pakistan
KPK 178 79.5
Islamabad
9 4.00
Punjab
6 2.7
Sindh
3 1.3
Baluchistan
2 0.9
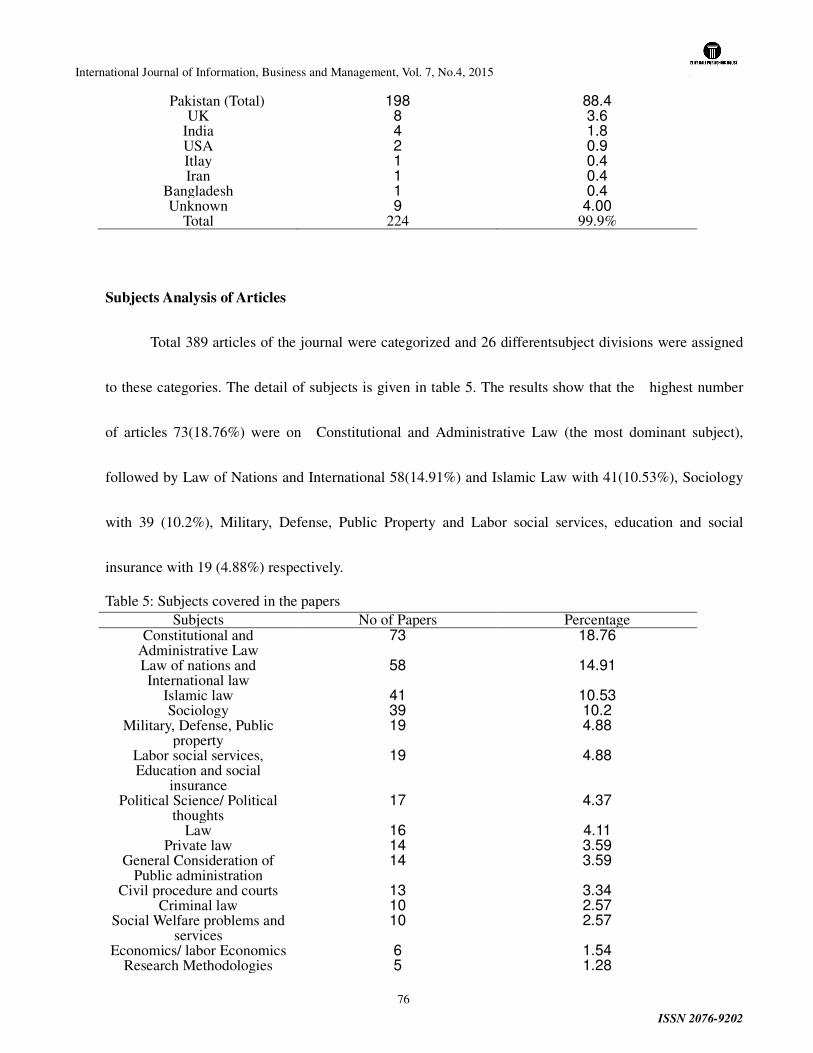
International Journal of Information, Business and Management, Vol. 7, No.4, 2015
ISSN 2076-9202
76
Pakistan (Total) 198 88.4 UK 8 3.6
India 4 1.8 USA 2 0.9 Itlay 1 0.4 Iran 1 0.4
Bangladesh 1 0.4 Unknown 9 4.00
Total 224 99.9%
Subjects Analysis of Articles
Total 389 articles of the journal were categorized and 26 differentsubject divisions were assigned
to these categories. The detail of subjects is given in table 5. The results show that the highest number
of articles 73(18.76%) were on Constitutional and Administrative Law (the most dominant subject),
followed by Law of Nations and International 58(14.91%) and Islamic Law with 41(10.53%), Sociology
with 39 (10.2%), Military, Defense, Public Property and Labor social services, education and social
insurance with 19 (4.88%) respectively.
Table 5: Subjects covered in the papers Subjects No of Papers Percentage
Constitutional and Administrative Law
73 18.76
Law of nations and International law
58 14.91
Islamic law 41 10.53 Sociology 39 10.2
Military, Defense, Public property
19 4.88
Labor social services, Education and social
insurance
19 4.88
Political Science/ Political thoughts
17 4.37
Law 16 4.11 Private law 14 3.59
General Consideration of Public administration
14 3.59
Civil procedure and courts 13 3.34 Criminal law 10 2.57
Social Welfare problems and services
10 2.57
Economics/ labor Economics 6 1.54 Research Methodologies 5 1.28
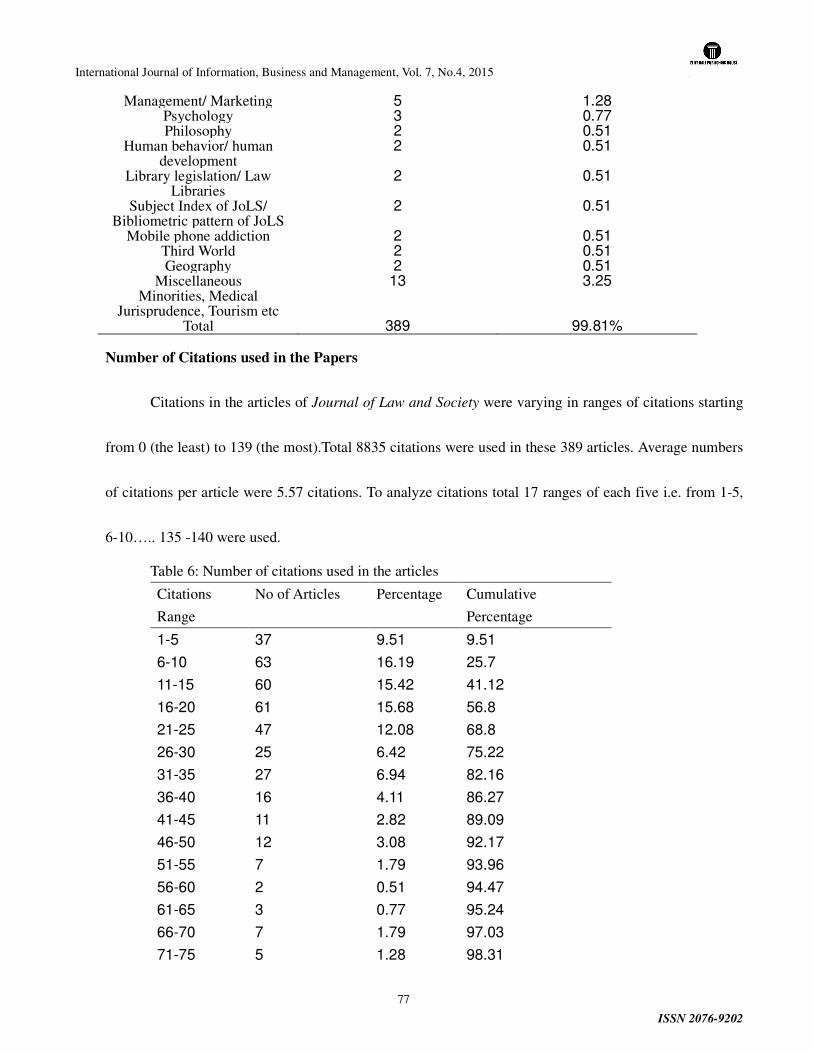
International Journal of Information, Business and Management, Vol. 7, No.4, 2015
ISSN 2076-9202
77
Management/ Marketing 5 1.28 Psychology 3 0.77 Philosophy 2 0.51
Human behavior/ human development
2 0.51
Library legislation/ Law Libraries
2 0.51
Subject Index of JoLS/ Bibliometric pattern of JoLS
2 0.51
Mobile phone addiction 2 0.51 Third World 2 0.51 Geography 2 0.51
Miscellaneous Minorities, Medical
Jurisprudence, Tourism etc
13 3.25
Total 389 99.81%
Number of Citations used in the Papers
Citations in the articles of Journal of Law and Society were varying in ranges of citations starting
from 0 (the least) to 139 (the most).Total 8835 citations were used in these 389 articles. Average numbers
of citations per article were 5.57 citations. To analyze citations total 17 ranges of each five i.e. from 1-5,
6-10….. 135 -140 were used.
Table 6: Number of citations used in the articles
Citations
Range
No of Articles Percentage Cumulative
Percentage
1-5 37 9.51 9.51
6-10 63 16.19 25.7
11-15 60 15.42 41.12
16-20 61 15.68 56.8
21-25 47 12.08 68.8
26-30 25 6.42 75.22
31-35 27 6.94 82.16
36-40 16 4.11 86.27
41-45 11 2.82 89.09
46-50 12 3.08 92.17
51-55 7 1.79 93.96
56-60 2 0.51 94.47
61-65 3 0.77 95.24
66-70 7 1.79 97.03
71-75 5 1.28 98.31
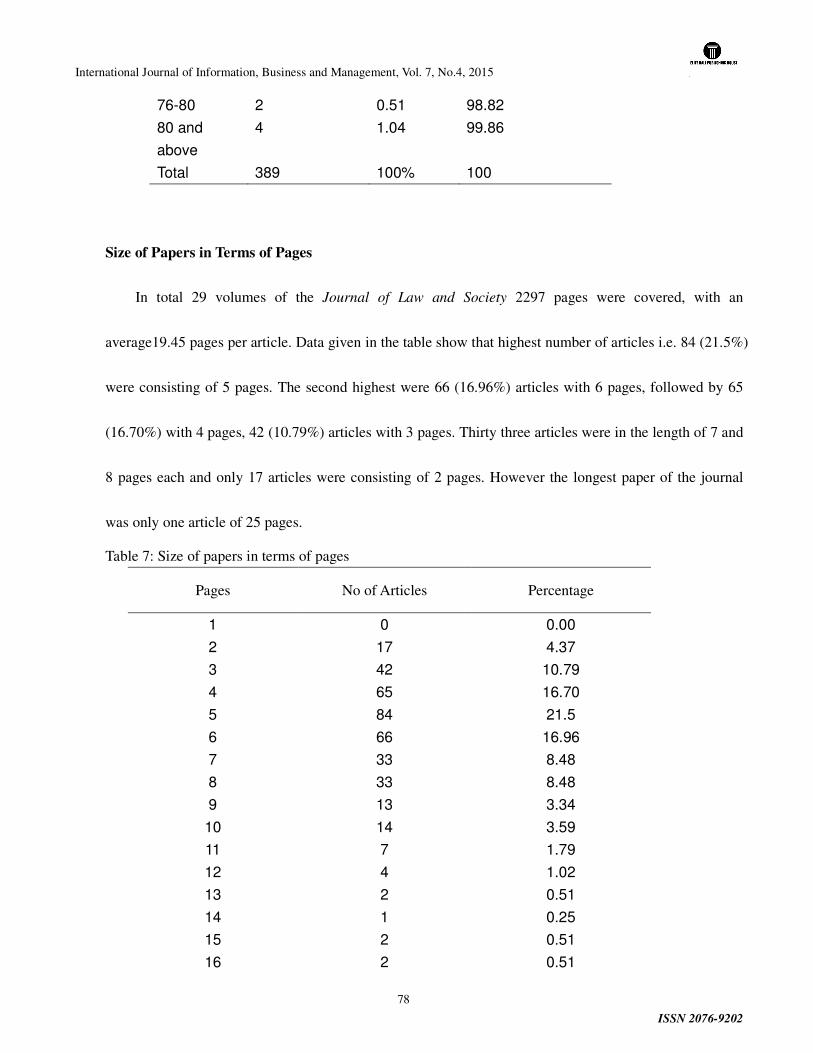
International Journal of Information, Business and Management, Vol. 7, No.4, 2015
ISSN 2076-9202
78
76-80 2 0.51 98.82
80 and
above
4 1.04 99.86
Total 389 100% 100
Size of Papers in Terms of Pages
In total 29 volumes of the Journal of Law and Society 2297 pages were covered, with an
average19.45 pages per article. Data given in the table show that highest number of articles i.e. 84 (21.5%)
were consisting of 5 pages. The second highest were 66 (16.96%) articles with 6 pages, followed by 65
(16.70%) with 4 pages, 42 (10.79%) articles with 3 pages. Thirty three articles were in the length of 7 and
8 pages each and only 17 articles were consisting of 2 pages. However the longest paper of the journal
was only one article of 25 pages.
Table 7: Size of papers in terms of pages
Pages No of Articles Percentage
1 0 0.00
2 17 4.37
3 42 10.79
4 65 16.70
5 84 21.5
6 66 16.96
7 33 8.48
8 33 8.48
9 13 3.34
10 14 3.59
11 7 1.79
12 4 1.02
13 2 0.51
14 1 0.25
15 2 0.51
16 2 0.51
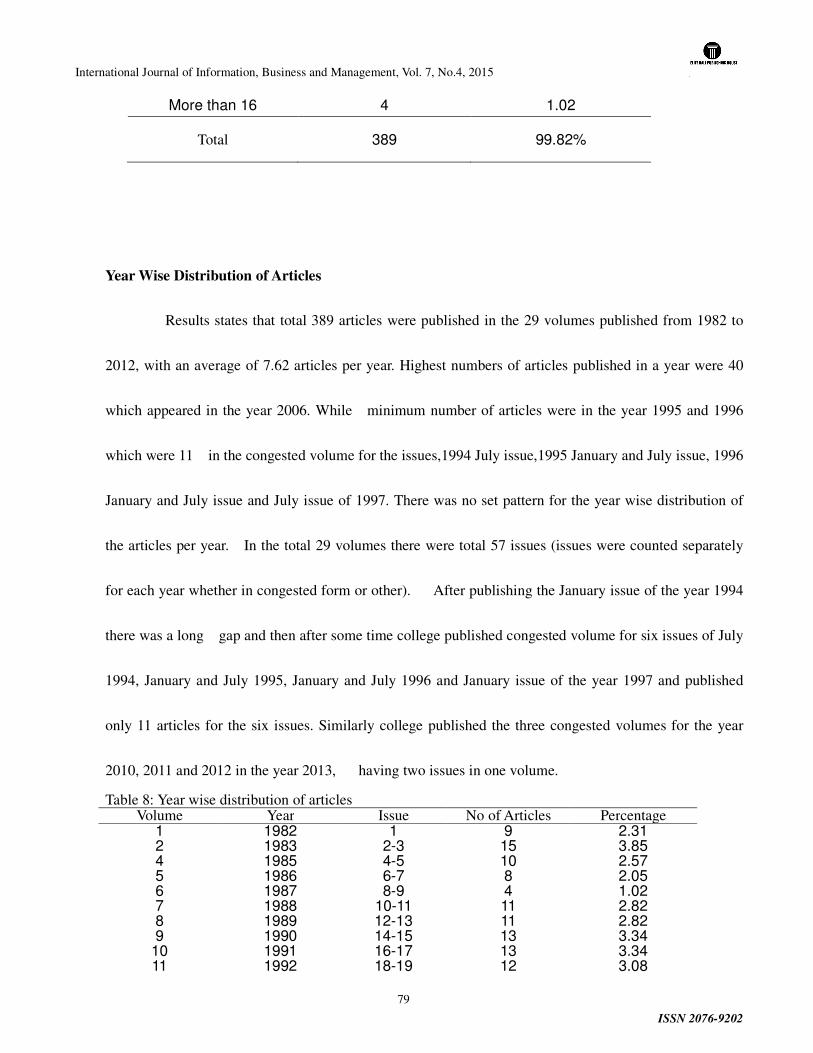
International Journal of Information, Business and Management, Vol. 7, No.4, 2015
ISSN 2076-9202
79
More than 16 4 1.02
Total 389 99.82%
Year Wise Distribution of Articles
Results states that total 389 articles were published in the 29 volumes published from 1982 to
2012, with an average of 7.62 articles per year. Highest numbers of articles published in a year were 40
which appeared in the year 2006. While minimum number of articles were in the year 1995 and 1996
which were 11 in the congested volume for the issues,1994 July issue,1995 January and July issue, 1996
January and July issue and July issue of 1997. There was no set pattern for the year wise distribution of
the articles per year. In the total 29 volumes there were total 57 issues (issues were counted separately
for each year whether in congested form or other). After publishing the January issue of the year 1994
there was a long gap and then after some time college published congested volume for six issues of July
1994, January and July 1995, January and July 1996 and January issue of the year 1997 and published
only 11 articles for the six issues. Similarly college published the three congested volumes for the year
2010, 2011 and 2012 in the year 2013, having two issues in one volume.
Table 8: Year wise distribution of articles Volume Year Issue No of Articles Percentage
1 1982 1 9 2.31 2 1983 2-3 15 3.85 4 1985 4-5 10 2.57 5 1986 6-7 8 2.05 6 1987 8-9 4 1.02 7 1988 10-11 11 2.82 8 1989 12-13 11 2.82 9 1990 14-15 13 3.34 10 1991 16-17 13 3.34 11 1992 18-19 12 3.08
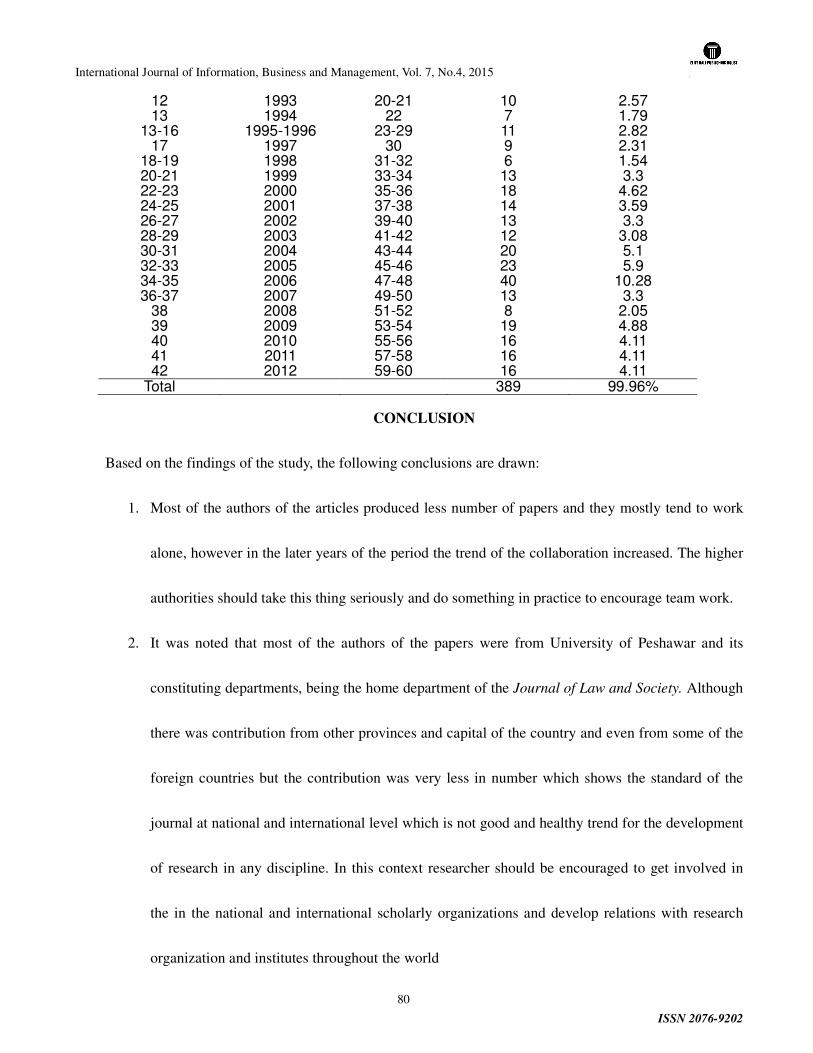
International Journal of Information, Business and Management, Vol. 7, No.4, 2015
ISSN 2076-9202
80
12 1993 20-21 10 2.57 13 1994 22 7 1.79
13-16 1995-1996 23-29 11 2.82 17 1997 30 9 2.31
18-19 1998 31-32 6 1.54 20-21 1999 33-34 13 3.3 22-23 2000 35-36 18 4.62 24-25 2001 37-38 14 3.59 26-27 2002 39-40 13 3.3 28-29 2003 41-42 12 3.08 30-31 2004 43-44 20 5.1 32-33 2005 45-46 23 5.9 34-35 2006 47-48 40 10.28 36-37 2007 49-50 13 3.3
38 2008 51-52 8 2.05 39 2009 53-54 19 4.88 40 2010 55-56 16 4.11 41 2011 57-58 16 4.11 42 2012 59-60 16 4.11
Total 389 99.96%
CONCLUSION
Based on the findings of the study, the following conclusions are drawn:
1. Most of the authors of the articles produced less number of papers and they mostly tend to work
alone, however in the later years of the period the trend of the collaboration increased. The higher
authorities should take this thing seriously and do something in practice to encourage team work.
2. It was noted that most of the authors of the papers were from University of Peshawar and its
constituting departments, being the home department of the Journal of Law and Society. Although
there was contribution from other provinces and capital of the country and even from some of the
foreign countries but the contribution was very less in number which shows the standard of the
journal at national and international level which is not good and healthy trend for the development
of research in any discipline. In this context researcher should be encouraged to get involved in
the in the national and international scholarly organizations and develop relations with research
organization and institutes throughout the world
International Journal of Information, Business and Management, Vol. 7, No.4, 2015
ISSN 2076-9202
81
3. A great number of subjects are covered by the journals however there is still need to take serious
attention to the journal and incorporate emerging topics in the new area must be covered.
RECOMENDATIONS
The following recommendations are suggested on the basis of the results and conclusion of the
study.
• As collaborative research efforts improve the quality of papers, therefore an effort should
be made for the promotion of team research and collaborative work.
• Legal Centre Law College University of Peshawar, ought to give serious attention to
motivate researchers, through conferences, seminars and trainings to encourage research
at national and international level, Which in turn will not only improve the quality of
research but also will make it a trend and the Journal will develop.
• The college ought to set a proper pattern/ format for the publishing of papers in the
journal. This will bring uniformity in paper formats, especially in giving references and
citations, and papers without citations should be avoid in publishing because it’s actually
citations which shows the quality of a paper.
• The editorial board should make serious efforts to attract researchers from countries and
encourage authors to the papers written in national and international collaboration.
• Scope of the journal should be defined so clearly that papers on all aspects of law and
society should be contributed.
International Journal of Information, Business and Management, Vol. 7, No.4, 2015
ISSN 2076-9202
82
• There is an urgent need for conducting a citation analysis of the papers published in the
Journal of Law and Society.
REFERENCES
Ahmad, S. Bibliometric analysis of Sarhad Journal of Agriculture (1985-2009).Department of Library & Information Science.University of the Punjab. Lahore.
Ahmad, S., &Mahmood, K. (2011). Library and Information Science Education in Pakistan: A Decade of Development - 2000 to 2009. Pakistan Library & Information Science Journal, 42(3), 3-12.
Anyi, K. W. U., Zainab, A. N., &Anuar, N. B. (2009).Bibliometric studies on single journals: a review. Malaysian Journal of Library & Information Science, 14(1), 17-55.
Begum, D., &Goswami, A. (2003).Development of Public Libraries and Library Legislation in Assam.Herald of Library Science, 42(3/4), 170-177.
BENITO, J. G., MONTESINOS, M. D. H., FERRÉ, G. G., & TORRENTE, M. M. (2005). A bibliometric study of differential item functioning. Scientometrics, 64(1), 3-16.
Bibliometrics. (2012). Retrieved 25th July 2012, from Wikipedia http://en.wikipedia.org/wiki/Law
Bibliometrics. (2012). Retrieved 21 Aug. 2012 from Oxford English Dictionary www.oed.com/view/Entry/241665
Biswas, B. C., Roy, A., &Sen, B. K. (2007). Economic Botany: A Bibliometric Study. Malaysian Journal of Library & Information Science, 12(1), 23-33.
Braider, B. S. (2006). Indian Journal of Environmental Protection: A study of citation pattern. Annals of Library and Information Studies, 53(3), 109-113.
Buznik, V., Zibareva, I., Piottukh-Peletskii, V., & Sorokin, N. (2004).Bibliometric Analysis of the Journal of Structural Chemistry.Journal of Structural Chemistry, 45(6), 1096-1106
Das, A. K., &Sen, B. K. (2001). Journal of Biosciences: An analysis of citation pattern. Annals of Library and Information Studies, 48(2), 59-63.
Dhiman, A. K. (2000). Ethnobotony Journal: A ten years bibliometric study. IASLIC Bulletin, 45(4), 177-182.
Dixit, S., &Katare, V. V. (2007).A bibliomeric analysis of the 'Journal of the Indian Society for Cotton Improvement' (1995-2004).Annals of Library & Information Studies, 54(2), 9-9..
International Journal of Information, Business and Management, Vol. 7, No.4, 2015
ISSN 2076-9202
83
Egghe, L. & Rousseau, R. (1990). Introduction to informatics: Quantative methods in library, documentation and information science, Amsterdam, the Netherlands: Elsevier.
Fairthorne, R. A. (1969). Progress in documentation.Empirical Hyperbolic Distributions (bradford-zipf-mandelbrot) For Bibliometric Description & Predict, 25(4), 319-343.
Garfield, E. (1955). Citation indexes for science: a new dimension in documentation through association of ideas. Science, 122(3159), 108-111.
Gebken, R., Strong, S., &McCarary, S. (2009). Research Publication Trends and Topics in the Journal of Industrial Technology.Journal of Industrial Technology, 25(1), 1-8.
Hamadicharef, B. (2010). Scientometric study of the Journal Neuroimage 1992-2009. Paper presented at the International Conference on Web Information System and Mining (WISM 10). http://www.elsevier.com/locate/ynming
Hazarika, T., Goswami, K., & Das, P. (2003).Bibliometric analysis of Indain Forester: 1991-2000. IASLIC Bulletin, 48(4), 213-223.
Hirsch, J. E. (2005). An index to quantify an individual's scientific research output.Proceeding of the National Academy of Sciences of the United States of America, 102(46), 16569-16572.
Hulme, E. W. (1923). Statistical bibliograohy in relation to the growth of modern civilization. London: Grafton & Co.
Hussain, A., & Fatima, N. (2011). A Bibliometric Analysis of the 'Chinese Librarianship: an International Electronic Journal, (2006-2010)'. Chinese Librarianship(31), 1-14.
Hussain, A., Fatima, N., & Kumar, D. (June, 2011). Bibliometric analysis of the 'Electronic Library' journal (2000-2010) Webology, 8(1).
Jan, S. (2012). Bibliometric Analysis of Pakistan Development Review (PDR) (1979-2010). Department of Library & Information Science.University of the Punjab. Lahore.
Jena, K. L. (2006). A bibliometric analysis of the journal 'Indian Journal of Fibre and Textile Research, 19996-2004.'.Annals of Library & Information Studies, 53(1), 4-4.
JEUELL, C. A., FRANCISCO, C. B., & PORT, J. S. (April, 1977). Brief Survey of Public Information Services at Privately-Supported Medical School Libraries: Comparison with Publicly Supported Medical School Libraries. Bull. Med. Libr. Assoc., 65(2), 290-292.
Kaur, H. (2006). Bibliometric Study of Malayan Law Journal Articles.Legal Information Management, 6(1), 49-54.
Khaparde, D. V. (2011). E-Journals in library and Information Science: A Bibliometric Study. International Journal of Humanities and Social Sciences, 1(11).
Khaparde, V. (August, 2011). E-Journals in Library and Information Science: A Bibliometric Study. International Journal of Humanities and Social Science, 1(11), 99-106.
Khaparde, V. (2011).Bibliometric Study of Electronic Journal of Academic and Special
International Journal of Information, Business and Management, Vol. 7, No.4, 2015
ISSN 2076-9202
84
Librarianship.British Journal of Humanities and Social Sciences, 1(2), 33-43.
Knight, G. A., Hult, G. T. M., &Bashaw, R. E. (2000). Research Productivity in the Journal of Business Research: 1985-1999. Journal of Business Research, 49(3), 303-314.
Kumar, A., Prakasan, E. R., Kalyane, V. L., & Kumar, V. (2008).Pramana -- Journal of Physics: A scientometric analysis. Annals of Library & Information Studies, 55(1), 6-6.
Kumar, S., Tiwari, C., &Deepu, M. (May, 2012 ). Contribution to Indian Sociology: A Bibliometric Study. LANGUAGE IN INDIA: Strength for Today and Bright Hope for Tomorrow, 12(5), 650-674.
Narrang, A. (2004). Indian Journal of Pure and Applied Mathematics: a bibliometric study. Annals of Library and Information Studies, 51(1), 28-38.
Naseer, M. M., &Mahmood, K. (2009). LIS Research in Pakistan: An Analysis of Pakistan Library and Information Science Journal 1998-2007. Pakistan Library & Information Science Journal, 40(3), 10-20.
Natter, S. (2009). Indian Journal of Physics: A scientometric analysis. International Journal of Library and Information Science, 1(4), 55-61.
Potter, W. G. (1981). Lotka's law revisited. Library Trends, 30(1), 21-39.
Pritchard, A. (1969). Statistical bibliography or bibliometric?Journal of Documentation, 25(4), 348-349.
Repanovkik, A. (2010). Measuring the visibility of the university’s scientific production using Google scholar, “publish or perish” software and scientometrics. Retrieved 24th July, 2013, from http://conference.ifla.org/past/2010/155-repanovici-en.pdf
Sen, B. K. (2005). Bibliometrics with the help of computer: Computer programs and bibliometric analysis of some doctoral dissertations. Annals of Library & Information Studies, 52(1), 37-37.
Sengupta, S. E-Thesis Repositories: The Asian Scenario. Chinese Librarianship(33).
Sharif, M. A., &Mahmood, K. (2004). How economists cite literature: citation analysis of two core Pakistani economic journals. Collection Building, 23(4), 172-176.
Swain, D. K., & Panda, K. C. Journal of Intellectual Property Rights, 2002-2010: A Bibliometric Study. Chinese Librarianship(33).
Swain, D. K. (2011). Library Philosophy and Practice, 2004-2009: A Scientometric Appraisal. Library Philosophy & Practice, 112-128.
Thajudin, S. (1998). Journal of Plantation Crops- ABibliometric appraisal. Annals of Library Science and Documentation, 45(4), 117-124.
Thanuskodi, S. (2010).Bibliometric Analysis of the Journal Library Philosophy and Practice from 2005-2009. Library Philosophy & Practice, 1-6.
Thanuskodi, S. (2011).Bibliometric Analysis of the Indian Journal of Chemistry.Library Philosophy & Practice, 105-111.

International Journal of Information, Business and Management, Vol. 7, No.4, 2015
ISSN 2076-9202
85
Thanuskodi, S. (2011). LIBRARY HERALD JOURNAL: A BIBLIOMETRIC STUDY. Researchers World: Journal of Arts, Science & Commerce, 2(4), 68-76.
Thanuskodi, S. (2010).Journal of Social Science: a bibliometric study. Journal of Social Science, 24(2), 77-80.
Thelwall, M. (2008).Bibliometrics to webometrics.Journal of Information Science, 34(4), 605-621.
Tiew, W. S. (1998). Journal of Malaysian Branch of the Royal Asiatic Society (JMBRAS) 1987-1996: A ten years bibliometric analysis. Malaysian Journal of Library and Information Science, 3(2), 49-66.
Tiew, W. S. (2003). Malaysian Historical Journals (1847-1966): A Bibliometric Study. Malaysian Journal of Library & Information Science, 8(1), 19.
Tiew, W. S. (2006). Authorship Characteristics in SekitarPerpustakaan 1994-2003: A Bibliometric Study. Malaysian Journal of Library & Information Science, 11(1), 49-59.
Tiew, W. S., Abrizah, A., &Kiran, K. (2002). MALAYSIAN JOURNAL OF LIBRARY AND INFORMATION SCIENCE 1996-2000: A BIBLIOMETRIC STUDY. Malaysian Journal of Library & Information Science, 6(2), 43-56.
Van Raan, A. F. J. (2005). For Your Citations Only?Hot Topics in Bibliometric Analysis.Measurement, 3(1), 50-62.
Verna, N., Tamrakar, R., & Sharma, P. (2007).Analysis of contribution of 'Annals of Library and Information Studies.'.Annals of Library & Information Studies, 54(2), 7-7.
Vijay, K. R., &Raghavan, I. (2007). Journal of Food Science and Technology: A bibliometric study. Annals of Library & Information Studies, 54(4), 6.
Warraich, N. F., & Ahmad, S. (2011). Pakistan Journal of Library and Information Science: A bibliometric analysis. Pakistan Journal of Library & Information Science(12), 1-7.
Warraich, N. F., & Ahmad, S. (2011). Pakistan Journal of Library and Information Science: A bibliometric analysis. Pakistan Journal of Library & Information Science(12), 1-7.
Wilson, V. (2012). Research Methods: Bibliometrics. Evidence Based Library and Information Practice, 7(3), 121-123.
Yang, S. K., Kim, S. J., & Park, K. (2009).Bibliometric review of the Korean Journal of Urology 1960-2008: Trends and future directions. Korean Journal of Urology, 50(8), 731-738.
Zhang, C.-T. (2009). The e- Index, complementing the h-Index for excess citations. PLoS ONE, 4(5), 1.
International Journal of Information, Business and Management, Vol. 7, No.4, 2015
ISSN 2076-9202
86
SOCIAL MEDIA MARKETING (SMM) STRATEGIES FOR SMALL
TO MEDIUM ENTERPRISES (SMES)
Sohrab Karimi, Hengameh sadat Naghibi
1- MBA, college of commerce and business Management, Osmania University, A.P., India. Add: plot
no.48, Ravinder Nagar, Road No8, Habsiguda, Hyderabad, A.P., India.
Email: [email protected], Tell :+91-9700798272
2- BCOM, Nizam College, Osmania University, A.P., India. Add: plot no.49, Ravinder Nagar, Road
No8, Habsiguda, Hyderabad, A.P., India. Email: [email protected],
Tell:+91-8008097941
1. ABSTRACT:
Social media marketing involves the use of online social media tools such as Facebook, Twitter, and
LinkedIn to reach consumers in innovative ways. Given the increasingly large numbers of consumers
using social media, businesses of all types are getting involved in social media in an attempt to reach new
audiences and strengthen their ties with existing customers.This paper will start by presenting the notion
and concepts of SMEs and Social Media and its relation to Marketing, defining the terms and their
features. Then, on the one hand, the theoretical analysis will use a wide literature review to discuss the
main SME’s marketing strategy and Social Media Marketing, explaining why SMEs should create their
Social Media sites and maintain their presence on them regularly. On the other hand, the empirical
analysis will examine the main marketing techniques used by SMEs on the Social Media channels,
analyzing how businesses should develop their Social Media Sites. Finally, it will end with general
conclusions and recommendations for SMEs using Social Media Marketing.
Key words: Social Media, Social Media Marketing, SME, Business
ACKNOWLEDGEMENTS
“One of the greatest pieces of economic wisdom is to know what you do not know” – John Kenneth
Galbraith.
We first and foremost give thanks to the almighty deity who divine providence has kept us alive to make
this piece of work successful.
I would like to thank all faculty of my colage, for the patient guidance, encouragement and advice he has
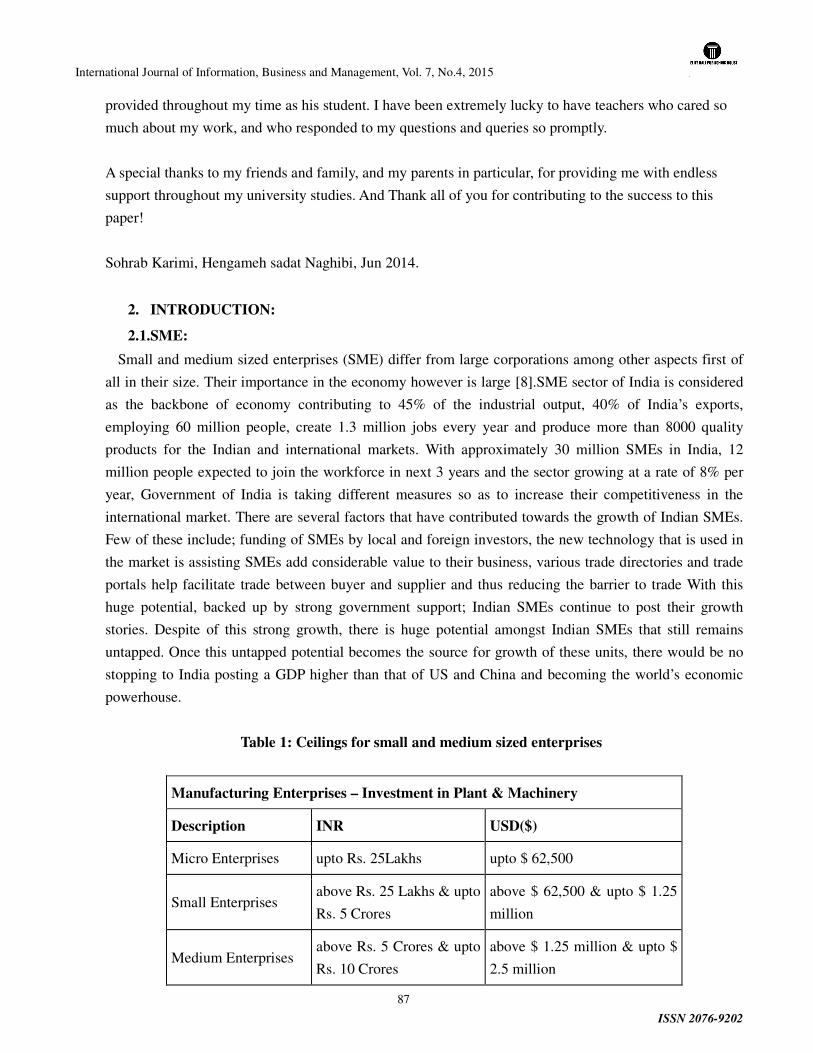
International Journal of Information, Business and Management, Vol. 7, No.4, 2015
ISSN 2076-9202
87
provided throughout my time as his student. I have been extremely lucky to have teachers who cared so
much about my work, and who responded to my questions and queries so promptly.
A special thanks to my friends and family, and my parents in particular, for providing me with endless
support throughout my university studies. And Thank all of you for contributing to the success to this
paper!
Sohrab Karimi, Hengameh sadat Naghibi, Jun 2014.
2. INTRODUCTION:
2.1.SME:
Small and medium sized enterprises (SME) differ from large corporations among other aspects first of
all in their size. Their importance in the economy however is large [8].SME sector of India is considered
as the backbone of economy contributing to 45% of the industrial output, 40% of India’s exports,
employing 60 million people, create 1.3 million jobs every year and produce more than 8000 quality
products for the Indian and international markets. With approximately 30 million SMEs in India, 12
million people expected to join the workforce in next 3 years and the sector growing at a rate of 8% per
year, Government of India is taking different measures so as to increase their competitiveness in the
international market. There are several factors that have contributed towards the growth of Indian SMEs.
Few of these include; funding of SMEs by local and foreign investors, the new technology that is used in
the market is assisting SMEs add considerable value to their business, various trade directories and trade
portals help facilitate trade between buyer and supplier and thus reducing the barrier to trade With this
huge potential, backed up by strong government support; Indian SMEs continue to post their growth
stories. Despite of this strong growth, there is huge potential amongst Indian SMEs that still remains
untapped. Once this untapped potential becomes the source for growth of these units, there would be no
stopping to India posting a GDP higher than that of US and China and becoming the world’s economic
powerhouse.
Table 1: Ceilings for small and medium sized enterprises
Manufacturing Enterprises – Investment in Plant & Machinery
Description INR USD($)
Micro Enterprises upto Rs. 25Lakhs upto $ 62,500
Small Enterprises above Rs. 25 Lakhs & upto
Rs. 5 Crores
above $ 62,500 & upto $ 1.25
million
Medium Enterprises above Rs. 5 Crores & upto
Rs. 10 Crores
above $ 1.25 million & upto $
2.5 million
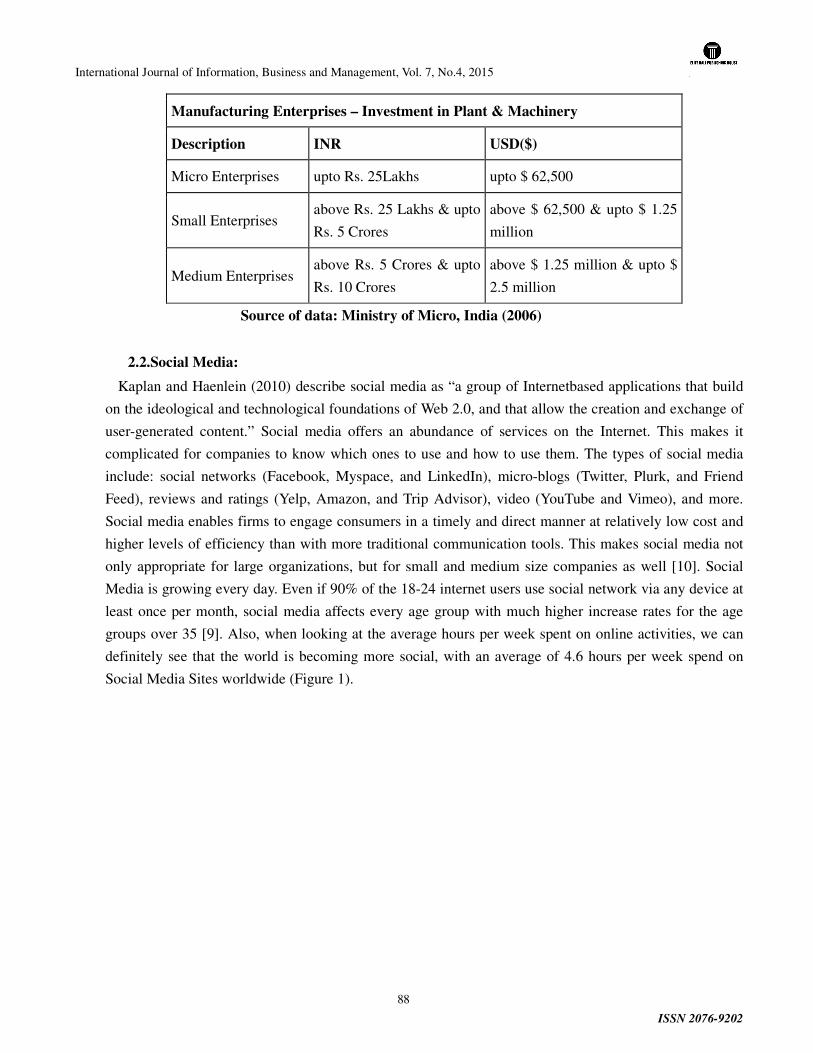
International Journal of Information, Business and Management, Vol. 7, No.4, 2015
ISSN 2076-9202
88
Manufacturing Enterprises – Investment in Plant & Machinery
Description INR USD($)
Micro Enterprises upto Rs. 25Lakhs upto $ 62,500
Small Enterprises above Rs. 25 Lakhs & upto
Rs. 5 Crores
above $ 62,500 & upto $ 1.25
million
Medium Enterprises above Rs. 5 Crores & upto
Rs. 10 Crores
above $ 1.25 million & upto $
2.5 million
Source of data: Ministry of Micro, India (2006)
2.2.Social Media:
Kaplan and Haenlein (2010) describe social media as “a group of Internetbased applications that build
on the ideological and technological foundations of Web 2.0, and that allow the creation and exchange of
user-generated content.” Social media offers an abundance of services on the Internet. This makes it
complicated for companies to know which ones to use and how to use them. The types of social media
include: social networks (Facebook, Myspace, and LinkedIn), micro-blogs (Twitter, Plurk, and Friend
Feed), reviews and ratings (Yelp, Amazon, and Trip Advisor), video (YouTube and Vimeo), and more.
Social media enables firms to engage consumers in a timely and direct manner at relatively low cost and
higher levels of efficiency than with more traditional communication tools. This makes social media not
only appropriate for large organizations, but for small and medium size companies as well [10]. Social
Media is growing every day. Even if 90% of the 18-24 internet users use social network via any device at
least once per month, social media affects every age group with much higher increase rates for the age
groups over 35 [9]. Also, when looking at the average hours per week spent on online activities, we can
definitely see that the world is becoming more social, with an average of 4.6 hours per week spend on
Social Media Sites worldwide (Figure 1).
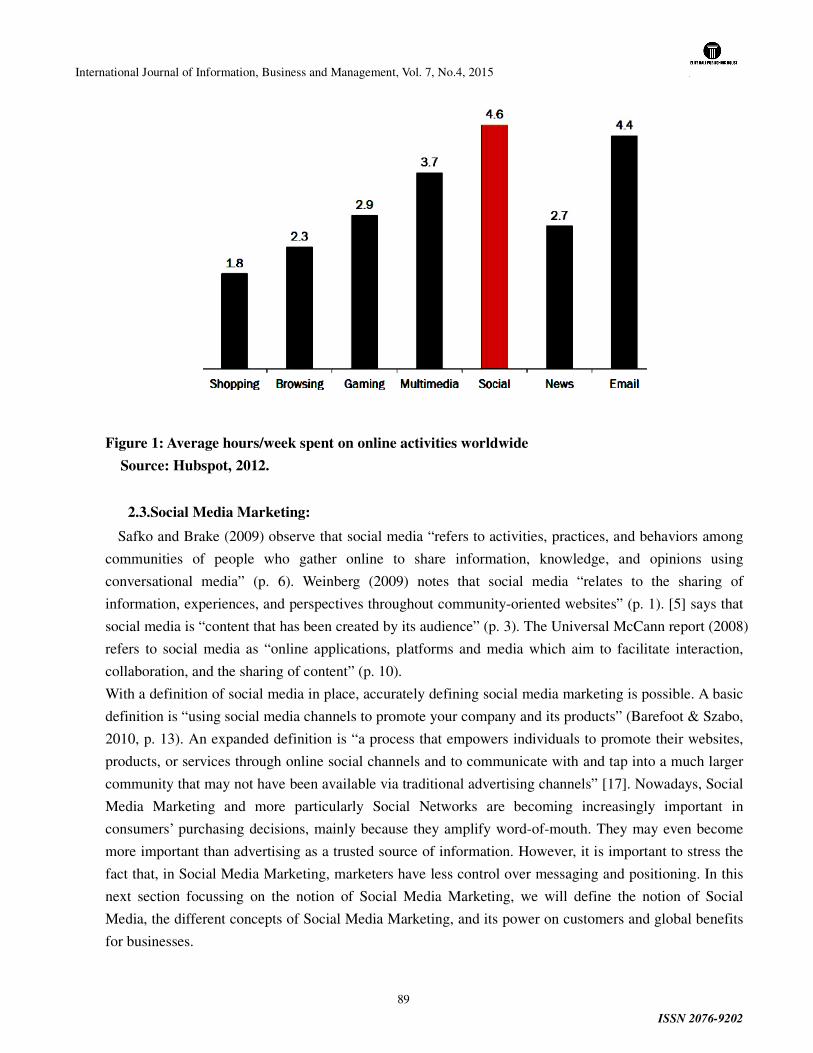
International Journal of Information, Business and Management, Vol. 7, No.4, 2015
ISSN 2076-9202
89
Figure 1: Average hours/week spent on online activities worldwide
Source: Hubspot, 2012.
2.3.Social Media Marketing:
Safko and Brake (2009) observe that social media “refers to activities, practices, and behaviors among
communities of people who gather online to share information, knowledge, and opinions using
conversational media” (p. 6). Weinberg (2009) notes that social media “relates to the sharing of
information, experiences, and perspectives throughout community-oriented websites” (p. 1). [5] says that
social media is “content that has been created by its audience” (p. 3). The Universal McCann report (2008)
refers to social media as “online applications, platforms and media which aim to facilitate interaction,
collaboration, and the sharing of content” (p. 10).
With a definition of social media in place, accurately defining social media marketing is possible. A basic
definition is “using social media channels to promote your company and its products” (Barefoot & Szabo,
2010, p. 13). An expanded definition is “a process that empowers individuals to promote their websites,
products, or services through online social channels and to communicate with and tap into a much larger
community that may not have been available via traditional advertising channels” [17]. Nowadays, Social
Media Marketing and more particularly Social Networks are becoming increasingly important in
consumers’ purchasing decisions, mainly because they amplify word-of-mouth. They may even become
more important than advertising as a trusted source of information. However, it is important to stress the
fact that, in Social Media Marketing, marketers have less control over messaging and positioning. In this
next section focussing on the notion of Social Media Marketing, we will define the notion of Social
Media, the different concepts of Social Media Marketing, and its power on customers and global benefits
for businesses.
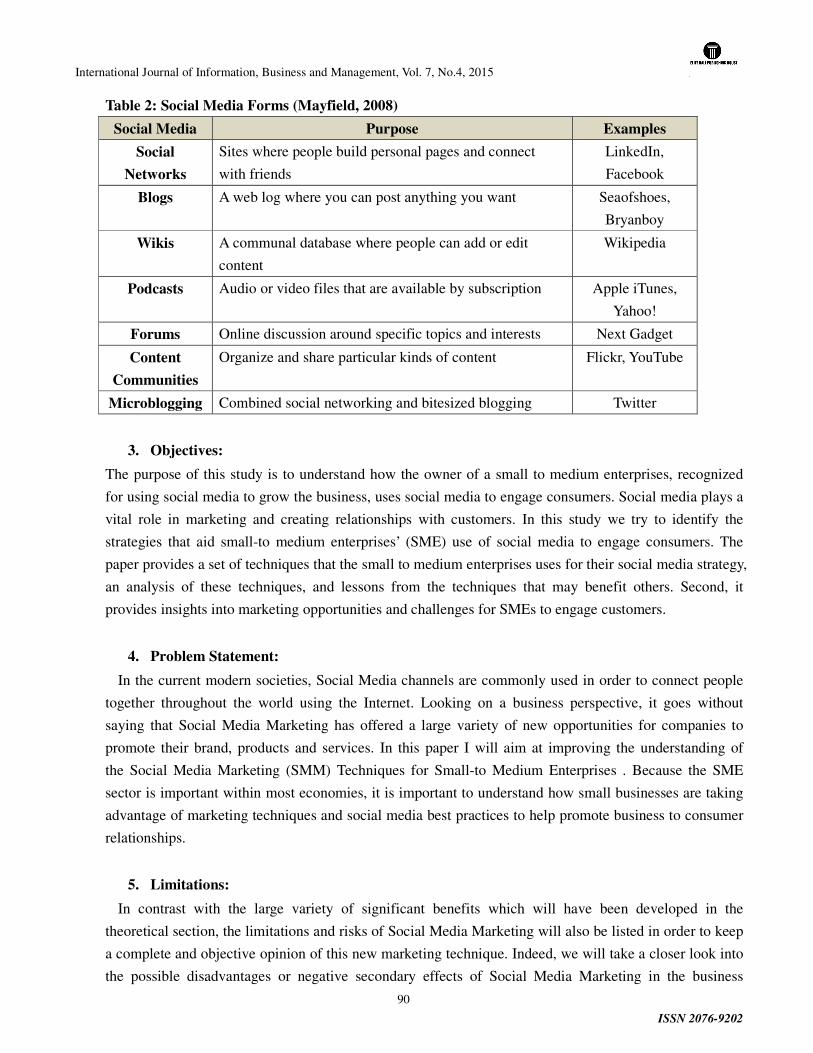
International Journal of Information, Business and Management, Vol. 7, No.4, 2015
ISSN 2076-9202
90
Table 2: Social Media Forms (Mayfield, 2008)
Social Media Purpose Examples
Social
Networks
Sites where people build personal pages and connect
with friends
LinkedIn,
Blogs A web log where you can post anything you want Seaofshoes,
Bryanboy
Wikis A communal database where people can add or edit
content
Wikipedia
Podcasts Audio or video files that are available by subscription Apple iTunes,
Yahoo!
Forums Online discussion around specific topics and interests Next Gadget
Content
Communities
Organize and share particular kinds of content Flickr, YouTube
Microblogging Combined social networking and bitesized blogging Twitter
3. Objectives:
The purpose of this study is to understand how the owner of a small to medium enterprises, recognized
for using social media to grow the business, uses social media to engage consumers. Social media plays a
vital role in marketing and creating relationships with customers. In this study we try to identify the
strategies that aid small-to medium enterprises’ (SME) use of social media to engage consumers. The
paper provides a set of techniques that the small to medium enterprises uses for their social media strategy,
an analysis of these techniques, and lessons from the techniques that may benefit others. Second, it
provides insights into marketing opportunities and challenges for SMEs to engage customers.
4. Problem Statement:
In the current modern societies, Social Media channels are commonly used in order to connect people
together throughout the world using the Internet. Looking on a business perspective, it goes without
saying that Social Media Marketing has offered a large variety of new opportunities for companies to
promote their brand, products and services. In this paper I will aim at improving the understanding of
the Social Media Marketing (SMM) Techniques for Small-to Medium Enterprises . Because the SME
sector is important within most economies, it is important to understand how small businesses are taking
advantage of marketing techniques and social media best practices to help promote business to consumer
relationships.
5. Limitations:
In contrast with the large variety of significant benefits which will have been developed in the
theoretical section, the limitations and risks of Social Media Marketing will also be listed in order to keep
a complete and objective opinion of this new marketing technique. Indeed, we will take a closer look into
the possible disadvantages or negative secondary effects of Social Media Marketing in the business
International Journal of Information, Business and Management, Vol. 7, No.4, 2015
ISSN 2076-9202
91
perspective. First, Social Media Marketing for businesses is extremely time-consuming, as it might
require a complete team to work on it daily in order to produce regular content and be reactive at
responding to customers’ feedbacks and complaints. Besides, Social Media Marketing does also present
some legal, reputational and operational risks for the business, which need to be taken into account and
manage during the planning of the Social Media strategy. Limitations of my study include the low
academic resources on Social Media Marketing as it is a relatively new domain of marketing and it is still
evolving continuously. Interviews and questionnaires on the business benefits of Social Media Marketing
are also very limited in response and valuable knowledge as most companies implementing Social Media
Marketing strategy have not been able to measure their complete success yet.
6. Review of Relevant Literature:
Marketing is a crucial activity for the survival and success of a business. Businesses today have more
marketing opportunities than ever [2]. In small businesses, marketing relies heavily on word of mouth
recommendations for customer acquisition [14].Today’s economy, distinguished by relationships,
technology, and networks, favors some of the characteristics of SMEs [16]. According to Kim and Ko
(2010a), social media can have a dramatic impact on a brand's reputation. One-third of survey participants
posted opinions about products and brands on the brand's blog, and 36% thought more positively about
companies that have blogs. A recent study by DEI Worldwide (2008) provides the following statistics:
70% of consumers have visited social media sites to get information; 49% of these consumers have made
a purchase decision based on the information they found through the social media sites; 60% said they
were likely to use social media sites to pass along information to others online; and 45% of those who
searched for information via social media sites engaged in word-of-mouth. The report states that
companies not engaging in social media as part of their online marketing strategy are missing an
opportunity to reach consumers. With a significant percentage of people passing along information to
others through social media, the value of one customer is worth far more than what he or she initially
spends. Thus, firms and brands now need to factor in the value of customers and also the influence of
social media on them.
7. Methodology:
This study intends to initially give the reader a brief overview of the most popular social media. Later
the paper will examine social media from a marketing perspective. This will be done by first describing
social media in practice followed by guidelines for creating a strategy. This will be based on a literature
study that was conduced at the start of this study. In order to analyze and resolve this problem formulation,
the methodological approach chosen in this study will focus on understanding the role of Social Media
Marketing in the SMEs. The main sources of information used throughout this study were issued from
Internet articles and online blogs on Social Media Marketing, in order to always read up-to-dated
information. On the whole, the methodological approach chosen for this study was aiming at providing
study results as a synthesis of the literature review in a more structured and academic perspective. In this
following methodology section, we will be starting with an explanation of the social media phenomenon,
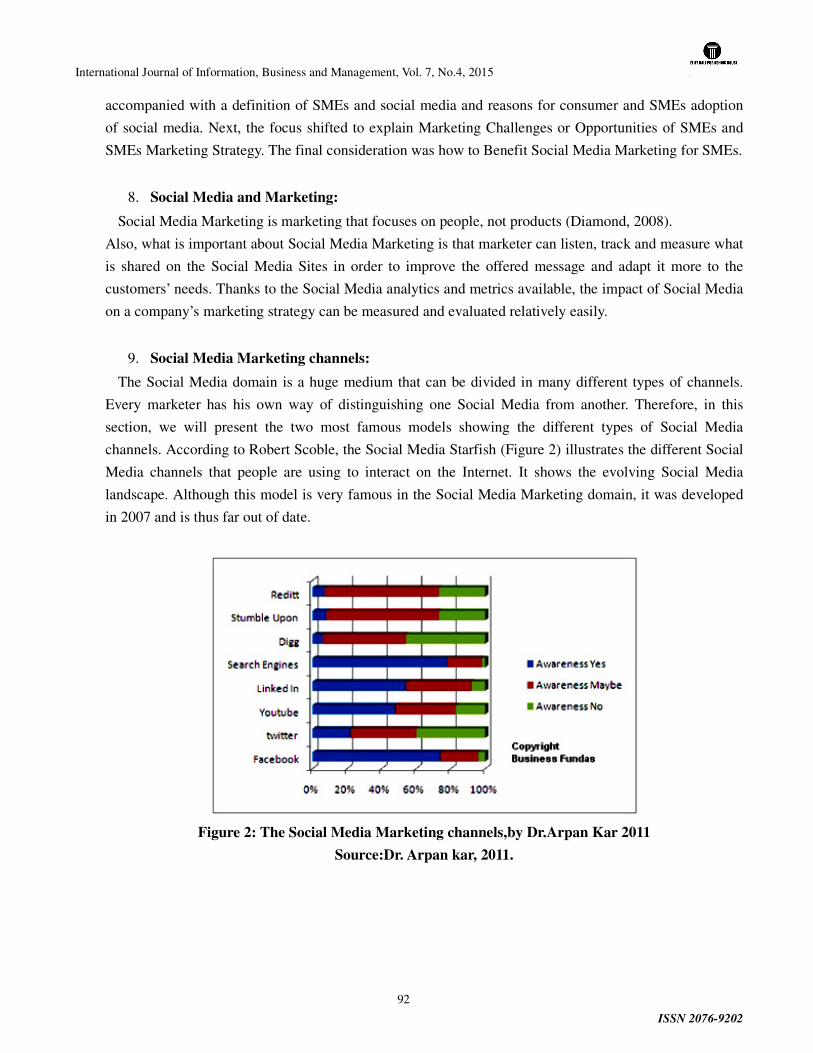
International Journal of Information, Business and Management, Vol. 7, No.4, 2015
ISSN 2076-9202
92
accompanied with a definition of SMEs and social media and reasons for consumer and SMEs adoption
of social media. Next, the focus shifted to explain Marketing Challenges or Opportunities of SMEs and
SMEs Marketing Strategy. The final consideration was how to Benefit Social Media Marketing for SMEs.
8. Social Media and Marketing:
Social Media Marketing is marketing that focuses on people, not products (Diamond, 2008).
Also, what is important about Social Media Marketing is that marketer can listen, track and measure what
is shared on the Social Media Sites in order to improve the offered message and adapt it more to the
customers’ needs. Thanks to the Social Media analytics and metrics available, the impact of Social Media
on a company’s marketing strategy can be measured and evaluated relatively easily.
9. Social Media Marketing channels:
The Social Media domain is a huge medium that can be divided in many different types of channels.
Every marketer has his own way of distinguishing one Social Media from another. Therefore, in this
section, we will present the two most famous models showing the different types of Social Media
channels. According to Robert Scoble, the Social Media Starfish (Figure 2) illustrates the different Social
Media channels that people are using to interact on the Internet. It shows the evolving Social Media
landscape. Although this model is very famous in the Social Media Marketing domain, it was developed
in 2007 and is thus far out of date.
Figure 2: The Social Media Marketing channels,by Dr.Arpan Kar 2011
Source:Dr. Arpan kar, 2011.
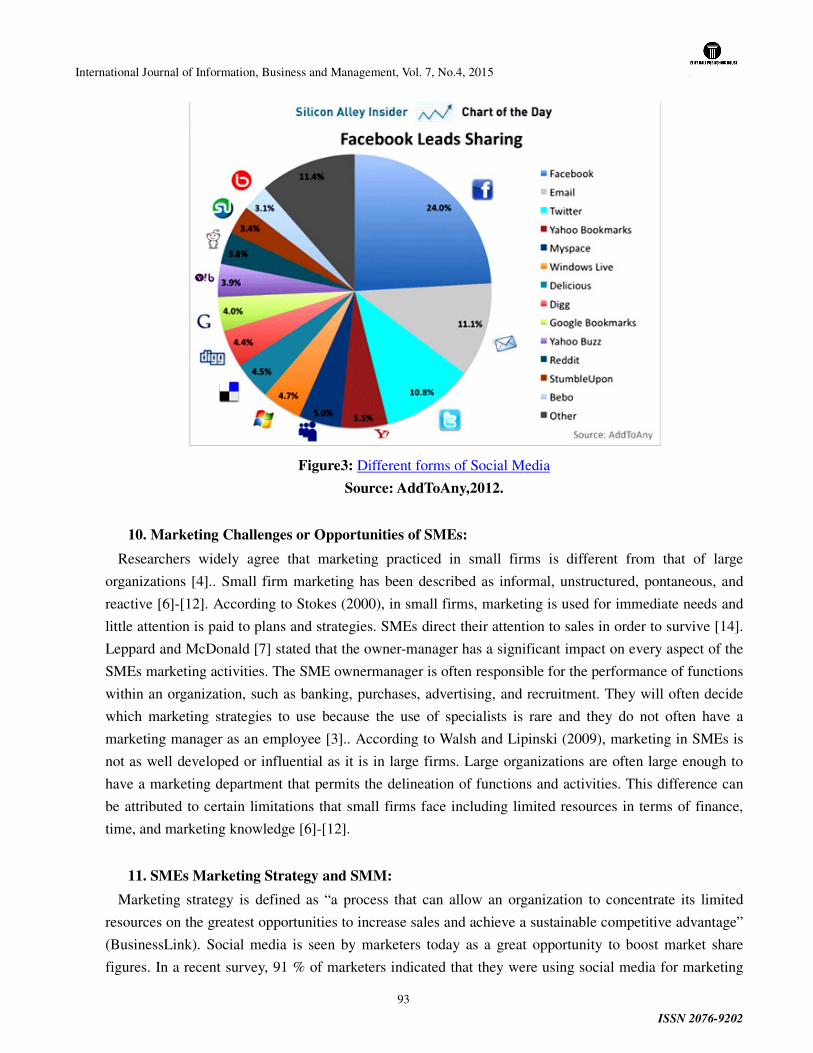
International Journal of Information, Business and Management, Vol. 7, No.4, 2015
ISSN 2076-9202
93
Figure3: Different forms of Social Media
Source: AddToAny,2012.
10. Marketing Challenges or Opportunities of SMEs:
Researchers widely agree that marketing practiced in small firms is different from that of large
organizations [4].. Small firm marketing has been described as informal, unstructured, pontaneous, and
reactive [6]-[12]. According to Stokes (2000), in small firms, marketing is used for immediate needs and
little attention is paid to plans and strategies. SMEs direct their attention to sales in order to survive [14].
Leppard and McDonald [7] stated that the owner-manager has a significant impact on every aspect of the
SMEs marketing activities. The SME ownermanager is often responsible for the performance of functions
within an organization, such as banking, purchases, advertising, and recruitment. They will often decide
which marketing strategies to use because the use of specialists is rare and they do not often have a
marketing manager as an employee [3].. According to Walsh and Lipinski (2009), marketing in SMEs is
not as well developed or influential as it is in large firms. Large organizations are often large enough to
have a marketing department that permits the delineation of functions and activities. This difference can
be attributed to certain limitations that small firms face including limited resources in terms of finance,
time, and marketing knowledge [6]-[12].
11. SMEs Marketing Strategy and SMM:
Marketing strategy is defined as “a process that can allow an organization to concentrate its limited
resources on the greatest opportunities to increase sales and achieve a sustainable competitive advantage”
(BusinessLink). Social media is seen by marketers today as a great opportunity to boost market share
figures. In a recent survey, 91 % of marketers indicated that they were using social media for marketing
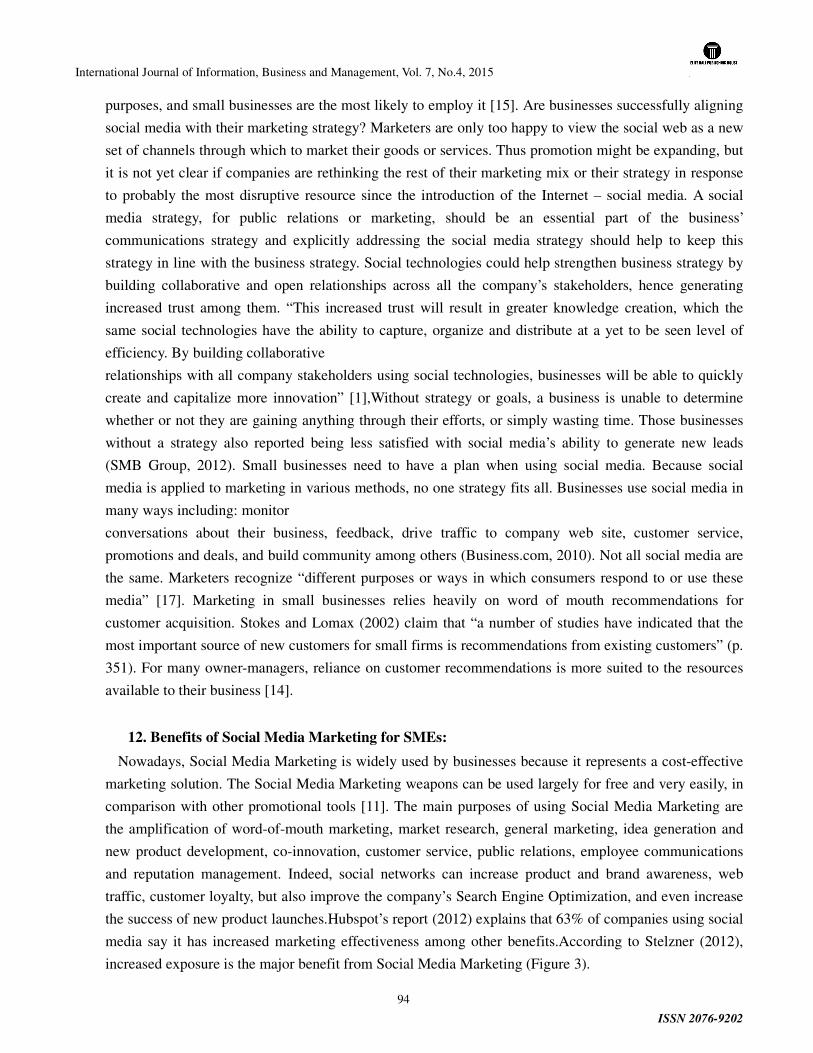
International Journal of Information, Business and Management, Vol. 7, No.4, 2015
ISSN 2076-9202
94
purposes, and small businesses are the most likely to employ it [15]. Are businesses successfully aligning
social media with their marketing strategy? Marketers are only too happy to view the social web as a new
set of channels through which to market their goods or services. Thus promotion might be expanding, but
it is not yet clear if companies are rethinking the rest of their marketing mix or their strategy in response
to probably the most disruptive resource since the introduction of the Internet – social media. A social
media strategy, for public relations or marketing, should be an essential part of the business’
communications strategy and explicitly addressing the social media strategy should help to keep this
strategy in line with the business strategy. Social technologies could help strengthen business strategy by
building collaborative and open relationships across all the company’s stakeholders, hence generating
increased trust among them. “This increased trust will result in greater knowledge creation, which the
same social technologies have the ability to capture, organize and distribute at a yet to be seen level of
efficiency. By building collaborative
relationships with all company stakeholders using social technologies, businesses will be able to quickly
create and capitalize more innovation” [1],Without strategy or goals, a business is unable to determine
whether or not they are gaining anything through their efforts, or simply wasting time. Those businesses
without a strategy also reported being less satisfied with social media’s ability to generate new leads
(SMB Group, 2012). Small businesses need to have a plan when using social media. Because social
media is applied to marketing in various methods, no one strategy fits all. Businesses use social media in
many ways including: monitor
conversations about their business, feedback, drive traffic to company web site, customer service,
promotions and deals, and build community among others (Business.com, 2010). Not all social media are
the same. Marketers recognize “different purposes or ways in which consumers respond to or use these
media” [17]. Marketing in small businesses relies heavily on word of mouth recommendations for
customer acquisition. Stokes and Lomax (2002) claim that “a number of studies have indicated that the
most important source of new customers for small firms is recommendations from existing customers” (p.
351). For many owner-managers, reliance on customer recommendations is more suited to the resources
available to their business [14].
12. Benefits of Social Media Marketing for SMEs:
Nowadays, Social Media Marketing is widely used by businesses because it represents a cost-effective
marketing solution. The Social Media Marketing weapons can be used largely for free and very easily, in
comparison with other promotional tools [11]. The main purposes of using Social Media Marketing are
the amplification of word-of-mouth marketing, market research, general marketing, idea generation and
new product development, co-innovation, customer service, public relations, employee communications
and reputation management. Indeed, social networks can increase product and brand awareness, web
traffic, customer loyalty, but also improve the company’s Search Engine Optimization, and even increase
the success of new product launches.Hubspot’s report (2012) explains that 63% of companies using social
media say it has increased marketing effectiveness among other benefits.According to Stelzner (2012),
increased exposure is the major benefit from Social Media Marketing (Figure 3).
International Journal of Information, Business and Management, Vol. 7, No.4, 2015
ISSN 2076-9202
95
Figure 3: Benefits of Social Media Marketing, Source: Stelzner, 2012
Social Media Marketing can be using unconventional means to achieve conventional goals, through the
use of creativity, community, and relationships instead of big budgets to achieve marketing objectives.
These methods are powerful guerrilla marketing strategies. Every marketer is now armed with highly
effective online communications tools that enable him to garner the same level of influence that many
large corporations have. Therefore, Social Media Marketing is a great change in the world of
marketing.According to Hubspot (2012), 57% of SMBs say social media is beneficial to their business.
Whether it is concerning large multinationals or small and medium-sized enterprises, Social Media
Marketing presents many significant benefits for the companies’ success. Social Media platforms foster
communication around brands and products, enhancing positive as well as negative word-of-mouth
around a business and its products and services. Any message or piece of information shared on the Social
Media channels can be seen by thousands of people in an extremely short period of time. Furthermore,
94% of marketers affirm that they are employing Social Media for marketing purposes [15]. 83% of them
said that Social Media is important to their businesses and 59% of marketers are using Social Media for 6
hours or more weekly, and 33% for 11 or more hours.
.
Table 2: Summary of the benefits of Social Media Marketing for SMEs
FUNCTIONAL AREA
BENEFITS
International Journal of Information, Business and Management, Vol. 7, No.4, 2015
ISSN 2076-9202
96
MARKETING
• Increased brand exposure
• Build awareness
• Brand reputation management
• Increased targeted traffic
• Improved Search Engine Optimization
• Leads generation
• Reduced marketing costs
CUSTOMER SUPPORT
• Customer interaction > Feedbacks
• Real-time and personalized support
• Improved customer experience
• Increased customer retention and
loyalty
• Reduced support costs
RESEARCH AND DEVELOPMENT
• Market insights on target audience
• Competitor monitoring
• New ideas captured from community
FINANCE
• Cost effective
• Reduce costs in marketing, customer
service and recruitment
PUBLIC RELATIONS
• Communication in real-time
• Increased brand exposure
HUMAN RESOURS
• Business networking
• Facilitated recruitment
• Reduce recruitment costs
Source: Celine Arca, 2012.
13. Conclusion:
In summary, this investigation into social media marketing began with an explanation of the social
media phenomenon, accompanied with a definition of social media and reasons for consumer and
corporate adoption of social media. Next, the focus shifted to ways of creating and capturing value
through social media: managing online reputation, increasing brand awareness, communicating with
customers, and other methods. The final consideration was how to formulate a social media marketing
strategy. As previously stated, much research has been done into the social media practices of large
organizations; however, there have been limited studies
conducted relative to social media usage and experience specifically targeted at very small businesses. It
is important to study how a small business uses social media to engage the public because the nature of
this channel allows for the cultivation of relationships between businesses and individuals.
14. Reference:
International Journal of Information, Business and Management, Vol. 7, No.4, 2015
ISSN 2076-9202
97
[1]Anderson, Tac, “The 3 types of social media strategy”, 8 April ,2010. http://www.socialmediatoday.com/SMC/187490
[2] Bresciani, S., & Eppler, M. J., “Brand new ventures? Insights on start-ups' branding practices”. Journal of Product & Brand Management, 19(5),2010, p 356- 366.
[3] Berthon, P., Ewing, M. T., & Napoli, J., “Brand management in small to medium-sized enterprises”. Journal of Small Business Management”,2008,46(1), 27-45.
[4] Coviello, N., Brodie, R.,& Munro, H., “An investigation of marketing practice by firm size”. Journal of Business Venturing,15(5),2000, p523-545.
[5] Comm, J., “Twitter power: How to dominate your market one tweet at a time Hoboken”, NJ: John Wily & Sons, 2009.
[6] Gilmore, A., Carson, D., Donnell, A. O., & Cummins, D., “Added value: A qualitative assessment of SME marketing”. Irish Marketing Review, 1999, 12(1), 27.
[7] Hill, J., “A multidimensional study of the key determinants of effective SME marketing activity: Part 1”. International Journal of Entrepreneurial Behavious & Research, 7(5), 2001, p171-204.
[8] Hermann, 1996, p.119; Pfohl, 2006, p.18). “Therefore, in small companies, the (owner-) manager is often responsible for many different tasks and important decisions”(Hermann, 1996, p.128).
[9] Hubspot, “120 Marketing Stats, Charts & Graphs”, viewed April 28th 2012, http://hubspot.com/
[10] Kaplan, A. M., & Haenlein, M., “Users of the world, unite! The challenges and opportunities of social media”. Business Horizons, 53(1),2010, p 59–68.
[11] Levinson, J.C. & Gibson, S.,“Guerrilla Social Media Marketing: 100+ Weapons to Grow your Online Influence, Attract Customers and Drive Profits”, Entrepreneur Media Inc., Canada, 2010.
[12] Reijonen, H., “Do all SMEs practice same kind of marketing?” Journal of Small Business and Enterprise Development, 17(2),2010, p 279–293.
[13 ]Safko, L., & Brake, D. K., “The social media bible: Tactics, tools & strategies for business success”. Hoboken, NJ: John Wiley & Sons, 2009.
[14] Stokes, D., & Lomax, W., “Taking control of word of mouth marketing: the case of an entrepreneurial hotelier”. Journal of Small Business and Enterprise Development, 9, 2002, p 349-357.
[15] Stelzner, M., “Social media marketing industry report: How marketers are using social media to
International Journal of Information, Business and Management, Vol. 7, No.4, 2015
ISSN 2076-9202
98
grow their businesses”, 2011.
Weinberg, T., “The new community rules: Marketing on the social web Sebastopol, CA: O’Reilly Media, Inc”, 2009.
[16] Walsh, M., & Lipinski, J., “The role of the marketing function in small and medium sized enterprises”. Journal of Small Business and Enterprise Development, 16(4), 2009, p569-585.
[17] Weinberg, B.D., & Pehlivan, E., “Social spending: Managing the social media mix. Business Horizons”, 54(3), 2011, p275–282.
[18] Zarrella, D., “The social media marketing book”. Sebastopol, CA: O’Reilly Media,Inc, 2010.
International Journal of Information, Business and Management, Vol. 7, No.4, 2015
ISSN 2076-9202
99
Trade Balance of Pakistan and its Determinants
Abdul Qadir Shah
Lecturer, Department of Management Sciences, University of Haripur, Pakistan
E-mail: [email protected]
Abstract
The paper investigated empirically the determinants of balance of trade of Pakistan. It has examined the
effect of the determinants on trade balance of Pakistan. Multiple regression model is used for empirical
assessment. Balance of trade is the dependent variable where as exchange rate of Pakistani Rupee against
US Dollar, money supply, foreign direct investment, gross domestic product and Total domestic
consumption are independent variables. Annual data from FY1975-76 to FY2009-10 has been collected for
the variables. The results from multiple regression model show that only Pakistan Rupee exchange rate has
a significant impact on balance of trade of Pakistan, while all other variables have no significant impact on
balance of trade of Pakistan.
1. Introduction
In this era of globalization, international or foreign trade is not only important but unavoidable.
Balance of trade is an important determinant of any modern economy. Economies with high trade deficit
are seen as vulnerable to any slight economic shock or recession. Every country tries to meet, at least, a
balance in its foreign trade, if not surplus. Pakistan is a developing state of South Asia with 180 million
people. The economy of Pakistan is dependent on agriculture. Since independence in 1947, Pakistan has
been witnessing trade deficit for most of the years.
As a developing state and under huge burden of foreign debt, Pakistan needs to be very careful
and keep an analytical eye on this important determinant of the economy. Pakistan’s foreign debt soared
International Journal of Information, Business and Management, Vol. 7, No.4, 2015
ISSN 2076-9202
100
to 58 billion in March, 2011, which is more than alarming. In the last three years the national foreign debt
of Pakistan has increased by 12 billion US Dollars. This shows a poor balance of payments, in which a
poor balance of trade plays the central role. If the country does not give attention to its poor balance of
trade, the situation will get worse and even out of control because we are spending more and luxuriously
and earning very less. We are wholly dependent on foreign aid and loans from international financial
institutions and banks, at their conditions, which further hurts the economy.
Study of economic literature recognizes that exchange rate policy affects various items of the
balance of payments. It influences the balance of trade of a state mainly through improving global
competitiveness which affects the demand and supply for imports and exports. For developing countries
like Pakistan its economy and currency is greatly influenced by its major developed trading partners and
for this instant the US Dollar and its fluctuations affect in one way or the other. Historically, Pakistan has
pursued a policy of export led growth, with the objective of improving its balance of payments. For
achieving this objective, Pakistan had to adopt various exchange rate regimes at different times.
Pakistan faces challenges of globalization as well as regional competition from emerging
neighbouring states like Bangladesh. Through the passage of time Pakistan has broadened its export base
and moved towards more unconventional, non-agricultural and finish goods but this progress had been
slow in speed than import. Imports have been increasing many folds and thus the trade deficit has been
widening. The country has always enjoyed a trade deficit which has always worried and stressed the
economy and at present, Pakistan is facing its worse economic and balance of payment crisis.
Rupee is on record low against the Dollars. It has helped the exports but its effect is minimized by
the fact that it has bad impact on oil prices. As Pakistan has a huge crude petroleum import, the declining
rupee increases the import bill and also cost of production in industries. Pakistan needs to clearly chalk
out monetary and fiscal policy, which can grant its exports a helping hand and also can control its
economy through its fiscal policy. Both will help the country to balance its foreign trade and also improve
its balance of payments.
2. Literature review
International Journal of Information, Business and Management, Vol. 7, No.4, 2015
ISSN 2076-9202
101
Sulaiman D. M. (2010) empirically proved that foreign income, FDI, domestic consumption and
real effective exchange rate significantly affect balance of trade of Pakistan. The paper has used data from
of 1975 to 2008. For long run analysis of relationship among the macro economic variables, the
researcher has used Johansen co integration test (1996) and for short run analysis the VECM, vector error
correction model has been used. All variables are taken in natural log. The VECM results provide that
there is disequilibrium in short run, which will be adjusted within a year.
Waliullah, Mehmood, Rehmatullah and Wakeel (2010) found that income and money supply have
an important role in balance of trade of Pakistan. These researchers also found that exchange rate is in
direct relation to balance of trade of Pakistan but former two variables i.e. income and supply of money
have a more vital and significant role. Growth and monetary policy have got stronger influence in the
long run on balance of trade than exchange rate of the Pakistan Rupee. The paper argues that exchange
rate will benefit trade balance of Pakistan but for a stable and long run change and improvement, the
variables of money supply and income are of paramount importance and effect. The researchers have used
ARDL model on annual data from 1970 to 2005.
Zehra and Sajawal (2008) have studied the Pakistan rupee real exchange rate depreciation and its
effects on trade with its 12 major trading partners. The paper has avoids, what it argues the aggregate bias
by not taking aggregate trade data but instead has taken bilateral trade data of 12 trading partners of
Pakistan but have found no evidence in support of standard J-curve phenomenon. The ARDL or auto
regressive distributed lad model has been used. The variables used are Pakistani exports to each partner,
imports from respective partner, income of the respective partner, Pakistani income and real exchange rate
with respective trading Partner.
Bahmani-oskooee and Cheema (2009) have also studied relationship of bilateral exchange rate of
Pakistan with its 13 major trading countries separately. The study shows that in half the cases the bilateral
exchange rate has an important role in bilateral trade. Here bounds testing approach has been used. The
variables used are, trade balance between Pakistan and its trading partner (dependent variable), Pakistan
income, income of respective trading partner and bilateral exchange rate.
International Journal of Information, Business and Management, Vol. 7, No.4, 2015
ISSN 2076-9202
102
Sadia B. (2006) has empirically assessed the question; whether intermediate and capital imports
which are used in the preparation of Pakistani finished goods export, helpful to the exports or not. OLS
technique has been used for empirical assessment and data was taken from 1973-2005. The variables used
in the study are index of export, index of relative price, capital import index, nominal effective exchange
rate index, import index, US domestic output index, and index of industrial raw material import (both
consumer as well as capital). The variables taken are in log linear. Index of export is the dependent
variable, while remaining are independent. The researcher found a long term relationship between
Pakistani exports and relative import of intermediate and capital goods.
Jarita D (2007) has examined the relationship between Malaysian balance of trade and macro
economic variables of real exchange rate, income and money supply. The researcher has found significant
long term relation between Malaysian balance of trade, income and money supply. Here, most
importantly the paper does not find long run relationship between balance of trade and real exchange rate.
The paper finds and suggests that Marshall-Lerner condition does not find significance in the long run for
economy of Malaysia. The paper has used bound testing approach to co-integration and error correction
model. The paper also finds and suggests that Malaysian economy should be seen in view of absorption
and monetary policies. The data for the paper has been taken annually from 1974 to 2003.
David M. G., Roy J. R. and M. D. Anderson (1996) have empirically examined trade deficit, its
causes and consequences. The paper argues that trade surplus or deficit reflects a country’s international
borrowing or lending profile over a period of time. Trade deficit or surplus, not necessarily show the
weakness or strength of an economy, unless proved empirically. Trade deficit may prove beneficial in the
long run if investment is made in importing capital goods. Any economy having continual trade surplus or
deficit may be the reaction to the income got from investments, which allow it to have desired trade and
imports. This paper argues that there is no long run relationship between weak economy and trade deficit
of a country because ordinary and prevalent thinking is that trade deficit hurts economy of the country.
The paper gives a more broader perspective and argues that balance of trade surpluses or deficits are an
important part of the world resource allocation in an efficient manner. This efficient allocation of world
International Journal of Information, Business and Management, Vol. 7, No.4, 2015
ISSN 2076-9202
103
resources is of key importance for well being and smooth running of the global economy. The paper looks
to trade balance from a broader perspective and not from a narrow or a single country’s perspective.
3. Research Methodology
3.1 Multiple Regression
The multiple regression model is used to find out the impact of independent variables on a
dependent variable. For this purpose an equation is fitted with the dependent variable and independent
variables for gauging the relationship. The dependent variable is associated with each and every variable
and the change in the dependent variable is because of the independent variables of the equation.
In this study the multiple regression model is applied to a thirty-five years annual data
(FY1975-76 to FY2009-10). The empirically assessment will give us evidence whether significant
relationship exists between trade balance and its determinants and in what manner. Empirical results are
analyzed and conclusions drawn on its basis. The Regression model is given below,
BOT = α + β1 (EPR) + β2 (MS) + β3 (FDI) + β4 (GDP) + β5 (TDC) + ε
BOT Balance of trade of Pakistan
EPR Exchange rate of Pakistan Rupee
MS money supply
FDI foreign direct investment
GDP gross domestic product
TDC Total domestic consumption
Where, β 1, β 2, β 3, β 4 & β5 in the model represent the slope of each determinant.
In addition to it “α” is the Y-Intercept.
3.2 Data Collection
For this study, data for macro-economic variables is collected. The data is collected for exchange rate,
money supply, FDI, GDP, total domestic consumption and foreign trade of Pakistan. The large part of the
data used in the study is collected from secondary sources. The main sources of the data collected are
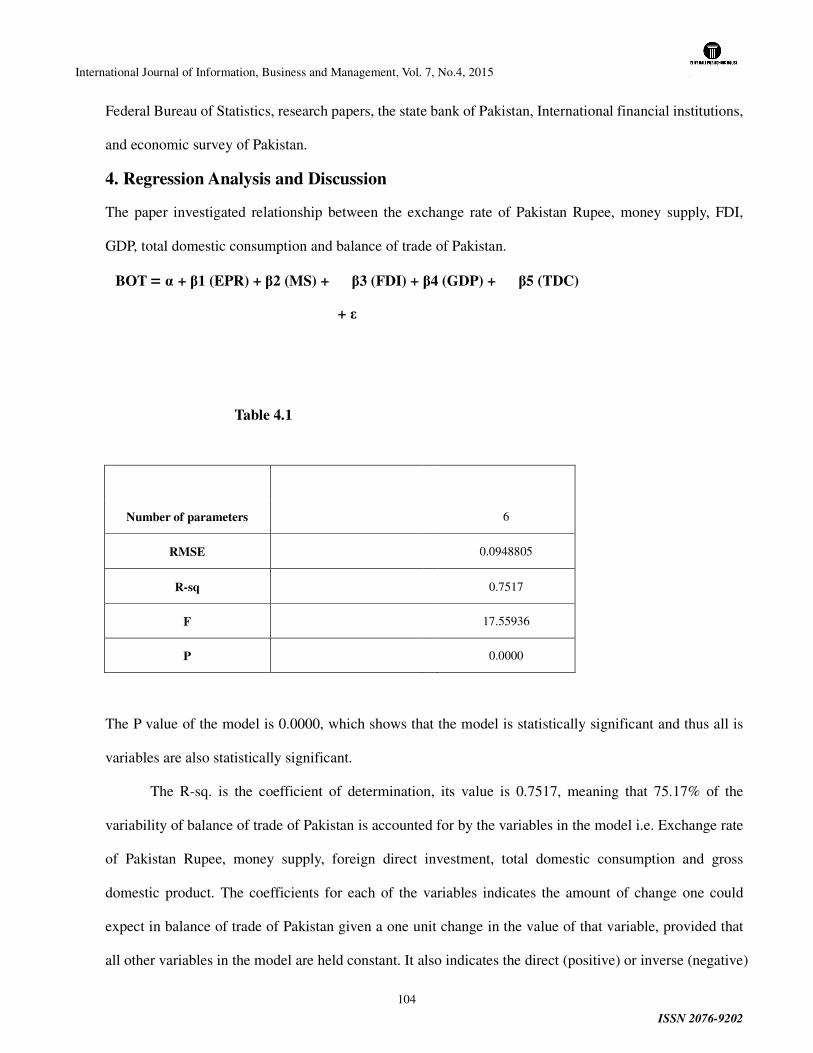
International Journal of Information, Business and Management, Vol. 7, No.4, 2015
ISSN 2076-9202
104
Federal Bureau of Statistics, research papers, the state bank of Pakistan, International financial institutions,
and economic survey of Pakistan.
4. Regression Analysis and Discussion
The paper investigated relationship between the exchange rate of Pakistan Rupee, money supply, FDI,
GDP, total domestic consumption and balance of trade of Pakistan.
BOT = α + β1 (EPR) + β2 (MS) + β3 (FDI) + β4 (GDP) + β5 (TDC)
+ ε
Table 4.1
Number of parameters 6
RMSE 0.0948805
R-sq 0.7517
F 17.55936
P 0.0000
The P value of the model is 0.0000, which shows that the model is statistically significant and thus all is
variables are also statistically significant.
The R-sq. is the coefficient of determination, its value is 0.7517, meaning that 75.17% of the
variability of balance of trade of Pakistan is accounted for by the variables in the model i.e. Exchange rate
of Pakistan Rupee, money supply, foreign direct investment, total domestic consumption and gross
domestic product. The coefficients for each of the variables indicates the amount of change one could
expect in balance of trade of Pakistan given a one unit change in the value of that variable, provided that
all other variables in the model are held constant. It also indicates the direct (positive) or inverse (negative)
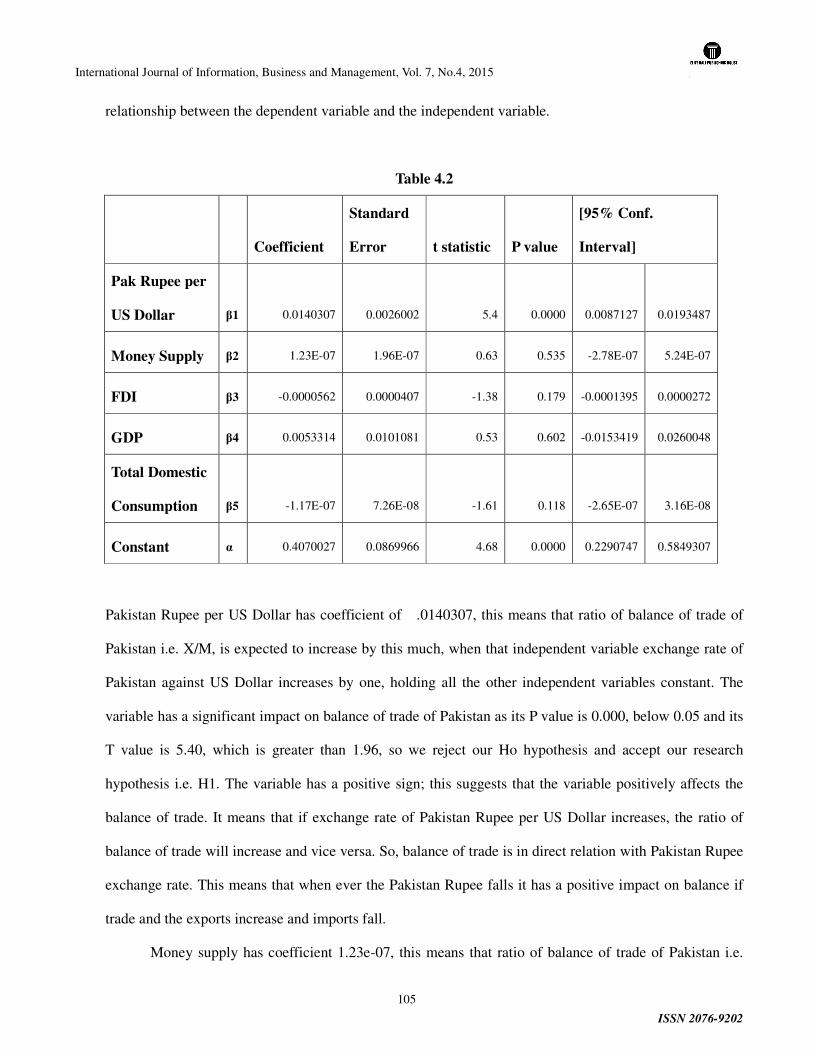
International Journal of Information, Business and Management, Vol. 7, No.4, 2015
ISSN 2076-9202
105
relationship between the dependent variable and the independent variable.
Table 4.2
Coefficient
Standard
Error t statistic P value
[95% Conf.
Interval]
Pak Rupee per
US Dollar β1 0.0140307 0.0026002 5.4 0.0000 0.0087127 0.0193487
Money Supply β2 1.23E-07 1.96E-07 0.63 0.535 -2.78E-07 5.24E-07
FDI β3 -0.0000562 0.0000407 -1.38 0.179 -0.0001395 0.0000272
GDP β4 0.0053314 0.0101081 0.53 0.602 -0.0153419 0.0260048
Total Domestic
Consumption β5 -1.17E-07 7.26E-08 -1.61 0.118 -2.65E-07 3.16E-08
Constant α 0.4070027 0.0869966 4.68 0.0000 0.2290747 0.5849307
Pakistan Rupee per US Dollar has coefficient of .0140307, this means that ratio of balance of trade of
Pakistan i.e. X/M, is expected to increase by this much, when that independent variable exchange rate of
Pakistan against US Dollar increases by one, holding all the other independent variables constant. The
variable has a significant impact on balance of trade of Pakistan as its P value is 0.000, below 0.05 and its
T value is 5.40, which is greater than 1.96, so we reject our Ho hypothesis and accept our research
hypothesis i.e. H1. The variable has a positive sign; this suggests that the variable positively affects the
balance of trade. It means that if exchange rate of Pakistan Rupee per US Dollar increases, the ratio of
balance of trade will increase and vice versa. So, balance of trade is in direct relation with Pakistan Rupee
exchange rate. This means that when ever the Pakistan Rupee falls it has a positive impact on balance if
trade and the exports increase and imports fall.
Money supply has coefficient 1.23e-07, this means that ratio of balance of trade of Pakistan i.e.
International Journal of Information, Business and Management, Vol. 7, No.4, 2015
ISSN 2076-9202
106
X/M, is expected to increase by this much, when that independent variable money supply increases by
one, holding all the other independent variables constant. Money supply has no significant impact on
balance of trade of Pakistan as its P value is 0.535, which is greater than 0.05. The t value is in between
1.96 and -1.96 (i.e. 0.63), therefore we accept Ho. Money supply is positively or directly related to
balance of trade of Pakistan.
Foreign Direct Investment, FDI has a coefficient of -.0000562, this implies that ratio of balance of
trade of Pakistan i.e. X/M, is expected to decrease by this much, when that independent variable FDI
increases by one, holding all the other independent variables constant. FDI has no significant impact on
balance of trade of Pakistan as its P value is 0.179, greater than 0.05 and its t value is -1.38, which is
in-between 1.96 and -1.96. The negative sign shows that there is negative relation between balance of
trade and FDI or both variables are inversely related.
GDP has a coefficient of .0053314, this implies that ratio of balance of trade of Pakistan i.e. X/M,
is expected to increase by this much, when that independent variable GDP increases by one, holding all
the other independent variables constant. The “P” value of 0.602, which shows that GDP has not got
significant impact on balance of trade of Pakistan. The t value of GDP also falls in-between 1.96 and
-1.96 (i.e. 0.53). GDP and balance of trade of Pakistan are directly related.
Total domestic consumption has a coefficient of -1.17e-07, that shows that ratio of balance of
trade of Pakistan i.e. X/M, is expected to decrease by this much, when that independent variable total
domestic consumption of Pakistan increases by one, holding all the other independent variables constant.
Total domestic consumption is also not significant because its P value is above 0.05, i.e. 0.118 and its t
value is -1.61, which falls in-between 1.96 and -1.96, therefore we accept Ho. The total domestic
consumption and balance of trade are inversely related.
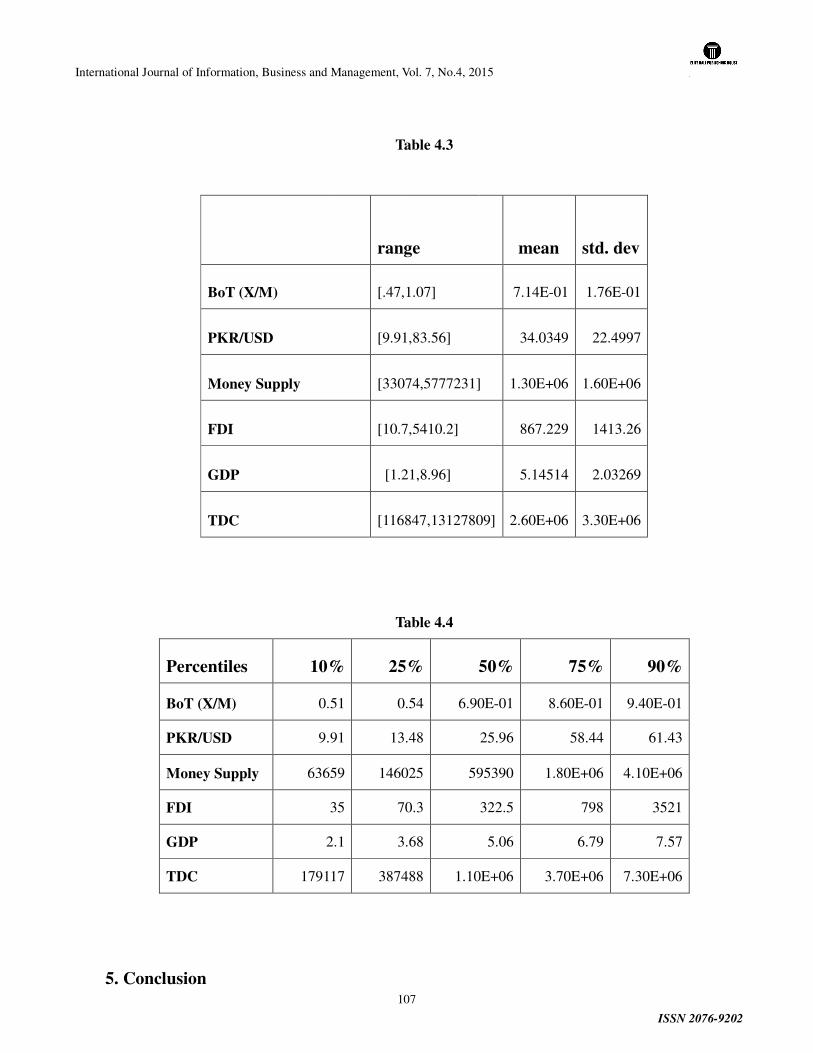
International Journal of Information, Business and Management, Vol. 7, No.4, 2015
ISSN 2076-9202
107
Table 4.3
range mean std. dev
BoT (X/M) [.47,1.07] 7.14E-01 1.76E-01
PKR/USD [9.91,83.56] 34.0349 22.4997
Money Supply [33074,5777231] 1.30E+06 1.60E+06
FDI [10.7,5410.2] 867.229 1413.26
GDP [1.21,8.96] 5.14514 2.03269
TDC [116847,13127809] 2.60E+06 3.30E+06
Table 4.4
Percentiles 10% 25% 50% 75% 90%
BoT (X/M) 0.51 0.54 6.90E-01 8.60E-01 9.40E-01
PKR/USD 9.91 13.48 25.96 58.44 61.43
Money Supply 63659 146025 595390 1.80E+06 4.10E+06
FDI 35 70.3 322.5 798 3521
GDP 2.1 3.68 5.06 6.79 7.57
TDC 179117 387488 1.10E+06 3.70E+06 7.30E+06
5. Conclusion
International Journal of Information, Business and Management, Vol. 7, No.4, 2015
ISSN 2076-9202
108
This paper narrowly focuses on balance of trade of Pakistan and its determinants. The macro-economic
variables which are examined as independent variables are foreign exchange rate of Pakistan Rupee
against US Dollar, money supply, foreign direct investment (FDI), gross domestic consumption (GDP)
and total domestic consumption. The model used is the multiple regression. The data for variables is taken
for the period FY1975-76 to FY2009-2010.
The study shows that there is significant affect of Pakistan Rupee exchange rate on balance of
trade of Pakistan and no other variable has significant impact on balance of trade of Pakistan. Based on
our empirical findings the “the Pakistan Rupee exchange rate has a significant impact on balance of trade
of Pakistan”. Policy and decision makers in the government needs to lay attention on exchange rate
regime but also needs to widen the horizon of balance of trade of Pakistan, especially to monetary policy
and growth rate because they also plays an important role.
Recommendations
• Pakistan needs to chalk out well analyzed and suited forex policy, which best suits the needs and
interests of the economy and trading sector.
• Pakistan needs to expand and diversify its export base to more unconventional, non-agricultural
and technologically advance finished goods. Presently it cannot compete with its semi-finished,
agricultural and technologically less advance goods and services in the world and regional
markets.
• Pakistan as a state and as a nation of consumers both spend luxuriously. Every year Pakistan has a
substantial luxury items import bill, which needs to be curtailed immediately to balance its foreign
trade and improve its balance of payments.
• Pakistan every year imports petroleum and related products in huge amount. Which make up
majority of its import bill. Thus, Pakistan needs to explore petroleum reservoirs and alternative
energy resources as coal, solar and wind etc. which are locally found in abundance.
International Journal of Information, Business and Management, Vol. 7, No.4, 2015
ISSN 2076-9202
109
• Services sector has been always undermine and not developed in Pakistan. Pakistan lacks in
expertise and technical skills, which are of paramount importance for development and motivating
FDI into the country.
• Pakistan needs to solve its energy crisis and provide cheap energy to its industries and thus they
can produce cheap and compatible goods.
• Policy makers should strive for local investment and as well as FDI in research and development
because in the twenty first century technology is changing and upgrading not by years but day by
day.
References
A Santos-Paulino and A. P. Thirlwall (2004). The impact of trade liberalisation on exports, imports and the balance of payments of developing countries. The Economic Journal, 114 (February), F50–F72. Royal Economic Society 2004. Published by Blackwell Publishing, 9600 Garsington Road, Oxford OX4 2DQ, UK and 350 Main Street, Malden,MA 02148, USA. A. Garcίa-Herrero and T. Koivu (2007). Can the Chinese trade surplus be reduced through exchange rate policy? BOFIT Discussion Papers 6.
A. R. Kemal, Musleh, Usman Q., Lloyd F., Sirimevan S. C. (2002). Exports and economic growth in South Asia. A study prepared for the South Asia network of economic research institutes.
Bahmani-oskooee and Cheema (2009). short-run and long-run effects of currency depreciation on the bilateral trade balance between Pakistan and her major trading partners. Journal of economic development, Volume 34, Number 1, June 2009. Catherine L. M. and Katharina P. (2005). The US Trade Deficit: A Disaggregated Perspective. Institute for
International Economics, working paper series, number WP 05-11.
David M. G., Roy J. R. and M. D. Anderson (1996). Trade Deficits: Causes and Consequences. Federal reserve bank of Dallas. Economic review fourth quarter 1996.
Falk, M. (2008). Determinants of the Trade Balance in Industrialized Countries. FIW Research Report N°
013 / Foreign Direct Investment Hassan S. and Barry W. (1997). The relationship between the real exchange rate and the trade balance: an empirical reassessment. International economic journal Volume 11, Number 1, Spring 1997. Iman S. (2005). The determinants of trade balance and adjustment to the crisis in Indonesia. CIES
discussion paper 0508.
Jarita D (2007). Determinants of Malaysian trade balance: an ARDL bound testing approach. Journal of
International Journal of Information, Business and Management, Vol. 7, No.4, 2015
ISSN 2076-9202
110
Economic Cooperation, 28,3 (2007), 21-40.
Khan and Hossain (2010). A Model of Bilateral Trade Balance: Extensions and Empirical Tests. Economic Analysis & Policy, Vol. 40 No. 3, December 2010 Luis C and Elisabetta F. (1999). Determinants of Argentina’s external trade. IMF working paper,
WP/99/121
Marco F. (2004). Export performance and its determinants: supply and demand constraints. United
Nations conference on trade and development, policy issues in international trade and commodities study
series no. 26
Nusrate A. (2008). The Role of Exchange Rate in Trade Balance: Empirics from Bangladesh. University
of Birmingham, UK Organisation for Economic Co-operation and Development (2000). Main determinants and impacts of foreign direct investment on China’s economy. Directorate for financial, fiscal and enterprise affairs,
working papers on international investment. Renan Z., Won W. and Jeremy W. M. (2007). Determinants of the U.S. Trade Balance in Consumer-Oriented Agricultural Products. Agribusiness & Applied Economics Report No. 607.
Sadia B (2007). Determining Import Intensity of Exports for Pakistan. SBP Working Paper Series, No. 15.
Sulaiman D M (2010). Determinant of Balance of Trade: Case Study of Pakistan. European Journal of
Scientific Research, ISSN 1450-216X Vol.41 No.1 (2010), pp.13-20.
Tafirenyika S., C. Chidoko and J. Zivanomoyo (2007). Determinants of Intra-Industry Trade between Zimbabwe and its Trading Partners in the Southern African Development Community Region (1990-2006). Journal of Social Sciences 5(1): 16-21, 2009
Tony M. (2006). China’s growing trade surplus: causes, consequences and policy implications. Refereed paper presented at the ACESA2006 Emerging China: Internal Challenges and Global Implications, Victoria University, Melbourne, 13-14 July 2006.
Waliullah, Mehmood, Rehmatullah and Wakeel (2010). The Determinants of Pakistan’s Trade Balance: An ARDL Co-integration Approach. The Lahore Journal of Economics, 15 : 1 (Summer 2010): pp. 1-26.
Zehra and Sajawal (2008). Bilateral J-Curves between Pakistan and Her Trading Partners. PIDE Working
Papers, 2008:45.
International Journal of Information, Business and Management, Vol. 7, No.4, 2015
ISSN 2076-9202
111
LABOUR CASUALIZATION AND TRADE UNIONISM IN NIGERIA
Oludele Mayowa SOLAJA
Department of Sociology, University of Ibadan, Nigeria
Email: [email protected]
Abstract
The role of trade union in contemporary industrial relation system is increasingly deflating as many work
organizations (formal and informal) now engage in labour casualization. Labour casualization is the
process where workers in an organization are casual, temporary, seasonal, contract or part-time employees
with little or no legal provisions. However, the most perturbing issue is the restriction of casual workers
from joining trade union which denied them from benefiting from collective agreement in the organization.
It is against this veracity that this paper set out to examine how labour casualization practices have affected
the activities of trade unionism in Nigeria. A descriptive survey method was adopted in the study.
Participants were 120 staffs of Larfage Wapco Cement, Ewekoro, Ogun State, Nigeria who were selected
through triangulation of sampling methods. Data were collected through structured questionnaire. Result
shows that labour casualization has weakened volume of trade union members, financial strength and
bargaining power of trade unions in Nigeria. Thus, the study recommends that government should invoke
relevant laws that will encourage casual workers to enjoy freedom of association in order to protect against
exploitation and to give them a voice.
Keywords: Industrial Relations, Trade Union, Labour Casualization, Exploitation, Freedom
Wordcount: 186
1. INTRODUCTION
One outstanding challenge facing the practice of trade union in developing countries as well as
Nigeria is “labour casualization”. Labour casualization depicts the process where workers in an
organization are casual, temporary, seasonal, contract or part-time employees with little or no legal
provisions.
Labour casualization is a function of incredible changes in the world of work- from a labour –
management relationship to a commercial-management relationship- with the workers taking the greater
portion of the risk of engagement. This form of labour practice has a history (see Noon and Blyton 2002;
Statt 2004). In late19th and all through 20th centuries, work is taken as an activity where individuals alone
and collectively engage in productive endeavors to accomplish certain tasks in which are self set or set by
International Journal of Information, Business and Management, Vol. 7, No.4, 2015
ISSN 2076-9202
112
others and which may or may not be remunerated meanwhile, the need to foster workers satisfaction and
workers right led to the formation of trade union (a voluntary organization of workers which aims to protect
and promote the socio-economic interest of its members through collective bargaining with employers) in
the organization. This posture, according to Marx, Engels, Webber and other prehistoric scholars marked
the beginning of struggle between capitalism and socialism or between money and the people (see Carris
and Malloch, 2006). However, the turn of 21st century experience an alternative view to the understanding
of work by bringing in formal recognition for voluntary, unpaid and underpaid work carried out by citizens
(Beck, 1998; 2000; 2004). This, notwithstanding, can be described as era of disempowerment of unionism
that caused the return of workers to previously escaped web of diminishing rights and working conditions
in work organization. For a fact, casualization in current sense is one of the ways which the role of trade
union had been amputated in today’s ultramodern organization.
Further attempts to review academic literature revealed that some factors are accountable for the
stretch of labour casualization across workplaces. These factors includes; increasing desperation of
employers to cut-down organizational cost and increase capital mobility (Kalleberg, 199; Basso 2003;
Anugwon 2007; Okafor 2011; Fapohunda 2012), deregulation of labour market (Bernstein 2007), trade
liberation (Standing 2008), inability to bring effective regulation to fill the loopholes of a globalizing
economy (Okafor 2007; Kalleberg 2009), intention of the employees to combined work with study or
family responsibilities, moonlighting, unemployment and poverty (Okafor 2012; Fapohunda 2012;
Bamidele 2010). It must be noted here that there has been increasing arguments for and against the practice
of labour casualization in current studies, some of which we shall examined in the later sections. However,
this paper set out to examine the effect of labour casualization on trade union activities in Nigeria which is
almost absent in contemporary studies.
Aim of the Study
The general aim of this study is to examine the effect of labour casualization on trade unionism in
Nigerian cement companies. While the specific objectives are to:
i. Know the factors hindering trade union anti-casualization campaign in Larfarge Cement
Company.
International Journal of Information, Business and Management, Vol. 7, No.4, 2015
ISSN 2076-9202
113
ii. Know the activities of trade union that has been affected by labour casualization in Larfarge
Cement Company.
iii. Investigate if those who work as casual staff will eventually become full time workers in Larfarge
Cement Company.
2. LITERATURE REVIEW
This section examines some critical issues in the present understanding of casualization and labour
casualization in contemporary world.
Casualization: A cursory look
The term casualization has been controversial issue among authors in management and social
sciences. This is because of the dynamic nature of casualization as a new form of labour practice in
developing countries like Nigeria. Casualization is complex to define however, is a process of filling
positions that are supposed to be permanent with temporary or contract employees.
Some authors viewed casualization as a work structuring that promotes bad working conditions,
inequality, injustice, exploitation and modern form of workers enslavement (Okafor, 2012; Fapohunda
2012; Bamidele 2010) as a result, casualization must not be entertained in employment relationships. While
others are of the opinion that casualization constitute the price of progress because it creates room for
unemployed individuals to kick out idleness and become casual workforce as well as develop their
potentials though the reward for their contribution as casual worker may not be commensurate to that of
full-time worker (May, Campbell and Burgess 2005; Kalejaiye 2014). In spite of the controversies,
casualization still fix many prospective employees into the needs of production and service provision by
offering only very limited choices to workers. Shorter hours are usually associated with lower pay and
lower skilled work. Buchanan (2004) strongly affirmed that casual employment is primarily undertaken
by those with other commitments (e.g. careers for children and the elderly and students) or with no other
choice (e.g. blue collar workers seeking any kind of alternative to unemployment). With this mind, it is
important to note that casualization can appear inform of contract/seasonal/interim labour (workers hired
to perform certain tasks with stipulated deadline or expiring date) or casual labour (workers hired to work

International Journal of Information, Business and Management, Vol. 7, No.4, 2015
ISSN 2076-9202
114
full-time or part-time with little benefits compare to permanent employees). Another point to note is that
casual/contract labour can be out-sourced or called ‘agency labour’ (workers who are employ temporarily
to fill certain positions through an employment agency) and may be in-sourced (workers on contract
business function and commencement of performing it internally).
Concept of Labour Casualization
There is no generally acceptable definition of labour casualization however; it can be viewed as
part of a new era of the management of labour where workers in an organization are casual, temporary,
seasonal, contract or a part-time employees. Labour casualization can take different forms in different
countries. Labour casualization has been one of the prominent means for increasing the proportion of
employees in Australia, United Kindom, Russia and United State of America in the last two decades
(Campbell and Brosnan 1999; Watson et al. 2003).
The Bureau of labour Statistics (2012) revealed that labour casualization about 82 million workers
in the United States are casual workers; casual workers constitute 60% in Korea, 58% in Bosnia and
Herzegovina, 52.5% in Macedonia, 49% in Serbia as well as 40% in Japan and Greece respectively. In
Maghreb, Egypt, China as well as Nigeria, there is no statistic available to show however, report shows
that casualization is growing in unprecedented speed. The fact about the practice of labour casualization is
Nigeria is that organizations that adopts casualization model do compromise the statutory labour standards
and workers rights (Fapohunda, 2012) in order to make work activities less secure on a freelance and
occasional basis (Bamidele, 2010) with strict ban of workers from trade unionism. This in effect results in
powerlessness, lack of representation and freedom of casual workers. Now let’s examine the issue of
labour casualization in Nigerian context.
The Nigerian Experience of Labour Casualization
Inference from the statistics submitted by management experts revealed that the trail of labour
casualization is spreading virtually to all work organizations (formal and informal) in Nigeria. In the
statistics, about fifty percent of workers in the oil and gas, telecommunication, banking and
manufacturing companies are casual workers whose interest are not fully captured under the Labour act
International Journal of Information, Business and Management, Vol. 7, No.4, 2015
ISSN 2076-9202
115
and as a result, they work under precarious working conditions with complete refutation of some benefits
associated with permanent employment (Eroke, 2012; Faponhunda 2012; NLC, 2013). Also, the report
published by Campaign for Democratic Workers’ Rights in Nigeria a non-governmental organization
reveals forty-five percent of Nigeria labour force is made up of casual workers who are under harsh
working environment (CDWR, 2010). Consequently, CDWR condemns the management of Dangote
Savannah Sugar Company Plc in Adamawa state, Nigeria for subjecting workers of the company to
conditions akin to slave labour without commensurate reward for it.
Majority of the workers are underpaid while about 80 percent of them work under terrible working
conditions for seven to eight years with no consideration for permanent employment in the company.
Similarly, about 3,000 permanent workers who are Nigerians were sacked by a Telecommunication
Company, Airtel Nigeria Limited in 2011and they were replaced by casual workers (Fapohunda, 2012).
Okei-odumakin (2013) described this kind of casualization of work as slavery in one’s father land.
However, the practice of casualization and its associated unfair labour practices are carried out in order to
keep up with global trade liberation and competition as well as to enhance organizational profit margin,
have been an obstacle to the growth of ethically responsible management, and on the other hand, its
recourse the era of cruel Scientific Management. Since, casualization force casual workers to trade off the
right to join trade union and being fully protected by the labour statutory provisions in work organization
in an intermittent manner. This in effect has consequential result on the scientific study of relationships
among the actors of industrial relation systems (employers/employers association; employees/trade union;
government and its agencies).
Commenting on the practice of casual employment in Nigeria, authors like Bamidele (2010),
Fapohunda (2012), Okafor (2012) and Kalejaiye (2014) observed that casualization has brought in its the
development of a more flexible and dynamic workforce in many workplaces in Nigeria yet, with many
short-comings. The facts that informed their positions on the adoption of casualization in Nigeria include
that:
International Journal of Information, Business and Management, Vol. 7, No.4, 2015
ISSN 2076-9202
116
i. Casual workers are not entitled to statutory benefits provided by Labour act (Okafor 2010 and
2012)
ii. Casual workers are relatively cheap to acquired and poorly paid i.e. most banks in Nigeria hired
more casual workers than full-time or permanent workers in order to minimize cost of providing
statutory benefits to workers (Fapohunda, 2012; Kalejaiye 2014)
iii. As a prerequisite for many organizations to participate in the globalizing competitive economy
(Okafor, 2007)
iv. Casual employment gives the employer the power to hire and fire without observing any statutory
procedures (Bamidele 2010)
Aside the above, another salient point is that casual employment saves employers from the troubles of
unionism because casual employees are excluded from joining a union or any kinds of workplace
association. This act will lead to unprecedented fall in union members with concomitant implication on
the important resources (intrinsic and extrinsic) to promote active trade unionism.
To further understand the course of this study, the term trade union is examined below.
Concept of Trade Union Examined
Trade union is a vital part of industrial relation systems. International Labour Organization (ILO)
defined trade union as “an association, consisting predominantly of employees, the principle activities of
which include the negotiation of pay and conditions of employment for its members” (ILO, 2001). However,
evidences from scholars revealed that unions also go beyond collective bargaining to perform other
essential roles such as role for environment protection, energy management, politics and law making,
public health, productivity and efficiency improvement of socialization process, poverty alleviation and
disasters sensitization and assistance. According to ILO (2005), trade unions engage in indispensable roles
that expand beyond the four pillars of the organizational environment. They make incredible efforts to
lessening of inequality, employee’s oppression and social protection.
The more organized workers are, the better and stronger they can determine their destiny in the
workplace, as they best understand their own economic and political situations. Thus, ILO report
International Journal of Information, Business and Management, Vol. 7, No.4, 2015
ISSN 2076-9202
117
acknowledged trade unions as a crucial engine to sustainable development and their actions contribute
greatly to the regulation of the global economy. So why are employers restricting their casual employees
from becoming member of trade union!
Studies on trade union performance in Nigeria also affirmed that unions played vital roles in the
front line of the struggle for democracy, liberation and sustenance of democratic principles. Their roles can
also be traced to the various struggles during the colonial era and even after independent (Adebisi, 2011).
Most importantly, the several years of military dictatorship and despotic rules witnessed unprecedented
challenges from the trade union movements. The number of strike actions and man-hour loss are
unquantifiable because, they want to fight against social injustice, unfair dictatorship and human
deprivations. Trade union movements also pursue the need for good governance and adherence to the rule
of law during the few years of democratic experience in Nigeria.
Unfortunately, the performance of trade unions in Nigeria has been taunted by the increasing
casualization of employment and the restrictions of casual workers to participate in union activities. More
so, it is equally pertinent to note that workers restriction from union activities is not only peculiar to
casual workers, but also to employees who secure job in workplaces where they are denied of full
statutory protection or labour act. However, the rate at which casual workers are denied of the right to
form or participate in trade unionism in Nigeria is very alarming and worrisome.
Impact of Labour Casualization on Trade Union Activities in Nigeria
Industrial sociologists and management scholars observed that there has been significant
diminishing and disappointing role of trade unions in recent times. Part of the evidence reveals by them is
the drastic reduction of union members and the incapacity to promote trade union activities in Nigeria
(Moammed, 2010; Okafor 2012; Fapohunda 2012; Adefolaju, 2013). Commenting on the nature of labour
casualization in Nigeria, Mohammed (2010) revealed that “casualization of employment worsened the
activities of trade unions as casual workers are not fully employed and as a result, they are less secured by
the legal laws or statutory act that ought to support them to engage in trade union activities”. This is so
International Journal of Information, Business and Management, Vol. 7, No.4, 2015
ISSN 2076-9202
118
glaring in the treatment of casual workers in Nigerian organizations, when casual staffs try to participate
in protest against employer’s policies, even if it affects the terms of employment and condition of their
engagement, they are likely to receive sanctions or dismissal from the management. An example is the
sacked of about 250 casual workers at Dangote Pasta Ikorodu in August 2010 for joining and participating
in trade unionism (NUFBTE) which other staffs in the same organization belongs to. This posture
depict that rather than creating a ‘fit in’, equality and good sense of belonging among the workers (casual
and permanent), employers out of their selfishness build mammoth dichotomy between workers which is
detrimental to the progress of the organization.
According to Oechslin (1997) and Kelly (1998) cited in Adefolaju (2013), the effect of new structure
of production such as casualization of employment, part-time work, out-contracting, employing women to
replace men, but paid lower wages, non-payment of wages and non-remittance of check-off dues has
incredible consequences on trade unionism. Some of the consequences are:
i. A decline in trade union membership, density and influence.
ii. Absolute or relative decline in numbers of male, manual, full-time industrial workers and the use
of female, non-manual part-time and service workers.
iii. A decline in trade union movement as a unified political actor.
Adefolaju (2013) cited that Sklair (1995) observed that strike weapon has been blunted by the new
structure of production whereby transnational corporations (TNCs) no longer depend on one factory and
one workforce for production. As a result, the new international division of labour becomes more flexible
such that employers migrate in search of cheap labour, while preventing labour from holding capital to
ransom through a strike action. Adefolaju opted that this new production process has considerably
reduced union power to organize locally.
More so, due to the new production structure, trade unions continue to confront various challenges
which are posing a threat to its ability to organize and serve their members to the fullest. This also
involve issues like job insecurity, reduced wages/salaries and increased hours of work and work load in
the workforce further hinder trade union activities in Nigeria. In the face of these challenges, trade union
International Journal of Information, Business and Management, Vol. 7, No.4, 2015
ISSN 2076-9202
119
leaders need to be strengthened by the government or nongovernmental bodies against counteract forces
that are barriers for workers (casual or full time) to partake in trade unionism. Unfortunately, government
and its agencies seem not to be awake to address this virus (casualization) affecting the nature of
employment, working conditions and trade unionism in Nigeria. This suffices to drive home the need for
union representatives to engage in proactive anti-casualization campaign in Nigeria.
Strategies to enhance Anti-casualization Campaign of Union Representatives in Nigeria
The following strategies should be adopted in the anti-casualization campaign;
1. Resist political and social pressures: The interest of the casual workers as well as the union itself
should be put at the forefront. Realities have shown that Nigerian society is socially and politically
compromised, therefore, union executives should not accommodate political-fellow feelings,
loyalist behaviour or social pressure that may undermine their struggle for casual workers
participation in trade unionism in Nigeria.
2. Adept use of the ideological apparatus or mass media: Media and other mass communication
apparatus should be used to create more awareness for the right of casual workers involvement in
trade unionism. Hence, media channel such as newspaper, television, radio, bill board, hand bills
and public lecture as well as periodic labour sensitization should all be utilized.
3. Create freewill medium for funds or financial support: Due to the fact that employing media
and other ideological apparatus for publicity and awareness requires funds to execute, thus, union
leaders should build a non-politically influenced means of securing financial assistance from
external sources.
4. Stand firm to resists non compliance to Nigerian Labour act by employers: At this point,
union leaders have to ensure that employers of labour adhere to Nigerian Labour act without
discrimination among the workers. That is, all workers (casual or full-time) must enjoy equal
coverage under the statutory provisions of Nigerian Labour act. In this regard, casual employees
who to partake in trade union activities should be allow by their employers. Any employer who is
caught in non-compliance to the statutory provision should be held by legal authorities.
5. Seek illegal opinion and directives: Professional advice and directives on technical issues should
be sought from legal practitioners. This will enhance their knowledge and preparation to win the
struggle for freedom of casual labour to join trade union in Nigeria.
3. METHODOLOGY
Research Design: The survey research design method was used. This involves using a self-designed
International Journal of Information, Business and Management, Vol. 7, No.4, 2015
ISSN 2076-9202
120
questionnaire in colleting data from the respondents. This method was chosen in order to make reference
to phenomena as they exist in real life and it is relatively economical in terms of time and resources.
Study Area: Larfarge Cement Company was selected as the study organization being a multinational
corporation with mixed organizational culture and value regarding employment practices. It is also aimed
that using Lafarge Cement Company will complement other studies conducted on the subject matter who
focused mainly on domestic and few foreign firms in Nigeria.
Subject: Subjects for the study were one hundred and twenty employees of Larfarge Cement Ewekoro
plant, Ogun State, Nigeria. These subjects were drawn randomly from the different departments for
sample. The simple random sampling is a basic sampling design, which allows equal representation and
selection of samples. The selection of the subjects was done in such a way to include all categories of
worker (casual staff and permanent staff) and it cuts across gender. This was done in anticipation that
such a sampling of subject will provide the necessary variety of information required of this study.
Research Instrument: The instrument used in this study is a close-ended questionnaire that was designed
by the researcher. The questionnaire comprises three (3) parts or sections; with section “A” comprising
eight (8) items seeking demographic data such as age, sex, status, level of education etc. Section “B”
consists of ten (10) items, which sought to collect information about the level of casualization and
contract staffing in the organization. Section “C” contains ten (10) items on the effect of the rise in casual
workers on trade union activities in the organization.
Reliability and Validity: In order to establish the reliability of this instrument, a pilot study was carried
out on a sample of twenty (20) staff of the same company, Ewekoro plant, using a test-retest method. The
result of the reliability test was 0.52 showing that the instrument is reliable. In confirming the validities of
the instrument, face and content validities were ensured by conference of experts.
Procedure: The subjects were given the questionnaire in their place of work. Instruction on how to fill
the questionnaire was given. Confidential treatment of information was assured. With regard to the
scoring of responses, the first section of the questionnaire needs no score attached to it, since the
information required are demographic data of the subject. The second and third section that is “B” and “C”
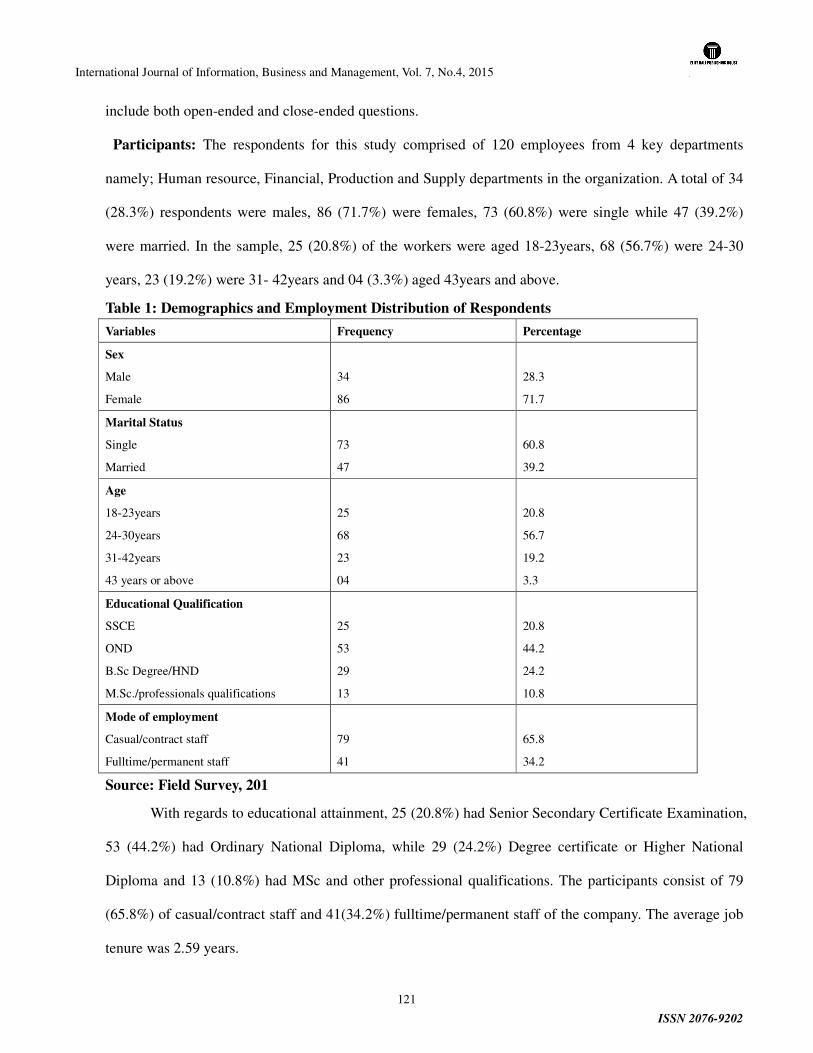
International Journal of Information, Business and Management, Vol. 7, No.4, 2015
ISSN 2076-9202
121
include both open-ended and close-ended questions.
Participants: The respondents for this study comprised of 120 employees from 4 key departments
namely; Human resource, Financial, Production and Supply departments in the organization. A total of 34
(28.3%) respondents were males, 86 (71.7%) were females, 73 (60.8%) were single while 47 (39.2%)
were married. In the sample, 25 (20.8%) of the workers were aged 18-23years, 68 (56.7%) were 24-30
years, 23 (19.2%) were 31- 42years and 04 (3.3%) aged 43years and above.
Table 1: Demographics and Employment Distribution of Respondents
Variables Frequency Percentage
Sex
Male
Female
34
86
28.3
71.7
Marital Status
Single
Married
73
47
60.8
39.2
Age
18-23years
24-30years
31-42years
43 years or above
25
68
23
04
20.8
56.7
19.2
3.3
Educational Qualification
SSCE
OND
B.Sc Degree/HND
M.Sc./professionals qualifications
25
53
29
13
20.8
44.2
24.2
10.8
Mode of employment
Casual/contract staff
Fulltime/permanent staff
79
41
65.8
34.2
Source: Field Survey, 201
With regards to educational attainment, 25 (20.8%) had Senior Secondary Certificate Examination,
53 (44.2%) had Ordinary National Diploma, while 29 (24.2%) Degree certificate or Higher National
Diploma and 13 (10.8%) had MSc and other professional qualifications. The participants consist of 79
(65.8%) of casual/contract staff and 41(34.2%) fulltime/permanent staff of the company. The average job
tenure was 2.59 years.
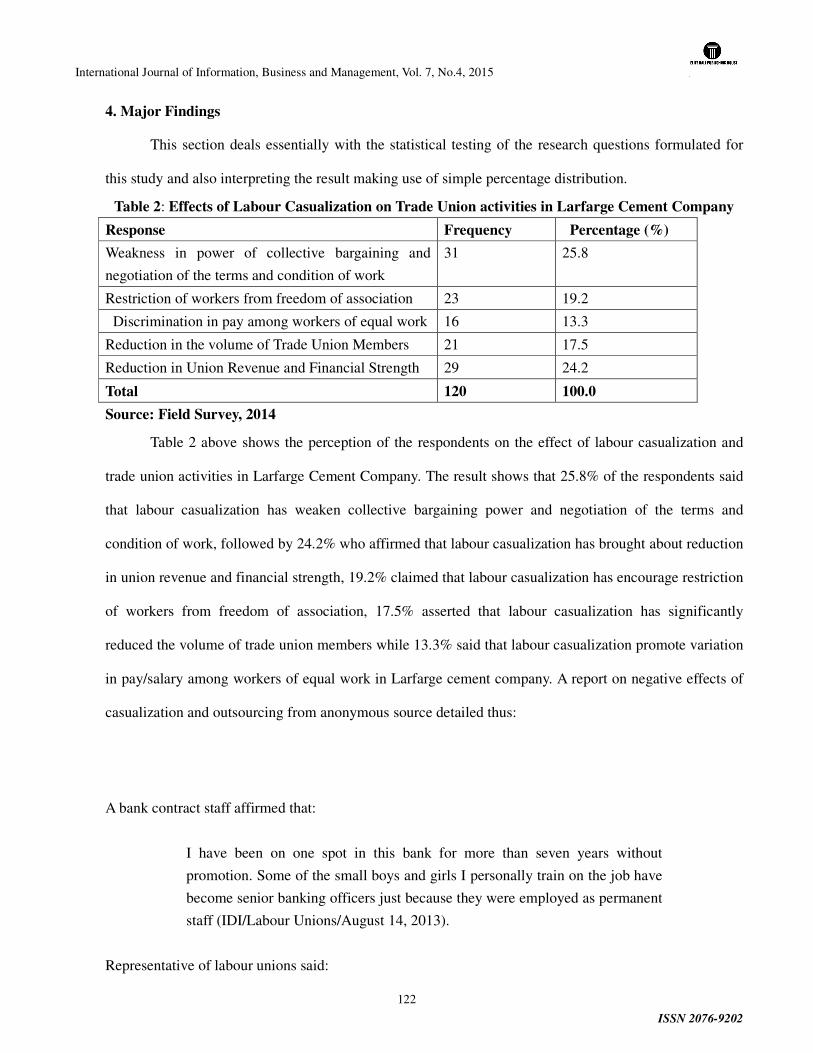
International Journal of Information, Business and Management, Vol. 7, No.4, 2015
ISSN 2076-9202
122
4. Major Findings
This section deals essentially with the statistical testing of the research questions formulated for
this study and also interpreting the result making use of simple percentage distribution.
Table 2: Effects of Labour Casualization on Trade Union activities in Larfarge Cement Company
Response Frequency Percentage (%)
Weakness in power of collective bargaining and
negotiation of the terms and condition of work
31 25.8
Restriction of workers from freedom of association 23 19.2
Discrimination in pay among workers of equal work 16 13.3
Reduction in the volume of Trade Union Members 21 17.5
Reduction in Union Revenue and Financial Strength 29 24.2
Total 120 100.0
Source: Field Survey, 2014
Table 2 above shows the perception of the respondents on the effect of labour casualization and
trade union activities in Larfarge Cement Company. The result shows that 25.8% of the respondents said
that labour casualization has weaken collective bargaining power and negotiation of the terms and
condition of work, followed by 24.2% who affirmed that labour casualization has brought about reduction
in union revenue and financial strength, 19.2% claimed that labour casualization has encourage restriction
of workers from freedom of association, 17.5% asserted that labour casualization has significantly
reduced the volume of trade union members while 13.3% said that labour casualization promote variation
in pay/salary among workers of equal work in Larfarge cement company. A report on negative effects of
casualization and outsourcing from anonymous source detailed thus:
A bank contract staff affirmed that:
I have been on one spot in this bank for more than seven years without
promotion. Some of the small boys and girls I personally train on the job have
become senior banking officers just because they were employed as permanent
staff (IDI/Labour Unions/August 14, 2013).
Representative of labour unions said:
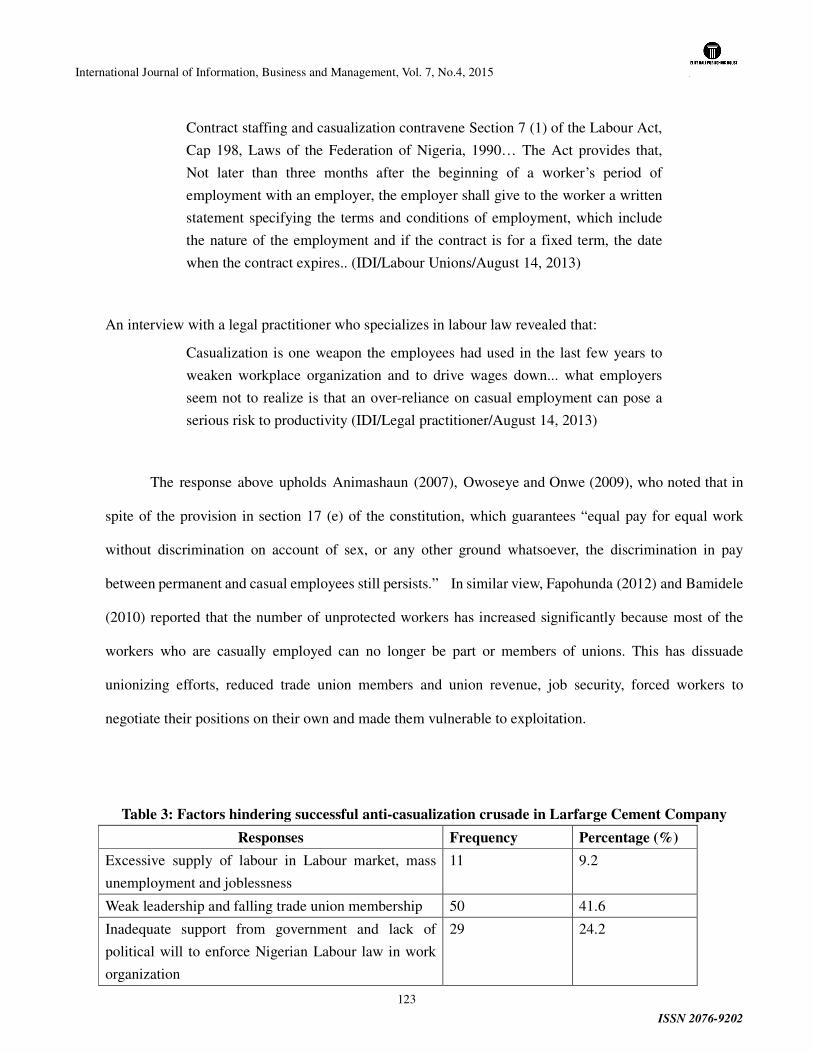
International Journal of Information, Business and Management, Vol. 7, No.4, 2015
ISSN 2076-9202
123
Contract staffing and casualization contravene Section 7 (1) of the Labour Act,
Cap 198, Laws of the Federation of Nigeria, 1990… The Act provides that,
Not later than three months after the beginning of a worker’s period of
employment with an employer, the employer shall give to the worker a written
statement specifying the terms and conditions of employment, which include
the nature of the employment and if the contract is for a fixed term, the date
when the contract expires.. (IDI/Labour Unions/August 14, 2013)
An interview with a legal practitioner who specializes in labour law revealed that:
Casualization is one weapon the employees had used in the last few years to
weaken workplace organization and to drive wages down... what employers
seem not to realize is that an over-reliance on casual employment can pose a
serious risk to productivity (IDI/Legal practitioner/August 14, 2013)
The response above upholds Animashaun (2007), Owoseye and Onwe (2009), who noted that in
spite of the provision in section 17 (e) of the constitution, which guarantees “equal pay for equal work
without discrimination on account of sex, or any other ground whatsoever, the discrimination in pay
between permanent and casual employees still persists.” In similar view, Fapohunda (2012) and Bamidele
(2010) reported that the number of unprotected workers has increased significantly because most of the
workers who are casually employed can no longer be part or members of unions. This has dissuade
unionizing efforts, reduced trade union members and union revenue, job security, forced workers to
negotiate their positions on their own and made them vulnerable to exploitation.
Table 3: Factors hindering successful anti-casualization crusade in Larfarge Cement Company
Responses Frequency Percentage (%)
Excessive supply of labour in Labour market, mass
unemployment and joblessness
11 9.2
Weak leadership and falling trade union membership 50 41.6
Inadequate support from government and lack of
political will to enforce Nigerian Labour law in work
organization
29 24.2
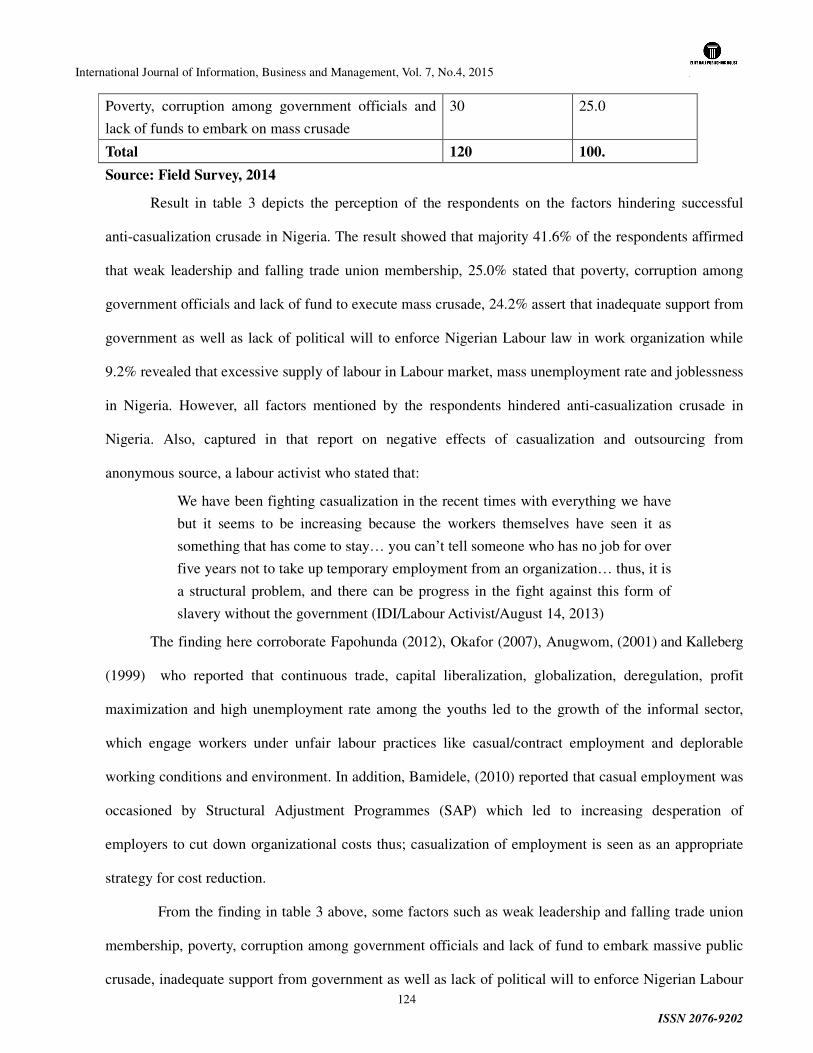
International Journal of Information, Business and Management, Vol. 7, No.4, 2015
ISSN 2076-9202
124
Poverty, corruption among government officials and
lack of funds to embark on mass crusade
30 25.0
Total 120 100.
Source: Field Survey, 2014
Result in table 3 depicts the perception of the respondents on the factors hindering successful
anti-casualization crusade in Nigeria. The result showed that majority 41.6% of the respondents affirmed
that weak leadership and falling trade union membership, 25.0% stated that poverty, corruption among
government officials and lack of fund to execute mass crusade, 24.2% assert that inadequate support from
government as well as lack of political will to enforce Nigerian Labour law in work organization while
9.2% revealed that excessive supply of labour in Labour market, mass unemployment rate and joblessness
in Nigeria. However, all factors mentioned by the respondents hindered anti-casualization crusade in
Nigeria. Also, captured in that report on negative effects of casualization and outsourcing from
anonymous source, a labour activist who stated that:
We have been fighting casualization in the recent times with everything we have
but it seems to be increasing because the workers themselves have seen it as
something that has come to stay… you can’t tell someone who has no job for over
five years not to take up temporary employment from an organization… thus, it is
a structural problem, and there can be progress in the fight against this form of
slavery without the government (IDI/Labour Activist/August 14, 2013)
The finding here corroborate Fapohunda (2012), Okafor (2007), Anugwom, (2001) and Kalleberg
(1999) who reported that continuous trade, capital liberalization, globalization, deregulation, profit
maximization and high unemployment rate among the youths led to the growth of the informal sector,
which engage workers under unfair labour practices like casual/contract employment and deplorable
working conditions and environment. In addition, Bamidele, (2010) reported that casual employment was
occasioned by Structural Adjustment Programmes (SAP) which led to increasing desperation of
employers to cut down organizational costs thus; casualization of employment is seen as an appropriate
strategy for cost reduction.
From the finding in table 3 above, some factors such as weak leadership and falling trade union
membership, poverty, corruption among government officials and lack of fund to embark massive public
crusade, inadequate support from government as well as lack of political will to enforce Nigerian Labour
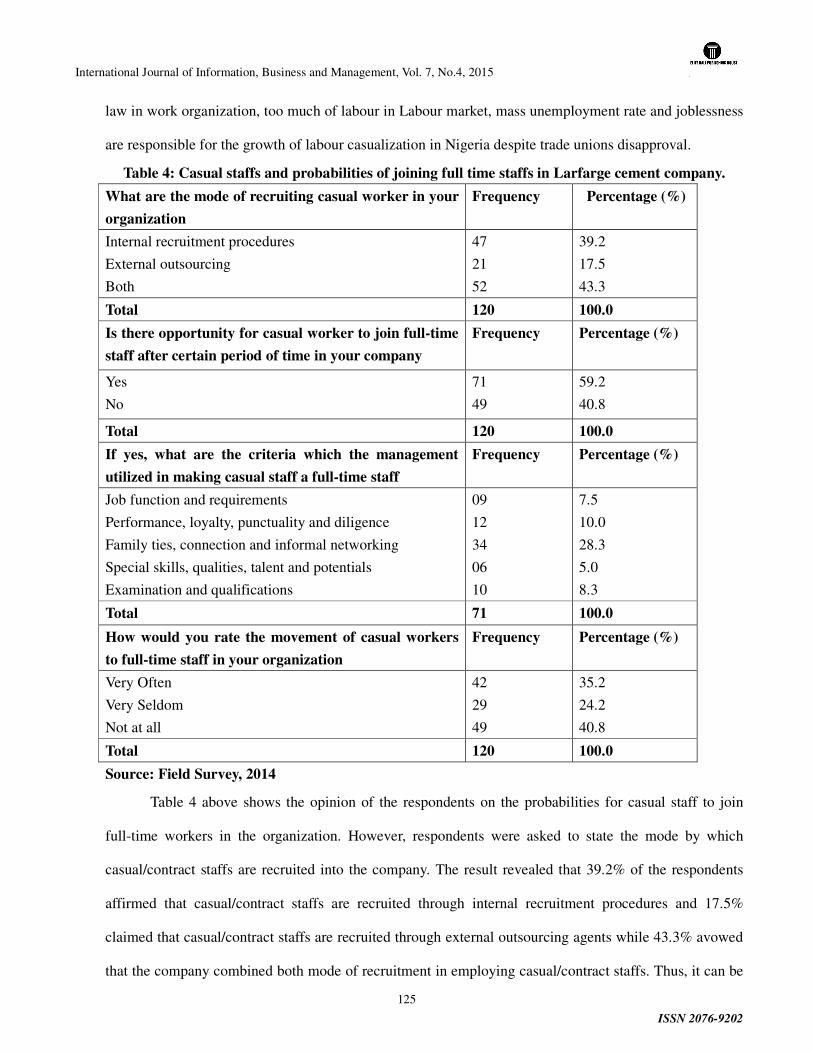
International Journal of Information, Business and Management, Vol. 7, No.4, 2015
ISSN 2076-9202
125
law in work organization, too much of labour in Labour market, mass unemployment rate and joblessness
are responsible for the growth of labour casualization in Nigeria despite trade unions disapproval.
Table 4: Casual staffs and probabilities of joining full time staffs in Larfarge cement company.
What are the mode of recruiting casual worker in your
organization
Frequency Percentage (%)
Internal recruitment procedures
External outsourcing
Both
47
21
52
39.2
17.5
43.3
Total 120 100.0
Is there opportunity for casual worker to join full-time
staff after certain period of time in your company
Frequency Percentage (%)
Yes
No
71
49
59.2
40.8
Total 120 100.0
If yes, what are the criteria which the management
utilized in making casual staff a full-time staff
Frequency Percentage (%)
Job function and requirements
Performance, loyalty, punctuality and diligence
Family ties, connection and informal networking
Special skills, qualities, talent and potentials
Examination and qualifications
09
12
34
06
10
7.5
10.0
28.3
5.0
8.3
Total 71 100.0
How would you rate the movement of casual workers
to full-time staff in your organization
Frequency Percentage (%)
Very Often
Very Seldom
Not at all
42
29
49
35.2
24.2
40.8
Total 120 100.0
Source: Field Survey, 2014
Table 4 above shows the opinion of the respondents on the probabilities for casual staff to join
full-time workers in the organization. However, respondents were asked to state the mode by which
casual/contract staffs are recruited into the company. The result revealed that 39.2% of the respondents
affirmed that casual/contract staffs are recruited through internal recruitment procedures and 17.5%
claimed that casual/contract staffs are recruited through external outsourcing agents while 43.3% avowed
that the company combined both mode of recruitment in employing casual/contract staffs. Thus, it can be
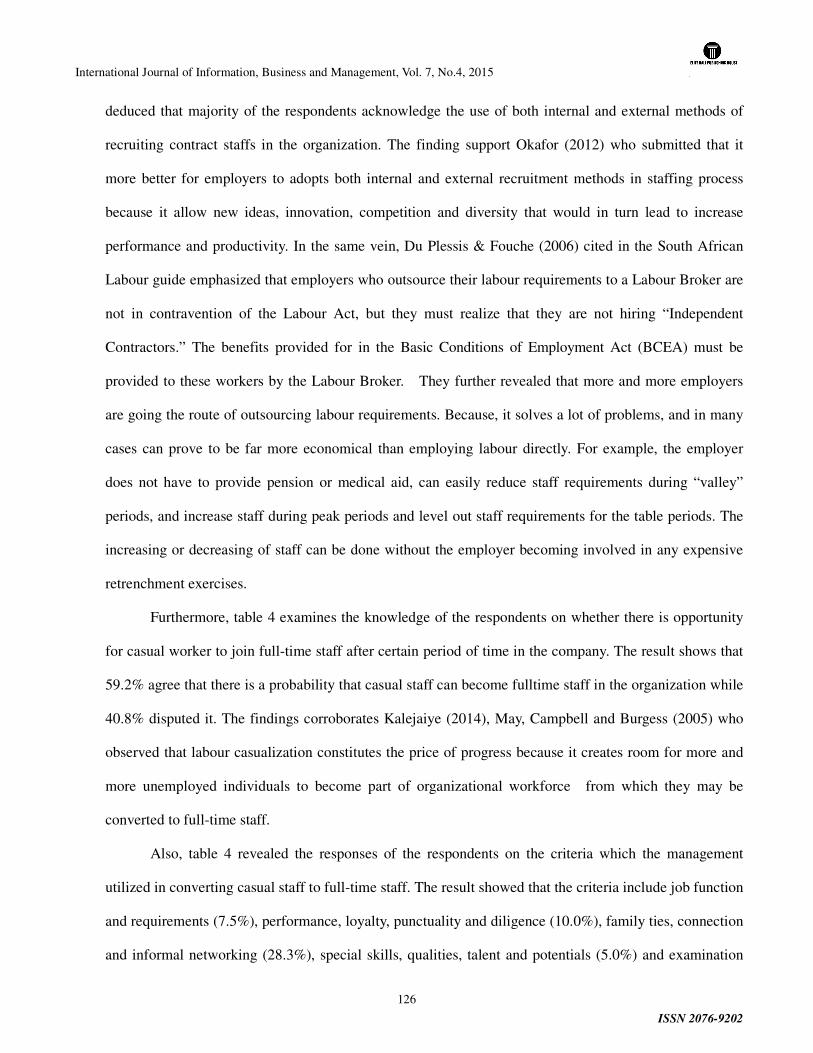
International Journal of Information, Business and Management, Vol. 7, No.4, 2015
ISSN 2076-9202
126
deduced that majority of the respondents acknowledge the use of both internal and external methods of
recruiting contract staffs in the organization. The finding support Okafor (2012) who submitted that it
more better for employers to adopts both internal and external recruitment methods in staffing process
because it allow new ideas, innovation, competition and diversity that would in turn lead to increase
performance and productivity. In the same vein, Du Plessis & Fouche (2006) cited in the South African
Labour guide emphasized that employers who outsource their labour requirements to a Labour Broker are
not in contravention of the Labour Act, but they must realize that they are not hiring “Independent
Contractors.” The benefits provided for in the Basic Conditions of Employment Act (BCEA) must be
provided to these workers by the Labour Broker. They further revealed that more and more employers
are going the route of outsourcing labour requirements. Because, it solves a lot of problems, and in many
cases can prove to be far more economical than employing labour directly. For example, the employer
does not have to provide pension or medical aid, can easily reduce staff requirements during “valley”
periods, and increase staff during peak periods and level out staff requirements for the table periods. The
increasing or decreasing of staff can be done without the employer becoming involved in any expensive
retrenchment exercises.
Furthermore, table 4 examines the knowledge of the respondents on whether there is opportunity
for casual worker to join full-time staff after certain period of time in the company. The result shows that
59.2% agree that there is a probability that casual staff can become fulltime staff in the organization while
40.8% disputed it. The findings corroborates Kalejaiye (2014), May, Campbell and Burgess (2005) who
observed that labour casualization constitutes the price of progress because it creates room for more and
more unemployed individuals to become part of organizational workforce from which they may be
converted to full-time staff.
Also, table 4 revealed the responses of the respondents on the criteria which the management
utilized in converting casual staff to full-time staff. The result showed that the criteria include job function
and requirements (7.5%), performance, loyalty, punctuality and diligence (10.0%), family ties, connection
and informal networking (28.3%), special skills, qualities, talent and potentials (5.0%) and examination
International Journal of Information, Business and Management, Vol. 7, No.4, 2015
ISSN 2076-9202
127
and qualifications (8.3%) among others. However, majority of the respondents affirmed that the family
ties, connection and informal networking are the most prevalent criteria. In addition, 35.2% of the
respondents rated the movement of casual workers to full-time staff in your organization very often while
24.2 rated it very seldom and 40.8% denied the probabilities of converting casual staff to full time staff in
the organization. The deduction that can be made here is that the propensity for converting casual staff to
fulltime staff is very low and insignificant in the organization.
Conclusion
Trade unions in Nigeria have for long engage in the struggle and massive fight against workplace
oppression, gender discrimination, bad working conditions, job insecurity, unfairness and injustice in
workplace hence depleting virus such as “Labour Casualization” will further cripple their efforts to ensure
continuity in the struggle. Since, casualization is a commercial employment relationship enables
employers to ignore workplace standards and worker social needs and to create a strong barrier against
workplace unionism. The findings of this study have shown that trade unions activities have been
negatively affected due to increasing casualization of employment in Nigeria. Also, the struggle to fight
the menace of casualization in many workplaces in Nigeria have been hindered as a result of some factors
such as weak leadership and falling trade union membership, poverty, corruption among government
officials and lack of fund to embark massive public crusade, inadequate support from government as well
as lack of political will to enforce Nigerian Labour law in work organization. More so, the findings
revealed that casualization has weaken collective bargaining power and negotiation of the terms and
condition of work, brought about reduction in union revenue and financial strength, encourage restriction
of workers from freedom of association and falling volume of trade union members as well as promoting
variation in pay/salary among workers of equal work in contemporary work organization. Further
findings of this study established that employers adopt both internal and external methods of recruitment
in sourcing contract/casual staffs for the organization. In addition, the findings of this study showed that
there is a prospect that casual staff can become fulltime staff in work organization though; this is very
slim and rare in many organizations in Nigeria.

International Journal of Information, Business and Management, Vol. 7, No.4, 2015
ISSN 2076-9202
128
Recommendations
In view of the above discussion, this study is interested in fostering the following
recommendations:
i. Within work organization, every worker regardless of their mode of employment should be
entitled to assemble freely and associate with other persons, and in particular form or belong to
any trade union or association for the protection of his interests and determination of terms and
condition of employment.
ii. Policy makers must make legislations to protect casual workers from the exploitation of
employers. Casualization of labour is against the campaign of full employment and decent work
for all and an assault on workers’ rights. Therefore, government for enact policies that will give
signs of hope to the plight of casual/contract workers in Nigeria. Such policies should emphasize
equity in terms and conditions of work among casual and permanent workers. Also, in some
instances where casual workers are been used to filled permanent positions there should high level
of probability that those casual work will be converted to fulltime staffs within reasonable period
of service.
iii. Casualization is a big challenge for unions in their bid to protect and advance workers‟ rights and
foster decent work. Thus, trade unions must develop and explore new strategies to organize and
fight for the rights of casual workers or its outright eradication in many work places particularly in
organizations that employ more of casual staffs than permanent staffs.
iv. In the face of increasing casualization of labour unions have a significant role to play. Trade
unions must take the lead in the campaign against casualization of labour and the restoration of
decency and dignity to work in all its forms and categories.
REFERENCES
Animashaun, O. (2007) „Casualization and Casual Employment in Nigeria: Beyond Contract. Labour Law Review Vol. 1, No. 4, pp.14-34. Anugwom. B. 2007. An Address he delivered at the Seminar/Workshop on Casualization, Organised by
International Journal of Information, Business and Management, Vol. 7, No.4, 2015
ISSN 2076-9202
129
OPTS held on 5th and 6th of November 2001 at the Nicon Hilton, Abuja, Nigeria. Bamidele, R.(2010). Casualization and labour utilization in Nigeria. Department of Sociology and psychology, Fountain University Osogbo, Osun State. Du Plessis & Fouche, 2006. A Practical Guide to Labour Law, 9 Kogan Basso, P., 2003. Modern Times, Ancient Hours: Working in the Twenty-First Century. London: Verso Bodibe, O,2007.TheExtent and Effects of Casualization in Southern Africa: Analysis of Lesotho, Mozambique, South Africa, Swaziland, Zambia and Zimbabwe. Research Report for the Danish Federation of Workers. Fapohunda, O. J. (2010) Employment and Unemployment in Lagos. Institute of Social Studies, The Hague Netherlands, Occasional Paper No 66 pp 1-18. International Labour Organization ILO (2004) Working Paper No. 237. Freedom of Association and Protection of the Right to Organise Convention (No. 87) International Labour Office Geneva. International Labour Organization ILO (2007). Equality at Work: Tackling the Challenges. Report of the Director- General. Geneva. International Labour Organization ILO (2008) World of Work Report. Geneva. Kalejaiye, P.O (2014). The rise of Casual work in Nigeria: Who Loses, Who benefits? African Research Review: An International Multidisciplinary Journal, Ethiopia.Vol. 8 (1), Serial No. 32, January, 2014:156-176 Kalleberg, Reskin (1999) Changing Employment Relations in the United States. A Paper Presented at the Meetings of the Society for the Advancement of Socio-Economics. Madison, Wisconsin, July 8-11, p. 10 May, R., Campbell, I. and Burgess, J. (2005). The rise and rise of casual work in Australia: Who benefits, who loses? Paper for seminar 20 June, Sydney University (RMIT University and Newcastle University) Okafor, E.E., 2007. Globalizations, Casualization and Capitalist Business Ethics: A Critical Overview of Situation in the Oil and Gas Sector in Nigeria. Journal of Social Science, 15, pp. 169-179 Owoseye, A. and Onwe, C. (2009). Recession: Temporary Employment the Toast for Employer. 234 NEXT, Lagos.
International Journal of Information, Business and Management, Vol. 7, No.4, 2015
ISSN 2076-9202
130
Liberalisation and India’s Middleclass Economy: A Critique
Dr A.Somalingam, M.B.A., L.L.M., M.Phil., Ph.D.,
Business Consultant, E-mail: [email protected]
Dr R.Shanthakumari, M.B.A., M.L.M., L.L.B., Ph.D.,
Assistant Professor, Kanchi Sri Krishna College of Arts & Science, Kanchipuram &
Research Supervisor, Bharathiar University, Coimbatore, India
E-mail: [email protected]
Abstract
India’s New Economic Policy has brought many changes in Indian economy, particularly to
middleclass society. The larger number of India’s middle class and their consumption pattern is
predominant drivers of her economic growth and development. However, the transitional economy with
sudden structural changes put the mass market into jeopardy. The steep and wide gap between richest
and poorest is a unique problem for India to identify middleclass and their growing needs. Immature
consumer markets, feeding to vast population, inordinate income inequality, cross-cultural divergence,
migration etc. are some of the major issues with regard to middleclass economy. This review article tries
to explore some of the hidden facts pertaining to liberalization policy of Government of India and its
impact on middleclass economy. Secondary data were used for the study. Implications of the study were
discussed.
Key words: Globalization, middleclass economy, liberalization, new economic policy,
livelihood and private consumption.
1. Introduction
India’s New Economic Policy by way of liberalization, privatization and globalization (LPG) has
brought many changes in Indian economy. The larger number of India’s middle class and their
consumption pattern is predominant drivers of her economic growth and development. Asia’s young
population with rising productivity, drastically changing culture and frequent labour mobility are
International Journal of Information, Business and Management, Vol. 7, No.4, 2015
ISSN 2076-9202
131
important milestones in the liberalization history. However, the transitional economy with sudden
structural changes put India’s mass market into jeopardy. Immature consumer markets, feeding to vast
population, inordinate income inequality, cross-cultural divergence, migration etc are some of the major
issues with regard to middleclass economy. As India is having second largest population in the globe her
fundamental challenges lies on many fronts; resource management, production of alternate energy,
efficient management of farming and manufacturing industry etc. The India’s distribution process is one
of largest processes in the world. The steep and wide gap between richest and poorest is a unique
problem for India to identify middleclass and their growing needs. The present policy of deregulation of
many public sector organizations ceases job security and employees’ welfare measures considerably. The
sudden flow of FDI (Foreign Direct Investment) in major industries including defense, retail, insurance
and other service sectors will result into larger amount of security concern and price volatility of
consumer market. To gain comparative and competitive advantages, developing nations are continuously
striving for their strategic planning by leveraging their potential business sources. But the globalization
and liberalization process may differ from country to country based on their socio-economic
commitment. This review article tries to explore some of the hidden facts pertaining to liberalization
policy of Government of India and its impact on middleclass economy.
2. The Concept of Middleclass and Their Economy
Many authors defined and fixed parameter for middleclass member of a society, based on the
income and spending capacity. Economically, middleclass is defined in two main ways: in relative terms,
based on the middleclass income range of each country; and in absolute terms, using a fixed band for all
countries. An influential exponent of the first approach was discussed by Lester Thurow (1984) who took
as his reference point the median income in America—where there is an equal number of people above
and below the line—and defined the American middle class as the group with incomes lying between
75% and 125% of the median. Nancy Birdsall (2000) discussed on the same idea to developing countries.
Easterly, William (1999) selected those who were in the three middle quintiles of income (leaving out the
poorest 20% and the richest 20%). This approach has its limitation of different median income, because
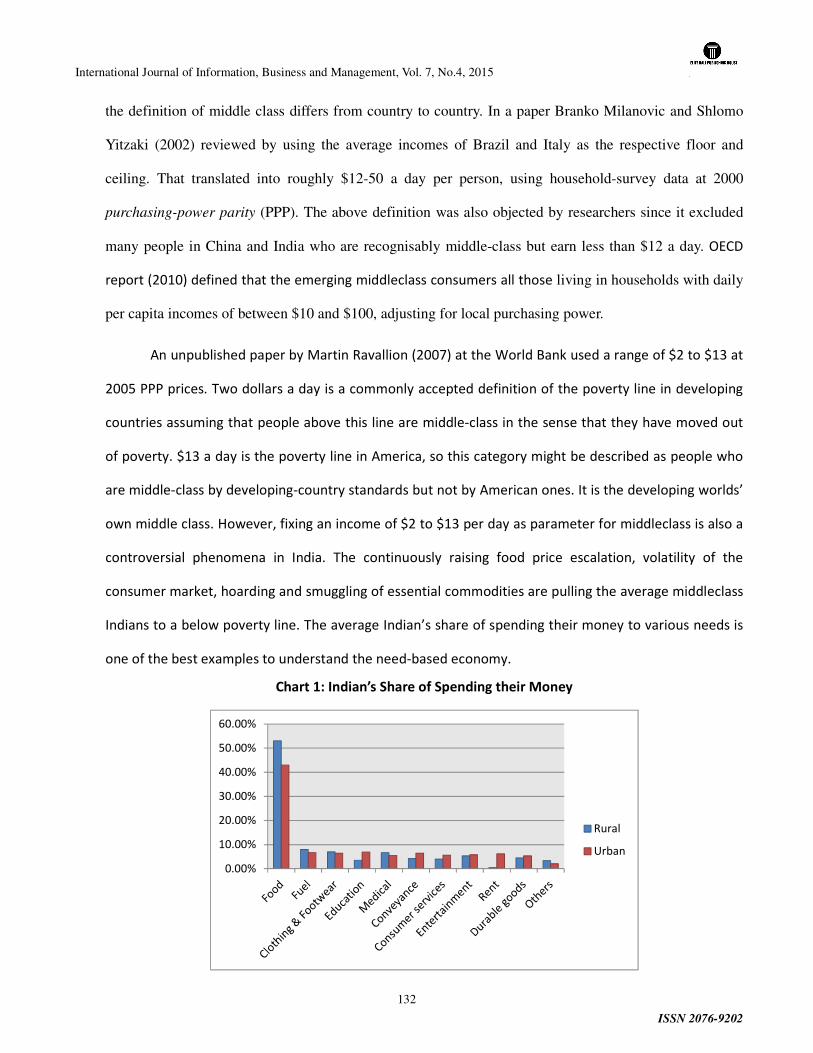
International Journal of Information, Business and Management, Vol. 7, No.4, 2015
ISSN 2076-9202
132
the definition of middle class differs from country to country. In a paper Branko Milanovic and Shlomo
Yitzaki (2002) reviewed by using the average incomes of Brazil and Italy as the respective floor and
ceiling. That translated into roughly $12-50 a day per person, using household-survey data at 2000
purchasing-power parity (PPP). The above definition was also objected by researchers since it excluded
many people in China and India who are recognisably middle-class but earn less than $12 a day. OECD
report (2010) defined that the emerging middleclass consumers all those living in households with daily
per capita incomes of between $10 and $100, adjusting for local purchasing power.
An unpublished paper by Martin Ravallion (2007) at the World Bank used a range of $2 to $13 at
2005 PPP prices. Two dollars a day is a commonly accepted definition of the poverty line in developing
countries assuming that people above this line are middle-class in the sense that they have moved out
of poverty. $13 a day is the poverty line in America, so this category might be described as people who
are middle-class by developing-country standards but not by American ones. It is the developing worlds’
own middle class. However, fixing an income of $2 to $13 per day as parameter for middleclass is also a
controversial phenomena in India. The continuously raising food price escalation, volatility of the
consumer market, hoarding and smuggling of essential commodities are pulling the average middleclass
Indians to a below poverty line. The average Indian’s share of spending their money to various needs is
one of the best examples to understand the need-based economy.
Chart 1: Indian’s Share of Spending their Money
0.00%
10.00%
20.00%
30.00%
40.00%
50.00%
60.00%
Rural
Urban
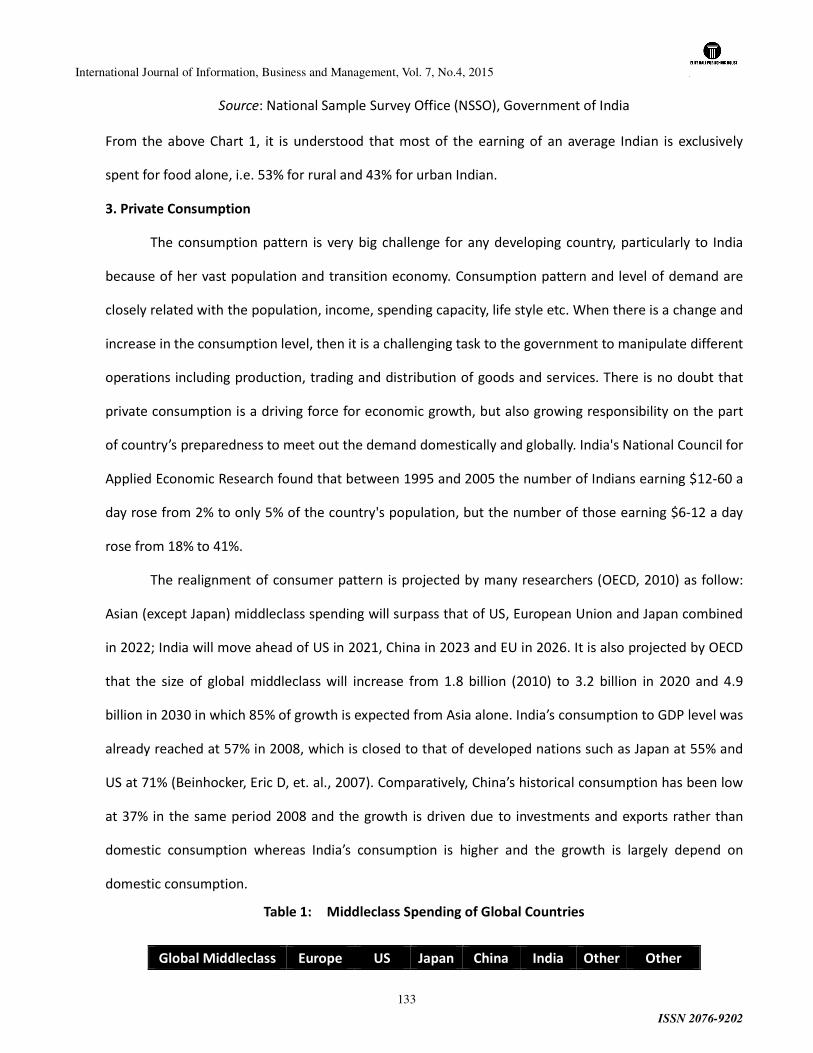
International Journal of Information, Business and Management, Vol. 7, No.4, 2015
ISSN 2076-9202
133
Source: National Sample Survey Office (NSSO), Government of India
From the above Chart 1, it is understood that most of the earning of an average Indian is exclusively
spent for food alone, i.e. 53% for rural and 43% for urban Indian.
3. Private Consumption
The consumption pattern is very big challenge for any developing country, particularly to India
because of her vast population and transition economy. Consumption pattern and level of demand are
closely related with the population, income, spending capacity, life style etc. When there is a change and
increase in the consumption level, then it is a challenging task to the government to manipulate different
operations including production, trading and distribution of goods and services. There is no doubt that
private consumption is a driving force for economic growth, but also growing responsibility on the part
of country’s preparedness to meet out the demand domestically and globally. India's National Council for
Applied Economic Research found that between 1995 and 2005 the number of Indians earning $12-60 a
day rose from 2% to only 5% of the country's population, but the number of those earning $6-12 a day
rose from 18% to 41%.
The realignment of consumer pattern is projected by many researchers (OECD, 2010) as follow:
Asian (except Japan) middleclass spending will surpass that of US, European Union and Japan combined
in 2022; India will move ahead of US in 2021, China in 2023 and EU in 2026. It is also projected by OECD
that the size of global middleclass will increase from 1.8 billion (2010) to 3.2 billion in 2020 and 4.9
billion in 2030 in which 85% of growth is expected from Asia alone. India’s consumption to GDP level was
already reached at 57% in 2008, which is closed to that of developed nations such as Japan at 55% and
US at 71% (Beinhocker, Eric D, et. al., 2007). Comparatively, China’s historical consumption has been low
at 37% in the same period 2008 and the growth is driven due to investments and exports rather than
domestic consumption whereas India’s consumption is higher and the growth is largely depend on
domestic consumption.
Table 1: Middleclass Spending of Global Countries
Global Middleclass Europe US Japan China India Other Other
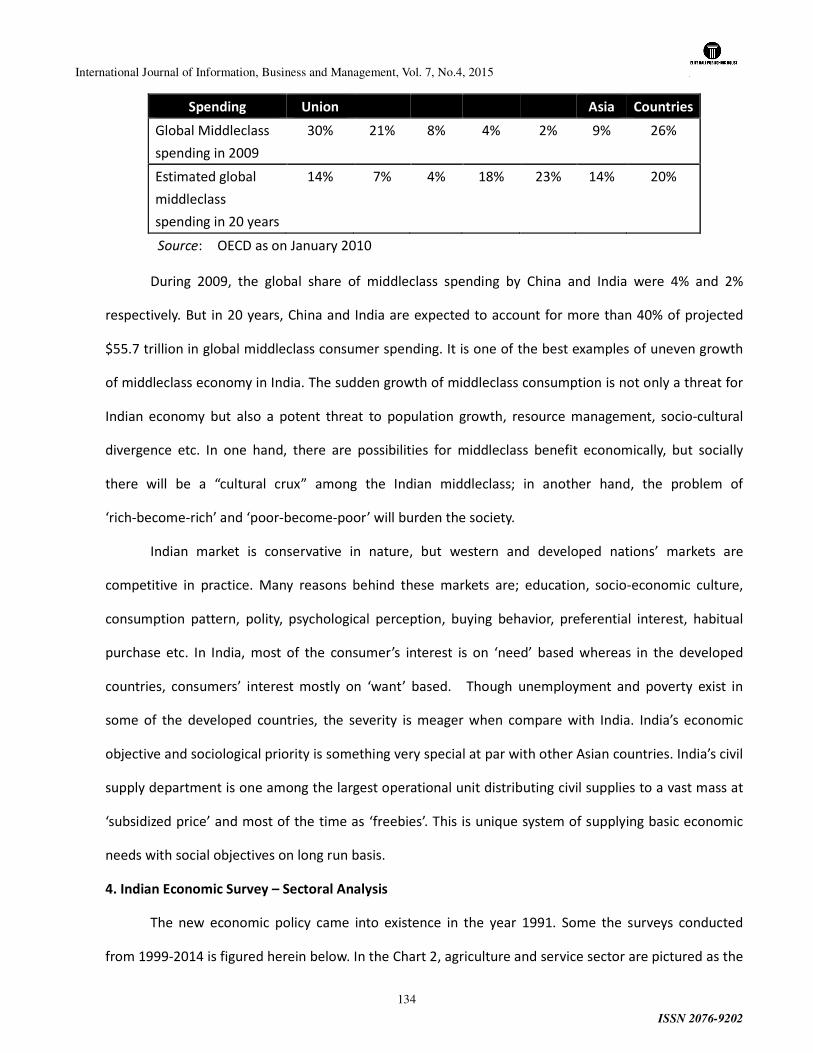
International Journal of Information, Business and Management, Vol. 7, No.4, 2015
ISSN 2076-9202
134
Spending Union Asia Countries
Global Middleclass
spending in 2009
30% 21% 8% 4% 2% 9% 26%
Estimated global
middleclass
spending in 20 years
14% 7% 4% 18% 23% 14% 20%
Source: OECD as on January 2010
During 2009, the global share of middleclass spending by China and India were 4% and 2%
respectively. But in 20 years, China and India are expected to account for more than 40% of projected
$55.7 trillion in global middleclass consumer spending. It is one of the best examples of uneven growth
of middleclass economy in India. The sudden growth of middleclass consumption is not only a threat for
Indian economy but also a potent threat to population growth, resource management, socio-cultural
divergence etc. In one hand, there are possibilities for middleclass benefit economically, but socially
there will be a “cultural crux” among the Indian middleclass; in another hand, the problem of
‘rich-become-rich’ and ‘poor-become-poor’ will burden the society.
Indian market is conservative in nature, but western and developed nations’ markets are
competitive in practice. Many reasons behind these markets are; education, socio-economic culture,
consumption pattern, polity, psychological perception, buying behavior, preferential interest, habitual
purchase etc. In India, most of the consumer’s interest is on ‘need’ based whereas in the developed
countries, consumers’ interest mostly on ‘want’ based. Though unemployment and poverty exist in
some of the developed countries, the severity is meager when compare with India. India’s economic
objective and sociological priority is something very special at par with other Asian countries. India’s civil
supply department is one among the largest operational unit distributing civil supplies to a vast mass at
‘subsidized price’ and most of the time as ‘freebies’. This is unique system of supplying basic economic
needs with social objectives on long run basis.
4. Indian Economic Survey – Sectoral Analysis
The new economic policy came into existence in the year 1991. Some the surveys conducted
from 1999-2014 is figured herein below. In the Chart 2, agriculture and service sector are pictured as the
International Journal of Information, Business and Management, Vol. 7, No.4, 2015
ISSN 2076-9202
135
shares of India’s GDP.
Chart 2: Indian Economic Survey-Sectoral Share of GDP
Source: Economic times, July 13, 2014, page 7
From the above Chart 2, it is found that the share of service sector to GDP is growing while
agricultural share is shrinking. With regard to employment, the share of two major sectors, namely
agriculture and service sector to total employment is figured herein below:
Chart 3: Share of Major Sectors in Total Employment (%)
Source: Census, 2001 & Census 2011, Govt. of India Statistics, www.censusindia.gov.in
Though India’s agricultural sector is a largest employer, the number of farmers is shrinking. For
the first time ever, India’s cultivators is shrank from 127 million (census 2001) to 118 million (census
0
10
20
30
40
50
60
Agriculture & Allied
Sector
Service Sector
0
10
20
30
40
50
60
1999-2000 2004-05 2011-12
Agriculture & Allied
Sector
Service Sector
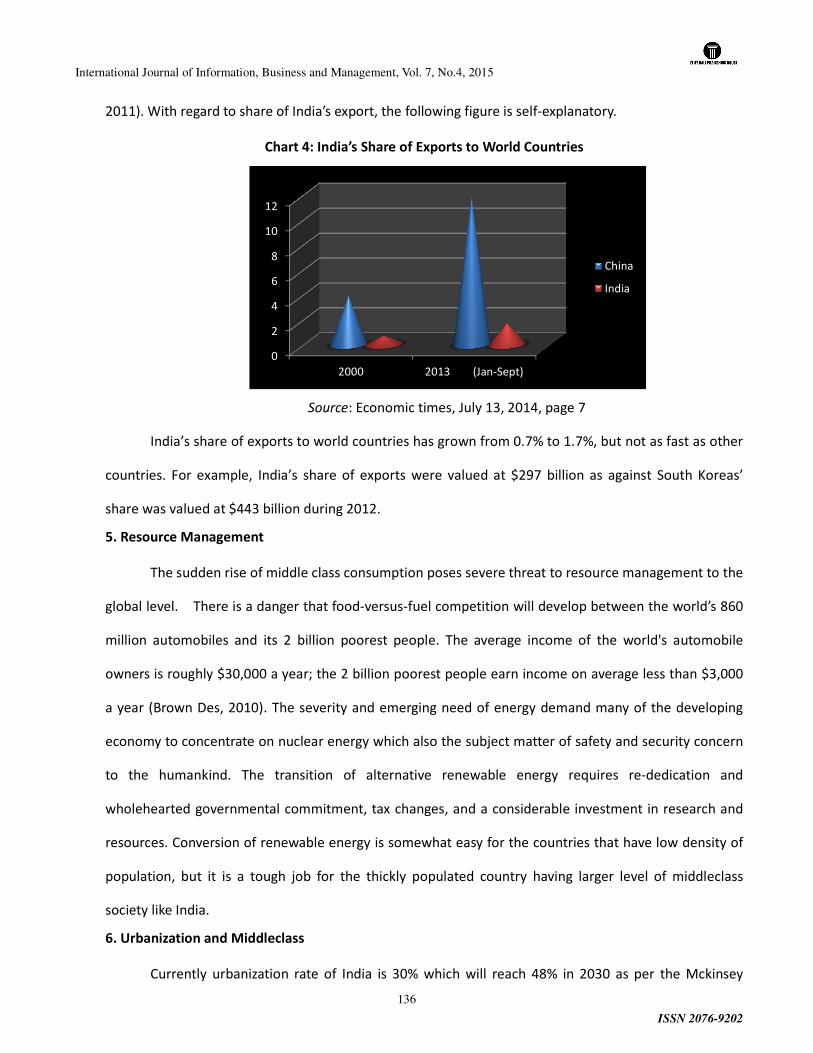
International Journal of Information, Business and Management, Vol. 7, No.4, 2015
ISSN 2076-9202
136
2011). With regard to share of India’s export, the following figure is self-explanatory.
Chart 4: India’s Share of Exports to World Countries
Source: Economic times, July 13, 2014, page 7
India’s share of exports to world countries has grown from 0.7% to 1.7%, but not as fast as other
countries. For example, India’s share of exports were valued at $297 billion as against South Koreas’
share was valued at $443 billion during 2012.
5. Resource Management
The sudden rise of middle class consumption poses severe threat to resource management to the
global level. There is a danger that food-versus-fuel competition will develop between the world’s 860
million automobiles and its 2 billion poorest people. The average income of the world's automobile
owners is roughly $30,000 a year; the 2 billion poorest people earn income on average less than $3,000
a year (Brown Des, 2010). The severity and emerging need of energy demand many of the developing
economy to concentrate on nuclear energy which also the subject matter of safety and security concern
to the humankind. The transition of alternative renewable energy requires re-dedication and
wholehearted governmental commitment, tax changes, and a considerable investment in research and
resources. Conversion of renewable energy is somewhat easy for the countries that have low density of
population, but it is a tough job for the thickly populated country having larger level of middleclass
society like India.
6. Urbanization and Middleclass
Currently urbanization rate of India is 30% which will reach 48% in 2030 as per the Mckinsey
0
2
4
6
8
10
12
2000 2013 (Jan-Sept)
China
India
International Journal of Information, Business and Management, Vol. 7, No.4, 2015
ISSN 2076-9202
137
Report (2010). Even in the urbanization, India has proved her inability by allowing greater amount of
inequality. For example, the state of Tamil Nadu and Gujarat are achieving an urbanization rate of 53%
and 44% respectively; whereas Orissa, Himachal Pradesh and Bihar are having lowest rate of
urbanization, such as, 18%, 12% and 9% respectively. There is no doubt that globalization has made
some employment opportunities to the developing countries such as China, India, Brazil and other
countries, particularly in the Information Technology industry. But this meager employment opportunity
will not attain sustainability to the whole of Indian population since India’s economy is immensely
depending on agriculture and rural industries. The growth of India’s population is linked to excessive
urbanization, infrastructure failures and unemployment. The slum population in India is 23.8% of total
population and the percentage of sewage treated is just 30% out basic service standard of 100% (Census
2001, Govt. of India). Nearly 90 per cent of the total workforce in India is from the unorganized sector.
Most of them retired without any financial security like pension or other post-retirement benefits (Siva
Raju, 2005) and majority are compelled to continue in some occupation to maintain their families. Some
of the studies conducted in major cities (Delhi: Jagannathan & Palvia, 1997; Udaipur: Sati, 1988; Siva
Raju, 2000) confirmed that a considerable percentage of retirees take up re-employment mainly due to
financial constraints.
With regard to income inequality, almost non-overlapping distributions of India and the US: less
than 5% of people in India richer than the poorest ventile in the US. But this is not true for Brazil, China
and Russia: about half of the population of Brazil better off than the very poorest ventile in the US; for
Russia, it is 3/4, for China 1/5 (Branko Milanovic, 2011). He further argued three implications of high
international and global inequality, which are,
a) no catch up of poor countries
b) no global equality of opportunity
c) need for impediments to migration
7. The Quest of Mixed Economy
India’s much avowed objective as per the constitution is socialistic pattern of society with ‘mixed
International Journal of Information, Business and Management, Vol. 7, No.4, 2015
ISSN 2076-9202
138
economy’. The doctrine of mixed economy was enforced in India with a view to proportionate the public
and private participation. The concept of policy of mixed economy is slowly being wiped out by the
liberalization-policy makers. Globalization is a process of shifting the public authority to private. This is a
policy allows individuals and private organizations to grow extensively through competition and
competition alone. As reviewed by Edwards (1999), changes in the distribution of power and authority
are characteristic of the processes we call globalization. Globalization of the world economy is driving
us toward a borderless society; it will not reduce the differences among peoples in various regions
overnight. Globalization is a long term process which requires structural changes. Globalization also
motivates individuals for a larger amount of cross-cultural divergence and continuous migration. It is
middleclass society who most of the occasions aspiring for power and prefer to frequent migration
across borders. Many researchers criticize and raising objection that is there any need for borderless
society and cross-cultural diversity for a peaceful and harmonious society. Some other facts also to be
re-examined that the increasingly interconnected world cannot be a safe place if a large portion of its
population still suffers from grinding poverty, disease, illiteracy, lack of education, unemployment and
other barriers to survival. According to Mathews, Jessica (1997), this is not just a “power shift” from
public to private interests, but a deeper and more complex process in which large numbers of people see
their position systematically eroded by economic, social and political forces which work to the benefit of
a small proportion of the world’s population.
Many developing countries including India have trimmed their public sector with the belief to
achieve fiscally sustainable growth and remain competitive at an international level. The globalization
has caused the most distributional stress for what we commonly refer to as the “middle class”, the large
group of households that are neither wealthy nor poor, but that form the backbone of both the market
economy and of democracy in most advanced societies (Easterly, William et al., 1999). The policy of
liberalization, privatization and globalization continue to increase and the government participation is
decreased. The new economic policy is also encouraging larger participation of FDI (Foreign Direct
Investment) in almost all the industries including defense, insurance, retail sector etc. The liberalization
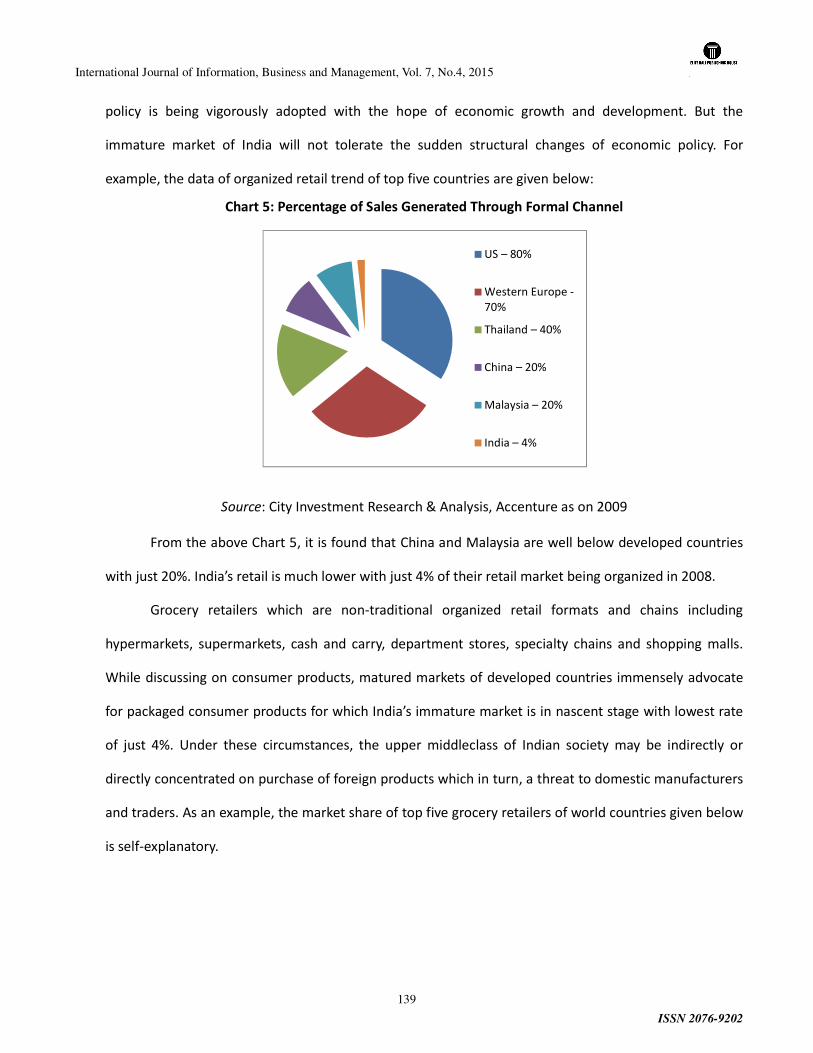
International Journal of Information, Business and Management, Vol. 7, No.4, 2015
ISSN 2076-9202
139
policy is being vigorously adopted with the hope of economic growth and development. But the
immature market of India will not tolerate the sudden structural changes of economic policy. For
example, the data of organized retail trend of top five countries are given below:
Chart 5: Percentage of Sales Generated Through Formal Channel
Source: City Investment Research & Analysis, Accenture as on 2009
From the above Chart 5, it is found that China and Malaysia are well below developed countries
with just 20%. India’s retail is much lower with just 4% of their retail market being organized in 2008.
Grocery retailers which are non-traditional organized retail formats and chains including
hypermarkets, supermarkets, cash and carry, department stores, specialty chains and shopping malls.
While discussing on consumer products, matured markets of developed countries immensely advocate
for packaged consumer products for which India’s immature market is in nascent stage with lowest rate
of just 4%. Under these circumstances, the upper middleclass of Indian society may be indirectly or
directly concentrated on purchase of foreign products which in turn, a threat to domestic manufacturers
and traders. As an example, the market share of top five grocery retailers of world countries given below
is self-explanatory.
US – 80%
Western Europe -
70%
Thailand – 40%
China – 20%
Malaysia – 20%
India – 4%
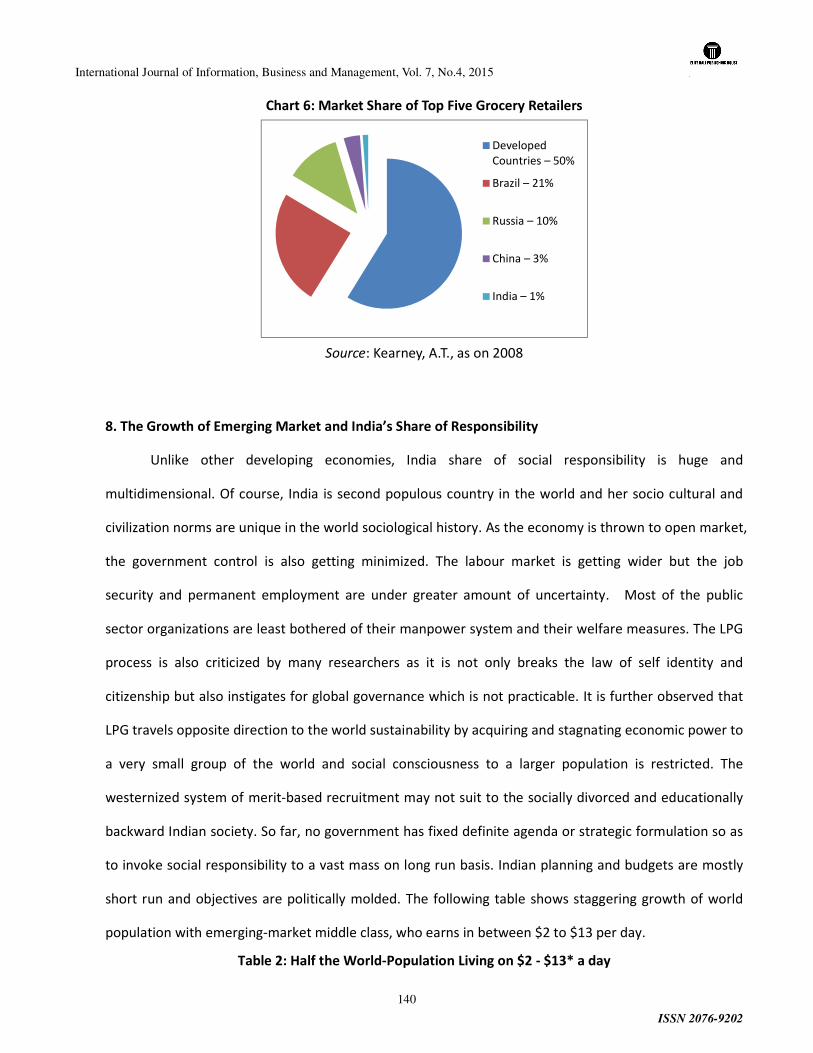
International Journal of Information, Business and Management, Vol. 7, No.4, 2015
ISSN 2076-9202
140
Chart 6: Market Share of Top Five Grocery Retailers
Source: Kearney, A.T., as on 2008
8. The Growth of Emerging Market and India’s Share of Responsibility
Unlike other developing economies, India share of social responsibility is huge and
multidimensional. Of course, India is second populous country in the world and her socio cultural and
civilization norms are unique in the world sociological history. As the economy is thrown to open market,
the government control is also getting minimized. The labour market is getting wider but the job
security and permanent employment are under greater amount of uncertainty. Most of the public
sector organizations are least bothered of their manpower system and their welfare measures. The LPG
process is also criticized by many researchers as it is not only breaks the law of self identity and
citizenship but also instigates for global governance which is not practicable. It is further observed that
LPG travels opposite direction to the world sustainability by acquiring and stagnating economic power to
a very small group of the world and social consciousness to a larger population is restricted. The
westernized system of merit-based recruitment may not suit to the socially divorced and educationally
backward Indian society. So far, no government has fixed definite agenda or strategic formulation so as
to invoke social responsibility to a vast mass on long run basis. Indian planning and budgets are mostly
short run and objectives are politically molded. The following table shows staggering growth of world
population with emerging-market middle class, who earns in between $2 to $13 per day.
Table 2: Half the World-Population Living on $2 - $13* a day
Developed
Countries – 50%
Brazil – 21%
Russia – 10%
China – 3%
India – 1%
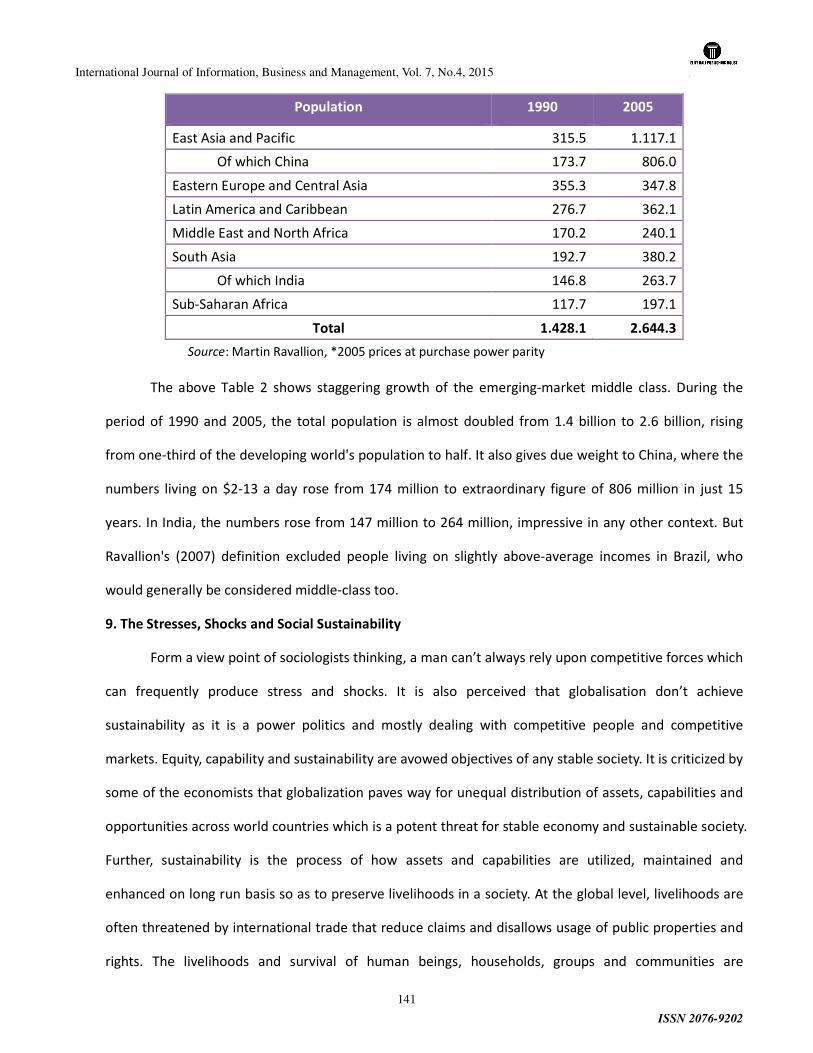
International Journal of Information, Business and Management, Vol. 7, No.4, 2015
ISSN 2076-9202
141
Population 1990 2005
East Asia and Pacific 315.5 1.117.1
Of which China 173.7 806.0
Eastern Europe and Central Asia 355.3 347.8
Latin America and Caribbean 276.7 362.1
Middle East and North Africa 170.2 240.1
South Asia 192.7 380.2
Of which India 146.8 263.7
Sub-Saharan Africa 117.7 197.1
Total 1.428.1 2.644.3
Source: Martin Ravallion, *2005 prices at purchase power parity
The above Table 2 shows staggering growth of the emerging-market middle class. During the
period of 1990 and 2005, the total population is almost doubled from 1.4 billion to 2.6 billion, rising
from one-third of the developing world's population to half. It also gives due weight to China, where the
numbers living on $2-13 a day rose from 174 million to extraordinary figure of 806 million in just 15
years. In India, the numbers rose from 147 million to 264 million, impressive in any other context. But
Ravallion's (2007) definition excluded people living on slightly above-average incomes in Brazil, who
would generally be considered middle-class too.
9. The Stresses, Shocks and Social Sustainability
Form a view point of sociologists thinking, a man can’t always rely upon competitive forces which
can frequently produce stress and shocks. It is also perceived that globalisation don’t achieve
sustainability as it is a power politics and mostly dealing with competitive people and competitive
markets. Equity, capability and sustainability are avowed objectives of any stable society. It is criticized by
some of the economists that globalization paves way for unequal distribution of assets, capabilities and
opportunities across world countries which is a potent threat for stable economy and sustainable society.
Further, sustainability is the process of how assets and capabilities are utilized, maintained and
enhanced on long run basis so as to preserve livelihoods in a society. At the global level, livelihoods are
often threatened by international trade that reduce claims and disallows usage of public properties and
rights. The livelihoods and survival of human beings, households, groups and communities are
International Journal of Information, Business and Management, Vol. 7, No.4, 2015
ISSN 2076-9202
142
vulnerable to stresses and shocks. As Indian society is comprised of larger portion of middleclass
household, it is often subjected to stress, anxiety and shocks. Global recession and its meltdown often
directly and indirectly affect the middleclass household, who knows the causes and consequences, but
incapable to avoid the same. For example, the sudden increase of US dollar value from INR 45 to INR 62,
the sudden fall of IT employment and compensation pattern, US claim of patent right on Indian
traditional products etc. Stressors are pressures which are typically continuous and cumulative such as
seasonal shortages, rising populations or declining resources, while shocks are impacts which are
typically sudden, unpredictable and traumatic (Conwey, and Barbier, 1990). The causes of stresses and
shocks are also interpreted with declining labour work available, declining real wages, declining common
property resources, population pressure, declining return on labour etc. which build up gradually and
affect the households (Evans, 1989). Though many number issues rising in the process of globalisation,
social sustainability is one of the potent issues of middleclass economy prevailing in India.
10. Conclusion
The above review explores many numbers of suggestions to India’s policy formulation.
Conclusively, the sudden implementation of new economic policy of government of India is more like
uneven and immature in its policy formulation and implementation. With reference to middleclass
economy, most of the needs of middleclass society are creative and imaginary needs and not real needs.
Most of the advertisements propagated through mass media and internet are exclusively on profit
motive, obscuring the real needs of the society. The sudden shift of middleclass society poses severe
scarcity in the resources of the nation and its management.
Economic power is expressed in the distribution of productive assets and the workings of
markets and firms; social power is expressed in the status and position awarded to different social
groups; and political power defines each person’s voice in decision-making in both the private sphere
and public affairs. These systems of power combine to produce a “social order”, and transforming this
social order is the task of social change. India’s middleclass is a major social group and deciding factor of
economic power. Until the socio economic power is tuned systematically and strategically on the long
International Journal of Information, Business and Management, Vol. 7, No.4, 2015
ISSN 2076-9202
143
term policies, India’s socio-economic objectives will not gain her sustainable growth. With reference to
India’s intervention to globalization, globalization process will have possibilities to gain comparative and
competitive advantages to the society, provided her socio-cultural and political objectives are taken care
with long term perspectives. Otherwise, the LPG process will result into great confusion and economic
crisis to the vast population by allowing ‘rich to become rich’ and ‘poor to become poor’.
References
Beinhocker , Eric D, Diana Farrell & Adil S Zainulbhai (2007), “Tracking the growth of India’s middleclass”, The McKinsey Quarterly, No.3, p.51-61.
Birdsall, Nancy, (2000), “Why Inequality Matters: The Developing and Transition Economies”, Paper prepared for Conference on The World Economy in the 21st Century: Challenges and Opportunities (February 18-19), Mount Holyoke College, Massachusetts.
Branko Milanovic (Autumn 2011), “Global income inequality: the past two centuries and implications for 21st centuries”, World Bank.
Brown Des, The UK’s Secretary of State for Defense, Speech delivered in Disarmament Conference, Genewa, 2010.
Census 2001; Govt of India, & McKinsey Global Institute analysis.
Conwey, and Barbier, E B, (1990), “After the green revolution: sustainable agriculture for development, earthscan”, London.
Easterly, William and Hairong Yu, (1999), Global Development Network Growth Database, http:// www.worldbank.org/html/prdmg/grthweb/GDNdata.htm, November.
Edward, M (1999), “Future Positive: International Co-operation in the 21st Century”, London: Earthscan.
Edward M.Kerschner & Naeema Huq (2011), “Asian Affluence: The Emerging 21st Century Middleclass”. Working Paper published by Morgan Stanly Smith Barney, June 2011.
Evans, T, 1989, The impact of permanent disability on rural households; river blindness in Guinea, IDS Bulletin No 20-2, p.41-48.
Jagannadham, V. & Palvia, C (1997), “Problems of Pensioners – Social Economic Policy and Administration”. Working Paper, Indian Institute of Public Administration, New Delhi.
Kearney, A.T. (2008), Global Retail Development Index.
Kharas, Homi (2010), “The Emerging Middleclass in Developing Countries”. Working Paper, Organization for Economic Co-operation and Development (OECD) Development Centre.
Mathews, J (1997), “Power Shift”, Foreign Affairs (Jan/Feb).
International Journal of Information, Business and Management, Vol. 7, No.4, 2015
ISSN 2076-9202
144
Ravallion Martin, Shaohua Chen and Prem Sangraula (2007), “New evidence on the urbanization of global poverty”. World Bank Policy Research Working Paper No. 4199, World Bank.
Sati, P.N. (1988), “Retired And Ageing People – A Study of Their Problems”. Mittal Publications, Delhi.
Siva Raju, S (2000), “Ageing in India: An Overview”. In Murli Desai and Siva Raju (Eds) “Gerontological Social Work in India: Some Issues and Perspectives”. B.R. Publishing Corporation, New Delhi.
Siva Raju, S (2005), “Employment and Income Security for the Elderly: A Study in Mumbai”. Paper Presented at International Conference on Employment and Income Security in India, Institute of Human Development, New Delhi, April 6-8.
Thurow, Lester C, (1984), "The Disappearance of the Middle Class." The New York Times, February 5.
International Journal of Information, Business and Management, Vol. 7, No.4, 2015
ISSN 2076-9202
145
Assessing the effect of demographic factors on conflict situations in Ghana
government hospitals
Dr. Gabriel Dwomoh1*, Kofi Kwarteng2, Evelyn Frempong3, Regina Anima Frempong4
1Institute of Entrepreneurship and Enterprise, Kumasi Polytechnic, Kumasi, Ghana
2 School of Business, Takoradi Polytechnic, Takoradi, Ghana
3Department of General Management, Christian Service University College, Kumasi, Ghana
4Administration Department, Komfo Anokye Teaching Hospital, Kumasi, Ghana
*Corresponding author (Email: [email protected])
Abstract
The study seeks to examine the influence of demographic factors on conflict in Ghana government
hospitals. It adopted the quantitative approach which involves the use of questionnaires and interviews
coupled with statistical analysis to assess the effect of age, educational level, gender and number of years
on the job of employees and conflict occurrences at the workplace. The use of purposive and
convenience sampling techniques were adopted to get a sample of 123 employees and 10 heads or deputy
heads of human resource of the ten regional hospitals in Ghana. The study found out that there is
association between these demographic factors and conflict occurrences at these hospitals with 95%
confidence level. It therefore recommends to management of these hospitals and other policy makers
to pay much attention to these factors when formulating policies so that they meet the expectation of
different categories of employees at the workplace.
Keywords: Conflict, demographic factors, hospitals, Ghana, government
1.0 Introduction
Workplace conflict is a universal organizational phenomenon because it is inevitable aspect of modern
life. For any organization to perform well to achieve its objectives, different teams and individuals of
different age, sex, gender and marital status must work together and create relationships across
organizational lines and groups. In the flow of work and information, individuals, groups and departments
depend on each other for information sharing, assistance or coordinated action. For example, in the
hospital environment, doctors will depend on nurses, lab technicians, x-ray attendants and pharmacists to
collate the needed and relevant information to assist their patients in the recovery process. Without the
help of the personnel mentioned above, the work of the medical doctor will be very difficult especially if
there are disagreements among them.
In the same way, the pharmacist will depend on the medical doctor in the area of prescriptions. Such
interdependence may either foster cooperation or conflict. The hospital environment is a mixture of
different categories of people with different background in terms of age, gender, education, religion,
International Journal of Information, Business and Management, Vol. 7, No.4, 2015
ISSN 2076-9202
146
beliefs and tribe and as mentioned by Collier (2006) such differences are potential causes of conflict in
organizations. Again, the hospital is the only working environment where its customers patronized its
service when they have health related problems and it can range from a simple disease to a complicated
health condition hence makes the hospital a conflict prone workplace.
As people with different backgrounds, age, gender, sex, values, needs and personalities interact with each
other, conflicts are bound to develop. Moreover where one party does not have a sound mind then the
probability that the person will not reason up with the other party is high and hence disagreement is likely
to occur. Taking the second largest government hospital (Komfo Anokye Teaching Hospital) as an
example, according to the first half year report of the Ministry of Health for 2012, a total of 150,430
patients visited the Outpatient Department (OPD) whilst 199,176 also visited the OPD of the teaching
hospital in 2011. These patients come to the OPD with varying degrees of health related disease and
complications. Added to this, the government hospitals is one of the public institutions that absorbs a
large number of employees in the public sector and these employees apart from the fact that they are
different in terms of their values and needs are also demographically different in terms of sex, education
level, income level, marital status, occupation (doctor or nurse) and religion.
As already indicated, it appears these differences in demographic factors together with the fact that the
hospital is the only institution whose services are patronized when people have health related problems
makes the hospital environment a place where conflict can easily occur. In support of this, the
literature from American College of Physician Executives’ (2009) indicated that 98% of those surveyed
had witnessed an incident of disruptive behavior between nurses and physicians.
In another study by Anderson and D’Antonio (2005), about 50% of physician’s time is spent on conflict.
This according to the writers stem from the fact that the hospital is among the few organizations that
normally does not segment or target specific customers. Demographically, all people of different age,
sex, marital status, religion and occupation are expected to patronize in the services of these hospitals.
Now the question one may ask is that, looking at the fact that these demographic factors are not
homogenous and as such there are differences in age, gender, religion and marital status, is it prudent for
health professionals to spend most of their time taking into consideration differences in these factors
when dealing with patients and their fellow colleagues since their thinking, reasoning, perception, values
and needs are not the same? In answering such a question, Studdert et al. (2010) are of the view that the
uniqueness of the hospital environment demands that health professionals are tolerant in all situations and
in the worse case when conflict occurs as a result of differences in reasoning, perception and thinking,
they needed to be dealt with in a swift manner in order to avoid loss of human lives. Whilst we may agree
with the writers, it is also true that one need to really examine what brings these differences in reasoning,
perception and thinking and its effect on conflict occurrences.
In light of this, the researchers decided to go into this research to look at the effect of these demographic
International Journal of Information, Business and Management, Vol. 7, No.4, 2015
ISSN 2076-9202
147
factors on conflict occurrences in government hospitals in Ghana since though many research had been
done on conflict and its occurrences, there is little on isolating these demographic factors and their
consequences on conflict occurrence. Second in terms of Ghanaian context, literature available to the
researchers indicates that proper attention has not been given in terms of research on conflict situations in
government hospitals. It is the believe of the researchers that going into this research by focusing on
this area will help bridge the gap in terms of knowing the effect of demographic factors on conflict and its
occurrence in Ghana government hospitals.
2.0 Literature Review
Over the years the term conflict has been branded to many people as an awful conduct of parties who
engaged in an argument which is normally generated from differences in ideas, beliefs and values. It was
tagged as a disturbing force (Walton, 1969), hence most scholars advocated for its eradication. By the
year 1980, researchers such as Tjosvold (1991), began to rethink about the constructive and solidarity
consequence of conflict. Thus, though conflict act as a negative force operating against successful
completion of group common goals, it may also lead to positive effects depending on the nature of the
conflict (Obasan, 2011).
From the literature of Henry (2009), organizational conflict is regarded as the friction that occurs when
the goals, interests or values of different individuals or groups are incompatible with those of other
individuals or groups in an organization and where they may block or frustrate each other in an attempt to
achieve their objectives. Other writers such as Meek, Heit and Page (2005), Hart (2000) and Reece and
Brandt (1996) adding their voices to what is meant by conflict share a similar view that it is a state of
opposition, disagreement or incompatibility between two or more people or groups of people which is
sometimes characterized by physical violence or assault. Their views on conflict actually points to the
fact that it is not always that parties tend to be physical or violent towards each other that one can actually
says there is conflict. In some instances as can be found in the comments by Lambert and Myers (1999)
and Hocker and Wilmot (1995), conflict can be latent and the other party may not even be aware that
there is a conflict. In the case of health care environment, a patient may be in conflict with a physician
without the physician been aware that the patient is in conflict with him since it is believed that conflict is
cognitive rather than behavioral state.
Conflict is inevitable hence needs a strategic approach in terms of its resolution so that the end result can
be functional rather than dysfunctional. Whilst it tends to be inevitable, from the literature of Rahim
(2001), departments, units and sections competing with limited resources is one of the most common
sources of conflict in organizations. Looking at the literature given by the writer, the researchers of this
study based on their own observation see it as one of the major causes of conflict in Ghana government
hospitals where patient frustrations due to congestions and pressure on health equipment generate
frequent quarrels and disagreements among them and staff based on the time taken for health care
professionals to deliver a service. To Tseveendorj (2008), the causes of conflict are not only limited to
scarce resources but people’s perception and culture also breeds conflict. Culture and perception is very
International Journal of Information, Business and Management, Vol. 7, No.4, 2015
ISSN 2076-9202
148
instrumental human make up that is very hard to transform. Instances where team mates working on the
same task have diverse cultures and values, their perception on how to achieve the task vary because each
one’s decision will be influenced by his values or beliefs. From the literature of Henkin and Cistone
(2000), demographic factors such as religion, educational level, gender and age have high influence on
perception and as such makes people think differently. Looking at the writers assertion on the fact that
age, religion, educational level and gender play important role in influencing perception, one can deduce
from the comment made by Tseveendorj (2008) that the root cause of conflict as a result of differences in
reasoning, believe and thinking is not perception but differences in demographic factors (age, religion,
gender and educational level) since the latter has high influence on the former.
As organization comprises of people from different backgrounds and conflicts are bound to occur, it is
necessary for managers and supervisors to acquire skills that will enable them manage conflicts when
they occur since according to Watson and Hoffman (1996) supported by Dana (2001), managers most of
the time spend about 42% of their time dealing with conflict related matters. Reynolds and Kalish
(2002) share a similar view with the writers since to them; managers nowadays spend at least 25% of
their time resolving workplace conflicts. Looking at the comments regarding the percentage of
manager’s time devoted to resolving workplace conflicts, it presupposes that organizations need to pay
much attention to how they can benefit from conflict situation when they occur by ensuring that it tends
out to be functional one. In ensuring that the outcome of conflict is functional, it is necessary for
managers to also ensure that they adopt the right approach in terms of its management. In the view of
Gatlin et al (2012), an early intervention by investigating disputes and complaints when they are raised,
identifying root causes of problems in addition to symptoms, and sharing this information to create
change can facilitate a smooth resolution of the conflict. In talking about the various approaches to
handling conflicts, Johnson and Johnson (2000) and Bercovitch and Kadayifci-Orellana (2009)
recommends mediation as the best approach to be adopted by managers in resolving conflicts. Despite
their recommendation, they were quick to add that if the mediator is inexperienced, the end result of the
conflict will not be beneficial. Based on our literature, one can set the following hypotheses to check is
there is any association between conflict occurrence and demographic factors:
Ho: Conflict occurrence is independent on differences in age at the workplace
H1: Conflict occurrence is associated with differences in age at the workplace at 5% level of
significance.
Ho: Conflict occurrence is independent on differences in gender at the workplace
H1: Conflict occurrence is associated with differences in gender at the workplace at 5% level of
significance.
Ho: Conflict occurrence is independent on differences in educational level at the workplace
H1: Conflict occurrence is associated with differences in educational level at the workplace at 5% level
of significance.
Ho: Conflict occurrence is independent on differences in employees’ number of years at the workplace
H1: Conflict occurrence is associated with differences in employees’ number of years at the workplace
at 5% level of significance.
International Journal of Information, Business and Management, Vol. 7, No.4, 2015
ISSN 2076-9202
149
3.0 Methodology
The study seeks to assess the effect of demographic factors on conflict situations in Ghana government
hospitals. In achieving this objective, the study adopted a quantitative approach and the target
population consisted of all the government hospitals in Ghana. Since dealing with all the government
hospitals was difficult because of resource constraint, the researchers adopted a non probability sampling
which convenience sampling was used to sample the government hospitals to be used for the study. In
doing this, the ten regional government hospitals namely Komfo Anokye Teaching Hosptial (Kumasi -
Ashanti), Effia Nkwanta Regional Hospital (Takoradi - Western), Regional Hospital (Koforidua - Eastern),
Central Regional Hospital (Cape Coast - Central), Tamale Regional Hospital (Northern), Regional
Hospital (Sunyani – Brong Ahafo), Regional Hospital (Bolgatanga – Upper East), Regional Hospital (Wa-
Upper West), Regional Hospital (Ho –Volta) and Ridge Regional Hospital (Ridge – Greater Accra) were
conveniently selected from the rest of government hospitals in Ghana. The choice of this non
probability sampling was based on the researchers’ easy access to information from those hospitals.
In getting respondents for the study, the researchers used quota sampling were 10 health workers were
selected from each of the regional hospitals except Komfo Anokye Teaching Hospital, Kumasi where 13
workers were selected because of proximity and availability of workers to participate in the study. In all
123 workers excluding heads and deputy heads of human resource section of the various hospitals were
sampled for the study and they comprise of 20 doctors, 20 nurses and midwives, 21 security, 20
pharmacists, 20 lab technicians and 22 administration workers. For the researchers to get this sample,
both purposive and convenience sampling was adopted. The researchers adopted purposive sampling to
include heads and deputy heads of human resources whilst convenience sampling was adopted to get
doctors, nurses and midwives, security, pharmacists, lab technicians and administration workers in the
study. The choice of purposive sampling was to ensure that heads and deputy heads of human resource
of the various hospitals were included in the study since they deal with issues pertaining to conflict
situations in their workplaces. Again, in almost all organizational setup, conflict and its management is
part of the job description of human resource professionals and as such including them in the study helped
the researchers to obtain vital information for the study. There were 10 heads or deputy heads, 1 from
each of the regional government hospitals that was selected for the study.
Looking at convenience sampling, its choice to get the rest of the workers in the study was based on those
who were willing and ready to participate in the study.
In getting data for the study, the researchers used questionnaires and interview. The questionnaires were
directed to the sampled workers (doctors, nurses and midwives, lab technicians, pharmacists, security and
administration) whilst interview was for heads or deputy heads of the various government hospitals. In a
situation where the head of human resource was not available, the deputy head was interviewed to solicit
the needed information.
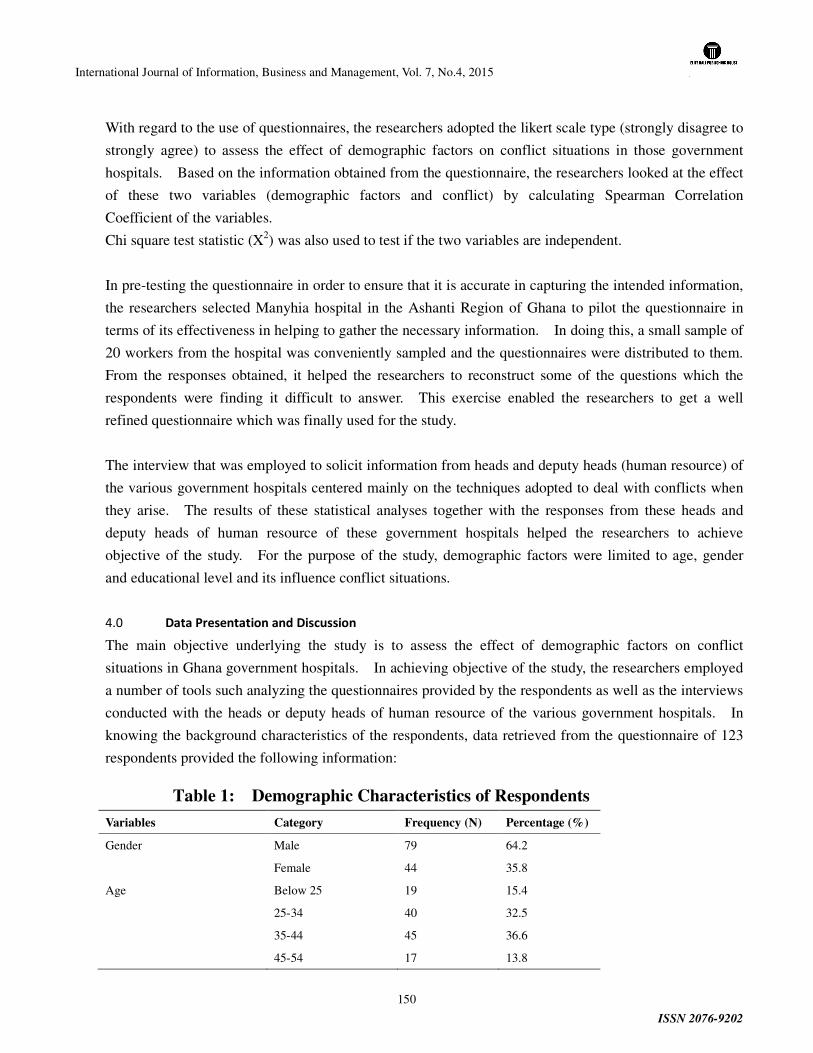
International Journal of Information, Business and Management, Vol. 7, No.4, 2015
ISSN 2076-9202
150
With regard to the use of questionnaires, the researchers adopted the likert scale type (strongly disagree to
strongly agree) to assess the effect of demographic factors on conflict situations in those government
hospitals. Based on the information obtained from the questionnaire, the researchers looked at the effect
of these two variables (demographic factors and conflict) by calculating Spearman Correlation
Coefficient of the variables.
Chi square test statistic (X2) was also used to test if the two variables are independent.
In pre-testing the questionnaire in order to ensure that it is accurate in capturing the intended information,
the researchers selected Manyhia hospital in the Ashanti Region of Ghana to pilot the questionnaire in
terms of its effectiveness in helping to gather the necessary information. In doing this, a small sample of
20 workers from the hospital was conveniently sampled and the questionnaires were distributed to them.
From the responses obtained, it helped the researchers to reconstruct some of the questions which the
respondents were finding it difficult to answer. This exercise enabled the researchers to get a well
refined questionnaire which was finally used for the study.
The interview that was employed to solicit information from heads and deputy heads (human resource) of
the various government hospitals centered mainly on the techniques adopted to deal with conflicts when
they arise. The results of these statistical analyses together with the responses from these heads and
deputy heads of human resource of these government hospitals helped the researchers to achieve
objective of the study. For the purpose of the study, demographic factors were limited to age, gender
and educational level and its influence conflict situations.
4.0 Data Presentation and Discussion
The main objective underlying the study is to assess the effect of demographic factors on conflict
situations in Ghana government hospitals. In achieving objective of the study, the researchers employed
a number of tools such analyzing the questionnaires provided by the respondents as well as the interviews
conducted with the heads or deputy heads of human resource of the various government hospitals. In
knowing the background characteristics of the respondents, data retrieved from the questionnaire of 123
respondents provided the following information:
Table 1: Demographic Characteristics of Respondents
Variables Category Frequency (N) Percentage (%)
Gender Male 79 64.2
Female 44 35.8
Age Below 25 19 15.4
25-34 40 32.5
35-44 45 36.6
45-54 17 13.8
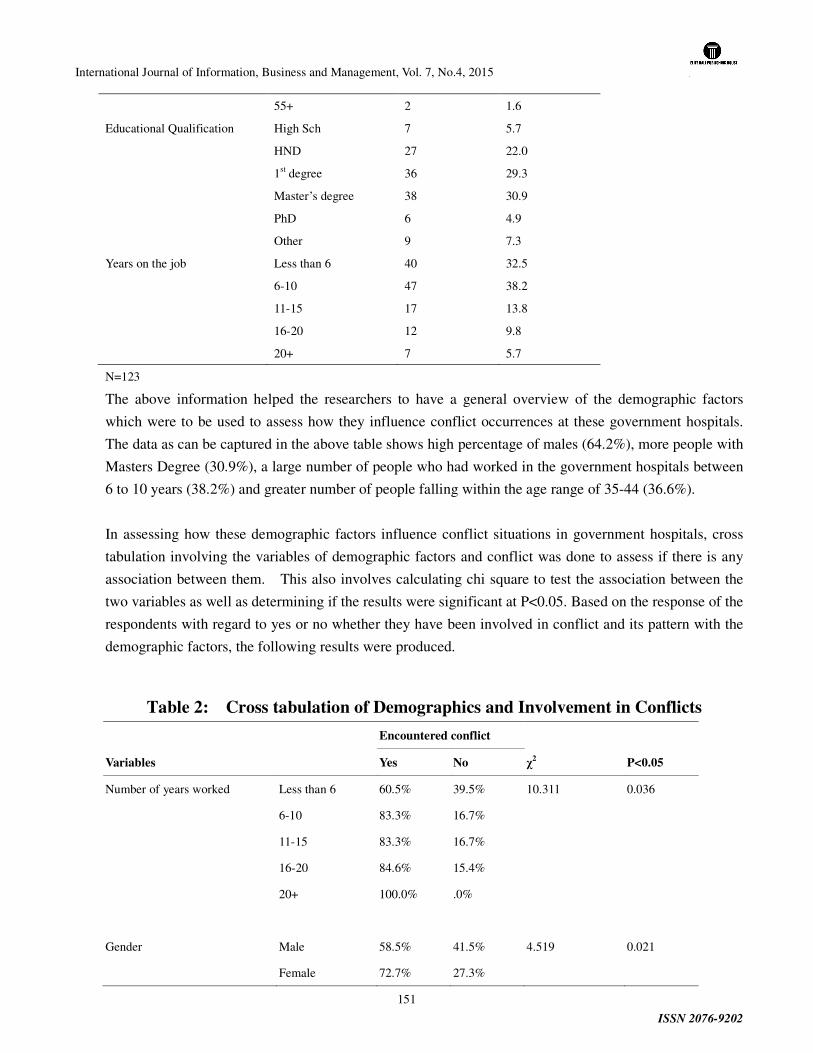
International Journal of Information, Business and Management, Vol. 7, No.4, 2015
ISSN 2076-9202
151
55+ 2 1.6
Educational Qualification High Sch 7 5.7
HND 27 22.0
1st degree 36 29.3
Master’s degree 38 30.9
PhD 6 4.9
Other 9 7.3
Years on the job Less than 6 40 32.5
6-10 47 38.2
11-15 17 13.8
16-20 12 9.8
20+ 7 5.7
N=123
The above information helped the researchers to have a general overview of the demographic factors
which were to be used to assess how they influence conflict occurrences at these government hospitals.
The data as can be captured in the above table shows high percentage of males (64.2%), more people with
Masters Degree (30.9%), a large number of people who had worked in the government hospitals between
6 to 10 years (38.2%) and greater number of people falling within the age range of 35-44 (36.6%).
In assessing how these demographic factors influence conflict situations in government hospitals, cross
tabulation involving the variables of demographic factors and conflict was done to assess if there is any
association between them. This also involves calculating chi square to test the association between the
two variables as well as determining if the results were significant at P<0.05. Based on the response of the
respondents with regard to yes or no whether they have been involved in conflict and its pattern with the
demographic factors, the following results were produced.
Table 2: Cross tabulation of Demographics and Involvement in Conflicts
Variables
Encountered conflict
χ2 P<0.05 Yes No
Number of years worked Less than 6 60.5% 39.5% 10.311 0.036
6-10 83.3% 16.7%
11-15 83.3% 16.7%
16-20 84.6% 15.4%
20+ 100.0% .0%
Gender Male 58.5% 41.5% 4.519 0.021
Female 72.7% 27.3%
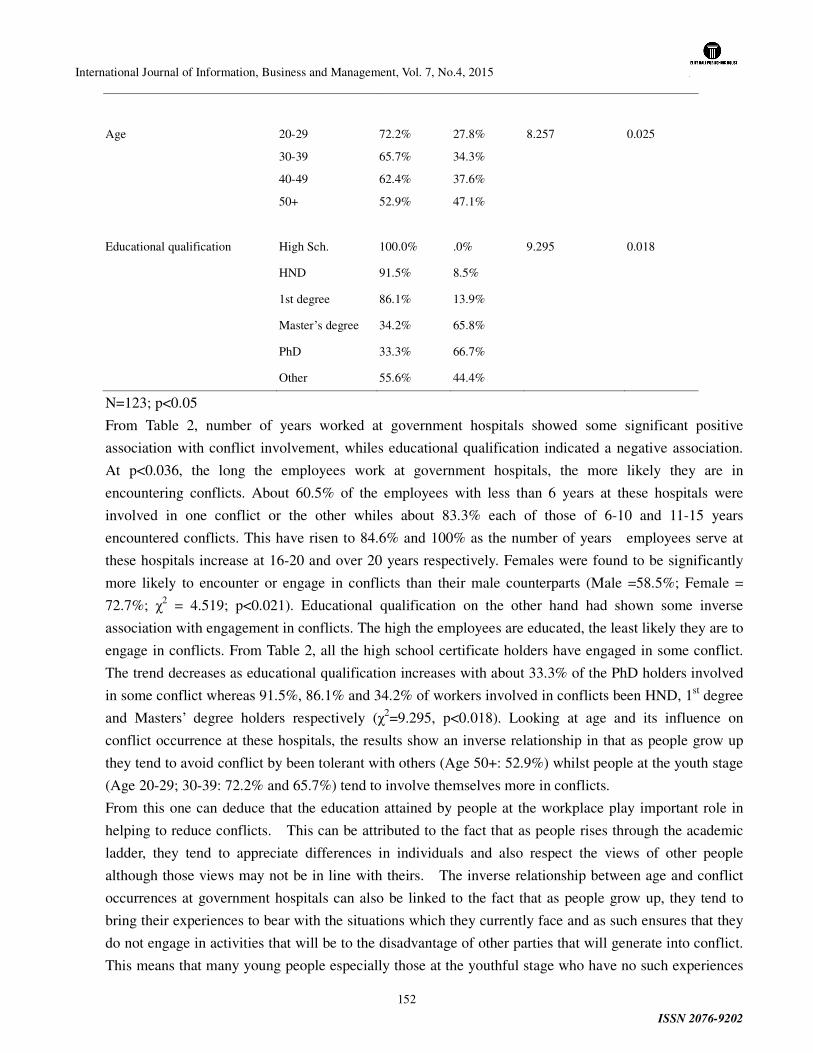
International Journal of Information, Business and Management, Vol. 7, No.4, 2015
ISSN 2076-9202
152
Age
Educational qualification
20-29
30-39
40-49
50+
High Sch.
72.2%
65.7%
62.4%
52.9%
100.0%
27.8%
34.3%
37.6%
47.1%
.0%
8.257
9.295
0.025
0.018
HND 91.5% 8.5%
1st degree 86.1% 13.9%
Master’s degree 34.2% 65.8%
PhD 33.3% 66.7%
Other 55.6% 44.4%
N=123; p<0.05
From Table 2, number of years worked at government hospitals showed some significant positive
association with conflict involvement, whiles educational qualification indicated a negative association.
At p<0.036, the long the employees work at government hospitals, the more likely they are in
encountering conflicts. About 60.5% of the employees with less than 6 years at these hospitals were
involved in one conflict or the other whiles about 83.3% each of those of 6-10 and 11-15 years
encountered conflicts. This have risen to 84.6% and 100% as the number of years employees serve at
these hospitals increase at 16-20 and over 20 years respectively. Females were found to be significantly
more likely to encounter or engage in conflicts than their male counterparts (Male =58.5%; Female =
72.7%; χ2 = 4.519; p<0.021). Educational qualification on the other hand had shown some inverse
association with engagement in conflicts. The high the employees are educated, the least likely they are to
engage in conflicts. From Table 2, all the high school certificate holders have engaged in some conflict.
The trend decreases as educational qualification increases with about 33.3% of the PhD holders involved
in some conflict whereas 91.5%, 86.1% and 34.2% of workers involved in conflicts been HND, 1st degree
and Masters’ degree holders respectively (χ2=9.295, p<0.018). Looking at age and its influence on
conflict occurrence at these hospitals, the results show an inverse relationship in that as people grow up
they tend to avoid conflict by been tolerant with others (Age 50+: 52.9%) whilst people at the youth stage
(Age 20-29; 30-39: 72.2% and 65.7%) tend to involve themselves more in conflicts.
From this one can deduce that the education attained by people at the workplace play important role in
helping to reduce conflicts. This can be attributed to the fact that as people rises through the academic
ladder, they tend to appreciate differences in individuals and also respect the views of other people
although those views may not be in line with theirs. The inverse relationship between age and conflict
occurrences at government hospitals can also be linked to the fact that as people grow up, they tend to
bring their experiences to bear with the situations which they currently face and as such ensures that they
do not engage in activities that will be to the disadvantage of other parties that will generate into conflict.
This means that many young people especially those at the youthful stage who have no such experiences
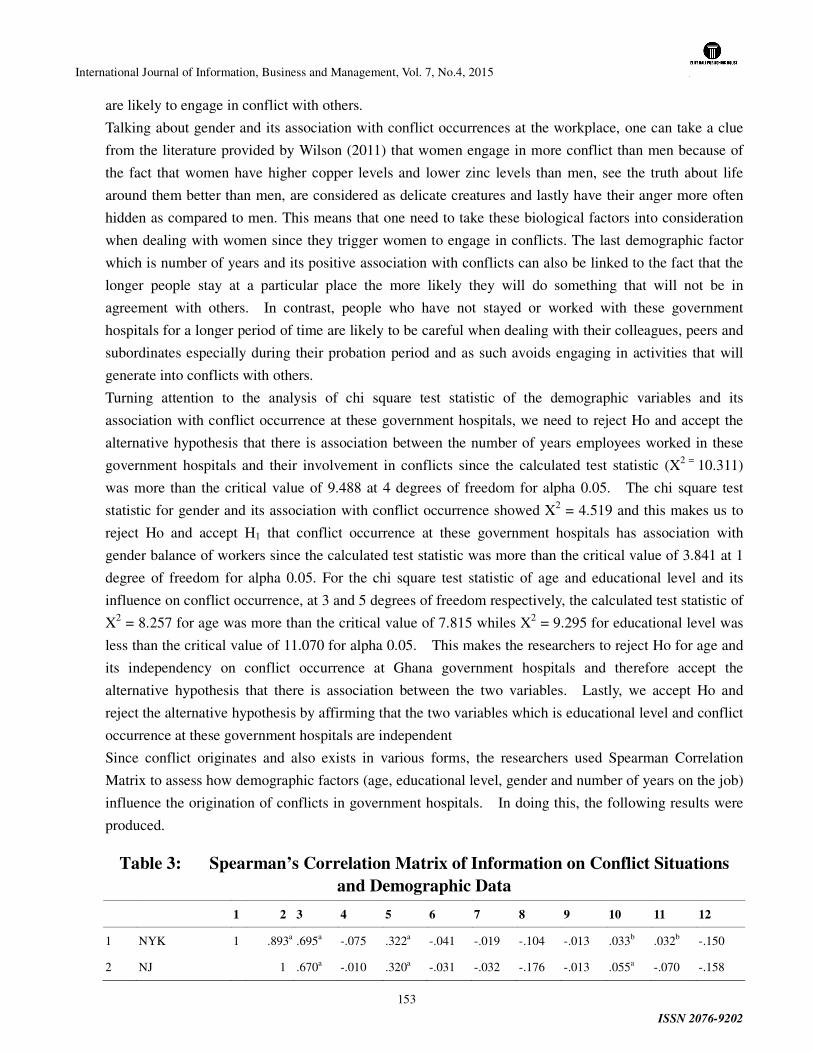
International Journal of Information, Business and Management, Vol. 7, No.4, 2015
ISSN 2076-9202
153
are likely to engage in conflict with others.
Talking about gender and its association with conflict occurrences at the workplace, one can take a clue
from the literature provided by Wilson (2011) that women engage in more conflict than men because of
the fact that women have higher copper levels and lower zinc levels than men, see the truth about life
around them better than men, are considered as delicate creatures and lastly have their anger more often
hidden as compared to men. This means that one need to take these biological factors into consideration
when dealing with women since they trigger women to engage in conflicts. The last demographic factor
which is number of years and its positive association with conflicts can also be linked to the fact that the
longer people stay at a particular place the more likely they will do something that will not be in
agreement with others. In contrast, people who have not stayed or worked with these government
hospitals for a longer period of time are likely to be careful when dealing with their colleagues, peers and
subordinates especially during their probation period and as such avoids engaging in activities that will
generate into conflicts with others.
Turning attention to the analysis of chi square test statistic of the demographic variables and its
association with conflict occurrence at these government hospitals, we need to reject Ho and accept the
alternative hypothesis that there is association between the number of years employees worked in these
government hospitals and their involvement in conflicts since the calculated test statistic (X2 = 10.311)
was more than the critical value of 9.488 at 4 degrees of freedom for alpha 0.05. The chi square test
statistic for gender and its association with conflict occurrence showed X2 = 4.519 and this makes us to
reject Ho and accept H1 that conflict occurrence at these government hospitals has association with
gender balance of workers since the calculated test statistic was more than the critical value of 3.841 at 1
degree of freedom for alpha 0.05. For the chi square test statistic of age and educational level and its
influence on conflict occurrence, at 3 and 5 degrees of freedom respectively, the calculated test statistic of
X2 = 8.257 for age was more than the critical value of 7.815 whiles X2 = 9.295 for educational level was
less than the critical value of 11.070 for alpha 0.05. This makes the researchers to reject Ho for age and
its independency on conflict occurrence at Ghana government hospitals and therefore accept the
alternative hypothesis that there is association between the two variables. Lastly, we accept Ho and
reject the alternative hypothesis by affirming that the two variables which is educational level and conflict
occurrence at these government hospitals are independent
Since conflict originates and also exists in various forms, the researchers used Spearman Correlation
Matrix to assess how demographic factors (age, educational level, gender and number of years on the job)
influence the origination of conflicts in government hospitals. In doing this, the following results were
produced.
Table 3: Spearman’s Correlation Matrix of Information on Conflict Situations
and Demographic Data
1 2 3 4 5 6 7 8 9 10 11 12
1 NYK 1 .893a .695a -.075 .322a -.041 -.019 -.104 -.013 .033b .032b -.150
2 NJ 1 .670a -.010 .320a -.031 -.032 -.176 -.013 .055a -.070 -.158
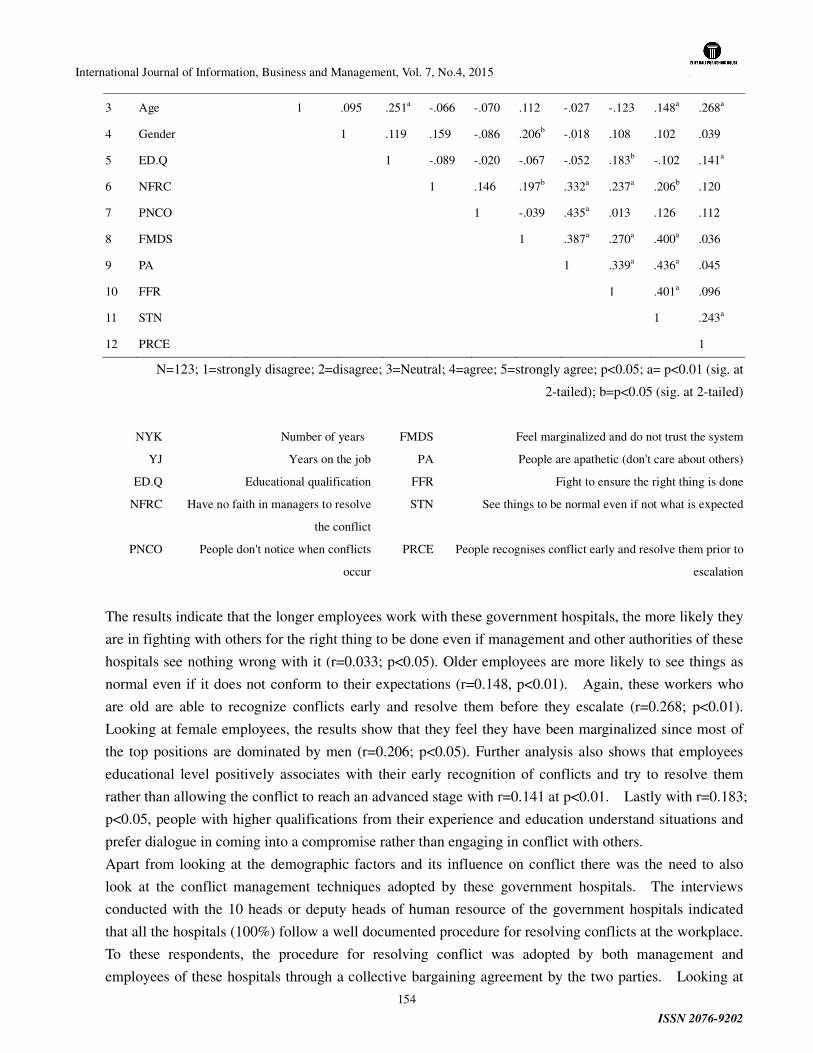
International Journal of Information, Business and Management, Vol. 7, No.4, 2015
ISSN 2076-9202
154
3 Age 1 .095 .251a -.066 -.070 .112 -.027 -.123 .148a .268a
4 Gender 1 .119 .159 -.086 .206b -.018 .108 .102 .039
5 ED.Q 1 -.089 -.020 -.067 -.052 .183b -.102 .141a
6 NFRC 1 .146 .197b .332a .237a .206b .120
7 PNCO 1 -.039 .435a .013 .126 .112
8 FMDS 1 .387a .270a .400a .036
9 PA 1 .339a .436a .045
10 FFR 1 .401a .096
11 STN 1 .243a
12 PRCE 1
N=123; 1=strongly disagree; 2=disagree; 3=Neutral; 4=agree; 5=strongly agree; p<0.05; a= p<0.01 (sig. at
2-tailed); b=p<0.05 (sig. at 2-tailed)
NYK Number of years FMDS Feel marginalized and do not trust the system
YJ Years on the job PA People are apathetic (don't care about others)
ED.Q Educational qualification FFR Fight to ensure the right thing is done
NFRC Have no faith in managers to resolve
the conflict
STN See things to be normal even if not what is expected
PNCO People don't notice when conflicts
occur
PRCE People recognises conflict early and resolve them prior to
escalation
The results indicate that the longer employees work with these government hospitals, the more likely they
are in fighting with others for the right thing to be done even if management and other authorities of these
hospitals see nothing wrong with it (r=0.033; p<0.05). Older employees are more likely to see things as
normal even if it does not conform to their expectations (r=0.148, p<0.01). Again, these workers who
are old are able to recognize conflicts early and resolve them before they escalate (r=0.268; p<0.01).
Looking at female employees, the results show that they feel they have been marginalized since most of
the top positions are dominated by men (r=0.206; p<0.05). Further analysis also shows that employees
educational level positively associates with their early recognition of conflicts and try to resolve them
rather than allowing the conflict to reach an advanced stage with r=0.141 at p<0.01. Lastly with r=0.183;
p<0.05, people with higher qualifications from their experience and education understand situations and
prefer dialogue in coming into a compromise rather than engaging in conflict with others.
Apart from looking at the demographic factors and its influence on conflict there was the need to also
look at the conflict management techniques adopted by these government hospitals. The interviews
conducted with the 10 heads or deputy heads of human resource of the government hospitals indicated
that all the hospitals (100%) follow a well documented procedure for resolving conflicts at the workplace.
To these respondents, the procedure for resolving conflict was adopted by both management and
employees of these hospitals through a collective bargaining agreement by the two parties. Looking at
International Journal of Information, Business and Management, Vol. 7, No.4, 2015
ISSN 2076-9202
155
this, the researchers see it as a system adopted by the hospitals to boost employees’ confidence for them
to report disagreements with their colleagues, subordinates and superiors so that they are resolved to the
satisfaction of both parties. Again, having this system in place creates the avenue for both parties to
explain why they are in disagreement so that compromise could be reached without prolonging the
conflict.
5.0 Conclusion
The study assesses demographic factors and its influence on conflict in Ghana government hospitals.
Data collected through questionnaires and interviews as well as the statistical analysis shows that
demographic factors (age, educational level, gender and number of years on the job) have influence on
conflict and its occurrence in Ghana government hospitals. This means that as most conflicts are
perceived to be dysfunctional, there is a need for managers of these hospitals to take these factors into
consideration when coming out with policies since differences in interpretation of these policies may
come as a result of differences in these demographic factors. Again, employee differences in reasoning
and thinking are potential triggers of conflict and the former comes as a result of differences in age, sex,
educational levels and years of experience on the job among group of employees doing the same work or
in a particular organization. This means that the kind of leadership style managers of these government
hospitals adopt in managing their people should take cognizance of these factors since older people,
people with higher level of education and had also served in these hospitals for a longer period of time
feel peeved when they are not considered when a decision is taken.
6.0 Suggestion to policy makers
Managers manage people with different age, educational level, gender and experience on the job and their
behavior tends to be different as a result of differences in these demographic factors. It is therefore
suggested that managers acting in the capacity as policy formulators need to assign weight to these
demographic factors before these policies are formulated if they are to be embraced by these people.
The differences in existence of these demographic factors among people at the workplace means that even
policies are well acceptable to employees, inter conflict among individuals at the workplace is not
avoidable. On this note, it is suggested that policy makers also need to pay much attention to ensuring
that well a documented policy on addressing conflict is made known to all their employees and their
involvement in the preparation of such policy is crucial if it is to be acceptable to them.
7.0 References
American College of Physicians (2009). Nurse Practitioners in Primary Care, Independence Mall West, Philadelphia
Anderson, Coby and D'Antonio, Linda (2005) "A Participatory Approach to
Understanding Conflict in Health Care," Georgia State University Law Review: Vol. 21.
International Journal of Information, Business and Management, Vol. 7, No.4, 2015
ISSN 2076-9202
156
Annual Report: First Half (2012). Ghana Health Service, Accra
Bercovitch, J & Kadayifci-Orellana, S. A (2009), ‘Religion and Mediation: The Role of
Faith Based Actors in International Conflict Resolution’, International Negotiation, No. 14
Collier, P (2006). Economic causes of civil conflict and their implications for policy, Department of Economics, Oxford University
Dana, D., (2001), Conflict Resolution, New York: McGraw-Hill.
Gatlin et al (2012). Understanding conflict at the workplace, University of Florida, IFAS Extension
Hart, B. (2000). Conflict in the workplace. Behavioral Consultants, P.C. Available on the
World Wide Web at http://behavioralconsultants.com1Newsletters /conflicting theworispjce.htm
Heit, P., Meeks L., & Page, R. (2005) Comprehensive School Health Education. New York: McGraw-Hill
Henkin B. A, Cistone J. Pr. Dee R. J. (2000). Conflict management strategies of principals in site-based
Henry, O. (2009). Organizational Conflict and Its Effects on Organizational Performance. Research Journal of Business Management, 2 (1): 16-24.
Hocker, J L and Wilmot, W W (1995). Interpersonal Conflict. 4th Edition., McGraw-Hill Companies Inc., USA.
Johnson, D.W and Johnson (2000). Joining together: group theory and group skills, 7th Edition, Boston, Allyn and Bacon.
Lambert, J and Myers, S (1999). Activities for conflict resolution. Amherst, MA: HR Development Press.
Obasan A K (2011). Impact of conflict management on corporate productivity: An Evaluative Study, Australian Journal of Business and Management Research, Vol. 1(5)
Rahim, M. A. (2001). Toward a theory of managing organizational conflict. International Journal of Conflict Management, 13, 206–235.
Reece L.B and Brandt R(1996) Effective Human Relations in Organisation,6th edition, Hougton Mifflin Company, Boston-Toronto
Reynolds, S and Kalish E. (2002). Managing collaborative conflict resolution. Reynolds/Kalish website. Available on the World Wide Web at http://www.reynoldskalish.com/mccr.html.
Studdert et al (2010). Conflict in the care of patients: sources, types and predictors, Intensive Care Med
Tjosvold, D, (1991). The conflict-positive organization, Boston: Addison- Wesley
Tseveendorj, O. (2008). Conflict Resolution: A Basis for Effective Conflict Management of Banks in
International Journal of Information, Business and Management, Vol. 7, No.4, 2015
ISSN 2076-9202
157
Baguio City. Thesis Submitted to St Louis University, Baguio City, Philippines.
Walton, R. E. (1969). Interpersonal peacemaking: Confrontations and third-party consultation, Reading, MA: Addison-Wesley
Watson, C. & Hoffman, L. R., (1996), Managers as Negotiators: A Test of Power versus Gender as Predictor of Feelings, behavior and Outcomes, The Leadership Quarterly, 7(1) Western College Publishing 9th Ed., Australia
Wilson, L (2011). Why Are Many Women Angry? The Centre for Development. www.drlwilson.com/articles
International Journal of Information, Business and Management, Vol. 7, No.4, 2015
ISSN 2076-9202
158
The Role of Brand Credibility on Purchase Intention on Fast Food Sector
in Pakistan
Ayesha Shakeel1 1MBA (Continue: 2013-2015) Institute of Business and Management, University of Engineering and
Technology, Lahore.
ABSTRACTABSTRACTABSTRACTABSTRACT The purpose of this study is to identify those main factors that influence upon purchase intension of
customers specifically in fast food sector. The variables which were selected for this research were
perceived quality, customer value, perceived risk and purchase intention. The instrument that is used for
research is close ended questionnaire. Questionnaires were developed collected data from 150
respondents. After analysis the results showed that all the three variables, perceived quality, customer
value and perceived risk have a great impact on consumer purchase intentions. Perceived quality plays
important role. Purchase intentions are built at the last moment when the consumer got the good
perceived quality. Early making of decisions also lead to development of customer value.
Key Words: Customer Value, Fast Food Industry, Perceived Quality, Perceived Risk, Purchase Intention.
1111----Introduction:Introduction:Introduction:Introduction: This topic of my research is impact of perceived quality on purchase intention. The main aim of this study
is to identify those main factors that influence upon purchase intentions of customers. I have selected this
topic as I believe that Purchase intention is the most important factor of customer that triggers the buying
behavior of the customer to any kind of product. So I wanted to find out those important factors that
influence this purchase intention variable. To proceed with this topic I selected three independent
variables and these variables are perceived quality, perceived risk and customer value.
The sector I selected for my research is fast food industry. Fast food industry is on boom not only in
Pakistan but also in the whole world. Especially in my geographic region where I have to conduct my
study i.e. Lahore (Pakistan), people here are too much fond of eating and dining in different type of
restaurants and try new types of food. So I selected fast food industry as my research sector.
The dependent and main variable of my research is Purchase intention. Purchase intention is actually the
mantel plan of a customer in which he /she intend to purchase a product or service at the same time or in
near future. In my opinion purchase intention is the most important factor that is involves in customer
buying behavior. All the companies and organization strive and adopt those methods and processes that
increase purchase intention of customers. The purchase intention can be influenced my many factors, like
advertising, pricing, product, location, quality, positive positioning of the brand or product in the market.
Especially the need of the product at that time.
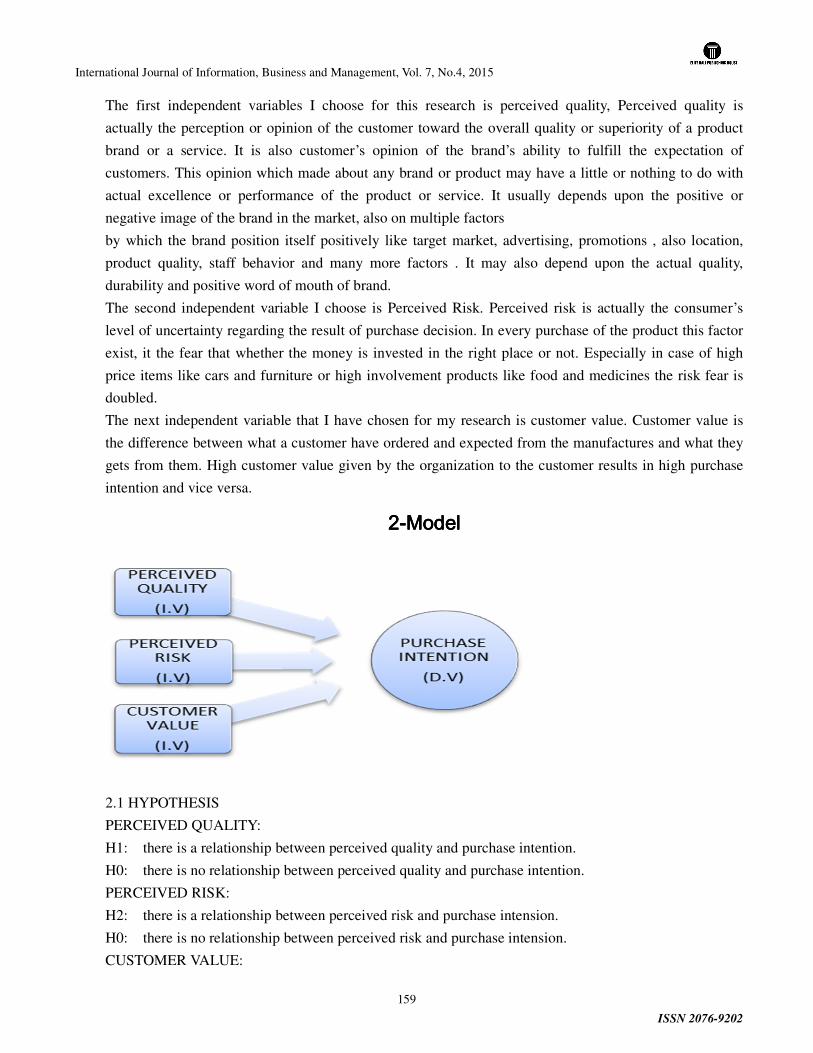
International Journal of Information, Business and Management, Vol. 7, No.4, 2015
ISSN 2076-9202
159
The first independent variables I choose for this research is perceived quality, Perceived quality is
actually the perception or opinion of the customer toward the overall quality or superiority of a product
brand or a service. It is also customer’s opinion of the brand’s ability to fulfill the expectation of
customers. This opinion which made about any brand or product may have a little or nothing to do with
actual excellence or performance of the product or service. It usually depends upon the positive or
negative image of the brand in the market, also on multiple factors
by which the brand position itself positively like target market, advertising, promotions , also location,
product quality, staff behavior and many more factors . It may also depend upon the actual quality,
durability and positive word of mouth of brand.
The second independent variable I choose is Perceived Risk. Perceived risk is actually the consumer’s
level of uncertainty regarding the result of purchase decision. In every purchase of the product this factor
exist, it the fear that whether the money is invested in the right place or not. Especially in case of high
price items like cars and furniture or high involvement products like food and medicines the risk fear is
doubled.
The next independent variable that I have chosen for my research is customer value. Customer value is
the difference between what a customer have ordered and expected from the manufactures and what they
gets from them. High customer value given by the organization to the customer results in high purchase
intention and vice versa.
2222----ModelModelModelModel
2.1 HYPOTHESIS
PERCEIVED QUALITY:
H1: there is a relationship between perceived quality and purchase intention.
H0: there is no relationship between perceived quality and purchase intention.
PERCEIVED RISK:
H2: there is a relationship between perceived risk and purchase intension.
H0: there is no relationship between perceived risk and purchase intension.
CUSTOMER VALUE:
International Journal of Information, Business and Management, Vol. 7, No.4, 2015
ISSN 2076-9202
160
H3: there is a relationship between customer value and purchase intention.
H0: there is no relationship between customer value and purchase intention
3333----Literature ReviewLiterature ReviewLiterature ReviewLiterature Review Tsiotsou R. (2006) deemed “The role of perceived product quality and overall satisfaction on purchase
intentions”. He discussed five variables included values, involvement, perceived product quality, purchase
intention and overall satisfaction. The research was made on sport shoes. The technique was questionnaire.
He selected 197 students as respondent. The finding of his study is that the thing which has the largest
effect was perceived product quality. It was having the direct effect. The least to matter was purchase
intention. While if satisfaction was considered it had the largest and the direct effect on the purchase
intention but its overall effect is less because of indirect effect. Purchase intentions are very important in
marketing term or functions. Purchase intention is important as it’s totally linked with the marketing
literature. While he described perceived quality as the working of the product on the basis of judgments
made. Objective quality is totally different from perceived quality. Perceived product quality is assessed
globally. Consumer made purchase intention for those products that later satisfies them or create customer
value for them. Purchase intention are made on the outlook of the product quality or feature.
Khatib H. and Lee H. (2011) examined “The role of perceived support quality”. They worked on nine
variables included information quality, system quality, perceived trustworthiness, perceived risk,
compatibility, complexity, perceived ease of use (PEOU), perceived usefulness (PU), and social influence.
They used the study of Churchill to study construct. The item (generation) produced was 53. Qualitative
empirical approach has been used. The technique was questionnaire. The findings of the study are that
both the academics and practitioners are contributing towards understanding the factors that will distract
government working regarding adoption and usage. Sometime citizens are useless. They have to pay
taxes for each and everything. For their future benefits they would apply for social benefits. If any things
get expire they have to renew them. For security and safety they’ll be having the need of health services.
Many governmental websites are there but they not been viewed or checked from the perspective of
perceived quality. E-Governments are making success model of information systems. Manu unskilled
person can use them.
Bukenya J. and Wright N. (2007) worked on “The Determinants of Consumer Attitudes and Purchase
Intentions with Regard to Genetically Modified Tomatoes”. He discussed fifteen variables included Race,
Female, Young age, Middle age, Medium education, High education, Medium income, High income,
Primary shopper, Knowledge, Attitude, Risk, Label, Perception, Price. The analysis is drawn on the data
which was gathered through the survey on consumer held at different grocery stores in Alabama. The
result showed up expanded preferences towards the tomatoes. He investigated that the price was being
showed by the variable of prices differences between the mutant and non-mutant tomatoes. People will
prefer to buy mutant tomatoes if the prices between mutant and non-mutant tomatoes will increases. Now
the person having high income and good or selective at shopping will consider the expensive. Many
factors have been neglect like consumer behavior and belief etc. because of the larger effect of the socio
economic criteria.
International Journal of Information, Business and Management, Vol. 7, No.4, 2015
ISSN 2076-9202
161
Saizrbitoria I and Landin G. (2006) examined “The impact of quality management in European
companies’ performance”. He worked on four variables Economic profitability, Market share, Sales per
employee and sales growth. The technique they used was QM models. They came up with the result that
the use of QM model has a good effect on the result of the company. QM models improved the operations
and functions of the company. Efficiency was remarkably improved. Cost of internal activities was also
reduced.
Fu Chen C. and Ying Chang Y. (2008) studied “Airline brand equity, brand preference, and purchase
intentions the moderating effects of switching costs”. He worked on four variables included brand equity,
brand preference, purchase intentions, and switching costs. They found on the brand of equity the
moderating effect of the switching cost does not exist. Brand preferences also don’t exist. While on the
path of equity there is involvement of the moderating effect and it exist strongly. Brand equity is
important for every industry. It is the primary capital as it’s built in the long span of time. Customer can
be attracted or strong attachment can be built only with the help or presence of strong brand having strong
equity. Brand enables the customer to see beyond the horizon. To visualize what type of benefits the
brand is offering them. Only then the customer can understand the intangible factors of brand and its built
equity.
Bahia K. and NantelJ. (2000) studied “A reliable and valid measurement scale for the perceived service
quality of banks”. They worked on six variables included effectiveness and assurance, access, price,
tangibles, services portfolio and reliability. The researched that replications are always welcomed as the
authentication of the measure is a lasting process. In any process repetition exist with the reliable data.
Besides repetition of the data limitation also exits for the bank. Measurement that is limited can be
improved until the bank reaches the perfect scale could be attain. Sometimes the perfect scale does not
exist but sometimes reliable and valid data are also obtained. Perceived service quality is what the
consumer thinks of the product whenever he confronts it. Their way of looking towards the product is the
form of attitude. Consumer observes things and then makes judgments, comparison and decision of the
basis of perceived quality. They presume the performance of the product on the basis of perceived quality.
Chen Z. and Dubinsky A. (2003) studied “Conceptual model of perceived customer value in e-commerce”.
They considered seven variables for their work. It includes purchase intention, perceived customer value,
product price, perceived product quality, perceived risk, e-retailer reputation, valence of experience.
Regression test was used to check the customer value. Several proposition was given about the customer
value and their support regarding the empirical study was been checked. Multi co linearity does not seem
to be the major concerns. The customer makes an overall assessment of the utilization of the product that
is based on certain perceptions regarding what type of value a customer got and what he had paid to get
those values.
Heijden H. et al., (2003) determined “The online purchase intentions: contributions from technology and
trust perspectives”. They worked on three variables perceived risk, online purchase intention and
perceived ease of use. They investigated that perceived risk and perceived ease of use has a background.
The ancestor of them is attitude of customer towards online purchasing. Perceive risk is high at online
purchasing because in many situation people don’t trust the web. While at the other hand perceived ease
International Journal of Information, Business and Management, Vol. 7, No.4, 2015
ISSN 2076-9202
162
of use is positive as the online shopping seems to be so easy for the people that while sitting home one
can get the thing and the job done. The basic hurdle may came for a person having less knowledge of
technology as the online consumer has to deal with the technology for placing the order or getting the
services. Perceived risk is high as the store is replaced by the electronic things where there is no
possibility of checking or trying the things. The store may either be replaced by information system (IS).
Szybillo G. and Jacoby J.studied“Intrinsic versus extrinsic cues as determinants of perceived product
quality”. They discussed 4 variables included physical product, price, store image, Error within groups.
They came up with the result that extrinsic cues has less effect upon quality perception. Intrinsic cues had
a greater effect upon quality. Composition difference has a greater effect while price or information
storage has a less effect. Perceived is the state when the consumer is so willing to buy the product as he
acquires a little purchase intention. While in case perceived quality the purchase intention is less. In that
case the purchase intentions will be followed up by the practitioners. Purchase intentions has a positive
relationship with the purchase behavior which was actually been done. The basic findings say that the
perceived worth is more so more focus should be given on worth rather than working on building
perceived quality.
Kuo Y. et al., (2009) deemed “The relationships among perceived value, service quality, customer
satisfaction and
post purchase intention in mobile services”. The variables were tested to check the relationship of above
four. Service quality greatly impact on perceived value and customer satisfaction. When a mobile service
quality gives an excellent service so the purchasing intention automatically increases. It positively affects
the satisfaction level of consumers. As high perceived value higher will be the satisfaction level. As far as
post purchase intention is concerned there is no direct relation of service quality; although the perceived
value is directly affected by post purchase intention. The service quality is actually the difference between
the actual and desired state of the consumer. While the perceived customer value can easily be evaluated
from the quality, money, benefits and other social factors.
4444----Methodology:Methodology:Methodology:Methodology: In my research I have done the quantitative research. I used the quantitative techniques i.e. close ended
questionnaires. I have used the same methods to get quantitative data.
4.1 Population and Sampling
Population is that category/segment of respondent’s that we have selected to get data of our research
questions, which will become the part of our survey. While sample is the total no of respondents of that
same category from whom we have collected our data.
In my research the population is the whole segment of persons who like to go to fast food restaurants.
And my sample size is 150
4.2 Data Collection And Instrument
After identifying the topic and research market i.e. respondents or sample, we have to develop an
instrument whit the help of which we attain different views of our respondents and interpret those views
and data in numeric form so that we get the accurate information. Close ended questionnaire is the
International Journal of Information, Business and Management, Vol. 7, No.4, 2015
ISSN 2076-9202
163
simplest effective and widely used instrument, so a questionnaire is developed which included close
ended questions with a scale to get accurate data. After that these questionnaires are randomly distributed
and data was collected.
5. DATA ANALYSIS5. DATA ANALYSIS5. DATA ANALYSIS5. DATA ANALYSIS After getting the data from respondents, the next step is to align data and interpret it using software. SPSS
software is used for the analysis of data. Multiple testapplied on collected data using SPSS; performed
both descriptive statistics and inferential tests and analyzed the following
� Reliability
� Good fitness of model by ANOVA table.
� Regression Analysis
5.1 RELIABILITY AND VALIDITY
Validity:
validity is also called acceptability; here validity refers to the acceptability of our research
instrument which is our close ended questionnaireI used face validity that is got my questionnaire
checked by expert.
Reliability:
After validity of the instrument, the data is collected and after that, the reliability of our data collected is
analyzed and checked for reliability. A test is applied in SPSS software to check the reliability.
Table 1. Reliability Statistics
Cronbach's Alpha N of Items
.827 20
Here the value of Cronbach `salpha is 0.827 which is more than 0.7 which showed that the data is
reliable.
5.2 ANALYSIS
Descriptive Statistics
Table 2. Descriptive Statistics
N Range Minimum Maximum Mean
Std.
Deviation
PQtotal 150 3.80 1.20 5.00 3.8147 .70553
PItotal 150 3.20 1.80 5.00 3.9213 .64043
PRtotal 150 3.00 2.00 5.00 3.7973 .61785
CVtotal 150 3.60 1.40 5.00 3.9120 .75458
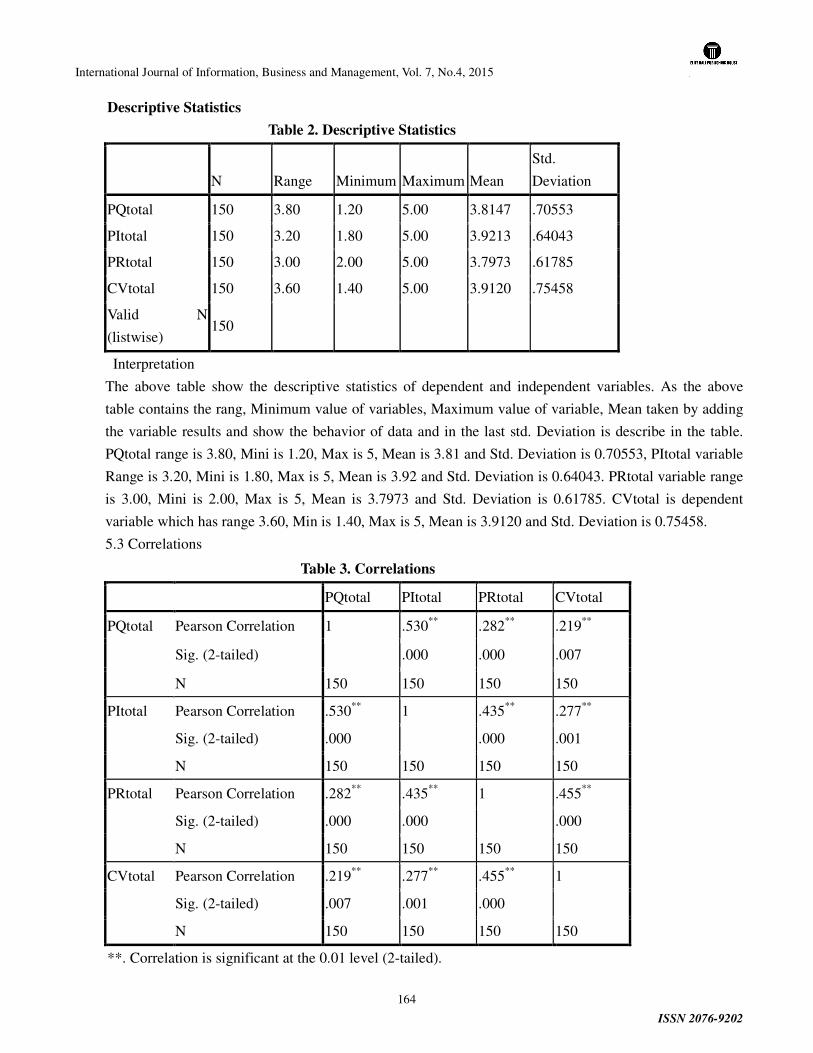
International Journal of Information, Business and Management, Vol. 7, No.4, 2015
ISSN 2076-9202
164
Descriptive Statistics
Table 2. Descriptive Statistics
N Range Minimum Maximum Mean
Std.
Deviation
PQtotal 150 3.80 1.20 5.00 3.8147 .70553
PItotal 150 3.20 1.80 5.00 3.9213 .64043
PRtotal 150 3.00 2.00 5.00 3.7973 .61785
CVtotal 150 3.60 1.40 5.00 3.9120 .75458
Valid N
(listwise) 150
Interpretation
The above table show the descriptive statistics of dependent and independent variables. As the above
table contains the rang, Minimum value of variables, Maximum value of variable, Mean taken by adding
the variable results and show the behavior of data and in the last std. Deviation is describe in the table.
PQtotal range is 3.80, Mini is 1.20, Max is 5, Mean is 3.81 and Std. Deviation is 0.70553, PItotal variable
Range is 3.20, Mini is 1.80, Max is 5, Mean is 3.92 and Std. Deviation is 0.64043. PRtotal variable range
is 3.00, Mini is 2.00, Max is 5, Mean is 3.7973 and Std. Deviation is 0.61785. CVtotal is dependent
variable which has range 3.60, Min is 1.40, Max is 5, Mean is 3.9120 and Std. Deviation is 0.75458.
5.3 Correlations
Table 3. Correlations
PQtotal PItotal PRtotal CVtotal
PQtotal Pearson Correlation 1 .530** .282** .219**
Sig. (2-tailed) .000 .000 .007
N 150 150 150 150
PItotal Pearson Correlation .530** 1 .435** .277**
Sig. (2-tailed) .000 .000 .001
N 150 150 150 150
PRtotal Pearson Correlation .282** .435** 1 .455**
Sig. (2-tailed) .000 .000 .000
N 150 150 150 150
CVtotal Pearson Correlation .219** .277** .455** 1
Sig. (2-tailed) .007 .001 .000
N 150 150 150 150
**. Correlation is significant at the 0.01 level (2-tailed).
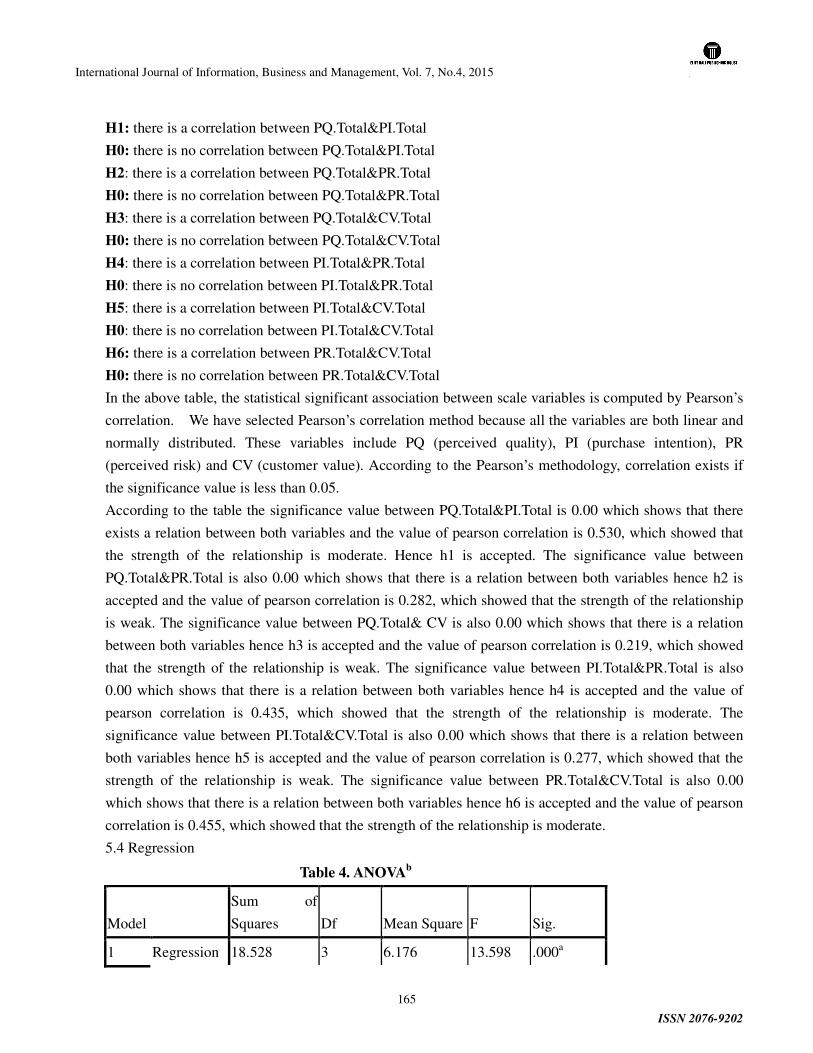
International Journal of Information, Business and Management, Vol. 7, No.4, 2015
ISSN 2076-9202
165
H1: there is a correlation between PQ.Total&PI.Total
H0: there is no correlation between PQ.Total&PI.Total
H2: there is a correlation between PQ.Total&PR.Total
H0: there is no correlation between PQ.Total&PR.Total
H3: there is a correlation between PQ.Total&CV.Total
H0: there is no correlation between PQ.Total&CV.Total
H4: there is a correlation between PI.Total&PR.Total
H0: there is no correlation between PI.Total&PR.Total
H5: there is a correlation between PI.Total&CV.Total
H0: there is no correlation between PI.Total&CV.Total
H6: there is a correlation between PR.Total&CV.Total
H0: there is no correlation between PR.Total&CV.Total
In the above table, the statistical significant association between scale variables is computed by Pearson’s
correlation. We have selected Pearson’s correlation method because all the variables are both linear and
normally distributed. These variables include PQ (perceived quality), PI (purchase intention), PR
(perceived risk) and CV (customer value). According to the Pearson’s methodology, correlation exists if
the significance value is less than 0.05.
According to the table the significance value between PQ.Total&PI.Total is 0.00 which shows that there
exists a relation between both variables and the value of pearson correlation is 0.530, which showed that
the strength of the relationship is moderate. Hence h1 is accepted. The significance value between
PQ.Total&PR.Total is also 0.00 which shows that there is a relation between both variables hence h2 is
accepted and the value of pearson correlation is 0.282, which showed that the strength of the relationship
is weak. The significance value between PQ.Total& CV is also 0.00 which shows that there is a relation
between both variables hence h3 is accepted and the value of pearson correlation is 0.219, which showed
that the strength of the relationship is weak. The significance value between PI.Total&PR.Total is also
0.00 which shows that there is a relation between both variables hence h4 is accepted and the value of
pearson correlation is 0.435, which showed that the strength of the relationship is moderate. The
significance value between PI.Total&CV.Total is also 0.00 which shows that there is a relation between
both variables hence h5 is accepted and the value of pearson correlation is 0.277, which showed that the
strength of the relationship is weak. The significance value between PR.Total&CV.Total is also 0.00
which shows that there is a relation between both variables hence h6 is accepted and the value of pearson
correlation is 0.455, which showed that the strength of the relationship is moderate.
5.4 Regression
Table 4. ANOVAb
Model
Sum of
Squares Df Mean Square F Sig.
1 Regression 18.528 3 6.176 13.598 .000a
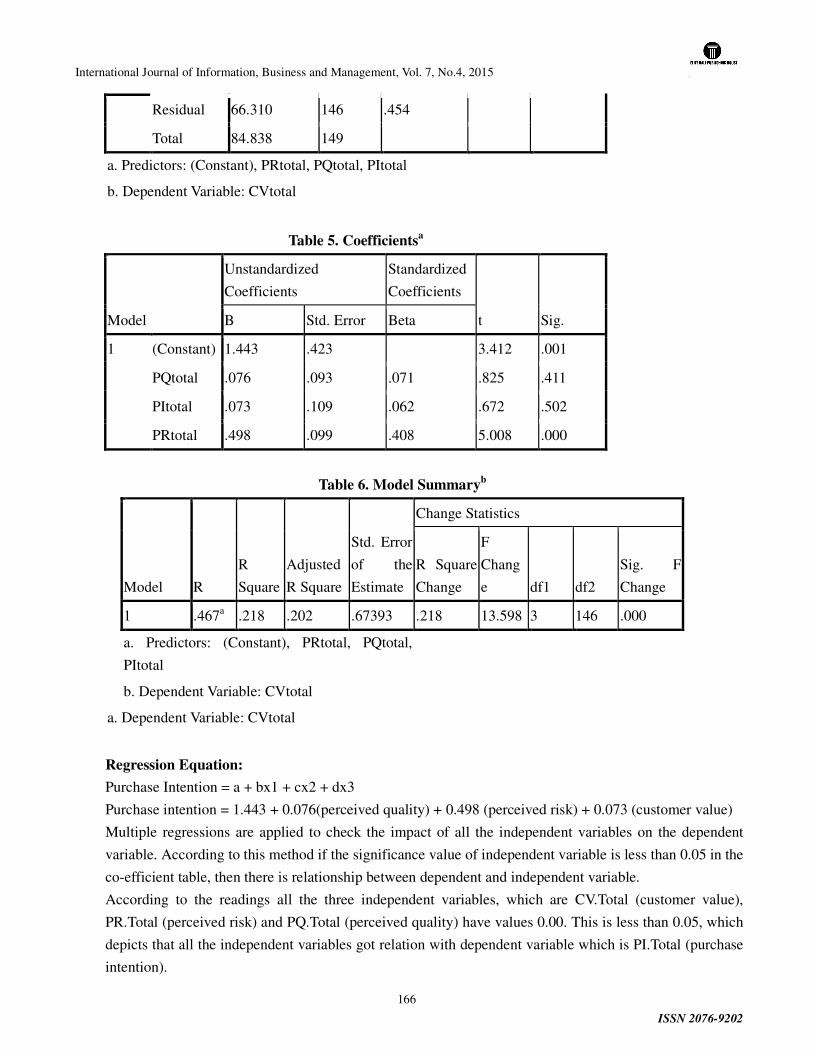
International Journal of Information, Business and Management, Vol. 7, No.4, 2015
ISSN 2076-9202
166
Residual 66.310 146 .454
Total 84.838 149
a. Predictors: (Constant), PRtotal, PQtotal, PItotal
b. Dependent Variable: CVtotal
Table 5. Coefficientsa
Model
Unstandardized
Coefficients
Standardized
Coefficients
t Sig. B Std. Error Beta
1 (Constant) 1.443 .423 3.412 .001
PQtotal .076 .093 .071 .825 .411
PItotal .073 .109 .062 .672 .502
PRtotal .498 .099 .408 5.008 .000
a. Dependent Variable: CVtotal
Regression Equation:
Purchase Intention = a + bx1 + cx2 + dx3
Purchase intention = 1.443 + 0.076(perceived quality) + 0.498 (perceived risk) + 0.073 (customer value)
Multiple regressions are applied to check the impact of all the independent variables on the dependent
variable. According to this method if the significance value of independent variable is less than 0.05 in the
co-efficient table, then there is relationship between dependent and independent variable.
According to the readings all the three independent variables, which are CV.Total (customer value),
PR.Total (perceived risk) and PQ.Total (perceived quality) have values 0.00. This is less than 0.05, which
depicts that all the independent variables got relation with dependent variable which is PI.Total (purchase
intention).
Table 6. Model Summaryb
Model R
R
Square
Adjusted
R Square
Std. Error
of the
Estimate
Change Statistics
R Square
Change
F
Chang
e df1 df2
Sig. F
Change
1 .467a .218 .202 .67393 .218 13.598 3 146 .000
a. Predictors: (Constant), PRtotal, PQtotal,
PItotal
b. Dependent Variable: CVtotal
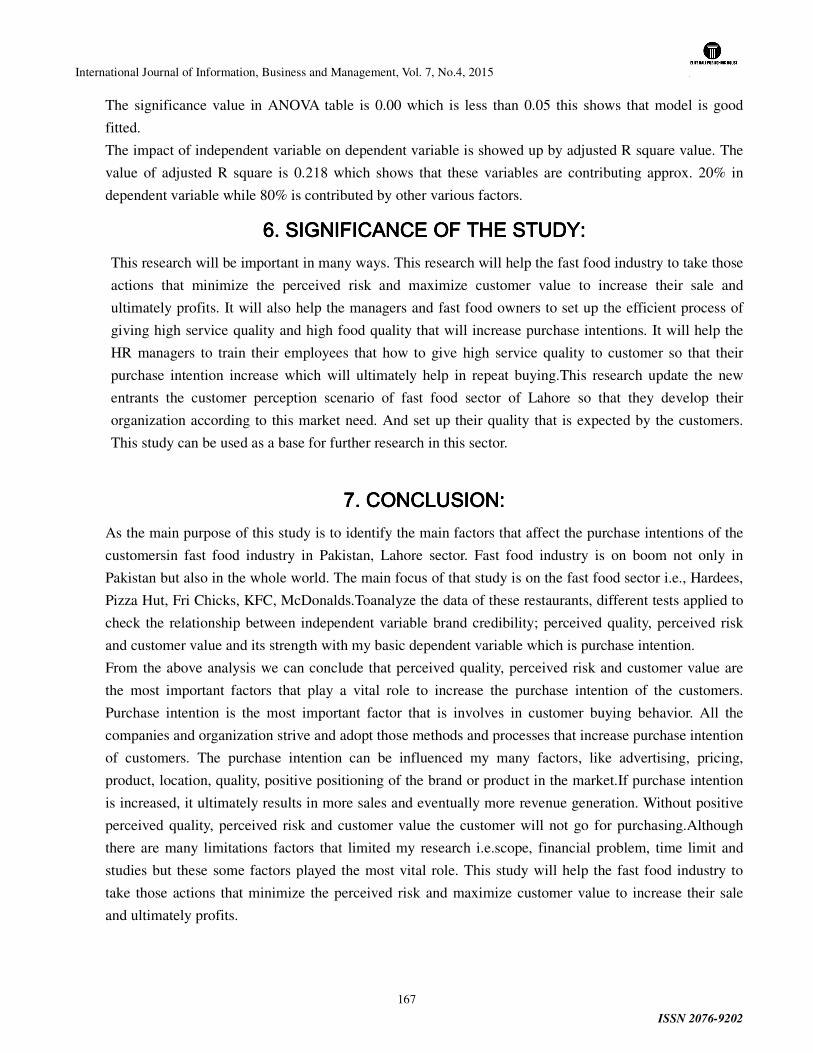
International Journal of Information, Business and Management, Vol. 7, No.4, 2015
ISSN 2076-9202
167
The significance value in ANOVA table is 0.00 which is less than 0.05 this shows that model is good
fitted.
The impact of independent variable on dependent variable is showed up by adjusted R square value. The
value of adjusted R square is 0.218 which shows that these variables are contributing approx. 20% in
dependent variable while 80% is contributed by other various factors.
6. SIGNIFICANCE OF THE STUDY:6. SIGNIFICANCE OF THE STUDY:6. SIGNIFICANCE OF THE STUDY:6. SIGNIFICANCE OF THE STUDY: This research will be important in many ways. This research will help the fast food industry to take those
actions that minimize the perceived risk and maximize customer value to increase their sale and
ultimately profits. It will also help the managers and fast food owners to set up the efficient process of
giving high service quality and high food quality that will increase purchase intentions. It will help the
HR managers to train their employees that how to give high service quality to customer so that their
purchase intention increase which will ultimately help in repeat buying.This research update the new
entrants the customer perception scenario of fast food sector of Lahore so that they develop their
organization according to this market need. And set up their quality that is expected by the customers.
This study can be used as a base for further research in this sector.
7. CONCLUSION:7. CONCLUSION:7. CONCLUSION:7. CONCLUSION: As the main purpose of this study is to identify the main factors that affect the purchase intentions of the
customersin fast food industry in Pakistan, Lahore sector. Fast food industry is on boom not only in
Pakistan but also in the whole world. The main focus of that study is on the fast food sector i.e., Hardees,
Pizza Hut, Fri Chicks, KFC, McDonalds.Toanalyze the data of these restaurants, different tests applied to
check the relationship between independent variable brand credibility; perceived quality, perceived risk
and customer value and its strength with my basic dependent variable which is purchase intention.
From the above analysis we can conclude that perceived quality, perceived risk and customer value are
the most important factors that play a vital role to increase the purchase intention of the customers.
Purchase intention is the most important factor that is involves in customer buying behavior. All the
companies and organization strive and adopt those methods and processes that increase purchase intention
of customers. The purchase intention can be influenced my many factors, like advertising, pricing,
product, location, quality, positive positioning of the brand or product in the market.If purchase intention
is increased, it ultimately results in more sales and eventually more revenue generation. Without positive
perceived quality, perceived risk and customer value the customer will not go for purchasing.Although
there are many limitations factors that limited my research i.e.scope, financial problem, time limit and
studies but these some factors played the most vital role. This study will help the fast food industry to
take those actions that minimize the perceived risk and maximize customer value to increase their sale
and ultimately profits.
International Journal of Information, Business and Management, Vol. 7, No.4, 2015
ISSN 2076-9202
168
ReferencesReferencesReferencesReferences
[1] Rodoula, T.(2006), “The role of perceived product quality and overall satisfaction on purchase intention”. Consumer studies, Vol. 30 NO. 2, pp. 207-217.
[2] Khatib, A. & Lee, H. (2011),“The Role Of Perceived Quality”. INTERNATIONAL JOURNAL OF eBUSINESS AND eGOVERNMENT STUDIES,Vol. 3 No. 2.
[3] Bukenya, J. & Wright, N. (2007),“The Determinants of Consumer Attitudes and Purchase Intentions With Regard to Genetically Modified Tomatoes”. Agribusines, Vol. 23 NO.1, pp. 117-130.
[4] Saizrbitoria, I. & Landin, G. (2006),“The impact of quality management in European companies' performance: The case of the Spanish companies”. European Business Review, Vol. 18 No. 2, pp. 114-131.
[5] Fu Chen C. & Ying Chang Y. (2008),“Airline brand equity, brand preference and purchase intentions”. The moderating effects of switching costs. Vol.14 No. 1, pp. 40-42.
[6] Bahia, K. &Nantel, J. (2000),“A reliable and valid measurement scale for the perceived service quality of banks”. International Journal of Bank Marketing, Vol. 18 No. 2, pp 84-91.
[7] Chen, Z. & Dubinsky, A. (2003),“Conceptual model of perceived customer value in e-commerce”. Psychology & Marketing, Vol. 20 No. 4, pp. 323-347.
[8] Heijden, H. et al., (2003),Online Servicescapes, Trust, And Purchase Intentions. 4.
[9] Szybillo, G. & Jacoby, J. ( 1974), “Intrinsic Versus Extrinsic Cues as DeterminantsOfPerceived Product Quality”. Journal of Applied Psychology, Vol. 59 No. 1, pp. 74-78.
[10] Kuo Y., W. C. (2009, July),“The relationships among service quality, perceived value, customer satisfaction, and post-purchase intention in mobile value-added services”. Computers in Human Behavior, Vol. 25 No. 4, pp. 887-896.
International Journal of Information, Business and Management, Vol. 7, No.4, 2015
ISSN 2076-9202
169
CSR Practices in Asia: Case Study of Multinational Companies in SMEs
Ayesha Shakeel
MBA (Continue), Institute of Business & Management, UET Lahore, Pakistan
Abstract
Today the corporate social responsibility is an integral and important part of company’s environment. The focus of the study is to evaluate
the importance of the corporate social responsibility inUnilever Pakistan Limited in Asia. (Indonesia, Malaysia, Pakistan, Bangladesh,
Thailand & Singapore). Furthermore thispaper identifies the significance of corporate social responsibility in the labor rights, stakeholder’s
rights and protection of the environment.
Key Words: Asia, Corporate Social Responsibility (CSR), Multinational Corporations Stakeholders
I. INTRODUCTION
Corporate social responsibility has been extremely famous around organizations and top companies. Particularly in the 21st
century when ecological concerns, human rights, work rights, reasonable exchange and numerous different concerns are
getting to be progressively imperative to buyers, stakeholders and organizations apparently equivalent. However the careful
definition and the viability of corporate social obligation are frequently exceptionally unclear and confounding to others. This
paper will investigate in profundity of what precisely is corporate social responsibility, how organizations are driven to
consolidating CSR into their beliefs, business systems and what movements do these organizations take to turn into a socially
dependable organization. [1]
II. LITERATURE REVIEW---- WHAT IS CORPORATE SOCIAL RESPONSIBILITY?
Corporate Social responsibility (CSR) includes a guarantee by an organization to manage its different parts in the public eye, as
maker, management, client and national in a mindful way. How a company satisfies its business liability goals is affected by its
history, perspective of the creator, lifestyle, experience, viewpoint and business rules. It varies from simple conformity with
law to genuine philanthropy. [2]
2.1the Pyramid of Corporate Social Responsibility
For CSR it is suggested here that four kinds of social responsibilities constitute total CSR: economic, legal, ethical and
philanthropic.
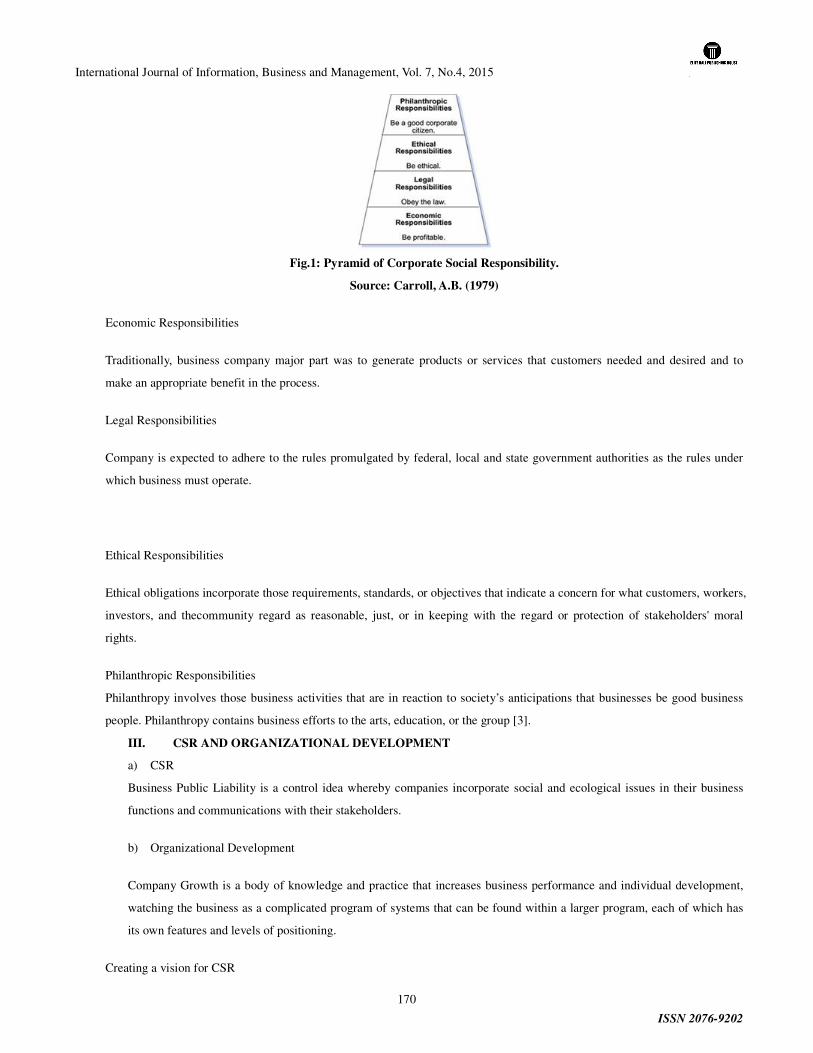
International Journal of Information, Business and Management, Vol. 7, No.4, 2015
ISSN 2076-9202
170
Fig.1: Pyramid of Corporate Social Responsibility.
Source: Carroll, A.B. (1979)
Economic Responsibilities
Traditionally, business company major part was to generate products or services that customers needed and desired and to
make an appropriate benefit in the process.
Legal Responsibilities
Company is expected to adhere to the rules promulgated by federal, local and state government authorities as the rules under
which business must operate.
Ethical Responsibilities
Ethical obligations incorporate those requirements, standards, or objectives that indicate a concern for what customers, workers,
investors, and thecommunity regard as reasonable, just, or in keeping with the regard or protection of stakeholders' moral
rights.
Philanthropic Responsibilities
Philanthropy involves those business activities that are in reaction to society’s anticipations that businesses be good business
people. Philanthropy contains business efforts to the arts, education, or the group [3].
III. CSR AND ORGANIZATIONAL DEVELOPMENT
a) CSR
Business Public Liability is a control idea whereby companies incorporate social and ecological issues in their business
functions and communications with their stakeholders.
b) Organizational Development
Company Growth is a body of knowledge and practice that increases business performance and individual development,
watching the business as a complicated program of systems that can be found within a larger program, each of which has
its own features and levels of positioning.
Creating a vision for CSR
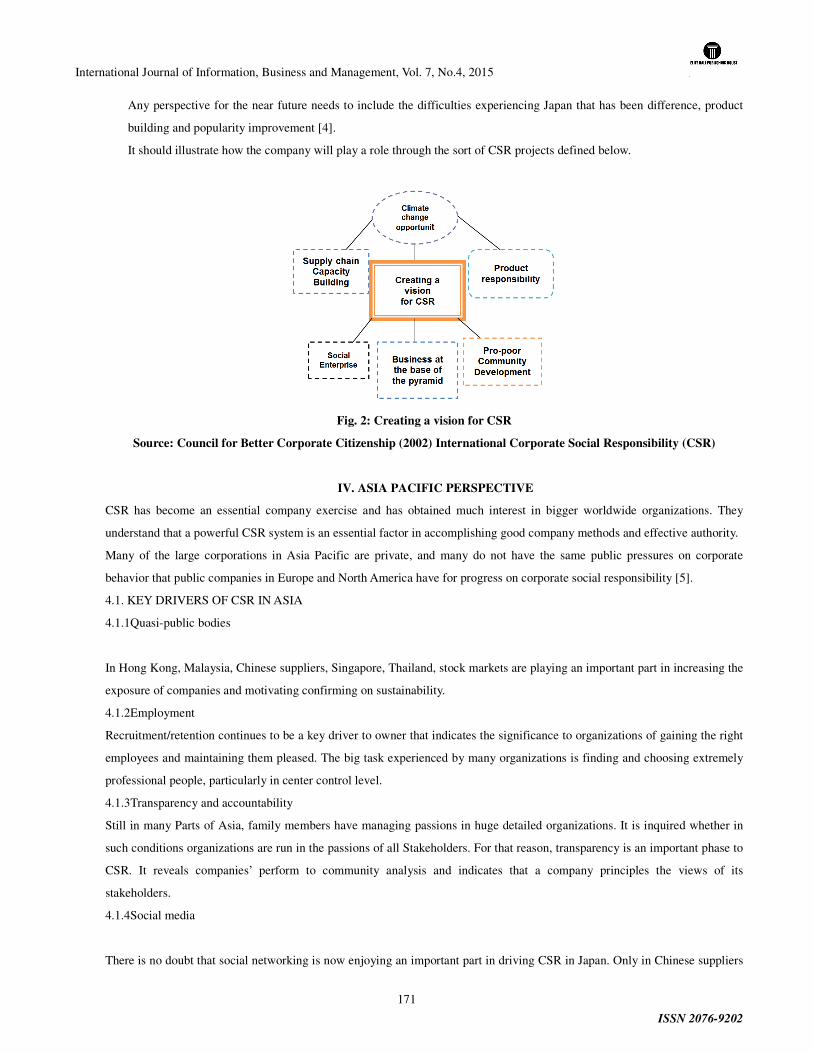
International Journal of Information, Business and Management, Vol. 7, No.4, 2015
ISSN 2076-9202
171
Any perspective for the near future needs to include the difficulties experiencing Japan that has been difference, product
building and popularity improvement [4].
It should illustrate how the company will play a role through the sort of CSR projects defined below.
Fig. 2: Creating a vision for CSR
Source: Council for Better Corporate Citizenship (2002) International Corporate Social Responsibility (CSR)
IV. ASIA PACIFIC PERSPECTIVE
CSR has become an essential company exercise and has obtained much interest in bigger worldwide organizations. They
understand that a powerful CSR system is an essential factor in accomplishing good company methods and effective authority.
Many of the large corporations in Asia Pacific are private, and many do not have the same public pressures on corporate
behavior that public companies in Europe and North America have for progress on corporate social responsibility [5].
4.1. KEY DRIVERS OF CSR IN ASIA
4.1.1Quasi-public bodies
In Hong Kong, Malaysia, Chinese suppliers, Singapore, Thailand, stock markets are playing an important part in increasing the
exposure of companies and motivating confirming on sustainability.
4.1.2Employment
Recruitment/retention continues to be a key driver to owner that indicates the significance to organizations of gaining the right
employees and maintaining them pleased. The big task experienced by many organizations is finding and choosing extremely
professional people, particularly in center control level.
4.1.3Transparency and accountability
Still in many Parts of Asia, family members have managing passions in huge detailed organizations. It is inquired whether in
such conditions organizations are run in the passions of all Stakeholders. For that reason, transparency is an important phase to
CSR. It reveals companies’ perform to community analysis and indicates that a company principles the views of its
stakeholders.
4.1.4Social media
There is no doubt that social networking is now enjoying an important part in driving CSR in Japan. Only in Chinese suppliers
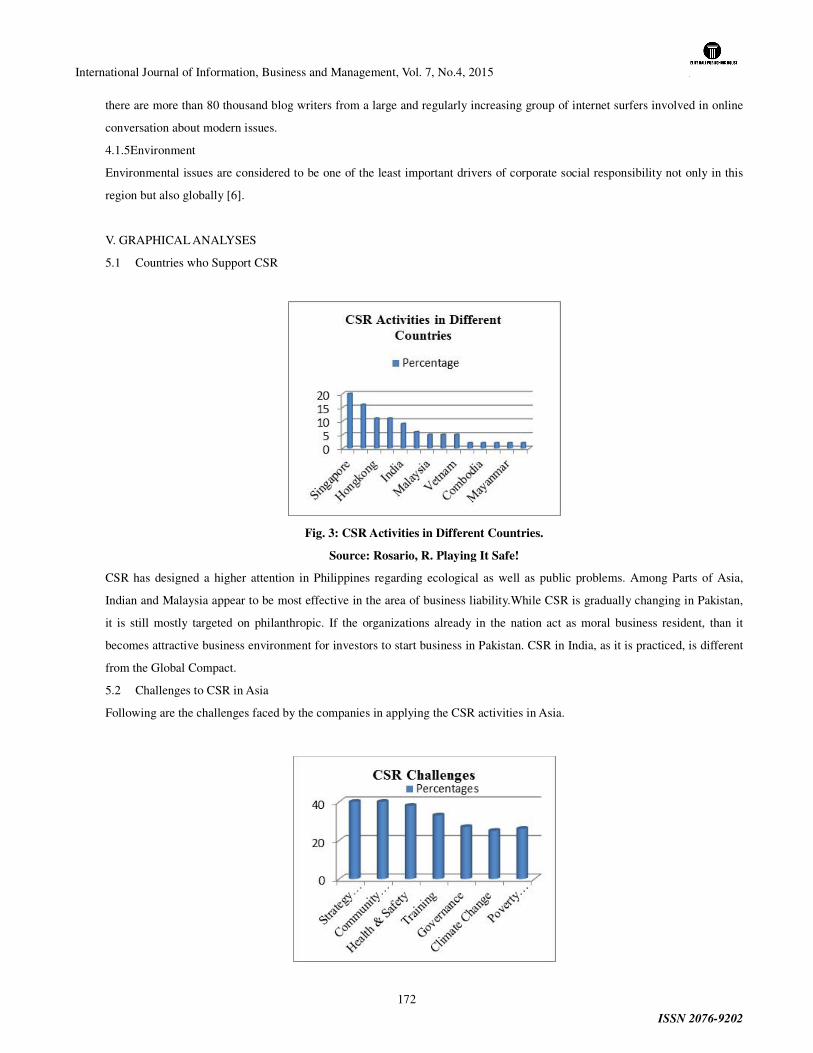
International Journal of Information, Business and Management, Vol. 7, No.4, 2015
ISSN 2076-9202
172
there are more than 80 thousand blog writers from a large and regularly increasing group of internet surfers involved in online
conversation about modern issues.
4.1.5Environment
Environmental issues are considered to be one of the least important drivers of corporate social responsibility not only in this
region but also globally [6].
V. GRAPHICAL ANALYSES
5.1 Countries who Support CSR
Fig. 3: CSR Activities in Different Countries.
Source: Rosario, R. Playing It Safe!
CSR has designed a higher attention in Philippines regarding ecological as well as public problems. Among Parts of Asia,
Indian and Malaysia appear to be most effective in the area of business liability.While CSR is gradually changing in Pakistan,
it is still mostly targeted on philanthropic. If the organizations already in the nation act as moral business resident, than it
becomes attractive business environment for investors to start business in Pakistan. CSR in India, as it is practiced, is different
from the Global Compact.
5.2 Challenges to CSR in Asia
Following are the challenges faced by the companies in applying the CSR activities in Asia.
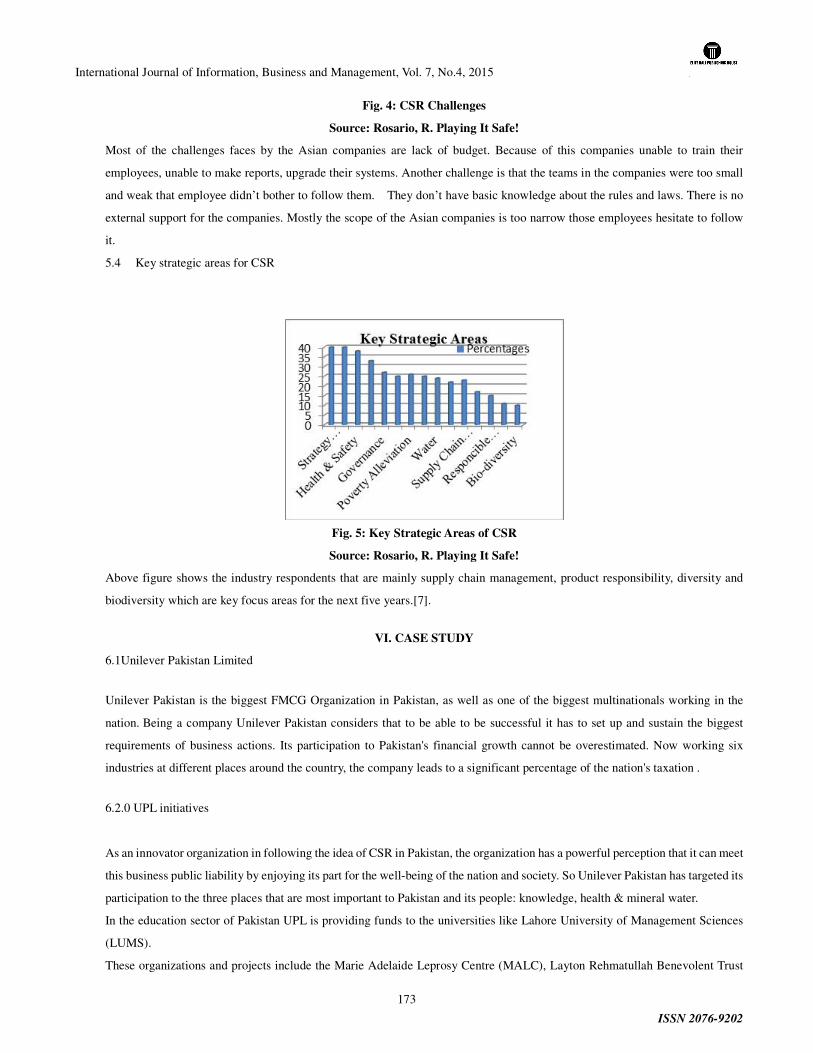
International Journal of Information, Business and Management, Vol. 7, No.4, 2015
ISSN 2076-9202
173
Fig. 4: CSR Challenges
Source: Rosario, R. Playing It Safe!
Most of the challenges faces by the Asian companies are lack of budget. Because of this companies unable to train their
employees, unable to make reports, upgrade their systems. Another challenge is that the teams in the companies were too small
and weak that employee didn’t bother to follow them. They don’t have basic knowledge about the rules and laws. There is no
external support for the companies. Mostly the scope of the Asian companies is too narrow those employees hesitate to follow
it.
5.4 Key strategic areas for CSR
Fig. 5: Key Strategic Areas of CSR
Source: Rosario, R. Playing It Safe!
Above figure shows the industry respondents that are mainly supply chain management, product responsibility, diversity and
biodiversity which are key focus areas for the next five years.[7].
VI. CASE STUDY
6.1Unilever Pakistan Limited
Unilever Pakistan is the biggest FMCG Organization in Pakistan, as well as one of the biggest multinationals working in the
nation. Being a company Unilever Pakistan considers that to be able to be successful it has to set up and sustain the biggest
requirements of business actions. Its participation to Pakistan's financial growth cannot be overestimated. Now working six
industries at different places around the country, the company leads to a significant percentage of the nation's taxation .
6.2.0 UPL initiatives
As an innovator organization in following the idea of CSR in Pakistan, the organization has a powerful perception that it can meet
this business public liability by enjoying its part for the well-being of the nation and society. So Unilever Pakistan has targeted its
participation to the three places that are most important to Pakistan and its people: knowledge, health & mineral water.
In the education sector of Pakistan UPL is providing funds to the universities like Lahore University of Management Sciences
(LUMS).
These organizations and projects include the Marie Adelaide Leprosy Centre (MALC), Layton Rehmatullah Benevolent Trust
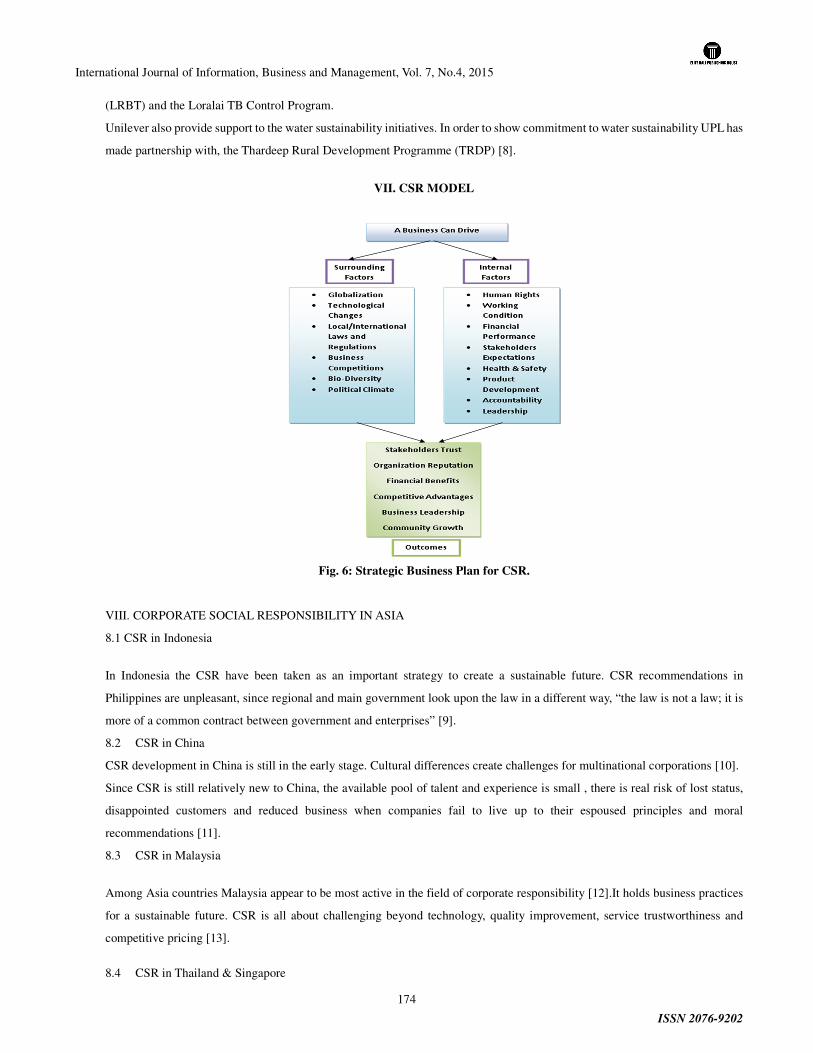
International Journal of Information, Business and Management, Vol. 7, No.4, 2015
ISSN 2076-9202
174
(LRBT) and the Loralai TB Control Program.
Unilever also provide support to the water sustainability initiatives. In order to show commitment to water sustainability UPL has
made partnership with, the Thardeep Rural Development Programme (TRDP) [8].
VII. CSR MODEL
Fig. 6: Strategic Business Plan for CSR.
VIII. CORPORATE SOCIAL RESPONSIBILITY IN ASIA
8.1 CSR in Indonesia
In Indonesia the CSR have been taken as an important strategy to create a sustainable future. CSR recommendations in
Philippines are unpleasant, since regional and main government look upon the law in a different way, “the law is not a law; it is
more of a common contract between government and enterprises” [9].
8.2 CSR in China
CSR development in China is still in the early stage. Cultural differences create challenges for multinational corporations [10].
Since CSR is still relatively new to China, the available pool of talent and experience is small , there is real risk of lost status,
disappointed customers and reduced business when companies fail to live up to their espoused principles and moral
recommendations [11].
8.3 CSR in Malaysia
Among Asia countries Malaysia appear to be most active in the field of corporate responsibility [12].It holds business practices
for a sustainable future. CSR is all about challenging beyond technology, quality improvement, service trustworthiness and
competitive pricing [13].
8.4 CSR in Thailand & Singapore
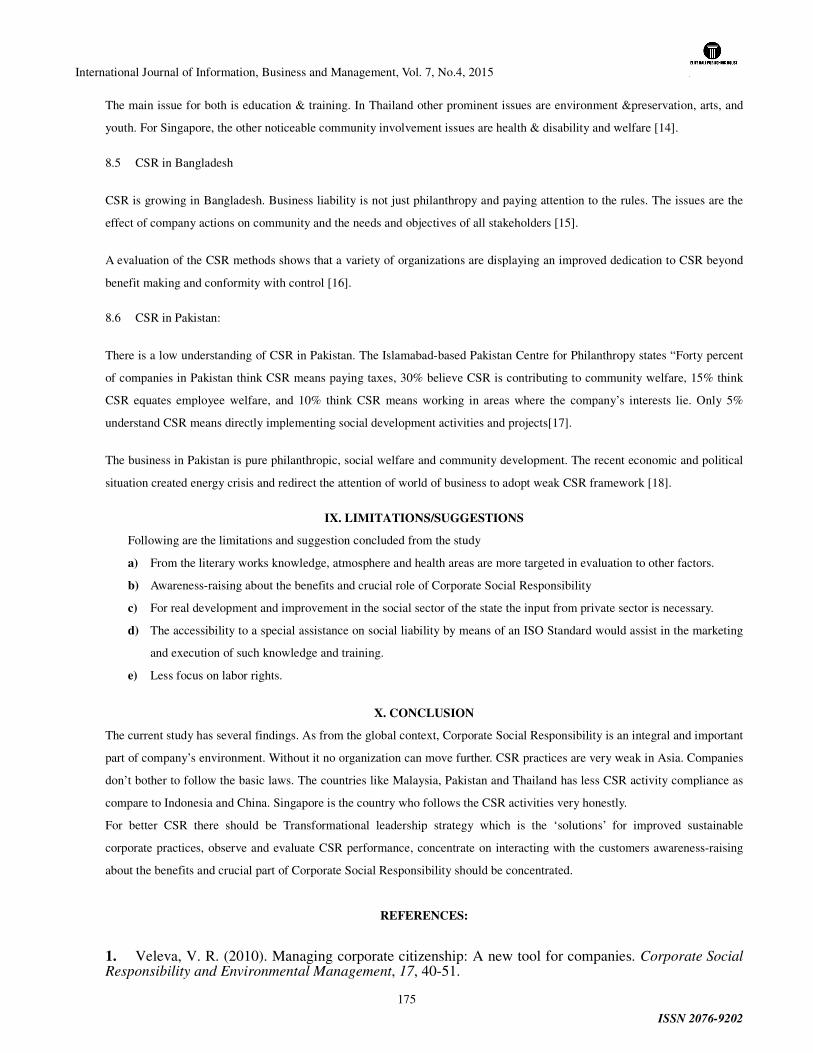
International Journal of Information, Business and Management, Vol. 7, No.4, 2015
ISSN 2076-9202
175
The main issue for both is education & training. In Thailand other prominent issues are environment &preservation, arts, and
youth. For Singapore, the other noticeable community involvement issues are health & disability and welfare [14].
8.5 CSR in Bangladesh
CSR is growing in Bangladesh. Business liability is not just philanthropy and paying attention to the rules. The issues are the
effect of company actions on community and the needs and objectives of all stakeholders [15].
A evaluation of the CSR methods shows that a variety of organizations are displaying an improved dedication to CSR beyond
benefit making and conformity with control [16].
8.6 CSR in Pakistan:
There is a low understanding of CSR in Pakistan. The Islamabad-based Pakistan Centre for Philanthropy states “Forty percent
of companies in Pakistan think CSR means paying taxes, 30% believe CSR is contributing to community welfare, 15% think
CSR equates employee welfare, and 10% think CSR means working in areas where the company’s interests lie. Only 5%
understand CSR means directly implementing social development activities and projects[17].
The business in Pakistan is pure philanthropic, social welfare and community development. The recent economic and political
situation created energy crisis and redirect the attention of world of business to adopt weak CSR framework [18].
IX. LIMITATIONS/SUGGESTIONS
Following are the limitations and suggestion concluded from the study
a) From the literary works knowledge, atmosphere and health areas are more targeted in evaluation to other factors.
b) Awareness-raising about the benefits and crucial role of Corporate Social Responsibility
c) For real development and improvement in the social sector of the state the input from private sector is necessary.
d) The accessibility to a special assistance on social liability by means of an ISO Standard would assist in the marketing
and execution of such knowledge and training.
e) Less focus on labor rights.
X. CONCLUSION
The current study has several findings. As from the global context, Corporate Social Responsibility is an integral and important
part of company’s environment. Without it no organization can move further. CSR practices are very weak in Asia. Companies
don’t bother to follow the basic laws. The countries like Malaysia, Pakistan and Thailand has less CSR activity compliance as
compare to Indonesia and China. Singapore is the country who follows the CSR activities very honestly.
For better CSR there should be Transformational leadership strategy which is the ‘solutions’ for improved sustainable
corporate practices, observe and evaluate CSR performance, concentrate on interacting with the customers awareness-raising
about the benefits and crucial part of Corporate Social Responsibility should be concentrated.
REFERENCES:
1. Veleva, V. R. (2010). Managing corporate citizenship: A new tool for companies. Corporate Social Responsibility and Environmental Management, 17, 40-51.
International Journal of Information, Business and Management, Vol. 7, No.4, 2015
ISSN 2076-9202
176
2. Godbole, G. (2007). Corporate Social Responsibility and Children’s Right in South Asia, Published by Save the Children Sweden.
3. Carroll, Archie B. (1991). The pyramid of Corporate Social Responsibility: Towards the moral Management of Organizational Stakeholders, Business Horizons. 4-7.
4. Blair, M. E., Levine, B., A. J., &Rippin, T. M. (2004). The UN's role in corporate social responsibility.
5. Council for Better Corporate Citizenship (2002).International Corporate Social Responsibility (CSR).
6. Lauring, J., & Thomsen, C. (2009). Collective ideals and practices in sustainable development.Social responsibilities of the Businessman.
7. Rosario, R. Playing It Safe!The Asian Institute of Management’s.Sr. Center for Corporate Social Responsibility and the Singapore Compact for CSR.
8. Uni liver Pakistanlimited (Pesticide Incident), Prin.L.N.Welingkar Institute Of Management Development & Research, October 2009
9. Prayukvong, P. & Olsen M. (2009). Promoting Corporate Social Responsibility in Thailand and the Role of Volunteerism.The Network of NGO and Business Partnerships for Sustainable Development AsiaDepartment. Pg 18-20.
10. Fang, F.(2010).Corporate Social Responsibility in China: A Study on corporate social responsibility for multinational corporations in China. Pg 31-34.
11. Jiali An. (2013). CSR Guidelines for Multinational Corporation in China.
12. Ismail, R. (2011). Development & Awareness of Corporate Social Responsibility in Perspective of Bangladesh. Asian Transactions on Basic & Applied Sciences, 1(3), 12-28.
13. Ogrizek, M. (2002). The Effect of Corporate Social Responsibility on the Branding of Financial Services.Journal of Financial Services Marketing.Vol 6, Pg. 215-228
14. Baskin, J. (2005). Corporate Social Responsibility Practices of Emerging Market Companies-A Fact Finding Study. Working Papers On International Investment.
15. Buhmann, K. (2005). Corporate Social Responsibility in China: Current Issues and Their Relevance for Implementation of Law. The Copenhagen Journal of Asian Studies 22.
16. Quazi, A., Rahman, Z. (2007). A Developing Country Perspective of Corporate Social Responsibility: A Test Case of Bangladesh. Pg. 2791-2793.
17. (2012)Corporate Responsibility and Sustainable Economic Development in China: Implications for Business.
18. Standard Report on “CSR in Asia- The Real Picture”, Lloyd's Register Quality Assurance (2012).
International Journal of Information, Business and Management, Vol. 7, No.4, 2015
ISSN 2076-9202
177
FULL COMMITEMENT OF TOP MANAGEMENT IN MACEDONIAN
HIGH EDUCATION INSTITUTIONS
1Elizabeta Mitreva, PhD, Nako Taskov, PhD, 2Julijana Sazdova
¹Faculty of Tourism and Business Logistics, University "Goce Delcev" - Stip, Macedonia 2Msc. Candidate at Faculty of Tourism and Business Logistics, Goce Delcev University - Stip, Macedonia
Mail: [email protected] ; [email protected]
Abstract
In this paper is given integral methodology for the design of TQM (Total Quality Management)
system in higher education institutions and its implementation in practice of higher education, as well as
actions to be taken to build a system of quality assurance. The success of the application of TQM strategy
depends on the commitment of the academic staff and administration and their motivation. Although the
philosophy of total quality management (TQM) is deeply involved in many higher education institutions
and business aspects of European and other countries, it is not sufficiently present in the country and
other developing countries. Especially critical is the long term point of this philosophy, when results do
not come “overnight”. Globalization allows creating a European area of higher education in order to
facilitate joint knowledge creation and greater mobility of students and academic staff. Thus Europe has
become a common space of higher education, the rules and principles designed to work together and to
use the common results.
Key words: TQM strategy, internal standardization, statistical process control, quality assurance, cost
analysis methodologies
Introduction
National Programme for the Development of Education in Macedonia (www.npro.edu.mk) expresses the
desire of the state to bring about change in education that will enable compatibility of study programs,
recognition and recognition of degrees awarded at all levels of education in European educational space
and greater employability in the European labour market. The structure of the system of quality assurance
in higher education institutions correspond to regulation, although there is a deep gap between
management of quality and culture of quality. Higher education institutions are aware of the need to
redesign the profile and curriculum and quality of teaching depends primarily responsible for the
reassessment of values, attractiveness of an innovative learning environment, and in the highest degree
will depend on the leadership of higher education institutions. Macedonian higher education institutions
should accept new TQM strategy and implement it in educational processes.
The essence of TQM (Total Quality Management) strategy
TQM philosophy is embodied in many higher education institutions in the world, and its application
means new key change in the approach to the quality of the educational process, according to Kano
(1996). The first change concerns the establishment of a process of continuous improvement in all
International Journal of Information, Business and Management, Vol. 7, No.4, 2015
ISSN 2076-9202
178
segments of higher education institutions with the involvement of academic staff, and the other, to meet
the needs of all users (students, teachers, Ministry of Education, employment and professional bodies,
society general and international forum) with the results of the institution.
Factors for successful implementation of TQM strategy in higher education institutions
A condition for successful implementation of TQM strategy in higher education institutions is having
modern management, particularly strong leadership (according Ciampa, 2005). Leadership Initiative
includes the top, commitment to TQM philosophy with their active participation, according to academics,
penetration of opinions, proactive work style, teamwork, training, support for successful actions and
achievements. Spreading the TQM conception in higher education institutions requires a particular social
and cultural level of the middle (habits and mentality of employees), infrastructure creation and
development of corporate culture in higher education institutions. In this paper we make an effort to,
using the principles of TQM, develop a universal, integrated methodology for design and
implementation of TQM system in higher education Mitreva (2010). This methodology should help to
give useful guidance to all higher education institutions tend to be educational institutions "world class".
1. INTEGRAL METHODOLOGY FOR DESIGNING AND IMPLEMENTING TQM SYSTEM IN
MACEDONIAN HIGHER EDUCATION INSTITUTIONS
The need of redesign or reengineering can occur in educational institutions who want to leave the
traditional approach by introducing a new, modern approach to education and science. Both approaches
are based on the same tenets: competence, ability and knowledge, but they are applied differently
according to the country's technological development and higher education systems therein.
Although the philosophy of total quality management (TQM) is deeply involved in many higher
education institutions and business aspects of European and other countries, it is not sufficiently present
in the country and other developing countries. Especially critical is the long term point of this philosophy,
when results do not come “overnight”. Globalization allows creating a European area of higher education
in order to facilitate joint knowledge creation and greater mobility of students and academic staff. Thus
Europe has become a common space of higher education, the rules and principles designed to work
together and to use the common results.
In this paper is given integral methodology for the design of TQM (Total Quality Management) system in
higher education institutions and its implementation in practice of higher education, as well as actions to
be taken to build a system of quality assurance. The success of the application of TQM strategy depends
on the commitment of the academic staff and administration and their motivation.
Integral methodology for designing and implementing TQM system, as suggested in this paper, consists
of more methodologies Mitreva (2010): Methodology for subsystem-internal standardization;
Methodology for subsystem-Statistical Process Control (SPC); Methodology for analysis of total cost of a
given process; Methodology for subsystem-education; Methodology about evaluating the success of the
designed and implemented system in TQM (Audit). Basis in creating this model is redesign, after that, it
starts a new phase of business-continuous improvement, or turning round Deming quality
(Plan-Do-Check-Act).
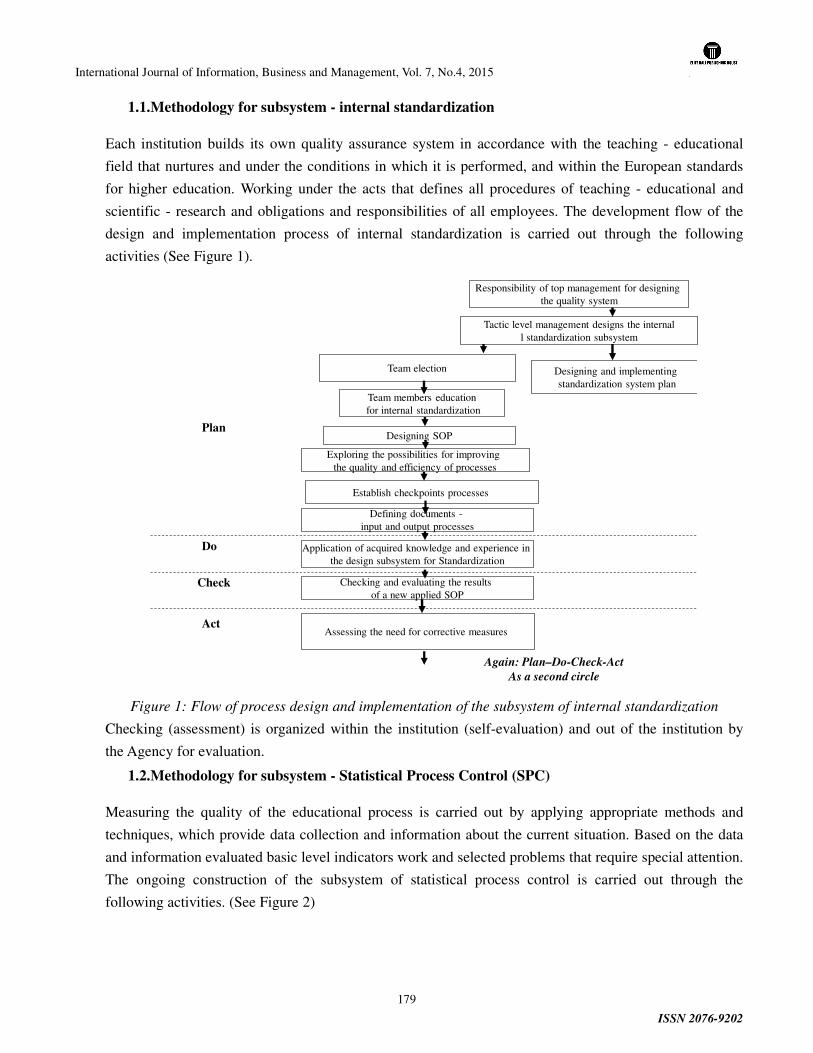
International Journal of Information, Business and Management, Vol. 7, No.4, 2015
ISSN 2076-9202
179
1.1.Methodology for subsystem - internal standardization
Each institution builds its own quality assurance system in accordance with the teaching - educational
field that nurtures and under the conditions in which it is performed, and within the European standards
for higher education. Working under the acts that defines all procedures of teaching - educational and
scientific - research and obligations and responsibilities of all employees. The development flow of the
design and implementation process of internal standardization is carried out through the following
activities (See Figure 1).
Responsibility of top management for designing the quality system
Tactic level management designs the internall standardization subsystem
Team election Designing and implementingstandardization system plan
Team members educationfor internal standardization
Exploring the possibilities for improvingthe quality and efficiency of processes
Establish checkpoints processes
Designing SOP
Application of acquired knowledge and experience inthe design subsystem for Standardization
Checking and evaluating the resultsof a new applied SOP
Assessing the need for corrective measures
Again: Plan–Do-Check-Act
As a second circle
Act
Defining documents -input and output processes
Do
Check
Plan
Figure 1: Flow of process design and implementation of the subsystem of internal standardization
Checking (assessment) is organized within the institution (self-evaluation) and out of the institution by
the Agency for evaluation.
1.2.Methodology for subsystem - Statistical Process Control (SPC)
Measuring the quality of the educational process is carried out by applying appropriate methods and
techniques, which provide data collection and information about the current situation. Based on the data
and information evaluated basic level indicators work and selected problems that require special attention.
The ongoing construction of the subsystem of statistical process control is carried out through the
following activities. (See Figure 2)
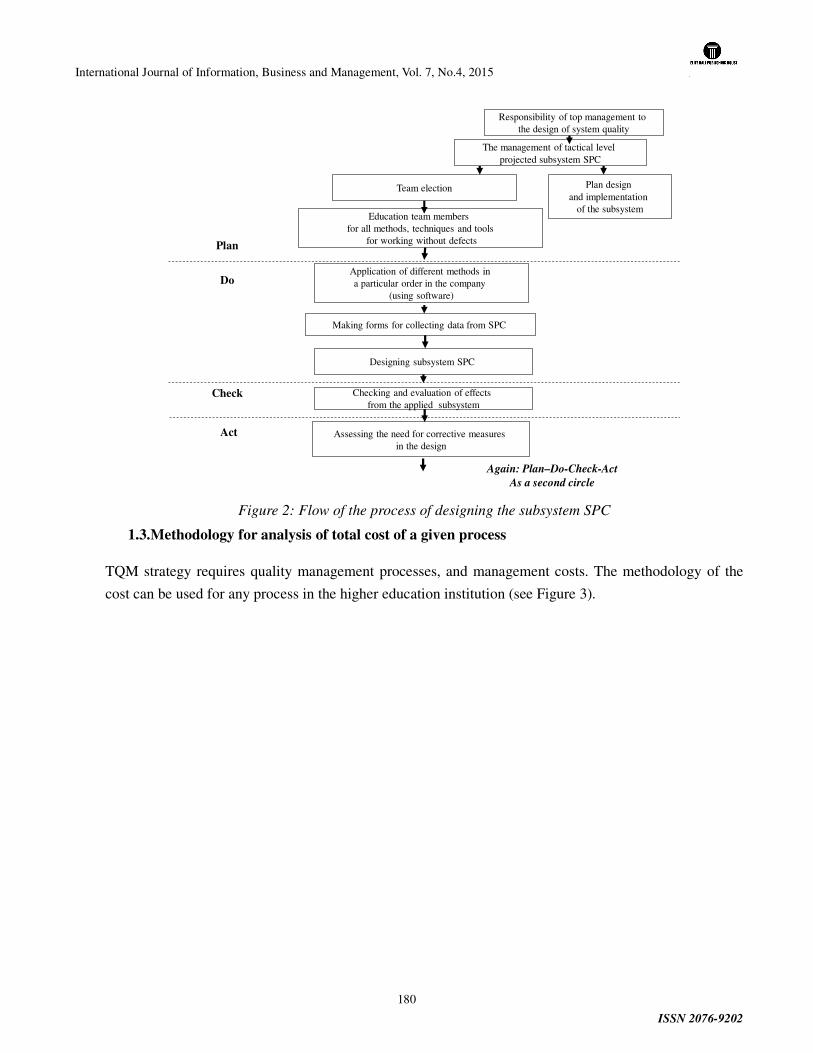
International Journal of Information, Business and Management, Vol. 7, No.4, 2015
ISSN 2076-9202
180
Responsibility of top management tothe design of system quality
The management of tactical levelprojected subsystem SPC
Team election Plan designand implementation
of the subsystemEducation team members
for all methods, techniques and toolsfor working without defects
Application of different methods ina particular order in the company
(using software)
Designing subsystem SPC
Checking and evaluation of effectsfrom the applied subsystem
Assessing the need for corrective measuresin the design
Again: Plan–Do-Check-Act
As a second circle
Act
Making forms for collecting data from SPC
Do
Check
Plan
Figure 2: Flow of the process of designing the subsystem SPC
1.3.Methodology for analysis of total cost of a given process
TQM strategy requires quality management processes, and management costs. The methodology of the
cost can be used for any process in the higher education institution (see Figure 3).
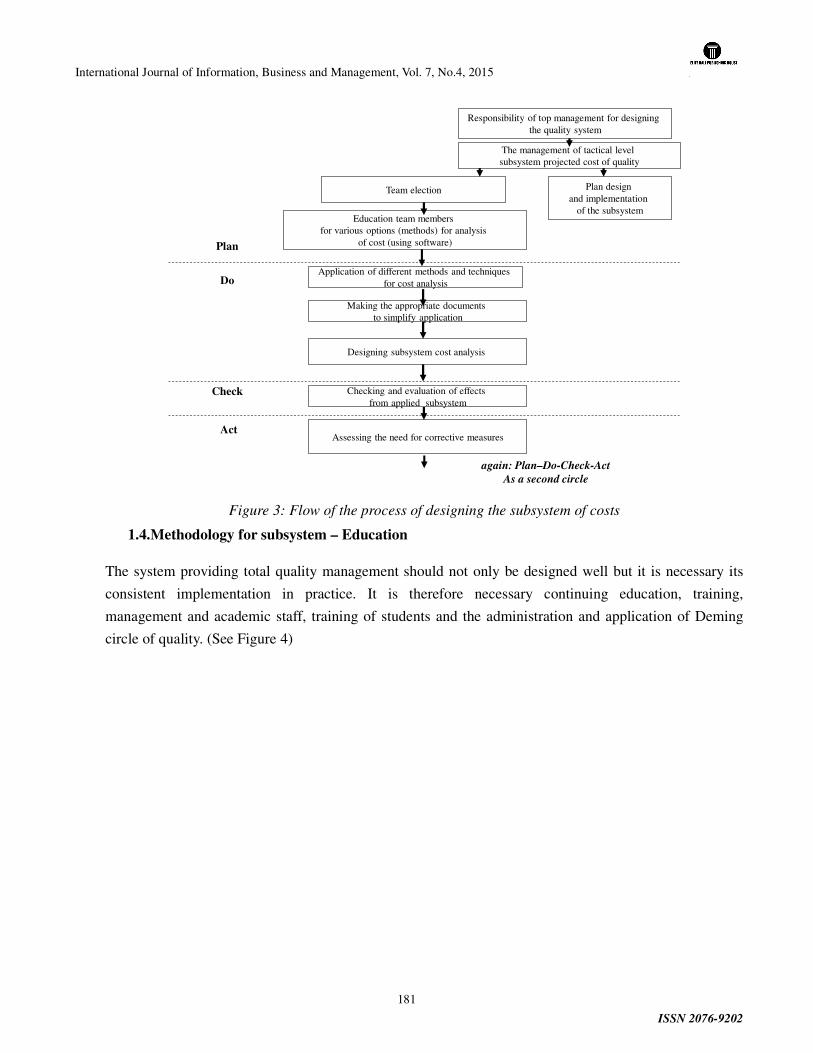
International Journal of Information, Business and Management, Vol. 7, No.4, 2015
ISSN 2076-9202
181
Responsibility of top management for designing the quality system
The management of tactical levelsubsystem projected cost of quality
Team election Plan designand implementation
of the subsystemEducation team members
for various options (methods) for analysisof cost (using software)
Application of different methods and techniquesfor cost analysis
Designing subsystem cost analysis
Checking and evaluation of effectsfrom applied subsystem
Assessing the need for corrective measures
again: Plan–Do-Check-Act
As a second circle
Act
Making the appropriate documentsto simplify application
Do
Check
Plan
Figure 3: Flow of the process of designing the subsystem of costs
1.4.Methodology for subsystem – Education
The system providing total quality management should not only be designed well but it is necessary its
consistent implementation in practice. It is therefore necessary continuing education, training,
management and academic staff, training of students and the administration and application of Deming
circle of quality. (See Figure 4)
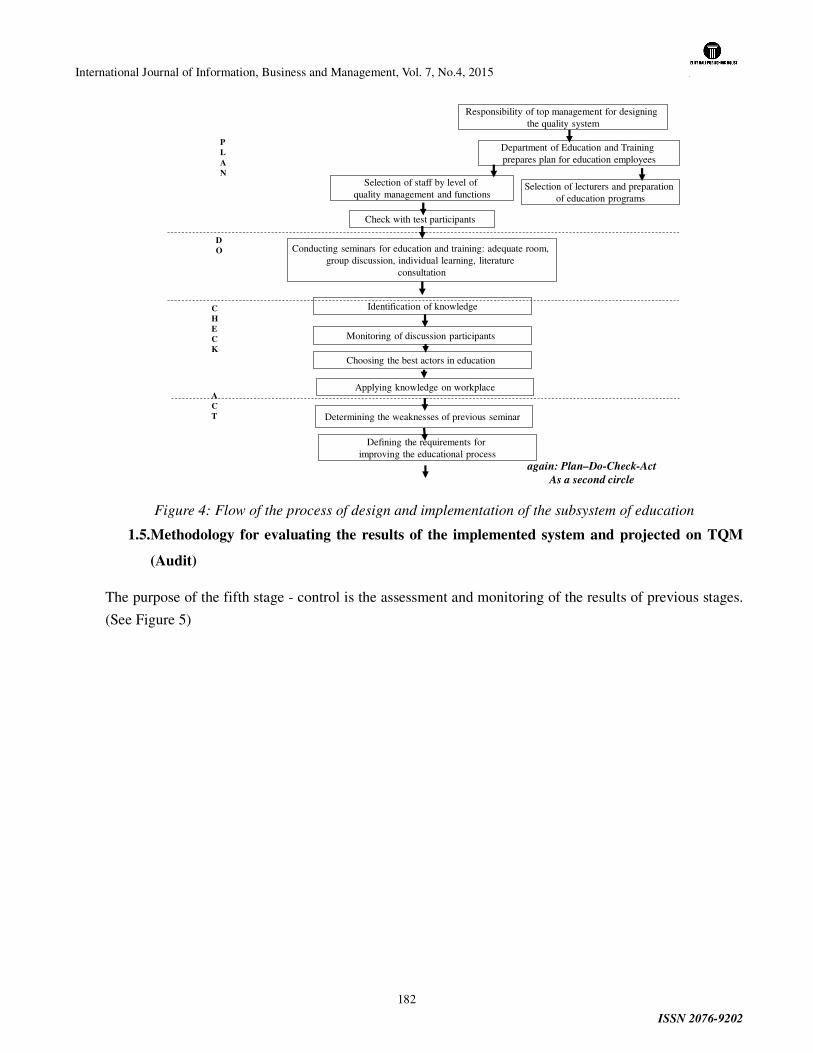
International Journal of Information, Business and Management, Vol. 7, No.4, 2015
ISSN 2076-9202
182
Responsibility of top management for designing the quality system
Department of Education and Trainingprepares plan for education employees
Selection of staff by level ofquality management and functions
Selection of lecturers and preparationof education programs
Check with test participants
Conducting seminars for education and training: adequate room,group discussion, individual learning, literature
consultation
Identification of knowledge
Monitoring of discussion participants
Applying knowledge on workplace
Determining the weaknesses of previous seminar
Defining the requirements forimproving the educational process
again: Plan–Do-Check-Act
As a second circle
P
L
A
N
D
O
C
H
E
C
K
A
C
T
Choosing the best actors in education
Figure 4: Flow of the process of design and implementation of the subsystem of education
1.5.Methodology for evaluating the results of the implemented system and projected on TQM
(Audit)
The purpose of the fifth stage - control is the assessment and monitoring of the results of previous stages.
(See Figure 5)
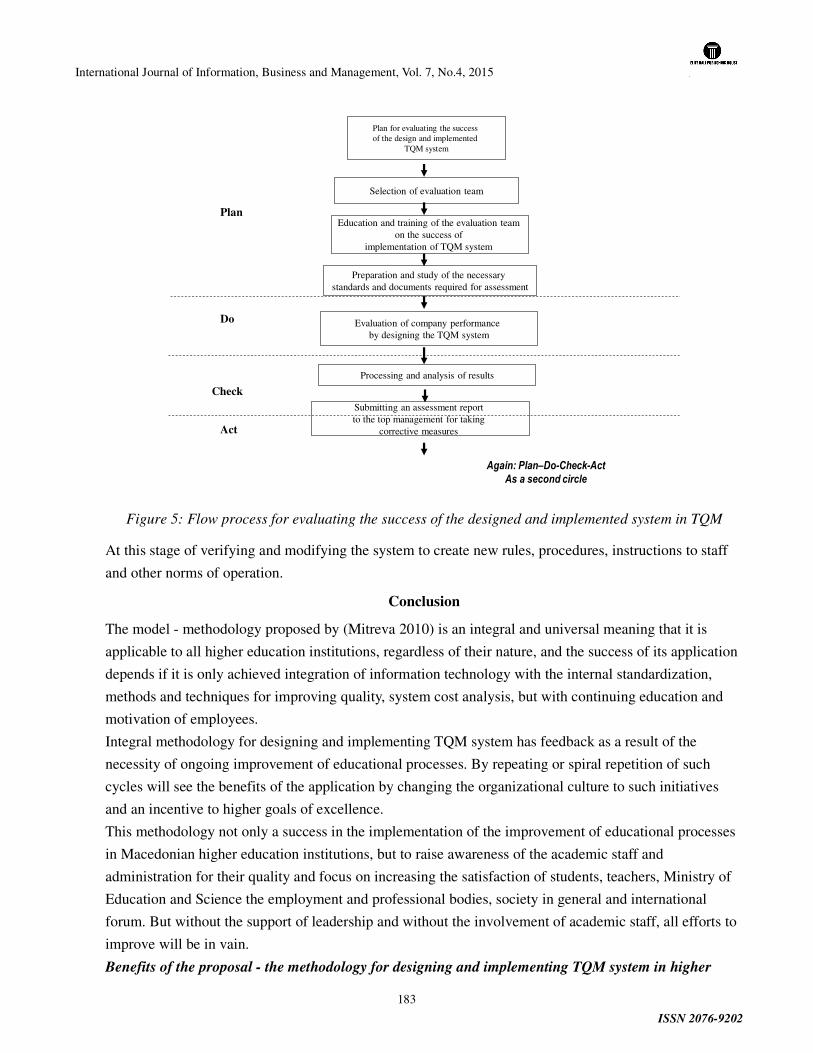
International Journal of Information, Business and Management, Vol. 7, No.4, 2015
ISSN 2076-9202
183
Selection of evaluation team
Plan for evaluating the successof the design and implemented
TQM system
Education and training of the evaluation teamon the success of
implementation of TQM system
Preparation and study of the necessarystandards and documents required for assessment
Evaluation of company performanceby designing the TQM system
Processing and analysis of results
Submitting an assessment reportto the top management for taking
corrective measures
Again: Plan–Do-Check-Act
As a second circle
Act
Do
Check
Plan
Figure 5: Flow process for evaluating the success of the designed and implemented system in TQM
At this stage of verifying and modifying the system to create new rules, procedures, instructions to staff
and other norms of operation.
Conclusion
The model - methodology proposed by (Mitreva 2010) is an integral and universal meaning that it is
applicable to all higher education institutions, regardless of their nature, and the success of its application
depends if it is only achieved integration of information technology with the internal standardization,
methods and techniques for improving quality, system cost analysis, but with continuing education and
motivation of employees.
Integral methodology for designing and implementing TQM system has feedback as a result of the
necessity of ongoing improvement of educational processes. By repeating or spiral repetition of such
cycles will see the benefits of the application by changing the organizational culture to such initiatives
and an incentive to higher goals of excellence.
This methodology not only a success in the implementation of the improvement of educational processes
in Macedonian higher education institutions, but to raise awareness of the academic staff and
administration for their quality and focus on increasing the satisfaction of students, teachers, Ministry of
Education and Science the employment and professional bodies, society in general and international
forum. But without the support of leadership and without the involvement of academic staff, all efforts to
improve will be in vain.
Benefits of the proposal - the methodology for designing and implementing TQM system in higher
International Journal of Information, Business and Management, Vol. 7, No.4, 2015
ISSN 2076-9202
184
education institutions
Benefits of the methodology for designing and implementing TQM in higher education system are:
the application of internal standardization improves responsibility of academic staff in the implementation
and administration of the educational process;
the application of statistical methods and techniques to ensure the quality of education;
application software packages increases performance in the application of statistical methods and
techniques;
by analyzing the cost of quality can be controlled losses and to reduce them to the minimum.
Besides these other important effects are expected to be achieved, such as:
involvement of all employees in achieving the quality of the educational process;
employee commitment to improving the quality of education;
full commitment of top management to the system in TQM and its continuous improvement;
ability to solve problems at all levels;
small but significant improvements in educational processes and services;
optimization of the educational process;
disposing responsibility for decision-making at lower levels.
Without the commitment of top management to set goals for the quality of the educational process and
consistency in their implementation, these efforts will only be spending time and money, while at the
same time will reduce the possibility of following such a successful initiative.
It should be emphasized that the benefits of the introduction of this model are not seen immediately, but
in the long run. But it should not be a reason for the initial failure of the initiative, because quality is a
long term process.
The benefits of implementing this model not only increase the commitment of top management and
academic staff to improve the educational process, but achieving satisfaction of students, parents, teachers
and society, we will continue to serve as the driving force for continuous improvement.
However, the conclusion remains that there is a clear determination of the Macedonian higher education
institutions for the care and responsibility for ensuring and improving the quality of education, and thus
increased the interest for cooperation with universities in the country, the region and Europe.
References
1. Ciampa, D., (2005). Almost Ready: How Leaders Move Up, Harvard Business Review 83, No.1.
2. Chepjunoska, V., Donevski, B., (2005). Quality Assurance in Higher Education - A view from Macedonia, Skopje - Bitola, pp. 39-150.
3. EFQM, (1992). Total Quality Management: The European Model for Self-Appraisal, European Foundation for Quality Management.
4. Harung, H.S., (1996). A world-leading learning organization: A case study of Tomra Systems, Oslo, Norway. The Learning Organization: an International Journal, Vol. 3, No. 4, pp. 22-34.
International Journal of Information, Business and Management, Vol. 7, No.4, 2015
ISSN 2076-9202
185
5. Kano, N., (1996). Business Strategies for the 21 sr Century and Attractive Quality Creation, ICQ, Yokohama, pp.105.
6. Mitreva, E., (2011). Model-integral methodology for successful designing and implementing of TQM system in Macedonian companies. International Journal for Quality Research, Vol. 5, No. 4, pp. 255-260.
7. National Programme for Development of Education 2005-2015, (2006), http://www.npro.edu.mk/, 12.08.2013.
8. Mitreva, E., Prodanovska V., (2013). The Management Teams are a Unique Business Potential that can Initiate, Identify and Manage Change within the Organization. In: Applied Social Sciences: Administration and Management. Cambridge Scholars Publishing, Newcastle upon Tyne, UK, pp. 57-65.
9. Prodanovska, V., Mitreva, E., (2012). Incorporation, authorization and encouragement of the employees in order to improve the quality of the educational process. In: Two decades of academic teaching, 18-19 June; Timișoara.
10. Beardwell, I., Holden, L., Claydon, T., (2004). Human Resource Management; A Contemporary Approach, Prentice Hall, Fourth Edition, pp. 124-387.
11. Ishikawa, K., (1995). President Touka Henkau Sozo Gakkai, “Thoughts on risk management “Creativity and risk management”, JUSE, Societas Qualitatis, Vol. 9, No. 3, July/Aug, 5.
12. Juran, J. M., (1988). Juran on Planning for Quality, Free Press, New York, NY.
13. Mitreva, E., Jakovlev, Z., Koteski, C., Kitanov, V., Angelkova, T., (2012). "Analysis of the existing management system in Macedonian companies and the necessity of accepting the TQM philosophy", International Journal of Pure and Applied Sciences and Technology, Vol. 8, pp. 54-63.
14. Woodall, J., Winstanley, D., (1998). Management development: Purposes, processes and prerequisites. In Management development: Strategy and practice, Oxford: Blackwell, pp. 3-17.
International Journal of Information, Business and Management, Vol. 7, No.4, 2015
ISSN 2076-9202
186
“Stock selection abilities and the market timing skills of fund Managers”:
A study with reference to banking sector funds in India.
Vijayalakshmi Sundar
E-mail: [email protected]
Research Assistant, Department of Commerce, Pondicherry University, Puducherry 14, India.
Dr. Aravazhi Irisappane
E-mail: [email protected]
Associate Professor, Department of Commerce, Kanchi Mamunivar Centre for Post-Graduate Studies,
Puducherry 08, India.
ABSTRACT
Mutual fund industry in India facing lots of issues and challenges such as the agents and the sales
executives of the Mutual funds assure higher returns to the investors and the management paint a rosy
picture about the Mutual funds while marketing schemes. In the present study the performance of banking
sector fund is evaluated in terms of stock selectivity abilities and market timing skills of fund manager.
We have used Jensen’s measure, Fanma’s Net selectivity model and Treynor and Mazuy’s Model .The
study indicates that majority of Mutual fund Managers did have sufficient market timing ability. In case
of net selectivity. With regards to market timing skills, the entire portfolio managers were able to position
their portfolios based on market movements. The Fund Manager of Sundaram Financial Services
Opportunities could be credited with the highest correct market followed by Sahara Banking and
Financial Services and Reliance Banking Fund. Other funds such as ICICI Pru Banking & Financial
Services, UTI-Banking Sector and Religare Invesco Banking also showing positive t- statistic estimates.
Keywords: Mutual Funds, Performance Evaluation, Banking Funds
International Journal of Information, Business and Management, Vol. 7, No.4, 2015
ISSN 2076-9202
187
Acronyms: Net Asset Value (NAV), Unit Trust of India (UTI), Bombay Stock Exchange(BSE), Jensen’s
Alpha (JA), Fama’ s Net Selectivity Measure (FNSM), Treynor and Mazuy Model (TMM)
1. INTRODUCTION
The financial services in India have undergone revolutionary changes over the years and had become
more sophisticated, in response to the varied needs of the economy. The process of financial sector
reforms, economic liberalization and globalization of Indian Capital Market had generated and augmented
the interest of the investors in equity. Though the investors today are having knowledge about stock
market dealings due to the Securities Exchange Board of India (SEBI) awareness programs etc., but lack
of professional expertise, the common investors are still hesitant to invest their hard earned money in the
corporate securities. The advent of mutual funds Mutual fund has helped in garnering the investible funds
of this category of investors in a significant way. As professional experts manage MFs, investment in
them relieves investors from the emotional stress involved in buying and selling of securities.
The Mutual fund industry in India has passed through several distinct phases namely,
formation of UTI (Unit Trust of India) in 1964, entry of public sector funds in 1987 and then the
entry of the private sector funds in 1993. The fourth phase is marked by the bifurcation of UTI
into two separate entities in February 2003 viz., Specified Undertaking of the UTI and the UTI
mutual fund Limited. In the later part of nineties, the industry has also gone through some degree
of consolidation through mergers and acquisitions. Over the years, Mutual funds have redefined
the financial landscape of investors in India. There are several different ways an investor can
diversify a portfolio, such as the different categories, several different asset classes etc., but
another common way to diversify is between the various sectors of the economy. This is usually
accomplished with Mutual funds that concentrate in one of the major sectors.
Feature of the sector is that it invest in the securities of only those sectors or industries as
specified in the offer documents. The returns in these funds are reliant on the performance of the
International Journal of Information, Business and Management, Vol. 7, No.4, 2015
ISSN 2076-9202
188
respective sectors/industries. The point is fund managers are bullish on most sectors, which makes a solid
enough situation for a sector allocation. While no one is signifying that pushing all the eggs in one basket
is a worthy idea, a well-thought out portfolio approach, combining the benefits of diversification as well
as a limited allocation to choice sectors with a positive outlook may be worth a try.
The banking sector is very much connected with the economy of the country. The GDP growth for
the financial year 2013 was predictable at 7.6 per cent, so the economy is anticipated to improve and be
back on the growth track in FY13. But Indian economy had recorded 5 percent growth in 2012-13.
Stating that the basics of the Indian economy are strong, as Prime Minister Manmohan Singh has said
GDP will progress in the second half of fiscal 2013 -14 and that the government is commitment to get
back to a sustainable growth rate of 8-9 per cent. This will also result in the banking space witnessing an
emission in growth in business next fiscal year.
Currently, Indian banks face several challenges, such as increase in interest rates on saving
deposits, possible deregulation of interest rates on saving deposits, a tighter monetary policy, a large
government deficit, increased stress some sectors such as, State utilities, airlines, and microfinance,
restructured loan accounts, unamortised pension/gratuity liabilities and increasing infrastructure loans.
With the advent of the process of liberalisation in the early ’nineties, the demands on banks’ resources and
capabilities increased as banks had to match the challenges of being financial service providers in a
globalised, competitive environment.
This posed a dual challenge for the banking industry. The first challenge was to manage the
growing needs of their existing customer segments and business locations for better and more efficient
services, and the second was, how to expand the reach of their services and business beyond the
traditional services and locations, which had large socio-economic implications because large parts of the
population did not have access to even basic banking services. Increased use of information technology
emerged as the key to meeting these challenges. Several measures were mooted at the level of the
Government, the Reserve Bank of India (RBI) and industry, which provided an impetus to adoption of
technology in the banking sector.
International Journal of Information, Business and Management, Vol. 7, No.4, 2015
ISSN 2076-9202
189
2. STATEMENT OF A PROBLEM
Various studies show that Mutual fund industry in India facing lots of issues and
challenges in present days. Some of the major issues related to the performance are the agents and
the sales executives of the Mutual funds assure higher returns to the investors and the management
paint a rosy picture about the Mutual funds while marketing schemes. The Mutual funds in our
country have been quite wrongly promoted as an alternative to equity investing and created very
high expectations in the minds of the investors. The ignorance of the investors about Mutual funds
coupled with aggressive selling by promising higher returns to the investors have resulted into loss
of investors’ confidence due to inability to provide higher returns.
Also Sondhi and Jain (2006) assessed the stock selectivity skills of fund managers using
Jensen’s Alpha (JA) and revealed that performance of open – ended Mutual funds were better than close
ended Mutual fund also size wise performance analysis showed that small size equity Mutual funds
performed better vis-à-vis medium and large funds and performance based on ownership pattern revealed
differential rate of return amongst the various ownership categories. Kader and Kuang (2007),
Vangapandu Rama Devi (2011) and Santhi & Balanaga Gurunathan (2012) used popular models such as
JA, TMM index in their different studies and they examined risk – adjusted performance, selectivity,
timing ability and performance persistence. The empirical study of 60 growth and growth – income
Mutual fund schemes in India done by Sehgal and Jhanwar (2008) results suggested that the evidence on
selectivity improved marginally when higher frequency data such as daily returns are used instead of
monthly returns.
A number of studies have been carried out to evaluate the investment performance of
Mutual funds in India. But there are only few studies that focus on the performance of sector
based funds in India. One of which is the performance evaluation of pharma funds in India by
Shanmugham and Zabiulla (2009).The present study evaluated portfolio manager’s performance is
in terms of stock selectivity skills and market timing abilities. There were few studies conducted

International Journal of Information, Business and Management, Vol. 7, No.4, 2015
ISSN 2076-9202
190
on banking sector funds which were undertaken on banking sector funds for period less than one year.
Hence the present study has been made to analyse the performance of selected banking funds in India for
at least four years and to examine the efficiency of the fund managers in their selectivity and timing skills.
3. OBJECTIVE OF THE STUDY
The objective of the study is to appraise the stock selection abilities and the market timing skills of
Mutual fund Managers.
4. HYPOTHESES
Based on the above objectives, the following hypothesis were set.
H01= There is no significant relationship between fund performance and the stock selection ability of fund
manager.
H02 = There is no significant relationship between fund performance and the market timing skills of fund
manager.
5. METHODOLOGY OF THE STUDY
5.1.SOURCES OF DATA AND PERIOD OF THE STUDY
The study is based on the secondary data. For evaluating the performance the requisite daily NAV
(Net Asset Value) was obtained from Bloomberg database. The daily Bombay Stock Exchange (BSE)
Sensex benchmark return was collected from prowess database provided by Centre for Monitoring Indian
Economy (CMIE). In this study the yield on the 91-day treasury bills of Government of India has been
used as surrogate for riskless return. The weekly published data of T-Bill rate is taken from RBI source
and converted in daily average risk free rate. The present study covers a period of four years spanning
from 1st April 2009 to 31st March 2013.For the purpose of analysis, benchmark portfolio and other
macro-economic factors were collected for the same period. The data for the Banking sector funds
collected for the period are subject to limitations such as continuous operation for the years under study

International Journal of Information, Business and Management, Vol. 7, No.4, 2015
ISSN 2076-9202
191
and hence final sample restricted to six banking sector funds.
5.2.SAMPLING DESIGN
Multi-stage sampling technique is used for the study and the different stages followed are
mentioned below:
The total of 21 Equity banking sector funds are reduced to 19 since funds come under Dividend
categories are ignored.
Among the 19 funds since 11 funds are launched recently after 2012 are also ignored. Final sample
constitutes 6actively traded funds with availability of complete data required for the study for the study
period. Our final six sample funds are mentioned as below:
Table 1: Sample Banking Sector Funds
Sl.No Fund Launch
1 ICICI Pru Banking & Financial Services (ICICIPBFS) 7-Aug-08
2 Reliance Banking Fund(RBF) 22-May-03
3 Religare Invesco Banking (RIB) 17-Jun-08
4 Sahara Banking and Financial Services (SBFS) 26-Aug-08
5 Sundaram Financial Services Opportunities (SFSO) 16-May-08
6 UTI-Banking Sector (UTIBS) 7-Apr-04
5.3.RESEARCH METHOD FOR ANALYSIS
Daily NAV values of the sample schemes for the study period were used for analysis. BSE sensex
index was considered as a benchmark and the yield on the 91-day treasury bills of Government of
India has been used as surrogate for riskless return. Eviews 6, analysis package is used for
estimations.
Appropriate ratios as stated below are used to measure the performance.
a. Fama’ s Net Selectivity Measure (FNSM)
International Journal of Information, Business and Management, Vol. 7, No.4, 2015
ISSN 2076-9202
192
b. Treynor and Mazuy Model (TMM)
6. LIMITATIONS OF THE STUDY
� The study is based only on secondary data which were collected from CMIE Prowess Package,
Bloomberg. The quality of the study depends purely upon the accuracy, reliability and quality of
secondary data.
� The funds chosen for the study are restricted to 6 due to the facts like non-availability of data and
less period of operation of funds.
7. RESULTS:
7.1.JENSEN’S ALPHA (JA)
Jensen (1968) developed a return – generated model for evaluating the performance of managed
portfolios relative to a benchmark. JA is popularly known as ‘alpha’. The measure is based on CAPM and
reflects the difference between the return actually earned on a portfolio and the return the portfolio was
supposed to earn, given its systematic risk (beta). The specification of the JA is given by the following
equation:
)( pfmppfp RRRR εβα +−+=−
Alpha measures the portfolio manager’s performance relative to benchmark while beta measures its
systematic risk. A positive alpha shows that the fund has performed better and has outperformed the
market; while a negative alpha suggests that the fund has underperformed as compared to the market. An
alpha estimate of zero indicates that the fund has just performed what it is expected to. Table 3 presents
the results of JA for the whole period of study from 2009-2013.The analysis of Table 2 reveals that
ICICIPBFS has posted highest positive alpha as a whole, followed by RBF. It indicates that these two
funds have outperformed the market for the period 2009-13.
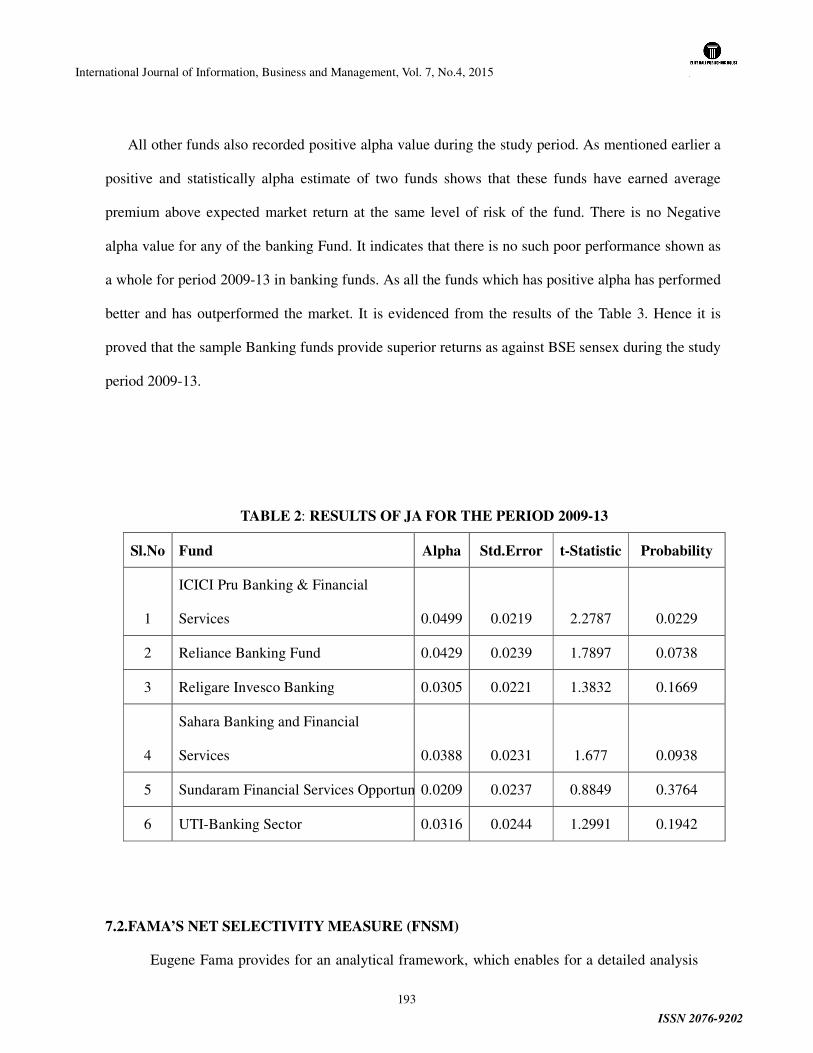
International Journal of Information, Business and Management, Vol. 7, No.4, 2015
ISSN 2076-9202
193
All other funds also recorded positive alpha value during the study period. As mentioned earlier a
positive and statistically alpha estimate of two funds shows that these funds have earned average
premium above expected market return at the same level of risk of the fund. There is no Negative
alpha value for any of the banking Fund. It indicates that there is no such poor performance shown as
a whole for period 2009-13 in banking funds. As all the funds which has positive alpha has performed
better and has outperformed the market. It is evidenced from the results of the Table 3. Hence it is
proved that the sample Banking funds provide superior returns as against BSE sensex during the study
period 2009-13.
TABLE 2: RESULTS OF JA FOR THE PERIOD 2009-13
Sl.No Fund Alpha Std.Error t-Statistic Probability
1
ICICI Pru Banking & Financial
Services 0.0499 0.0219 2.2787 0.0229
2 Reliance Banking Fund 0.0429 0.0239 1.7897 0.0738
3 Religare Invesco Banking 0.0305 0.0221 1.3832 0.1669
4
Sahara Banking and Financial
Services 0.0388 0.0231 1.677 0.0938
5 Sundaram Financial Services Opportunities0.0209 0.0237 0.8849 0.3764
6 UTI-Banking Sector 0.0316 0.0244 1.2991 0.1942
7.2.FAMA’S NET SELECTIVITY MEASURE (FNSM)
Eugene Fama provides for an analytical framework, which enables for a detailed analysis
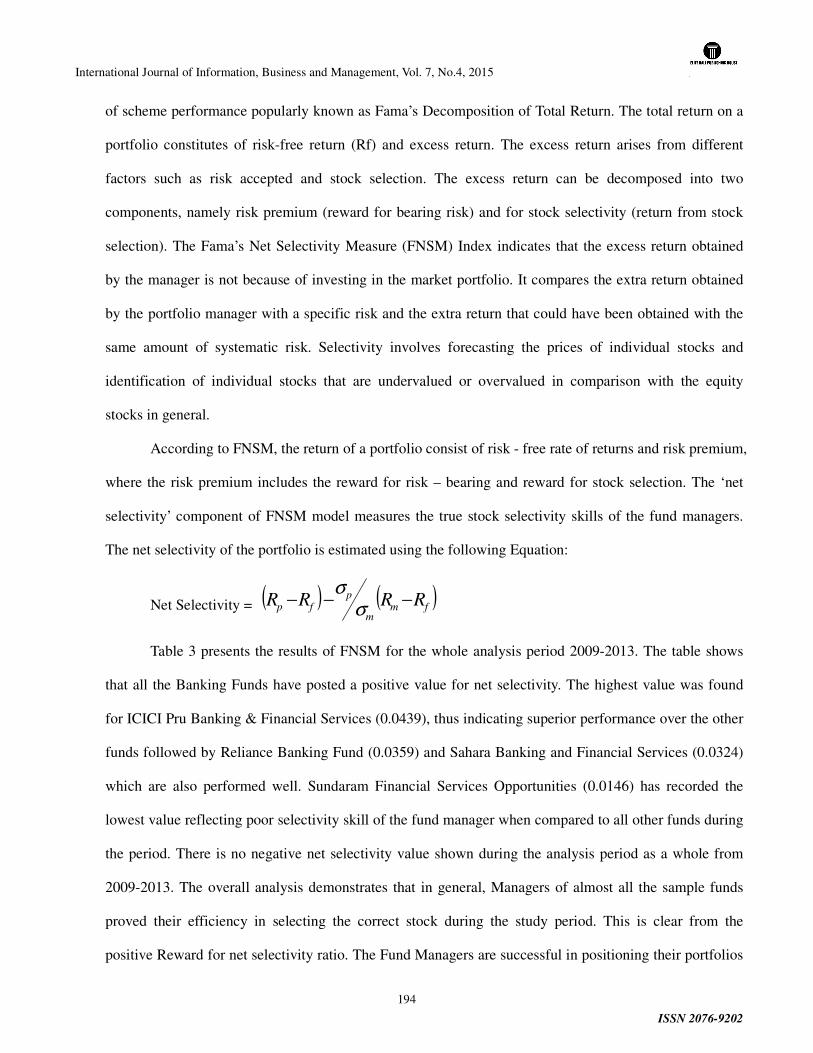
International Journal of Information, Business and Management, Vol. 7, No.4, 2015
ISSN 2076-9202
194
of scheme performance popularly known as Fama’s Decomposition of Total Return. The total return on a
portfolio constitutes of risk-free return (Rf) and excess return. The excess return arises from different
factors such as risk accepted and stock selection. The excess return can be decomposed into two
components, namely risk premium (reward for bearing risk) and for stock selectivity (return from stock
selection). The Fama’s Net Selectivity Measure (FNSM) Index indicates that the excess return obtained
by the manager is not because of investing in the market portfolio. It compares the extra return obtained
by the portfolio manager with a specific risk and the extra return that could have been obtained with the
same amount of systematic risk. Selectivity involves forecasting the prices of individual stocks and
identification of individual stocks that are undervalued or overvalued in comparison with the equity
stocks in general.
According to FNSM, the return of a portfolio consist of risk - free rate of returns and risk premium,
where the risk premium includes the reward for risk – bearing and reward for stock selection. The ‘net
selectivity’ component of FNSM model measures the true stock selectivity skills of the fund managers.
The net selectivity of the portfolio is estimated using the following Equation:
Net Selectivity = )( )(fm
m
pfp RRRR −−−
σσ
Table 3 presents the results of FNSM for the whole analysis period 2009-2013. The table shows
that all the Banking Funds have posted a positive value for net selectivity. The highest value was found
for ICICI Pru Banking & Financial Services (0.0439), thus indicating superior performance over the other
funds followed by Reliance Banking Fund (0.0359) and Sahara Banking and Financial Services (0.0324)
which are also performed well. Sundaram Financial Services Opportunities (0.0146) has recorded the
lowest value reflecting poor selectivity skill of the fund manager when compared to all other funds during
the period. There is no negative net selectivity value shown during the analysis period as a whole from
2009-2013. The overall analysis demonstrates that in general, Managers of almost all the sample funds
proved their efficiency in selecting the correct stock during the study period. This is clear from the
positive Reward for net selectivity ratio. The Fund Managers are successful in positioning their portfolios
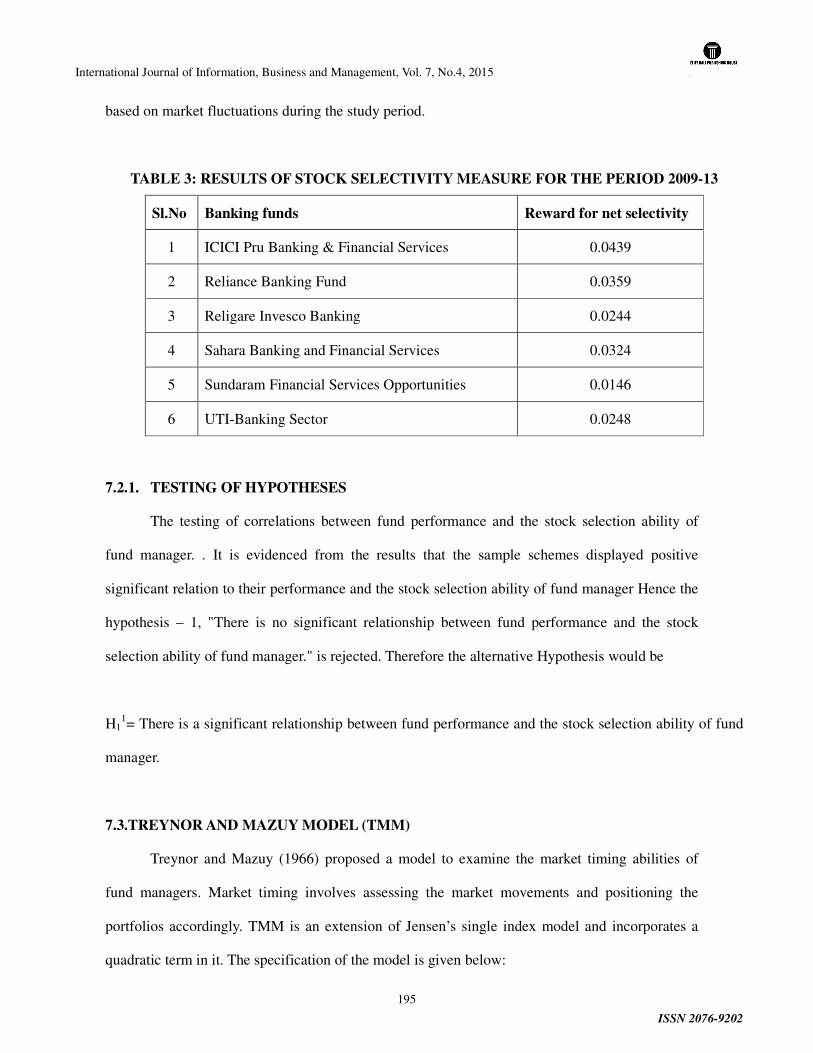
International Journal of Information, Business and Management, Vol. 7, No.4, 2015
ISSN 2076-9202
195
based on market fluctuations during the study period.
TABLE 3: RESULTS OF STOCK SELECTIVITY MEASURE FOR THE PERIOD 2009-13
Sl.No Banking funds Reward for net selectivity
1 ICICI Pru Banking & Financial Services 0.0439
2 Reliance Banking Fund 0.0359
3 Religare Invesco Banking 0.0244
4 Sahara Banking and Financial Services 0.0324
5 Sundaram Financial Services Opportunities 0.0146
6 UTI-Banking Sector 0.0248
7.2.1. TESTING OF HYPOTHESES
The testing of correlations between fund performance and the stock selection ability of
fund manager. . It is evidenced from the results that the sample schemes displayed positive
significant relation to their performance and the stock selection ability of fund manager Hence the
hypothesis – 1, "There is no significant relationship between fund performance and the stock
selection ability of fund manager." is rejected. Therefore the alternative Hypothesis would be
H11= There is a significant relationship between fund performance and the stock selection ability of fund
manager.
7.3.TREYNOR AND MAZUY MODEL (TMM)
Treynor and Mazuy (1966) proposed a model to examine the market timing abilities of
fund managers. Market timing involves assessing the market movements and positioning the
portfolios accordingly. TMM is an extension of Jensen’s single index model and incorporates a
quadratic term in it. The specification of the model is given below:
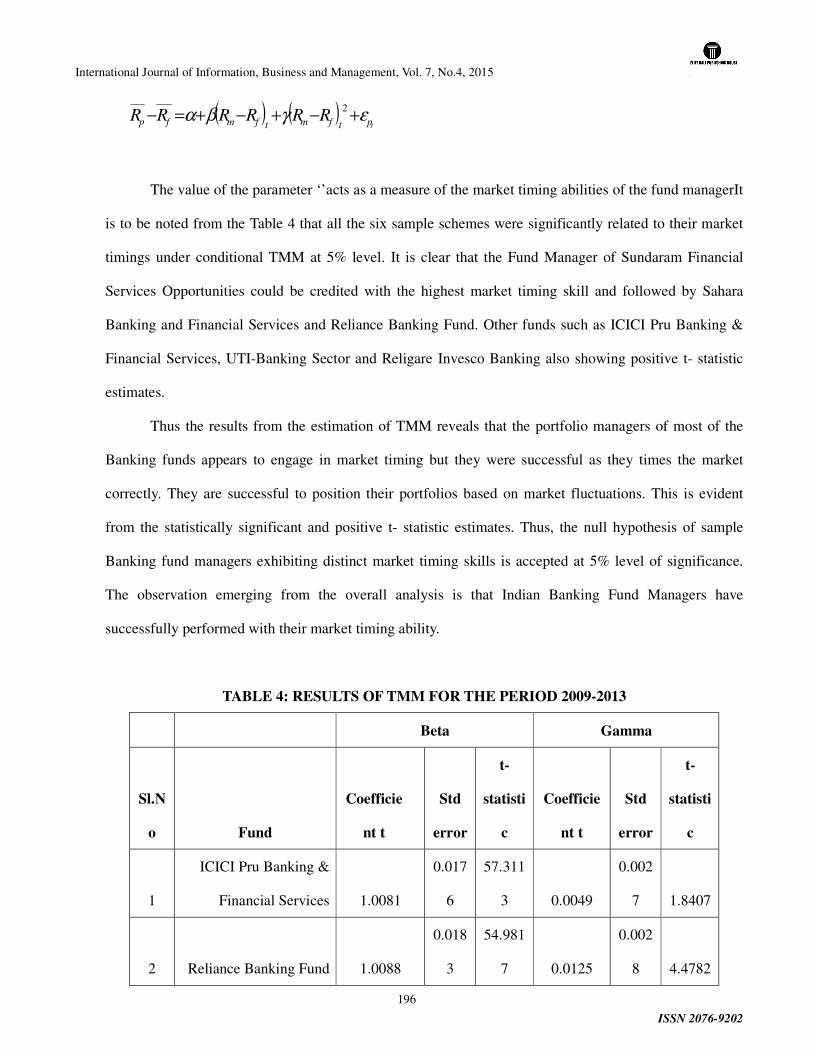
International Journal of Information, Business and Management, Vol. 7, No.4, 2015
ISSN 2076-9202
196
)( )(tptfmtfmfp RRRRRR εγβα +−+−+=−
2
The value of the parameter ‘’acts as a measure of the market timing abilities of the fund managerIt
is to be noted from the Table 4 that all the six sample schemes were significantly related to their market
timings under conditional TMM at 5% level. It is clear that the Fund Manager of Sundaram Financial
Services Opportunities could be credited with the highest market timing skill and followed by Sahara
Banking and Financial Services and Reliance Banking Fund. Other funds such as ICICI Pru Banking &
Financial Services, UTI-Banking Sector and Religare Invesco Banking also showing positive t- statistic
estimates.
Thus the results from the estimation of TMM reveals that the portfolio managers of most of the
Banking funds appears to engage in market timing but they were successful as they times the market
correctly. They are successful to position their portfolios based on market fluctuations. This is evident
from the statistically significant and positive t- statistic estimates. Thus, the null hypothesis of sample
Banking fund managers exhibiting distinct market timing skills is accepted at 5% level of significance.
The observation emerging from the overall analysis is that Indian Banking Fund Managers have
successfully performed with their market timing ability.
TABLE 4: RESULTS OF TMM FOR THE PERIOD 2009-2013
Beta Gamma
Sl.N
o Fund
Coefficie
nt t
Std
error
t-
statisti
c
Coefficie
nt t
Std
error
t-
statisti
c
1
ICICI Pru Banking &
Financial Services 1.0081
0.017
6
57.311
3 0.0049
0.002
7 1.8407
2 Reliance Banking Fund 1.0088
0.018
3
54.981
7 0.0125
0.002
8 4.4782
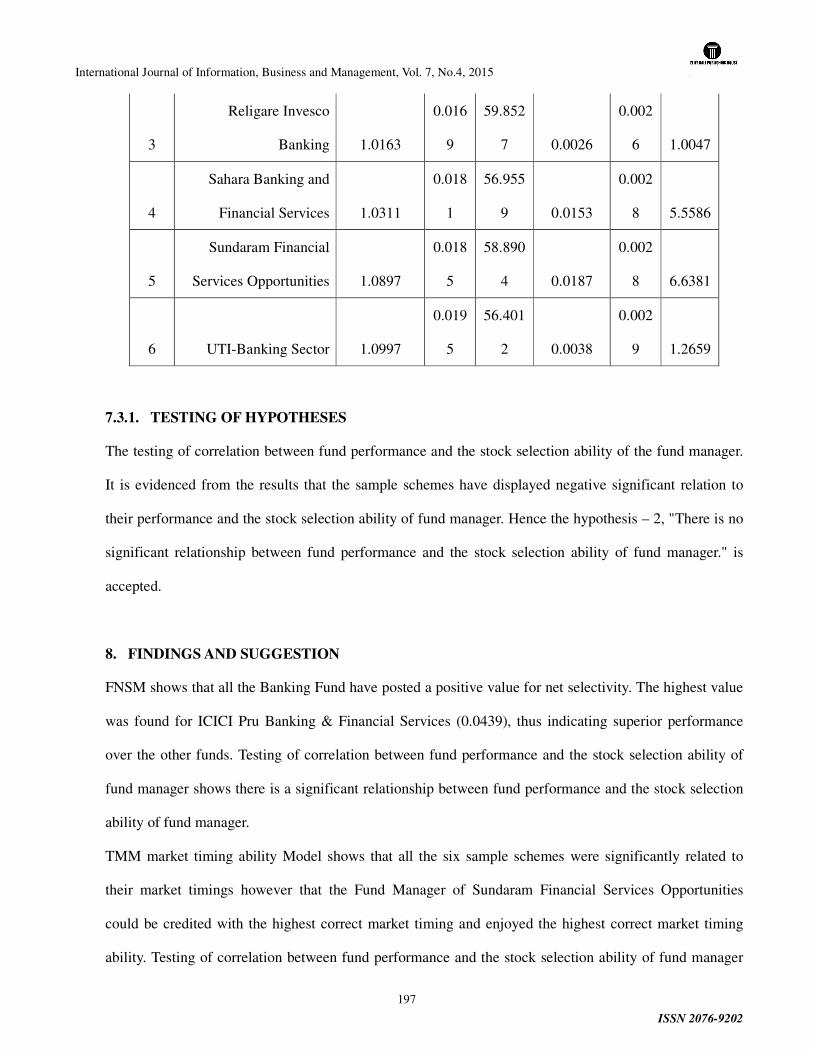
International Journal of Information, Business and Management, Vol. 7, No.4, 2015
ISSN 2076-9202
197
3
Religare Invesco
Banking 1.0163
0.016
9
59.852
7 0.0026
0.002
6 1.0047
4
Sahara Banking and
Financial Services 1.0311
0.018
1
56.955
9 0.0153
0.002
8 5.5586
5
Sundaram Financial
Services Opportunities 1.0897
0.018
5
58.890
4 0.0187
0.002
8 6.6381
6 UTI-Banking Sector 1.0997
0.019
5
56.401
2 0.0038
0.002
9 1.2659
7.3.1. TESTING OF HYPOTHESES
The testing of correlation between fund performance and the stock selection ability of the fund manager.
It is evidenced from the results that the sample schemes have displayed negative significant relation to
their performance and the stock selection ability of fund manager. Hence the hypothesis – 2, "There is no
significant relationship between fund performance and the stock selection ability of fund manager." is
accepted.
8. FINDINGS AND SUGGESTION
FNSM shows that all the Banking Fund have posted a positive value for net selectivity. The highest value
was found for ICICI Pru Banking & Financial Services (0.0439), thus indicating superior performance
over the other funds. Testing of correlation between fund performance and the stock selection ability of
fund manager shows there is a significant relationship between fund performance and the stock selection
ability of fund manager.
TMM market timing ability Model shows that all the six sample schemes were significantly related to
their market timings however that the Fund Manager of Sundaram Financial Services Opportunities
could be credited with the highest correct market timing and enjoyed the highest correct market timing
ability. Testing of correlation between fund performance and the stock selection ability of fund manager

International Journal of Information, Business and Management, Vol. 7, No.4, 2015
ISSN 2076-9202
198
resulted that the sample schemes displayed negative significant relation to their performance and the
stock selection ability of fund manager
Mutual funds operations utilized the public money of investors. Hence Fund Managers have to use
this public money in a proper way and distribute reasonable returns to investors. Fund Managers must
find the portfolio allocation under risk and returns proposition. After that they have to select the stocks for
fund allocation. In general, high level of risk provides high returns. Hence Fund Managers are advised
continue to select the correct stocks according to the expectations of investors. It is true that the market
movement affects the Equity Mutual fund Performance. Hence the Fund Manager should continue to
change their portfolio to suit the market conditions. The present study indicates that majority of Mutual
fund Managers did have sufficient market timing ability. Hence Fund Managers must continue with skill
of spotting out the correct market timings .The stock selection ability is the primary qualification of Fund
Managers. They are advised to take more care while selecting the stocks according to the fund
characteristics to provide continuous improvement in future. In the present scenario, many national and
international factors affect the functions of Capital Market and Mutual fund Institutions. Hence it is
advisable for Fund Managers to know these factors while taking any decision favorable to investors.
9. CONCLUSION
The performance of six banking funds were examined in terms of the stock selectivity abilities and
examining the manager’s market timing abilities. In terms of net selectivity ICICI Pru Banking &
Financial Services have shown superior performance over the other funds reflecting that these fund
managers have taken diversifiable risk that is compensated by additional returns followed Reliance
Banking Fund and Sahara Banking and Financial Services. The testing of correlation between fund
performance and the stock selection ability of fund manager shows there is a significant relationship
between the variables.
With regards to market timing skills, the entire portfolio managers were able to position their
portfolios based on market movements. It is clear that the Fund Manager of Sundaram Financial Services
International Journal of Information, Business and Management, Vol. 7, No.4, 2015
ISSN 2076-9202
199
Opportunities could be credited with the highest correct market timing and enjoyed the highest
correct market timing ability of Fund Manager followed by Sahara Banking and Financial
Services and Reliance Banking Fund. Other funds such as ICICI Pru Banking & Financial
Services, UTI-Banking Sector and Religare Invesco Banking also showing positive t- statistic
estimates. The testing of correlation between fund performance and the stock selection ability of
fund manager resulted that the sample schemes displayed negative significant relation to their
performance and the stock selection ability of fund manager.
References
1. Muthappan, P.K and E. Damodharan (2006) ‘Risk – Adjusted Performance Evaluation of Indian Mutual Fund Schemes’, Finance India, 10 (3): 965- 983.
2. Jayadev, M (1996), ‘Mutual Fund Performance: An Analysis of Monthly Returns’, Finance India, 10(1): 73 – 84
3. Deb, S.G., A. Banerjee and B.B Chakrabarti (2007), ‘Market Timing and Stock Selection Ability of Mutual Funds in India: An Empirical Investigation’, Vikalpa, 32(2): 39 – 51.
4. Sondhi, H.J and P.K Jain (2006), ‘Can Growth Stocks be identified for Investments? : A Study of Equity Selectivity Abilities of Fund Managers in India’, The ICFAI Journal of Applied Finance, 17-30.
5. Kader, Abdel M., and Y Kuang (2007), ‘Risk - adjusted Performance, Selectivity, Timing ability and Performance Persistence of Hong Kong Mutual Funds’, Journal of Asia Pacific Business, 8(2): 25 – 58
6. Nooney Lenin Kumar and Vangapandu Rama Devi (2011), ‘Performance evaluation of private and public sponsored mutual fundsin India’, International journal of research in commerce.IT & Management, 1(2): 24 – 35
7. Santhi, N.S and K. Balanaga Gurunathan (2012), ‘An Analysis of Risk-Adjusted Return on Tax-Saving Mutual Fund Schemes in India’, The IUP Journal of Financial Risk Management, 9(3), 54 – 71
8. Sehgal, S. and J. Manoy (2008), ‘On Stock Selection Skills and Market Timing Abilities of Mutual Fund Managers in India’, International Research Journal of Finance and Economics, 15 : 307 – 317
9. Shanmugham, R. and Zabiulla (2010), ‘Performance of managed portfolios : A study with reference to the pharma funds in India’, Pranjana: The Journal of Management Awareness, 13(2) : 47 – 59
10. www.amfiindia.com

International Journal of Information, Business and Management, Vol. 7, No.4, 2015
ISSN 2076-9202
200
11. www.rbi.org.in
12. www.nseindia.com
13. www.sebi.gov.in
International Journal of Information, Business and Management, Vol. 7, No.4, 2015
ISSN 2076-9202
201
THE IMPACT OF SERVICE QUALITY AND CUSTOMER
SATISFACTION ON CUSTOMER’S LOYALTY: EVIDENCE FROM
FAST FOOD RESTAURANT OF MALAYSIA
INTAN MAIZURA ABD RASHID
[email protected] School of Business Innovation and Technopreneurship,
Universiti Malaysia Perlis
MOHD JURAIJ ABD RANI
[email protected] School of Business Innovation and Technopreneurship,
Universiti Malaysia Perlis
BIBI NORAINI MOHD YUSUF
[email protected] School of Business Innovation and Technopreneurship,
Universiti Malaysia Perlis
MOHD SHAHIDAN SHAARI
[email protected] School of Business Innovation and Technopreneurship,
Universiti Malaysia Perlis
Abstract
This paper discusses the Customer’s Loyalty as it is becoming an important element for gaining
competitive advantage. The study looks into the impact of service quality and customer satisfaction on
customer’s loyalty in fast food restaurant of Malaysia. The selected sample size was 300 of respondents
received in four major cities; the researcher received 300 valid questionnaires with a response rate of 100%.
The results revealed that service quality and customer satisfaction were found significantly related with
significance level to with customer’s loyalty were partially correlated with dependent variable. Results of
this research will help the fast food industry to shape their products and services in such a way that they
could maximize customer satisfaction and maintain their customer’s loyalty in order to achieve higher
International Journal of Information, Business and Management, Vol. 7, No.4, 2015
ISSN 2076-9202
202
market share.
Key Words:
Service Quality, Customer Satisfaction, Customer’s Loyalty, Fast Food Restaurant, Malaysia.
1.1 The Background of the study
Malaysia is a multiracial and multireligious country. According to the information provide by World Bank
Group, purchasing power parity and living of the population had increase rapidly in Malaysia which the
GDP per capita in US Dollar 14,215. The phenomenon of globalization, a lot of Malaysian’s lifestyle has
been change and most people prefer to stick with the fast food. Customer loyalty is playing an important
role in the customer strategy in any organization nowadays. Most of the families frequently incline to
eating-out especially in fast food restaurants. The benefit of gaining customer loyalty will have the huge
competitive advantage for an organization and institutions to be successful in future compare to others
(Aksu, 2006). It is because strategy retaining existing customers is much more effective rather than
attracting new customers to replace the existing customer (Gee R, 2008).
According to (Kotler, 2011), customers seek a variety of features and benefits with various capabilities to
meet and satisfying their needs and wants. Therefore, multiple of criteria will be concerning when making
decision for restaurant which are include product packages, service package and others. The factor that
influencing customer loyalty should be understood by all restaurant industry especially fast foods because
it able fulfills customers' demand and leading to gain more revenue for the restaurant. In previous
researches, various types of analysis and investigation have been conducted regarding factors influencing
customer loyalty towards fast food restaurant and innovative changes should be made.
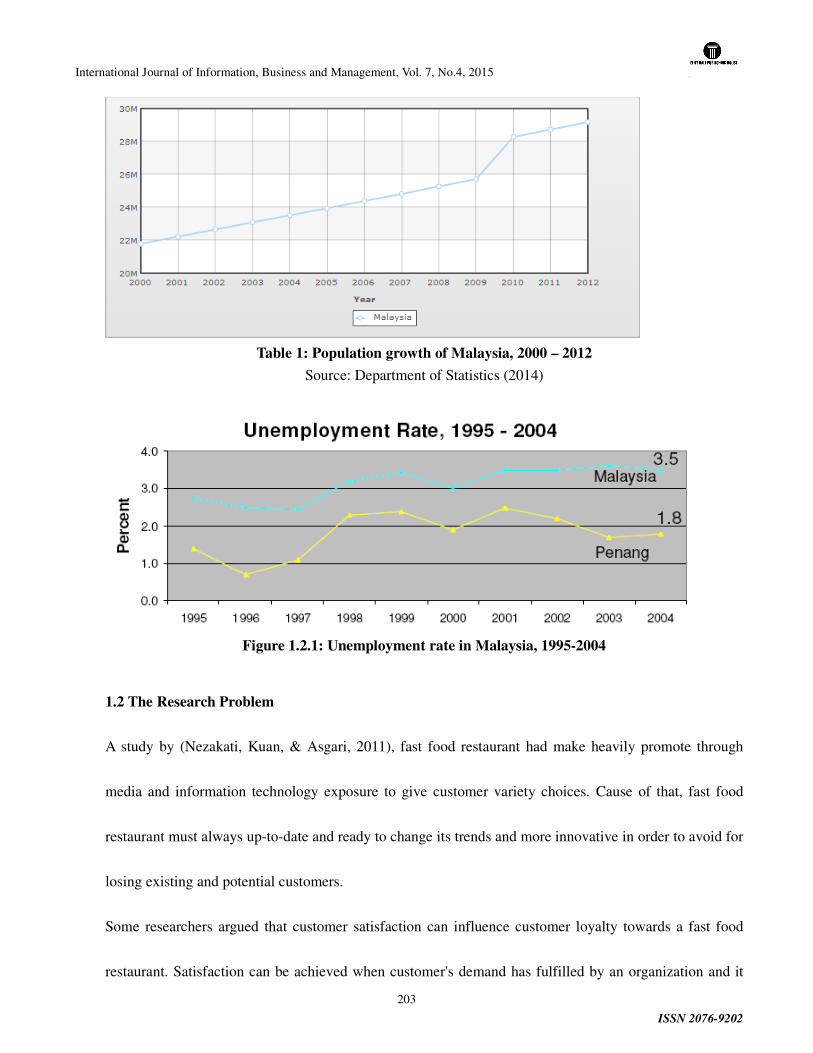
International Journal of Information, Business and Management, Vol. 7, No.4, 2015
ISSN 2076-9202
203
Table 1: Population growth of Malaysia, 2000 – 2012
Source: Department of Statistics (2014)
Figure 1.2.1: Unemployment rate in Malaysia, 1995-2004
1.2 The Research Problem
A study by (Nezakati, Kuan, & Asgari, 2011), fast food restaurant had make heavily promote through
media and information technology exposure to give customer variety choices. Cause of that, fast food
restaurant must always up-to-date and ready to change its trends and more innovative in order to avoid for
losing existing and potential customers.
Some researchers argued that customer satisfaction can influence customer loyalty towards a fast food
restaurant. Satisfaction can be achieved when customer's demand has fulfilled by an organization and it
International Journal of Information, Business and Management, Vol. 7, No.4, 2015
ISSN 2076-9202
204
determining future purchase intentions. (McAlexander & H.F., 1994) Demands from the customers are
not only related with the food but it might include others factor such as environment, service quality, price
fairness, food variety and strategies of the physical location. Due to that, all aspects have to alert and
notify by fast food restaurant to increase its revenue neither short-term nor long-term.
There is no clear evidence about the factors influencing customer loyalty towards fast food restaurant in
Malaysia. So, this study will deal with this issue by examining the factor that will influence customer
loyalty towards fast food restaurant.
1.3 The Research Question
i. Does the service quality factor will affect the customer loyalty towards fast food restaurant in
Malaysia?
ii. Does the customer satisfaction will affect the customer loyalty towards fast food restaurant in
Malaysia?
1.4 The Objective of the Study
i. To determine the relationship between the service quality and customers loyalty towards
fast food restaurant in Malaysia.
ii. To investigate the relationship between customer satisfaction and customers loyalty
towards fast food restaurant in Malaysia.
1.5 The Significance of the Study
International Journal of Information, Business and Management, Vol. 7, No.4, 2015
ISSN 2076-9202
205
The purpose of this research is used to provide awareness and solutions to the fast food restaurant so that
they can make some improvement. Besides that, it also used to remind the fast food restaurant about the
factors which will lead customer loyalty towards them neither short-term nor long-term period.
Through this study, fast food restaurant can more understand the demand from their customer.
Improvement from different aspect such as fairness of pricing, service quality, food quality, customer
satisfaction, customer preferences are able to achieve by applied the strategies which match with it and it
will give a hand to the fast food restaurant that involve in an extremely competitive business environment.
Information that obtains from this study also can act as guideline for new entrepreneur fast food
restaurant to establish its business.
Last but not least, government is able to use the information from this research to improve sector of fast
food and stimulate Malaysian's economy to better. In long-term orientation, GDP of Malaysia can be
increase and it will lead fast growing of fast food sectors.
1.6 The Scope of Study
This research will take the sample from customers that frequently visit fast food restaurant in Malaysia.
However, the factors of influencing customer loyalty towards fast food restaurant will be obtained from
the journals and previous researches which were conducted in Malaysia. Thus, the group involve in this
research is focus on consumer of fast food restaurant in Malaysia. It also focuses on these fields to
analyze and study about the factors that will influence customer loyalty towards fast food restaurant in
Malaysia.
International Journal of Information, Business and Management, Vol. 7, No.4, 2015
ISSN 2076-9202
206
2.0 LITERATURE REVIEW
2.1 Introduction
The terms of fast foods are the final products that are prepared in a minimum preparation time, quickly,
and easily which are ready to serve directly to people. Besides that, fast food compared with alternatives
home-cooked meals it is fastest and save more time, for the example of fast food such as Hamburger,
pizza, fried rice and other foods. In addition information, most of the fast food restaurant is operating for
24 hours in all the time and growing rapidly day by day. Basically, fast food companies will provide
product and services that meets or exceeds the customer’s expectation every time (miler et al, 2000) and it
may enable loyalty of customer to maintain or even increase.
Besides that, customer loyalty is categories into 2 dimensions which are attitudinal and behavioral
dimension. The behavior is the practice, customer loyalty as long as they continue to buy and use of good
or services (Clottey, Collier, & Stodnick, 2008). The attitudinal approach consists of criteria suck
emotional attachment, trustiness and commitment, whereas the behavior approach are includes criteria
such as word of mouth referrals, share-of-wallet and repeat purchase.
(Reichheld, 2003) state that percentage of customers who were willing enough to refer a friend or
colleague to a particular good or service is the strongest evidence of customer loyalty. (Nebert Matelong,
2013) also examined the link between attitude and behavior and found that “the stronger the attitudinal
commitment…, the more likely consumers were to remain loyal” thus the use of an attitudinal measure
would also indicate the behavioral dimension of loyalty. Customer loyalty can measure by the customer’s
response to how strongly they would recommend the retailer to their friends and family on a seven point
International Journal of Information, Business and Management, Vol. 7, No.4, 2015
ISSN 2076-9202
207
ordinal scale (Yoon, 2010).
2.2 Fast Food
Eating is one of the human’s activities that it is enjoyable. There are many kinds of food available to eat,
no exception is fast food. Fast food is define as ‘‘designed for ready availability, use, or consumption with
little consideration given to quality or significance.’’ The words ‘‘fast food’’ was create in 1954 as a
shorthand for the fare of restaurants that provided ‘‘fast food service.’’ Fast food usually does not require
cutlery and generally consists of finger food such as hamburgers, french fries, chicken nuggets, tacos, and
pizza. Among these, McDonald’s is the leader of the fast food industry. Their founders, Ray Kroc,
transformed a hamburger, fries, and a shake into American meal, establish golden arches to guide hungry
travelers, and appointed a kid friendly clown as fast food's ambassador (Freeman, 2007).
Fast food has since expanded to include an extensive array of foods. In 2005, the top ten fast food chains
in the United States were McDonald's, Burger King, Wendy's, Subway, Taco Bell, Pizza Hut, Starbucks,
KFC, Dunkin' Donuts and Domino's Pizza. Preparing fast food is highly processed and done by using
standardized ingredients and production techniques. Most of fast food is deep fried in partially
hydrogenated oils which lead to high cholesterol rates and heart attacks. Combined with starchy
vegetables and sugary drinks, these foods have a high glycemic load, a factor that contributes to obesity
and diabetes. Fast food also contains a large amount of chemical additives and often lacks accurate
nutrition labeling (Freeman, 2007).
Although fast food is a kind of meal which is prepared or served quickly, however, some people argue
that by eating fast food, they may gain the advantages and disadvantages. The advantage of consuming
International Journal of Information, Business and Management, Vol. 7, No.4, 2015
ISSN 2076-9202
208
fast foods is that it can save time. Fast foods, such as hamburger and pizza only need a short time to order.
Moreover, nowadays, the restaurants which sell them can be found easily. Therefore, no matter when you
are hungry, or wherever you are, there is probably at least one fast food restaurant just a short drive away
(Kriswintari, 2012).
Furthermore, there are another advantage of eating fast foods is that they have a good taste such as
snack, spaghetti and fried chicken have special flavor which make the consumers be addicted. Because in
fact, such fast foods are added with additives, such as Monosodium glutamate and sodium which can
improve the taste of food. Unfortunately, fast foods would directly cause obesity. This is because fast
foods have many of calories and these accumulate in the body as fat deposits that can cause obesity.
Hence, with obesity come other problems like high blood pressure and diseases of the joints. Some
researchers have shown that there is a direct link between fast food and obesity on children (Kriswintari,
2012).
As a conclusion, fast food is a multi-billion dollar industry that relies on a close relationship with
International Journal of Information, Business and Management, Vol. 7, No.4, 2015
ISSN 2076-9202
209
the government to ensure profits. While many outspoken critics of the food justice movement advocate a
free-market society based on consumer choice, these arguments ignore the fact that, in many cases, true
freedom of choice is not available to many Americans. The narrowing of choice results from the deals
made between the government and the meat, dairy, and fast food industries (Freeman, 2007).
2.3 Customer Loyalty
There are many definitions of customer loyalty. Yet each of them fails to realize that loyalty runs
hand-in-hand with emotions. Customer loyalty is the result of consistently positive emotional experience,
physical attribute-based satisfaction and perceived value of an experience, which includes the product or
services. Besides that, customer loyalty also was a discussion about attracting the right customer, getting
them to buy, buy often, buy in higher quantities and bring you even more customers. However, that focus
is not how you build customer loyalty (Customer Loyalty and Retention).
More and more companies are focusing on consumer loyalty to enhance long-term profitability (Jain and
Singh 2002). To enhance consumer loyalty, companies adopt many strategies, and the most popular
among them is the loyalty program. Hotels, airlines, department stores, drugstores, gasoline stations,
grocery stores, mass merchandisers, and specialty apparel stores, all have adopted loyalty programs.
However, it is not clear whether loyalty programs are, in spite of their widespread use, profitable in all
cases. Some researchers argue that they are profitable whereas others take the opposite stand (Siddharth S.
Singh, 2008)
Recent research by Villenueva et al. (2007) in the journal of Siddharth S. Singh, 2008, shows that a firm
would be better off looking at short term period-by-period profit maximization instead of long-term profit
International Journal of Information, Business and Management, Vol. 7, No.4, 2015
ISSN 2076-9202
210
maximization obtainable through in itiatives such as loyalty programs. Thus, it is not clear whether
loyalty p yalty programs. Thus, it is not clear whether loyalty programs really bring in more profits to the
firms.
Another stream of research uses a game theoretic approach and analyzes the market equilibrium
conditions that enable competing firms to offer loyalty programs (e.g., Klemperer 1995, Kim et al. 2001,
Caminal and Matutes 1990, Von Weizsacker 1984). A common finding is that loyalty programs sustain in
equilibrium because they reduce market competition by introducing consumer-switching costs. However,
it is interesting to note that all of these studies focus on a market where both of the competing firms offer
loyalty programs (Siddharth S. Singh, 2008).
On the order hand, keeping customer satisfied is what leads to customer loyalty (Jones and Sasser Jr,
1995). He found after examine thirty two different organization with 5 different market that if the
customer have the choice the relationship between loyalty and satisfaction is linear it means that when the
satisfaction rises the loyalty rises too. A higher customer satisfaction lead to number of improvements like
higher customer loyalty, higher consumption of the service, acquisition of further customers (Male, 2003).
However in markets that there is an intense competency there is no relationship between customers and
loyalty it means that there is a difference between loyalty and satisfied or completely satisfied customers.
Put simply if satisfaction ranked on 1-5 scale from completely dissatisfied to completely satisfied, the 4's
– though satisfied- were six times more likely to defect than the 5's.
Customer loyalty reveals itself in many form of customer behavior such as:
� Intend to re-purchase;
International Journal of Information, Business and Management, Vol. 7, No.4, 2015
ISSN 2076-9202
211
� Primary behavior - organization have access to information on various transactions at the
customer level and can track five categories that show actual customer re-purchasing
behavior; regency, frequency, amount, retention, and longevity; and
� Secondary behavior – e.g. customer referrals, endorsement and spreading the word are all
extremely important forms of consumer behavior for an organization.
In markets with repeat purchases, it is common for a firm to offer different prices to its repeat customers
and customers who switch from a rival. Some industries are popularized by marketing programs that
entice consumers to switch from rivals. For example, long-distance telephone companies often offer
lower prices to rivals' consumers, satellite companies sometimes target cable users with lower prices, and
credit card companies frequently offer lower rates to switching customers. In some other industries,
however, the prevailing practice is for firms to reward consumer loyalty (Pearcy, 2010)
However, some of these companies which already do a very good job building relationships
organically, by providing good products and services, run the risk of shooting themselves in the foot by
launching questionable, artificial loyalty-building programs. If these programs do not deliver substantial
value to the customer, the company runs the risk of eroding existing loyalty (Duffy D. L., 2005).
As a conclusion, customer loyalty presents a paradox. Many see it as primarily an attitude based
phenomenon that can be influenced significantly by customer relationship management initiatives such as
the increasingly popular loyalty and affinity programs. However, empirical research shows that loyalty in
competitive repeat-purchase markets is shaped more by the passive acceptance of brands than by
strongly-held attitudes about them. From this perspective, the demand-enhancing potential of loyalty
International Journal of Information, Business and Management, Vol. 7, No.4, 2015
ISSN 2076-9202
212
programs is more limited than might be hoped (D.Uncles, R.Dowling, & Hammond, 2003).
2.4 Factors Influencing Customers Loyalty towards Fast Food Restaurant
Regarding to the title of this research, there are several of factors have been found from previous research
that will influence customer loyalty towards fast food restaurant in Malaysia. The following are the
explanation about the factors and the previous research found.
2.4.1 Service Quality
When there is a close interaction between a service employee and a customer, the perception of what is
being delivered is as important as what is actually delivered (Ozment & Morash, 1994). Therefore, the
employee’s behaviors and attitudes can influence a customer’s perception of quality for that service
offering (Brady & Cronin, 2001). The exchange process is more observable in the service industry, due to
the evolving interaction between service providers and their customers. Service providers have an
opportunity to offer something special that stands out in a customer’s mind, thereby increasing the rate of
customer retention (Crosby & Johnson, 2002; Mitchell, 1998; Shostack, 1977).
Creating long-term relationships with customers is the key to the survival and growth of service
operations (Duffy D. , 1998). Thus, firms should benefit from a better understanding of what leads to
customer satisfaction in services. The nature of evaluating service quality stems from comparing service
expectations with actual performance perceptions (Zeithaml, Parasuraman, & Berry, 1990). In other
words, it is the result of the comparison that customers make between their expectations about a service
and their perceptions of the way the service has been performed (Parasuraman, Zeithaml, & Berry, 1985).
This gap between perceptions and expectations (P-E) had been made explicit by the SERVQUAL
International Journal of Information, Business and Management, Vol. 7, No.4, 2015
ISSN 2076-9202
213
instrument. Parasuraman (1985) proposed that service quality is a multidimensional concept, consisting of
five elements which are as follows:
� Reliability refers to the ability to deliver the promised services dependably and accurately. It
covers keeping promises on delivery, pricing, complaint handling.
� Responsiveness is defined as the willingness to assist customers in a promptly manner. This
dimension advocates positive service attitude and requires personnel to be attentive to
customer requests, questions and complaints.
� Assurance focuses on the ability to inspire trust and confidence.
� Empathy is the service aspect that individualizes the treatment of customers.
� Finally, tangibles are the dimension that the elements that can be observed physically.
An important advantage of the SERVQUAL instrument is that it has been used and validated across
different contexts in the service industry, e.g. hospitals (Babakus & Mangold, 1992), mechanic shops,
higher education (Boulding, Kalra, Staelin & Zeithaml, 1993) and departmental stores (Finn and Lamb,
1991; Teas, 1993). Fitzsimmons and Fitzsimmons (1994) confirmed that the SERVQUAL instrument still
remains the best measure for cross-sectional research and industry benchmarking.
The university system is one special kind of public administration. It prepared for the students as a
customer the most important level of education, so it would be really necessary to evaluate its work in
terms of the quality of the services offered. We could test quality of service by measuring student
satisfaction, since we assume students as a real customer. This process could be carried out by comparing
quality expected, quality provided and quality perceived ( Baccarani, 2003, 2004).
International Journal of Information, Business and Management, Vol. 7, No.4, 2015
ISSN 2076-9202
214
According (Crosby & Kenneth & Cowles, 1990) defined that quality is a standard and specification
degree for a product to maximize the external clients’ needs. Based on Kotler (2003) advocate that is a set
of characteristics and overall properties of the service which aim to satisfy the clients and meet their
needs. From the previous research found that service quality is an activity for a business to deliver the
need and expectation of clients. Besides, according to Gronros (1993) the quality of a service, as a
perceived by the customer is a result of a comparison between the expectation of the customer and his
real-life experiences.
Service quality is an important strategic for a business operation, a high service quality will increase the
customer satisfaction and customer loyalty. According to Crosby (1990) state that the theory of
relationship quality model which is a high service performance will make the impact of positive
relationship on quality. Furthermore, service quality indicated the perceptions of high service quality and
high service satisfaction resulted in a very high level of purchase intentions (boulding, Kalra, Staelin, &
Zeithaml, 1993;Ceonin & Taylor, 1992; Taylor, 1997; Taylor & Baker, 1994; Zeithaml et al, 1996).
According to Huang and Liu (2010) high service performance will increase the customer satisfaction,
trust and loyalty.
According to Wong (2004), service quality positively would affect emotional satisfaction that in turn
would have positive effect on both customer loyalty and relationship quality. The importance of service
quality on customer loyalty intentions was highlighted by Venetis and Ghauri (2004) who found that
service quality affected customers' intentions to stay in a relationship with a service provider. Service
International Journal of Information, Business and Management, Vol. 7, No.4, 2015
ISSN 2076-9202
215
quality also may affect loyalty through the mediating variables of trust and commitment (Caceres and
Paparoidamis, 2007).
Consumers can strengthen their relationship with the organization via motivating by high quality services
(Hess, Ganesan & Klein, 2003) while low quality can provoke a change in consumers' attitudes/behavior
towards an organization. The high quality services will have positive consequences on its customers'
purchasing intentions, on-word-of-mouth recommendations and on the willingness to pay a higher price
(Zeithaml, Berry & Parasuraman, 1996).
Service quality plays an integrating role between organization and its customers. Service quality can also
divided into 8 quality dimension there are tangible, reliability, responsiveness, competence, courtesy,
credibility, security, access, communication and understanding the customer by (Zeithaml, Parasuraman
& Berry, 1990). The following is the 8 dimension quality explanation and the example.
i. Tangibles- which bring the meaning of the physical facilities on the restaurant and the design of
the environment are attractive or the staff dressed appropriately.
ii. Reliability- define as the truthiness of the restaurant and the reputation image of the restaurant,
instead of this it also a promised service is accurate or correct.
iii. Responsiveness- provide by the restaurant is good and willing to extra help the customer to do
prompt service or a duty of the restaurant.
International Journal of Information, Business and Management, Vol. 7, No.4, 2015
ISSN 2076-9202
216
iv. Competence- means the service activities of the restaurant are ability are successfully or
efficiently besides if also the talent and skill of the restaurant. For an example, the restaurant’s
staff have do their job well or the staff fumbling around without doing anything.
v. Courtesy- define as the attitude of the staff such as polite, kindly, friendly and manners of the
restaurant.
vi. Security- security can me define as the safety of the restaurant and the location of the restaurant.
For an example, the restaurant design and the table location which is not safety in fact always
inconvenient to their staff walking and customer and will make customer injuries this will also
affect the restaurant image.
vii. Access- refers to how easy to communicate with the staff member and how easy to reach the
appropriate staff person for an example contact by using telephone or by email.
viii. Communication-which is refers to the staff listening skill and the understanding of the customer’s
order.
Quality service for a business playing an important role and it’s will bring a lot benefits to the business
income. For 21 century, an increasing competition marketing service quality is an essential strategy for
success and also survival has attracted increasing in over the past 20 years (Ismail, 2006). Furthermore,
restaurant facing a lot of competition, many restaurant’s manager try their best to making a difference
type of order with other from their competitors. So that service quality plays a critical role to develop a
competitive advantage (Brown, 1993).
International Journal of Information, Business and Management, Vol. 7, No.4, 2015
ISSN 2076-9202
217
According to (Jamal, 2009) service quality can define as the magnitude and direction of difference
between perception and expectation of the consumers. Based on (Parasuraman et al, 1988) promote a
multi-item scale which name as SERVQUAL to measure the service quality and investigate quality of
service perceived by customer due to the result of comparing customer expectations and their original
perception towards products and services.
2.4.2 Alternate Perspectives to Service Quality
A 3 dimensional view of service quality, which is interaction, physical and corporate identity was
suggested by Lehtinen and Lehtinen (1982). Later, Gronroos (1983; 1990) proposed that service quality
can be illustrated to be either output or process-oriented. This two dimensional model from the customer’s
perspective highlights the technical (or output) quality and functional (or process) quality as a resultant
force in quality outcomes. The former refers to what has been delivered to the customer, be it the form of
a meal in a restaurant, or recommendations provided by a consultant. The latter which is functional
quality is concerned with what is achieved at the end of the service provider-customer relationship.
In other words, functional quality can be both psychological and behavioral that ranges from the level of
accessibility the customers possess to how the services are carried out. In operationalization the two,
technical quality can be evaluated objectively. However, this is not so with functional quality. An
alternative three-dimensional view (interaction quality, service environment quality and outcome quality)
was developed by Brady and Cronin (2001). The first i.e. interaction quality, is defined as a customer’s
experience as a result of the interaction with the human element of the organization.
The important role of front line employees in service industry has been confirmed by researchers such as
International Journal of Information, Business and Management, Vol. 7, No.4, 2015
ISSN 2076-9202
218
Gremler and Gwinner (2000) and Zeithaml and Bitner (2003). The second dimension of service
environment quality refers to the physical element of the organization. Finally, outcome quality refers to
the fulfillment of a customer’s expectations after having used the service (Brady & Cronin, 2001). Brady
and Cronin (2001) further proposed three sub-dimensions of the above three-dimensional view.
Interaction quality can be further broken down into employees’ attitudes, behavior, and expertise.
Service environment can be classified into facility design, customers’ loyalty ambient conditions, and
social factors. Lastly, the outcome quality can be categorized into waiting time, tangible element, and
valence. Brady and Cronin’s (2001) model had been applied in the context of health clubs in Greece
(Alexandris Zahariadis, Tsorbatzoudis & Grouios, 2004).
2.4.3 Customer Satisfaction
According to Oxford dictionary, the word “satisfaction”is defined as a feeling of pleasure or something
that gives happiness because of a need, a desire or a demand had been fulfilled or convinced. (Crowther,
Kavanagh, & Ashby, 1995). A “satisfaction”in usual life, is something to fulfill or to be fulfilled and most
commonly applied among business distributors and customers. That’s why the phrase “customer
satisfaction”is becoming a common goal in the business world. The meaning of it is defined very
differently by various marketing experts including Richard L. Oliver, Philip Kotler, Johnson and Fornell
etc. who come from different parts of the world.
This justifies that the customer satisfaction is being concerned at almost everywhere beyond the national
boundaries and has generally becoming one of the focuses in business, in both of the product and service
industries. To understand about the customer satisfaction, based on the earlier studies by Marit G.
International Journal of Information, Business and Management, Vol. 7, No.4, 2015
ISSN 2076-9202
219
Gundersen, during 90s, typically defining the term “customer satisfaction”which is “a post choice
evaluative judgment concerning a specific purchase decision.”(Gundersen, Heide., & Olsson, 1996).
Another definition or conceptualization of the concept of customer satisfaction comes from the
expectancy disconfirmation theory. (McQuitty, Finn, & Wiley, 2000)
The disconfirmation theory was developed by Richard L. Oliver. During the research back in 1980, Oliver
proposed that the difference in satisfaction level is caused by the difference between the expected and
perceived performance. In other words, the better or worse of discovered performance which differs from
the expected performance results in satisfaction. (Oliver, 1980)
It is well-established that satisfied customers are the key to long-term business success (Gilbert and
Veloutsou, 2006). To develop and maintain a healthy loyal customer base, expanding business and
acquiring higher degree of market share is a must to increase long term profitability. Getty and Thompson
(1994) conducted a study on lodging experiences of the customers and discovered that a customer will
recommend product or service to others when they feel satisfied with the product or service regards
lodging experience. A study have shown two main factors which are satisfaction level of the outgoing
patients and service quality in the health are realm will determining future purchase intentions
(McAlexander J. a., 2007).
Most studies show that higher levels of customer satisfaction will lead to greater customer loyalty, which
in turn results in better company performance and also related to bottom line results (Gilbert and
Veloutsou, 2006). According to Jang and Mattila 2005, attracting a new customer is three to five times
more costly than retaining an existing customer. Therefore, most of the multinational companies will
International Journal of Information, Business and Management, Vol. 7, No.4, 2015
ISSN 2076-9202
220
come out with new marketing strategies or provide special promotion in order to attract new customers
and retain existing customers. According to Heskett (1997), customer satisfaction passes a certain
threshold will increase customer loyalty rapidly. Consistent with this "threshold" argument, it has been
found that "delighted" customers have a much higher probability of retention than those who are merely
"satisfied" (Oliver, 1997). Customer satisfaction is an overall attitude towards a service provider
(Levesque & McDougall, 1996) or an emotional reaction to the difference between what customers
anticipate and what they receive (Zineldin, 2000).
Customer satisfaction literature showed that the relationship between customer satisfaction and customer
loyalty depended on the type of satisfaction. The positive impact of manifest satisfaction on customer
loyalty was stronger than that of latent satisfaction on customer loyalty (Bloemer & Kasper, 1995);
(Bloemer & Ruyter, 1998).According to Tjiptono and Diana (2000), customer satisfaction mean as post
purchased evaluation whereas perception to the product and services performance that is chosen can
fulfill or maybe give more hopeful with before purchased. Satisfaction will not occur if the perception to
the performance is not match with the hopeful. Customer satisfaction plays a very important role in
customer loyalty and retention although it does not ensure repeat purchase (Mohsan et al, 2011).
According to Hallowell (1996), the profitability of a business is dependent on satisfaction which means
that attainable increases in satisfaction could dramatically improve profitability. Literature also shows that
to enhance the customer loyalty, customer satisfaction plays a vital role and it is the most important driver
(Sondoh et al, 2007). Customer's retention intention is directly proportional by the service quality and
customer's satisfaction (Prof. Gopalkrishnan et al, 2011).
International Journal of Information, Business and Management, Vol. 7, No.4, 2015
ISSN 2076-9202
221
Satisfied customer will become loyal while dissatisfied customers will move to another vendor (Heskett
et al. 1994: 164-174). According to Reichheld (2000), 60-80% of customers who defect to a competitor
said they were satisfied or very satisfied on the survey just prior to their defection. So, it has shown that
there are other factors besides satisfaction will have impact on customer loyalty. According to Rasmey
and Sohi (1997), there is a correlated between customer satisfaction and customer loyalty. Customer
satisfaction play vital role in enhancing and maintain long-term relationship among companies and their
customers and customer satisfaction is reveled to be improved predictor of customer loyalty (Haq & Amin,
2009).
According to Kuuisk (2007), there is a direct connection among loyalty and satisfaction. Customers will
loyalty if they are satisfied with the product or services while dissatisfied customer will switches to
another vendor. So, customer satisfaction can act as a connection between customer participation and
loyalty. Satisfaction does not imply necessary loyalty, but generally affect it (Chirico & Presti,
2008).According to Akbar and Parvez (2009), customer satisfaction act as reaction which result from a
method of assessing what has been received against what was expected which including needs and wants
related with the purchase ad purchase decision itself. Satisfaction also acts as a person's feeling of
pleasure or disappointment resulting from comparing a product's perceived performance in relation to his
or her expectation (Singh, 2006).
Customers will only repurchase if they are satisfied with the product or service (Gronroos, 2007 p. 144;
Han & Ryu, 2009). Repurchase is the effect of cumulative satisfaction rather than individual episodic
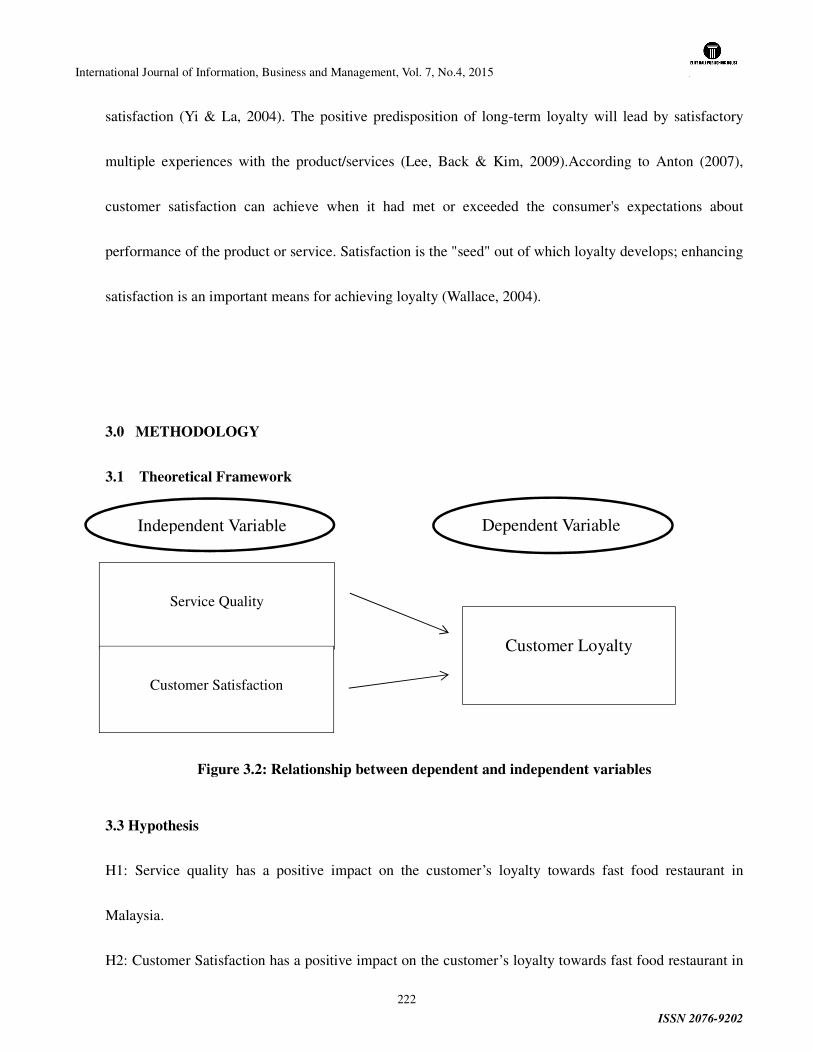
International Journal of Information, Business and Management, Vol. 7, No.4, 2015
ISSN 2076-9202
222
satisfaction (Yi & La, 2004). The positive predisposition of long-term loyalty will lead by satisfactory
multiple experiences with the product/services (Lee, Back & Kim, 2009).According to Anton (2007),
customer satisfaction can achieve when it had met or exceeded the consumer's expectations about
performance of the product or service. Satisfaction is the "seed" out of which loyalty develops; enhancing
satisfaction is an important means for achieving loyalty (Wallace, 2004).
3.0 METHODOLOGY
3.1 Theoretical Framework
Figure 3.2: Relationship between dependent and independent variables
3.3 Hypothesis
H1: Service quality has a positive impact on the customer’s loyalty towards fast food restaurant in
Malaysia.
H2: Customer Satisfaction has a positive impact on the customer’s loyalty towards fast food restaurant in
Dependent Variable Independent Variable
Customer Loyalty
Service Quality
Customer Satisfaction
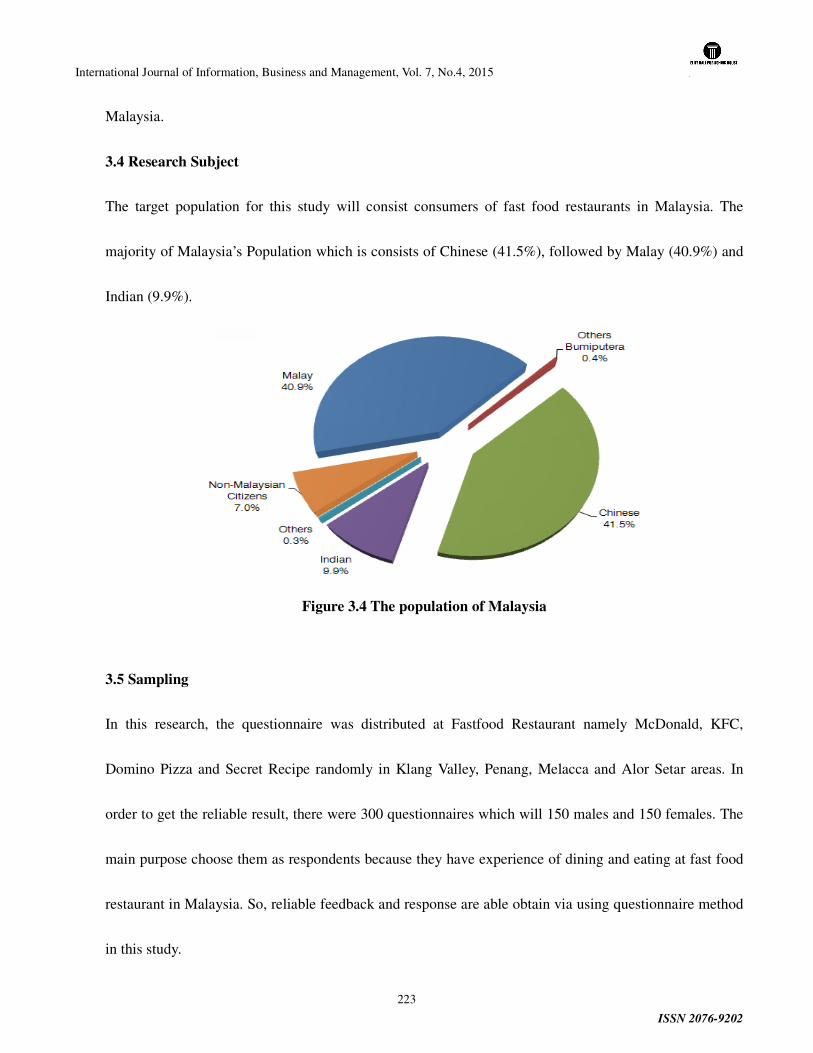
International Journal of Information, Business and Management, Vol. 7, No.4, 2015
ISSN 2076-9202
223
Malaysia.
3.4 Research Subject
The target population for this study will consist consumers of fast food restaurants in Malaysia. The
majority of Malaysia’s Population which is consists of Chinese (41.5%), followed by Malay (40.9%) and
Indian (9.9%).
Figure 3.4 The population of Malaysia
3.5 Sampling
In this research, the questionnaire was distributed at Fastfood Restaurant namely McDonald, KFC,
Domino Pizza and Secret Recipe randomly in Klang Valley, Penang, Melacca and Alor Setar areas. In
order to get the reliable result, there were 300 questionnaires which will 150 males and 150 females. The
main purpose choose them as respondents because they have experience of dining and eating at fast food
restaurant in Malaysia. So, reliable feedback and response are able obtain via using questionnaire method
in this study.
International Journal of Information, Business and Management, Vol. 7, No.4, 2015
ISSN 2076-9202
224
3.6 Questionnaire
This study was conducted using questionnaire method because its ability provide accurate feedback,
cheap, do not require as much effort from the questioner and the answers are standardized which is easy
to compile data. An close-ended questions will be created in the questionnaire and respondent only need
to pick an answer from a given number of options. Questions flows will arrange from the least sensitive to
the most sensitive in order to achieve the best response rates. Five-point likert scale from 5 (strongly
agree) to 1 (strongly disagree). It could asists respondents easier to make their choice for each item by
putting number and opinion can express with the particular statement. The research questionnaire will
separate into four sections.
3.6.1 Structure of Questionnaire
Questionnaire will consists 4 sections whereby section A is about demographic profile, section B is
general questions while section C is about independent variable and section D is the dependent variable
question. There are 39 questions involve in my questionnaire as shown below:
For section A, it will focus about demographic profile of the respondent. In this section its consist of 3
question the question is about the gender, ethnic and age will cover in this section and it is use nominal
scale and presence-absence method which is "yes" or "no".
For section B, it is focus on general question and includes 6 questions which involves factors of influence
respondents' decisions to eat at fast-food restaurant, frequently visiting of a restaurant, method influence
of visiting the restaurant and others. Further information there are five-point likert scale from 5 (strongly
agree) to 1 (strongly disagree) nominal scale and presence-absence are using in this section.
International Journal of Information, Business and Management, Vol. 7, No.4, 2015
ISSN 2076-9202
225
For section C, it will focus on independent variable which includes service quality and customer
satisfaction influence customer loyalty towards fast food restaurant. There are 10 questions in this section
which have five-point likert scale from 5 (strongly agree) to 1 (strongly disagree) are also using in this
section.
Lastly for section D, it will focus on dependent variable which influence by the indenpent variable that
includes service quality and customer satisfaction. In the questionaire there are 5 questions which give
respondent to choose from five-point likert scale from 5 (strongly agree) to 1 (strongly disagree) are using
in this section.
As a conclusion, there are 24 questions consists in the questionaire to test the reliablility of the factors that
influence the customer loyalty among the customer towards fast food restaurant in Malaysia. Finally, the
data collected will be analyzed using SPSS software analysis.
4.0 PRESENTATION AND INTERPRETATIONS OF RESULTS
The results are obtained through the Statistical Package for the Social Sciences (SPSS).The first section
states the respondent’s profile. Frequency and percentage were used to show generally the distribution of
the profile in respect of the respondent. Subsequently, goodness of measures was examined by using
factor analysis and reliability analysis, followed by the third section, which provides the inter-correlation
between all the variables that are studied and descriptive statistics that showed the mean and standard
deviation of the factors. Then, the hypotheses from the proposed model were tested through hierarchical
regression analysis. Last but not least, the summary of the findings will be presented at the end of this
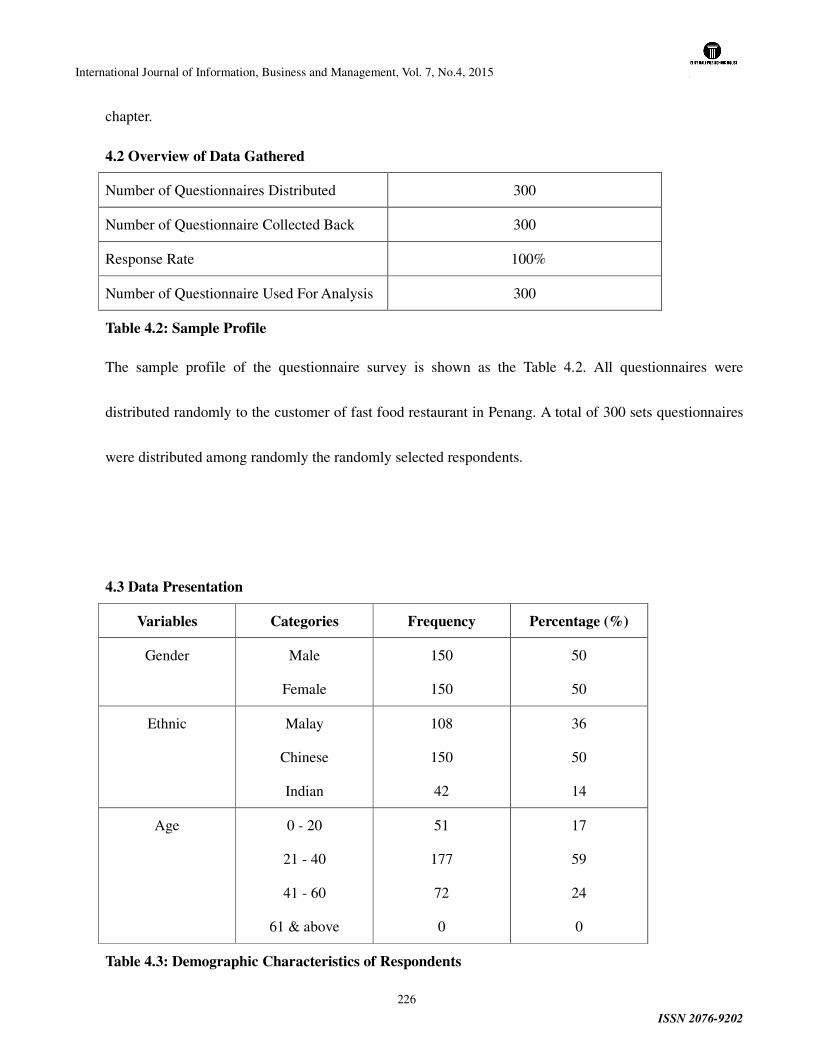
International Journal of Information, Business and Management, Vol. 7, No.4, 2015
ISSN 2076-9202
226
chapter.
4.2 Overview of Data Gathered
Number of Questionnaires Distributed 300
Number of Questionnaire Collected Back 300
Response Rate 100%
Number of Questionnaire Used For Analysis 300
Table 4.2: Sample Profile
The sample profile of the questionnaire survey is shown as the Table 4.2. All questionnaires were
distributed randomly to the customer of fast food restaurant in Penang. A total of 300 sets questionnaires
were distributed among randomly the randomly selected respondents.
4.3 Data Presentation
Variables Categories Frequency Percentage (%)
Gender Male
Female
150
150
50
50
Ethnic Malay
Chinese
Indian
108
150
42
36
50
14
Age 0 - 20
21 - 40
41 - 60
61 & above
51
177
72
0
17
59
24
0
Table 4.3: Demographic Characteristics of Respondents
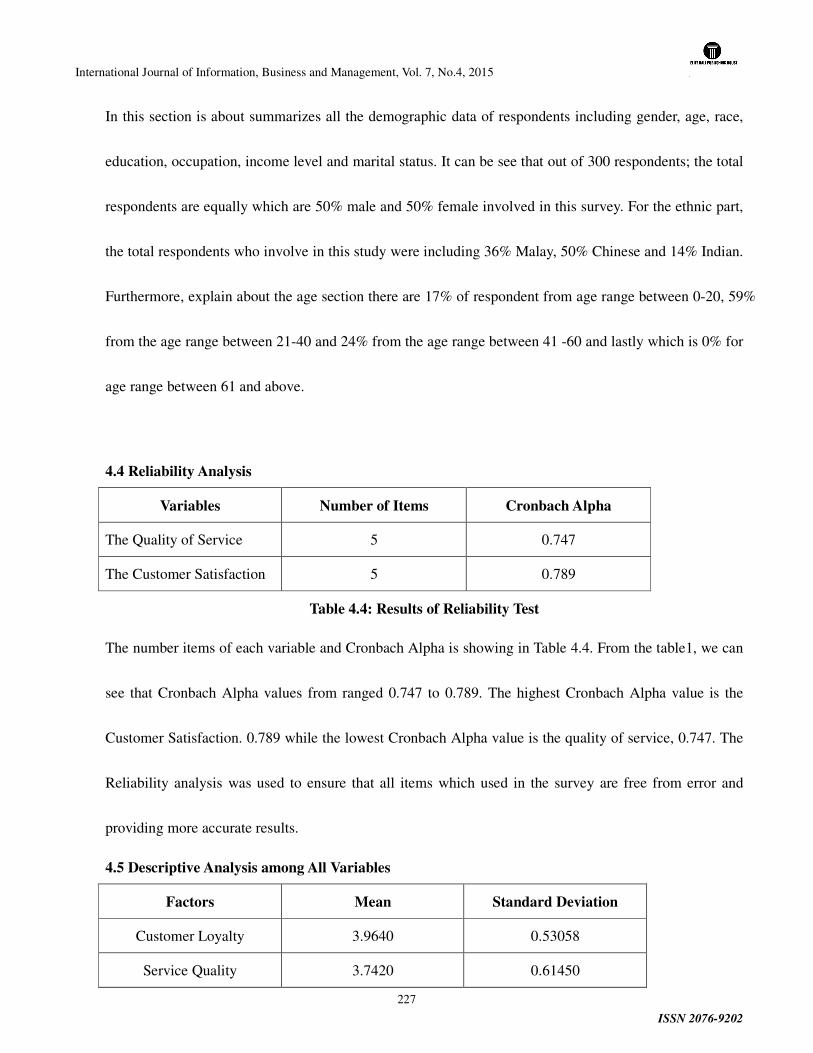
International Journal of Information, Business and Management, Vol. 7, No.4, 2015
ISSN 2076-9202
227
In this section is about summarizes all the demographic data of respondents including gender, age, race,
education, occupation, income level and marital status. It can be see that out of 300 respondents; the total
respondents are equally which are 50% male and 50% female involved in this survey. For the ethnic part,
the total respondents who involve in this study were including 36% Malay, 50% Chinese and 14% Indian.
Furthermore, explain about the age section there are 17% of respondent from age range between 0-20, 59%
from the age range between 21-40 and 24% from the age range between 41 -60 and lastly which is 0% for
age range between 61 and above.
4.4 Reliability Analysis
Variables Number of Items Cronbach Alpha
The Quality of Service 5 0.747
The Customer Satisfaction 5 0.789
Table 4.4: Results of Reliability Test
The number items of each variable and Cronbach Alpha is showing in Table 4.4. From the table1, we can
see that Cronbach Alpha values from ranged 0.747 to 0.789. The highest Cronbach Alpha value is the
Customer Satisfaction. 0.789 while the lowest Cronbach Alpha value is the quality of service, 0.747. The
Reliability analysis was used to ensure that all items which used in the survey are free from error and
providing more accurate results.
4.5 Descriptive Analysis among All Variables
Factors Mean Standard Deviation
Customer Loyalty 3.9640 0.53058
Service Quality 3.7420 0.61450
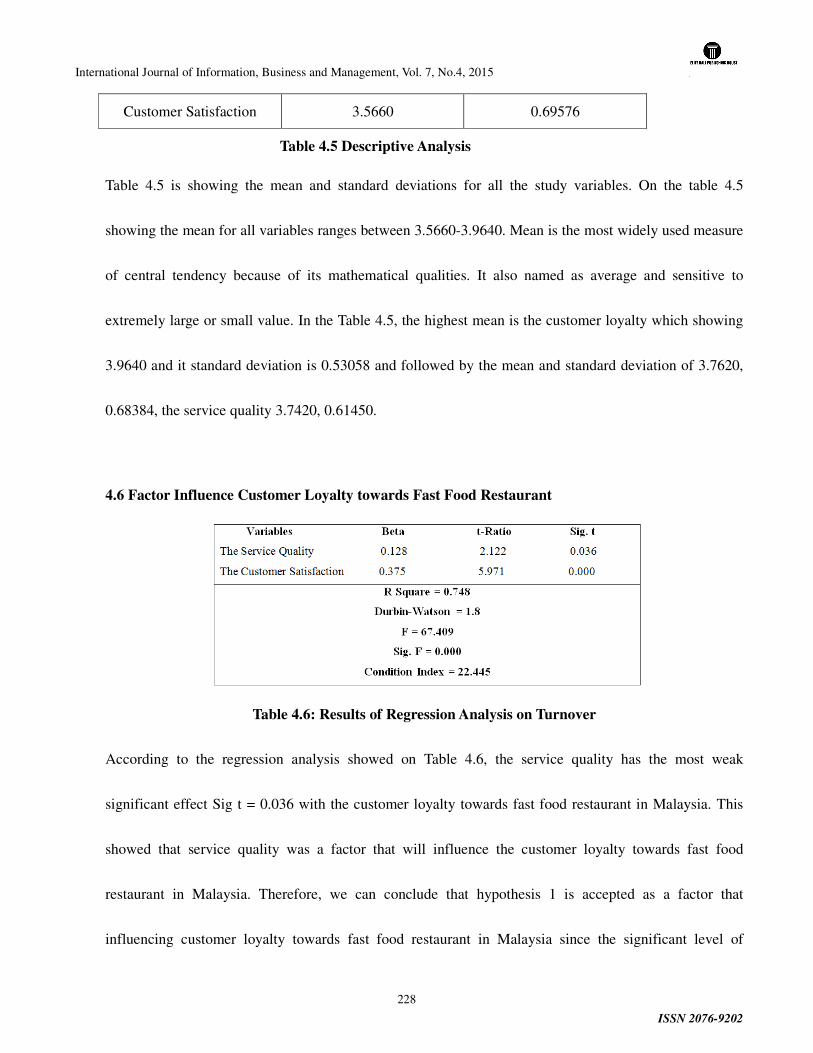
International Journal of Information, Business and Management, Vol. 7, No.4, 2015
ISSN 2076-9202
228
Customer Satisfaction 3.5660 0.69576
Table 4.5 Descriptive Analysis
Table 4.5 is showing the mean and standard deviations for all the study variables. On the table 4.5
showing the mean for all variables ranges between 3.5660-3.9640. Mean is the most widely used measure
of central tendency because of its mathematical qualities. It also named as average and sensitive to
extremely large or small value. In the Table 4.5, the highest mean is the customer loyalty which showing
3.9640 and it standard deviation is 0.53058 and followed by the mean and standard deviation of 3.7620,
0.68384, the service quality 3.7420, 0.61450.
4.6 Factor Influence Customer Loyalty towards Fast Food Restaurant
Table 4.6: Results of Regression Analysis on Turnover
According to the regression analysis showed on Table 4.6, the service quality has the most weak
significant effect Sig t = 0.036 with the customer loyalty towards fast food restaurant in Malaysia. This
showed that service quality was a factor that will influence the customer loyalty towards fast food
restaurant in Malaysia. Therefore, we can conclude that hypothesis 1 is accepted as a factor that
influencing customer loyalty towards fast food restaurant in Malaysia since the significant level of
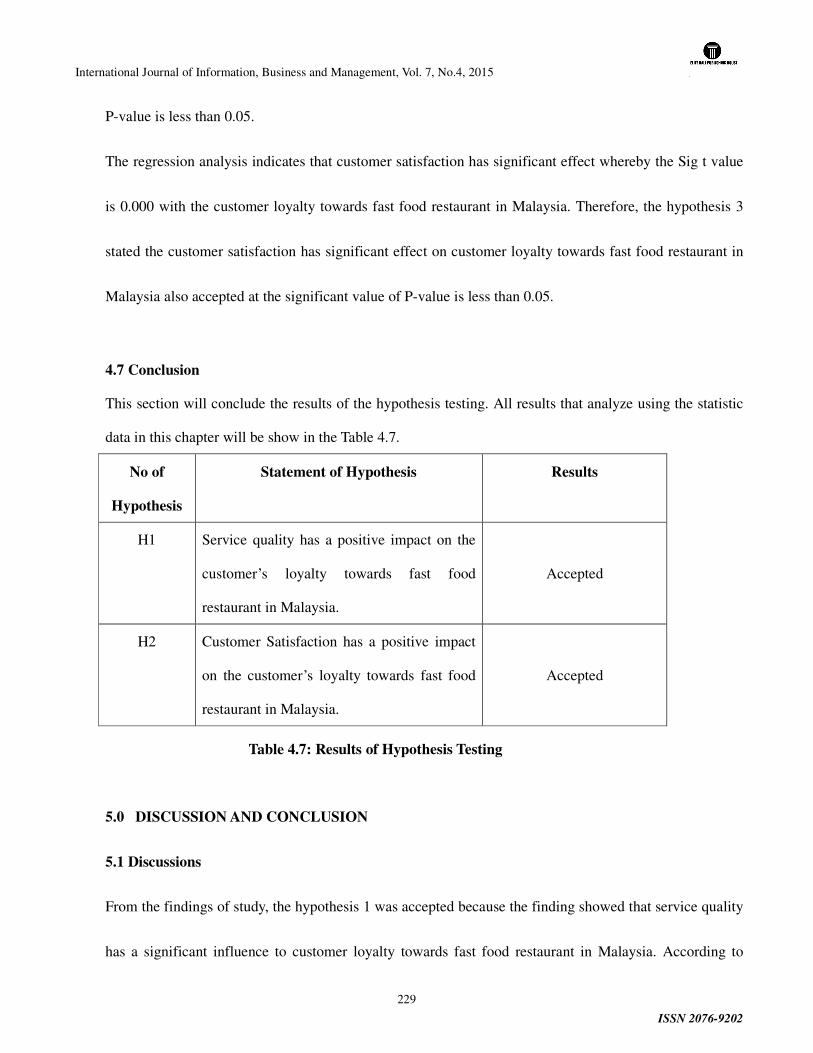
International Journal of Information, Business and Management, Vol. 7, No.4, 2015
ISSN 2076-9202
229
P-value is less than 0.05.
The regression analysis indicates that customer satisfaction has significant effect whereby the Sig t value
is 0.000 with the customer loyalty towards fast food restaurant in Malaysia. Therefore, the hypothesis 3
stated the customer satisfaction has significant effect on customer loyalty towards fast food restaurant in
Malaysia also accepted at the significant value of P-value is less than 0.05.
4.7 Conclusion
This section will conclude the results of the hypothesis testing. All results that analyze using the statistic
data in this chapter will be show in the Table 4.7.
No of
Hypothesis
Statement of Hypothesis Results
H1 Service quality has a positive impact on the
customer’s loyalty towards fast food
restaurant in Malaysia.
Accepted
H2 Customer Satisfaction has a positive impact
on the customer’s loyalty towards fast food
restaurant in Malaysia.
Accepted
Table 4.7: Results of Hypothesis Testing
5.0 DISCUSSION AND CONCLUSION
5.1 Discussions
From the findings of study, the hypothesis 1 was accepted because the finding showed that service quality
has a significant influence to customer loyalty towards fast food restaurant in Malaysia. According to
International Journal of Information, Business and Management, Vol. 7, No.4, 2015
ISSN 2076-9202
230
Wong (2004), service quality positively would affect emotional satisfaction that in turn would have
positive effect on both customer loyalty and relationship quality. This had been supported by the previous
research as same with this current research that service quality has positive significant influence to
customer loyalty towards fast food restaurant in Penang.
Hypothesis 2 examined the relationship between customer satisfaction will influence customer loyalty
toward fast food restaurant in Malaysia. This supported by Kuuisk (2007), there is a direct connection
among loyalty and satisfaction.in this situation show that, most of the customer satisfaction will influence
the loyalty toward a fast food restaurant. High satisfaction will get a loyal customer, in the other hand low
degree of satisfaction will affect the loyalty towards a restaurant. Gilbert and Veloutsou (2006) research is
contradicted with the result of this research and it showed that high levels of customer satisfaction will led
to greater customer loyalty and automatically will have good impact in aspects of company performance.
These show that the result had same with the previous research which had a positive significant influence
to customer loyalty towards fast food restaurant in Malaysia.
5.2 Implication
The result of the study has showed the connection between service quality and customer satisfaction will
influence customer loyalty towards fast food restaurants in Malaysia. Thus, the information that obtains
this research will able to give helpful information to the owner of fast food restaurant or franchisor in
identifying the factors influence customer loyalty towards fast food restaurants in Malaysia. It also let
International Journal of Information, Business and Management, Vol. 7, No.4, 2015
ISSN 2076-9202
231
them more understand what the customer needs and wants in order to increase their restaurants’ revenue
and at the same time enhance the image and reputation of its restaurants. It also leads an entrepreneur or
owner of restaurant take the right action in aspects of establishing its sales volume and expanding their
business as well.
5.3 Limitation of Research
It was necessary to recognize the limitations of the current study. Firstly, the limitation of this study was
time constraints due to the overload of assignment to be done. There were tons of assignment have
distributed. This was the major obstacles that impede the process of this study.
Next, as some of the respondents are known to the researcher, there might be a potential of respondents
bias when answering the questionnaires. Furthermore, most of the respondents were rushing time,
therefore they might not answer the questionnaire without much considerations and understanding in the
question asked. The bias and the inaccurate answering might cause some variance in the study. Specific
age group among respondents, time constraints, small sample size, biases, inaccurate answers, and,
contributes to the limitations of this study
Conclusion
By this research, the entire objective that set was achieved. From the finding, the service quality and
customer satisfaction had a significant affect customer loyalty towards fast food restaurant in Malaysia.
So, it enable future researcher can do analyze and examined others than those factors that will influence
customer loyalty towards fast food restaurants in Malaysia. Last but not least, it also can act as guideline
International Journal of Information, Business and Management, Vol. 7, No.4, 2015
ISSN 2076-9202
232
for all entrepreneur and owner of fast food restaurant to improve their business growth in terms of
performance and revenue as well. It also leads a hand in terms of attracting new customers and at the
same time retain existing customer to dine-in at its restaurant. It also allows all entrepreneurs or owner of
restaurant understand what the customers' need and want so that they can make some improvement to this
issues.
Bibliography
Brand . (2014, May 6). Retrieved from Wikipedia, The Free Encyclopedia: http://en.wikipedia.org/wiki/Brand
Customer Loyalty. (2014). Retrieved from Business Dictionary: http://www.businessdictionary.com/definition/customer-loyalty.html
Customer Satisfaction. (2014, May 21). Retrieved from Wikipedia,the free encyclopedia: http://en.wikipedia.org/wiki/Customer_satisfaction
What is Service Quality. (2014). Retrieved from Business Dictionary: http://www.businessdictionary.com/definition/service-quality.html
Why is customer satisfaction so important? (2014). Retrieved from Ask.com: http://www.ask.com/question/why-is-customer-satisfaction-so-important
Abdllat, M. M. (n.d.). Customer satisfaction.
Abraheen, A., & Mohammad, S. Y. (2011). Service quality perspectives and customer satisfaction in Connercial Banks Working in Jordan. Middle Eastern Finance and Economics, 2.
Admin, W. (n.d.). Customer Loyalty & Retention. Retrieved from What is Customer Loyalty: http://www.customerloyalty.org/what-is-customer-loyalty/
Agnieszka Jaworowska, T. B. (2013). Nutritional challenges and health implications of takeaway and Fast Food. Nutrition Reviews, 310-318.
Aksu. (2006). Gap Analysis In Customer Loyalty. A research in 5-star hotels in the Antalya region of Turkey. 187-205.
Aksu. (2006). Gap analysis in customer loyalty: A research in 5-star hotel in the Antalya region of Turkey. Quant, 187-205.
Aksu, A. (2006). Gap analysis in customer loyalty: A research in 5-star hotels in the Antalya region of Turkey Qual. Quant. 187-205.
Ali, F. (2012). An Assessment og the Service Quality Using GAP Analysis: A Study Conducted at Chitrai, Pakistan. Journal of Contemporary Research In Business Vol4, No3, 1-8.
Baldinger, A., & Rubinson, J. (1996). Brand Loyalty:the link between attitude and behavior . Journal of Advertising Research 36(6), 22-34.
International Journal of Information, Business and Management, Vol. 7, No.4, 2015
ISSN 2076-9202
233
Benjamin, O. A., & Samuel, O. O. (n.d.). Personality Attributes as Predictors of Nigeria Customer. International Journal of Business and Management Invention, 2014.
Bloemer, J., & Ruyter. (1998). On the relationship between store image, store satisfaction and store loyalty. European Journal of Marketing.
Brady, M., & Cronin, J. (2001). Customer orientation: effects on customer service perceptions and outcome behaviors. Journal of Service Research Vol3 No3 , 241-251.
Brady, M., & Cronin, J. (2001). Customer Orientation: effects on customer service perceptions and outcome behaviors. Journal of Service Research, Vol3 No3, 241-251.
Carlsson, M. H. (2010). Service Quality- expectations, perceptions and satisfaction about Service Quality at Destination Gotland.
Clottey, T. A., Coller, D. A., & Stodnick, M. (2008). Driver of Customer loyalty in a Retail Store Envionment. Journal of Service Science , 3.
Clottey, T. A., Collier, D. A., & Stodnick, M. (2008). Driver of Customer Loyalty In A Retail Store Environment. Journal of Service Science, 3.
Crosby, L. A., & Cowles, K. &. (1990). Quality in Service Selling: An Interpersonal Influence Perspective. Journal of Marketing, 71-84.
Customer Loyalty and Retention. (n.d.). Retrieved from www.customerloyalty.org: http://www.customerloyalty.org/what-is-customer-loyalty/
D, J., & AS, M. (2005). An examination of restaurant loyalty programs: what kinds of rewards do customer prefer. International Journal of Contemporary Hospitality management Vol 17 No 5 (2005) pp 402-408 Journal of Service Marketing Vol 20 No 5, 298-308.
D, W., & J, G. J. (2004). Customer retailer loyalty in the context of multiple channel strategies. Journal of Retailing, 249-263.
Davidson. (2002, June 20). Beginner's Guide For Descriptive Statistics. Retrieved from Bio.davidson: http://www.bio.davidson.edu/courses/bio111labman/lab%207.html
Dick, A., & Basu, K. (1994). Customer loyalty: toward an integrated cnceptual framework. Journal of Marketing Science, Vol. 22 No. 2 , 99-113.
Dick, A., & Basu, K. (1994). Customer loyalty: toward an integrated conceptual framework. Journal of Marketing Science, 99-113.
Duffy, D. (1998). Consumer loyalty strategies . Journal of Consumer MArketing Vol.15 No.5, 435-485.
Duffy, D. L. (2005). The evolution of customer loyalty strategy. Journal of Consumer Marketing, 284-286.
East, R., Gendall, P., & Lomax, K. H. (n.d.). Consumer Loyalty: Singular, Additive or Interactive?
Europe, A. (2012, March). Background, definitions and scope. Retrieved from Alzheimer Europe: http://www.alzheimer-europe.org/Ethics/Ethical-issues-in-practice/Ethics-of-dementia-research/Background-definitions-and-scope?#fragment-1
F, M., M.M, N., S.M., K., Z, S., & N., A. (2011). Impact of customer satisfacion on customer loyalty and intentions to switch: Evidence from banking sector of Pakistan. Internaltion Journal of Business and Social, 3(2): 1982-1991.
Freeman. (2007). Fast Food: Oppression through Poor Nutrition. California Law Review, Inc.
Freeman. (2007). Fast Food: Oppression through poor Nutrition . California Law Review , 2221-2259.
G, G. R., & C, V. (n.d.). A cross-industry comparison of customer satisfaction.
Gee R, C. G. (2008). Understanding and profitably managing customer loyalty. 359-374.
International Journal of Information, Business and Management, Vol. 7, No.4, 2015
ISSN 2076-9202
234
Gupta. (1999). SPSS for Beginners. VJBooks Inc, 268.
H, S. (2006). The Importance of Customer Satisfaction in Relation to Customer Loyalty and Retention. Academy of Marketing Science, 193-225.
Hellesvig-Gaskell, K. (2013, Aug 16). Definition of Fast Foods. Retrieved from LiveStrong: http://www.livestrong.com/article/49366-definition-fast-foods/
J, B., & H, K. (1995). The complex relationship between consumersatisfaction and brand loyalty. Journl of Economic Physhology, 311-329.
Jaipura, A. (n.d.). The Dark Side of Customer Relationship Management in the Luxury segment of the Hotel Industry.
Jayawardhena, C. (2011). Effects of retail employees behaviours on customers' service evaluation. International Journal of Retail & Distribution Management Vol.39 No3 , 203-217.
JL, H., TO, J., GW, L., WE, S., & LA, S. (1994). Putting the Service-Profit Chain to Work. Harward Business Review, 164-174.
Kabir, M. H., & Carlsson, T. (2010). Service Quality.
Katherine W.Bauer, M. M. (2012). Energy Content of U.S .Fast-Food Restaurant Offerings. American Journal of Preventive Medicine, 490-493.
Katherine W.Bauer, M. M. (2012). Energy Content of U.S .Fast-Food Restaurant Offerings. American Journal of Preventive Medicine, 490-493.
Kirk, A. (2008). Explaining Cronbach's Alpha. Japan: University of Oklahoma.
Kotler. (2011). Marketing Management. Upper Saddle River: Pearson/Prentice Hall.
Kriswintari, D. (2012, May). The Advantage and Disadvantages of Eating Fast Food. Retrieved from www.studymode.com: http://www.studymode.com/essays/The-Advantage-And-Disadvantages-Of-Eating-1006163.html
Kuusik, A. (2007). Affecting customer loyalty: Do different factor have various influences in different loyalty levels? Journal of Business & Economic, 59-72.
Levesque, T., & McDougall, G. (1996). Determinants of Customer Satisfaction in Retail Banking. International Journal of Banking Marketing. 14(7), 12-20.
Linda Shields, A. T. (2003, November 15). The difference between quantitative and qualitative research. Retrieved from http://www.rcn.org.uk/: http://www.rcn.org.uk/__data/assets/pdf_file/0016/9214/Quantitative_qualitative.pdf
Mark D.Uncles, G. R. (2003). Customer loyalty and customer loyalty programs. Journal of Consumer Marketing.
Mark D.Uncles, G. R. (2003). Customer loyalty and customer loyalty programs. Journal of Consumer Marketing, 294-316.
Mary O.Hearst, L. J. (2013). Nutritional Quality at Eight U.S. Fast Food Chains 14-Year Trends. American Journal of Preventive Medicine, 589-593.
Mary O.Hearst, L. J. (2013). Nutritional Quality at Eight U.S. Fast Food Chains 14-Year Trends. American Journal of Preventive Medicine, 589-593.
McAlexander, J. a. (2007). Service Quality Measurement. Journal of Health Care Marketing, Vol. 14 No. 3, 34-40.
McAlexander, J. K., & H.F, K. (1994). Service Quality Management. Journal of Health Care Marketing Vol. 14 No. 3, 34-40.
McAlexander, J. K., & H.F., K. (1994). Service Quality Measurement. Journal of Health Care Marketing,
International Journal of Information, Business and Management, Vol. 7, No.4, 2015
ISSN 2076-9202
235
Vol. 14 No.3, 34-40.
MIller, J. C., & Karwan, K. (2000). Service recovery: a framework and empirical investigation. Journal of Operations Managment, Vol. 18 , 387-400.
Min, H., & Min, H. (2011). Benchmarking the service quality of fast-food restaurant franchises in the USA: A longitudinal study. Emarld Insight.
Mohammad Haghighi, A. D., & Hoseinpour, A. (2012). Evaluation of factors affecting customer loyalty in the restaurant industry. African Journal of Business Managment Vol. 6(14), 1-8.
Mohammad, A. A. (2011). Service Quality Perspectives and Customer Satisfaction. Middle Eastern Finance and Economics.
Nebert Matelong, B. N. (2013). Determinants of Service Quality for Customer: An overview of Loyalty. LAMBERT Academic Publishing.
Nebert Matelong, B. N. (2013). Determinants of Service Quality for Customers: An overview of Loyalty. LAMBERT Academic Publishing.
Nezakati, H., Kuan, Y. L., & Asgari, O. (2011, May). Factors influencing customer loyalty towards fast food restaurants. Retrieved from EBSCO Host Connection: http://connection.ebscohost.com/c/articles/74613190/factors-influencing-customer-loyalty-towards-fast-food-restaurants
Nezakati, H., Kuan, Y. L., & Asgari, O. (May). EBSCO HOst Connection. Retrieved from 2011: http://connection.ebscohost.com/c/articles/74613190/factors-influencing-customer-loyalty-towards-fast-food-restaurants
Norman. (1991). Service Management: Strategy and Leadership in Service Business John Wiley and Sons.
Oliver. (1997). Satisfaction-behavioural perspective on the consumer, McGraw-Hill,New York,NY.
Ozment, J., & Morash, E. (1994). The augmented service offering for perceived and actual service quality. Journal of the Academy of Marketing Sciences,22(4), 352-363.
Ozment, J., & Morash, E. (1994). The augmented service offering for perceived and actual service quality. Journal of the Academy of Marketing Sciences,22(4), 352-363.
P, C., & AL, P. (2008). A customer loyalty model for services based on a continuing relationship with the provider. Journal of Marketing, 168-171.
P, K., & Kl, K. (2011). Marketing Managment . 14th edn. Upper Saddle River: Pearson/Prentice Hall.
Pearcy, Y. C. (2010). Dynamic pricing: when to entice brand switching and when to reward consumer loyalty. The RAND Journal of Economics, 674-685.
Pearcy, Y. C. (2010). Dynamic pricing: when to entice brand switching and when to reward consumer loyalty. The RAND Journal of Economics, 674-685.
Philip, K. (2003). Management Marketing.
Quality, S. (2014). Service Quality. Retrieved from ASO The Golbal Voice of Quality: http://asq.org/service/
R, G., & Coates G, N. M. (2008). Understanding and profitably managing customer loyalty Mark Intel Plan 26(4). 359-374.
R, H. (1996). The relationships of customer satisfaction, customer loyalty and profitability: an empirical study. International Journal of Service Industry Managment, 7(4): 27-42.
Rechheld, F. a. (2000). E-loyalty: Yout Secret Weapon on the Web. Harvard Business Review, 78, 105-113.
International Journal of Information, Business and Management, Vol. 7, No.4, 2015
ISSN 2076-9202
236
Reichheld, F. (2003, December). The one number you need to grow. Retrieved from Harvard Business Review: http://hbr.org/2003/12/the-one-number-you-need-to-gtow/ar/1
Reichheld, F. (2003). The one number you need to Grow. Harvard Business Review, 485-491.
Robert East, P. G., & Lomax, W. (n.d.). Consumer Loyalty: Aingular, Additive or Interactive? 1-2.
Rowley, J. (2005). The four Cs of customer loyalty. Marketing Intelligence & Planning, 574-581.
Rowley, J. (2005). The four Cs of customer loyalty. Marketing Intelligence & Planning, 574-581.
Rowley, J., & Dawes, J. (1999). Customer loyalty - a relevant concept for libraries? Library Management Vol.20 No.6, 345-351.
S.F, Y., & M.L., K. (n.d.). SERVICE QUALITY AND CUSTOMER SATISFACTION.
Seawright, K. K., & DeTienne, K. B. (2007). An empirical examination of service recovery design. Emerald Insight, 1-22.
Siddharth S. Singh, D. C. (2008). Customer Loyalty Programs: Are They Profitable? INFORMS, 1205-1211.
Siddharth S. Singh, D. C. (2008). Customer Loyalty Programs: Are They Profitable? INFORMS, 1205-1211.
Sierra, J. F., & McQuitty, S. (2005). Service providers and customers: Social exchange theory and service loyalty. Journal of Service Marketing, 392-400.
Steriner. (2003). Starting at the Beginning: An introduction to Coefficient Alpha and Internal Consistency. Journal of Personality Assesment, 99-103.
Suprihanti, A. (1998). The Effect of Services to Customer’s Loyalty. Retrieved from www.share-pdf.com: http://www.share-pdf.com/6213f2a7815041b5ad05470adaedf304/050.htm
Tewsbury, R. (Theoretical and Philosophical Criminology). Qualitative versus Quantitative Methods: Understanding Why Qualitative Methods are. Theoretical and Philosophical Criminology, 39.
Wikipedia. (2014, April 30). Service Quality. Retrieved from Wikipedia The Free Encyclopedia: http://en.wikipedia.org/wiki/Service_quality
Y, K., & J, B. &. (2009). Family restaurant brand personality and its impact on customer's emotion, satisfaction, and brand loyalty. Journal of Hospitality & Tourism Research 33(3), 305-328.
Yi, Y. L. (2004). What influence the relationship betwen customer satisfaction and repurchase intention? Investigating the effects of adjusted expectations and customer loyalty. Psychology & Marketing 21(5), 351-373.
Zeithaml, & Berry, P. (1990). Delivering Quality Service, Balancing Customer Perceptions and Expectations. Free Press.
Zeithaml, V., Parasuraman, A., & Berry, L. (1990). Delivering Quality Service. The Free Press, New York .
Zeithaml, V., Parasuraman, A., & Berry, L. (1990). Delivering Quality Service. The Free Press, New York.
Zineldin. (2000). TRM Total Relationship Managment. Student literature Lund.
APPENDICES
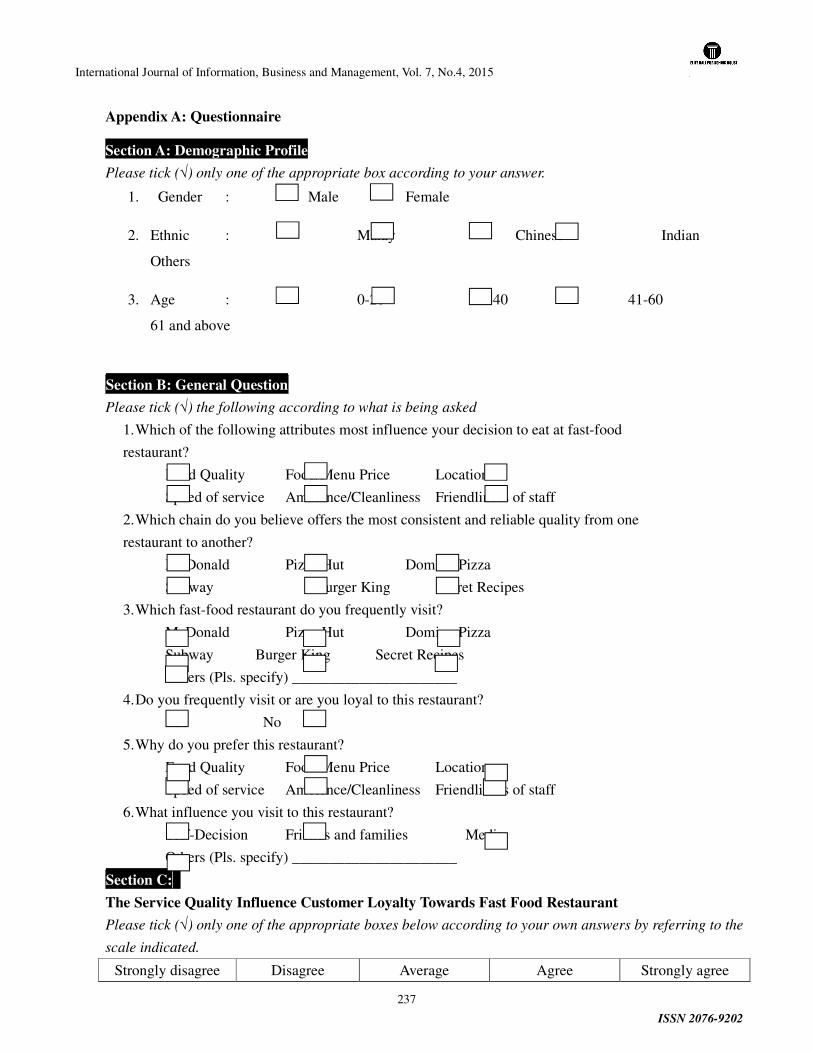
International Journal of Information, Business and Management, Vol. 7, No.4, 2015
ISSN 2076-9202
237
Appendix A: Questionnaire
Section A: Demographic Profile
Please tick (√) only one of the appropriate box according to your answer.
1. Gender : Male Female
2. Ethnic : Malay Chinese Indian
Others
3. Age : 0-20 21-40 41-60
61 and above
Section B: General Question
Please tick (√) the following according to what is being asked
1. Which of the following attributes most influence your decision to eat at fast-food
restaurant?
Food Quality Food/Menu Price Location
Speed of service Ambience/Cleanliness Friendliness of staff
2. Which chain do you believe offers the most consistent and reliable quality from one
restaurant to another?
McDonald Pizza Hut Domino Pizza
Subway Burger King Secret Recipes
3. Which fast-food restaurant do you frequently visit?
McDonald Pizza Hut Domino Pizza
Subway Burger King Secret Recipes
Others (Pls. specify) ______________________
4. Do you frequently visit or are you loyal to this restaurant?
Yes No
5. Why do you prefer this restaurant?
Food Quality Food/Menu Price Location
Speed of service Ambience/Cleanliness Friendliness of staff
6. What influence you visit to this restaurant?
Self-Decision Friends and families Media
Others (Pls. specify) ______________________
Section C:
The Service Quality Influence Customer Loyalty Towards Fast Food Restaurant
Please tick (√) only one of the appropriate boxes below according to your own answers by referring to the
scale indicated.
Strongly disagree Disagree Average Agree Strongly agree
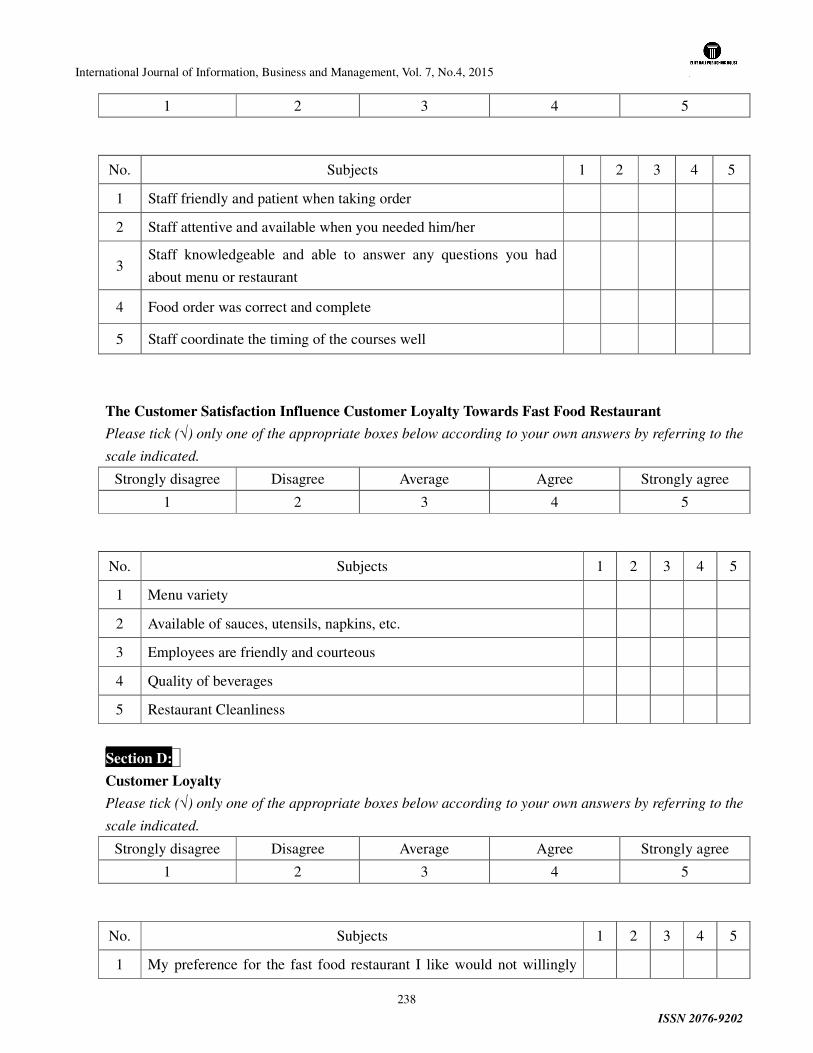
International Journal of Information, Business and Management, Vol. 7, No.4, 2015
ISSN 2076-9202
238
1 2 3 4 5
No. Subjects 1 2 3 4 5
1 Staff friendly and patient when taking order
2 Staff attentive and available when you needed him/her
3 Staff knowledgeable and able to answer any questions you had
about menu or restaurant
4 Food order was correct and complete
5 Staff coordinate the timing of the courses well
The Customer Satisfaction Influence Customer Loyalty Towards Fast Food Restaurant
Please tick (√) only one of the appropriate boxes below according to your own answers by referring to the
scale indicated.
Strongly disagree Disagree Average Agree Strongly agree
1 2 3 4 5
No. Subjects 1 2 3 4 5
1 Menu variety
2 Available of sauces, utensils, napkins, etc.
3 Employees are friendly and courteous
4 Quality of beverages
5 Restaurant Cleanliness
Section D:
Customer Loyalty
Please tick (√) only one of the appropriate boxes below according to your own answers by referring to the
scale indicated.
Strongly disagree Disagree Average Agree Strongly agree
1 2 3 4 5
No. Subjects 1 2 3 4 5
1 My preference for the fast food restaurant I like would not willingly
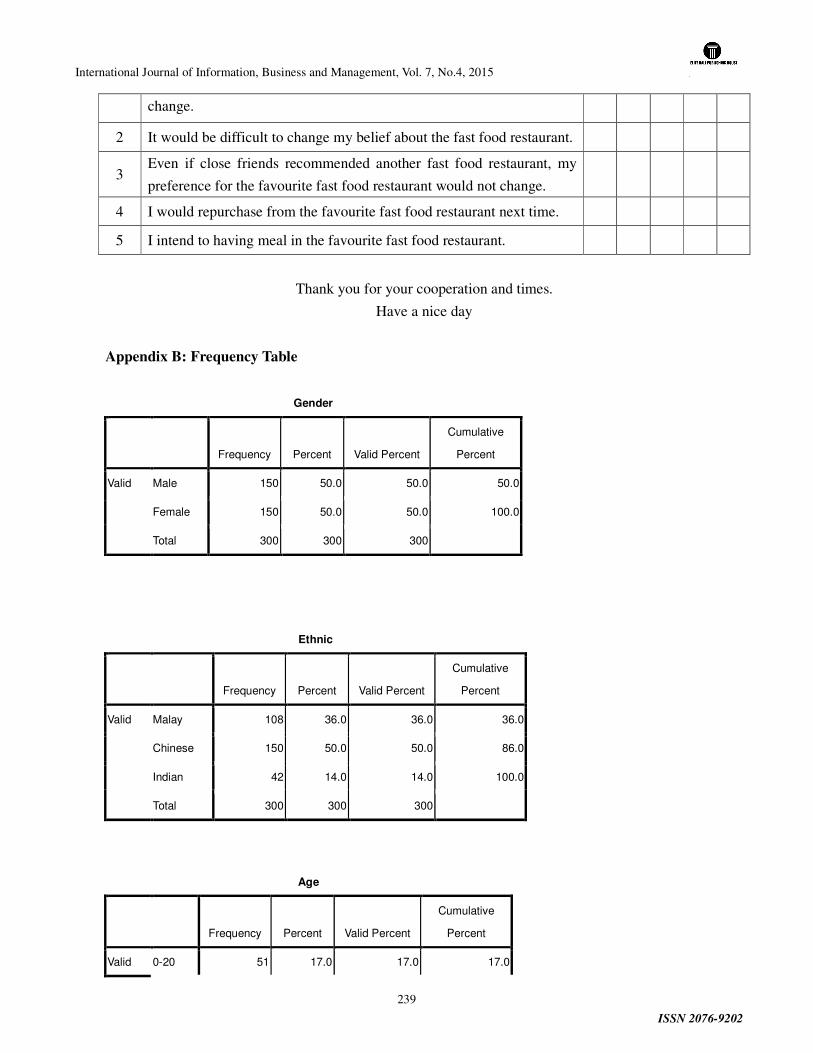
International Journal of Information, Business and Management, Vol. 7, No.4, 2015
ISSN 2076-9202
239
change.
2 It would be difficult to change my belief about the fast food restaurant.
3 Even if close friends recommended another fast food restaurant, my
preference for the favourite fast food restaurant would not change.
4 I would repurchase from the favourite fast food restaurant next time.
5 I intend to having meal in the favourite fast food restaurant.
Thank you for your cooperation and times.
Have a nice day
Appendix B: Frequency Table
Gender
Frequency Percent Valid Percent
Cumulative
Percent
Valid Male 150 50.0 50.0 50.0
Female 150 50.0 50.0 100.0
Total 300 300 300
Ethnic
Frequency Percent Valid Percent
Cumulative
Percent
Valid Malay 108 36.0 36.0 36.0
Chinese 150 50.0 50.0 86.0
Indian 42 14.0 14.0 100.0
Total 300 300 300
Age
Frequency Percent Valid Percent
Cumulative
Percent
Valid 0-20 51 17.0 17.0 17.0
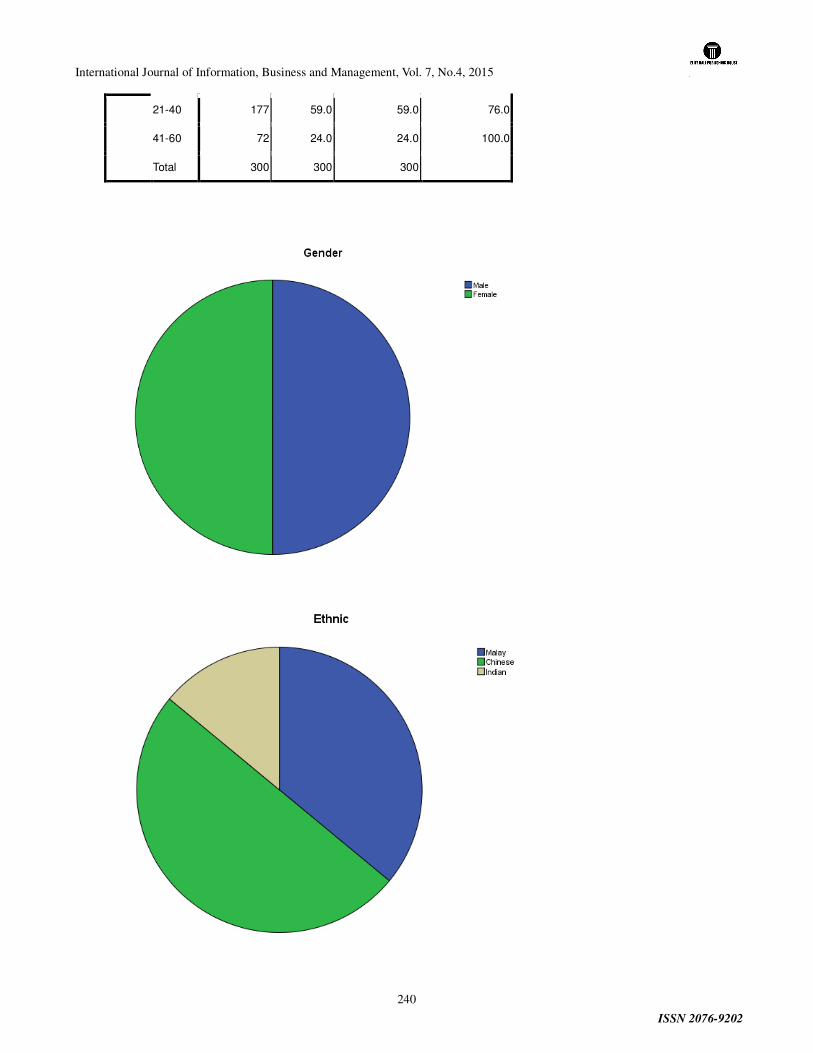
International Journal of Information, Business and Management, Vol. 7, No.4, 2015
ISSN 2076-9202
240
21-40 177 59.0 59.0 76.0
41-60 72 24.0 24.0 100.0
Total 300 300 300
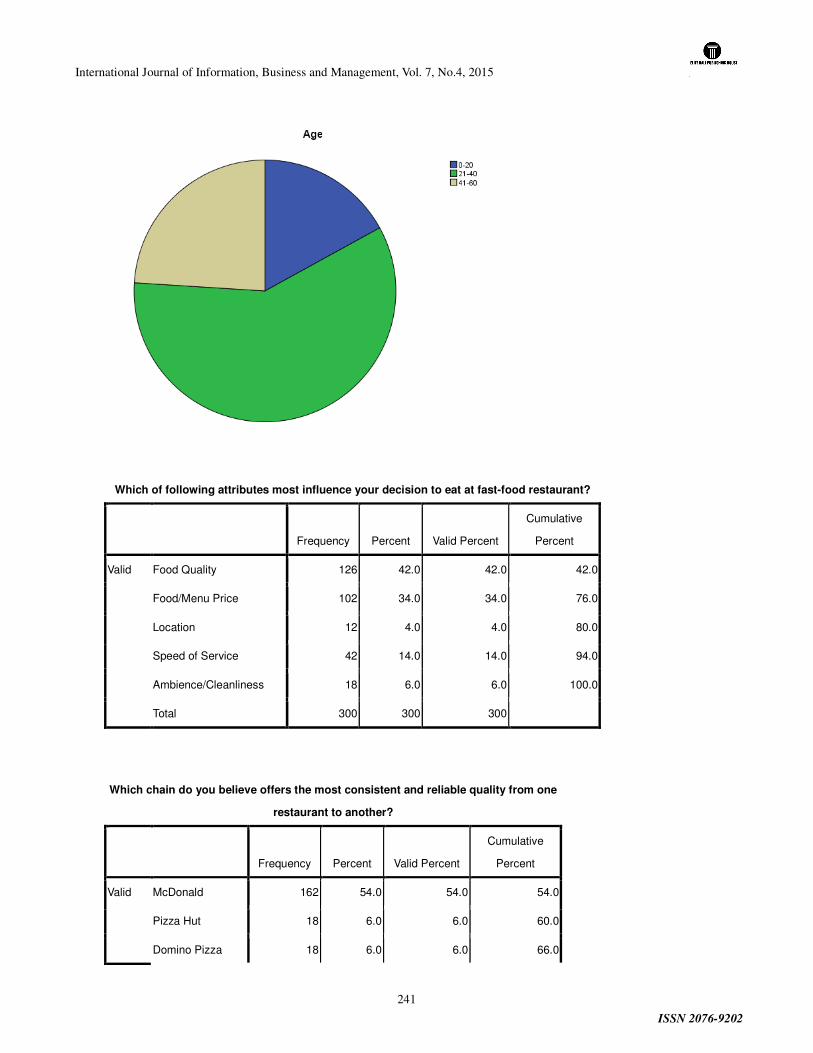
International Journal of Information, Business and Management, Vol. 7, No.4, 2015
ISSN 2076-9202
241
Which of following attributes most influence your decision to eat at fast-food restaurant?
Frequency Percent Valid Percent
Cumulative
Percent
Valid Food Quality 126 42.0 42.0 42.0
Food/Menu Price 102 34.0 34.0 76.0
Location 12 4.0 4.0 80.0
Speed of Service 42 14.0 14.0 94.0
Ambience/Cleanliness 18 6.0 6.0 100.0
Total 300 300 300
Which chain do you believe offers the most consistent and reliable quality from one
restaurant to another?
Frequency Percent Valid Percent
Cumulative
Percent
Valid McDonald 162 54.0 54.0 54.0
Pizza Hut 18 6.0 6.0 60.0
Domino Pizza 18 6.0 6.0 66.0
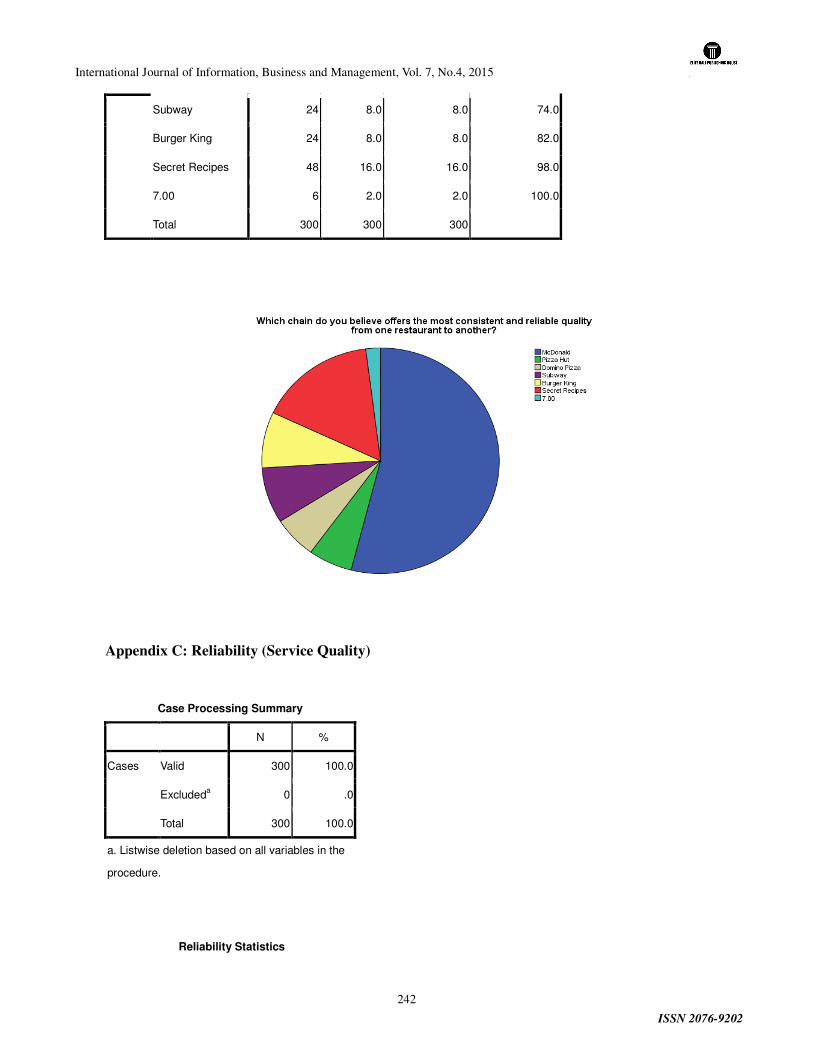
International Journal of Information, Business and Management, Vol. 7, No.4, 2015
ISSN 2076-9202
242
Subway 24 8.0 8.0 74.0
Burger King 24 8.0 8.0 82.0
Secret Recipes 48 16.0 16.0 98.0
7.00 6 2.0 2.0 100.0
Total 300 300 300
Appendix C: Reliability (Service Quality)
Case Processing Summary
N %
Cases Valid 300 100.0
Excludeda 0 .0
Total 300 100.0
a. Listwise deletion based on all variables in the
procedure.
Reliability Statistics
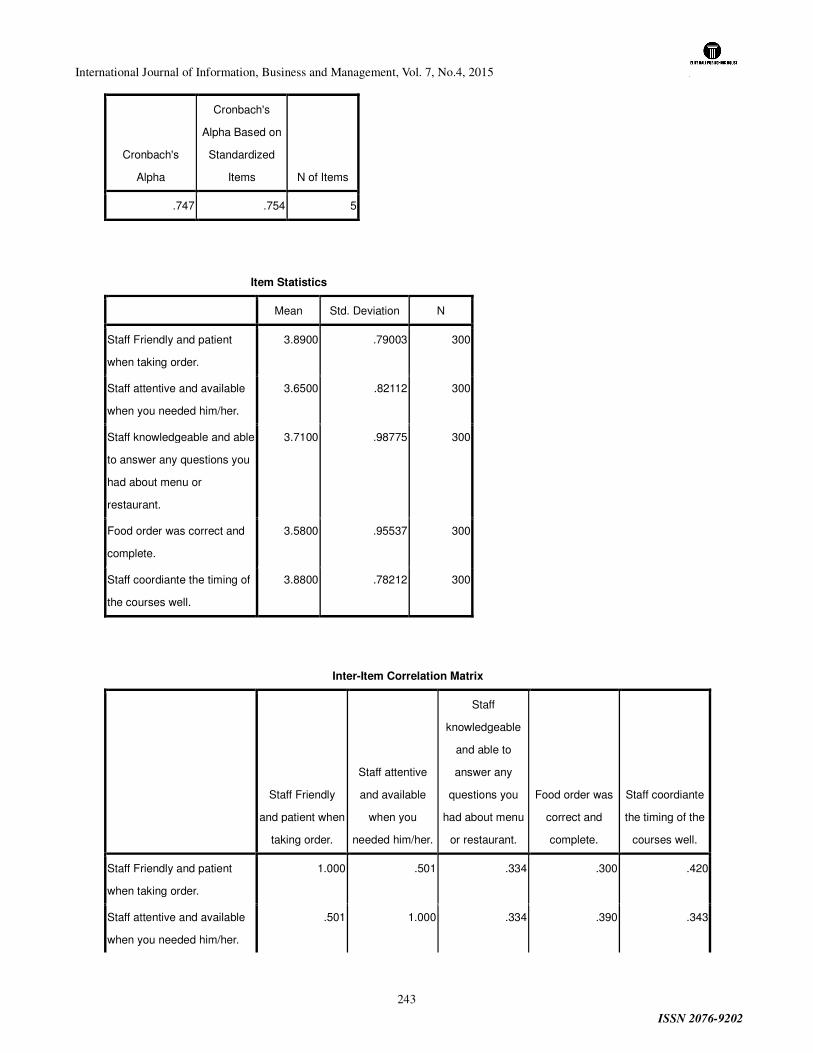
International Journal of Information, Business and Management, Vol. 7, No.4, 2015
ISSN 2076-9202
243
Cronbach's
Alpha
Cronbach's
Alpha Based on
Standardized
Items N of Items
.747 .754 5
Item Statistics
Mean Std. Deviation N
Staff Friendly and patient
when taking order.
3.8900 .79003 300
Staff attentive and available
when you needed him/her.
3.6500 .82112 300
Staff knowledgeable and able
to answer any questions you
had about menu or
restaurant.
3.7100 .98775 300
Food order was correct and
complete.
3.5800 .95537 300
Staff coordiante the timing of
the courses well.
3.8800 .78212 300
Inter-Item Correlation Matrix
Staff Friendly
and patient when
taking order.
Staff attentive
and available
when you
needed him/her.
Staff
knowledgeable
and able to
answer any
questions you
had about menu
or restaurant.
Food order was
correct and
complete.
Staff coordiante
the timing of the
courses well.
Staff Friendly and patient
when taking order.
1.000 .501 .334 .300 .420
Staff attentive and available
when you needed him/her.
.501 1.000 .334 .390 .343
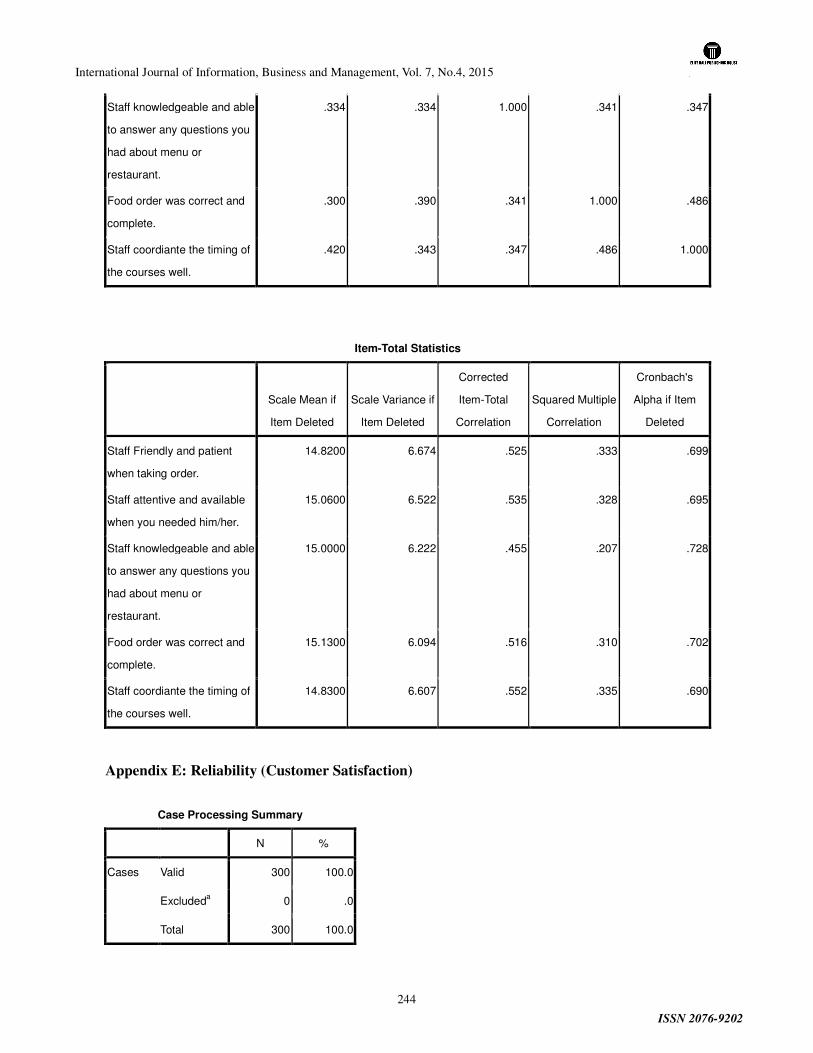
International Journal of Information, Business and Management, Vol. 7, No.4, 2015
ISSN 2076-9202
244
Staff knowledgeable and able
to answer any questions you
had about menu or
restaurant.
.334 .334 1.000 .341 .347
Food order was correct and
complete.
.300 .390 .341 1.000 .486
Staff coordiante the timing of
the courses well.
.420 .343 .347 .486 1.000
Item-Total Statistics
Scale Mean if
Item Deleted
Scale Variance if
Item Deleted
Corrected
Item-Total
Correlation
Squared Multiple
Correlation
Cronbach's
Alpha if Item
Deleted
Staff Friendly and patient
when taking order.
14.8200 6.674 .525 .333 .699
Staff attentive and available
when you needed him/her.
15.0600 6.522 .535 .328 .695
Staff knowledgeable and able
to answer any questions you
had about menu or
restaurant.
15.0000 6.222 .455 .207 .728
Food order was correct and
complete.
15.1300 6.094 .516 .310 .702
Staff coordiante the timing of
the courses well.
14.8300 6.607 .552 .335 .690
Appendix E: Reliability (Customer Satisfaction)
Case Processing Summary
N %
Cases Valid 300 100.0
Excludeda 0 .0
Total 300 100.0
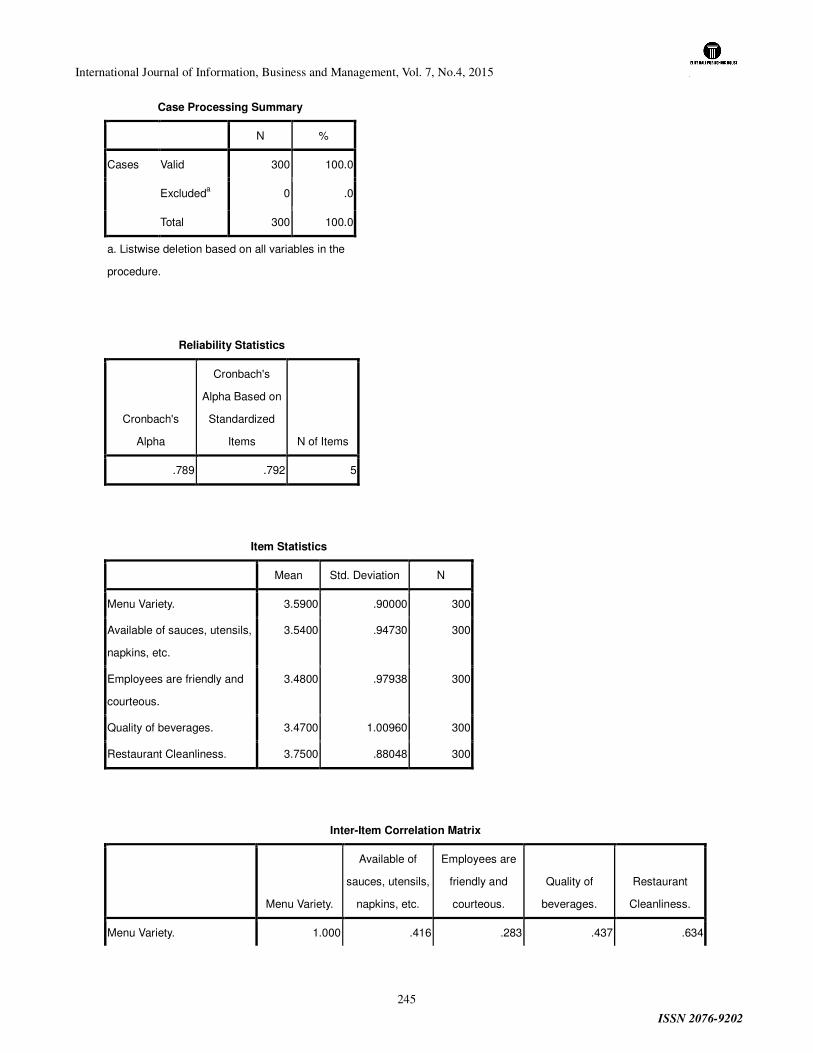
International Journal of Information, Business and Management, Vol. 7, No.4, 2015
ISSN 2076-9202
245
Case Processing Summary
N %
Cases Valid 300 100.0
Excludeda 0 .0
Total 300 100.0
a. Listwise deletion based on all variables in the
procedure.
Reliability Statistics
Cronbach's
Alpha
Cronbach's
Alpha Based on
Standardized
Items N of Items
.789 .792 5
Item Statistics
Mean Std. Deviation N
Menu Variety. 3.5900 .90000 300
Available of sauces, utensils,
napkins, etc.
3.5400 .94730 300
Employees are friendly and
courteous.
3.4800 .97938 300
Quality of beverages. 3.4700 1.00960 300
Restaurant Cleanliness. 3.7500 .88048 300
Inter-Item Correlation Matrix
Menu Variety.
Available of
sauces, utensils,
napkins, etc.
Employees are
friendly and
courteous.
Quality of
beverages.
Restaurant
Cleanliness.
Menu Variety. 1.000 .416 .283 .437 .634
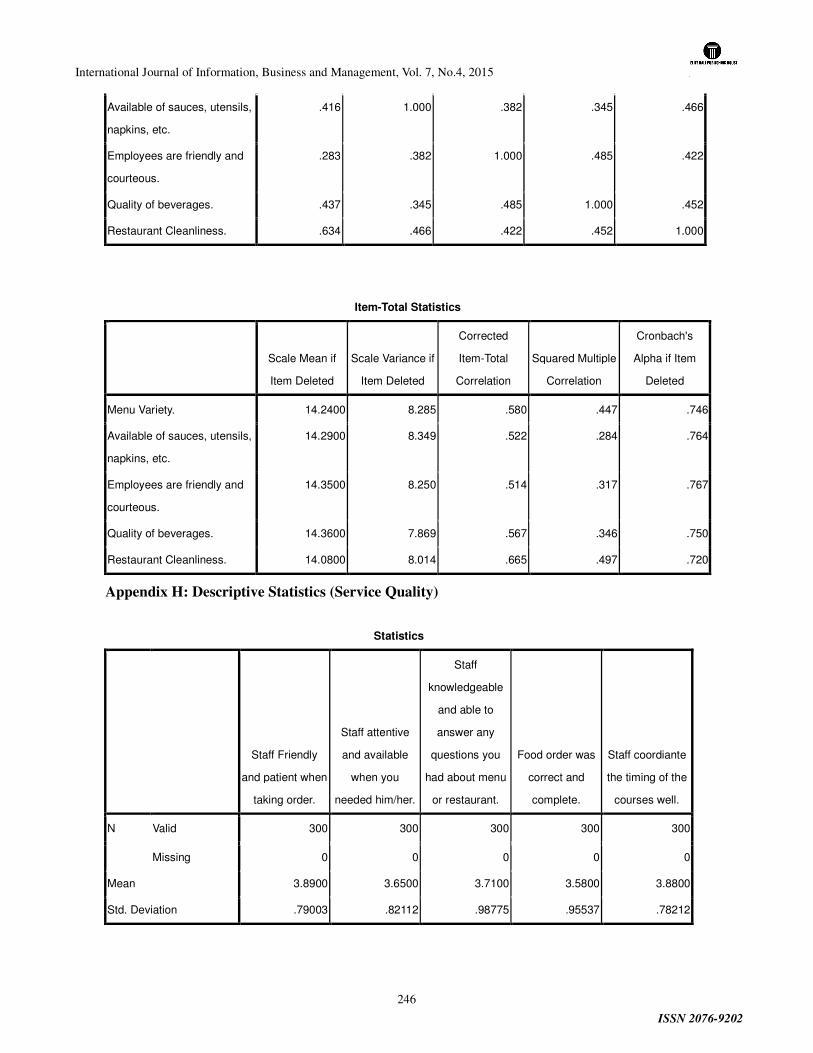
International Journal of Information, Business and Management, Vol. 7, No.4, 2015
ISSN 2076-9202
246
Available of sauces, utensils,
napkins, etc.
.416 1.000 .382 .345 .466
Employees are friendly and
courteous.
.283 .382 1.000 .485 .422
Quality of beverages. .437 .345 .485 1.000 .452
Restaurant Cleanliness. .634 .466 .422 .452 1.000
Item-Total Statistics
Scale Mean if
Item Deleted
Scale Variance if
Item Deleted
Corrected
Item-Total
Correlation
Squared Multiple
Correlation
Cronbach's
Alpha if Item
Deleted
Menu Variety. 14.2400 8.285 .580 .447 .746
Available of sauces, utensils,
napkins, etc.
14.2900 8.349 .522 .284 .764
Employees are friendly and
courteous.
14.3500 8.250 .514 .317 .767
Quality of beverages. 14.3600 7.869 .567 .346 .750
Restaurant Cleanliness. 14.0800 8.014 .665 .497 .720
Appendix H: Descriptive Statistics (Service Quality)
Statistics
Staff Friendly
and patient when
taking order.
Staff attentive
and available
when you
needed him/her.
Staff
knowledgeable
and able to
answer any
questions you
had about menu
or restaurant.
Food order was
correct and
complete.
Staff coordiante
the timing of the
courses well.
N Valid 300 300 300 300 300
Missing 0 0 0 0 0
Mean 3.8900 3.6500 3.7100 3.5800 3.8800
Std. Deviation .79003 .82112 .98775 .95537 .78212
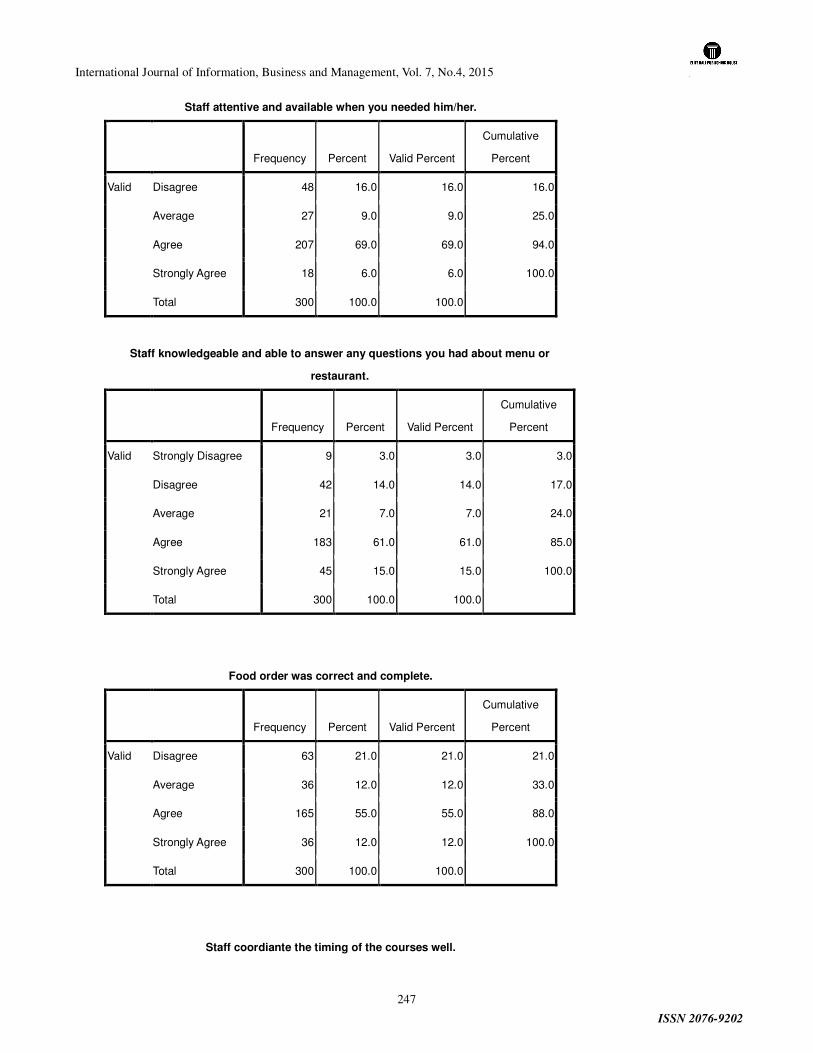
International Journal of Information, Business and Management, Vol. 7, No.4, 2015
ISSN 2076-9202
247
Staff attentive and available when you needed him/her.
Frequency Percent Valid Percent
Cumulative
Percent
Valid Disagree 48 16.0 16.0 16.0
Average 27 9.0 9.0 25.0
Agree 207 69.0 69.0 94.0
Strongly Agree 18 6.0 6.0 100.0
Total 300 100.0 100.0
Staff knowledgeable and able to answer any questions you had about menu or
restaurant.
Frequency Percent Valid Percent
Cumulative
Percent
Valid Strongly Disagree 9 3.0 3.0 3.0
Disagree 42 14.0 14.0 17.0
Average 21 7.0 7.0 24.0
Agree 183 61.0 61.0 85.0
Strongly Agree 45 15.0 15.0 100.0
Total 300 100.0 100.0
Food order was correct and complete.
Frequency Percent Valid Percent
Cumulative
Percent
Valid Disagree 63 21.0 21.0 21.0
Average 36 12.0 12.0 33.0
Agree 165 55.0 55.0 88.0
Strongly Agree 36 12.0 12.0 100.0
Total 300 100.0 100.0
Staff coordiante the timing of the courses well.
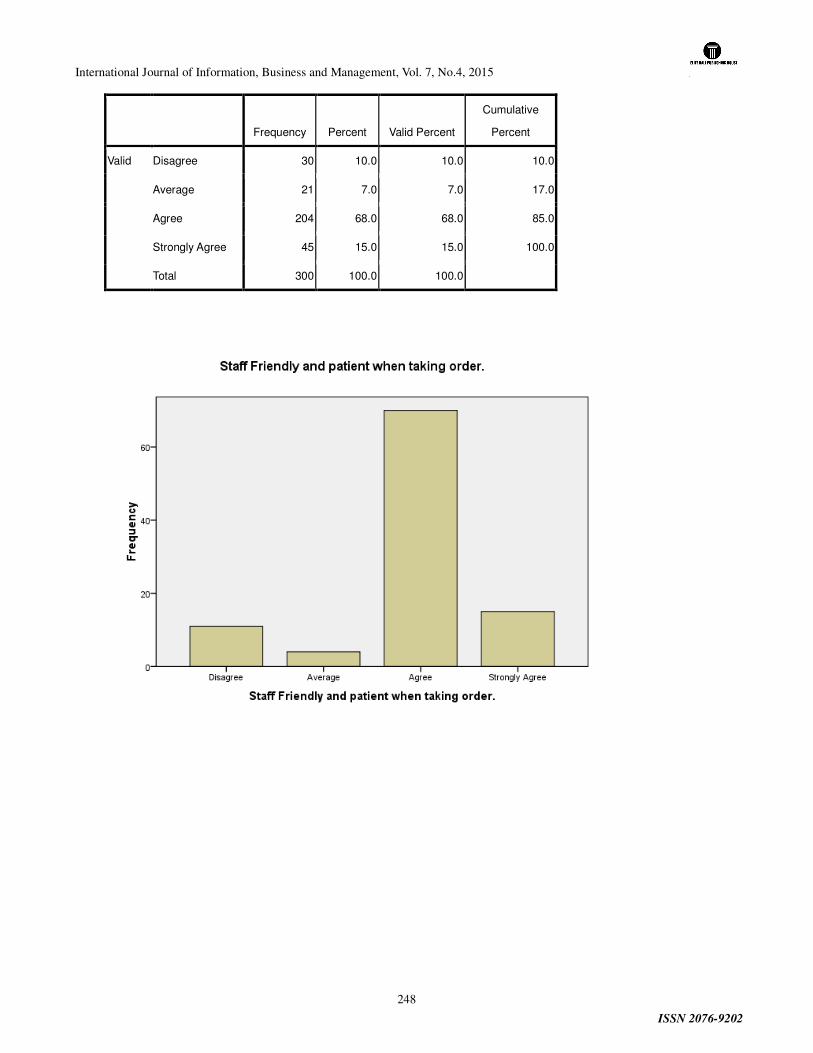
International Journal of Information, Business and Management, Vol. 7, No.4, 2015
ISSN 2076-9202
248
Frequency Percent Valid Percent
Cumulative
Percent
Valid Disagree 30 10.0 10.0 10.0
Average 21 7.0 7.0 17.0
Agree 204 68.0 68.0 85.0
Strongly Agree 45 15.0 15.0 100.0
Total 300 100.0 100.0
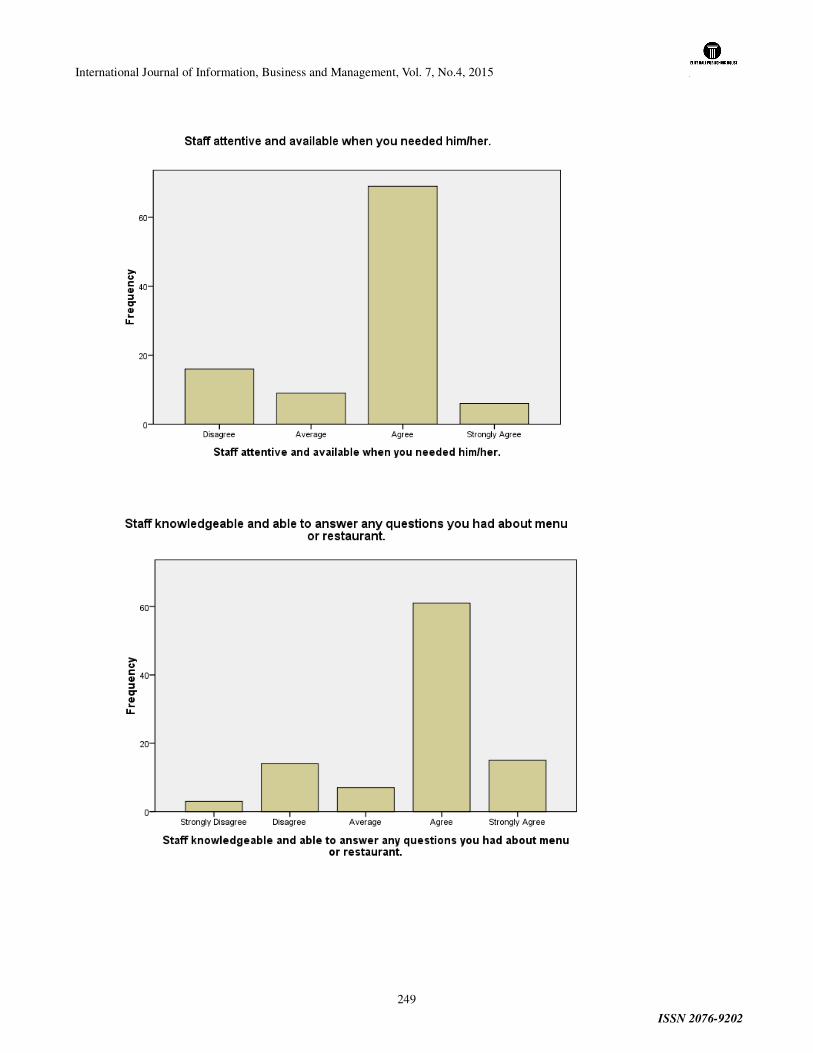
International Journal of Information, Business and Management, Vol. 7, No.4, 2015
ISSN 2076-9202
249
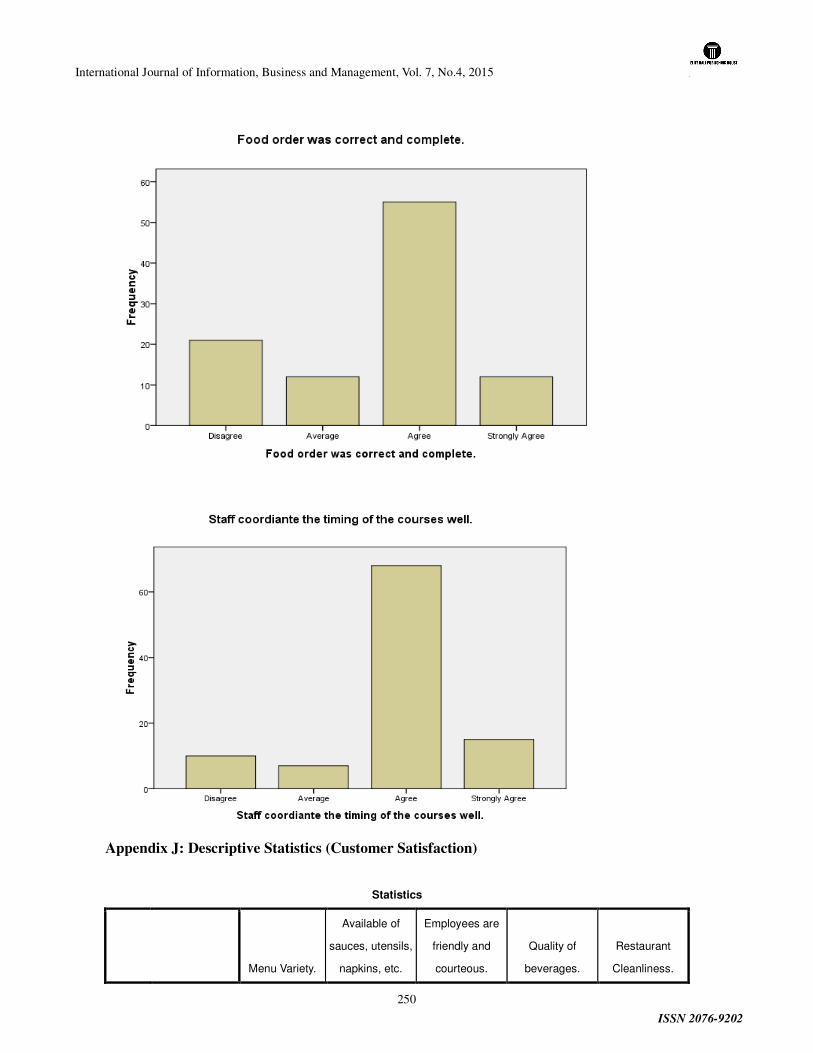
International Journal of Information, Business and Management, Vol. 7, No.4, 2015
ISSN 2076-9202
250
Appendix J: Descriptive Statistics (Customer Satisfaction)
Statistics
Menu Variety.
Available of
sauces, utensils,
napkins, etc.
Employees are
friendly and
courteous.
Quality of
beverages.
Restaurant
Cleanliness.
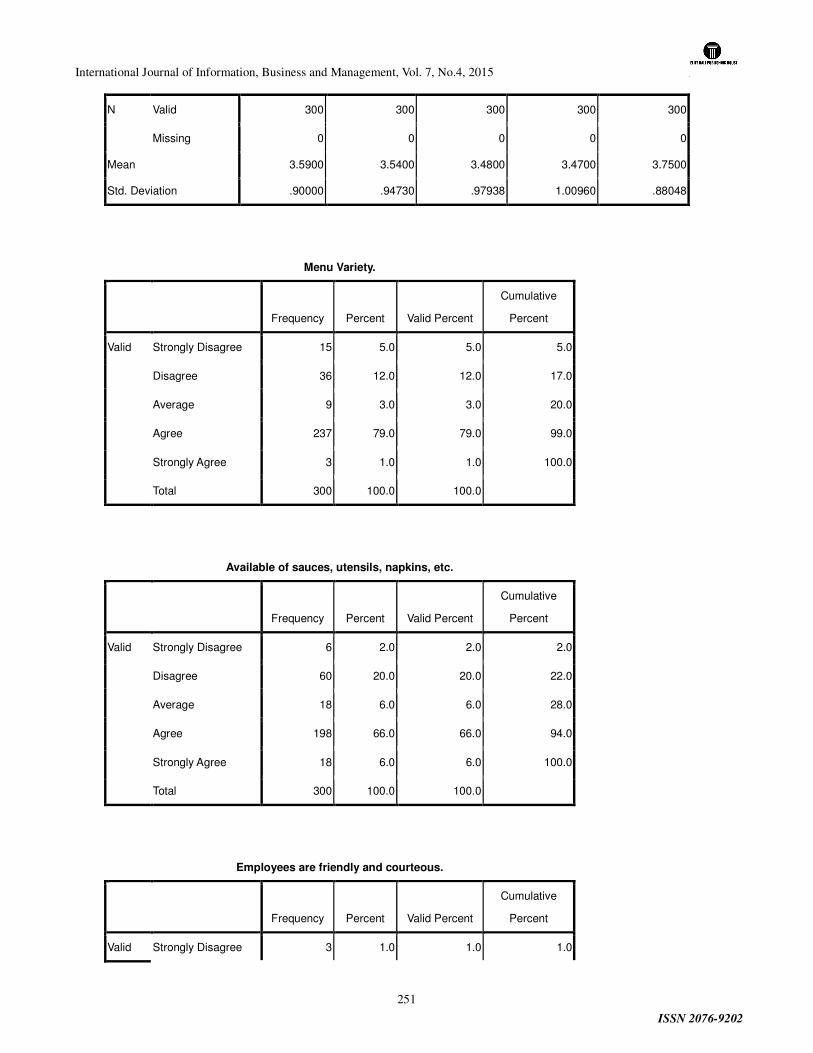
International Journal of Information, Business and Management, Vol. 7, No.4, 2015
ISSN 2076-9202
251
N Valid 300 300 300 300 300
Missing 0 0 0 0 0
Mean 3.5900 3.5400 3.4800 3.4700 3.7500
Std. Deviation .90000 .94730 .97938 1.00960 .88048
Menu Variety.
Frequency Percent Valid Percent
Cumulative
Percent
Valid Strongly Disagree 15 5.0 5.0 5.0
Disagree 36 12.0 12.0 17.0
Average 9 3.0 3.0 20.0
Agree 237 79.0 79.0 99.0
Strongly Agree 3 1.0 1.0 100.0
Total 300 100.0 100.0
Available of sauces, utensils, napkins, etc.
Frequency Percent Valid Percent
Cumulative
Percent
Valid Strongly Disagree 6 2.0 2.0 2.0
Disagree 60 20.0 20.0 22.0
Average 18 6.0 6.0 28.0
Agree 198 66.0 66.0 94.0
Strongly Agree 18 6.0 6.0 100.0
Total 300 100.0 100.0
Employees are friendly and courteous.
Frequency Percent Valid Percent
Cumulative
Percent
Valid Strongly Disagree 3 1.0 1.0 1.0
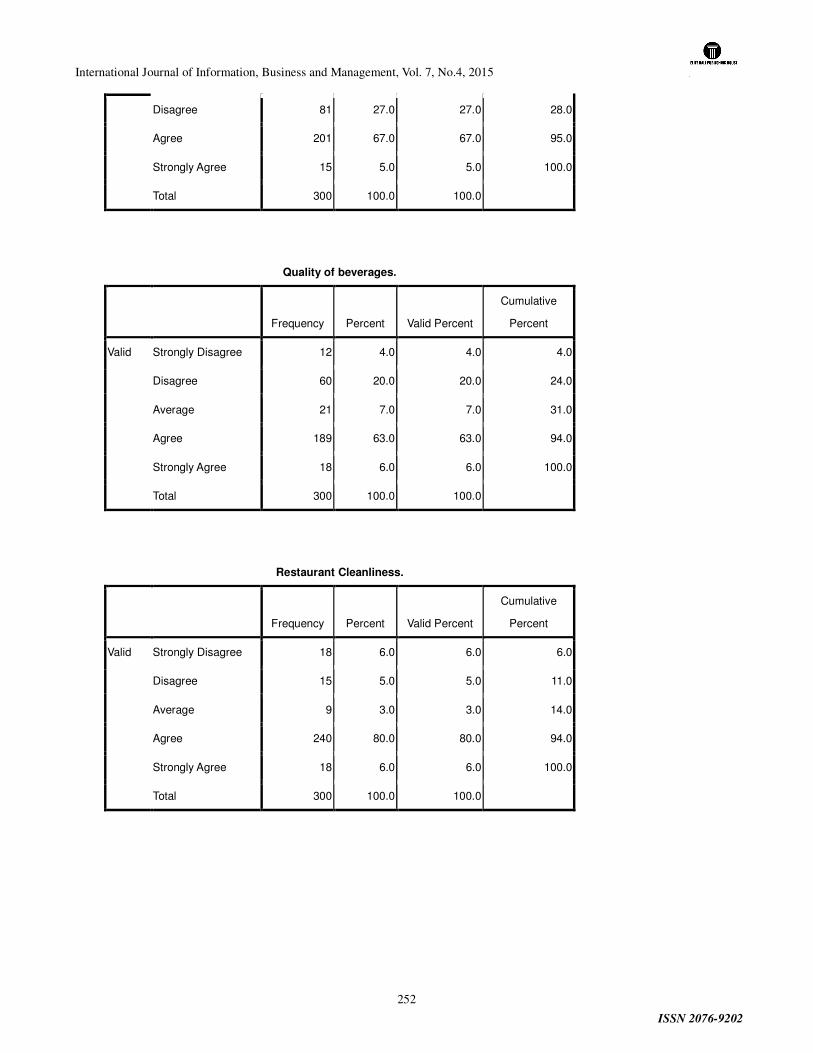
International Journal of Information, Business and Management, Vol. 7, No.4, 2015
ISSN 2076-9202
252
Disagree 81 27.0 27.0 28.0
Agree 201 67.0 67.0 95.0
Strongly Agree 15 5.0 5.0 100.0
Total 300 100.0 100.0
Quality of beverages.
Frequency Percent Valid Percent
Cumulative
Percent
Valid Strongly Disagree 12 4.0 4.0 4.0
Disagree 60 20.0 20.0 24.0
Average 21 7.0 7.0 31.0
Agree 189 63.0 63.0 94.0
Strongly Agree 18 6.0 6.0 100.0
Total 300 100.0 100.0
Restaurant Cleanliness.
Frequency Percent Valid Percent
Cumulative
Percent
Valid Strongly Disagree 18 6.0 6.0 6.0
Disagree 15 5.0 5.0 11.0
Average 9 3.0 3.0 14.0
Agree 240 80.0 80.0 94.0
Strongly Agree 18 6.0 6.0 100.0
Total 300 100.0 100.0
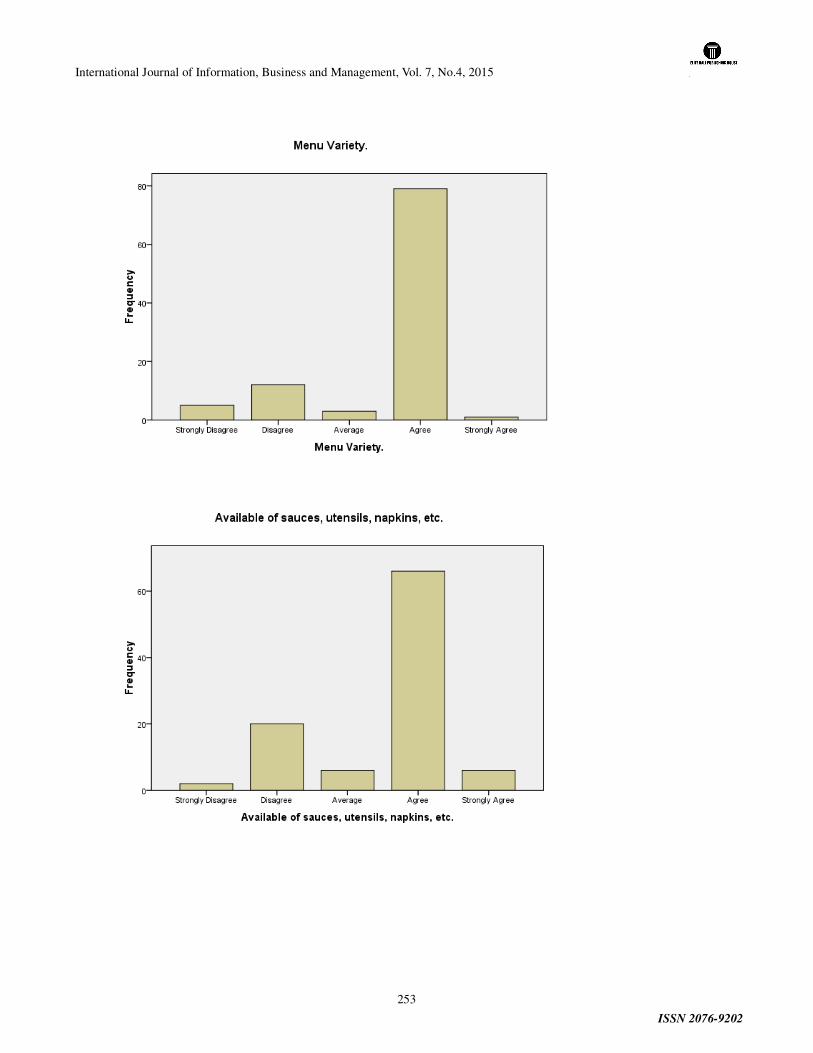
International Journal of Information, Business and Management, Vol. 7, No.4, 2015
ISSN 2076-9202
253
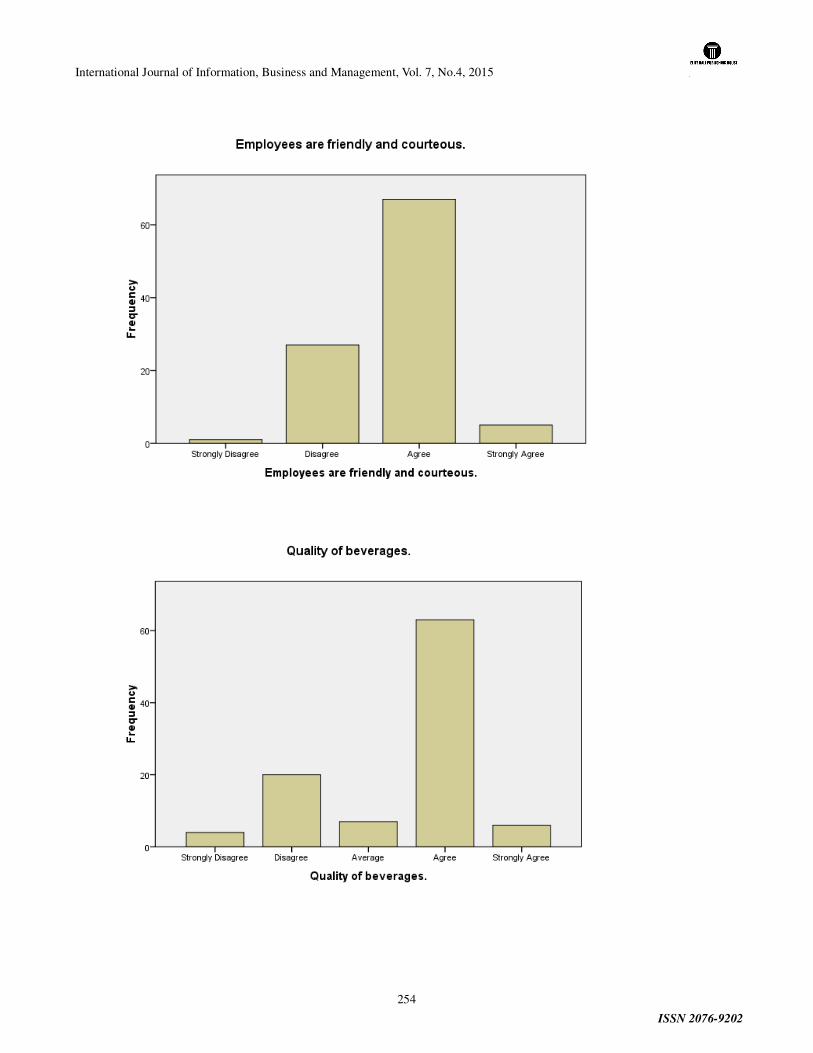
International Journal of Information, Business and Management, Vol. 7, No.4, 2015
ISSN 2076-9202
254
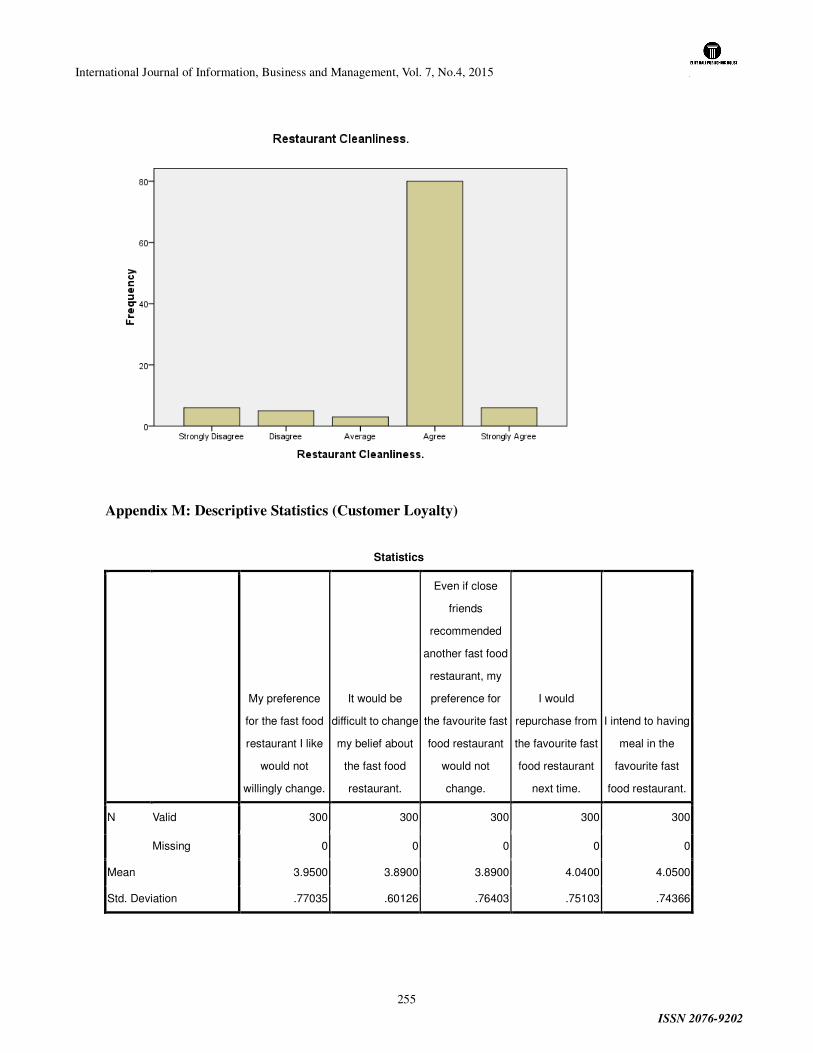
International Journal of Information, Business and Management, Vol. 7, No.4, 2015
ISSN 2076-9202
255
Appendix M: Descriptive Statistics (Customer Loyalty)
Statistics
My preference
for the fast food
restaurant I like
would not
willingly change.
It would be
difficult to change
my belief about
the fast food
restaurant.
Even if close
friends
recommended
another fast food
restaurant, my
preference for
the favourite fast
food restaurant
would not
change.
I would
repurchase from
the favourite fast
food restaurant
next time.
I intend to having
meal in the
favourite fast
food restaurant.
N Valid 300 300 300 300 300
Missing 0 0 0 0 0
Mean 3.9500 3.8900 3.8900 4.0400 4.0500
Std. Deviation .77035 .60126 .76403 .75103 .74366
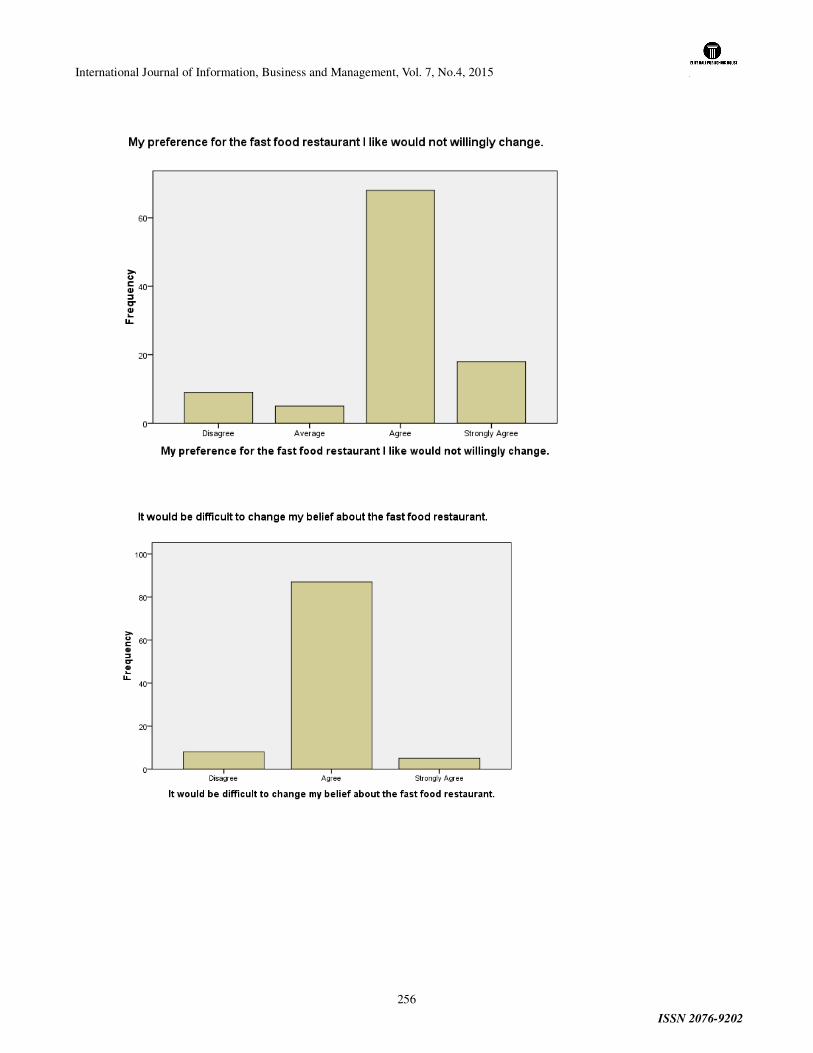
International Journal of Information, Business and Management, Vol. 7, No.4, 2015
ISSN 2076-9202
256
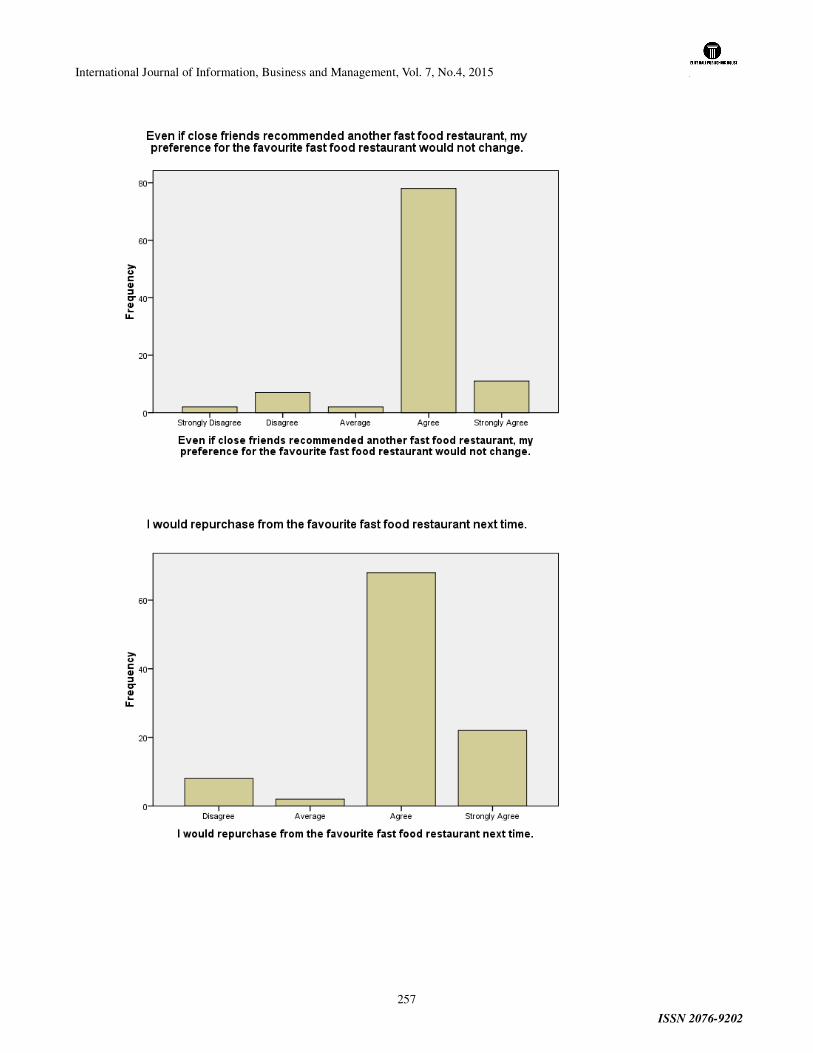
International Journal of Information, Business and Management, Vol. 7, No.4, 2015
ISSN 2076-9202
257
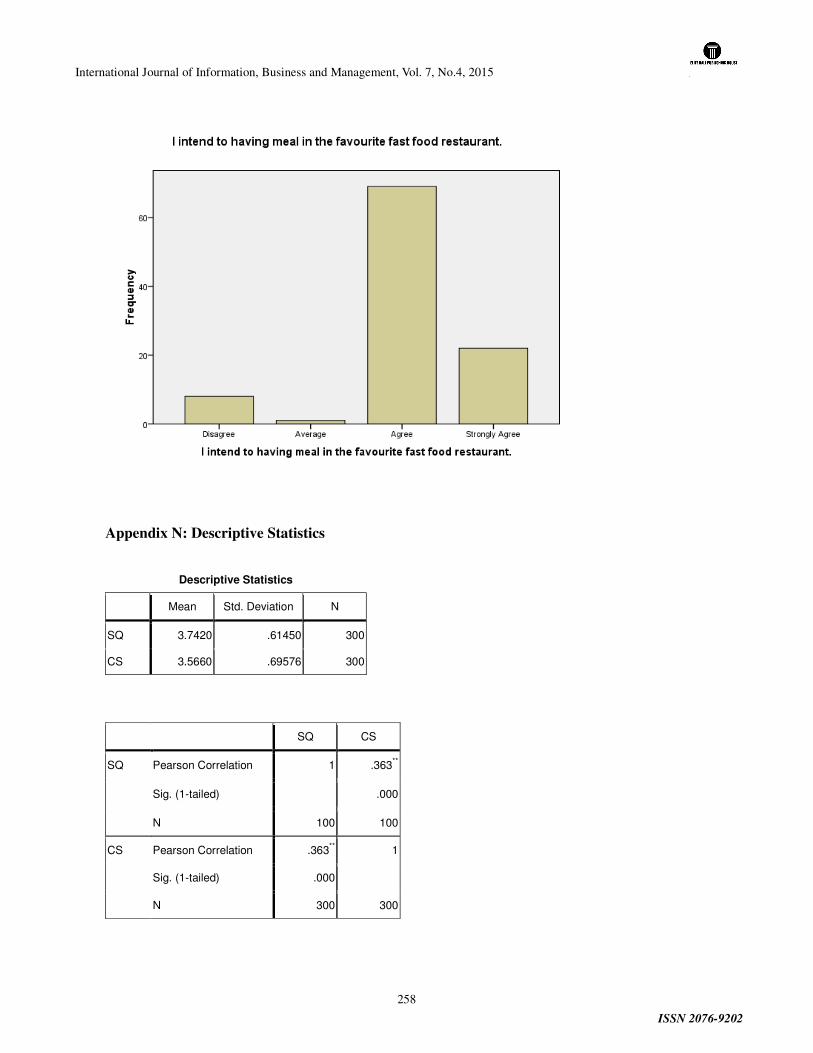
International Journal of Information, Business and Management, Vol. 7, No.4, 2015
ISSN 2076-9202
258
Appendix N: Descriptive Statistics
Descriptive Statistics
Mean Std. Deviation N
SQ 3.7420 .61450 300
CS 3.5660 .69576 300
SQ CS
SQ Pearson Correlation 1 .363**
Sig. (1-tailed) .000
N 100 100
CS Pearson Correlation .363** 1
Sig. (1-tailed) .000
N 300 300
International Journal of Information, Business and Management, Vol. 7, No.4, 2015
ISSN 2076-9202
259
IMPACT OF SUPERVISORY SUPPORT ON ORGANIZATIONAL
COMMITMENT IN THE PRESENCE OF POWER DISTANCE: A
QUANTITATIVE STUDY OF TEXTILE SECTOR OF FAISALABAD,
PAKISTAN.
Sajjad Rashid Khan
Department of Business Administration, GC University, Faisalabad, Pakistan.
Mohsin Bashir (Correspondence Author)
Assistant Professor, Department of Business Administration, GC University, Faisalabad, Pakistan.
Shahnawaz Saqib
(E-mail: [email protected], +92300-6704501)
PhD Scholar, Department of Business Administration, GC University, Faisalabad, Pakistan.
Ghulam Abbas
Departments of Commerce, Bahauddin Zakaria University, Multan, Pakistan.
Nadeem Nazir
PhD Scholar, Department of Business Administration, GC University, Faisalabad, Pakistan.
Abstract
Supervisory support has been considered a vital element to create organizational commitment.
Supervisors are the “human face” of the businesses. Better & supportive supervisors enable individuals
to achieve organizational goals. The purpose of this study was to investigate the impact of supervisory
support on organizational commitment with mediating role of power distance in the textile sector of
Pakistan at Faisalabad. Total 250 questionnaires were distributed among five organizations, 203 were
received back with 68 % response rate. Empirical results revealed that supervisory support has a
positive relationship with organizational commitment. Theoretical and managerial implications along
with research limitations have been discussed.
Key Words:
Supervisory support, Organizational Commitment, Power distance
1. Introduction
Supervisor’s support to the individuals is most important retention factor. Supervisors are the “human
face” of the businesses. Better & supportive supervisors enable individuals to achieve organizational

International Journal of Information, Business and Management, Vol. 7, No.4, 2015
ISSN 2076-9202
260
goals as well as their own goals. Supervisors integrate as a link to perform function between declared
objectives and potentials. Ontario, (2004) argued that supervisor support has very strong impact on the
individuals and it can be believed that human resources depart bosses, not jobs.
Borstorff & Marker (2007) stated that individuals desire to have trust-full supervisors who should
recognize them, appreciate them and deal with them in a fair manner. Insulting
supervisors are really responsible for all the disagreements in several ways and cause a disturbance in
individual’s attitude, life, work and organization. In the dynamic world, organizations are working with
diverse work force to achieve their goals. So it is the need of hour that they should develop strategies to
hold the employees for long term.
Silbert (2005) argued that employees who are well trained and have an excellent status could discover
alike work somewhere else but the effectual method to keep them is to persuade support and extend
close working affiliation.
Organizations formulate many policies to retain the right people with them. These
policies vary in nature in order to meet the requirements of individuals. Organizations should apply only
the applicable retention plans. Employees vary in nature & values, so there is no universal strategy
which fits to the all organizations; it is the matter of concern that human resource
departments have to formulate the strategies keeping in view the variation in the individuals.
These factors include supervisory support, operational surroundings, job growth prospects and work-life
steadiness on employee retention.
Organizations having turn over problems can’t enjoy the accomplishment, until they handle this
turnover crisis professionally and productively. One of the mainly significant aspects that have impact on
job dedication is the affiliation between an employee and a supervisor. Presently different labor force is
being utilized; hence a new level of correlation is noticed between the supervisor and the employee.
Borstorff & Marker (2007) argued, workers desire reliable supervisors who recognize them, appreciate
them and take care of them comparatively.
A lot of literature has been published on job retention through organizational commitment. Current
practices of elevated employment intensity, most of the businesses suppose that equilibrium of control
has been shifted from the employer to the employee since the spin over effect over the performance of
the organization have not been managed well. Disproportionate turnover is often an indication of basic
harms within the organization. It’s seriously significant to keep hold of them; to do this, one must know
how the worker can be retained in the particular corporation.
Organizational commitment has very dimensions. Employees prefer to be attached with any
organization either because the organization satisfies their needs and uses their abilities
International Journal of Information, Business and Management, Vol. 7, No.4, 2015
ISSN 2076-9202
261
to an optimal level or because they just can't find another job that can be termed as continues
commitment. Investigation of employee commitment has proved that employees have perception
regarding their organizations that they are worthwhile for the organizations and it is considered as
perceived organizational support (Eisenberger, Huntington, Hutchinson & Sowa, 1986).
Employee retention cannot be defined with a single definition. Simply it can be termed as retaining the
good people. This retention depends upon the culture and way in which employees are treated. Various
theorists have treated employee retention as controllable phenomena and organization can control it.
Due to growing needs at both, organizational level and individual level, organizations have to formulate
various strategies to retain employees in the businesses and even for the
particular divisions. Employees can be retained for long term with the organizations by paying them in
reasonable way. Other factor for retention is treatment of individuals with respect. Valuing employees as
asset, praising their attempts; clearly communicate goals, responsibilities and expectations.
Cohen (2000) found the relationship between Hofstede’s (1980) cultural dimensions and organizational
commitment, while Geiger (1998) found the impact of cultural values on the escalation of commitment.
These studies showed positive relationships between commitment and performance while Steers (1977)
found a negative relationship. From the above studies, it is clear that organizational commitment has a
potential impact on organizational performance. Thus, culture could enhance the level of organizational
commitment and thereby ensure organizational success. Further, these factors have important
implications to managers, who are the drivers of the organization
2. Review of literature Leaders should provide support to their staff because in most of the cases “People Don’t Leave
Organization, People Leave Managers” (Jim Collins). Different people different approaches, few consider
work environment as the top priority, few think they can be better performer if they are
having good relationship as the team among themselves or with the bosses (Asmed, 2006).
Wilson (1994) argued that the restricted acknowledgment is that type of recognition which one has to earn
by his own hard work and which is gained by some sense of success of an action or
result. When job of individuals becomes a source of satisfaction for them then they
come closed to the employer.
Motivated and satisfied employees contribute their efforts to achieve organizational goals, show better
workplace attitudes such as increased job involvement, reduced non- attendance and high retention with
the organization. Supervisors can help individuals by providing support in the shape of formal and
informal gratitude’s. Individuals always response to praise, encouragement and support (Silbert, 2005).
Supervisor confers employee’s improvement, frequently outside the official assessment procedure. They
assist workers to come across the accurate position in the organization, not just the next step on the
International Journal of Information, Business and Management, Vol. 7, No.4, 2015
ISSN 2076-9202
262
hierarchy (Freyermuth, 2007).
Many researchers analyzed that retaining employees is a key strategy to achieve financial success. The
challenge might be increasing day by day. The organizations want to hold the valued employees.
Organization needs to establish a realistic balance among the employee commitment and
organizational performance. Considerable quantity of literature is accessible on job
commitment.
Disproportionate or excessive workforce turnover is often a gauge of fundamental
troubles within the company. It is seriously significant to keep hold of the employees. Many researchers
analyzed that keeping workers is considered as a key approach to attain fiscal victory. This confrontation
may be rising day by day; the organizations want to hold the valued workers.
Ever since this notion of organizational commitment was explained by Mowday et al., (1982) many
researchers have tried to explore this phenomena. These researchers have tried to find out the different
effects of organizational commitment on the behaviors of employees. Allen & Meyer, (1996) argued that
organizational commitment is construct distinguishable in nature as compared with pleasure in the job, job
participation, work- related obligation, turnover objectives.
Wiener (1982) defined organizational commitment as an approach to achieve the business
targets. O’Reilly & Chatman, (1986) described organizational commitment as emotional affiliation felt by
an individual for the company; it reflects the level to which a person involves personally with the business.
Allen & Meyer (1990) stated that individual emotional binding with the organization is known as
organizational commitment. Meyer & Allen (1991) argued that organizational commitment has three key
factors, emotional commitment and exciting attachment of individuals with the organization,
persistence commitment, a wakefulness of the costs linked with departure from the organization and
a sense of ethical responsibility with the business or the work place.
The difference in various approaches of commitment may be due to different reasons. In order to resolve
the different ways of measuring commitment, Allen and Meyer (1990) suggested a three-component model
of commitment (TCM). This three component model integrates different conceptualizations. Allen and
Meyer, (1990) argued following components of commitment: (1) Affective; (2) Continuance (3) Normative.
Component of affective commitment refers to emotional attachment of individuals, identification with, and
involvement in, the organization. This attachment with the organization may be due to one’s role in
relation to the organizational goals and values, or to the organization for its own sake. The continuance
commitment refers to commitment based on the costs which employee associate with leaving the
organization. If the viable alternatives are few then the continuous commitment of the individuals will be
very high. The 3rd component of three component model is normative commitment which refers to
employees’ feelings of obligation to remain with the organization. This type of
International Journal of Information, Business and Management, Vol. 7, No.4, 2015
ISSN 2076-9202
263
commitment will be influenced by an individual’s experiences both prior to cultural socialization and
following organizational socialization entry into the organization. For example, an employee would have
strong normative commitment if one friend or family member had been a long-term employee
of an organization, and emphasized the importance of organizational loyalty
Researchers of cross cultural studies have found that cultural affects the attachment of individuals with the
organization. This affect is on the psychological attachment of employees. This psychological attachment
leads towards the loyalty and commitment with the organizations. Employees on high power distance show
an attachment with their supervisors as compared with the low power distance employees (Bochner &
Hesketh,1994).
Hofstede, (1980) argued that power distance is the level to which a culture recognize an uneven sharing of
power in the business or organizations within the hierarchy. The researcher divided his study on power
distance into two, namely; high (countries in Latin America, Asia and Africa) and low
(countries like the United States of America, Germany, Great Britain, Canada, France, Belgium,
e.t.c.) power distance.
Subordinates under a high-power distance culture are highly dependents on the top management for
direction and further suggested that employees manage their work according to what
the managers stipulate (respect for hierarchy). In this case, the employees are more co-operative
dealing with the superiors and are, frightened of disagreeing with them, but are reluctant to cooperate with
their peers. Power distance shows the degree by which employees accept the unequal distribution of power
in the organizations. Ripley & Ripley (1992) and Spatz (2000) stated that empowerment can
enhance the responsibilities as well as motivation of employees in their routine work, improve
satisfaction level, quality of services, employees loyalty and productivity by giving them self-respect that
worth a lot and ultimately increases the productivity and quality of products and reduces
the employee turnover.
Empowerment enables the managers to perform and help others working under them to achieve through
successful work systems. This requires that management should take more responsibility to lead toward
destiny with the intention to develop internal commitment. An individual s personal reasons and
motivation are the factors that make him committed to a particular project, person or program and create
internal commitment.
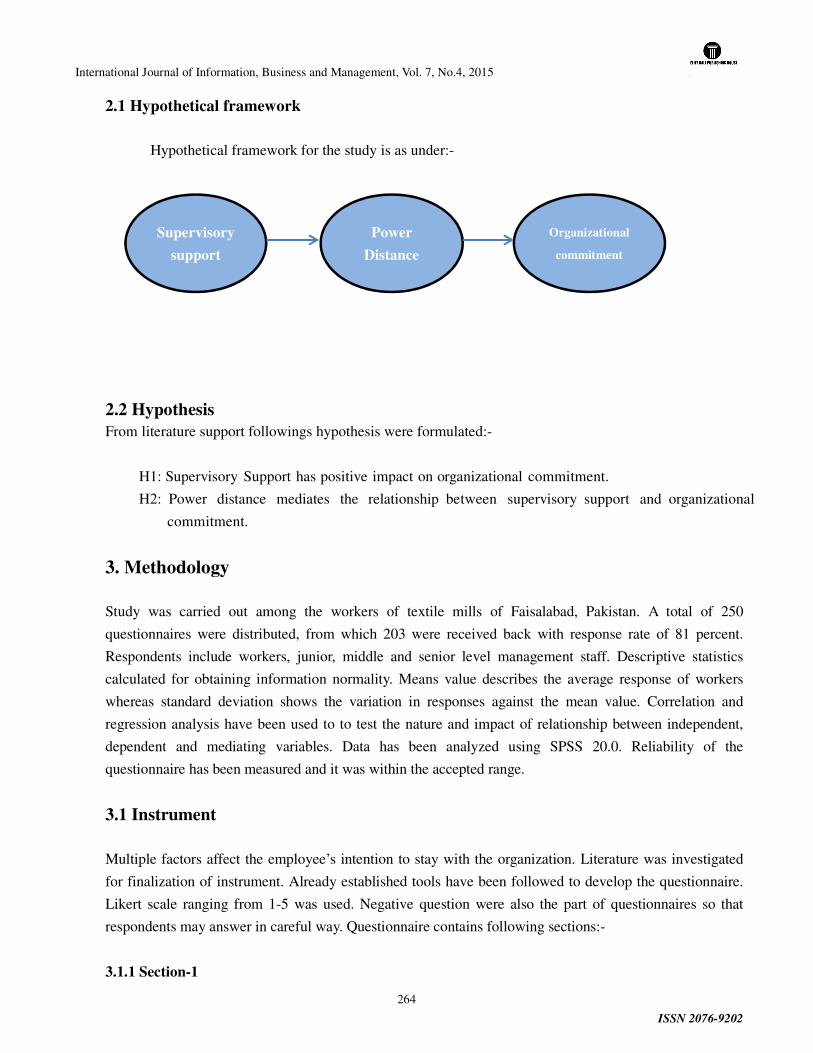
International Journal of Information, Business and Management, Vol. 7, No.4, 2015
ISSN 2076-9202
264
2.1 Hypothetical framework
Hypothetical framework for the study is as under:-
2.2 Hypothesis
From literature support followings hypothesis were formulated:-
H1: Supervisory Support has positive impact on organizational commitment.
H2: Power distance mediates the relationship between supervisory support and organizational
commitment.
3. Methodology
Study was carried out among the workers of textile mills of Faisalabad, Pakistan. A total of 250
questionnaires were distributed, from which 203 were received back with response rate of 81 percent.
Respondents include workers, junior, middle and senior level management staff. Descriptive statistics
calculated for obtaining information normality. Means value describes the average response of workers
whereas standard deviation shows the variation in responses against the mean value. Correlation and
regression analysis have been used to to test the nature and impact of relationship between independent,
dependent and mediating variables. Data has been analyzed using SPSS 20.0. Reliability of the
questionnaire has been measured and it was within the accepted range.
3.1 Instrument
Multiple factors affect the employee’s intention to stay with the organization. Literature was investigated
for finalization of instrument. Already established tools have been followed to develop the questionnaire.
Likert scale ranging from 1-5 was used. Negative question were also the part of questionnaires so that
respondents may answer in careful way. Questionnaire contains following sections:-
3.1.1 Section-1
Supervisory
support
Organizational
commitment
Power
Distance
International Journal of Information, Business and Management, Vol. 7, No.4, 2015
ISSN 2076-9202
265
The section-1 of instruments contains questions regarding gender, qualification, average age, and
designation, length of service and department of respondents.
3.1.2 Section-2
The section-2 of instruments comprises upon the questions regarding supervisory support, power distance
and organizational commitment. 3.1.2.1 Supervisory support
Supervisory support has been measured by various researchers in the history. For the purpose of this
study Supervisory Relationship Questionnaire (SRQ) was adopted. This questionnaire was developed by
Marina Palomo, (2004). Original version of this instrument contains total 67 questions with 6 sub scales at
7 point likert scale. Partial amendment was made and total 17 questions from this questionnaire were
adopted for the study purpose. Responses were obtained on 5 point likert scale.
3.1.2.2 Power distance
Dorfman and Howell’s (1988) cultural scale was used to measure the mediating role of power distance
between the relationship of supervisory support and organizational commitment.
3.1.2.3 Organizational commitment
Allen and Meyer, (1991) 3 dimensional questionnaire was adopted to measure the organizational
commitment. Affective, normative and continuance commitment component were measured through 24
items
3.3 Instrument Reliability
Cronbach’s coefficient alpha was calculated to check the reliability of the instrument and the calculated
values were in acceptable range.
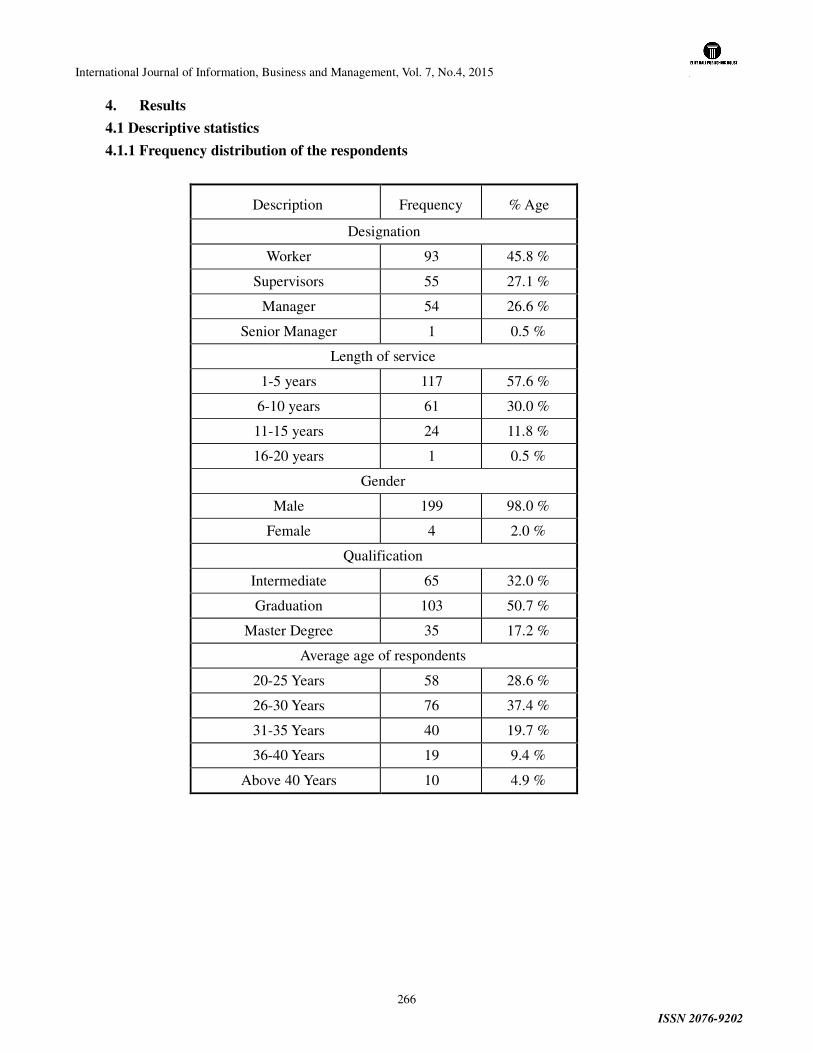
International Journal of Information, Business and Management, Vol. 7, No.4, 2015
ISSN 2076-9202
266
4. Results
4.1 Descriptive statistics
4.1.1 Frequency distribution of the respondents
Description Frequency % Age
Designation
Worker 93 45.8 %
Supervisors 55 27.1 %
Manager 54 26.6 %
Senior Manager 1 0.5 %
Length of service
1-5 years 117 57.6 %
6-10 years 61 30.0 %
11-15 years 24 11.8 %
16-20 years 1 0.5 %
Gender
Male 199 98.0 %
Female 4 2.0 %
Qualification
Intermediate 65 32.0 %
Graduation 103 50.7 %
Master Degree 35 17.2 %
Average age of respondents
20-25 Years 58 28.6 %
26-30 Years 76 37.4 %
31-35 Years 40 19.7 %
36-40 Years 19 9.4 %
Above 40 Years 10 4.9 %
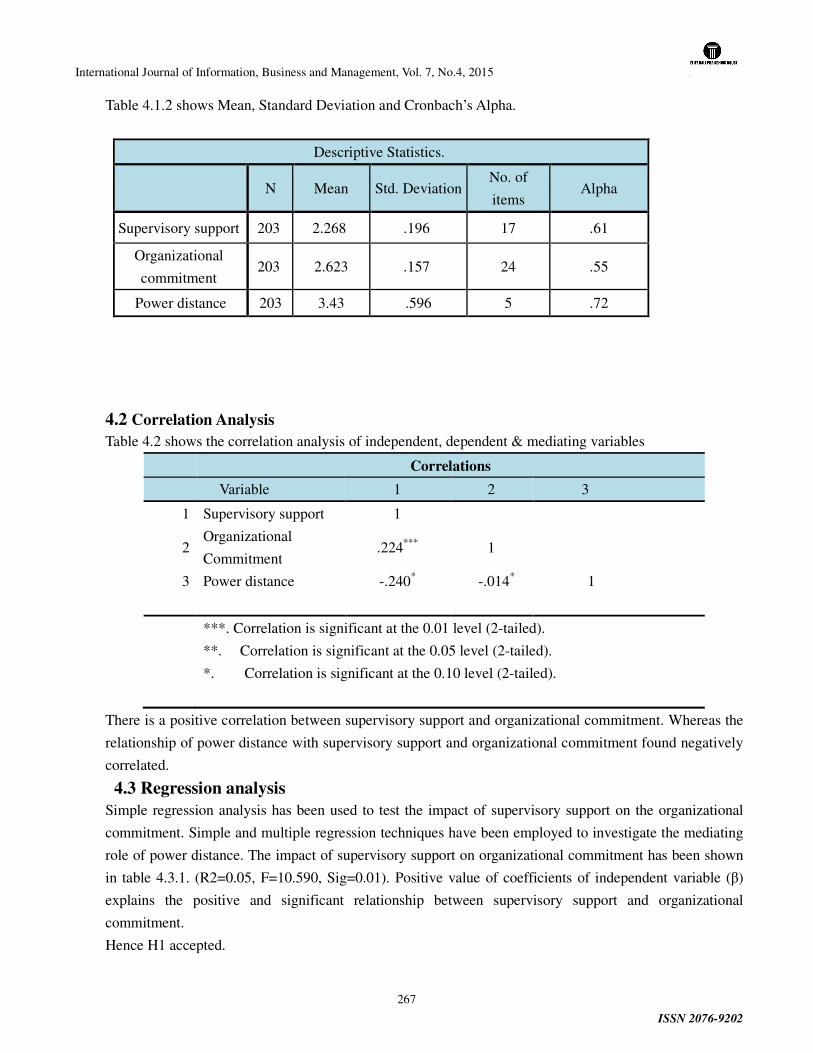
International Journal of Information, Business and Management, Vol. 7, No.4, 2015
ISSN 2076-9202
267
Table 4.1.2 shows Mean, Standard Deviation and Cronbach’s Alpha.
Descriptive Statistics.
N Mean Std. Deviation No. of
items Alpha
Supervisory support 203 2.268 .196 17 .61
Organizational
commitment 203 2.623 .157 24 .55
Power distance 203 3.43 .596 5 .72
4.2 Correlation Analysis
Table 4.2 shows the correlation analysis of independent, dependent & mediating variables
Correlations
Variable 1 2 3
1 Supervisory support 1
2 Organizational
Commitment .224*** 1
3 Power distance -.240* -.014* 1
***. Correlation is significant at the 0.01 level (2-tailed).
**. Correlation is significant at the 0.05 level (2-tailed).
*. Correlation is significant at the 0.10 level (2-tailed).
There is a positive correlation between supervisory support and organizational commitment. Whereas the
relationship of power distance with supervisory support and organizational commitment found negatively
correlated.
4.3 Regression analysis
Simple regression analysis has been used to test the impact of supervisory support on the organizational
commitment. Simple and multiple regression techniques have been employed to investigate the mediating
role of power distance. The impact of supervisory support on organizational commitment has been shown
in table 4.3.1. (R2=0.05, F=10.590, Sig=0.01). Positive value of coefficients of independent variable (β)
explains the positive and significant relationship between supervisory support and organizational
commitment.
Hence H1 accepted.
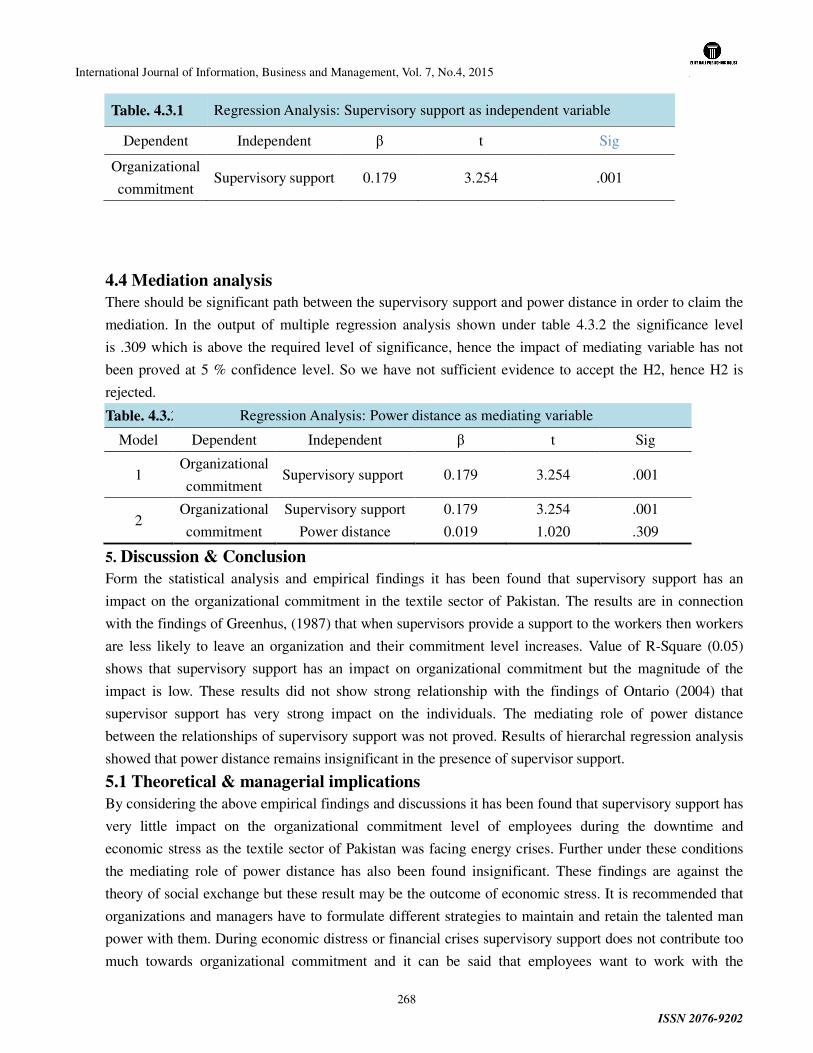
International Journal of Information, Business and Management, Vol. 7, No.4, 2015
ISSN 2076-9202
268
Table. 4.3.1 Regression Analysis: Supervisory support as independent variable
Dependent Independent β t Sig
Organizational
commitment Supervisory support 0.179 3.254 .001
4.4 Mediation analysis There should be significant path between the supervisory support and power distance in order to claim the
mediation. In the output of multiple regression analysis shown under table 4.3.2 the significance level
is .309 which is above the required level of significance, hence the impact of mediating variable has not
been proved at 5 % confidence level. So we have not sufficient evidence to accept the H2, hence H2 is
rejected.
Table. 4.3.2 Regression Analysis: Power distance as mediating variable
Model Dependent Independent β t Sig
1 Organizational
commitment Supervisory support 0.179 3.254 .001
2 Organizational
commitment
Supervisory support
Power distance
0.179
0.019
3.254
1.020
.001
.309
5. Discussion & Conclusion
Form the statistical analysis and empirical findings it has been found that supervisory support has an
impact on the organizational commitment in the textile sector of Pakistan. The results are in connection
with the findings of Greenhus, (1987) that when supervisors provide a support to the workers then workers
are less likely to leave an organization and their commitment level increases. Value of R-Square (0.05)
shows that supervisory support has an impact on organizational commitment but the magnitude of the
impact is low. These results did not show strong relationship with the findings of Ontario (2004) that
supervisor support has very strong impact on the individuals. The mediating role of power distance
between the relationships of supervisory support was not proved. Results of hierarchal regression analysis
showed that power distance remains insignificant in the presence of supervisor support.
5.1 Theoretical & managerial implications
By considering the above empirical findings and discussions it has been found that supervisory support has
very little impact on the organizational commitment level of employees during the downtime and
economic stress as the textile sector of Pakistan was facing energy crises. Further under these conditions
the mediating role of power distance has also been found insignificant. These findings are against the
theory of social exchange but these result may be the outcome of economic stress. It is recommended that
organizations and managers have to formulate different strategies to maintain and retain the talented man
power with them. During economic distress or financial crises supervisory support does not contribute too
much towards organizational commitment and it can be said that employees want to work with the
International Journal of Information, Business and Management, Vol. 7, No.4, 2015
ISSN 2076-9202
269
organization due to economic stress or non-availability of opportunities in the market. Under these
conditions financial rewards can help organizations to boost the motivation and satisfaction of the
employees to enhance the organizational commitment level.
5.2 Limitations and suggestions for future research
The study has many limitations and due to this inconsistencies have been found with the previous studies.
This variation in results may be due to the improper sample size and population. The study was conducted
by considering only the textile mills of Faisalabad. Energy crises that Pakistan has been facing
since many years may also be the fundamental reason for this variation. In future
studies, other factors may also be considered and included in the model to the antecedent of organizational
commitment.
References
1. Allen, N. and Meyer, J. (1990), “The measurement and antecedents of affective, normative and continuance commitment to the organization”, Journal of Occupational Psychology, Vol. 63, pp. 1-18.
2. Allen, N. J., & Meyer, J. P. (1996). Affective, continuance, and normative commitment to the organization: An examination of construct validity. Journal of Vocational Behavior, 49, 252-276.
3. Asmed.(2006). Motivating by creating working environment .Retrived April 2009 http://www.business.gov.vn/advice.aspx?id=21 5&LangType=1033
4. Bochner, S., & Hesketh, B. (1994). Power distance, individualism/collectivism, and job-related attitudes in a culturally diverse work group. Journal of cross-cultural psychology, 25(2), 233-257.
5. Borstorff, P. C., & Marker, M. B. (2007). Turnover Drivers and Retention Factors Affecting Hourly Workers: What is Important. Management Review: An International Journal, 2(1), 14-27.
6. Cohen, A. (2000). The relationship between commitment forms and work outcomes: A comparison of three models. Human Relations, 53(3), 387-418
7. Eisenberger, R., Huntington, R., Hutchison, S., & Sowa, D.(1986).Perceived organizational support. Journal of Applied Psychology.
8. Freyermuth. (2007). Retaining Employees in a Tightening Labor Market, RSM McGladrey.Website.www.cfo.com/whitepapers/index.cfm/displaywhitepaper/10308654? topic id=10240327 – 22k –
9. Geiger, G. (1998), “The impact of cultural values on escalation of commitment”, International Journal of Organisational Analysis, Vol. 6 No. 2, pp. 165-77
10. Hofstede, G. (1980), Cultures’ Consequences: International Differences in Work Related Values, Sage, Beverly Hills, CA.
International Journal of Information, Business and Management, Vol. 7, No.4, 2015
ISSN 2076-9202
270
11. Mowday, R. T., Porter, L. W., & Steers, R. M. (1982). Employee-organizational linkages: The psychology of commitment, absenteeism, and turnover. New York: Academic Press.
12. Meyer, P., & Allen, N. 1. (1991). A three-component conceptualization of organizational commitment. Human Resource Management Review, 1(1), 61-89
13. O’Reilly, C. and Chatman, J. (1986), “Organizational commitment and psychological attachment: the effects of compliance, identification, and internalization on pro-social behavior”, Journal of Applied Psychology, Vol. 71, pp. 492-9
14. Ontario, (2004). Ministry of Health and Long-Term Care (Report No. Learning series; booklet 4). Long-term care facility worker retention. Ministry of Health and Long-Term Care, recruitment & retention tactics for the long-term care facility sector, Recruitment & retention tactics for the long-term care (127.3K).
15. Ripley, R.E. and Ripley, M.J. (1992). Empowerment, the cornerstone of quality: Empowering management in innovative organizations in the 1990s. Management Decision, 30, 20-43
16. Steers, R.M. (1977), “Antecedents and outcomes of organizational commitment”, Administrative Science Quarterly, Vol. 22, pp. 46-56.
17. Spatz, D. (2000). Team building in construction. Practice Periodical on Structural Design and Construction, Vol 5, 93-105.
18. Silbert, L.T. (2005). The effect of Tangible Rewards on Perceived Organizational Support. Management Sciences.Website:uwspace.uwaterloo.ca/bitstream /10012/872/1/ lsilbert2005.pdf
19. Wilson, T. B. (1994). Innovative reward systems for the changing workplace. United States of America: R.R. Donnelley & Sons Company.
20. Wiener, Y. (1982). Commitment in organizations: A normative view. Academy of management review, 7(3), 418-428.

International Journal of Information, Business and Management, Vol. 7, No.4, 2015
ISSN 2076-9202
271
International Journal of Information, Business and Management, Vol. 7, No.4, 2015
ISSN 2076-9202
272
The Role of Online Service Quality in Enhancing Customer Satisfaction:
An Empirical Investigation of Pakistani Banks
Corresponding Author: Ahsan Akbar
Lecturer in Management Sciences
University of Education, Lahore, Pakistan
PhD Scholar
School of Accounting and Finance
Zhongnan University of Economics and Law, Wuhan, P.R.China
Abdul Mannan
Lecturer in Management Sciences
University of Education, Lahore, Pakistan
ABSTRACT
The study is aimed at examining the dimensions of online service quality that affect the customer
satisfaction. Data was collected through questionnaire from 100 respondents belonging to diverse
professional backgrounds. Results of correlation and regression analysis portray that reliability, assurance
of service, tangibles and transactions security have significant positive relationship with online service
quality. Bearing in mind that online service quality has a substantial room for improvement in Pakistan;
the results of this study uncover several practical implications. Online banking service providers shall
strive to offer reliable and assured services to their customers. In addition, tangible infrastructural
improvement and security of online transactions also plays a key role in enhancing the satisfaction level
of the customer on their service provider. In the backdrop of intense competition in the banking and
financial services industry, an efficient and effective service quality system can enable the banks to not
only expand and grow more rapidly but also to sustain the existing customer base. By incorporating these
online service quality dimensions into their quality policy, banks can improve their operating efficiency as
well as can maximize satisfaction of their valued customers.
Key Words
Banking Industry, Online Service Quality, Customer Satisfaction
INTRODUCTION
International Journal of Information, Business and Management, Vol. 7, No.4, 2015
ISSN 2076-9202
273
Service sector has experienced enormous changes mainly due to the various forces influencing this sector.
The major factor behind this shift is the advancement in technology. Furthermore, opportunities in the
market are increasing with the conception of new products and services, which further add to the
importance of developing more information and customer-focused business and management processes.
Electronic banking and online payment techniques are opening doors of new opportunities for banks to
introduce new and innovative financial products. This technological advancement is expected to shape a
new and efficient banking system. Technology facilitate institutions to provide banking products and
services employing advance delivery channels to consumers in a more economical and convenient way
without compromising the existing service level. The use of internet has witnessed a rapid growth in all
walks of life. It has also brought in a number on new opportunities of doing business for all types of
users.
In the context of online transactions, Awad (2000) presented four e-commerce activities that are
performed by the internet users that are banking, shopping, online electronic payment for internet services
and investing. To perform all these activities the customer requires a banking relationship. Massive
growth of the Internet is providing new ways of interaction with the consumer for businesses.
SERVQUAL developed by Zeithaml (1988) is the most commonly used model for accessing the customer
satisfaction. The fast growth in communication technology has enabled firms to introduce advanced
services. Internet banking is new addition in the existing portfolio of services. Based on these
developments it is valuable area of research to analyze that what factor are considered important by the
customer in making an evaluation of the technology based services. In this new era of internet based
home banking the bank will have to adopt new ways for maintaining relationship with customers.
Numerous researchers have focused upon the relationship among the service quality and the customer
satisfaction in different types of businesses. Internet banking is a modernized and dynamic field therefore
the dimensions used to measure conventional aspects of service quality is not directly applicable upon
e-banking. Therefore previously conducted studies have adopted various dimensions to measure
electronic service quality. The widely used elaboration of electronic or website service quality is “the
degree to which a web site assists purchasing, effective and efficient shopping and delivery of product or
services (Siu and Mou, 2003). Also e-service quality was regarded as the second most important factor,
involving empathy, follow-up, quick response, and assurance (Awad, 2000). A range of studies have
identified important dimensions of service quality in the conventional banking but comparatively less
attention is devoted to service quality dimensions in the internet banking industry and its impact on
customer satisfaction (Jun and Cai, 2001). Fewer empirical studies are conducted in the context of
Pakistan to understand this phenomenon of online service quality.
REVIEW OF LITERATURE
From Pakistan’s perspective, (Naeem, Akram, and Saif 2009) conducted a comparative study to discover
the effect of service quality on satisfaction level of customers in foreign and public sector banks of
International Journal of Information, Business and Management, Vol. 7, No.4, 2015
ISSN 2076-9202
274
Pakistan. Sample includes two hundred respondents. Most of the constructs used to measure the service
quality was taken from the SERVQUAL model developed by Zeithmal. The results of regression analysis
demonstrated that quality of services has a positive and significant impact upon customer satisfaction in
case of foreign banks but the impact was insignificant in case of public sector banks of Pakistan. The
finding revealed that effectively managed service quality can make a significant contribution toward
customer satisfaction.
To investigate the similar phenomenon in telecom sectors (Ahmed et al. 2010) examined the customer
satisfaction with the SMS services rendered by telecom organizations. The dimensions used to gauge the
service quality include reliability, responsiveness, assurance, empathy and tangibles. The sample size
included 331 SMS service users. Correlation and regression analysis indicated a positive relationship
between dimensions of service quality and customer satisfaction.
However the impact of online service quality on customer satisfaction in Pakistani banking sector was
analyzed by (Zafar et al. 2011). The dimensions used to measure online service quality included
Reliability, Responsiveness, Efficiency, Privacy, Assurance and Fulfillment. The sample size consisted of
264 respondents. The results of the empirical analysis revealed that online service quality enhances
customer satisfaction. So bank must strive for improved web service quality to achieve customer
satisfaction. (Herington and Weaven 2009) explored the relationship between e-service quality and
satisfaction of customers. The sample involved 200 Australian respondents who were regularly using
online banking services. The e-service quality dimensions used in the study were personal needs, site
organization, user friendliness and efficiency. The result of factor analysis and regression analysis
indicated that these dimensions of online service quality significantly enhance customer satisfaction
except efficiency that was not found to be a predictor of customer satisfaction.
(Ganguli and Roy 2011) conducted a study to investigate the impact of technology based dimensions of
banking service quality on customer satisfaction and customer loyality. Service quality dimensions
identified in the study were customer service, technology convenience, technology security and
information quality, easiness in the usage of technology and reliability.The result suggested that customer
service and usage of technology easiness and reliability have significant positive impact on both
customer satisfaction and customer loyalty.
(Rod, Ashill, Shao, and Carruthers 2009) examined the relationship among three service quality
dimensions that influence overall service quality of internet banking and their subsequent impact on
customer satisfaction in the context New Zealand banks. The result shown a significant relationship
among online customer service quality,banking service product quality, onlineinformation system quality,
overall service quality of internet bankingand customer satisfaction. (Herington and Weaven 2007)
explored the impact of online service quality on the delight level of customers and in customer
relationship development. The emperical results revealed that quality of online services has no effect on
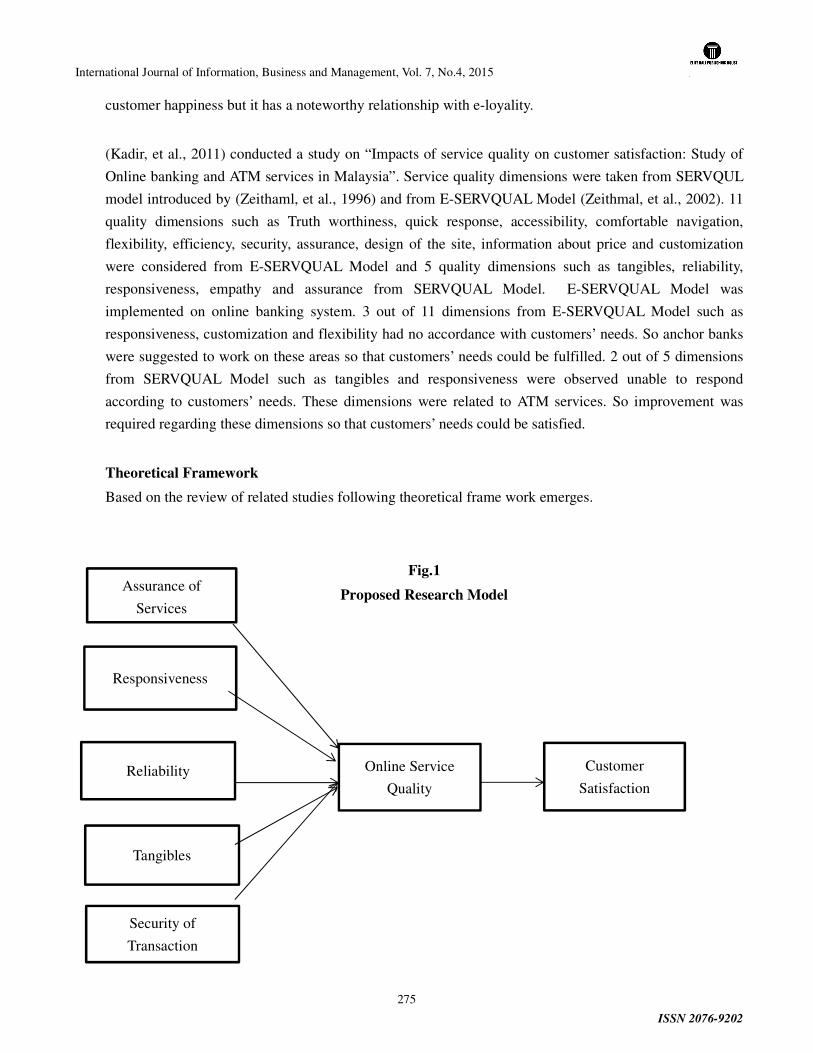
International Journal of Information, Business and Management, Vol. 7, No.4, 2015
ISSN 2076-9202
275
customer happiness but it has a noteworthy relationship with e-loyality.
(Kadir, et al., 2011) conducted a study on “Impacts of service quality on customer satisfaction: Study of
Online banking and ATM services in Malaysia”. Service quality dimensions were taken from SERVQUL
model introduced by (Zeithaml, et al., 1996) and from E-SERVQUAL Model (Zeithmal, et al., 2002). 11
quality dimensions such as Truth worthiness, quick response, accessibility, comfortable navigation,
flexibility, efficiency, security, assurance, design of the site, information about price and customization
were considered from E-SERVQUAL Model and 5 quality dimensions such as tangibles, reliability,
responsiveness, empathy and assurance from SERVQUAL Model. E-SERVQUAL Model was
implemented on online banking system. 3 out of 11 dimensions from E-SERVQUAL Model such as
responsiveness, customization and flexibility had no accordance with customers’ needs. So anchor banks
were suggested to work on these areas so that customers’ needs could be fulfilled. 2 out of 5 dimensions
from SERVQUAL Model such as tangibles and responsiveness were observed unable to respond
according to customers’ needs. These dimensions were related to ATM services. So improvement was
required regarding these dimensions so that customers’ needs could be satisfied.
Theoretical Framework
Based on the review of related studies following theoretical frame work emerges.
Fig.1
Proposed Research Model
Responsiveness
Reliability
Tangibles
Security of
Transaction
Online Service
Quality
Customer
Satisfaction
Assurance of
Services
International Journal of Information, Business and Management, Vol. 7, No.4, 2015
ISSN 2076-9202
276
Indication of Independent Variable and Dependent Variable
Online service quality is being treated as independent variable and customer satisfaction as dependent
variable. The dimensions such as reliability, responsiveness, security of transaction, tangibles and
assurance of services are used to measure the satisfaction level of the customers with online service
quality.
Development of Hypothesis
A comprehensive insight into the literature led to the development of following hypothesis.
Hypothesis 1: Reliability has significant and positive relationship with online service quality.
Hypothesis 2: Responsiveness has significant and positive relationship with online service quality.
Hypothesis 3: Assurance of services has significant and positive relationship with online service quality.
Hypothesis 4: Tangibles has significant and positive relationship with online service quality.
Hypothesis 5: Security of transaction has significant and positive relationship with online service quality.
Hypothesis 6: Online service quality has significant and positive relation with customer satisfaction.
DATA & METHODOLOGY
The section below provides the comprehensive detail about data collection and data analysis methods.
Data Collection Methods
The study adopted a survey questionaire method to obtain primary data from the target respondents.
Online service quality dimensions and items presented E-SERVQUAL model of Zeithmal (2002) were
taken as benchmark and modifications were made with context to Pakistan. Like security of transaction
and tangibles justify their place into the online service quality model. To ensure whether items were
measuring the same dimension, Cronbach Alpha technique was applied to check the Reliability of the
instrument. Population for this study was the online banking service users. Because of the time and
financial constraints 100 online banking service users were taken as a sample. Information from sample
was taken from two districts of Pakistan that are Sahiwal and Okara. Convenience sampling technique
was used because bank managers did not show their willingness to share the information of online users
with the researcher due to privacy concern. The sampling surrounds all those persons using the online
banking services
Data Analysis Methods
SPSS 20 was used for statistical analysis of the surveyed data. Personal information of online users was
depicted through percentages. Reliability of the questionnaire was examined using Cronbach Alpha.
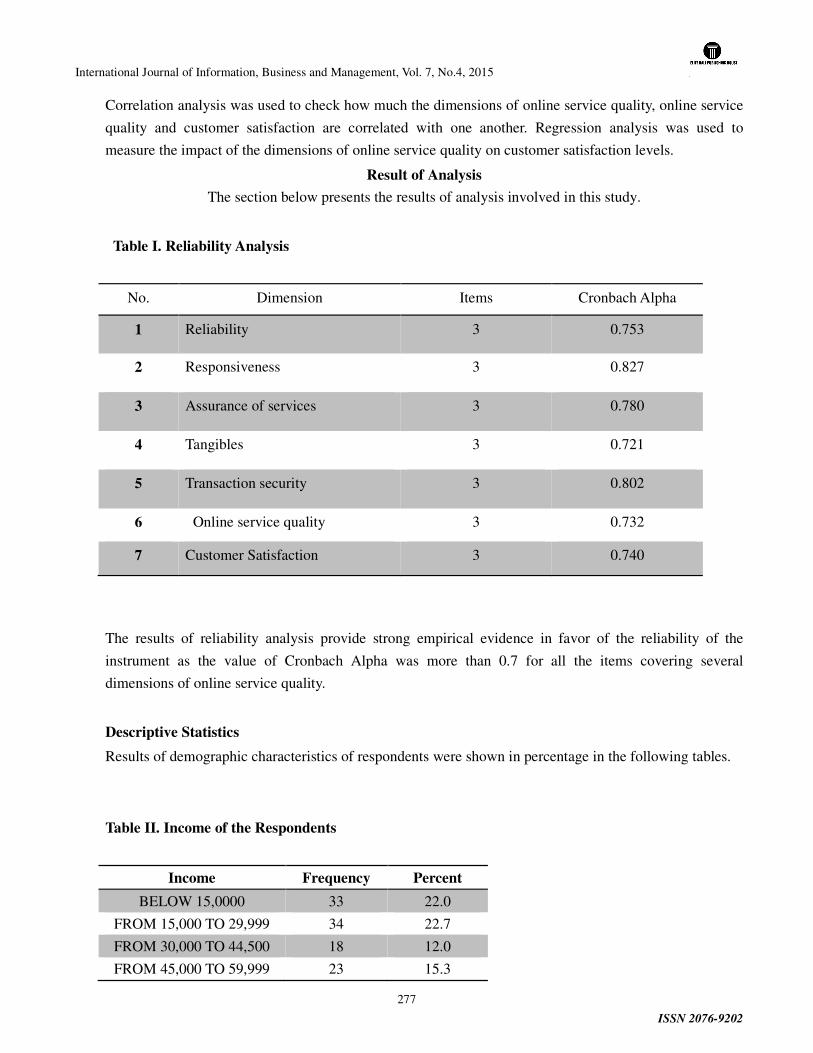
International Journal of Information, Business and Management, Vol. 7, No.4, 2015
ISSN 2076-9202
277
Correlation analysis was used to check how much the dimensions of online service quality, online service
quality and customer satisfaction are correlated with one another. Regression analysis was used to
measure the impact of the dimensions of online service quality on customer satisfaction levels.
Result of Analysis
The section below presents the results of analysis involved in this study.
Table I. Reliability Analysis
No. Dimension Items Cronbach Alpha
1 Reliability 3 0.753
2 Responsiveness 3 0.827
3 Assurance of services 3 0.780
4 Tangibles 3 0.721
5 Transaction security 3 0.802
6 Online service quality 3 0.732
7 Customer Satisfaction 3 0.740
The results of reliability analysis provide strong empirical evidence in favor of the reliability of the
instrument as the value of Cronbach Alpha was more than 0.7 for all the items covering several
dimensions of online service quality.
Descriptive Statistics
Results of demographic characteristics of respondents were shown in percentage in the following tables.
Table II. Income of the Respondents
Income Frequency Percent
BELOW 15,0000 33 22.0
FROM 15,000 TO 29,999 34 22.7
FROM 30,000 TO 44,500 18 12.0
FROM 45,000 TO 59,999 23 15.3
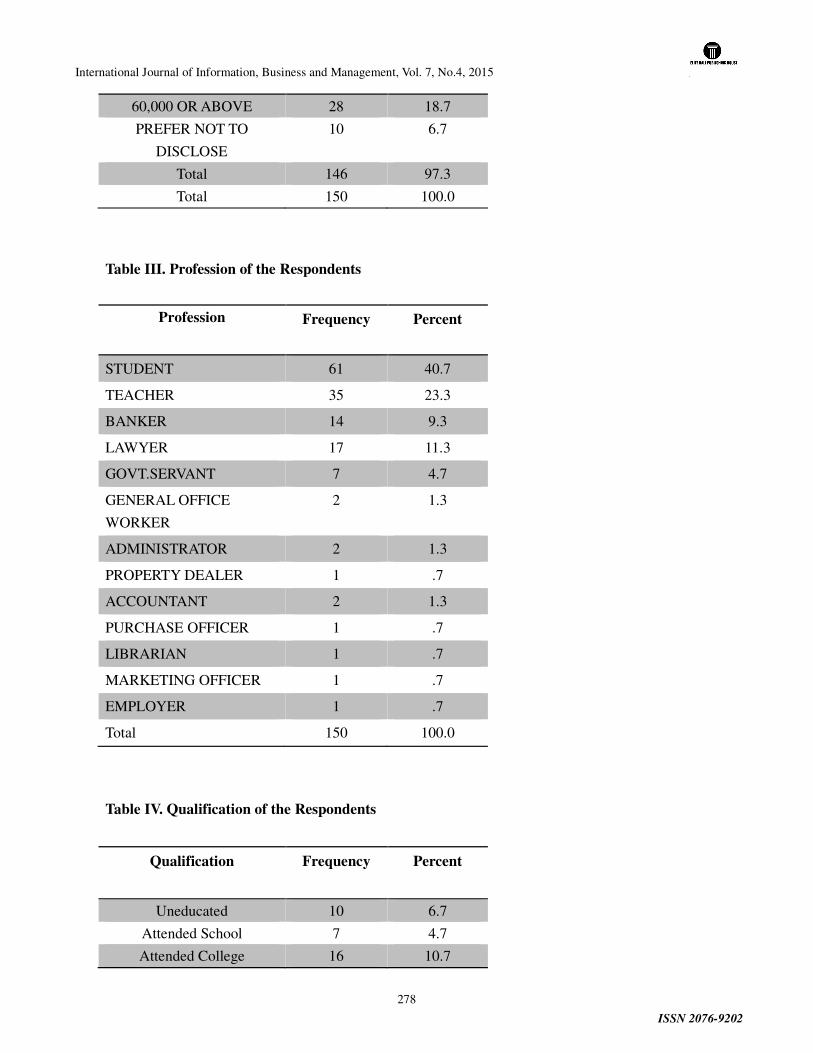
International Journal of Information, Business and Management, Vol. 7, No.4, 2015
ISSN 2076-9202
278
60,000 OR ABOVE 28 18.7
PREFER NOT TO
DISCLOSE
10 6.7
Total 146 97.3
Total 150 100.0
Table III. Profession of the Respondents
Profession
Frequency Percent
STUDENT 61 40.7
TEACHER 35 23.3
BANKER 14 9.3
LAWYER 17 11.3
GOVT.SERVANT 7 4.7
GENERAL OFFICE
WORKER
2 1.3
ADMINISTRATOR 2 1.3
PROPERTY DEALER 1 .7
ACCOUNTANT 2 1.3
PURCHASE OFFICER 1 .7
LIBRARIAN 1 .7
MARKETING OFFICER 1 .7
EMPLOYER 1 .7
Total 150 100.0
Table IV. Qualification of the Respondents
Qualification
Frequency Percent
Uneducated 10 6.7
Attended School 7 4.7
Attended College 16 10.7
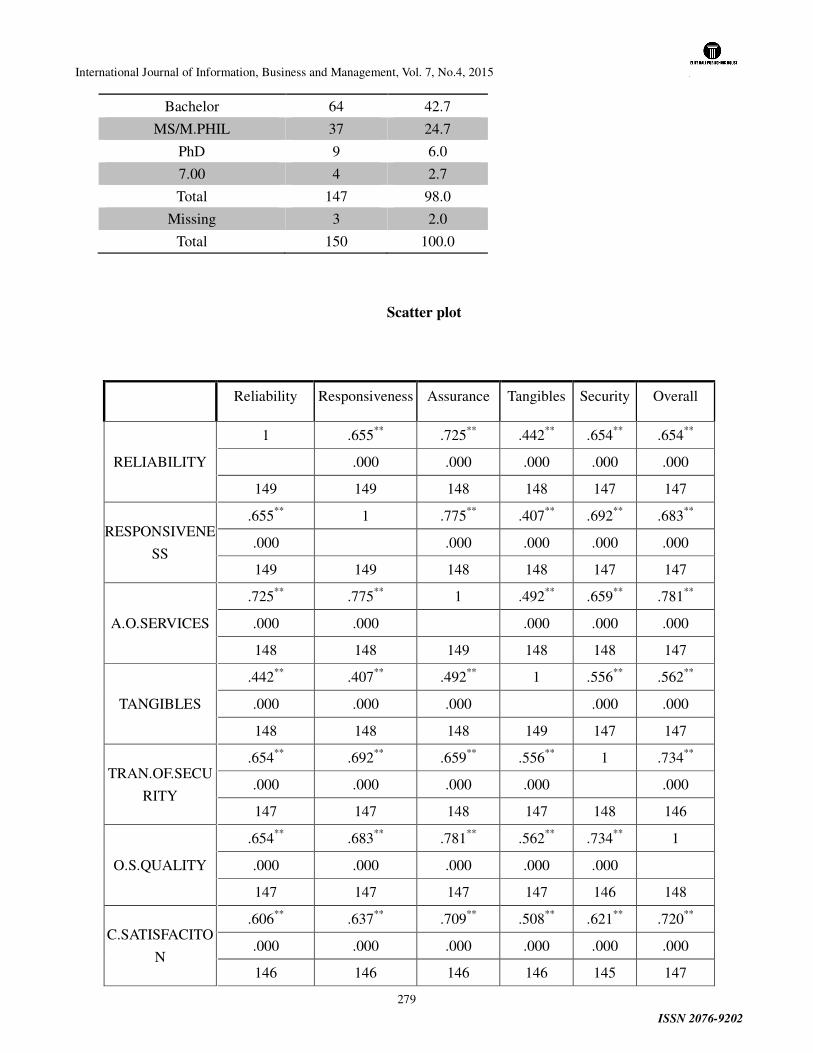
International Journal of Information, Business and Management, Vol. 7, No.4, 2015
ISSN 2076-9202
279
Bachelor 64 42.7
MS/M.PHIL 37 24.7
PhD 9 6.0
7.00 4 2.7
Total 147 98.0
Missing 3 2.0
Total 150 100.0
Scatter plot
Reliability Responsiveness Assurance Tangibles Security Overall
RELIABILITY
1 .655** .725** .442** .654** .654**
.000 .000 .000 .000 .000
149 149 148 148 147 147
RESPONSIVENE
SS
.655** 1 .775** .407** .692** .683**
.000 .000 .000 .000 .000
149 149 148 148 147 147
A.O.SERVICES
.725** .775** 1 .492** .659** .781**
.000 .000 .000 .000 .000
148 148 149 148 148 147
TANGIBLES
.442** .407** .492** 1 .556** .562**
.000 .000 .000 .000 .000
148 148 148 149 147 147
TRAN.OF.SECU
RITY
.654** .692** .659** .556** 1 .734**
.000 .000 .000 .000 .000
147 147 148 147 148 146
O.S.QUALITY
.654** .683** .781** .562** .734** 1
.000 .000 .000 .000 .000
147 147 147 147 146 148
C.SATISFACITO
N
.606** .637** .709** .508** .621** .720**
.000 .000 .000 .000 .000 .000
146 146 146 146 145 147
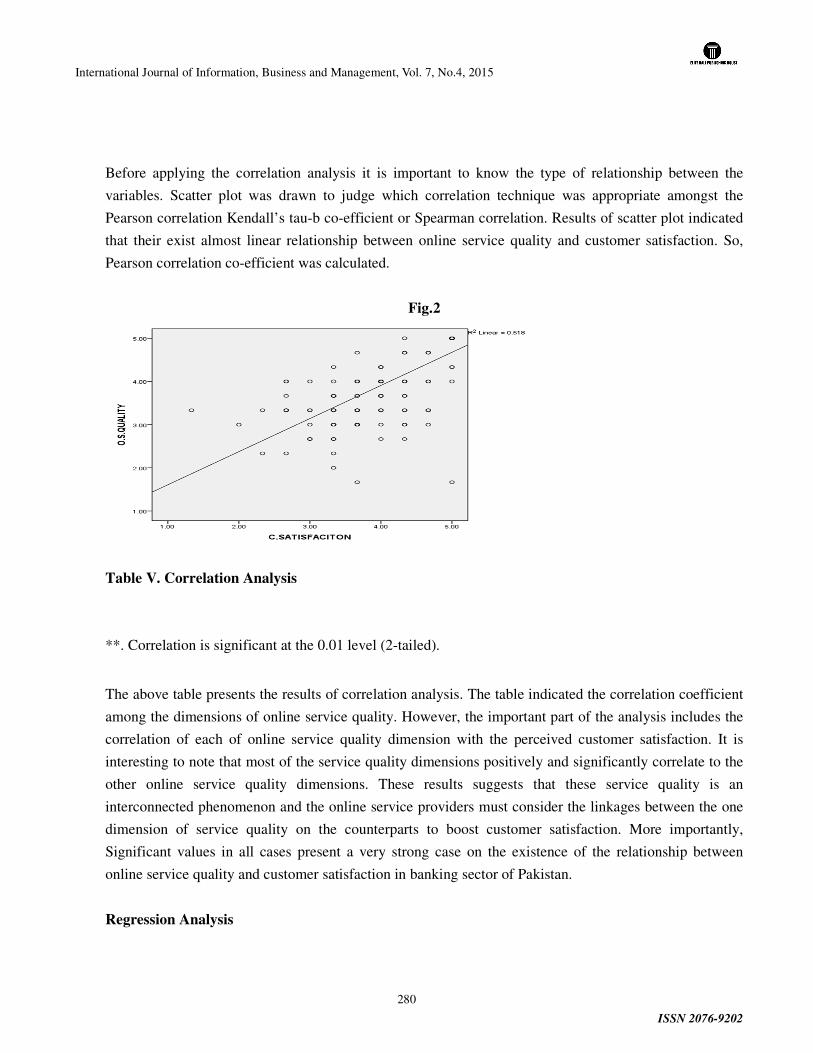
International Journal of Information, Business and Management, Vol. 7, No.4, 2015
ISSN 2076-9202
280
Before applying the correlation analysis it is important to know the type of relationship between the
variables. Scatter plot was drawn to judge which correlation technique was appropriate amongst the
Pearson correlation Kendall’s tau-b co-efficient or Spearman correlation. Results of scatter plot indicated
that their exist almost linear relationship between online service quality and customer satisfaction. So,
Pearson correlation co-efficient was calculated.
Fig.2
Table V. Correlation Analysis
**. Correlation is significant at the 0.01 level (2-tailed).
The above table presents the results of correlation analysis. The table indicated the correlation coefficient
among the dimensions of online service quality. However, the important part of the analysis includes the
correlation of each of online service quality dimension with the perceived customer satisfaction. It is
interesting to note that most of the service quality dimensions positively and significantly correlate to the
other online service quality dimensions. These results suggests that these service quality is an
interconnected phenomenon and the online service providers must consider the linkages between the one
dimension of service quality on the counterparts to boost customer satisfaction. More importantly,
Significant values in all cases present a very strong case on the existence of the relationship between
online service quality and customer satisfaction in banking sector of Pakistan.
Regression Analysis
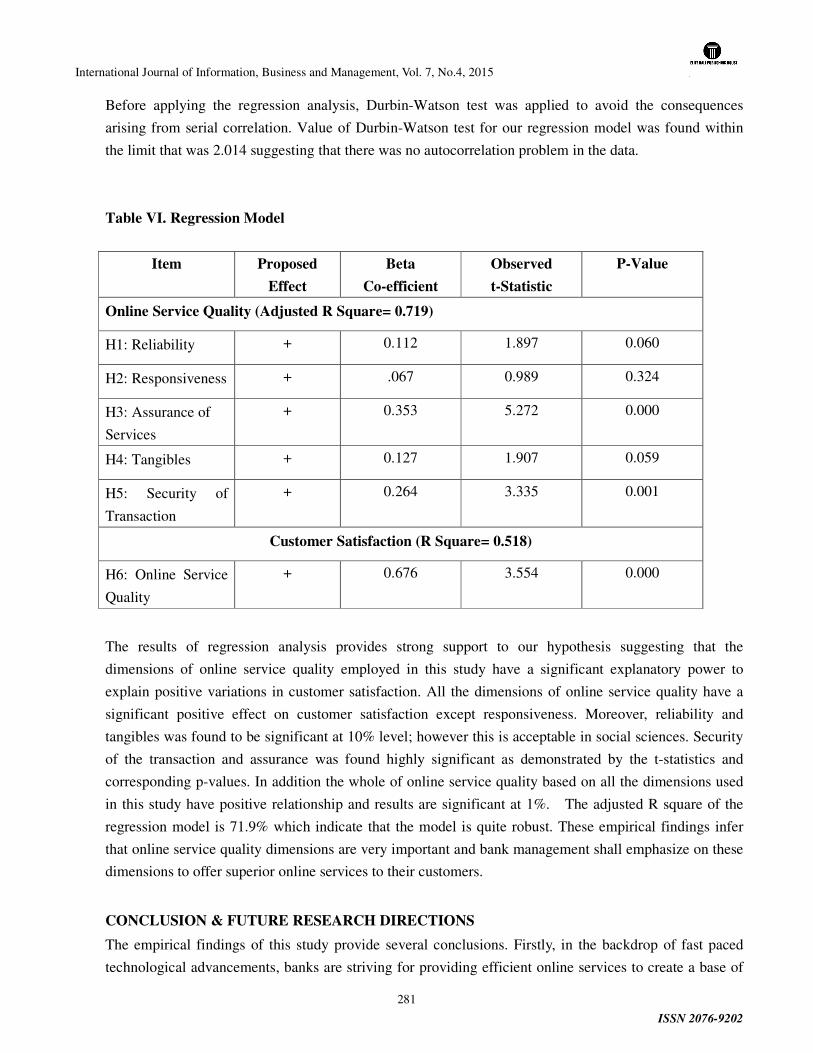
International Journal of Information, Business and Management, Vol. 7, No.4, 2015
ISSN 2076-9202
281
Before applying the regression analysis, Durbin-Watson test was applied to avoid the consequences
arising from serial correlation. Value of Durbin-Watson test for our regression model was found within
the limit that was 2.014 suggesting that there was no autocorrelation problem in the data.
Table VI. Regression Model
Item Proposed
Effect
Beta
Co-efficient
Observed
t-Statistic
P-Value
Online Service Quality (Adjusted R Square= 0.719)
H1: Reliability + 0.112 1.897 0.060
H2: Responsiveness + .067 0.989 0.324
H3: Assurance of
Services
+ 0.353 5.272 0.000
H4: Tangibles + 0.127 1.907 0.059
H5: Security of
Transaction
+ 0.264 3.335 0.001
Customer Satisfaction (R Square= 0.518)
H6: Online Service
Quality
+ 0.676 3.554 0.000
The results of regression analysis provides strong support to our hypothesis suggesting that the
dimensions of online service quality employed in this study have a significant explanatory power to
explain positive variations in customer satisfaction. All the dimensions of online service quality have a
significant positive effect on customer satisfaction except responsiveness. Moreover, reliability and
tangibles was found to be significant at 10% level; however this is acceptable in social sciences. Security
of the transaction and assurance was found highly significant as demonstrated by the t-statistics and
corresponding p-values. In addition the whole of online service quality based on all the dimensions used
in this study have positive relationship and results are significant at 1%. The adjusted R square of the
regression model is 71.9% which indicate that the model is quite robust. These empirical findings infer
that online service quality dimensions are very important and bank management shall emphasize on these
dimensions to offer superior online services to their customers.
CONCLUSION & FUTURE RESEARCH DIRECTIONS
The empirical findings of this study provide several conclusions. Firstly, in the backdrop of fast paced
technological advancements, banks are striving for providing efficient online services to create a base of
International Journal of Information, Business and Management, Vol. 7, No.4, 2015
ISSN 2076-9202
282
satisfied and loyal customers. Firstly, banks need to improve their tangible infrastructure in order to avoid
breakdowns and ensure hazard free services to their clients. To ensure this they need to increase
investment on the purchase of latest technology. Secondly, banks shall strive for providing a good security
mechanism to secure the private information of the online customers. Additionally, customer service staff
shall adopt such attitudes that instill reliability and assurance in their customers. The significant positive
relationship of online service quality dimensions as well as overall service quality highlights the
importance of these factors in online service organizations. Managers can create positive value for their
organizations as well as outperform their competitors by focusing on these online service quality
dimensions. Further researches in this area shall take some other dimensions of service quality like
transactional charges, timeliness of the transaction and convenience of using online services to check their
effect on customer satisfaction.
REFERENCES
Ahmad, N., & Iqbal, H. (2010). Impact of Service Quality on Customers Satisfaction: Empirical evidence from telecom sector of Pakistan. Interdisciplinery journal of contemporary research in business, 98-113.
Awad E. (2000). The Structure of E-Commerce in the Banking Industry: An Empirical Investigation. Proceedings of the 2000 ACM SIGCPR conference, Illinois USA.
Ganguli, S., & Roy, S. K. (2011). Generic technology-based service quality dimensions in banking :Impact on customer satisfaction and loyalty. International Journal of Bank Marketing, 168 - 189.
Herington, C., & Weaven, S. (2007). Can banks improve customer relationships with high quality online services? Managing Service Quality, 404 - 427.
Herington, C., & Weaven, S. (2009). E-retailing by banks: e-service quality and its importance to customer satisfaction. European Journal of Marketing, 1220 - 1231.
Jun M, Cai, S., (2001). The key determinants of internet banking service quality: a content analysis. Int. J. Bank. Mark. 19(7): 276-291.
Kadir, H. A., Rehmani, N., & Masinaei, R. (2011). Impacts of Service Quality on Customer Satisfaction: Study of Online Banking and ATM Services in Malaysia. International Journal of Trade, Economics and Finance, 2 (1), 201-223.
Kadir, H. A., Rahmani, N., & Masinaei, R. (2011). Service Quality Analysis: An Application on Online Banking and A.T.M Facilities. International Proceedings of Economics Development and Research, 4, 228-232.
Naeem, H., Akram, A., & Saif, M. I. (2009, December). Service Quality And Its Impact on Customer Satisfaction: An Empirical Evidence from The Pakistani Banking Sector. International Business and Economics Research Journal, 8(12), 99-104.
International Journal of Information, Business and Management, Vol. 7, No.4, 2015
ISSN 2076-9202
283
Rod, M., Ashill, N. J., Shao, J., & Carruthers, J. (2009). An examination of the relationship between service quality dimensions, overall internet banking service quality and customer satisfaction:A New Zealand study. Marketing Intelligence & Planning, 103 - 126.
Siu N, Mou J., (2003). A study of service quality in internet banking. International Journal of Consumer Marketing, 17(4), 99-116.
Zafar, M., Zaheer, A., Rahman, S. u., & Rehman, K. u. (2011). Impact of online service quality on customer satisfaction in banking sector of Pakistan. African Journal of Business Management, 11786-11793.
Zeithaml, VA., (1988). Consumer perception of price quality and value. Journal of Marketing, 52(3), 2-22.
Ziethaml, A. V., & Bitner, M. J. (1996). Services Marketing. Singapore: McGraw Hill Inc.
Zeithaml, V. A., Parasuraman, A., & Molhotra, A. (2002). "A Conceptual Framework For Understanding E-Service Quality: Implications For Future Research And Managerial Practice". Working Paper, Report No.00-115, Marketing Science Institute, Cambridge, MA.
International Journal of Information, Business and Management, Vol. 7, No.4, 2015
ISSN 2076-9202
284
Impact of Working Capital Management on Firm Profitability: An
Empirical Study of ITC Ltd.
Dr.S.K.Khatik1
Mr. Titto Varghese2
Abstract
The efficient management of working capital plays a crucial role in the successful functioning of a
firm. . Firm should always keep monitoring the liquidity position as it projects the company’s
credit image. Lack of liquidity can create a bad image among the parties interested in the firms
functioning. Also firm must ensure that there should be a proper balance between current
assets and current liabilities , as it can affect the profitability of the firm. For making the
analysis of Liquidity-profitability relationship of ITC, ratio analysis techniques of Financial
Management have been used.
By observation of this it can be seen that even though the profitability position was strong, the
liquidity position of ITC is not up to the ideal level. The short term solvency position of the firm
must be strengthened so that it is able to meet its obligations timely. These things facilitate the
maximization of the wealth of the firm. From this study it can be concluded that there is a
significant difference in the profitability & liquidity position of the company because it has been
seen that the profitability position was strong were as the liquidity position was not satisfactory.
The risk factor of the firm is high as compared to profitability. The total risk of the firm is also
high as compared to the ROCE, which was not worthwhile for the future prospects of the firm.
Key Words: Liquidity, Profitability, Risk, Current ratio, Net Working Capital, ROCE,
Risk-return Trade Off
JEL Code: G31, G32
Concept
The Management of Fixed assets and Current assets has a great impact on future return and risk of the
company. Managing fixed assets will help the concern in long term decisions. The current assets are the
assets which can be used by the company to meet their short term obligations. Working capital refers to
the firm’s investment in short term assets i.e. cash, short-term securities, debtors etc. it is the fund needed
to meet the day-to-day expenses. So it is vital ingredient to the business as the blood is to the human
body.
1 Professor & Head, Department of Commerce, Chairman Board of studies Commerce, Barkatullah University, Bhopal, Madhya Pradesh, India. 2 Research Scholar, Department of Commerce, Barkatullah University, Bhopal, Madhya Pradesh, India.
International Journal of Information, Business and Management, Vol. 7, No.4, 2015
ISSN 2076-9202
285
There are two concepts of working capital: Gross Working Capital and Net Working Capital. The former
means the firm’s investment in current assets and later the excess of current assets over the current
liabilities. Since the elements of working capital are short term in nature constant monitoring must be
done for proper management. Working capital can also be defined as the working expenses that get
blocked in current assets along the productive line of an enterprise. The Net Working Capital is that
liquidity which takes care of the working expenses.
The working capital requirement of a firm will depend upon its operating cycle. It is a cycle having a
continuous series of steps for conversion of sales into cash. The working capital is required maintaining
its liquidity in day-to-day operation to ensure it’s smooth running and meets its obligation (Eljelly, 2004).
Yet, this is not a simple task since managers must make sure that business operation is running in efficient
and profitable manner. There are the possibilities of mismatch of current asset and current liability during
this process. If this happens and firm’s manager cannot manage it properly then it will affect firm’s
growth and profitability. This will further lead to financial distress and finally firms can go bankrupt.
Working Capital management
A firm should maintain adequate level of working capital to meet the current obligations to maintain
uninterrupted business operation. Firm should always keep monitoring the liquidity position as it projects
the company’s credit image. Lack of liquidity can create a bad image among the parties interested in the
firms functioning. Also firm must ensure that there should be a proper balance between current assets
and current liabilities , as it can affect the profitability of the firm. Greater investment in idle current
assets can result in decrease in profitability.
So the goal of working capital management is to ensure that the firm is able to continue its day-to-day
operations and it has the sufficient ability to satisfy its present and future short term expenses. There
should be proper proportion between the level of current assets and current liability. So an efficient
working capital management will enable the concern to maintain a good balance between the liquidity
and profitability. Ezra Solomon states that “ liquidity measures a company`s ability to meet expected
as well as unexpected requirement of cash to expand its assets, reduce its liabilities and cover up an
operating losses”.
Risk-Return trade off
Every financial Decision has different degree of risk. Return and Risk are directly proportional, as a
higher degree of risk can lead to higher return and vice-versa. Risk return trade off in an enterprise can be
sustained by maintaining a proper balance between liquidity and profitability. Liquidity in a firm
represents the amount of investment in current assets and profitability the productivity of these current
assets. Higher investment in unproductive current assets can lead to decrease in profitability. Working
capital is to achieve desired trade off between liquidity and profitability (Smith 1980; Rehman & Nasr,
2007). Referring to theory of risk and return,Investment with more risk will result to more return. Thus,
Firm’s with high liquidity of working Capital many have to low risk then low Profitability. Conversely,
Firm that has low liquidity of working capital ,facing high risk results to high Profitability. The issue here
International Journal of Information, Business and Management, Vol. 7, No.4, 2015
ISSN 2076-9202
286
is in managing working capital, Firm must take into consideration all the items in both accounts and try to
balance the risk and return. So a proper management of Net Working Capital will ensure a good
risk-return proportion.
Justification of the Topic
Proper management of working capital is required to ensure that the firm is able to continue its day-to-day
operations and it has the sufficient ability to satisfy its present and upcoming short term expenses. The
working capital position helps the investors, creditors, bankers, suppliers, financial institutions,
government etc. judge the stability of the enterprise. The financial institutions and individuals may be
interested in investing in that company which is financial strong to meet its present and upcoming short
term expenses. Well maintained working capital will help to create good creditors image, avoid unwanted
borrowing, healthy government support etc. An efficient working capital management will only help a
firm to compete in the present global market. Working capital is the life blood and nerve centre of
business . Just as circulation of blood is essential in the human body for maintaining life , working capital
is very essential to maintain the smooth running of the business. No business can run successfully without
an adequate amount of working capital. Working capital plays a vital role in the impact of the
business. So there exist a number of implication and gaps for enquiry into working capital management of
companies; against this background a study was conducted on the Working Capital position of ITC
Limited.
Objectives of Study
This study has the following objectives:-
i. To analyze the Working capital position of ITC Ltd.
ii. To analyze the effect of liquidity on profitability
iii. To analyze the effect of risk on profitability.
iv. To give suggestions on the basis of findings of the study.
Hypotheses of the Study
This study is based on the following null hypotheses ( H0):
i. There is no significant difference between liquidity and profitability of ITC during the period
of study.
International Journal of Information, Business and Management, Vol. 7, No.4, 2015
ISSN 2076-9202
287
ii. There is no significant difference between risk and profitability of ITC during the period of
study.
Company profile
ITC was incorporated on August 24, 1910 under the name Imperial Tobacco Company of India Limited.
As the Company's ownership progressively Indianised, the name of the Company was changed from
Imperial Tobacco Company of India Limited to India Tobacco Company Limited in 1970 and then to
I.T.C. Limited in 1974. In recognition of the Company's multi-business portfolio encompassing a wide
range of businesses - Cigarettes & Tobacco, Hotels, Information Technology, Packaging, Paperboards &
Specialty Papers, Agri-business, Foods, Lifestyle Retailing, Education & Stationery and Personal Care -
the full stops in the Company's name were removed effective September 18, 2001. The Company now
stands rechristened 'ITC Limited'.
The office on Radha Bazar Lane, Kolkata, was the centre of the Company's existence The Company's
headquarter building, 'Virginia House', which came up on that plot of land two years later, would go on to
become one of Kolkata's most venerated landmarks. Though the first six decades of the Company's
existence were primarily devoted to the growth and consolidation of the Cigarettes and Leaf Tobacco
businesses,
In 1975 the Company launched its Hotels business with the acquisition of a hotel in Chennai which was
rechristened 'ITC-Welcomgroup Hotel Chola'. In 1979, ITC entered the Paperboards business by
promoting ITC Bhadrachalam Paperboards Limited, which today has become the market leader in India.
In 1985, ITC set up Surya Tobacco Co. in Nepal as an Indo-Nepal and British joint venture. Since
inception, its shares have been held by ITC, British American Tobacco and various independent
shareholders in Nepal.In 1990, ITC acquired Tribeni Tissues Limited, a specialty paper manufacturing
company and a major supplier of tissue paper to the cigarette industry. In 1990, leveraging its
agri-sourcing competency, ITC set up the Agri Business Division for export of agri-commodities.
In 2000, ITC forayed into the Greeting, Gifting and Stationery products business with the launch of
Expressions range of greeting cards. A line of premium range of notebooks under brand “Paperkraft”was
launched in 2002. In 2008, ITC repositioned the business as the Education and Stationery Products
Business and launched India's first environment friendly premium business paper under
the “Paperkraft” Brand. ITC also entered the Lifestyle Retailing business with the Wills Sport range of
International Journal of Information, Business and Management, Vol. 7, No.4, 2015
ISSN 2076-9202
288
international quality relaxed wear for men and women in 2000. The Wills Lifestyle chain of exclusive
stores later expanded its range to include Wills Classic formal wear (2002) and Wills Clublife evening
wear (2003). ITC also initiated a foray into the popular segment with its men's wear brand, John Players,
in 2002.
With all these achievements ITC is the biggest FMCG player with a turnover of Rs. 29605.58
Crores in the financial year 2012-13
Review of LiteratureReview of LiteratureReview of LiteratureReview of Literature
Gul, Khan, Rehman, Khan, Khan and Khan (2013) investigated the influence of working capital
management (WCM) on performance of small medium enterprises (SMEs) in Pakistan. The duration of
the study was seven years from 2006 to 2012. The data used in this study was taken from SMEDA,
Karachi Stock Exchange, tax offices, company itself and Bloom burgee business week. The dependent
variable of the study was Return on Assets (ROA) which was used as a proxy for profitability.
Independent variables were Number of Days Account Receivable (ACP), Number of Day’s Inventory
Almazari (2013) investigated the relationship between the working capital management(WCM) and the
firms’ profitability for the Saudi cement manufacturing companies. The sample included 8 Saudi cement
manufacturing companies listed in the Saudi Stock Exchange for the period of 5 years from 2008-2012.
Pearson Bivariate correlation and regression analysis were used. The study results showed that Saudi
cement industry’s current ratio was the most important liquidity measure which effected profitability,
therefore, the cement firms must set a trade-off between these two objectives so that, neither the liquidity
nor profitability suffers. It was also found, as the size of a firm increases, profitability increased. Besides,
when the debt financing increased, profitability declined. Linear regression tests confirmed a high degree
of association between the working capital management and profitability.
Akoto, Awunyo- Vitor and Angmor (2013) analyzed the relationship between working capital
management practices and profitability of listed manufacturing firms in Ghana. The study used data
collected from annual reports of all the 13 listed manufacturing firms in Ghana covering the period from
2005-2009. Using panel data methodology and regression analysis, the study found a significant negative
relationship between Profitability and Accounts Receivable Days. However, the firms’ Cash Conversion
Cycle, Current Asset Ratio, Size, and Current Asset Turnover significantly positively influence
profitability. The study suggests that managers can create value for their shareholders by creating
incentives to reduce their accounts receivable to 30 days. It is further recommended that, enactments of
local laws that protect indigenous firms and restrict the activities of importers are eminent to promote
increase demand for locally manufactured goods both in the short and long runs in Ghana. Omesa,
Maniagi, Musiega and Makori (2013) examined the relationships between Working Capital Management
and Corporate Performance of manufacturing firms listed on the Nairobi securities exchange. A sample of
20 companies whose data for 5 years from 2007-2011
International Journal of Information, Business and Management, Vol. 7, No.4, 2015
ISSN 2076-9202
289
Sharma and Kumar (2011) examined the effect of working capital on profitability of Indian firms. They
collected data about a sample of 263 non-financial BSE 500 firms listed at the Bombay Stock (BSE) from
2000 to 2008 and evaluated the data using OLS multiple regression. The results revealed that working
capital management and profitability is positively correlated in Indian companies. The study further
reveals that inventory of number of days and numbers of day’s accounts payable are negatively correlated
with a firm’s profitability, whereas number of days accounts receivables and cash conversion period
exhibit a positive relationship with corporate profitability.
Raheman, Afza, Qayyum and Bodla (2010) analyzed the impact of working capital management on firm’s
performance in Pakistan for the period 1998 to 2007. For this purpose, balanced panel data of 204
manufacturing firms was used which are listed on Karachi Stock Exchange. The results indicate that the
cash conversion cycle, net trade cycle and inventory turnover in days are significantly affecting the
performance of the firms. They concluded that manufacturing firms were in general facing problems with
their collection and payment policies. Moreover, financial leverage, sales growth and firm size also had
significant effect on the firm’s profitability. They study recommended that effective policies must be
formulated for the individual components of working capital.
Mathuva (2010) in his study on the influence of working capital management on corporate profitability
found that there exists a highly significant negative relationship between the time it takes for firms to
collect cash from their customers and profitability. He explained that the more profitable firms take the
shortest time to collect cash from the customers. The study further revealed that there exist a highly
significant positive relationship between the inventory conversion period and profitability. It was
explained that firms, which maintain sufficiently high inventory levels reduce costs of possible
interruptions in the production process and loss of business due to scarcity and products. Finally, the
study established that there exists a highly significant positive significant positive relationship between
the average payment period and profitability. He held that the longer a firm takes to pay its creditors, the
more profitable it is. In this study, a sample of 30 firms listed on Nairobi Stock Exchange for the periods
1993 to 2008 was used. Both the ported OLS and the fixed effects regression models were used.
Gill, Biger and Mathur (2010) analyzed the relationship between working capital management and
profitability of 88 American firms listed on New York Stock Exchange for a period of 3 years from 2005
to 2007 was selected. The data was analyzed using Pearson Bivariate Correlation Analysis and Weighted
Least Squares (WLS) Regression techniques. They found statistically significant relationship between the
cash conversion cycle and profitability, measured through gross operating profit. It followed that
managers can create profits for their companies by handling correctly the cash conversion cycle and by
keeping accounts receivables at an optimal level.
Bonamyong (2005) highlighted that a company with a lower cash conversion cycle is more efficient
because it turns its working capital over more times in a year, which means it generated more sales per
unit of money invested in working capital management.
Garcia-Teruel and Martinez-Solano (2007) in their Study demonstrated that managers can create value by
reducing their inventories and shortening the number of days for which their accounts are outstanding.
Gupta (2010) observed that better working capital can significantly help companies improve their growth
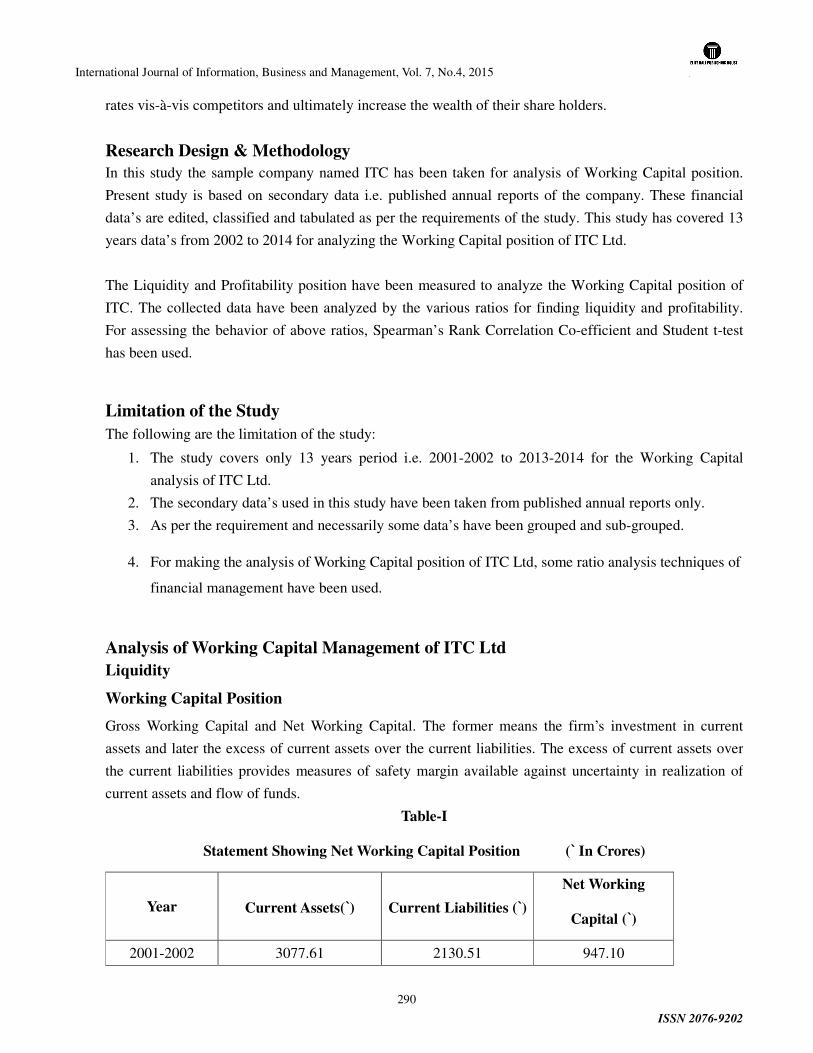
International Journal of Information, Business and Management, Vol. 7, No.4, 2015
ISSN 2076-9202
290
rates vis-à-vis competitors and ultimately increase the wealth of their share holders.
Research Design & Methodology
In this study the sample company named ITC has been taken for analysis of Working Capital position.
Present study is based on secondary data i.e. published annual reports of the company. These financial
data’s are edited, classified and tabulated as per the requirements of the study. This study has covered 13
years data’s from 2002 to 2014 for analyzing the Working Capital position of ITC Ltd.
The Liquidity and Profitability position have been measured to analyze the Working Capital position of
ITC. The collected data have been analyzed by the various ratios for finding liquidity and profitability.
For assessing the behavior of above ratios, Spearman’s Rank Correlation Co-efficient and Student t-test
has been used.
Limitation of the Study
The following are the limitation of the study:
1. The study covers only 13 years period i.e. 2001-2002 to 2013-2014 for the Working Capital
analysis of ITC Ltd.
2. The secondary data’s used in this study have been taken from published annual reports only.
3. As per the requirement and necessarily some data’s have been grouped and sub-grouped.
4. For making the analysis of Working Capital position of ITC Ltd, some ratio analysis techniques of
financial management have been used.
Analysis of Working Capital Management of ITC Ltd
Liquidity
Working Capital Position
Gross Working Capital and Net Working Capital. The former means the firm’s investment in current
assets and later the excess of current assets over the current liabilities. The excess of current assets over
the current liabilities provides measures of safety margin available against uncertainty in realization of
current assets and flow of funds.
Table-I
Statement Showing Net Working Capital Position (` In Crores)
Year Current Assets(`) Current Liabilities (`)
Net Working
Capital (`)
2001-2002 3077.61 2130.51 947.10
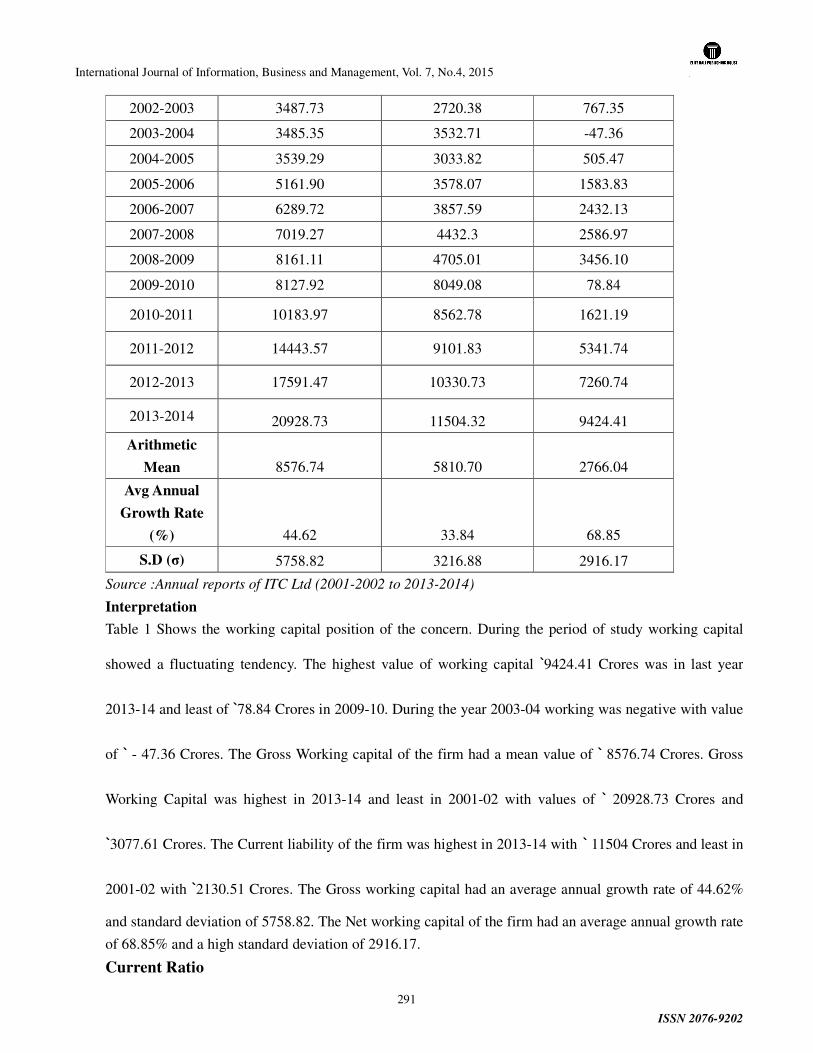
International Journal of Information, Business and Management, Vol. 7, No.4, 2015
ISSN 2076-9202
291
2002-2003 3487.73 2720.38 767.35
2003-2004 3485.35 3532.71 -47.36
2004-2005 3539.29 3033.82 505.47
2005-2006 5161.90 3578.07 1583.83
2006-2007 6289.72 3857.59 2432.13
2007-2008 7019.27 4432.3 2586.97
2008-2009 8161.11 4705.01 3456.10
2009-2010 8127.92 8049.08 78.84
2010-2011 10183.97 8562.78 1621.19
2011-2012 14443.57 9101.83 5341.74
2012-2013 17591.47 10330.73 7260.74
2013-2014 20928.73 11504.32 9424.41
Arithmetic
Mean 8576.74 5810.70 2766.04
Avg Annual
Growth Rate
(%) 44.62 33.84 68.85
S.D (σ) 5758.82 3216.88 2916.17
Source :Annual reports of ITC Ltd (2001-2002 to 2013-2014)
Interpretation
Table 1 Shows the working capital position of the concern. During the period of study working capital
showed a fluctuating tendency. The highest value of working capital `9424.41 Crores was in last year
2013-14 and least of `78.84 Crores in 2009-10. During the year 2003-04 working was negative with value
of ` - 47.36 Crores. The Gross Working capital of the firm had a mean value of ` 8576.74 Crores. Gross
Working Capital was highest in 2013-14 and least in 2001-02 with values of ` 20928.73 Crores and
`3077.61 Crores. The Current liability of the firm was highest in 2013-14 with ` 11504 Crores and least in
2001-02 with `2130.51 Crores. The Gross working capital had an average annual growth rate of 44.62%
and standard deviation of 5758.82. The Net working capital of the firm had an average annual growth rate
of 68.85% and a high standard deviation of 2916.17.
Current Ratio
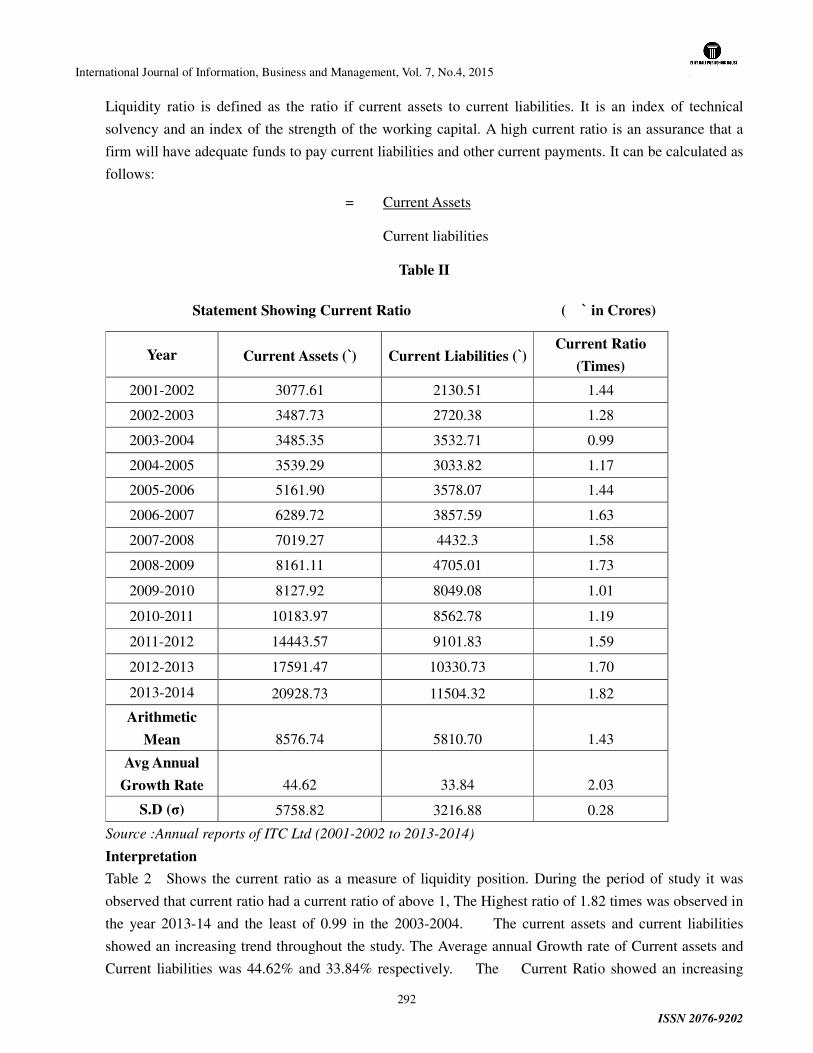
International Journal of Information, Business and Management, Vol. 7, No.4, 2015
ISSN 2076-9202
292
Liquidity ratio is defined as the ratio if current assets to current liabilities. It is an index of technical
solvency and an index of the strength of the working capital. A high current ratio is an assurance that a
firm will have adequate funds to pay current liabilities and other current payments. It can be calculated as
follows:
= Current Assets
Current liabilities
Table II
Statement Showing Current Ratio ( ` in Crores)
Year Current Assets (`) Current Liabilities (`) Current Ratio
(Times)
2001-2002 3077.61 2130.51 1.44
2002-2003 3487.73 2720.38 1.28
2003-2004 3485.35 3532.71 0.99
2004-2005 3539.29 3033.82 1.17
2005-2006 5161.90 3578.07 1.44
2006-2007 6289.72 3857.59 1.63
2007-2008 7019.27 4432.3 1.58
2008-2009 8161.11 4705.01 1.73
2009-2010 8127.92 8049.08 1.01
2010-2011 10183.97 8562.78 1.19
2011-2012 14443.57 9101.83 1.59
2012-2013 17591.47 10330.73 1.70
2013-2014 20928.73 11504.32 1.82
Arithmetic
Mean 8576.74 5810.70 1.43
Avg Annual
Growth Rate 44.62 33.84 2.03
S.D (σ) 5758.82 3216.88 0.28
Source :Annual reports of ITC Ltd (2001-2002 to 2013-2014)
Interpretation
Table 2 Shows the current ratio as a measure of liquidity position. During the period of study it was
observed that current ratio had a current ratio of above 1, The Highest ratio of 1.82 times was observed in
the year 2013-14 and the least of 0.99 in the 2003-2004. The current assets and current liabilities
showed an increasing trend throughout the study. The Average annual Growth rate of Current assets and
Current liabilities was 44.62% and 33.84% respectively. The Current Ratio showed an increasing
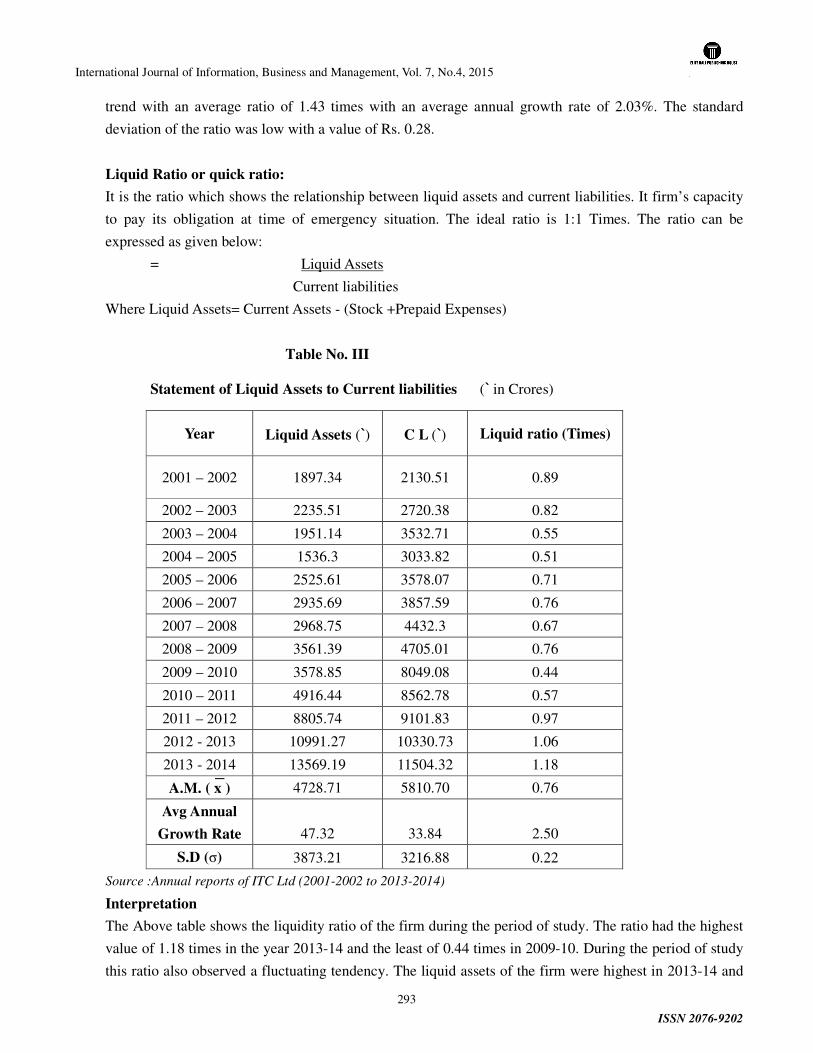
International Journal of Information, Business and Management, Vol. 7, No.4, 2015
ISSN 2076-9202
293
trend with an average ratio of 1.43 times with an average annual growth rate of 2.03%. The standard
deviation of the ratio was low with a value of Rs. 0.28.
Liquid Ratio or quick ratio:
It is the ratio which shows the relationship between liquid assets and current liabilities. It firm’s capacity
to pay its obligation at time of emergency situation. The ideal ratio is 1:1 Times. The ratio can be
expressed as given below:
= Liquid Assets
Current liabilities
Where Liquid Assets= Current Assets - (Stock +Prepaid Expenses)
Table No. III
Statement of Liquid Assets to Current liabilities (` in Crores)
Year Liquid Assets (`) C L (`) Liquid ratio (Times)
2001 – 2002 1897.34 2130.51 0.89
2002 – 2003 2235.51 2720.38 0.82
2003 – 2004 1951.14 3532.71 0.55
2004 – 2005 1536.3 3033.82 0.51
2005 – 2006 2525.61 3578.07 0.71
2006 – 2007 2935.69 3857.59 0.76
2007 – 2008 2968.75 4432.3 0.67
2008 – 2009 3561.39 4705.01 0.76
2009 – 2010 3578.85 8049.08 0.44
2010 – 2011 4916.44 8562.78 0.57
2011 – 2012 8805.74 9101.83 0.97
2012 - 2013 10991.27 10330.73 1.06
2013 - 2014 13569.19 11504.32 1.18
A.M. ( x ) 4728.71 5810.70 0.76
Avg Annual
Growth Rate 47.32 33.84 2.50
S.D (σ) 3873.21 3216.88 0.22
Source :Annual reports of ITC Ltd (2001-2002 to 2013-2014)
Interpretation
The Above table shows the liquidity ratio of the firm during the period of study. The ratio had the highest
value of 1.18 times in the year 2013-14 and the least of 0.44 times in 2009-10. During the period of study
this ratio also observed a fluctuating tendency. The liquid assets of the firm were highest in 2013-14 and

International Journal of Information, Business and Management, Vol. 7, No.4, 2015
ISSN 2076-9202
294
least in 2001-02 with values of `13569.19 Crores and `1536.30 Crores respectively. The liquid assets had
an average value of `4728.71 Crores with an average annual growth rate of 47.32%. The liquidity ratio
had an average value of 0.76 times with an average annual growth rate of 2.50%. The standard deviation
of the ratio was very low with a value of 0.22.
Cash Position Ratio.
It shows how much of total assets is kept in the form of cash is revealed through this ratio. How much per
rupee of total assets is kept in the form of cash. Higher the ratio shows less risk, but lower rate of return
as cash by itself does not earn profit. The ratio can be denoted as given below:
= Cash + Cash Equivalents
Total Assets
Table: IV
Statement of Cash to Total Assets (` in Crores)
Year
Cash &
Equivalents (`) TA(`)
Cash position Ratio
(Times)
2001 – 2002 44.21 6964.49 0.006
2002 – 2003 378.84 8266.56 0.046
2003 – 2004 34.04 15231.05 0.002
2004 – 2005 55.66 11550.88 0.005
2005 – 2006 855.82 13084.04 0.065
2006 – 2007 900.16 14968.4 0.060
2007 – 2008 570.25 17249.47 0.033
2008 – 2009 1032.39 19484.83 0.053
2009 – 2010 1126.28 23006.18 0.049
2010 – 2011 2243.24 25433.82 0.088
2011 – 2012 2818.93 28988.2 0.097
2012 - 2013 3615 34017.43 0.106
2013 - 2014 3289.37 39229.39 0.08
A.M. ( x ) 1304.94 19805.75 0.05
Avg Annual
Growth Rate 564.64 35.64 99.81
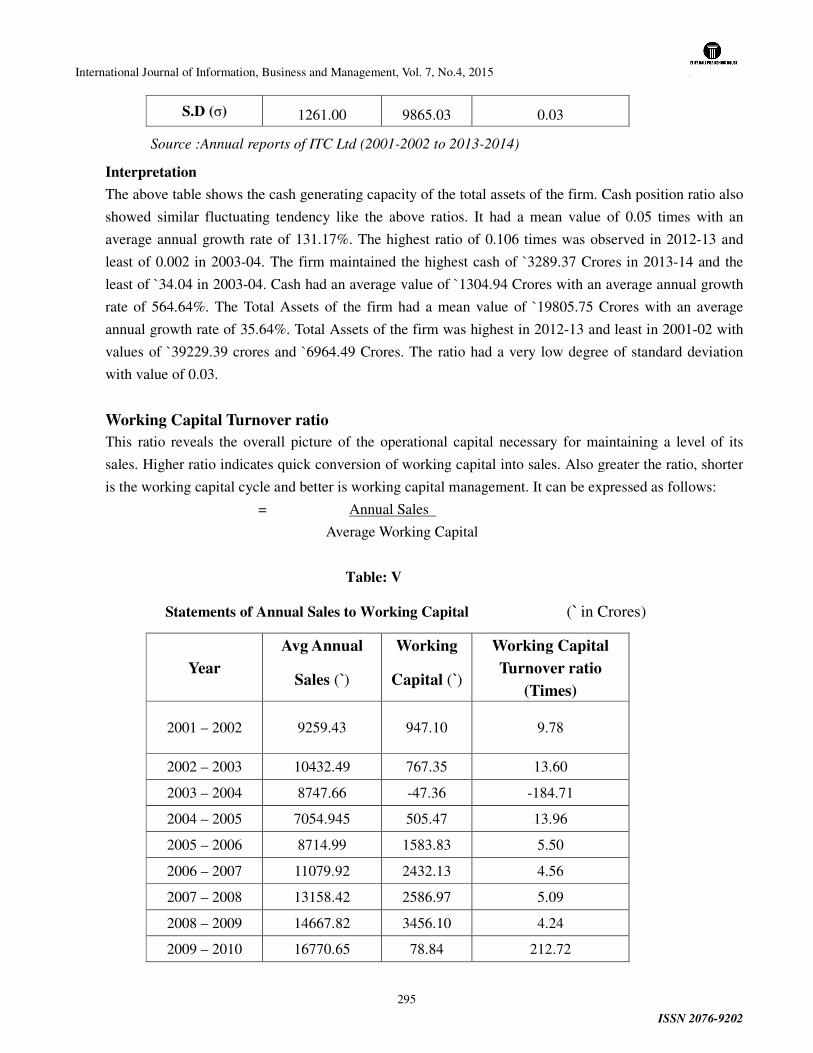
International Journal of Information, Business and Management, Vol. 7, No.4, 2015
ISSN 2076-9202
295
S.D (σ) 1261.00 9865.03 0.03
Source :Annual reports of ITC Ltd (2001-2002 to 2013-2014)
Interpretation
The above table shows the cash generating capacity of the total assets of the firm. Cash position ratio also
showed similar fluctuating tendency like the above ratios. It had a mean value of 0.05 times with an
average annual growth rate of 131.17%. The highest ratio of 0.106 times was observed in 2012-13 and
least of 0.002 in 2003-04. The firm maintained the highest cash of `3289.37 Crores in 2013-14 and the
least of `34.04 in 2003-04. Cash had an average value of `1304.94 Crores with an average annual growth
rate of 564.64%. The Total Assets of the firm had a mean value of `19805.75 Crores with an average
annual growth rate of 35.64%. Total Assets of the firm was highest in 2012-13 and least in 2001-02 with
values of `39229.39 crores and `6964.49 Crores. The ratio had a very low degree of standard deviation
with value of 0.03.
Working Capital Turnover ratio
This ratio reveals the overall picture of the operational capital necessary for maintaining a level of its
sales. Higher ratio indicates quick conversion of working capital into sales. Also greater the ratio, shorter
is the working capital cycle and better is working capital management. It can be expressed as follows:
= Annual Sales
Average Working Capital
Table: V
Statements of Annual Sales to Working Capital (` in Crores)
Year
Avg Annual
Sales (`)
Working
Capital (`)
Working Capital
Turnover ratio
(Times)
2001 – 2002 9259.43 947.10 9.78
2002 – 2003 10432.49 767.35 13.60
2003 – 2004 8747.66 -47.36 -184.71
2004 – 2005 7054.945 505.47 13.96
2005 – 2006 8714.99 1583.83 5.50
2006 – 2007 11079.92 2432.13 4.56
2007 – 2008 13158.42 2586.97 5.09
2008 – 2009 14667.82 3456.10 4.24
2009 – 2010 16770.65 78.84 212.72
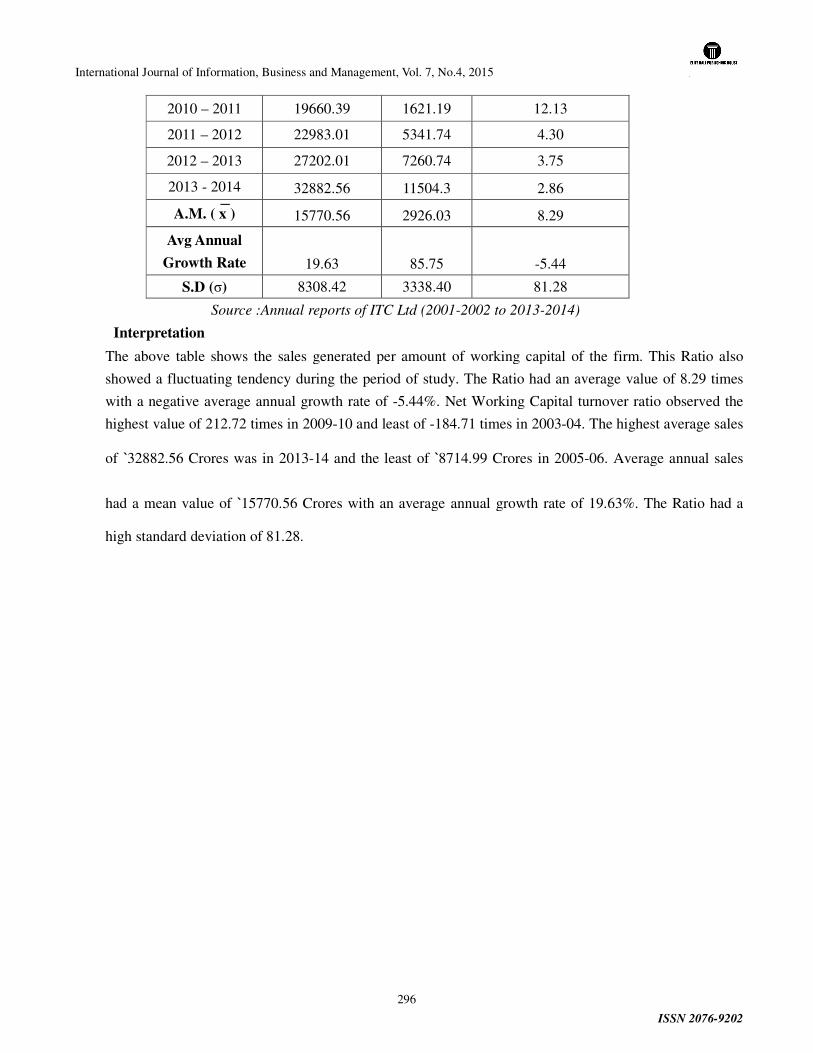
International Journal of Information, Business and Management, Vol. 7, No.4, 2015
ISSN 2076-9202
296
2010 – 2011 19660.39 1621.19 12.13
2011 – 2012 22983.01 5341.74 4.30
2012 – 2013 27202.01 7260.74 3.75
2013 - 2014 32882.56 11504.3 2.86
A.M. ( x ) 15770.56 2926.03 8.29
Avg Annual
Growth Rate 19.63 85.75 -5.44
S.D (σ) 8308.42 3338.40 81.28
Source :Annual reports of ITC Ltd (2001-2002 to 2013-2014)
Interpretation
The above table shows the sales generated per amount of working capital of the firm. This Ratio also
showed a fluctuating tendency during the period of study. The Ratio had an average value of 8.29 times
with a negative average annual growth rate of -5.44%. Net Working Capital turnover ratio observed the
highest value of 212.72 times in 2009-10 and least of -184.71 times in 2003-04. The highest average sales
of `32882.56 Crores was in 2013-14 and the least of `8714.99 Crores in 2005-06. Average annual sales
had a mean value of `15770.56 Crores with an average annual growth rate of 19.63%. The Ratio had a
high standard deviation of 81.28.
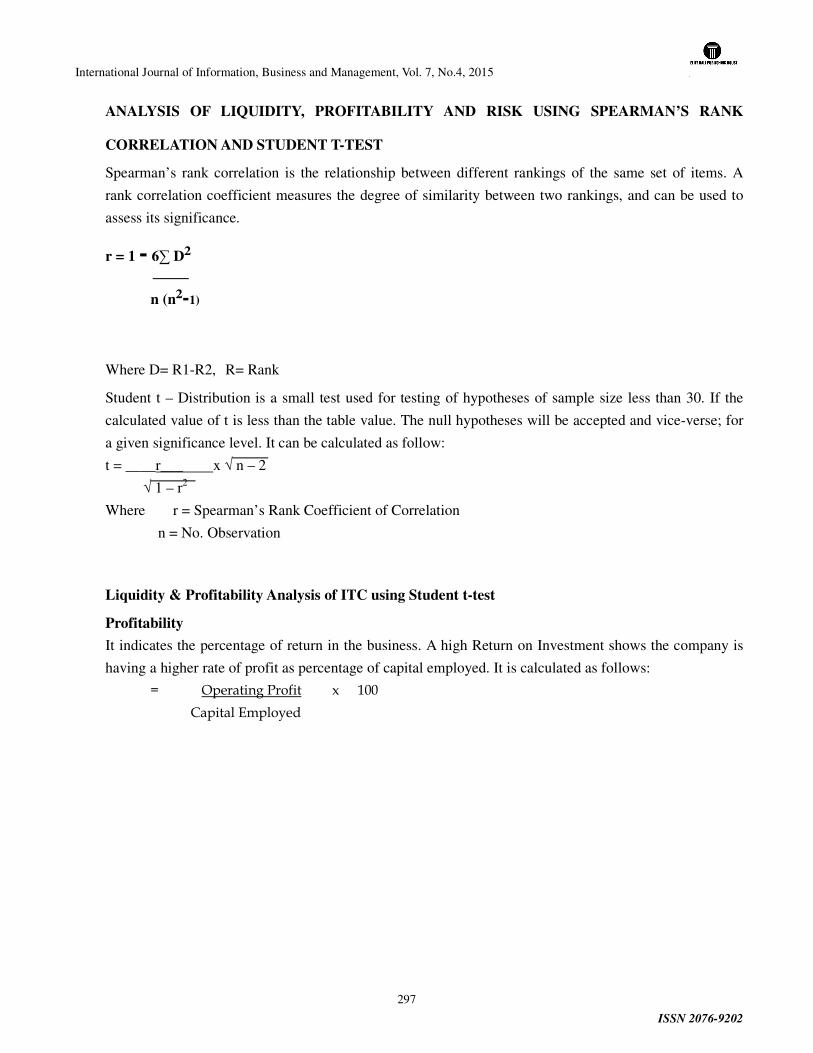
International Journal of Information, Business and Management, Vol. 7, No.4, 2015
ISSN 2076-9202
297
ANALYSIS OF LIQUIDITY, PROFITABILITY AND RISK USING SPEARMAN’S RANK
CORRELATION AND STUDENT T-TEST
Spearman’s rank correlation is the relationship between different rankings of the same set of items. A
rank correlation coefficient measures the degree of similarity between two rankings, and can be used to
assess its significance.
r = 1 - 6∑ D²
n (n²-1)
Where D= R1-R2, R= Rank
Student t – Distribution is a small test used for testing of hypotheses of sample size less than 30. If the
calculated value of t is less than the table value. The null hypotheses will be accepted and vice-verse; for
a given significance level. It can be calculated as follow:
t = ____r___ x √ n – 2
√ 1 – r2
Where r = Spearman’s Rank Coefficient of Correlation
n = No. Observation
Liquidity & Profitability Analysis of ITC using Student t-test
Profitability
It indicates the percentage of return in the business. A high Return on Investment shows the company is
having a higher rate of profit as percentage of capital employed. It is calculated as follows:
= Operating Profit x 100
Capital Employed
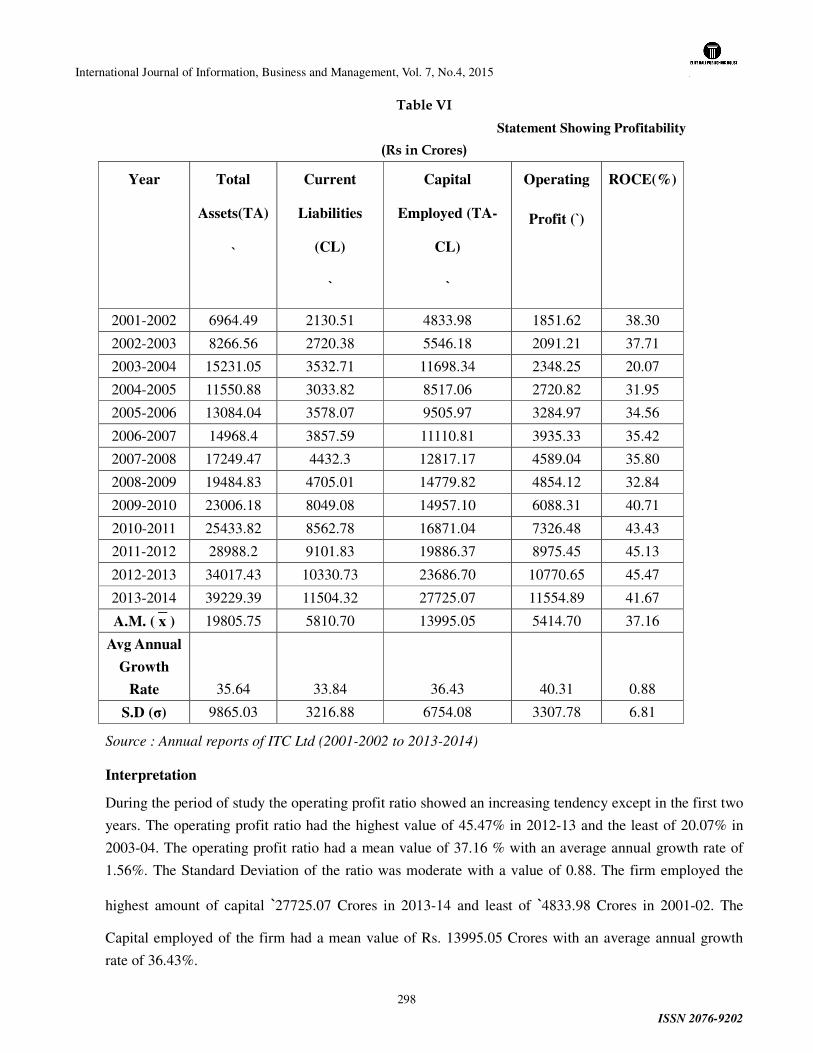
International Journal of Information, Business and Management, Vol. 7, No.4, 2015
ISSN 2076-9202
298
Table VI
Statement Showing Profitability
(Rs in Crores)
Year Total
Assets(TA)
`
Current
Liabilities
(CL)
`
Capital
Employed (TA-
CL)
`
Operating
Profit (`)
ROCE(%)
2001-2002 6964.49 2130.51 4833.98 1851.62 38.30
2002-2003 8266.56 2720.38 5546.18 2091.21 37.71
2003-2004 15231.05 3532.71 11698.34 2348.25 20.07
2004-2005 11550.88 3033.82 8517.06 2720.82 31.95
2005-2006 13084.04 3578.07 9505.97 3284.97 34.56
2006-2007 14968.4 3857.59 11110.81 3935.33 35.42
2007-2008 17249.47 4432.3 12817.17 4589.04 35.80
2008-2009 19484.83 4705.01 14779.82 4854.12 32.84
2009-2010 23006.18 8049.08 14957.10 6088.31 40.71
2010-2011 25433.82 8562.78 16871.04 7326.48 43.43
2011-2012 28988.2 9101.83 19886.37 8975.45 45.13
2012-2013 34017.43 10330.73 23686.70 10770.65 45.47
2013-2014 39229.39 11504.32 27725.07 11554.89 41.67
A.M. ( x ) 19805.75 5810.70 13995.05 5414.70 37.16
Avg Annual
Growth
Rate 35.64 33.84 36.43 40.31 0.88
S.D (σ) 9865.03 3216.88 6754.08 3307.78 6.81
Source : Annual reports of ITC Ltd (2001-2002 to 2013-2014)
Interpretation
During the period of study the operating profit ratio showed an increasing tendency except in the first two
years. The operating profit ratio had the highest value of 45.47% in 2012-13 and the least of 20.07% in
2003-04. The operating profit ratio had a mean value of 37.16 % with an average annual growth rate of
1.56%. The Standard Deviation of the ratio was moderate with a value of 0.88. The firm employed the
highest amount of capital `27725.07 Crores in 2013-14 and least of `4833.98 Crores in 2001-02. The
Capital employed of the firm had a mean value of Rs. 13995.05 Crores with an average annual growth
rate of 36.43%.
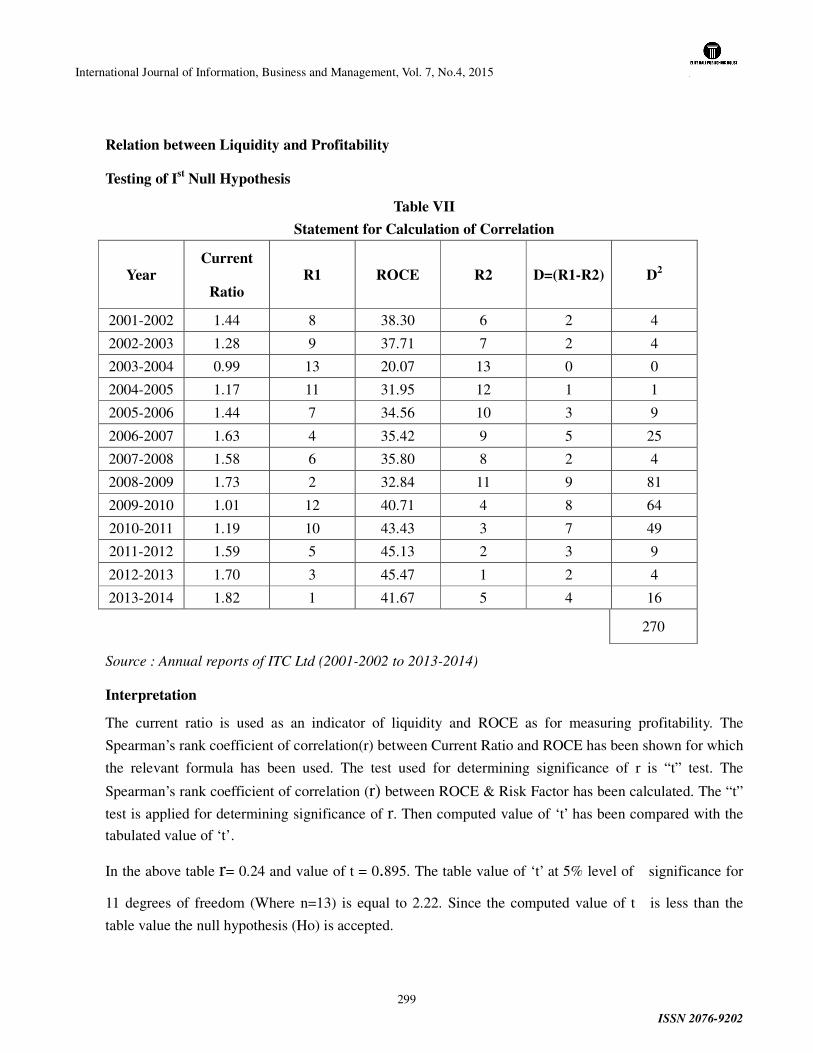
International Journal of Information, Business and Management, Vol. 7, No.4, 2015
ISSN 2076-9202
299
Relation between Liquidity and Profitability
Testing of Ist Null Hypothesis
Table VII
Statement for Calculation of Correlation
Year Current
Ratio R1 ROCE R2 D=(R1-R2) D2
2001-2002 1.44 8 38.30 6 2 4
2002-2003 1.28 9 37.71 7 2 4
2003-2004 0.99 13 20.07 13 0 0
2004-2005 1.17 11 31.95 12 1 1
2005-2006 1.44 7 34.56 10 3 9
2006-2007 1.63 4 35.42 9 5 25
2007-2008 1.58 6 35.80 8 2 4
2008-2009 1.73 2 32.84 11 9 81
2009-2010 1.01 12 40.71 4 8 64
2010-2011 1.19 10 43.43 3 7 49
2011-2012 1.59 5 45.13 2 3 9
2012-2013 1.70 3 45.47 1 2 4
2013-2014 1.82 1 41.67 5 4 16
270
Source : Annual reports of ITC Ltd (2001-2002 to 2013-2014)
Interpretation
The current ratio is used as an indicator of liquidity and ROCE as for measuring profitability. The
Spearman’s rank coefficient of correlation(r) between Current Ratio and ROCE has been shown for which
the relevant formula has been used. The test used for determining significance of r is “t” test. The
Spearman’s rank coefficient of correlation (r) between ROCE & Risk Factor has been calculated. The “t”
test is applied for determining significance of r. Then computed value of ‘t’ has been compared with the
tabulated value of ‘t’.
In the above table r= 0.24 and value of t = 0.895. The table value of ‘t’ at 5% level of significance for
11 degrees of freedom (Where n=13) is equal to 2.22. Since the computed value of t is less than the
table value the null hypothesis (Ho) is accepted.
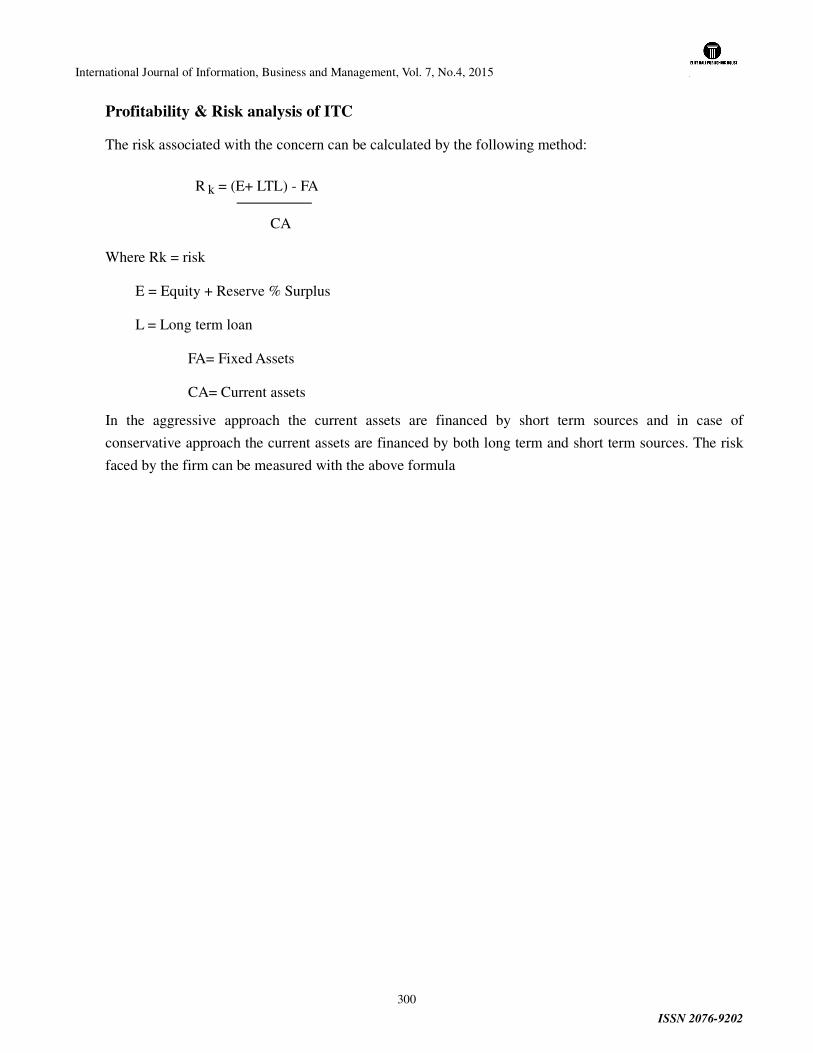
International Journal of Information, Business and Management, Vol. 7, No.4, 2015
ISSN 2076-9202
300
Profitability & Risk analysis of ITC
The risk associated with the concern can be calculated by the following method:
R k = (E+ LTL) - FA
CA
Where Rk = risk
E = Equity + Reserve % Surplus
L = Long term loan
FA= Fixed Assets
CA= Current assets
In the aggressive approach the current assets are financed by short term sources and in case of
conservative approach the current assets are financed by both long term and short term sources. The risk
faced by the firm can be measured with the above formula
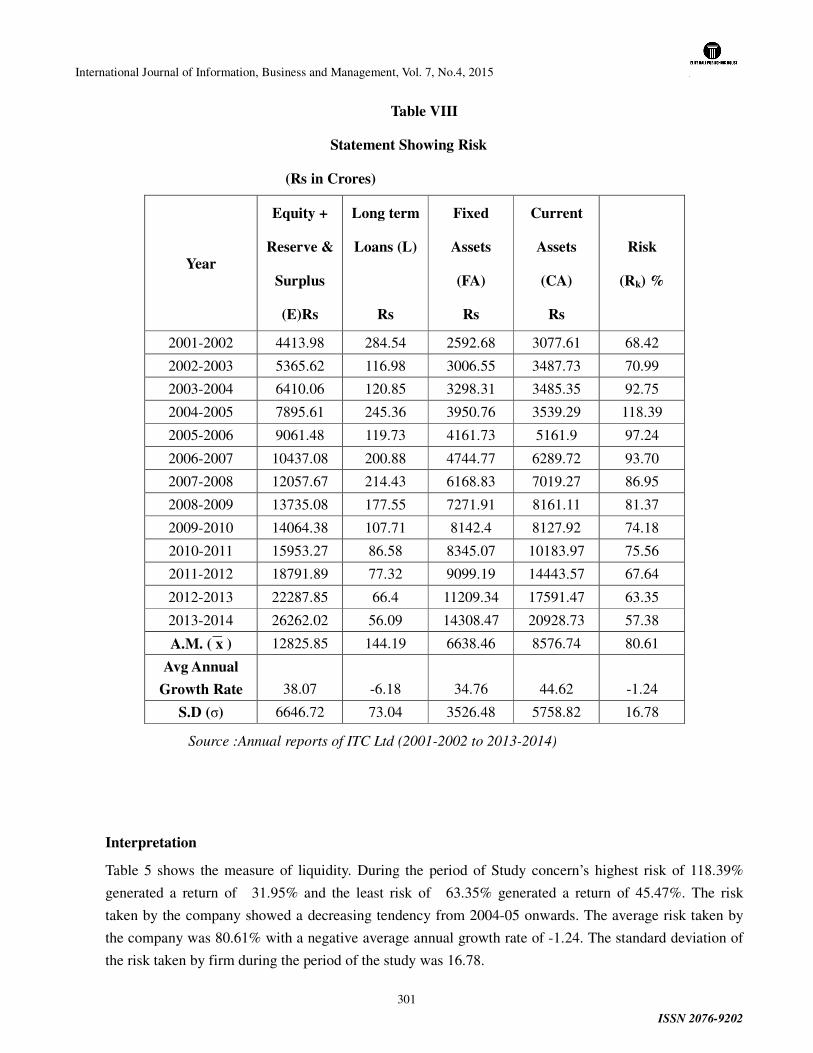
International Journal of Information, Business and Management, Vol. 7, No.4, 2015
ISSN 2076-9202
301
Table VIII
Statement Showing Risk
(Rs in Crores)
Year
Equity +
Reserve &
Surplus
(E)Rs
Long term
Loans (L)
Rs
Fixed
Assets
(FA)
Rs
Current
Assets
(CA)
Rs
Risk
(Rk) %
2001-2002 4413.98 284.54 2592.68 3077.61 68.42
2002-2003 5365.62 116.98 3006.55 3487.73 70.99
2003-2004 6410.06 120.85 3298.31 3485.35 92.75
2004-2005 7895.61 245.36 3950.76 3539.29 118.39
2005-2006 9061.48 119.73 4161.73 5161.9 97.24
2006-2007 10437.08 200.88 4744.77 6289.72 93.70
2007-2008 12057.67 214.43 6168.83 7019.27 86.95
2008-2009 13735.08 177.55 7271.91 8161.11 81.37
2009-2010 14064.38 107.71 8142.4 8127.92 74.18
2010-2011 15953.27 86.58 8345.07 10183.97 75.56
2011-2012 18791.89 77.32 9099.19 14443.57 67.64
2012-2013 22287.85 66.4 11209.34 17591.47 63.35
2013-2014 26262.02 56.09 14308.47 20928.73 57.38
A.M. ( x ) 12825.85 144.19 6638.46 8576.74 80.61
Avg Annual
Growth Rate 38.07 -6.18 34.76 44.62 -1.24
S.D (σ) 6646.72 73.04 3526.48 5758.82 16.78
Source :Annual reports of ITC Ltd (2001-2002 to 2013-2014)
Interpretation
Table 5 shows the measure of liquidity. During the period of Study concern’s highest risk of 118.39%
generated a return of 31.95% and the least risk of 63.35% generated a return of 45.47%. The risk
taken by the company showed a decreasing tendency from 2004-05 onwards. The average risk taken by
the company was 80.61% with a negative average annual growth rate of -1.24. The standard deviation of
the risk taken by firm during the period of the study was 16.78.
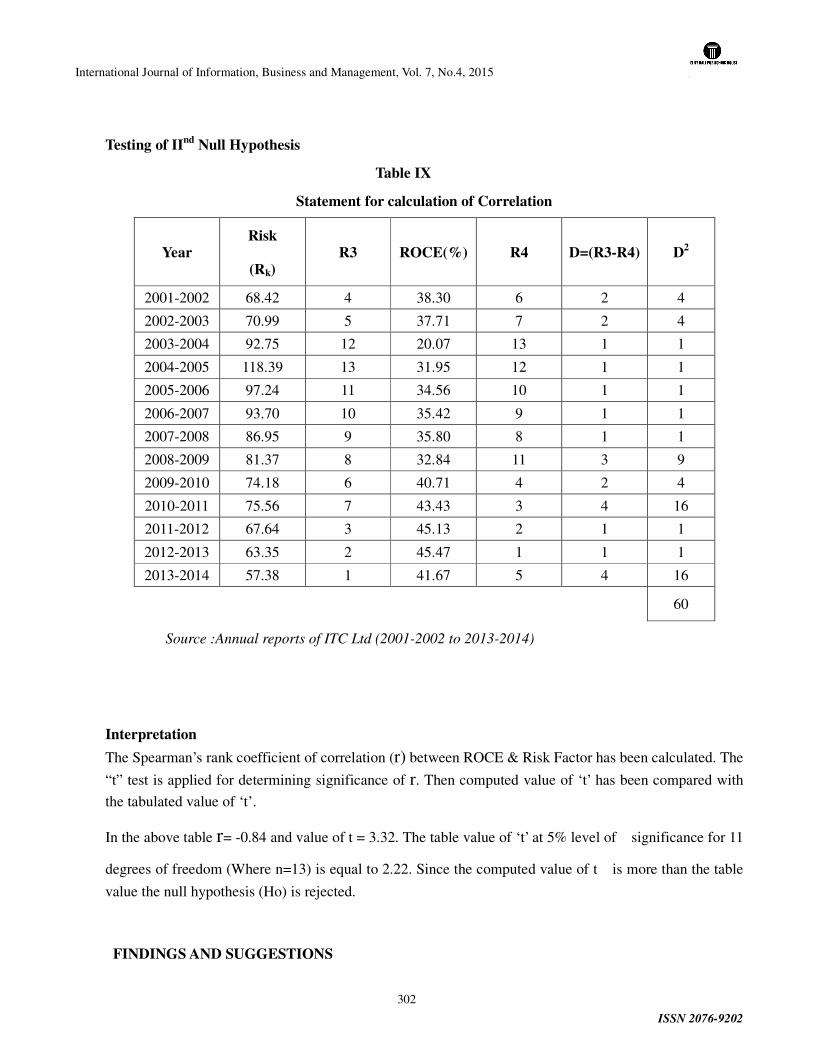
International Journal of Information, Business and Management, Vol. 7, No.4, 2015
ISSN 2076-9202
302
Testing of IInd Null Hypothesis
Table IX
Statement for calculation of Correlation
Year Risk
(Rk) R3 ROCE(%) R4 D=(R3-R4) D2
2001-2002 68.42 4 38.30 6 2 4
2002-2003 70.99 5 37.71 7 2 4
2003-2004 92.75 12 20.07 13 1 1
2004-2005 118.39 13 31.95 12 1 1
2005-2006 97.24 11 34.56 10 1 1
2006-2007 93.70 10 35.42 9 1 1
2007-2008 86.95 9 35.80 8 1 1
2008-2009 81.37 8 32.84 11 3 9
2009-2010 74.18 6 40.71 4 2 4
2010-2011 75.56 7 43.43 3 4 16
2011-2012 67.64 3 45.13 2 1 1
2012-2013 63.35 2 45.47 1 1 1
2013-2014 57.38 1 41.67 5 4 16
60
Source :Annual reports of ITC Ltd (2001-2002 to 2013-2014)
Interpretation
The Spearman’s rank coefficient of correlation (r) between ROCE & Risk Factor has been calculated. The
“t” test is applied for determining significance of r. Then computed value of ‘t’ has been compared with
the tabulated value of ‘t’.
In the above table r= -0.84 and value of t = 3.32. The table value of ‘t’ at 5% level of significance for 11
degrees of freedom (Where n=13) is equal to 2.22. Since the computed value of t is more than the table
value the null hypothesis (Ho) is rejected.
FINDINGS AND SUGGESTIONS
International Journal of Information, Business and Management, Vol. 7, No.4, 2015
ISSN 2076-9202
303
• The Net working Capital of ITC during the period of study was not satisfactory as it showed
frequent fluctuations in its values. It even turned negative during the period of study, which is
dangerous for the firm. ITC must try to keep regular check, whether its current liabilities are
exceeding the gross working capital of the firm.
• Liquidity position of the firm was not adequate because the average value of this Current Ratio
was only 1.43 times which is well below the ideal ratio of 2:1 times. Which indicates that, even
though it is in a position to meet its short term obligations with the existing current assets, but it is
in the verge of break even. So the firm must increase the position of its current assets to maintain
a current ratio of at least the ideal value.
• The Liquid ratio of the firm was also not up to the level due to a lower amount of liquid assets
during the period of study. The arithmetic mean of the liquid ratio was 0.76 times which is well
below the ideal value of 1:1 times. So the firm should increase the portion of the liquid assets to
stabilize the short solvency position.
• The cash position ratio of the firm was also not satisfactory as it was not able to generate
adequate amount of cash from its assets. The average value of the ratio was only 0.05 times. The
firm must try to keep regular check on its assets to identify whether they are staying idle or
obsolete. Only the liquid cash will help the firm to face any uncertainties at the times of
depressions.
• Working capital turnover ratio of the firm was satisfactory as it was able to generate on an
average 8.29 times the amount of working capital deployed. It should try to at least maintain this
situation or to increase its sales turnover.
• The profitability position of the firm was satisfactory because it operating profitability position
was 37.16 % of its turnover, which is well above the risk free bank rate. The capital employed in
the firm was appropriately used. It should maintain and stabilize the present profitability position.
• Applying of student’s t test between Current Ratio and ROCE showed that the calculated value
of t is less than the table value of t. Hence the null hypothesis was accepted and alternate
hypothesis was rejected. It says that there was no significant difference between liquidity and
profitability of the firm during the period of research study.
• When student’s t test was applied between ROCE and Risk showed that the calculated value of t
greater than the table value of t. Hence the null hypothesis was rejected and alternate hypothesis
was accepted. It says that there was significant difference between profitability and risk of the
firm during the period of research study.
Since the amount and risk involved in capital investment decision are very high, the firms give little
importance to the issues related with working capital. But from the above study we can say that ITC
International Journal of Information, Business and Management, Vol. 7, No.4, 2015
ISSN 2076-9202
304
should give due consideration to its working capital management policies. The company must improve its
present liquidity position to remain stable at the time of discrepancies or recession. It should also try to
generate higher returns from its assets. The company must keep an optimum balance between liquidity
and profitability for efficient use of its working capital. At the same time it should not stop formulating
certain policies to keep a well-monitored working capital for better profitability, stability, reliability,
growth and consistency.
References
Akoto, R.K., Awunyo-Vitor, D., & Angmor, P.L. (2013). Working capital management and profitability:
Evidence from Ghanaian listed manufacturing firms. Journal of Economics and International Finance,
5(9), 373-379.
Almazari, A.A. (2013).The Relationship between Working Capital Management and Profitability:
Evidence from Saudi Cement Companies. British Journal of Economics, Management & Trade,4.
Andrew, J. P. and Sirkin, H. L. (2003). "Innovating for Cash." Harvard Business School Publishing.
Arcelus, F. J. and Srinivasan, G. (1993). "Integrating Working Capital Decisions." The Engineering
Economist. Vol. 39, No. 1. pp 1-15.
Ball, R., Kothari, S., and Watts, R. (1993) "The Economic Determinants of the Relation between Earnings,
Changes and Stock Returns." The Accounting Review. Vol. 68. Pp 622-638.
Banomyong, R. (2005). "Measuring the Cash Conversion Cycle in an International Supply Chain".Annual
Logistics Research Network (LRN) Conference Proceedings, Plymouth, UK. ISBN 1-904564-13-5.
Burgstahler, D. and Dichev, I. (1997). "Earnings Management to Avoid Earnings Decreases and
Losses."Journal of Accounting and Economics. Vol. 24. pp 99-126.
Eljelly, Abuzar M.A. and Abubakr M. Abduidris (2001): “A Survey of capital budgeting techniques in
pulic and private sectors of a less developed country: The Case of Sudan”, Journal of African Business
2(1): 75-93
Ezra Solomon, John J. Pringle (2011): “An Introduction to Financial Management”, University of
Michigan, Goodyear Pub Co.,1980 ISBN 0876204752
Garcia-Temel, P. J. and Martinez-Solano, P. (2007). "Effects of Working Capital Management on SME
Profitability." International Journal of Managerial Finance. yol. 3, No.2. pp 164-177.
Gentry, J. A, Newbold, P. and Whitford, D. T. (1985). "Classifying Bankrupt Firms with Funds Flow
Components." Journal of Accounting Research. Vol. 23, No. 1. pp 146-160.
International Journal of Information, Business and Management, Vol. 7, No.4, 2015
ISSN 2076-9202
305
Gitman, 1. J., Moses, E. A and White, I. T. (1979). "An Assessment of Corporate Cash Management
Practices." Financial anagement. Vol. 8, No. 1. pp 32-41.
Gill, A., Biger, N., & Mathur, N. (2010). The relationship between working capital management and
profitability: Evidence from the United States. Business and Economics Journal, 4 (2), 1-9.
Gul, S., Khan, M. B., Raheman, S.U., Khan, M.T., Khan, M., & Khan, W. (2013). Working capital
management and performance of SME sector. European Journal of Business and management, 5(1),
60-68.
Gupta, J. K. (2010). "Gaining from working capital efficiency." Article in Business Standard. The
Business Standard website. URL: http:www.businessstandard.co.in/india/news/gainingworking-capital
efficiency 1 4048751. (Accessed on August 20,2010).
Mathuva, D.M. (2010). Influence of working capital management components on corporate profitability:
A survey on Kenyan listed firms. Research Journal of Business Management 3 (1), 1-11.
Moss.D.J and Stine.B (1993):”Cash Conversion cycle and firm size: A Study of Retail Firms”
Managerial Finance, 19:25-34.
Richards, V.D. and Laughlin, E. J. (1980). "A Cash Conversion Cycle Approach to Liquidity Analysis."
Financial Management. Vol 9. No. 1. pp 32-38.
Sharma, A.K., & Kumar, S. (2011). Effect of working capital management on firm profitability: Empirical
evidence from India. Global Business Review,12(1) 159-173.
Raheman, A., & Nasr, M. (2007). Working capital management and profitability case of Pakistan firms.
International Review of Business Research Papers,3(1), 279-300.
Smith, K. V. (1973). "State of the Art of Working Capital Management." Financial Management. Vol. 2,
No.3. pp 50-55.
The Bombay Stock Exchange's website. URL: http: www.bseindia.com/about/abindices/bse200.asp
(Accessed on August 20, 2010).
M. Ward and Cole, S. (2004): “SA home loans: Bank bashing is good for business, A case study, Wits
Business School, University of the Witswatersrand, Johannesburg.
Annual reports of ITC Ltd (2001-2002 to 2010 to 2013)
www.google.com

International Journal of Information, Business and Management, Vol. 7, No.4, 2015
ISSN 2076-9202
306
www.Itcportal.com
International Journal of Information, Business and Management, Vol. 7, No.4, 2015
ISSN 2076-9202
307
The Impact of Practicing Earnings Management on Borrowing Costs in
Pharmaceutical Companies listed in Amman Bursa
Ibrahim H. Fattouh
Department of Accounting and Finance, Dhofar University, Salalah, Dhofar, Oman
Nour Aldeen M. Ghafeer
Accounting Department, Philadelphia University, Amman, Jordan
Abdul Aziz A. Abdul Rahman
Accounting Department, Philadelphia University, Amman, Jordan
E-mail: [email protected]
Abstract
Profits indicator is considered one of the most important indicators, which measure the efficiency
of administrations, so administrations often resort to rig in this indicator to improve its image opposite
parties involved, through practicing earnings management. This study aims to determine the extent of the
practice of earning management in pharmaceutical companies listed in Bursa Amman, and to find out the
impact on the cost of borrowing. Modified Jones model,1995 has been used to determine if the company
practices earnings management or not, also multiple regression analysis has been used to investigate the
effect of earnings management practicing on the cost of borrowing. This study concluded that the studied
companies practiced earnings management with varying degrees, and in final outcome they practiced
earnings management, and there is no impact to earnings management practicing on the cost of borrowing.
This study recommends the need to add a new responsibility of the responsibilities of the auditor
regarding the practice of earnings management by companies, and the need to develop the encouraging
legislation and binding for companies to resort to the stock market to get the funding they need, through
the issuance of the loan bonds to take advantage of the benefits of financial market efficiency.
Keywords: Earnings Management, Cost of Borrowing, Pharmaceutical Companies, Bursa Amman.
Introduction
Managers usually depends on the earnings measure as a way to show their efficiency in managing
companies and obtain a confidence from various external parties particularly owners and lenders. Because
this measure is one of the important measures to judge the earning' ability for companies in the present
and future, also its importance appears in determining the expected return, which focused by owners and
lenders. Companies generally practices earnings management when they face some difficulties especially
when earnings measure becomes low. In this case companies tend to rig in earnings to keep landlords and
lenders confidence, a so-called "earnings management", which makes the accounting numbers shown in
financial statements distorted. This reflects a negative impact to decision-makers both owners and
lenders.
International Journal of Information, Business and Management, Vol. 7, No.4, 2015
ISSN 2076-9202
308
Using accounting information by external users such as investors, lenders, financial analysts and
others encourages management to rig in these information to influence their decisions in favor of the
company, which is reflected on several perspectives related to the company such as the cost of borrowing
for the company, which is the subject of this study.
Showing the reality of the profits better than the actual amount achieves to the company - in the
view of the administration – provides a feature to get a good share of the money offered for lending in the
financial market on one hand, and on the other hand the company gets the borrowed funds at a lower cost,
on the basis that lenders accept to sacrifice with a percentage of the expected return versus a low-risk that
they believe it is available in these companies.
Importance of the study
It is well known that there is a relative scarcity in the amount of capital that accepts the risks of investing
in the financial markets. So it is expected that there will be competition between enterprises to attract the
maximum amount of funding, and thus there is a strong incentive for enterprises to report adequately and
accurately all aspects of its activities through periodic financial reports. On the other hand, the good
reporting system will lead to reduce the cost of borrowing for the enterprise, as a result of the low degree
of uncertainty among lenders and, thus reduce the rate at which lenders accept as a return on their loans.
Hence, the importance of this study arises by showing the impact of the practice of earnings
management in the cost of borrowing, where the practice of earnings management process is considered
as a factor that results in misleading reports. Thereby, increase the degree of risk to the lenders and the
returns on the money they require.
Problem of the study
Practice of earnings management in behavior of investors in general and lenders in particular, leads us to
study the impact of the practice of earnings management in the cost of borrowing. Accordingly, the
problem of the study can be scales in the following questions:
1. Are studied companies practicing earnings management?
2. Is there an effect of the practicing of earnings management in the cost of borrowing in the studied
companies?
Objectives of the study
This study aims to achieve the following:
1. identify the earnings management policy, methods and caveats.
2. Identify whether the studied companies practice earnings management or not, through the application
of the modified Jones Model, 1995.
3. Identify the cost of borrowing in the studied companies.
4. Show the impact of practicing earnings management in the cost of borrowing in the studied companies.
Variables of the study
For the purposes of this study, independent, dependent and control variables have been adopted as
International Journal of Information, Business and Management, Vol. 7, No.4, 2015
ISSN 2076-9202
309
follows:
The independent variable (Earnings management): earnings management is "any behavior practices
by management which affects the income shown in the financial statements and do not achieve real
economic advantages, and may lead to damage in the long term". This can be measured through
discretionary accruals, according to the modified Jones Model, 1995 which includes:
- Discretionary accruals: is a non-obligatory expense that has not realized yet (such as an anticipated
bonus for management, deductive allowances) but it has recorded in the account books.
- Non-discretionary accrual: is an obligatory expense that has not realized yet, but it has already recorded
in the account books (such as Accrued expenses).
The dependent variable (The cost of borrowing): The cost of borrowing is the actual rate of interest
paid by the company to the lender. So, the company achieves tax savings through the amount of
interest times the tax rate. Thereby, the actual interest rate will be pre-tax actual interest rate minus the tax
savings.
Hypotheses of the study
H0-1: The studied companies do not practice earnings management policy.
H0-2: There is no statistically significant effect of the practicing of earnings management in the cost of
borrowing in the studied companies at a level of significance: a ≤ 0.05.
Limits of the study
This study was limited to the pharmaceutical companies listed in Bursa Amman in the period 2010-2013.
Methodology of the study
The study depends on descriptive analytical method to arrive at logical results that support the theoretical
hypothesis included in this study to determine the impact of earnings management in the cost of
borrowing. It will also be relying on the historical approach by reviewing the previous studies. The nature
of the study is an applied study, because the problem of this study predominantly has an analytical nature
for a set of independent and control variables that affect the cost of borrowing.
This study depends on a range of primary and secondary data and information from two sources:
Primary sources: through the reports issued by Bursa of Amman related to companies studied .
Secondary sources: through the availability of books, periodicals, research and theses in Arabic and
English.
Literature review
The study (Audi, 2014) aims to investigate the effect of earnings management on the accounting
information in decision-making process. The researcher used two types of analysis which are, the first one
is statistical analysis with study sample (20) public Jordanian industrial company during the period
2005-2012. The study used Pooled Data Regression to measure the impact of the practicing of earnings
management on the quality of accounting profits. The results show that lowing the quality of earnings
caused by the practice earnings management by Jordanian industrial companies. The second one is the
questionnaire where distributed to 37 companies and the number of distributed questionnaires was (350)
questionnaire and was multi-sectors and had results that Jordanian companies practice earnings
management using the following methods (Cleaning financial statements, manipulation of accounting
International Journal of Information, Business and Management, Vol. 7, No.4, 2015
ISSN 2076-9202
310
ways and policies) Therefore, the practice of earnings management affect the accounting information and
the quality of earnings, and this affects the decision-making process in the company. The most important
recommendations that mentioned to be by the researcher are the drafting and amendment of accounting
standards so that modulate weaknesses and flexibility that help managers to the practice of earnings
management and the elimination of discretionary options relating to estimated and non-estimated accruals,
and to establish a committee with the efficiency and capacity of the income tax to detect operations of
manipulation in the profits, and work to unify the accounting policies and measurement methods that
reduce the practice of earnings management.
The study (Lozi, 2013) aims to analyze earnings management and its impact on the price of shares
in republic contribution industrial companies listed in Bursa Amman, also discussed some of the other
variables in addition to earnings management, which can be affects on the stock price. The researcher
uses modified Jones Model 1995 to measure earnings management, Pearson coefficient and simple
regression analysis, and program (SPSS). The researcher found that almost 50% of the sample companies
practice earnings management, and they affect the share price in Bursa Amman, where the price fluctuates
according to the practice of earnings management. The researcher recommends the need for the expertise
of audit firms to limit the practice of earnings management, and doing modern studies about the impact of
earnings management on the reservation policy variables.
The study (Bertomu, 2013) shows more results between earnings management and cost of capital,
within a simplified version of a model which shows the relationship between the administration costs
activities and the capital of companies, with a risk of individual fraud. The study finds that the cost of
capital increases with the increase in earnings management. The researcher emphasizes that the
importance of accounting handlings are not only in terms of the division of politics, but also in terms of
what may mean for the pricing of assets, and that investors expect lower earnings management.
The study (Strobl,2009) aims to demonstrate the impact of earnings management on the cost of
capital. The researcher uses the agency model with many companies through cash flows. The researcher
also shows the correlation between manipulation profits and the company's various business cycle. The
researcher finds that managers more tendency to manipulate earnings during periods of economic
expansion, that means the reliance on the economic situation in the manipulation of earnings, also finds
that earnings management affect the cost of capital, and reduce the linking of cash flows for businesses
and thus reduce the risk premium required by investors.
First: earnings management
Accounting literature has included different definitions for Earnings management. It was known (Michael,
et al., 2007) as "an attempt by the administration to influence on disclosed profits, or manipulate it by
using certain accounting methods, such as recognize with unrecurring items to become recurring items,
and delay or accelerate recognition of certain expenses or revenue, or use other techniques designed to
influence in the short-term profits".
For (Hammad, 2005), he had defined it as "active maneuver to reach to a predetermined number
that may be subjective by management or predictions known by financial analysts or values agreed with
more smoothly and sustainability flow of a gains".
International Journal of Information, Business and Management, Vol. 7, No.4, 2015
ISSN 2076-9202
311
For (Partha, 2003), he had defined it as "a deliberate distortion of the profits, which in turn leads
to accounting numbers differ fundamentally from what could be in the absence of manipulation, and that's
when managers make decisions are not subject to strategic reasons, but simply to adjust the profits".
While it had known by (Merchant & Rakness, 2002) as "a behavior that the administration do it
and it impacts on the income that appears in the financial statements and do not achieve real economic
advantages, in fact, may lead to damage to the company over the long term."
From the previous definitions, the researchers conclude that earnings management is intended
practices done by the administration to influence the company's profits, either upward or downward
untapped accounting treatments available which allow them to use discretion, in order to achieve personal
gain or simply to influence the number of profit.
1.Tthe motives of earnings management
Administrations often have motives when they practice the earnings management, in order to achieve
prior objectives. Those motives can be classified as follows:
1.1.Motives related to expectations and assessment of the financial market: because the administration's
belief that investors and financial analysts use accounting information to assist in stock evaluation. So,
this generates motivation or incentive for managers to manipulate earnings, and to influence the stock
price in the short term (Coles, 2006). Motivates had classified, in three forms: (motivates related to reduce
the regulatory cost – motivates related to reduce the cost of capital - motivates related to maximize
managers' benefits) (Stolowy, et. Al., 2004).
1.2.Contractual motives: for (Scott, 2003), he pointed out that the accounting data may be used in the
monitoring and regulating of the contracts between the company and multi-owners, where the explicit and
implicit administrative bonuses contracts arise to accommodate between the administration' interests and
among the third parties' interests.
1.3.Regulatory motives: the greater of likelihood that the company may expose to external pressures and
interventions by the government, the company' management may tends to adopt accounting policies that
show low levels of profitability (Stolowy, et al., 2004).
2.Earnings management ethics:
Strategy should balance between transparency and full disclosure for all material information related to
the company on one hand, and on the other hand, to maintain confidentiality that require to protect the
information to be not available to everyone, as to maintenance this balance is the foundation of good
corporate governance within the company. The ethical aspect of the earnings management is a matter of
considerable disagreement as to whether the practice morally justified or not. In other words, does the
company mean by this act to achieve an essential improvement for some aspects of its future strategy or
to do deliberate deception to the parties related. Anyway, the deception is not always non-morally, but it
needs to justify. So, when an alternative for deception becomes available, then we could not find a
justification for practicing of deception. As the philosopher (Bok) said, that the problem with the
deception may obscures a target or hides suitable alternatives, resulting in estimates lead to damage the
party that has been deceived (Gaa and Dunmore, 2007).
3. Earnings management methods:
International Journal of Information, Business and Management, Vol. 7, No.4, 2015
ISSN 2076-9202
312
Researchers have agreed to divide the practice of earnings management into two types, real earnings
management and fictitious accounting earnings management (Kin Lo, 2008):
Type I: real earnings management: by using management decisions regarding activities of production,
investment and sales. This will be done by using three methods as follows (Ali, 2009):
� Sales and Purchasing management: such as granting inordinate reduction to customers in the
fourth quarter of the fiscal year, or lax in terms of forward sales, or postpone the purchase of
certain assets to a later period of time to influence the size of the cash flows or make decisions
regarding the timing of the sale of assets.
� Discretionary expense management: such as research and development expenses, advertising and
notarization expenses, and maintenance expenses in order to achieve the targeted profit, especially
if these expenses do not contribute to the achievement of income in the current period.
� Production management: by speeding up the production rate at an exaggerated rate, thereby
leading to reduction of fixed costs and thus reduce the cost of the unit, and at the same time an
increase in the inventory thereby reducing the cost of sales, and consequently increase in profits.
Type II: accounting profits Management: by using phantom or accounting variables by the management
which can be classified as follows (, et. Al., 2007 Joshua, R.):
� Exploiting the flexibility available under generally accepted accounting principles such as
accounting accruals management and discretionary accounting changes, and choose an appropriate
time to practice a mandatory accounting policy.
� Using of fraudulent practices and methods which are outside the framework of generally accepted
accounting principles in order to distort the financial reports and to minimize the transparency
related to published financial reports such as an early recognition in revenues and overstated
inventory.
4. Detecting ways for earnings management
There are two methods for detecting earnings management which are accounting analysis method and
discretionary accruals analysis method (Mohan ram, 2003).
� Accounting analysis method: by using a number of ways (Alfar, 2006; Abu Agile, 2007) which
are: identify the key accounting policies, assessing the accounting flexibility for the company,
assessing the accounting strategy of the company, assessing the quality of the situation of the
company, identify the likelihood of risk, and to prevent the accounting distortions.
� The accruals method: requires identifying the total accruals, and deduct the non-discretionary
accruals to reach to the discretionary accruals (Dechow & Saloan, 1995):
a- Total accruals = Declared income - operating cash flows
b- = Total accruals = discretionary accruals + non-discretionary accruals
Discretionary accruals usually by the administration, while non-discretionary accruals specify
economically. There are several models to estimate discretionary accruals:
International Journal of Information, Business and Management, Vol. 7, No.4, 2015
ISSN 2076-9202
313
� 1.The Jones Model, 1991: this model depends on regression model to measure the discretionary
accruals and separate it from the total accruals with two variables which are the total ownership
such as factories, and the change in the Working Capital Fund model.
� 2. The Modified Jones Model, 1995: this model assumes that the discretionary accruals coefficient
has a value less than the non-discretionary accruals coefficient. This means that discretionary
accruals are more prone to fraud by managers, so it is a valid measure for earnings management
(Jones, 1995).
� Cross - Sectional Model: which are the cross–sectional Jones model and the modified cross–
sectional Jones model. Guides are estimated by using cross-sectional data and not the time series
(Defornd & Giambalvo, 1994).
For the purpose of achieving the goal of this research the modified Jones model, 1995 will be used.
The Modified Jones Model,1995: by measuring whether the company practice earnings management,
which will be measured by using modified Jones model, 1995 such as follows:
1.The total accruals: it is calculated in the way of cash flow, which is the difference between net
operating income and net cash flow from operating activities using the following equation:
TACCi,t = ONI i,t - OCF i,t
Where is:
TACC i,t = the total accruals for the company (i) through the period (t)
ONI i,t = net operating income for the company (i) through the period (t)
OCF i,t = net cash flow from operating activities for the company (i) in the period (t)
2. Non-discretionary accruals: it will be measured by the regression equation by using the following
equation:
TACC i,t / Ai , t-1= a1(1/Ai,t-1)+ a2(∆REVi,t - ∆RECi,t )/ Ai ,t-1 + a3CHFi,t / Ai,t-1 + Ei,t
Where is:
TACC i,t = the total accruals for the company (i) through the period (t)
A i,t-1 = total assets for the company (i) through the period (t-1)
REV i,t = change in company' revenues for the company (i) through the period (t)
REC i, t = change in accounts receivable for the company (i) through the period (t)
CHFi,t = cash flow for the company (i) through the period (t)
E i,t = random error
3. The normal Non-discretionary accruals: they are measured by the following equation:
NDACC i,t =a1 (1/ Ai,t-1) + a2 (∆REV i,t- ∆REC i,t ) / Ai,t-1+ a3 (CHF i,t/ Ai,t-1)
Where is:
NDACC i,t = The normal Non-discretionary accruals for the company (i) through the period (t)
A i,t-1 = total assets for the company (i) through the period (t-1)
REV i,t= change in company' revenues for the company (i) through the period (t)
REC i,t= change in accounts receivable for the company (i) through the period (t)
CHFi,t= cash flow for the company (i) through the period (t)
4. Discretionary accruals: it is measured by finding the difference between the total accruals and
International Journal of Information, Business and Management, Vol. 7, No.4, 2015
ISSN 2076-9202
314
non-discretionary accruals for each company separately.
DACCi,t = TACCi,t - NDACC i,t
Where is:
DACCi,t = discretionary accruals for the company (i) through the period (t)
TACC i,t = total accruals for the company (i) through the period (t)
NDACC i,t = normal non-discretionary accruals for the company (i) through the period (t)
The result: the company considers practicing earnings management if the absolute value of discretionary
accruals for the company is more than its average discretionary accruals, and if less than its average
discretionary accruals, the company does not practice earnings management.
Second: the cost of borrowing:
What is the cost of external borrowing and its impact on financial decisions and financial structure for the
economic property:
1. Long-term loans:
The cost of borrowing is the actual rate of interests which pays by the company to the lender. But the
company achieves tax savings through these represented in the amount of interest times the tax rate. So,
the final and actual interest rate is pre-tax interest rate minus tax savings. But how does the cost of
borrowing is estimated?
The cost of long-term borrowing can be defined as the costs (after tax) must be paid to get the
money through long-term borrowing, and can be calculated (borrowing by issuing bonds) according to the
following equation:
ACB = RBMD (1 – TR)
Where is:
ACB = The actual cost of borrowing
TR = tax rate
RBMD = Return of the bond to maturity date
RBMD =Z[[\Z]^[_`a`b_cZ[[\Z]deff^bb^e[
Zg`aZh`]eZ[=
^[_`a`b_c([\fi`aejk`Zab
(la^[d^lZ]ej]eZ[c[`_]eZ[)/m
2. Cost short-term loans
Short-term debt is a source of external funding which the company depends on in the financing of its
operating activity. Therefore, it pays for this a cost summarized in interest and commissions paid by the
company for getting bank or commercial credit.
Commercial credit
Is a short-term credit granted by the seller to the buyer in the form of goods for the purpose of resale. The
most important forms of commercial credit is the current account in the seller book. The seller opens an
account to the buyer in its books recording the price of the goods that were sold on account and the
amounts paid first by first.
International Journal of Information, Business and Management, Vol. 7, No.4, 2015
ISSN 2076-9202
315
Commercial credit is often free if the buyer committed to the terms of the seller. But it may
become charged in many cases:
� 1-Not to acquire a discount to accelerate payment
Discount percentage = (Discount amount/Invoice value)100
� 2-Exceeding the credit period: that means any buyer will pay interest in case of delayed payment
beyond the period granted to him by the seller.
� 3-Cash purchase price is usually lower than the forward purchase price.
Bank credit:
Bank credit is defined as a relatively clear for activities including obtaining the loan and that lead to
success or lack of success to loan recovery (Altman, 1980).
Also known as the confidence, the bank gives to someone physically or morally by putting at
his/her disposal a sum of money or guaranteed for a specific period to be agreed between the parties,
where the customer has to fulfillment of obligations at the end of that period (Gulab, 1993).
Granting a credit depends on rules and foundations stable and recognizable such as safety of
providing bank funds and make a profit and liquidity. Also, there are criteria for granting credit, including
the personality of client and the client's ability to achieve income, the client' capital, guarantees
established by the customer under the disposal of the bank and the surrounding circumstances (Zubaidi,
2002).
Hypothesis testing and analysis of the results:
H0-1: "The studied companies do not practice earnings management policy".
1-Total accruals: it will be calculated by using the following equation:
TACCi,t = ONI i,t - OCF i,t
Table (1): Total accruals
Table of calculating TACC
Co. MPHA JPHM HPIC
YEARS 2011 2012 2013 2011 2012 2013 2011 2012 2013
ONI -2948099 -492408 620672 1631280 -365660 -1739829 1088649 2023989 2326872
OCF 1087033 631191 1427929 -3275855 2830324 3846770 1725529 1342137 3501111
TACC -4035132 -1123599 -807257 4907135 -3195984 -5586599 -636880 681852 -1174239
Co. PHIL DADI APHC
YEARS 2011 2012 2013 2011 2012 2013 2011 2012 2013
ONI -240261 -533858 817922 -1214164 2810277 8250459 -1142224 -727836 -976737
OCF -497414 237021 -122434 3599497 1753428 -2244684 -209716 -391525 369201
TACC 257153 -770879 940356 -4813661 1056849 10495143 -932508 -336311 -1345938
2. Non-discretionary accruals: it will be measured by the regression equation by using the following
equation:
TACC i,t / Ai , t-1= a1(1/Ai,t-1)+ a2(∆REVi,t - ∆RECi,t )/ Ai ,t-1 + a3CHFi,t / Ai,t-1 + Ei,t
Table (2): Non-discretionary accruals
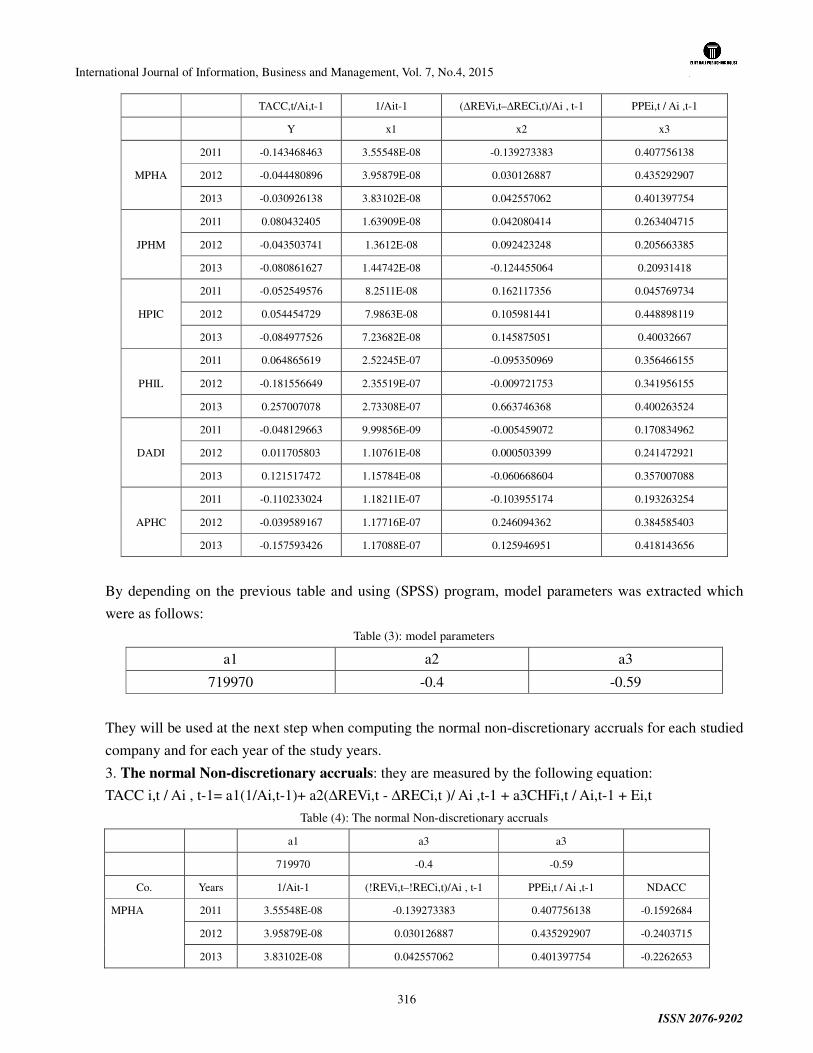
International Journal of Information, Business and Management, Vol. 7, No.4, 2015
ISSN 2076-9202
316
TACC,t/Ai,t-1 1/Ait-1 (∆REVi,t–∆RECi,t)/Ai , t-1 PPEi,t / Ai ,t-1
Y x1 x2 x3
MPHA
2011 -0.143468463 3.55548E-08 -0.139273383 0.407756138
2012 -0.044480896 3.95879E-08 0.030126887 0.435292907
2013 -0.030926138 3.83102E-08 0.042557062 0.401397754
JPHM
2011 0.080432405 1.63909E-08 0.042080414 0.263404715
2012 -0.043503741 1.3612E-08 0.092423248 0.205663385
2013 -0.080861627 1.44742E-08 -0.124455064 0.20931418
HPIC
2011 -0.052549576 8.2511E-08 0.162117356 0.045769734
2012 0.054454729 7.9863E-08 0.105981441 0.448898119
2013 -0.084977526 7.23682E-08 0.145875051 0.40032667
PHIL
2011 0.064865619 2.52245E-07 -0.095350969 0.356466155
2012 -0.181556649 2.35519E-07 -0.009721753 0.341956155
2013 0.257007078 2.73308E-07 0.663746368 0.400263524
DADI
2011 -0.048129663 9.99856E-09 -0.005459072 0.170834962
2012 0.011705803 1.10761E-08 0.000503399 0.241472921
2013 0.121517472 1.15784E-08 -0.060668604 0.357007088
APHC
2011 -0.110233024 1.18211E-07 -0.103955174 0.193263254
2012 -0.039589167 1.17716E-07 0.246094362 0.384585403
2013 -0.157593426 1.17088E-07 0.125946951 0.418143656
By depending on the previous table and using (SPSS) program, model parameters was extracted which
were as follows:
Table (3): model parameters
a1 a2 a3
719970 -0.4 -0.59
They will be used at the next step when computing the normal non-discretionary accruals for each studied
company and for each year of the study years.
3. The normal Non-discretionary accruals: they are measured by the following equation:
TACC i,t / Ai , t-1= a1(1/Ai,t-1)+ a2(∆REVi,t - ∆RECi,t )/ Ai ,t-1 + a3CHFi,t / Ai,t-1 + Ei,t
Table (4): The normal Non-discretionary accruals
a1 a3 a3
719970 -0.4 -0.59
Co. Years 1/Ait-1 (!REVi,t–!RECi,t)/Ai , t-1 PPEi,t / Ai ,t-1 NDACC
MPHA
2011 3.55548E-08 -0.139273383 0.407756138 -0.1592684
2012 3.95879E-08 0.030126887 0.435292907 -0.2403715
2013 3.83102E-08 0.042557062 0.401397754 -0.2262653
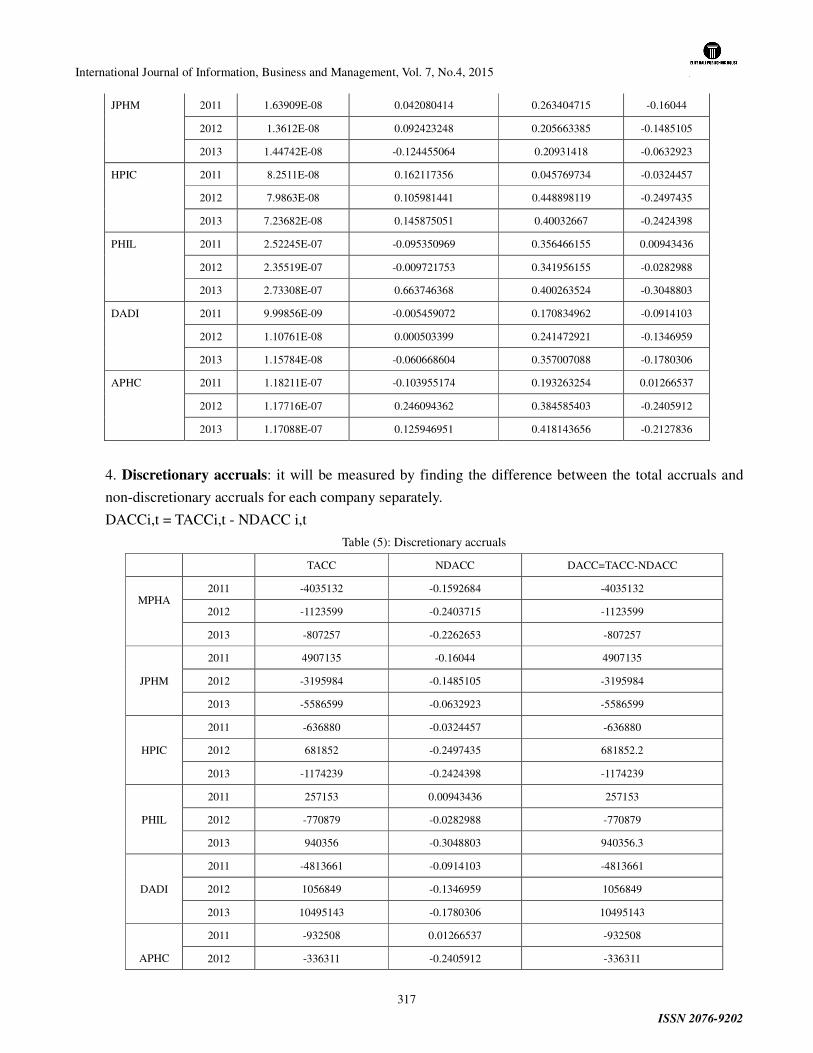
International Journal of Information, Business and Management, Vol. 7, No.4, 2015
ISSN 2076-9202
317
JPHM
2011 1.63909E-08 0.042080414 0.263404715 -0.16044
2012 1.3612E-08 0.092423248 0.205663385 -0.1485105
2013 1.44742E-08 -0.124455064 0.20931418 -0.0632923
HPIC
2011 8.2511E-08 0.162117356 0.045769734 -0.0324457
2012 7.9863E-08 0.105981441 0.448898119 -0.2497435
2013 7.23682E-08 0.145875051 0.40032667 -0.2424398
PHIL
2011 2.52245E-07 -0.095350969 0.356466155 0.00943436
2012 2.35519E-07 -0.009721753 0.341956155 -0.0282988
2013 2.73308E-07 0.663746368 0.400263524 -0.3048803
DADI
2011 9.99856E-09 -0.005459072 0.170834962 -0.0914103
2012 1.10761E-08 0.000503399 0.241472921 -0.1346959
2013 1.15784E-08 -0.060668604 0.357007088 -0.1780306
APHC 2011 1.18211E-07 -0.103955174 0.193263254 0.01266537
2012 1.17716E-07 0.246094362 0.384585403 -0.2405912
2013 1.17088E-07 0.125946951 0.418143656 -0.2127836
4. Discretionary accruals: it will be measured by finding the difference between the total accruals and
non-discretionary accruals for each company separately.
DACCi,t = TACCi,t - NDACC i,t
Table (5): Discretionary accruals
TACC NDACC DACC=TACC-NDACC
MPHA
2011 -4035132 -0.1592684 -4035132
2012 -1123599 -0.2403715 -1123599
2013 -807257 -0.2262653 -807257
JPHM
2011 4907135 -0.16044 4907135
2012 -3195984 -0.1485105 -3195984
2013 -5586599 -0.0632923 -5586599
HPIC
2011 -636880 -0.0324457 -636880
2012 681852 -0.2497435 681852.2
2013 -1174239 -0.2424398 -1174239
PHIL
2011 257153 0.00943436 257153
2012 -770879 -0.0282988 -770879
2013 940356 -0.3048803 940356.3
DADI
2011 -4813661 -0.0914103 -4813661
2012 1056849 -0.1346959 1056849
2013 10495143 -0.1780306 10495143
APHC
2011 -932508 0.01266537 -932508
2012 -336311 -0.2405912 -336311
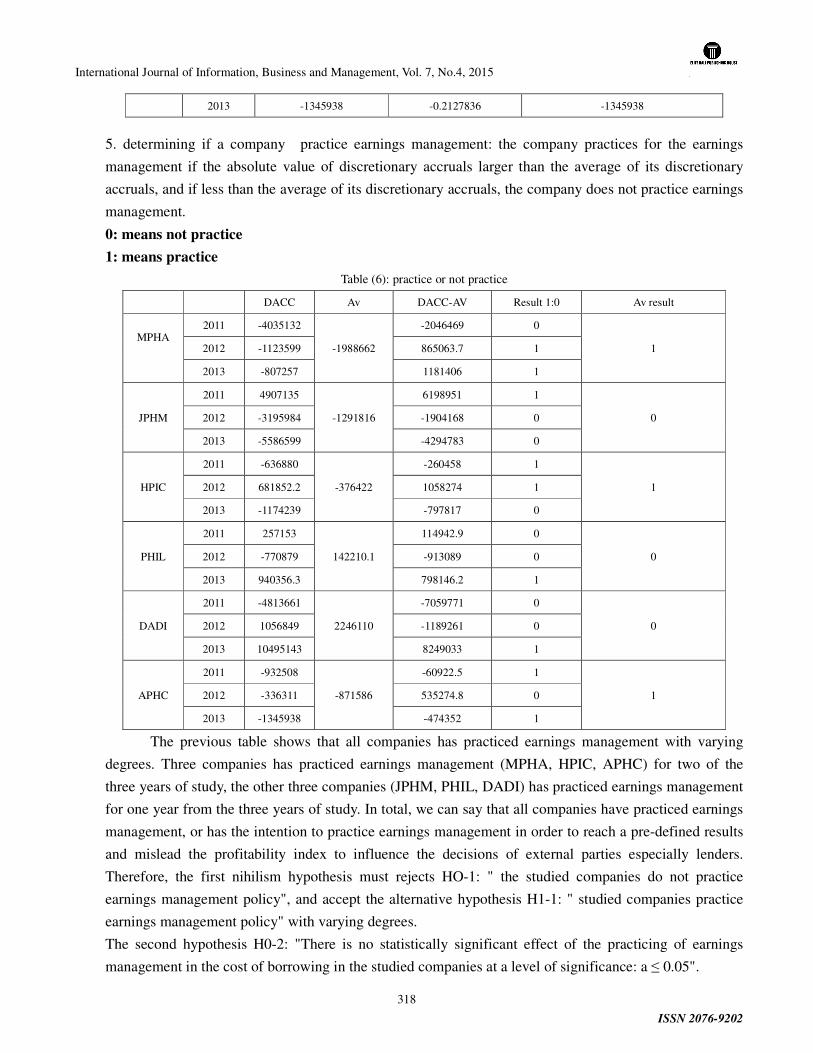
International Journal of Information, Business and Management, Vol. 7, No.4, 2015
ISSN 2076-9202
318
2013 -1345938 -0.2127836 -1345938
5. determining if a company practice earnings management: the company practices for the earnings
management if the absolute value of discretionary accruals larger than the average of its discretionary
accruals, and if less than the average of its discretionary accruals, the company does not practice earnings
management.
0: means not practice
1: means practice
Table (6): practice or not practice
DACC Av DACC-AV Result 1:0 Av result
MPHA
2011 -4035132
-1988662
-2046469 0
1 2012 -1123599 865063.7 1
2013 -807257 1181406 1
JPHM
2011 4907135
-1291816
6198951 1
0 2012 -3195984 -1904168 0
2013 -5586599 -4294783 0
HPIC
2011 -636880
-376422
-260458 1
1 2012 681852.2 1058274 1
2013 -1174239 -797817 0
PHIL
2011 257153
142210.1
114942.9 0
0 2012 -770879 -913089 0
2013 940356.3 798146.2 1
DADI
2011 -4813661
2246110
-7059771 0
0 2012 1056849 -1189261 0
2013 10495143 8249033 1
APHC
2011 -932508
-871586
-60922.5 1
1 2012 -336311 535274.8 0
2013 -1345938 -474352 1
The previous table shows that all companies has practiced earnings management with varying
degrees. Three companies has practiced earnings management (MPHA, HPIC, APHC) for two of the
three years of study, the other three companies (JPHM, PHIL, DADI) has practiced earnings management
for one year from the three years of study. In total, we can say that all companies have practiced earnings
management, or has the intention to practice earnings management in order to reach a pre-defined results
and mislead the profitability index to influence the decisions of external parties especially lenders.
Therefore, the first nihilism hypothesis must rejects HO-1: " the studied companies do not practice
earnings management policy", and accept the alternative hypothesis H1-1: " studied companies practice
earnings management policy" with varying degrees.
The second hypothesis H0-2: "There is no statistically significant effect of the practicing of earnings
management in the cost of borrowing in the studied companies at a level of significance: a ≤ 0.05".

International Journal of Information, Business and Management, Vol. 7, No.4, 2015
ISSN 2076-9202
319
Initially, the researchers will measure the cost of borrowing in the studied companies before studying the
impact of practice earnings management on the cost of borrowing .
Cost of borrowing
Due to lack of information about changes happened in the balance of loans and credit in the studied
companies during each financial year, the researchers consider the calculation of average loans and credit
between beginning and end of the period. Also, prevailing tax rate in Jordan imposed on companies
(including studied companies) is 14%. By applying the following equation for the cost of borrowing:
RBMD =�%%��� %����� + �%%���&�)) �� �%
�+��*����%=
n%����� + (��)��������
(, %& �������% + ������%)/2
The following table has prepared:
Table (7): Cost of borrowing
Average loans
Land (1/1+31/12)/2 Interest cost of %
MPHA
2010 11345782
2011 11820661 11583221.5 908723 6.7468431
2012 13135017 12477839 912563 6.28958412
2013 12716860 12925938.5 1088182 7.23998896
AVR
6.75880539
JPHM
2010 14088329
2011 21083100 17585714.5 644893 3.15374152
2012 20299857 20691478.5 1473032 6.12236346
2013 19716472 20008164.5 955323 4.10621264
AVR
4.46077254
HPIC
2010 315238
2011 354411 334824.5 31454 8.07899064
2012 253183 303797 22470 6.36089231
2013 385003 319093 34169 9.20902057
AVR
7.88296784
PHIL
2010 491428
2011 916715 704071.5 71838 8.77477358
2012 853964 885339.5 86895 8.44079588
2013 972530 913247 96975 9.13208584
AVR
8.78255177
DADI
2010 23196560
2011 27464009 25330284.5 1726851 5.8629103
2012 29959474 28711741.5 1744377 5.22491546
2013 38302933 34131203.5 1833428 4.6196674
AVR
5.23583105
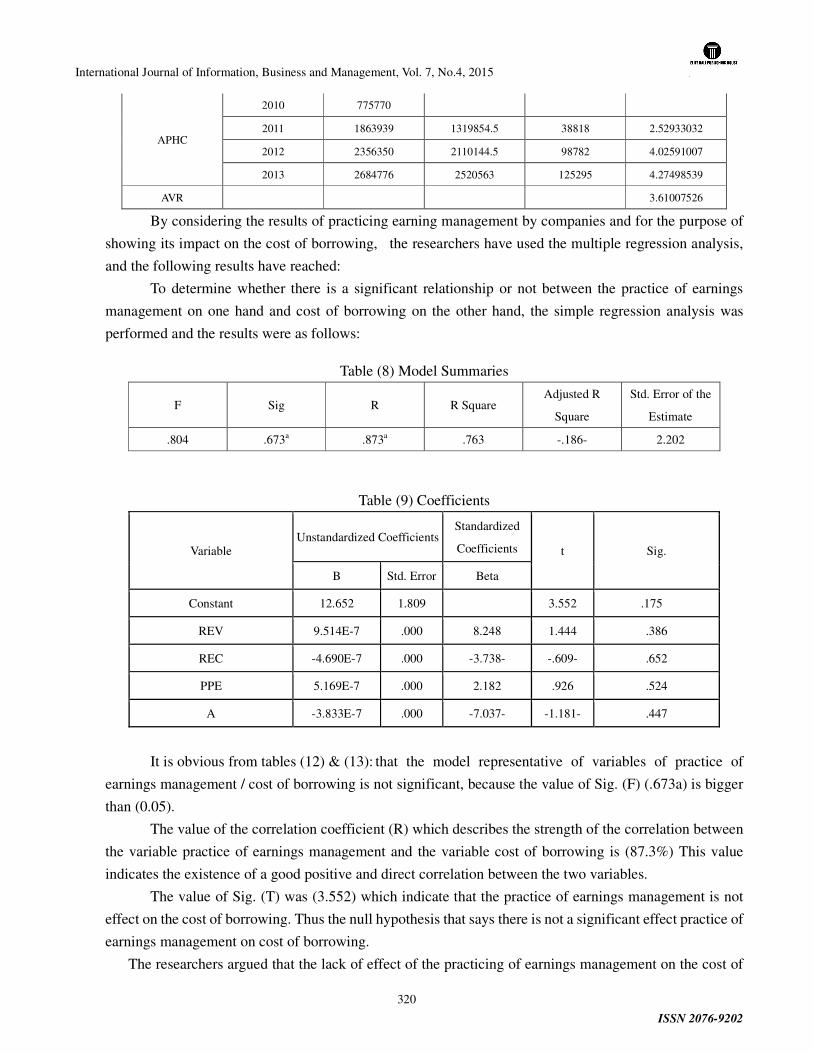
International Journal of Information, Business and Management, Vol. 7, No.4, 2015
ISSN 2076-9202
320
APHC
2010 775770
2011 1863939 1319854.5 38818 2.52933032
2012 2356350 2110144.5 98782 4.02591007
2013 2684776 2520563 125295 4.27498539
AVR 3.61007526
By considering the results of practicing earning management by companies and for the purpose of
showing its impact on the cost of borrowing, the researchers have used the multiple regression analysis,
and the following results have reached:
To determine whether there is a significant relationship or not between the practice of earnings
management on one hand and cost of borrowing on the other hand, the simple regression analysis was
performed and the results were as follows:
Table (8) Model Summaries
F Sig R R Square Adjusted R
Square
Std. Error of the
Estimate
.804 .673a .873a .763 -.186- 2.202
Table (9) Coefficients
Variable Unstandardized Coefficients
Standardized
Coefficients t Sig.
B Std. Error Beta
Constant 12.652 1.809 3.552 .175
REV 9.514E-7 .000 8.248 1.444 .386
REC -4.690E-7 .000 -3.738- -.609- .652
PPE 5.169E-7 .000 2.182 .926 .524
A -3.833E-7 .000 -7.037- -1.181- .447
It is obvious from tables (12) & (13): that the model representative of variables of practice of
earnings management / cost of borrowing is not significant, because the value of Sig. (F) (.673a) is bigger
than (0.05).
The value of the correlation coefficient (R) which describes the strength of the correlation between
the variable practice of earnings management and the variable cost of borrowing is (87.3%) This value
indicates the existence of a good positive and direct correlation between the two variables.
The value of Sig. (T) was (3.552) which indicate that the practice of earnings management is not
effect on the cost of borrowing. Thus the null hypothesis that says there is not a significant effect practice of
earnings management on cost of borrowing.
The researchers argued that the lack of effect of the practicing of earnings management on the cost of
International Journal of Information, Business and Management, Vol. 7, No.4, 2015
ISSN 2076-9202
321
borrowing goes back to that the borrowing market in Jordan is not sensitive towards the practice of earnings
management being one of the emerging markets, and most of loans due to the credit facilities obtained by
companies from banks in return for guarantees and mortgages and sometimes may return to the personal
relations between the company management and banks management, but not to the existence of bonds and
loans that are highly affected by the financial information published in the financial statements.
The conclusions
1. The pharmaceutical companies listed in Bursa Amman practice earnings management with varying
degrees, where there are three companies that practice earnings management for two years from the three
years studied, and three other companies practice earnings management for one year of the three years
studied.
2. The weakness of the sensitivity of the cost of borrowing against the practice of earnings management due
to that most loans in the studied companies are credit facilities from banks and not loan bonds shown in
Bursa Amman.
3. The difference of the cost of borrowing among the studied companies is due to the difference between the
interest rate on the local currency, which was (8.10%) and interest rate on the US dollar, which was (3.5 -
5%).
4. No effect practicing earnings management on the cost of borrowing in the studied companies.
The recommendations
1. The need for a paragraph included in the External Auditor's report on practicing earnings management by
companies.
2. the need for special attention by the committees of corporate governance to limiting the earnings
management practices.
3. The need to issue a stimulating legislation for companies to obtain financing they need through the
issuance of a loan bonds to take advantage of the efficiency of financial markets in determining the interest
rate.
References
Ali, Abdul Wahab Nasr. (2009), Encyclopedia of Modern external audit according to the standards of the Arab International and American Review, Part 4, Aldar Aljameia, Egypt.
Altman , Edward, (1980), commercial Bank Lending : process , credit scoring , and costs of errors in lending , journal of financial and quantitative analysis.
Coles. L. Jeffrey; Hertedm pichaelm and Kalpatlym Swaminathan.(2006). Earnings Management Around employee stock option reissues. Journal of accounting and economics; 41.
Gaa,J. Dunmore, P. (2007). ''The Ethic of Earnings Management'' Chartered Accountants Journal.
Gulab, Hassan Ahmed, (1993), accounting in commercial banks, library, Ain Shams, Cairo.
Hamad, Tareq, (2005), Financial Reports, Aldar Aljameia, Alexandria, Egypt.
International Journal of Information, Business and Management, Vol. 7, No.4, 2015
ISSN 2076-9202
322
Joshua, R., Varda, Y. (2008), Earnings Management: Emerging Insights in Theory, Practice, and Research, Springer Edition, New York.
Merchant, K., & Rockness, J., (2002), The ethics of managing earnings: An empirical investigation. Journal of Accounting and Public Policy. Vol. 13, No. 1.
Michael, D. Akers, D. Jodi, B. (2007). "Earnings Management and its Implication", The CPA Journal, Available at: www.highbeam.com/doc/1P3-1318434341.
Partha, M., (2003), How to Manage Earnings Management. Accounting World Institute of Chartered Financial Institutes of India.
Scott, W.S.,(2003), Financial Accounting Theory, Third Edition, Toronto, Prentice Hall.
Stolowy, Hervé and Breton, Gaétan ,(2004), Accounting Manipulation: A literature Review and Proposed Conceptual Framework, The Review of Accounting and Finance, Vol .3, No 1.
Zubaidi, Hamza M., (2002), Bank credit management and credit analysis, Warraq for Publishing and Distribution, Amman, Jordan.
International Journal of Information, Business and Management, Vol. 7, No.4, 2015
ISSN 2076-9202
323
The Determinants of Manufacturer Firm Value in Indonesia Stock
Exchange
Jacinta Winarto
University of Padjadjaran, Indonesia
Abstract
This study tests determinant of firm value of 32 publicly listed manufacturing companies in Indonesia
Stock Exchange during period of 2005 to 2010. Factors which affect firm value are classified into 2 parts
which are policy and performance. Policy factors include financing, investment, and dividend policies.
Performance factors include liquidity, profitability, activity, and also size factor. Data sources are from
Indonesian Capital Market Directory (ICMD) and company annual reports. To find the determinants of
firm value, panel regression is used. Based on sampling on 32 manufacturing companies, it was revealed
that liquidity has negative and significant influence to manufacturing firms value. On the other side,
financing, dividend policy and profitability have positive and significant influence to firm value.
Investment policy has a positive influence and significant to firm value at 10% level. Activity and
size of company does not have an effect to firm value.
Keywords: determinant, company policy, company performance, firm value, panel regression
1. Introduction
The main purpose of company according to theory of the firm is to maximize wealth or company
value (Sartono, 2009) through increase of share price (Fama, 1978). With the increasing of firm value, the
company can obtain many benefits, among others, access to source of fund from capital market, high
selling price or value when the company is bought or merged. Company value is also very important,
because with this affects stockholders prosperity.
The price of share as representation of firm value is determined by three primary factors, there are,
International Journal of Information, Business and Management, Vol. 7, No.4, 2015
ISSN 2076-9202
324
internal and external factors. This research emphasizes at internal factor of company because this factor
is manageable. Internal factor of company can be grouped into company policy factor and performance
factor. Company policy factor in this research emphasized in financial management policy which covers
investment, financing, and dividend policy (Damodaran, 2001). Financing policy is approximate to debt
policy or debt equity ratio. Investment policy is approximate to Investment Opportunity Set. Dividend
policy is approximate to dividend payout ratio. Performance factor in this research is liquidity,
profitability, and activity. In addition to company policy and performance factors, size is also considered
as a factor which affects firm value.
To maximize firm value, firm needs to pay attention to the various factors. Therefore, variables
which affects firms value is considered to be understood in terms of its direct influence to the company.
2. Literature Review
On the bottom line, company net profit can be shared to stockholders as a dividend or retained to
finance company invesment. There are some theories about dividend policy that affects firm value. The
Theory of Irrelevance Dividend expresses that dividend policy does not affect firm value. Bird in the
Hand Theory expresses that high dividend will increase firm value. The Theory of Brennan (1970)
expresses that increasing high dividend payout ratio of a firm, would lower value of the firm.
The beginning of theory of modern capital structure was from Modigliani and Miller (1958). Its
proposition is that financing decision is not relevant. Then there was an opposing capital structure theory
that is Trade-off Theory (Balancing Theory) and Pecking Order Theory (Myers and Majluf, 1984). Both
theories express that financing decision is relevant in capital structure policy in imperfect capital market
condition.
For the first time Myers (1977) introduced Investment Opportunity Set (IOS). Two matters which
affect firm value are placed asset future investment opportunities. IOS emphasized more on selection of
invesment in the future. IOS is opportunity of the firm to grow in the future instead of real growth that
has been achieved. The size of IOS usually correlated to gaining profitable project, company invesment in
International Journal of Information, Business and Management, Vol. 7, No.4, 2015
ISSN 2076-9202
325
research and development, and fixed asset.
Literature Review on Study Variables and Formulation of Hypotheses
Leverage Policy
Some previous researches have been performed. Research about leverage among others
committed by Uchida (2006) found that leverage or debt has positive influence and significant to value of
firm (Tobin's Q). Andri and Hanung (2007) found that investment opportunity set and leverage influence
firm value. In company with level of debt is too high, addition of debt causes firm value declines because
investors concern that debt can add burden to the company.
H1: Leverage has negative influence to firm value
According to Brigham (1999: 87) proxy leverage is
Book Debt to Equity Ratio = Total Debt : Total Equity
According to Brigham (1999: 86) proxy leverage is
Book Debt to Asset = Total Debt : Total Asset
According to Brigham and Gapenski (1996: 543) proxy leverage is
Long Term Debt Equity Ratio = Total Long Term Debt: Total Equity
Following Brigham (1999: 87), this research uses Book Debt to Equity Ratio = Total Debt : Total Equity
as proxy leverage.
Liquidity
Cash position is the proxy to measure liquidity. This factor is a manageable internal factor by
management. Company which has enough cash can seize opportunity better compared to company with
insufficient cash. Thus, the more a company seizes opportunities, the better the firm value.
H2: Liquidity has positive influence to firm value.
International Journal of Information, Business and Management, Vol. 7, No.4, 2015
ISSN 2076-9202
326
According to Helfert (1995), cash position can be counted based on comparison between year-end cash
balances with net profit after tax. Following Helfert (1995), then this research used proxy cash balance /
net profit after tax.
Profitability
Company profit is an indicator of company ability to fulfill obligation to its funder and also is an
element in value creation of firm which shows company prospect in the future. Profitability ratio is ratio
which measure ability of company producing profit at sale level, certain asset and capital stock. Carlson
and Bathala (1997) and Uchida (2006) found that ROA has positive influence to value of firm.
H3: Profitability has positive influence to firm value.
Profit is earning ability measurement of a company. There are measurements to describe this variable
such as Return on Assets (ROA), Return on Equity (ROE), Operating Profit Margin, and Net Profit
Margin. Following Carlson and Bathala (1997), Uchida (2006) this research uses ROA.
Size
The size of company indicates how large the company is. Asset is a measuring tool of magnitude or scale
of a company, usually large company has large asset. Large company has more certainty than small
scale company which reduce level of uncertainty about company prospect. The size of company shows
corporate activity which the company has. The size of a large company shows company development so
investor will response positively and firm value will increase. Taswan and Soliha (2002) and
Soepriyanto (2004) research indicated that company size is proven to affect value of firm.
H4: The size of firm has positive influence to firm value.
There are many proxies for size of a company such as total asset, sales, turnover, market capitalization,
number of employees.
International Journal of Information, Business and Management, Vol. 7, No.4, 2015
ISSN 2076-9202
327
This research uses total logarithm of asset as proxy of size of firm.
Investment Policy
To reach firm goal, manager makes invesment decision which produces positive net present value.
Fama (1978) expressed that value of firm is solely determined by invesment decision. Invesment decision
affects firm value at announcement time. (Mc Connel and Muscarella, 1984). Pasternak and Rosenberg
(2002) found that invesment has positive influence and significant to to firm value.
Investment Opportunity Set/ IOS or value of invesment opportunity is present value of company
choices to make future invesment.
IOS is a relation between current and future expenditure with value / return / prospect as result of the
invesment decision to produce value of firm’s. Three IOS proxies: 1. IOS proxy based on price which is
based on difference between assets and share market value 2. IOS proxy based on invesment shows that
high level invesment activity has positive correlation to company IOS (Kallapur and Trombley 1999. 3.
IOS proxy based on variant.
H5: IOS has positive influence to firm value
There are some indicators IOS like Book Value of Gross Property, Plant & Equipment to the Book Value
of the Assets Ratio (PPE / BVA), Market to Book Value of Equity Ratio (MVE / BVE); Price Earning
Ratio (PER); Market Value to Book Value of Assets Ratio (MVA / BVA).
This research uses PER as proxy of IOS
Activity
This ratio look at some assets and then determine how much level of assets activity at certain activity
level. Low activity at certain sale level will result in higher excess fund placed in the assets. The excess
fund will be better if it is invested at other more productive asset.
International Journal of Information, Business and Management, Vol. 7, No.4, 2015
ISSN 2076-9202
328
There are some proxies for activity like Inventory Turnover (ITO), Total Assets Turnover (TATO),
Receivable Turnover (RTO). Inventory as main element of working capital is an asset which is always in
circulation, which change continuously. To measure supply efficiency, it is necessary to calculate
Inventory Turn Over (ITO) with comparing number of cost of goods solds with supply average value
owned (Ross et. al., 2005). The higher the inventory turn over, the better the firm value which further will
be assessed as good by investors. This research uses Inventory Turnover (ITO) proxy.
H6 : Inventory Turnover has positive influence to firm value.
Dividend Policy
Research about dividend policy to firm value under study by Hasnawati (2008,) the result of its
research indicate that dividend policy influential positive to firm value.
H7: Dividend influential positive to firm value.
According to Smith & Watts (1992,) Kallapur & Trombley (1999), dividend proxy is dividend pay out
ratio = dividend paid to be divided with the available profit for stockholder.
According to Smith & Watts (1992,) Kallapur & Trombley (1999,) dividend proxy is dividend yield =
dividend percentage to price of previous period share which can be made as by proxy as its monetary
magnitude.
According to Glen et al (1995) that company in the developing countries is more prioritizeing dividend
payout ratio than its monetary magnitude.
Following Smith & Watts (1992,) Kallapur & Trombley (1999,) dividend proxy in this research is
dividend pay out ratio = dividend paid to be divided with the available profit for stockholder
The Firm Value
The firm value is defined as market value because company value can give maximal stockholder
prosperity if price of share increases. The main purpose of company is to increase firm value through
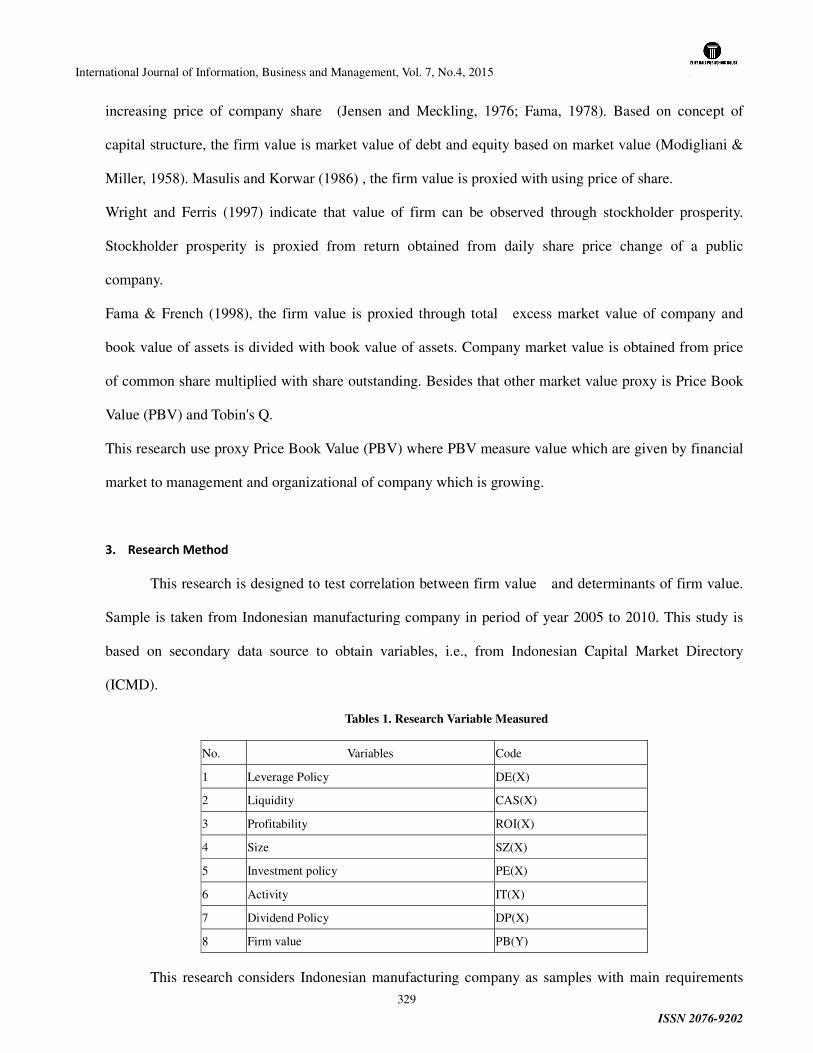
International Journal of Information, Business and Management, Vol. 7, No.4, 2015
ISSN 2076-9202
329
increasing price of company share (Jensen and Meckling, 1976; Fama, 1978). Based on concept of
capital structure, the firm value is market value of debt and equity based on market value (Modigliani &
Miller, 1958). Masulis and Korwar (1986) , the firm value is proxied with using price of share.
Wright and Ferris (1997) indicate that value of firm can be observed through stockholder prosperity.
Stockholder prosperity is proxied from return obtained from daily share price change of a public
company.
Fama & French (1998), the firm value is proxied through total excess market value of company and
book value of assets is divided with book value of assets. Company market value is obtained from price
of common share multiplied with share outstanding. Besides that other market value proxy is Price Book
Value (PBV) and Tobin's Q.
This research use proxy Price Book Value (PBV) where PBV measure value which are given by financial
market to management and organizational of company which is growing.
3. Research Method
This research is designed to test correlation between firm value and determinants of firm value.
Sample is taken from Indonesian manufacturing company in period of year 2005 to 2010. This study is
based on secondary data source to obtain variables, i.e., from Indonesian Capital Market Directory
(ICMD).
Tables 1. Research Variable Measured
This research considers Indonesian manufacturing company as samples with main requirements
No. Variables Code
1 Leverage Policy DE(X)
2 Liquidity CAS(X)
3 Profitability ROI(X)
4 Size SZ(X)
5 Investment policy PE(X)
6 Activity IT(X)
7 Dividend Policy DP(X)
8 Firm value PB(Y)
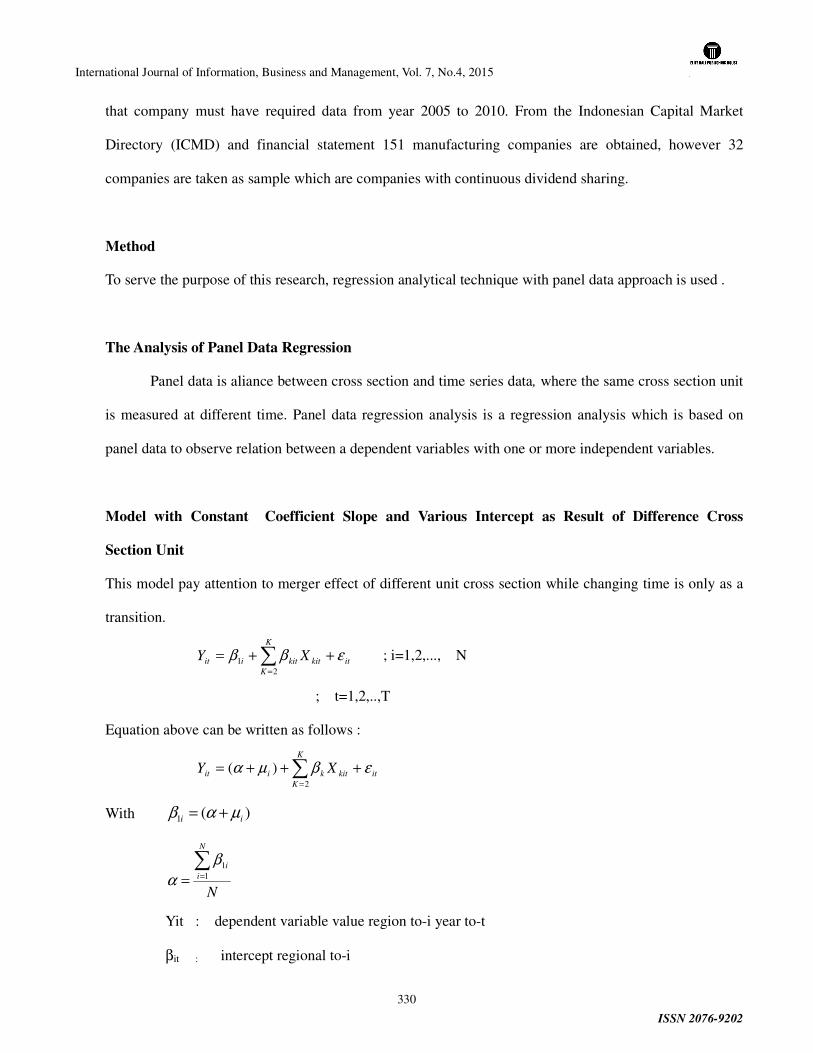
International Journal of Information, Business and Management, Vol. 7, No.4, 2015
ISSN 2076-9202
330
that company must have required data from year 2005 to 2010. From the Indonesian Capital Market
Directory (ICMD) and financial statement 151 manufacturing companies are obtained, however 32
companies are taken as sample which are companies with continuous dividend sharing.
Method
To serve the purpose of this research, regression analytical technique with panel data approach is used .
The Analysis of Panel Data Regression
Panel data is aliance between cross section and time series data, where the same cross section unit
is measured at different time. Panel data regression analysis is a regression analysis which is based on
panel data to observe relation between a dependent variables with one or more independent variables.
Model with Constant Coefficient Slope and Various Intercept as Result of Difference Cross
Section Unit
This model pay attention to merger effect of different unit cross section while changing time is only as a
transition.
it
K
K
kitkitiit XY εββ ++= ∑=2
1 ; i=1,2,..., N
; t=1,2,..,T
Equation above can be written as follows :
it
K
K
kitkiit XY εβµα +++= ∑=2
)(
With )(1 ii µαβ +=
N
N
i
i∑== 1
1β
α
Yit : dependent variable value region to-i year to-t
βit : intercept regional to-i
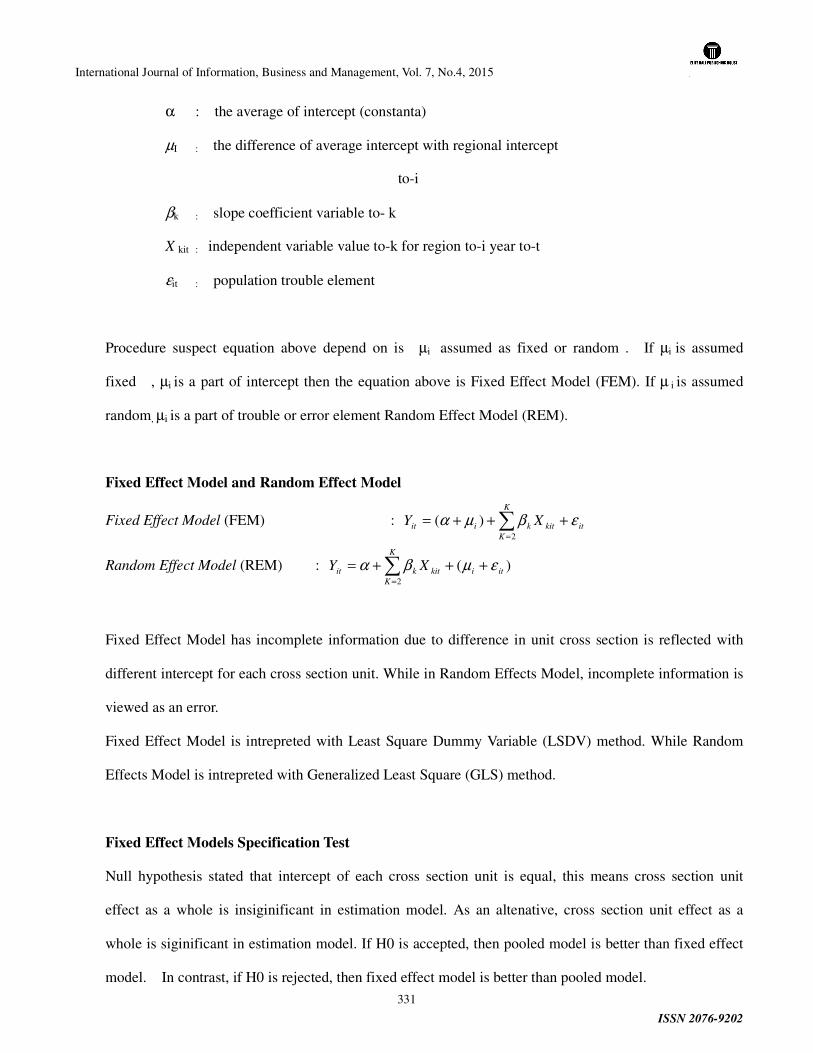
International Journal of Information, Business and Management, Vol. 7, No.4, 2015
ISSN 2076-9202
331
α : the average of intercept (constanta)
µI : the difference of average intercept with regional intercept
to-i
βk : slope coefficient variable to- k
X kit : independent variable value to-k for region to-i year to-t
εit : population trouble element
Procedure suspect equation above depend on is µi assumed as fixed or random . If µi is assumed
fixed , µi is a part of intercept then the equation above is Fixed Effect Model (FEM). If µ i is assumed
random, µi is a part of trouble or error element Random Effect Model (REM).
Fixed Effect Model and Random Effect Model
Fixed Effect Model (FEM) : it
K
K
kitkiit XY εβµα +++= ∑=2
)(
Random Effect Model (REM) : )(2
iti
K
K
kitkit XY εµβα +++= ∑=
Fixed Effect Model has incomplete information due to difference in unit cross section is reflected with
different intercept for each cross section unit. While in Random Effects Model, incomplete information is
viewed as an error.
Fixed Effect Model is intrepreted with Least Square Dummy Variable (LSDV) method. While Random
Effects Model is intrepreted with Generalized Least Square (GLS) method.
Fixed Effect Models Specification Test
Null hypothesis stated that intercept of each cross section unit is equal, this means cross section unit
effect as a whole is insiginificant in estimation model. As an altenative, cross section unit effect as a
whole is siginificant in estimation model. If H0 is accepted, then pooled model is better than fixed effect
model. In contrast, if H0 is rejected, then fixed effect model is better than pooled model.
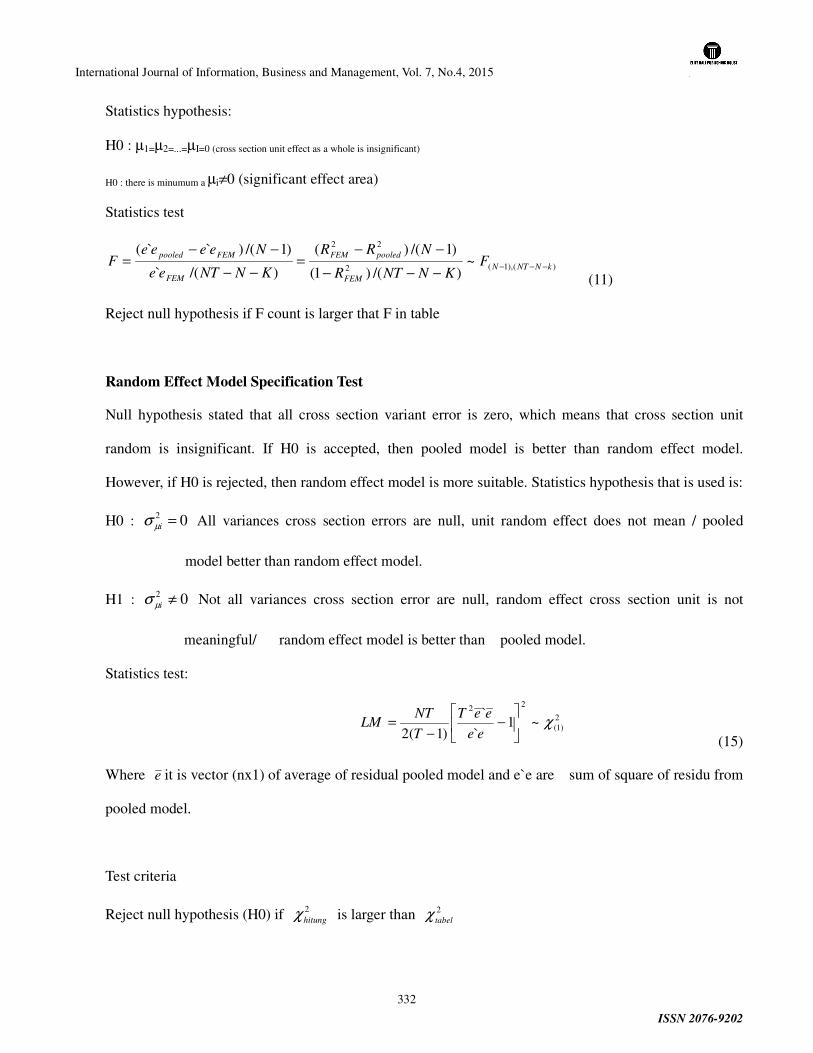
International Journal of Information, Business and Management, Vol. 7, No.4, 2015
ISSN 2076-9202
332
Statistics hypothesis:
H0 : µ1=µ2=...=µI=0 (cross section unit effect as a whole is insignificant)
H0 : there is minumum a µi≠0 (significant effect area)
Statistics test
)(),1(2
22
~)/()1(
)1/()(
)/(`
)1/()``(kNNTN
FEM
pooledFEM
FEM
FEMpooledF
KNNTR
NRR
KNNTee
NeeeeF −−−
−−−
−−=
−−
−−=
(11)
Reject null hypothesis if F count is larger that F in table
Random Effect Model Specification Test
Null hypothesis stated that all cross section variant error is zero, which means that cross section unit
random is insignificant. If H0 is accepted, then pooled model is better than random effect model.
However, if H0 is rejected, then random effect model is more suitable. Statistics hypothesis that is used is:
H0 : 02 =iµσ All variances cross section errors are null, unit random effect does not mean / pooled
model better than random effect model.
H1 : 02 ≠iµσ Not all variances cross section error are null, random effect cross section unit is not
meaningful/ random effect model is better than pooled model.
Statistics test:
2)1(
22
~1`
`
)1(2χ
−
−=
ee
eeT
T
NTLM
(15)
Where e it is vector (nx1) of average of residual pooled model and e`e are sum of square of residu from
pooled model.
Test criteria
Reject null hypothesis (H0) if 2hitungχ is larger than 2
tabelχ
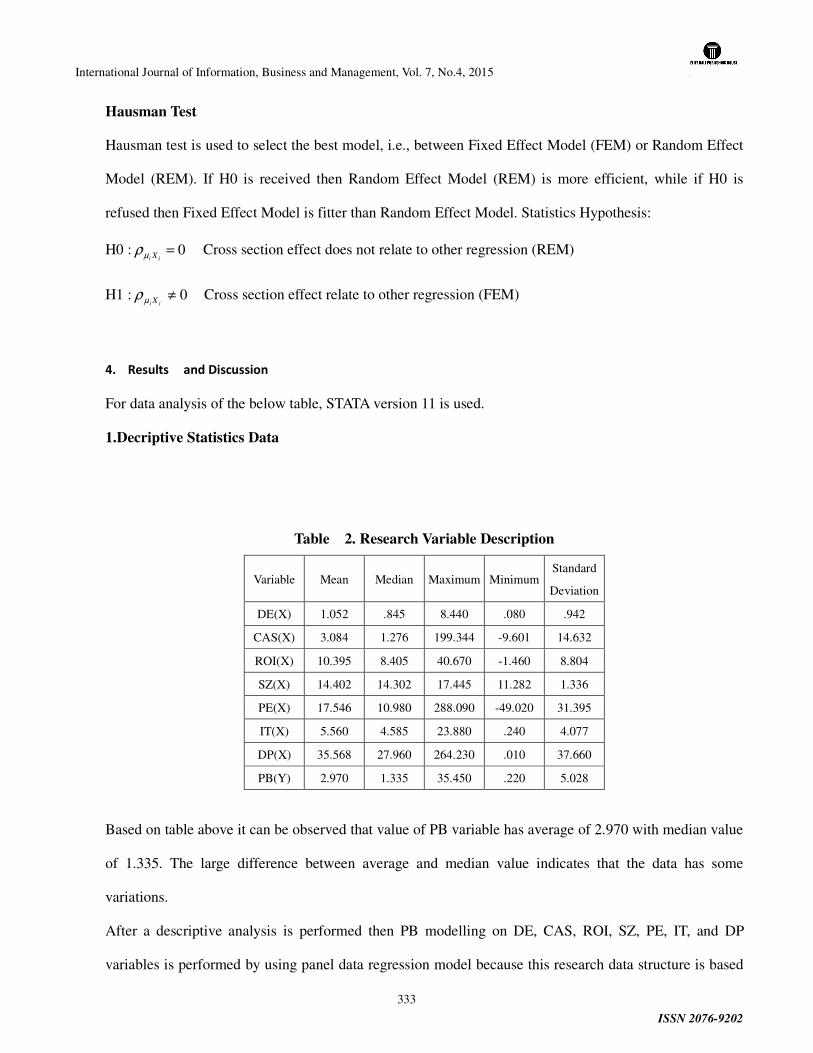
International Journal of Information, Business and Management, Vol. 7, No.4, 2015
ISSN 2076-9202
333
Hausman Test
Hausman test is used to select the best model, i.e., between Fixed Effect Model (FEM) or Random Effect
Model (REM). If H0 is received then Random Effect Model (REM) is more efficient, while if H0 is
refused then Fixed Effect Model is fitter than Random Effect Model. Statistics Hypothesis:
H0 : 0=ii Xµρ Cross section effect does not relate to other regression (REM)
H1 : 0≠ii Xµρ Cross section effect relate to other regression (FEM)
4. Results and Discussion
For data analysis of the below table, STATA version 11 is used.
1.Decriptive Statistics Data
Table 2. Research Variable Description
Variable Mean Median Maximum Minimum Standard
Deviation
DE(X) 1.052 .845 8.440 .080 .942
CAS(X) 3.084 1.276 199.344 -9.601 14.632
ROI(X) 10.395 8.405 40.670 -1.460 8.804
SZ(X) 14.402 14.302 17.445 11.282 1.336
PE(X) 17.546 10.980 288.090 -49.020 31.395
IT(X) 5.560 4.585 23.880 .240 4.077
DP(X) 35.568 27.960 264.230 .010 37.660
PB(Y) 2.970 1.335 35.450 .220 5.028
Based on table above it can be observed that value of PB variable has average of 2.970 with median value
of 1.335. The large difference between average and median value indicates that the data has some
variations.
After a descriptive analysis is performed then PB modelling on DE, CAS, ROI, SZ, PE, IT, and DP
variables is performed by using panel data regression model because this research data structure is based

International Journal of Information, Business and Management, Vol. 7, No.4, 2015
ISSN 2076-9202
334
on crossection and time series data.
2. Estimation Pooled Model
First phase in panel data regression modelling is to anticipate value of regression model parameter with
pooled modeling then it is compared to Fixed Effect and Random Effect Model to select the best research
model.
The result of Pooled Model calculation is as follow:
Source | SS df MS Number of obs = 192
-------------+------------------------------ F( 7, 184) = 52.39
Model | 3215.59328 7 459.370469 Prob > F = 0.0000
Residual | 1613.42994 184 8.76864099 R-squared = 0.6659
-------------+------------------------------ Adj R-squared = 0.6532
Total | 4829.02322 191 25.2828441 Root MSE = 2.9612
------------------------------------------------------------------------------
pb | Coef. Std. Err. t P>|t| [95% Conf. Interval]
-------------+----------------------------------------------------------------
de | 2.078861 .2449691 8.49 0.000 1.595552 2.562171
cas | -.0803609 .0193634 -4.15 0.000 -.1185638 -.0421581
roi | .3763272 .0260342 14.46 0.000 .3249633 .4276911
sz | .2465323 .1727649 1.43 0.155 -.0943225 .5873871
pe | .0547882 .0091634 5.98 0.000 .0367093 .0728671
it | -.065012 .0571658 -1.14 0.257 -.1777967 .0477726
dp | .0204176 .0059339 3.44 0.001 .0087103 .0321248
_cons | -7.757492 2.376299 -3.26 0.001 -12.44579 -3.069194
------------------------------------------------------------------------------
From the calculation result, Pooled Model regression model is obtained, which is as follow:
Based on result of hypothesis examination of each research variable DE, CAS, ROI, SZ, PE, IT, and DP
to PB, at column p.value (P>|t|) it can be seen that SZ and IT variables have p. value bigger than 0.05
which indicates that both variables do not give significant influence to PB.
As a whole , Pooled Model has coefficient of determination 0.666 or 66.6% variances of PB variable

International Journal of Information, Business and Management, Vol. 7, No.4, 2015
ISSN 2076-9202
335
which can be explained by Pooled Model. But this model cannot be concluded before it is compared to
Fixed Effect and Random Effect Model and classic assumption examination.
3. Estimation with Fixed Effect
Then calculation of Fixed effect model with Least Square Variable Dummy method is performed with
output as follow:
Source | SS df MS Number of obs = 192
-------------+------------------------------ F( 38, 153) = 22.62
Model | 4099.25451 38 107.875119 Prob > F = 0.0000
Residual | 729.768715 153 4.76973016 R-squared = 0.8489
-------------+------------------------------ Adj R-squared = 0.8113
Total | 4829.02322 191 25.2828441 Root MSE = 2.184
------------------------------------------------------------------------------
pb | Coef. Std. Err. t P>|t| [95% Conf. Interval]
-------------+----------------------------------------------------------------
de | 2.963734 .2883444 10.28 0.000 2.394084 3.533384
cas | -.0996252 .015563 -6.40 0.000 -.1303713 -.0688791
roi | .2883665 .0433138 6.66 0.000 .2027962 .3739368
sz | .0061778 .541177 0.01 0.991 -1.062966 1.075322
pe | .0450192 .0075109 5.99 0.000 .0301807 .0598577
it | -.1199476 .1156042 -1.04 0.301 -.3483342 .1084389
dp | .0214178 .0067006 3.20 0.002 .0081801 .0346555
_Iperush_2 | -.1064647 1.447927 -0.07 0.941 -2.966974 2.754045
_Iperush_3 | -2.535251 1.634162 -1.55 0.123 -5.763687 .6931842
_Iperush_4 | -.5163743 1.810699 -0.29 0.776 -4.093573 3.060824
_Iperush_5 | -1.195659 2.453188 -0.49 0.627 -6.042152 3.650835
_Iperush_6 | -3.18946 1.718827 -1.86 0.065 -6.585158 .2062378
_Iperush_7 | -.958057 1.846001 -0.52 0.605 -4.604998 2.688884
_Iperush_8 | -5.58989 1.721834 -3.25 0.001 -8.991528 -2.188252
_Iperush_9 | -1.849327 1.560529 -1.19 0.238 -4.932292 1.233639
_Iperush_10 | .01373 1.766458 0.01 0.994 -3.476066 3.503526
_Iperush_11 | -1.677663 1.767201 -0.95 0.344 -5.168928 1.813602
_Iperush_12 | -4.541404 1.613743 -2.81 0.006 -7.729499 -1.353309
_Iperush_13 | -3.56475 1.494628 -2.39 0.018 -6.517522 -.6119784
_Iperush_14 | -1.570462 1.888399 -0.83 0.407 -5.301165 2.160242
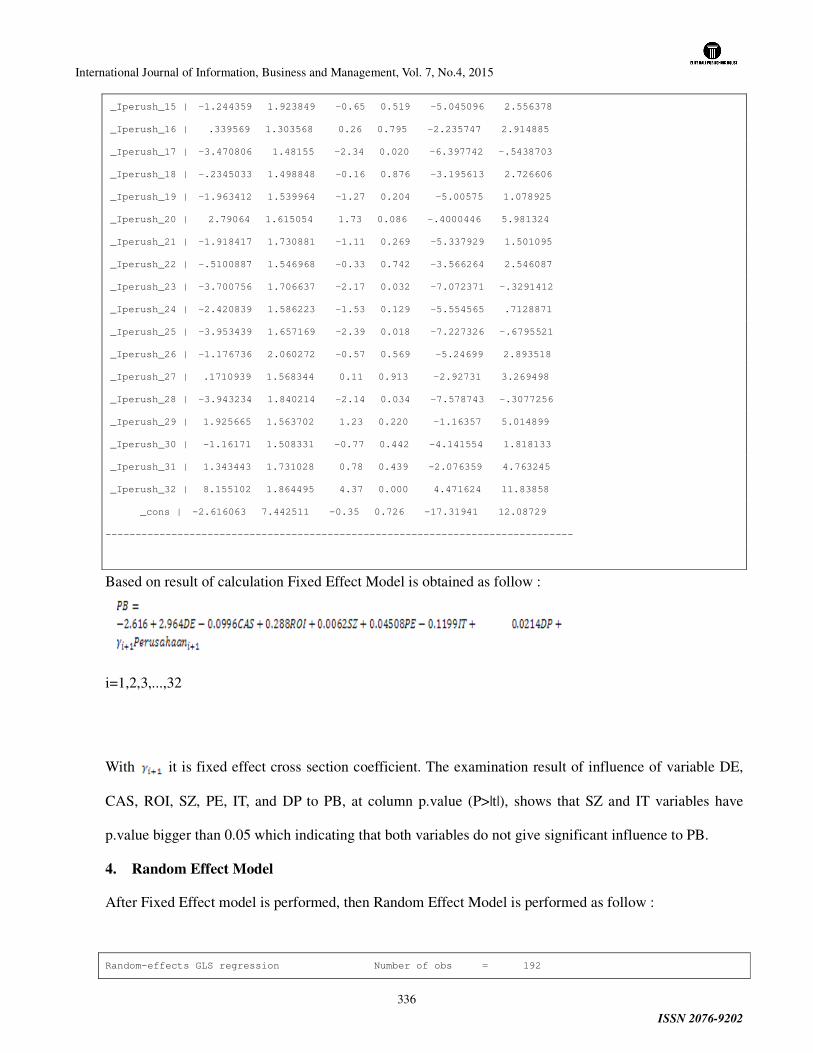
International Journal of Information, Business and Management, Vol. 7, No.4, 2015
ISSN 2076-9202
336
_Iperush_15 | -1.244359 1.923849 -0.65 0.519 -5.045096 2.556378
_Iperush_16 | .339569 1.303568 0.26 0.795 -2.235747 2.914885
_Iperush_17 | -3.470806 1.48155 -2.34 0.020 -6.397742 -.5438703
_Iperush_18 | -.2345033 1.498848 -0.16 0.876 -3.195613 2.726606
_Iperush_19 | -1.963412 1.539964 -1.27 0.204 -5.00575 1.078925
_Iperush_20 | 2.79064 1.615054 1.73 0.086 -.4000446 5.981324
_Iperush_21 | -1.918417 1.730881 -1.11 0.269 -5.337929 1.501095
_Iperush_22 | -.5100887 1.546968 -0.33 0.742 -3.566264 2.546087
_Iperush_23 | -3.700756 1.706637 -2.17 0.032 -7.072371 -.3291412
_Iperush_24 | -2.420839 1.586223 -1.53 0.129 -5.554565 .7128871
_Iperush_25 | -3.953439 1.657169 -2.39 0.018 -7.227326 -.6795521
_Iperush_26 | -1.176736 2.060272 -0.57 0.569 -5.24699 2.893518
_Iperush_27 | .1710939 1.568344 0.11 0.913 -2.92731 3.269498
_Iperush_28 | -3.943234 1.840214 -2.14 0.034 -7.578743 -.3077256
_Iperush_29 | 1.925665 1.563702 1.23 0.220 -1.16357 5.014899
_Iperush_30 | -1.16171 1.508331 -0.77 0.442 -4.141554 1.818133
_Iperush_31 | 1.343443 1.731028 0.78 0.439 -2.076359 4.763245
_Iperush_32 | 8.155102 1.864495 4.37 0.000 4.471624 11.83858
_cons | -2.616063 7.442511 -0.35 0.726 -17.31941 12.08729
------------------------------------------------------------------------------
Based on result of calculation Fixed Effect Model is obtained as follow :
i=1,2,3,...,32
With it is fixed effect cross section coefficient. The examination result of influence of variable DE,
CAS, ROI, SZ, PE, IT, and DP to PB, at column p.value (P>|t|), shows that SZ and IT variables have
p.value bigger than 0.05 which indicating that both variables do not give significant influence to PB.
4. Random Effect Model
After Fixed Effect model is performed, then Random Effect Model is performed as follow :
Random-effects GLS regression Number of obs = 192
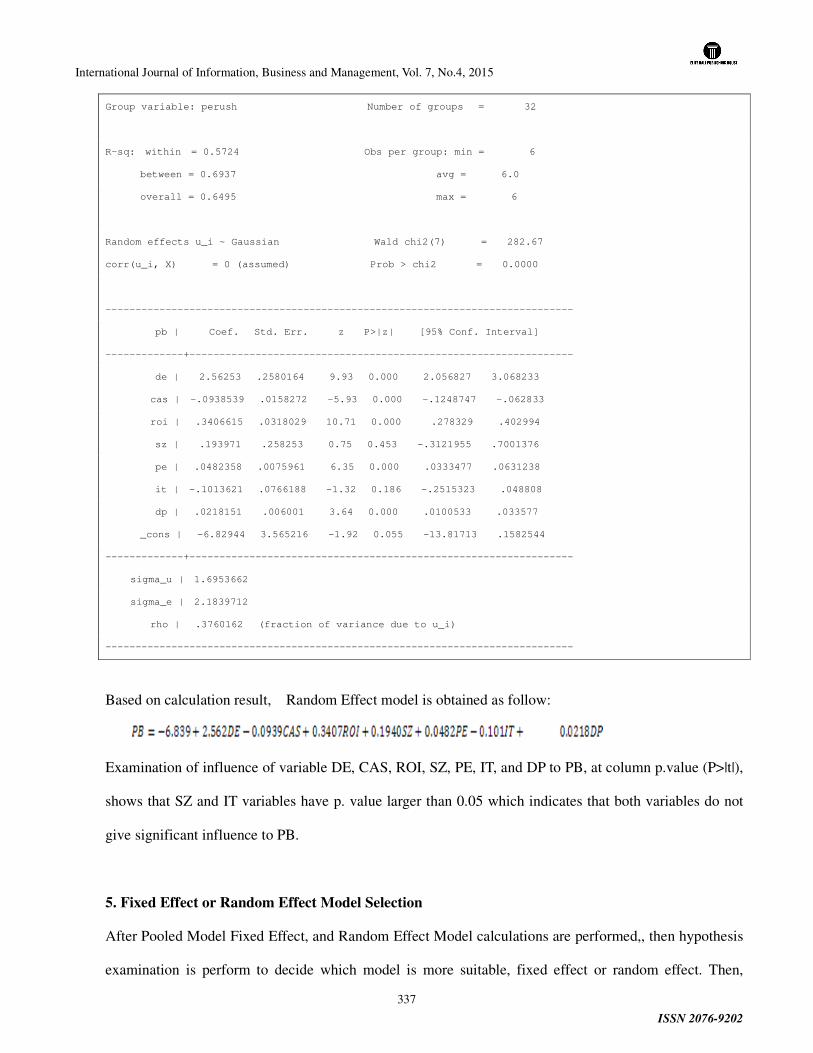
International Journal of Information, Business and Management, Vol. 7, No.4, 2015
ISSN 2076-9202
337
Group variable: perush Number of groups = 32
R-sq: within = 0.5724 Obs per group: min = 6
between = 0.6937 avg = 6.0
overall = 0.6495 max = 6
Random effects u_i ~ Gaussian Wald chi2(7) = 282.67
corr(u_i, X) = 0 (assumed) Prob > chi2 = 0.0000
------------------------------------------------------------------------------
pb | Coef. Std. Err. z P>|z| [95% Conf. Interval]
-------------+----------------------------------------------------------------
de | 2.56253 .2580164 9.93 0.000 2.056827 3.068233
cas | -.0938539 .0158272 -5.93 0.000 -.1248747 -.062833
roi | .3406615 .0318029 10.71 0.000 .278329 .402994
sz | .193971 .258253 0.75 0.453 -.3121955 .7001376
pe | .0482358 .0075961 6.35 0.000 .0333477 .0631238
it | -.1013621 .0766188 -1.32 0.186 -.2515323 .048808
dp | .0218151 .006001 3.64 0.000 .0100533 .033577
_cons | -6.82944 3.565216 -1.92 0.055 -13.81713 .1582544
-------------+----------------------------------------------------------------
sigma_u | 1.6953662
sigma_e | 2.1839712
rho | .3760162 (fraction of variance due to u_i)
------------------------------------------------------------------------------
Based on calculation result, Random Effect model is obtained as follow:
Examination of influence of variable DE, CAS, ROI, SZ, PE, IT, and DP to PB, at column p.value (P>|t|),
shows that SZ and IT variables have p. value larger than 0.05 which indicates that both variables do not
give significant influence to PB.
5. Fixed Effect or Random Effect Model Selection
After Pooled Model Fixed Effect, and Random Effect Model calculations are performed,, then hypothesis
examination is perform to decide which model is more suitable, fixed effect or random effect. Then,

International Journal of Information, Business and Management, Vol. 7, No.4, 2015
ISSN 2076-9202
338
selected model will be compared to Pooled Model.
Hypothesis :
H0 : 0=ii Xµρ Cross section effect does not relate to other regression (REM)
H1 : 0≠ii Xµρ Cross section effect relate to other regression (FEM)
To test this hypothesis, statistic by test Chi-Square is used with Hausman calculation testing as follow :
. hausman fixed random
---- Coefficients ----
| (b) (B) (b-B) sqrt(diag(V_b-V_B))
| fixed random Difference S.E.
-------------+----------------------------------------------------------------
de | 2.963734 2.56253 .4012044 .1287245
cas | -.0996252 -.0938539 -.0057714 .
roi | .2883665 .3406615 -.052295 .0294051
sz | .0061778 .193971 -.1877933 .4755817
pe | .0450192 .0482358 -.0032166 .
it | -.1199476 -.1013621 -.0185855 .0865672
dp | .0214178 .0218151 -.0003974 .0029809
------------------------------------------------------------------------------
b = consistent under Ho and Ha; obtained from xtreg
B = inconsistent under Ha, efficient under Ho; obtained from xtreg
Test: Ho: difference in coefficients not systematic
chi2(7) = (b-B)'[(V_b-V_B)^(-1)](b-B)
= 10.80
Prob>chi2 = 0.1477
(V_b-V_B is not positive definite)
Examination result gives value of Chi-Square 10.80 with p. value 0.14777. The p. value is larger than
0.05 so it is concluded that null hypothesis is received. This means that Random Effect Model is abetter
model according to Hausman's test .
5. Random Effect Model or Pooled Model Selection
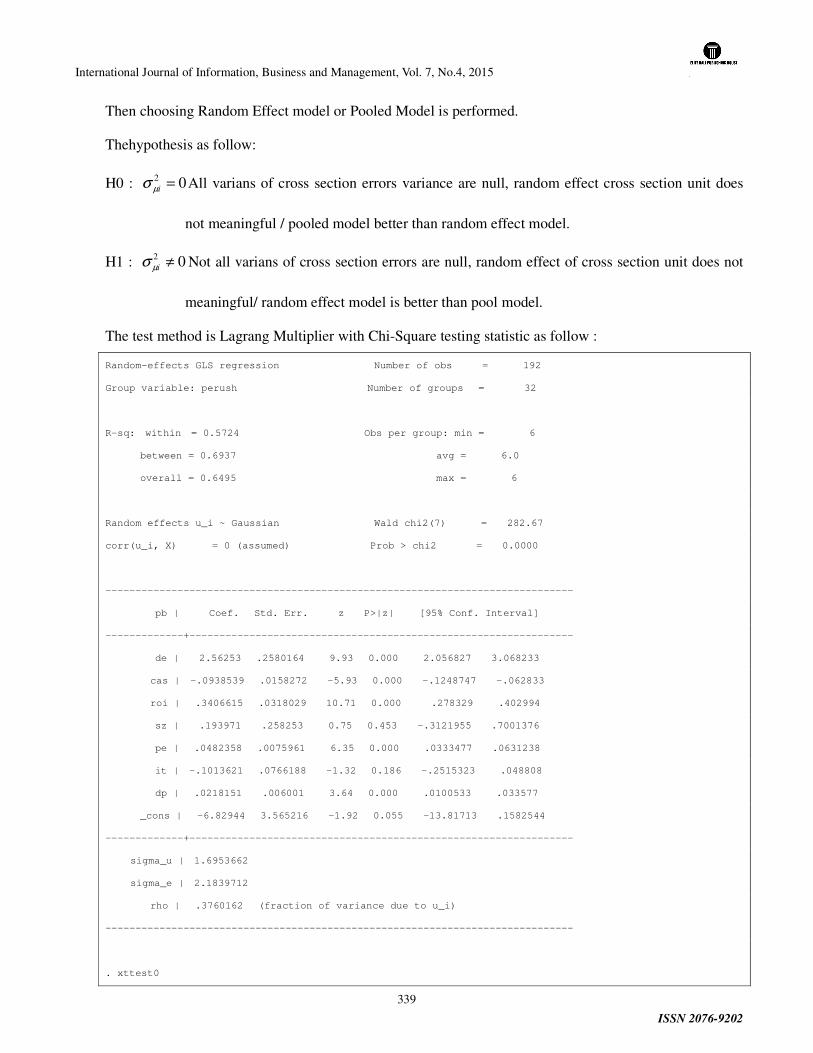
International Journal of Information, Business and Management, Vol. 7, No.4, 2015
ISSN 2076-9202
339
Then choosing Random Effect model or Pooled Model is performed.
Thehypothesis as follow:
H0 : 02 =iµσ All varians of cross section errors variance are null, random effect cross section unit does
not meaningful / pooled model better than random effect model.
H1 : 02 ≠iµσ Not all varians of cross section errors are null, random effect of cross section unit does not
meaningful/ random effect model is better than pool model.
The test method is Lagrang Multiplier with Chi-Square testing statistic as follow :
Random-effects GLS regression Number of obs = 192
Group variable: perush Number of groups = 32
R-sq: within = 0.5724 Obs per group: min = 6
between = 0.6937 avg = 6.0
overall = 0.6495 max = 6
Random effects u_i ~ Gaussian Wald chi2(7) = 282.67
corr(u_i, X) = 0 (assumed) Prob > chi2 = 0.0000
------------------------------------------------------------------------------
pb | Coef. Std. Err. z P>|z| [95% Conf. Interval]
-------------+----------------------------------------------------------------
de | 2.56253 .2580164 9.93 0.000 2.056827 3.068233
cas | -.0938539 .0158272 -5.93 0.000 -.1248747 -.062833
roi | .3406615 .0318029 10.71 0.000 .278329 .402994
sz | .193971 .258253 0.75 0.453 -.3121955 .7001376
pe | .0482358 .0075961 6.35 0.000 .0333477 .0631238
it | -.1013621 .0766188 -1.32 0.186 -.2515323 .048808
dp | .0218151 .006001 3.64 0.000 .0100533 .033577
_cons | -6.82944 3.565216 -1.92 0.055 -13.81713 .1582544
-------------+----------------------------------------------------------------
sigma_u | 1.6953662
sigma_e | 2.1839712
rho | .3760162 (fraction of variance due to u_i)
------------------------------------------------------------------------------
. xttest0
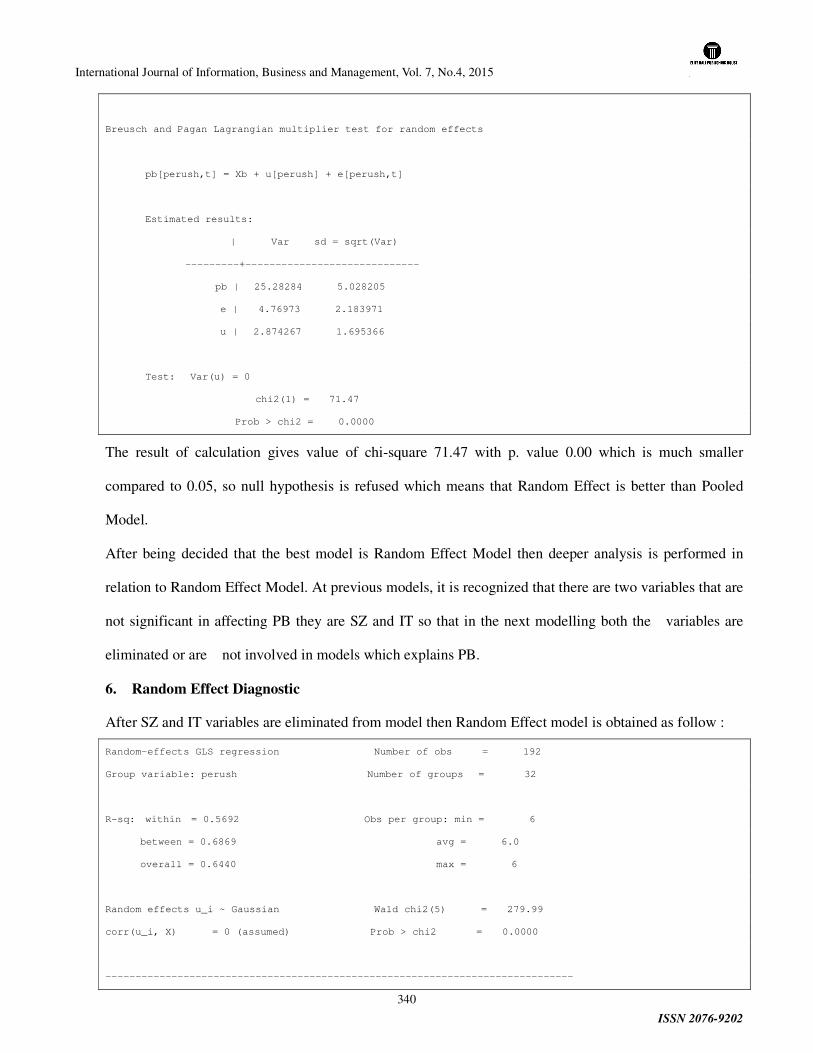
International Journal of Information, Business and Management, Vol. 7, No.4, 2015
ISSN 2076-9202
340
Breusch and Pagan Lagrangian multiplier test for random effects
pb[perush,t] = Xb + u[perush] + e[perush,t]
Estimated results:
| Var sd = sqrt(Var)
---------+-----------------------------
pb | 25.28284 5.028205
e | 4.76973 2.183971
u | 2.874267 1.695366
Test: Var(u) = 0
chi2(1) = 71.47
Prob > chi2 = 0.0000
The result of calculation gives value of chi-square 71.47 with p. value 0.00 which is much smaller
compared to 0.05, so null hypothesis is refused which means that Random Effect is better than Pooled
Model.
After being decided that the best model is Random Effect Model then deeper analysis is performed in
relation to Random Effect Model. At previous models, it is recognized that there are two variables that are
not significant in affecting PB they are SZ and IT so that in the next modelling both the variables are
eliminated or are not involved in models which explains PB.
6. Random Effect Diagnostic
After SZ and IT variables are eliminated from model then Random Effect model is obtained as follow :
Random-effects GLS regression Number of obs = 192
Group variable: perush Number of groups = 32
R-sq: within = 0.5692 Obs per group: min = 6
between = 0.6869 avg = 6.0
overall = 0.6440 max = 6
Random effects u_i ~ Gaussian Wald chi2(5) = 279.99
corr(u_i, X) = 0 (assumed) Prob > chi2 = 0.0000
------------------------------------------------------------------------------
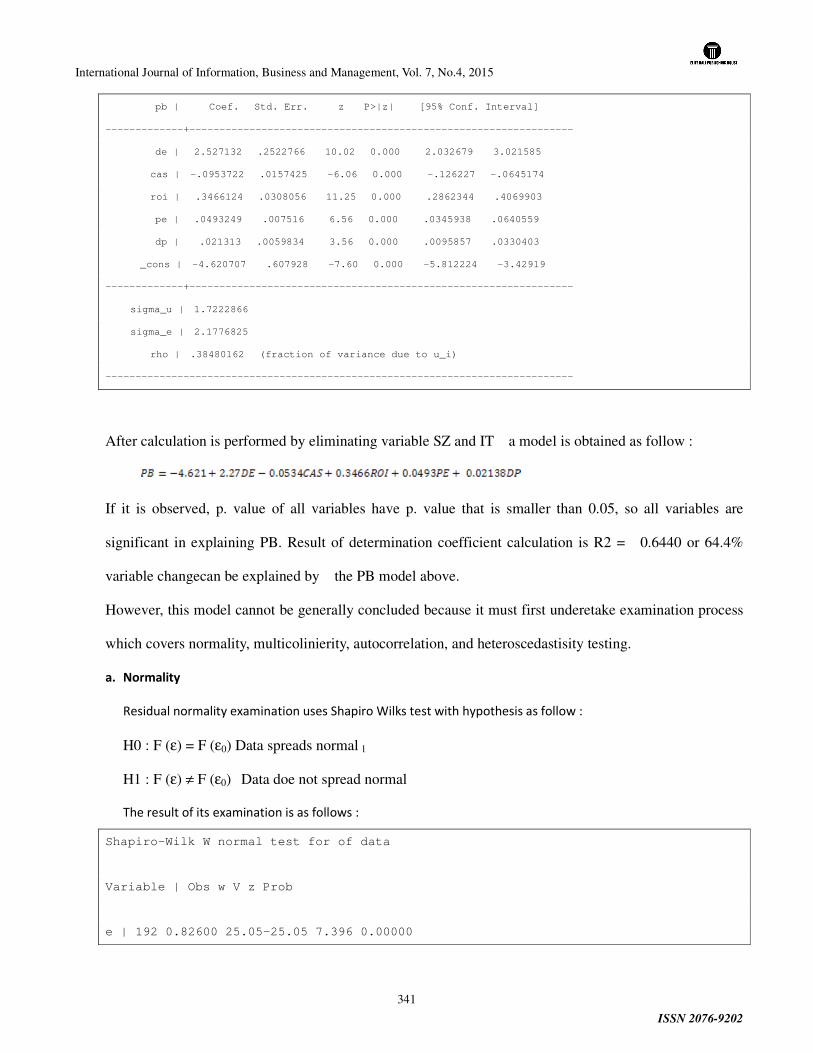
International Journal of Information, Business and Management, Vol. 7, No.4, 2015
ISSN 2076-9202
341
pb | Coef. Std. Err. z P>|z| [95% Conf. Interval]
-------------+----------------------------------------------------------------
de | 2.527132 .2522766 10.02 0.000 2.032679 3.021585
cas | -.0953722 .0157425 -6.06 0.000 -.126227 -.0645174
roi | .3466124 .0308056 11.25 0.000 .2862344 .4069903
pe | .0493249 .007516 6.56 0.000 .0345938 .0640559
dp | .021313 .0059834 3.56 0.000 .0095857 .0330403
_cons | -4.620707 .607928 -7.60 0.000 -5.812224 -3.42919
-------------+----------------------------------------------------------------
sigma_u | 1.7222866
sigma_e | 2.1776825
rho | .38480162 (fraction of variance due to u_i)
------------------------------------------------------------------------------
After calculation is performed by eliminating variable SZ and IT a model is obtained as follow :
If it is observed, p. value of all variables have p. value that is smaller than 0.05, so all variables are
significant in explaining PB. Result of determination coefficient calculation is R2 = 0.6440 or 64.4%
variable changecan be explained by the PB model above.
However, this model cannot be generally concluded because it must first underetake examination process
which covers normality, multicolinierity, autocorrelation, and heteroscedastisity testing.
a. Normality
Residual normality examination uses Shapiro Wilks test with hypothesis as follow :
H0 : F (ε) = F (ε0) Data spreads normal l
H1 : F (ε) ≠ F (ε0) Data doe not spread normal
The result of its examination is as follows :
Shapiro-Wilk W normal test for of data
Variable | Obs w V z Prob
e | 192 0.82600 25.05-25.05 7.396 0.00000
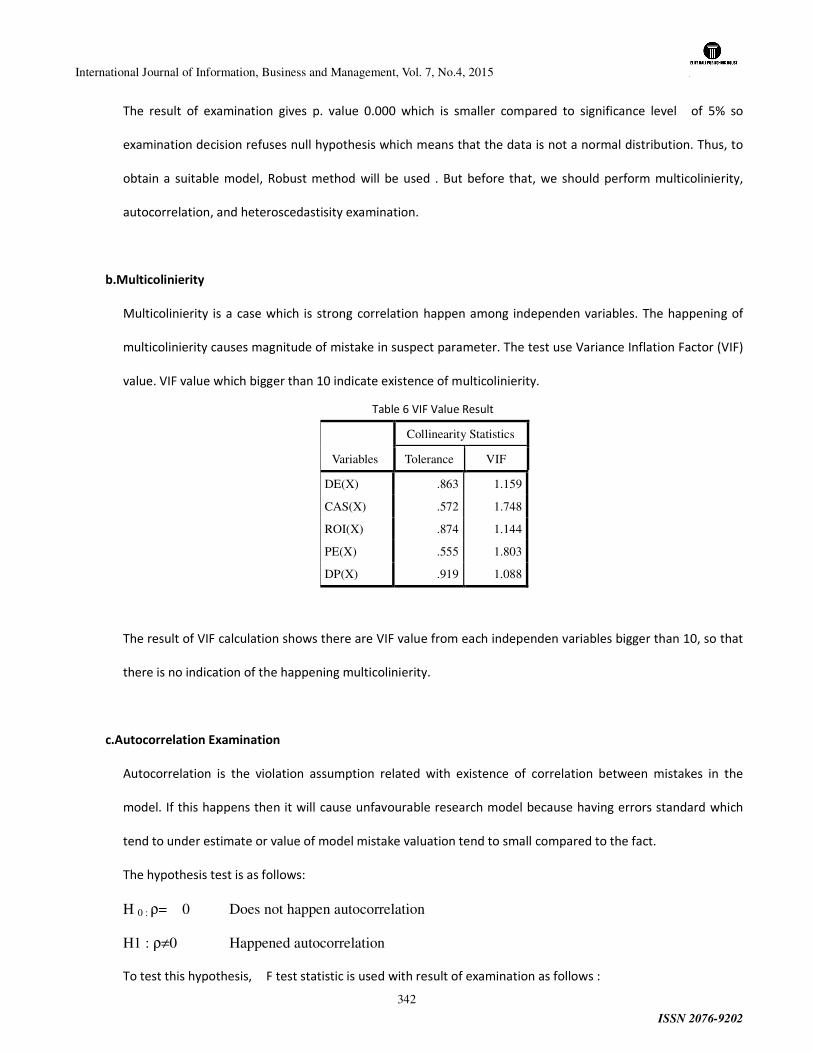
International Journal of Information, Business and Management, Vol. 7, No.4, 2015
ISSN 2076-9202
342
The result of examination gives p. value 0.000 which is smaller compared to significance level of 5% so
examination decision refuses null hypothesis which means that the data is not a normal distribution. Thus, to
obtain a suitable model, Robust method will be used . But before that, we should perform multicolinierity,
autocorrelation, and heteroscedastisity examination.
b.Multicolinierity
Multicolinierity is a case which is strong correlation happen among independen variables. The happening of
multicolinierity causes magnitude of mistake in suspect parameter. The test use Variance Inflation Factor (VIF)
value. VIF value which bigger than 10 indicate existence of multicolinierity.
Table 6 VIF Value Result
Variables
Collinearity Statistics
Tolerance VIF
DE(X) .863 1.159
CAS(X) .572 1.748
ROI(X) .874 1.144
PE(X) .555 1.803
DP(X) .919 1.088
The result of VIF calculation shows there are VIF value from each independen variables bigger than 10, so that
there is no indication of the happening multicolinierity.
c.Autocorrelation Examination
Autocorrelation is the violation assumption related with existence of correlation between mistakes in the
model. If this happens then it will cause unfavourable research model because having errors standard which
tend to under estimate or value of model mistake valuation tend to small compared to the fact.
The hypothesis test is as follows:
H 0 : ρ= 0 Does not happen autocorrelation
H1 : ρ≠0 Happened autocorrelation
To test this hypothesis, F test statistic is used with result of examination as follows :
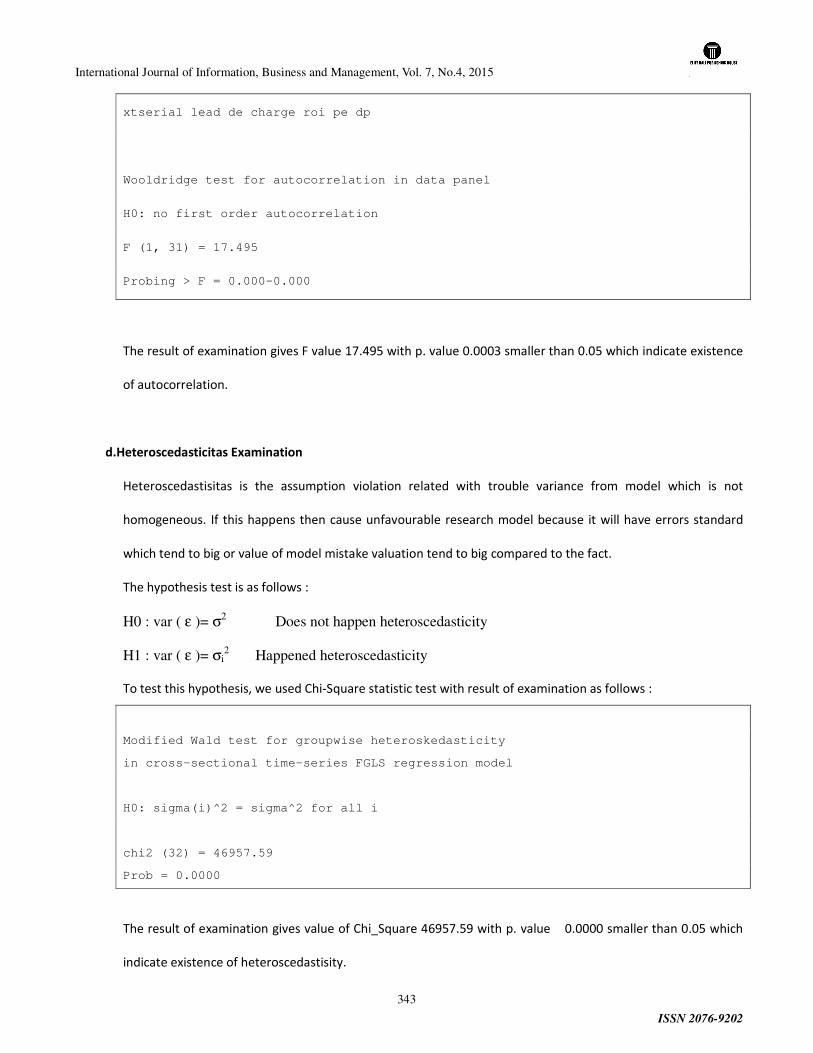
International Journal of Information, Business and Management, Vol. 7, No.4, 2015
ISSN 2076-9202
343
xtserial lead de charge roi pe dp
Wooldridge test for autocorrelation in data panel
H0: no first order autocorrelation
F (1, 31) = 17.495
Probing > F = 0.000-0.000
The result of examination gives F value 17.495 with p. value 0.0003 smaller than 0.05 which indicate existence
of autocorrelation.
d.Heteroscedasticitas Examination
Heteroscedastisitas is the assumption violation related with trouble variance from model which is not
homogeneous. If this happens then cause unfavourable research model because it will have errors standard
which tend to big or value of model mistake valuation tend to big compared to the fact.
The hypothesis test is as follows :
H0 : var ( ε )= σ2 Does not happen heteroscedasticity
H1 : var ( ε )= σi2 Happened heteroscedasticity
To test this hypothesis, we used Chi-Square statistic test with result of examination as follows :
Modified Wald test for groupwise heteroskedasticity
in cross-sectional time-series FGLS regression model
H0: sigma(i)^2 = sigma^2 for all i
chi2 (32) = 46957.59
Prob = 0.0000
The result of examination gives value of Chi_Square 46957.59 with p. value 0.0000 smaller than 0.05 which
indicate existence of heteroscedastisity.
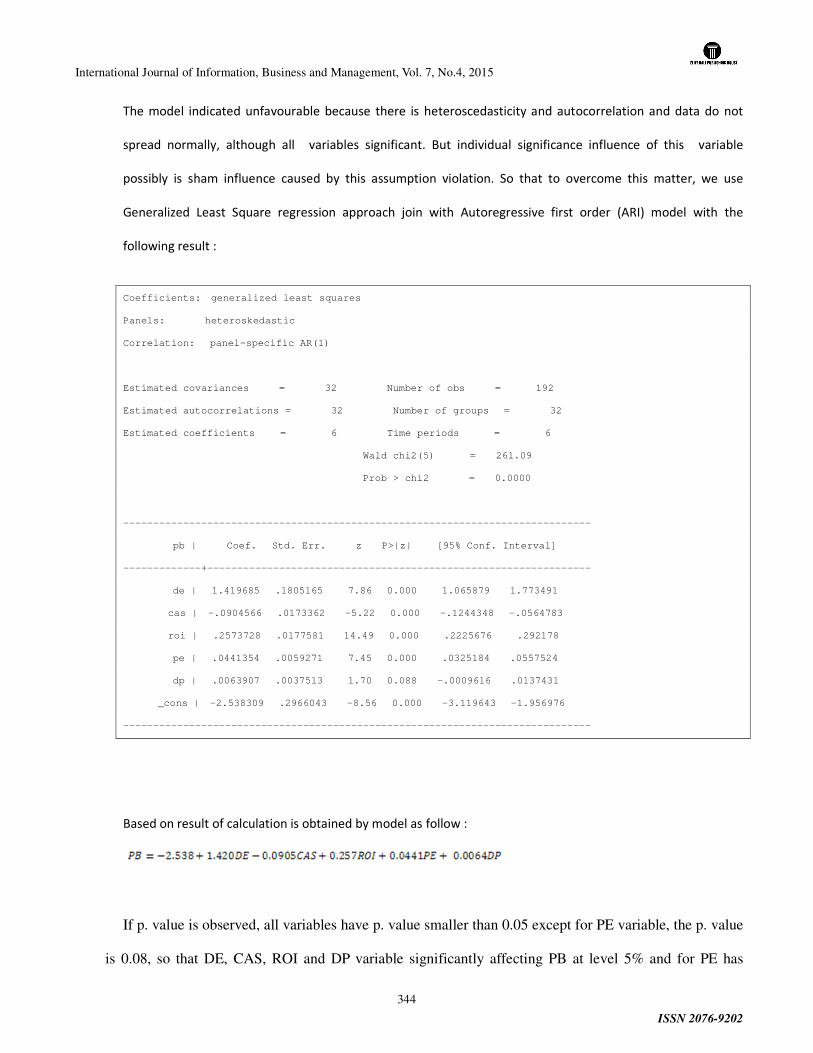
International Journal of Information, Business and Management, Vol. 7, No.4, 2015
ISSN 2076-9202
344
The model indicated unfavourable because there is heteroscedasticity and autocorrelation and data do not
spread normally, although all variables significant. But individual significance influence of this variable
possibly is sham influence caused by this assumption violation. So that to overcome this matter, we use
Generalized Least Square regression approach join with Autoregressive first order (ARI) model with the
following result :
Coefficients: generalized least squares
Panels: heteroskedastic
Correlation: panel-specific AR(1)
Estimated covariances = 32 Number of obs = 192
Estimated autocorrelations = 32 Number of groups = 32
Estimated coefficients = 6 Time periods = 6
Wald chi2(5) = 261.09
Prob > chi2 = 0.0000
------------------------------------------------------------------------------
pb | Coef. Std. Err. z P>|z| [95% Conf. Interval]
-------------+----------------------------------------------------------------
de | 1.419685 .1805165 7.86 0.000 1.065879 1.773491
cas | -.0904566 .0173362 -5.22 0.000 -.1244348 -.0564783
roi | .2573728 .0177581 14.49 0.000 .2225676 .292178
pe | .0441354 .0059271 7.45 0.000 .0325184 .0557524
dp | .0063907 .0037513 1.70 0.088 -.0009616 .0137431
_cons | -2.538309 .2966043 -8.56 0.000 -3.119643 -1.956976
------------------------------------------------------------------------------
Based on result of calculation is obtained by model as follow :
If p. value is observed, all variables have p. value smaller than 0.05 except for PE variable, the p. value
is 0.08, so that DE, CAS, ROI and DP variable significantly affecting PB at level 5% and for PE has
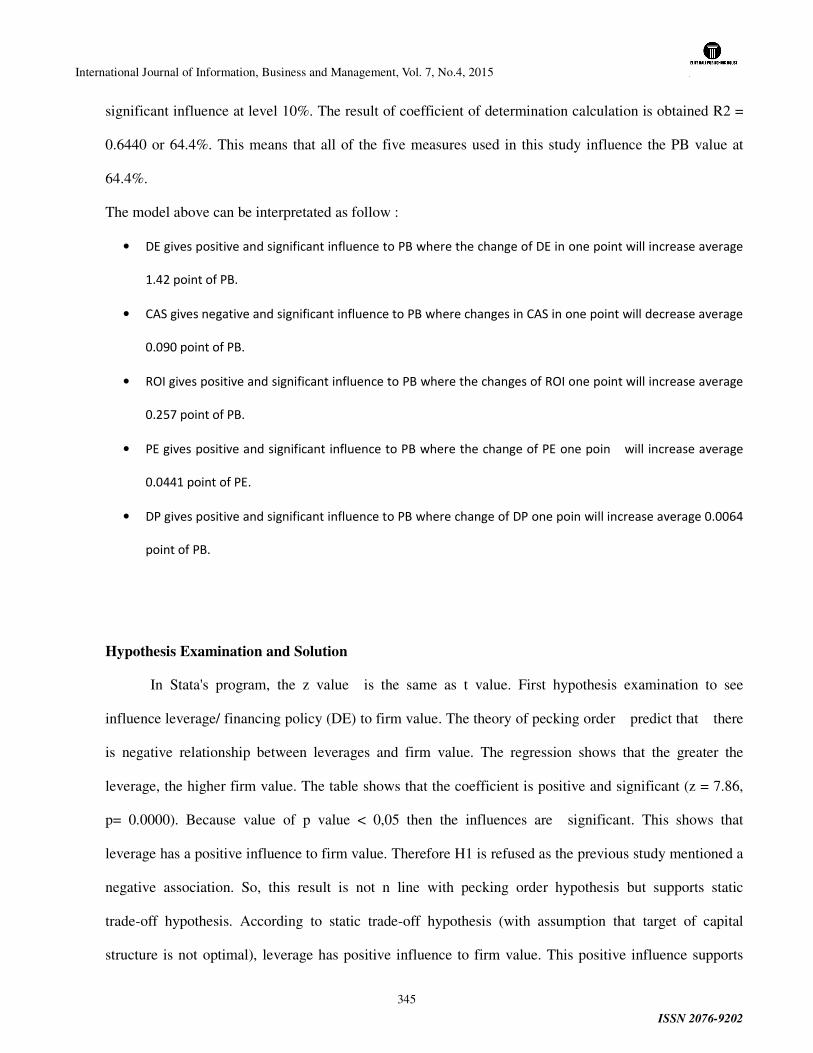
International Journal of Information, Business and Management, Vol. 7, No.4, 2015
ISSN 2076-9202
345
significant influence at level 10%. The result of coefficient of determination calculation is obtained R2 =
0.6440 or 64.4%. This means that all of the five measures used in this study influence the PB value at
64.4%.
The model above can be interpretated as follow :
• DE gives positive and significant influence to PB where the change of DE in one point will increase average
1.42 point of PB.
• CAS gives negative and significant influence to PB where changes in CAS in one point will decrease average
0.090 point of PB.
• ROI gives positive and significant influence to PB where the changes of ROI one point will increase average
0.257 point of PB.
• PE gives positive and significant influence to PB where the change of PE one poin will increase average
0.0441 point of PE.
• DP gives positive and significant influence to PB where change of DP one poin will increase average 0.0064
point of PB.
Hypothesis Examination and Solution
In Stata's program, the z value is the same as t value. First hypothesis examination to see
influence leverage/ financing policy (DE) to firm value. The theory of pecking order predict that there
is negative relationship between leverages and firm value. The regression shows that the greater the
leverage, the higher firm value. The table shows that the coefficient is positive and significant (z = 7.86,
p= 0.0000). Because value of p value < 0,05 then the influences are significant. This shows that
leverage has a positive influence to firm value. Therefore H1 is refused as the previous study mentioned a
negative association. So, this result is not n line with pecking order hypothesis but supports static
trade-off hypothesis. According to static trade-off hypothesis (with assumption that target of capital
structure is not optimal), leverage has positive influence to firm value. This positive influence supports
International Journal of Information, Business and Management, Vol. 7, No.4, 2015
ISSN 2076-9202
346
research of Uchida (2006.)
Second hypothesis examination is performed to see liquidity influence or cash position (CAS).
The regression shows that liquidity is negatively associated with firm value (z = -5.22, p.value = 0.000).
Because value p. value is < 0,05 then it has a significant influences. Large amount of cash indicates less
money is circulated by a company, that caused reduction in company return that further cause firm
value decline.
Third hypothesis examination is to observe profitability influence (ROI) to firm value. The
regression shows that profitability is positively associated with firm value (z = 14.49, p = o.oooo).
Because value p. value < 0,05 then the influence is significant. Therefore H3 is accepted. This result
supports research of Carlson and Bathala (1997) and Uchida (2006.) Company that produces profit, will
be able to fulfill obligation so it is perceived favourable by investor, therefore it can increase the firm
value.
Fourth hypothesis examination is to observe influence of size (SZ) to firm value. Based on
dataprocessing result, it is obtained by value of statistical z = 0.75 with value p. value of 0.453. Because p.
value is > 0,05 then its influence is not significant. Thus, size does not have a significant effect on
firm value. This result does not support research of Taswan and Soliha (2002) and Soepriyanto (2004.)
Fifth hypothesis examination is to observe investment policy influence (PE) to firm value. The
regression shows that investment decision is positively associated with firm value (z = 7.45, p = 0.0000).
Because value p. value is < 0,05 then its influence is significant. Therefore H5 is accepted. This result
supports research of Pasternak and Rosenberg (2002) Company which has many invesment opportunities
will grow so that it is perceived as favourable by investor.
The sixth hypothesis examination is to observe activity influence (IT) to firm value. Based on
data-processing result it is obtained statistical value of z = - 1,32 with p. value = 0.186. Because p. value
> 0,05 then its influence is not significant. So activity (IT) does not have significant effect on company
value.
Seventh hypothesis examination is to observe dividend influence (DP) to firm value. The
International Journal of Information, Business and Management, Vol. 7, No.4, 2015
ISSN 2076-9202
347
regression shows that dividend is positively associated with firm value (z = 1.70 and p. value = 0.088).
Because p. value is < 0.10 then dividend influence is significant at level 10%. So dividend (DP) has
significant positive influence to value of company. The result of research supports relevant dividend
policy hypothesis and support research of Hasnawati (2008.) The result of this research supports theory of
signalling. Dividend payment is expressed to have positive signal concerning company earnings prospect
so it increases share price as one indicator of firm value.
5. Conclusion
This study explores determinants of firm value of manufacturing company sample in period of
2005 to 2010. Analytical technique multiple regression with panel data approach was used to discover
associations among policy factor, performance factor, and size with manufacturing firm value.
Based on sample analysis which is taken from emiten group of manufacturing company, conclusion can
be drawn as follow:
1. Leverage (DE) has positive influence to firm value. Thus, this result does not support pecking
order hypothesis but supports static trade off hypothesis. According to static trade-off hypothesis,
leverage has positive influence to firm value. This research supports research of Uchida (2006).
2. Liquidity (CAS) has significant negative influence to firm value. The hypothesis is refused.
Increasingly large cash in a company will be assessed by investor that the company does not have
invesment opportunity or does not buy or trade goods so that it is assessed as unfavourable.
3. Profitability (ROI) has positive influence to firm value. This result supports Carlson and Bathala
(1997) and Uchida (2006) research. Increasingly profitability in a company will be assessed by
investor that the company is in a good condition.
4. Size (SZ) does not have an effect to firm value. The result of this research does not support
Taswan and Soliha (2002) and Soepriyanto (2004) research.
5. Investment policy (PE) has significant positive influence to firm value. This result supports
research of Pasternak and Rosenberg (2002).
International Journal of Information, Business and Management, Vol. 7, No.4, 2015
ISSN 2076-9202
348
6. Activity (IT) does not have a significant effect on firm value. This research supports Myers
(1977) research.
7. Dividend (DP) has significant positive influence to firm value. The result of research supports
relevant dividend policy hypothesis and support Hasnawati (2008) research.
Company which give dividend will be seen as a good company by the investors.
.
To increase firm value, company needs to consider financing, liquidity, profitability, investment, and
dividend policy. In advanced research, external factors to firm value should be taken into consideration.
Reference
Brigham, Eugene F, 1999. Fundamentals of Financial Management, Hult Saunders Japan: The Dryden Press.
Brigham, Eugene F. and Louis C. Gapenski.,1996. Intermediate Financial Management, Florida: The Dryden Press.
Carlson, S.J. and C.T. Bathala, 1997. Ownership Differences and Firms Income Smoothing Behavior, Journal of Business Finance and Accounting, 24(2), pp. 179-196.
Fama, Eugene F., 1978. The Efffect of a Firm’s Investment and Financing Decision on the Welfare of Its Securing Holders, American Economic Review, Vo. 68, No.3, pp. 272-284
Fama, Eugene F & Kenneth R. French, 1998. Taxes, Financing Decision, and Firm Value, The Journal of Finance Vol LIII No.3, June 1998, pp. 819-843
Glen, J.D. ;Y. Karmokolias, R.R. Miller and S. Shah, 1995. Dividend Policy and Behavior in Emerging Markets: To Pay or Not to Pay, IFC Discussion Paper no. 26.
Hasnawati, Sri, 2008. Analisis Dampak Kebijakan Dividen Terhadap Nilai Perusahaan Publik di Bursa Efek Jakarta, Vol. 13 No. 2, November 2008, pp. 312-322.
Helfert, Erich A., 1995. Analisis Laporan Keuangan, Terjemahan Herman Wibowo, Edisi Ketujuh, Jakarta: Erlangga.
Jensen, C. Michael and William Meckling, 1976. Theory of the Firm: Managerial Behavior, Agency Cost and Capital Structure, Journal of Financial Economics, 3, October, pp. 305-360.
International Journal of Information, Business and Management, Vol. 7, No.4, 2015
ISSN 2076-9202
349
Kallapur, Sanjay and Mark A. Trombley, 1999. The Association Between Investment Opportunity Set Proxies and Realized Broth, Journal of Business and Accounting; 26, April/ May, pp. 505-519.
Masulis, R. and A. Korwar, 1986. Seasoned Equity Offerings, An Empirical Investigation, Journal of Financial Economics, January/ February, pp. 91-118.
McConnell, J.J. and Muscarella, C.J., 1985. Corporate Capital Expenditure Decisions and The Market Value of The Firm. Journal of Financial Economics; 14, pp. 399-422.
Modigliani, F. and M. Miller, 1958. The Cost of Capital, Corporation Finance, and the Theory of Investment, American Economic Review 48 (3), pp. 261-297.
Myers, S.C., 1977. Determinants of Corporate Borrowing, Journal of Financial Economics, 5, pp. 147-175.
Myers, Stewart C. and Majluf, Nicholas S., 1984. Corporate Financing and Investment Decisions when Firms have Information that Investors Do Not Have, Journal of Financial Economics, 13, pp. 187-221.
Pasternak, D. and M. Rosenberg, 2002. Department of Finance and Statistics Swedish School of Economics and Business Administration Helsinki, The Impact of Stock Option Incentives on Investment and Firm Value, http://www.shh.fi/services/biblio/papers/index.htm.
Rachmawati, Andri dan Hanung Triatmoko,. 2007. Analisis Faktor-faktor yang Mempengaruhi Kualitas laba dan Nilai Perusahaan, Makalah Disampaikan dalam Simposium Nasional Akuntansi 10, Makasar, 26-28 Juli.
Ross, Stephen A., 1977. The Determination of Financial Structure: The Incentive-Signalling Approach, Bell Journal of Economics, 8:23-40
Sartono, R. Agus, 2009. Manajemen Keuangan, Teori dan Aplikasi, Edisi 4, Penerbit: BPFE Yogyakarta.
Smith Jr., Cliffort W. and Ross L. Watts, 1992. The Investment Opportunity Set and Corporate Financing, Dividend and Compensation Policies, Journal of Financial Economics; 32, pp. 263-292.
Soliha, Euis dan Taswan, 2002. Pengaruh Kebijakan Hutang Terhadap Nilai Perusahaan Serta Beberapa Faktor Yang Mempengaruhinya, Jurnal Bisnis dan Ekonomi, STIE STIKUBANK. September 2002, Semarang
Uchida, Konari. 2006. Faculty of Economics and Business Administration, The University of Kitakyushu, Agency Costs of Debt and the Relationship Between Firm Performance and Managerial Ownership: Evidence from Japan
Weston, J.F. and T.E. Copeland, 1992. Manajemen Keuangan, Edisi Kedelapan (Edisi Revisi), Penerbit Binarupa Aksara, Jakarta.
Wright, P. and S. Ferris, 1997. Agency Conflict and Corporate Strategy: The Effect of Divestment on Corporate Value, Strategic Management Journal, pp. 77-83.

Recommended