The Eurasia Proceedings of Educational & Social Sciences (EPESS)
ISSN: 2587-1730
ISSN: 2587-1730
IConMEB 2020: International Conference on Management, Economics and Business October 29 – November 1, 2020 Antalya, Turkey
Edited by: Mehmet Ozaslan (Chair), Gaziantep University, Turkey
©2020 Published by the ISRES Publishing

The Eurasia Proceedings of Educational & Social Sciences (EPESS)
ISSN: 2587-1730
IConMEB 2020 DECEMBER
Volume 19, Pages 1- 49 (December 2020) The Eurasia Proceedings of Educational & Social Sciences EPESS
e-ISSN: 2587-1730©2020 Published by the ISRES Publishing
Address: Istanbul C. Cengaver S. No 2 Karatay/Konya/TURKEY Website: www.isres.org
Contact: [email protected]
Edited by: Mehmet Ozaslan Articles: 1- 5
Conference: IConMEB 2020: International Conference on Management, Economics and Business
Dates: October 29 – November 1, 2020 Location: Antalya, Turkey
Conference Chair(s): Prof.Dr. Mehmet Ozaslan, Gaziantep University, Turkey
CONTENTS
Application of Six Sigma Methodology to Improve Customer Complaint Management / Pages: 1-10 Gulsah SISMAN, Fatma DEMIRCI OREL
Model Design Supplier Relationship Performance Measurement / Pages: 11-22 Rizki Prakasa HASIBUAN, Elisa KUSRINI
Perceived Supervisor Support, Work Engagement and Career-Related Self-Efficacy: An Empirical Study / Pages: 23-30 Emre Burak EKMEKCIOGLU
The Relationship between Governance and Economic Development: An Empirical Analysis from 1996 to 2019 for Albania / Pages: 31-40 Teuta XHINDI, Olgerta IDRIZI
Comparison of Financial Performances of Banks by Multi Criteria Decision Making Methods: The Case of Turkey / Pages: 41-49 Mehmet Nuri SALUR, Yasin CIHAN

The Eurasia Proceedings of
Educational & Social Sciences (EPESS)
ISSN: 2587-1730
- This is an Open Access article distributed under the terms of the Creative Commons Attribution-Noncommercial 4.0 Unported License,
permitting all non-commercial use, distribution, and reproduction in any medium, provided the original work is properly cited.
- Selection and peer-review under responsibility of the Organizing Committee of the Conference
© 2020 Published by ISRES Publishing: www.isres.org
The Eurasia Proceedings of Educational & Social Sciences (EPESS), 2020
Volume 19, Pages 1-10
IConMEB 2020: International Conference on Management, Economics and Business
Application of Six Sigma Methodology to Improve Customer Complaint
Management
Gulsah SISMAN
Cukurova University
Fatma DEMIRCI OREL
Cukurova University
Abstract: In today’s competitive business environment, customer satisfaction is one of the most critical
factors for sustaining a long-term success in an organization. Customers are mostly satisfied when the
organizations meet all their needs and expectations. This means, organizations need to listen the voice of the
customers and manage the customers’ complaints in an appropriate way. In this paper, a case study about
customer complaint management was carried out in a company from the plastics industry by applying six-sigma
project management methodology. The aim of this project was to overcome the increase in the customer
complaints by analyzing their root causes with six-sigma project management tools. The DMAIC methodology
was used during the project which has been completed in nine months. In the end, customer complaints
decreased %20 and the results show that six-sigma is a successful and encouraging tool for the improvement of
customer complaint management process of any organization.
Keywords: Six-sigma, customer complaints, customer satisfaction
Introduction
Developing a customer centric business is one of the most important strategies for sustaining an organization. In
order to do so, companies are trying to find the best methodologies to manage the customer relations. One of the
best methodologies that companies are focusing on is six-sigma. According to Kansal and Singhal (2017), six-
sigma offers an alternative problem-solving roadmap that can be implemented to any business function. Six-
sigma is a disciplined approach, which is data driven and analytical.
Before six-sigma applications, quality management tools and techniques were more preferable especially for the
production departments. El Haik and Roy (2005) explains that quality management system collects the business
processes focused on achieving quality policy and aims to meet customers’ needs. Different quality management
techniques and tools like ISO 9001:2008; Total Quality Management (TQM), six-sigma and lean have been
applied to improve internal and external customer satisfaction. Antony (2008) states that six-sigma is an
important tool in order to identify the root causes of the problems and produce efficient solutions.
Since the early days of six-sigma applications, there has been a common perception that six-sigma is useful only
for pure manufacturing processes and six-sigma does not very well adaptable to the other departments like sales
and marketing. Although six-sigma has been very popular in production department for years, sales and
marketing professionals have only recently started to use it (Pestorius, 2007). On the contrary, Desai and
Shrivasta (2008) think that six-sigma is a tool that is used to do strategical planning and boost profit, increase
market share and help to develop customer satisfaction by the help of statistical tools and also, service providers
prefer to apply six-sigma in marketing, finance, information systems and human resources in order to improve
the effectiveness and the efficiency of the system.
In this study, six-sigma management tools and techniques were applied to a company’s customer complaint
management system. In the company, there was a sharp increase in the customer complaints, product returns and

International Conference on Management, Economics and Business (IConMEB)
October 29–November 1, 2020, Antalya/TURKEY
2
some of the customers started to stop ordering and leave the company. This situation caused a stressful
environment for all the employees and managers. Therefore; the top management focused on a new six-sigma
project in order to find sustainable solutions to those problems. A project team was constituted, and project
goals were defined.
The main goals of this research are to introduce a six-sigma case study applied to decrease the number of
customer complaints, the total amount of product returns and the number of lost customers. Also, this study
shows that six-sigma is a management tool that can be easily adapted to departments related to customer
relations. Additionally, in this work, some recommendations for further studies are shared.
Literature Review
Six-sigma is a business management methodology that was first introduced by Motorola Inc. in the USA in
1987 (Nonthaleerak and Hendry, 2006). At that time, Motorola had an aggressive goal of 3.4 ppm defects and
developed six-sigma in order to reach that aim (Barney, 2002b; Folaron, 2003). In 1994 Larry Bossidy, CEO of
AlliedSignal, expressed six-sigma as a methodology that improves work processes, creates high-level results,
develops employees’ skills and effects the culture of the organization positively and worked on six-sigma (ASQ,
2002, p. 14). Afterwards, General Electric started to implement six-sigma to the processes of the company in
1995 (Slater, 1999).
Six-sigma has many definitions in literature in different perspectives. From the quality management points of
view, six-sigma is a high-performance, data-oriented problem analyzing and solving approach that focuses on
the root causes of business problems (Blakeslee, 1999, p. 78). Hahn et al. (2000) described six-sigma as an
approach that improves product and process quality by the help of statistics discipline. Harry and Schroeder
(2000), describes six-sigma as a “business process that allows companies to drastically improve their bottom
line by designing and monitoring everyday business activities in ways that minimize waste and resources while
increasing customer satisfaction. Additionally, Linderman et al. (2003) reiterated the need for a common
definition of six-sigma and suggested: ‘Six Sigma is an organized and systematic method for strategic process
improvement and new product and service development that relies on statistical methods and the scientific
method to make dramatic reductions in customer defined defect rates.’
Basically, six-sigma describes how a process is performing in a statistical way (Kansal and Singhal, 2017). The
purpose of the six-sigma is to eliminate and to minimize the defects in any process. Mostly used six-sigma
metrics are dpo (defects per opportunity), dpu (defects per unit), z-value or the sigma value, throughput yield,
rolled throughput yield, etc. (Erturk et al., 2016). According to six-sigma level perspective, in a process, no
more than 3.4 defects per million opportunities (DPMO) is acceptable (Linderman et al., 2003)
There are two main six-sigma methodologies: DFSS and DMAIC. These acronyms have special meanings.
DFSS means Design for Six Sigma and that is used to design or develop;
a new product or service and/or
a new process for an existing product.
DMAIC emphasizes the parts of the implementation process: Define, Measure, Analyze, Improve and Control.
DMAIC methodology is designed for the improvement of an ongoing process or existing product/service
performance that is not satisfactory.
DMAIC and DFSS are based on statistical tools with an assumption of 1.5 sigma shift in the process mean when
calculating the process capability of six-sigma (Nonthaleerak and Hendry, 2006). In this case study, DMAIC
approach were used to conduct the six-sigma project. In each phase of the DMAIC, useful quality tools and
techniques are applied (George, 2002; Pepper, 2010). Table 1 (Turkan, etc., 2009) shows the stages of Six
Sigma (DMAIC) and some of the tools and techniques used in detail (Turkan, etc., 2009). These tools and
techniques let the project team analyze the process performance and measure the system. The transition from
one phase to another is completed if all the goals of the phase have been reached (Liebermann, 2011).
DMAIC methodology’s success can be clarified by its structured logic that creates networks between phases, it
is important to touch each step of the methodology otherwise, there might be risky situations for finding the best
solutions for the problems. Some steps can be skipped only if the solution is clear and there is minimum risk. In
order to have this decision, those questions should be answered;

International Conference on Management, Economics and Business (IConMEB)
October 29–November 1, 2020, Antalya/TURKEY
3
What data exist to show that the proposed development is the best solution possible?
How can we make it sure that the solution will really solve the problem?
What are the disadvantages of the proposed development?
Table 1. Six sigma phases (DMAIC) and tools & techniques
Six-sigma
phase DMAIC phase steps The tools and methods
Define Ensuring that the problem and goal are defined in terms that
truly relate to key customer requirements
Project Charter
Process Flowchart
SIPOC Diagram
Stakeholder Analysis
CTQ Definitions
Measure Tested the output and input potential. Once it has determined the
right measurement system for
adequacy of available inputs and outputs.
Process Flowchart
Data Collection
Plan/Example Benchmarking
Measurement’s System
Analysis/Gage R&R
Process Sigma Calculations
Analyze Define Performance Objectives
Identify Value/Non-Value
Added Process Steps
Identify Sources of Variation
Determine Root Cause(s)
Determine Vital Few x’s, Y=f(x) Relationship
Histogram
Pareto Chart
Regression Analysis
Process Map Review and
Analysis Statistical Analysis
Hypothesis Testing
Non-Normal Data Analysis
Improve Perform Design of Experiments
Develop Potential Solutions
Define Operating Tolerances of Potential System Assess Failure
Modes of Potential Solutions Validate Potential Improvement by
Pilot Studies Correct/Re-Evaluate Potential Solution
Brainstorming
Mistake Proofing
Design of Experiments
Pugh Matrix
Failure Modes and Effects
Analysis
Control After optimized the output for the sake of continuity, and in
selected cases of important input just to check if continued, will
help to reduce the variability of the
output.
Process Sigma Calculation
Control Charts
Cost savings Calculations
Control Plan
If there is no data to answer these questions, although the solutions are obvious, it is necessary to follow a
complete DMAIC project with all stages (George, 2005).
Six-sigma is generally related to recover of the defects and costs of in the industry, but it doesn’t mean six-
sigma is only related to manufacturing problems. Six-sigma is a methodology that is adaptable not only
production but also services such as sales, marketing, supply chain, finance etc. After the implementation of six-
sigma, costs might decrease, process performances might increase, customer satisfaction might increase,
customer complaints might decrease (Antony, 2006; Kumar, etc., 2007; Noone, etc. 2010)
The Performance Management Group LLC (2006), reported that JP Morgan Chase (Global Investment Banking)
applied six-sigma methodology and reduce failures in customer related processes. After the project customer
satisfaction, process efficiency increased significantly. In addition to this, Celerant Consulting (2011), shared
British Telecom Wholesale’s case in their report. After six-sigma implementation, customer satisfaction and
process effectiveness increased significantly. The company reached million $ 77 savings and 50% decrease in
customer complaints thanks to six-sigma process improvement methodology. Additionally, Kansal and Singhal
(2017), explained in their paper a six-sigma study that aimed to develop customer satisfaction in an ISO
9001:2008 certificated government R&D organization. The organization had problems about customer
complaints. For these problems, six-sigma tools and techniques have been applied. After that, customer
satisfaction increased to more than 85%.

International Conference on Management, Economics and Business (IConMEB)
October 29–November 1, 2020, Antalya/TURKEY
4
Although there are some limitations, Reisenberger and Sousa (2010) explains that six-sigma applications in
services affect the performances positively, especially low performance processes like customer complaint
management, which will be explained in a case study in the following section, can benefit from six-sigma
solutions.
Case Study
In this study, a company from plastics industry was chosen in order to see the effects of the implementation of
six-sigma. The company produces three main plastics raw materials for the other companies in plastics industry.
The customers of the company are mostly located in Europe and have a sensitive quality and service
understanding. In this company, customer complaints between the years 2016-2018 were evaluated. After the
six-sigma project use, the service quality and efficiency of the customer complaint management were improved.
In this six-sigma project, DMAIC approach was applied that will be explained below.
Define
The company selected six-sigma project methodology in order to overcome customer complaints’ increase.
Before that the company had a Customer Complaint Management department, however in years, this department
had cancelled, and technical team supported the management of customer complaints. Unfortunately, technical
team was very busy with the production issues, they could not fully focus on the complaints and their solutions.
This situation and change caused an increase in the number of customer complaints day by day. In today’s
competitive environment, this increase sounded very dangerous for the economy and prestige of the company
from the top management’s point of view. That’s why, the top management planned to make started a new six-
sigma project. Team consisted of 5 professionals from sales, production, logistics and marketing departments.
Two of them have black belt six-sigma certification and minimum 2 years six-sigma project experience. Most of
the members of the team attended the project implementation actively. Project team organized project status
meetings regularly in every two weeks.
Customer complaints data between the years 2016 and 2018 had been used and analyzed as project data. Data of
the customer complaints were taken from a special database of this company. This data included customer
name, product group and name, date of the complaint and other details about complaint. There are three main
product groups of the company. This project aimed to improve polymer products’ customers’ complaints;
therefore, project scope was defined as it was in the Table 2, which explains the Project Charter that shows the
details of the project in the beginning. Project lasted for 9 months and after this time interval project leader
continued to control project indicators monthly in order prevent recurring increases of customer complaints.
Table 2. Project charter
Six-sigma Customer Complaint Management Project
Team Members
Leader : Gulsah Sisman
Process Owner : Member 1
Members : Member 2, Member 3, Member 4
Problem Definition: Increase in the number of customer complaints between the years 2016 and 2018.
Project Scope: The polymer products’ customers’ complaints
Project Indicators Unit Goal
The Number of Complaints Item/month 8
The Total Amount of Returns Ton/month 0
The Number of Lost Customers Item/month 0
In Table 2, the final goals of the project were stated as project indicators, also named as critical to quality
(CTQ). There were three indicators of the project. The first one was the number of the complaints. For this
indicator, the company aimed to have %20 decrease that means maximum 8 complaints monthly. Second one
was the total amount of returns due to unsatisfactory products or services. The company aimed to have zero
returns at the end of the project. Finally, the number of lost costumers was recorded monthly as another project
indicator. For this indicator, the aim of the company was to keep all the customers at the end of the project.
In Figure 1, the process flow chart of the customer complaint management can be seen below. There are four
main steps in this process. Firstly, the company has the information about the complaint coming from customer.

International Conference on Management, Economics and Business (IConMEB)
October 29–November 1, 2020, Antalya/TURKEY
5
Then, customer complaint management team tried to understand the details about the complaint. After that, root
cause analysis is conducted to specify and control complaints and prevent the system. Whenever the complaint
comes to a conclusion, related customer is informed about it.
Figure 1. Process flow chart
Measure
In order to better understand the current state of the customer complaint management, two years data about the
project indicators, which are customer complaints, product returns and lost customers were collected from the
company’s database. Minitab and Excel programs were used to measure and analyze the customer complaints
between the years 2016 and 2018. In this section, each indicator was explained and compared through years.
The Number of Complaints
The first step of the project measurement was to see yearly customer complaints. From Figure 2, it is easily seen
that the number of customer complaints increased in every year. In other words, the number of customer
complaints was 98 in 2016, 114 in 2017, while it was 118 in 2018.
Figure 2. The number of complaints (ıtem/year)
Additionally, in Figure 3, monthly change in customer complaints between the years 2016-2018 can be seen in
detail. From Figure 3, it is clear that there were some fluctuations in 2016 and 2017. In 2018, there was still
some fluctuations, however it was in an increasing trend during the whole year.
Figure 3. Time series plot of customer complaints
98
114 118
2016 2017 2018
1 The company
gets the
information
about the
complaint from
customer
2 The company
investigates the
customer in
detail
3 All the
related teams do
root cause
analysis and they
determine the
controlling and
preventing
actions.
4 Customer
complaint ends
and immediately
after customer is
informed.

International Conference on Management, Economics and Business (IConMEB)
October 29–November 1, 2020, Antalya/TURKEY
6
The Total Amount of Returns
Product returns were the most avoided procedure of the company’s customer complaint management, since it
was decreasing the profit of that sales badly. When a complaint happened and the customer insisted on sending
back the product, the company had to face with additional costs such as logistics, stocking, controlling etc.
Although the company tried to make the customer satisfied about the products or services, unfortunately, some
of the customer complaints caused product returns. In Figure 4, yearly amount of product returns in tones can be
seen in detail. In 2016, there were only 300 tones product returns however, in 2017 it increased dramatically to
890. This means in two years the amount of product returns had 296 % increase. Similarly, in 2018, the amount
of returned product increased to 1123 tones very sharply.
Figure 4. amount of returns (ton/year)
The Number of Lost Customers
In every customer complaint, unfortunately, did not end with a satisfactory solution. Some customers decided to
end the customer-supplier relationship with the company due to the unsolvable problems. In other words,
customer complaints might be a reason for the loss of customers. Figure 5 shows the yearly number of loss
customers and while in 2016 it was just 2, in 2018 it increased to 5. This increase means more than a 100 %
increase and affected the company’s economy very negatively.
Figure 5. The number of lost customers (ıtem/year)
Analyze
In this part of the project, six-sigma project team tried to understand the root causes of the customer complaints.
They came together and organized meetings with the related departments’ managers to make everything crystal
clear. If the main reasons of the complaints are clear, then it will be easier to manage all of them. Therefore, in
this section, customer complaints’ root causes were analyzed with some techniques such as fishbone diagram,
process flow chart review and grouped according to their main categories. After the meetings, the team
determined four main categories namely as quality, packaging, logistics and documentation for the customer
complaints. When the previous years’ complaints were analyzed in detail according to these categories, quality
problems were the most encountered problems. About %65 of the customer complaints occurred owing to the
quality problems such as melting point increase, different products’ contamination, humidity, viscosity, color
and shape. Afterwards, about 18% of the complaints happened because of the packaging issues. Wrong product
deliveries, damaged products, or other products’ contamination to the packages caused customers complain
300
890
1123
2016 2017 2018
2
3
5
2016 2017 2018

International Conference on Management, Economics and Business (IConMEB)
October 29–November 1, 2020, Antalya/TURKEY
7
about their unsatisfactory orders. In addition to this, some customers were not happy with the logistics process
of the company. Logistics problems led to about 16% of the complaints of the company. Under this category,
three subcategories, that were transport damage, delivery and loading, were decided by the project team.
Transportation is a critical service for a company. Transportation needs to have a good plan and careful
treatment from the first point until the last point. Sometimes, products might be damaged during transportation
or might be loaded different from the customers’ needs. These resulted in customer complaints for this
company. Additionally, deliveries to the wrong time, place or people caused similar problems. The final
category for the customer complaints was determined as documentation problems. Mostly the company’s
sharing the wrong documents, or some documents were being loss were the root causes of this type of
complaints. Table 3 shows all the categories in detail.
Table 3. Categories of the Complaints Between 2016-2018
Main Category (%) Subcategory
Quality (62)
Melting point
Contamination
Humidity
Viscosity
Color
Shape
Packaging (18)
Wrong product
Damaged product
Product
contamination
Logistics (16)
Transport damage
Delivery
Loading
Documentation (4) Wrong documents
Loss documents
Improve
After the define, measure and analyze steps of the six-sigma project, the project team organized a brainstorming
session in order to designate a to-do list to improve the defects in the system. In the brainstorming meeting,
potential solutions to the main problems were developed and the solutions were implemented accordingly.
Established solutions were like in the following;
Assigning a customer complaints coordinator and department responsible in order to restructure the
process.
Redrawing the process map.
Quality problems were analyzed in detail and special solutions were found to decrease the problems
generating from the production processes.
Supply chain department organized weekly communication meetings with the customers and sales
department in order not to miss any details about the shipments, packaging, required documents.
Packaging, documentation and logistics operations’ process maps were restructured.
Company’s customer complaints management database was reviewed, and special modules were added
in order to respond the complaints quicker.
When there was a complaint, customer satisfaction-oriented solutions were applied. For the all the employees,
customer satisfaction and communication trainings were arranged in order to raise awareness for this situation.
Project improvement actions lasted for about 4 months. In this period, the project team managed each little step
devotedly. Customer satisfaction awareness in the company increased very well with all the effort.
Control
The aim of this step was to see the effects of the improvements about customer complaint management in the
company. In every month, three main project indicators were observed and reported to the top management.
Additionally, some configurations about the procedures were planned and implemented when there was a need.
In the following Table 4, indicators’ monthly results were shared.
International Conference on Management, Economics and Business (IConMEB)
October 29–November 1, 2020, Antalya/TURKEY
8
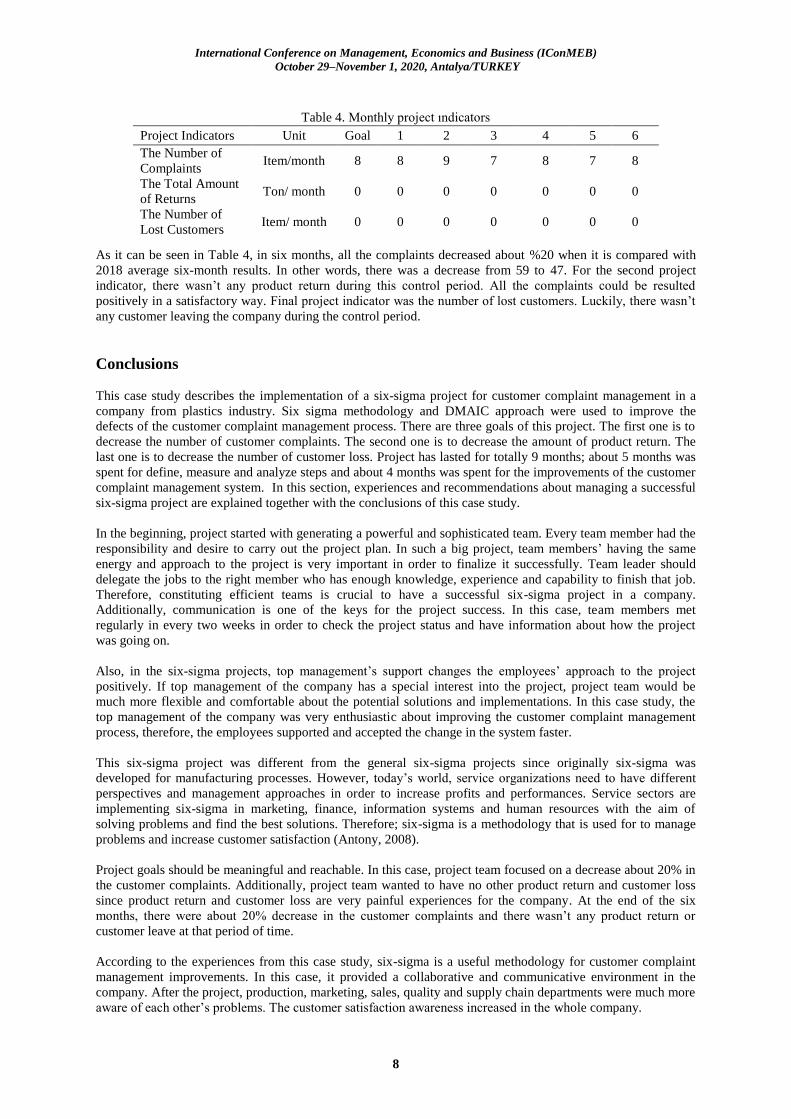
Table 4. Monthly project ındicators
As it can be seen in Table 4, in six months, all the complaints decreased about %20 when it is compared with
2018 average six-month results. In other words, there was a decrease from 59 to 47. For the second project
indicator, there wasn’t any product return during this control period. All the complaints could be resulted
positively in a satisfactory way. Final project indicator was the number of lost customers. Luckily, there wasn’t
any customer leaving the company during the control period.
Conclusions
This case study describes the implementation of a six-sigma project for customer complaint management in a
company from plastics industry. Six sigma methodology and DMAIC approach were used to improve the
defects of the customer complaint management process. There are three goals of this project. The first one is to
decrease the number of customer complaints. The second one is to decrease the amount of product return. The
last one is to decrease the number of customer loss. Project has lasted for totally 9 months; about 5 months was
spent for define, measure and analyze steps and about 4 months was spent for the improvements of the customer
complaint management system. In this section, experiences and recommendations about managing a successful
six-sigma project are explained together with the conclusions of this case study.
In the beginning, project started with generating a powerful and sophisticated team. Every team member had the
responsibility and desire to carry out the project plan. In such a big project, team members’ having the same
energy and approach to the project is very important in order to finalize it successfully. Team leader should
delegate the jobs to the right member who has enough knowledge, experience and capability to finish that job.
Therefore, constituting efficient teams is crucial to have a successful six-sigma project in a company.
Additionally, communication is one of the keys for the project success. In this case, team members met
regularly in every two weeks in order to check the project status and have information about how the project
was going on.
Also, in the six-sigma projects, top management’s support changes the employees’ approach to the project
positively. If top management of the company has a special interest into the project, project team would be
much more flexible and comfortable about the potential solutions and implementations. In this case study, the
top management of the company was very enthusiastic about improving the customer complaint management
process, therefore, the employees supported and accepted the change in the system faster.
This six-sigma project was different from the general six-sigma projects since originally six-sigma was
developed for manufacturing processes. However, today’s world, service organizations need to have different
perspectives and management approaches in order to increase profits and performances. Service sectors are
implementing six-sigma in marketing, finance, information systems and human resources with the aim of
solving problems and find the best solutions. Therefore; six-sigma is a methodology that is used for to manage
problems and increase customer satisfaction (Antony, 2008).
Project goals should be meaningful and reachable. In this case, project team focused on a decrease about 20% in
the customer complaints. Additionally, project team wanted to have no other product return and customer loss
since product return and customer loss are very painful experiences for the company. At the end of the six
months, there were about 20% decrease in the customer complaints and there wasn’t any product return or
customer leave at that period of time.
According to the experiences from this case study, six-sigma is a useful methodology for customer complaint
management improvements. In this case, it provided a collaborative and communicative environment in the
company. After the project, production, marketing, sales, quality and supply chain departments were much more
aware of each other’s problems. The customer satisfaction awareness increased in the whole company.
Project Indicators Unit Goal 1 2 3 4 5 6
The Number of
Complaints Item/month 8 8 9 7 8 7 8
The Total Amount
of Returns Ton/ month 0 0 0 0 0 0 0
The Number of
Lost Customers Item/ month 0 0 0 0 0 0 0

International Conference on Management, Economics and Business (IConMEB)
October 29–November 1, 2020, Antalya/TURKEY
9
As many of the case studies, there are some limitations in this work. Firstly, this project was implemented for
just the plastics products’ customers, other product groups’ customers were kept out of the scope. Also, this
project was conducted in a company from Turkey. If this kind of study would be repeated in another region, the
cultural or corporate differences and effects should be kept in mind.
Recommendations
For the future works, in addition to customer complaint management system, customer satisfaction
measurement system or customer communication system might be improved by the help of the six-sigma
project management approach. Additionally, for a similar case, different six-sigma tools or techniques might be
used for the measurement or analysis steps of the project.
References
Antony, J. (2006). Six sigma for service processes. Business Process Management Journal, 12(2), 234-248.
Antony, J. (2008). Can six sigma be effectively deployed in SMEs. International Journal of Productivity &
Performance Management, 57 (5), 420-423.
ASQ, (2002). The Honeywell edge. Six Sigma Forum Magazine, 1 (2), 14–17.
Barney, M., (2002). Motorola’s second generation. Six Sigma Forum Magazine, 1 (3), 13–16.
Blakeslee Jr., J.A. (1999). Implementing the Six Sigma solution. Quality Progress, 32 (7), 77–85.
Celerant Consulting, (2011 July, 16). Better services with lower opex-everyone wins. Retrieved from
http://www.celerantconsulting.com/Downloads/CaseStudies/Short/Celerant CS - Better services with
lower OPEX - everyone wins.pdf
Desai, T., & Shrivastava, R. L. (2008). Six Sigma – A new direction to quality and productivity management.
Proceedings of the World Congress on Engineering and Computer Science, ISBN: 978-988-98671-0-2.
El-Haik, B., & Roy, D. M. (2005). Service design for Six Sigma: A roadmap for excellence. Hoboken, New
Jersey: John Wiley and Sons Inc.
Erturk, M., Tuerdi, M., & Wujiabudula, A. (2016). The Effects of Six Sigma approach on business performance:
A study of white goods (home appliances) sector in Turkey. Procedia- Social and Behavioral Sciences,
229, 444 – 452.
Folaron, J. (2003). The evolution of Six Sigma. Six Sigma Forum Magazine, 2(4), 38–44.
George, M. L., Maxey, J., Rowlands, D. T., & Upton, M. (2005). The lean Six Sigma pocket toolbook: A quick
reference guide to 70 tools for improving quality and speed (p. 282). McGraw-Hill Professional.
Hahn, G.J., Doganaksoy, N., & Hoerl, R. (2000). The evolution of Six Sigma. Quality Engineering, 12(3), 317–
326.
Harry, M.J., & Schroeder, R. (2000). Six Sigma: The breakthrough management strategy revolutionizing the
world’s top corporations. Doubleday, New York.
Kansal J., & Singhal S. (2017). Application and validation of dmaic six sigma tool for enhancing customer
satisfaction in a government r&d organization. International Journal for Quality Research, 11(4) 931–
944.
Kumar, M., Antony, J., Antony, F. J., & Madu, C. N. (2007). Winning customer loyalty in an automotive
company through Six Sigma: A case study. Online, 849-866.
Liebermann, G. (2011). Apply Six Sigma for process improvement and problem-solving. Chemical Engineering
Progress, (March), 53- 60.
Linderman K., Schroeder R., Zaheer S., & Choo A. (2003). Six Sigma: A goal-theoretic perspective. Journal of
Operations Management, 21(2):193–203.
Nonthaleerak, P., & Hendry, L. (2006). Six Sigma: literature review and key future research areas. Operations
Management, 2(2), 105- 161.
Noone, B. M., Namasivayam, K., & Tomlinson, H. S. (2010). Examining the application of six sigma in the
service exchange. Managing Service Quality, 20(3), 273-293.
Pepper, M. P. J., & Spedding, T. A. (2010). The evolution of lean Six Sigma. International Journal of Quality
Reliability Management, 27(2), 138-155.
Pestorius M., S. (2007). Apply Six Sigma to sales and marketing. Quality Progress, 1, 19-24.
Riesenberger, C., & Sousa, S., D. (2010). Application of the Six Sigma methodology in customer complaints
management. Proceedings of the 21st Annual conference of the Production and Operations
Management Society, 22.
Slater, R. (1999). Jack Welch and the GE Way: Management Insights and Leadership Secrets of the Legendary
CEO. McGraw-Hill, New York.

International Conference on Management, Economics and Business (IConMEB)
October 29–November 1, 2020, Antalya/TURKEY
10
The Performance Management Group LLC. (2006, July 16). Who we’ve helped. Retrieved from
http://www.helpingmakeithappen.com/
Turkan Y. S., Manisalı E., & Celikkol M.F. (2009). Evaluation of critical success factors effect on Six Sigma
project success in Turkey’s manufacturing sector. Journal of Engineering and Natural Sciences, 27,
105-117.
Author Information Gulsah Sisman Cukurova University
Institute of Social Sciences,
Rectorate 01330, Sarıcam/Adana, Turkey
E-mail: [email protected]
Fatma Demirci Orel Cukurova University Faculty of Economics and Administrative Sciences,
Department of Business Administration
Rectorate 01330, Sarıcam/Adana, Turkey

The Eurasia Proceedings of
Educational & Social Sciences (EPESS)
ISSN: 2587-1730
- This is an Open Access article distributed under the terms of the Creative Commons Attribution-Noncommercial 4.0 Unported License,permitting all non-commercial use, distribution, and reproduction in any medium, provided the original work is properly cited.
- Selection and peer-review under responsibility of the Organizing Committee of the Conference
© 2020 Published by ISRES Publishing: www.isres.org
The Eurasia Proceedings of Educational & Social Sciences (EPESS), 2020
Volume 19, Pages 11-22
IConMEB 2020: International Conference on Management, Economics and Business
Model Design Supplier Relationship Performance Measurement
Rizki Prakasa HASIBUAN
University of Putera Batam
Elisa KUSRINI
Islamic University of Indonesia
Abstract:One way to maintain a position is how to meet customer satisfaction in a business-to-business
context and build buyer-supplier relationships. There are many factors that influence customer satisfaction in the
context of business to business and build buyer-supplier relationships. This paper aims to design a more
comprehensive supplier relationship performance measurement (SRPM) model with the buyer's perspective and
the supplier's perspective. The proposed SRPM model to make it easier for manufacturing companies to
measure the performance of the established buyer-supplier relationship. The research method uses interviews
and questionnaires to supply chain actors in manufacturing companies and validated by supply chain
management experts. The resulting design model for measuring SRPM uses several factors including cost,
quality, lead-time, flexibility, trust, power, transparency, communication, commitment, economic sustainable,
social sustainable and environmentally sustainable. The proposed model is implemented directly into
manufacturing companies using the Analitycal Hirarchy Process (AHP) method. The results obtained look at the
total final value of the supplier-buyer relationship and do the mapping with the SRPM matrix model.
Keywords: Supplier, Supplier relationship performance measurement, SRPM, Supplier relationship
management, AHP
Introduction
In today's competitive world, companies are constantly trying to make progress and maintain their current
position (Beikkhakhian et al., 2015). One of the ways to maintain position is how to meet customer satisfaction
in business to business and build supplier - supplier relationships. There are many factors that influence
customer satisfaction in a business-to-business context and building supplier-supplier relationships (Rajagopall
et al., 2009). According to Oghazi et al (2016) Supplier Relationship Management is a Supply Chain
Management concept that can help achieve a competitive advantage.
Supplier Relationship Management is a way for buyers and suppliers to seek competitive advantages in the
market, utilizing reciprocal resources as a result of supplier-buyer formation (Amoako-Gyampah et al., 2019).
SRM is the management of directed relationships between buyers and suppliers in quality, quantity, and
inventory on time. For this purpose, supplier relationship performance measurement (SRPM) is defined as one
of the metrics used to measure SRM performance.
It is important to measure the performance of the supplier relationship for relationship development and increase
trust. SRPM from a buyer-supplier perspective. Much of the literature on traditional models is based on a buyer
perspective, such as evaluation. According to Damlin et al (2012) how to assess buyer-supplier performance by
linking indicators and traditional relationships.
This paper aims to design a more comprehensive SRPM model developed by Damlin et al (2012). The SRPM
model is based on the perspective of buyers and suppliers with traditional relationship indicators to see supplier
relationship performance. In general, the relationship that the buyer-supplier wants to achieve is the closeness

International Conference on Management Economics and Business (IConMEB)
October 29–November 1, 2020, Antalya/TURKEY
12
between the buyer-supplier in competitive global competition. This study produces a SRPM model and an
increase in performance from the results of calculations using the AHP method. The results of this study serve
as a basis for consideration of supplier companies to improve supplier relationship performance.
Method
This research consists of several stages. Stage 1, a literature review containing a literature review of the research
by Damlin, 2012; Johnson, 2015 for the SRPM model. Phase 2, building a new model. This stage provides
additional criteria and develops a model with two perspectives, namely a buyer perspective and a supplier
perspective with the aim of building a more comprehensive model. Stage 3, Model Validation. This stage is
carried out by testing and validating the new model that has been obtained by conducting interviews with
several experts. This is done to verify the new model that has been formed. Stage 4. Case study. This stage is an
implementation of an existing model to be applied directly in the field. Stage 5. Results and Conclusions. This
stage describes the new model and implementation results in the company.
Results and Discussion
The framework used is the Damlin model linking traditional KPIs with KPI relationships to measure supplier-
buyer relationships. The Damlin model has several factors that influence the supplier-buyer relationship, the
factors in the supplier-buyer relationship can be seen in Figure 1.
Figure 1. SRPM framework damlin (Damlin, 2012)
Damlin's model connects two categories of traditional KPIs and a relationship that uses only buyer perceptions.
This study provides a more compensation model by linking traditional KPIs and relationships using a supplier-
buyer approach. There are many criteria or factors that influence this relationship, the relationship criteria used
in this SRPM model are criteria that broadly affect a relationship (Damlin, 2012). Supplier Relationship
Performance Measurement is a performance measurement in supplier-buyer relationships with several activities
including developing a relationship measurement model to identify actual and supplier-buyer perceptions,
measure, and monitor and evaluate (Thanh Ha, 2015). The following is a proposed framework for Supplier
Relationship Performance Measurement as shown in Figure 2.
Figure 2. SRPM framework
The proposed SRPM framework is more comprehensive because it uses supplier-buyer perceptions and
proposes sustainability criteria. The criteria for sustainability are proposed because the supplier-buyer company
has adopted a sustainable management strategy. Sustainability proposed in the SRPM model integrates supplier-
buyer sustainability strategy and evaluates sustainable performance to achieve supplier-buyer goals.

Inte
rna
tion
al
Co
nfe
ren
ce o
n M
an
ag
emen
t E
con
om
ics
an
d B
usi
nes
s (I
Co
nM
EB
)
Oct
ob
er 2
9–
No
vem
ber
1, 20
20
, A
nta
lya
/TU
RK
EY
Tab
le 1
. M
od
el s
up
pli
er r
elat
ionsh
ip p
efo
rman
ce m
easu
rem
ent
bu
yer
sat
isfa
ctio
n
Cat
ego
ry
Cri
teri
a
Ind
icat
or
Sca
le 1
S
cale
2
Sca
le 3
S
cale
4
Sca
le 5
Tra
dit
ional
(Dam
lin e
t a
l.,
20
12)
Co
st
(Tah
erdo
ost
et
al.
, 2
019
.,
Cer
na
et a
l.,
20
16
,
Gan
gurd
e et
al.
, 2
015
)
Pro
duct
Pri
ce
20
%
>O
E
10
% >
OE
O
E
10
% <
OE
2
0%
<O
E
Qual
ity
(Tah
erdo
ost
et
al.
, 2
019
.,
Cer
na
et a
l.,
20
16
.,
Gan
gurd
e et
al.
, 2
015
)
Qual
ity P
rod
uct
3
0%
def
ecti
ve
go
od
s
20
% d
efec
tive
go
od
s
10
% d
efec
tive
go
od
s
5%
def
ecti
ve
go
od
s
0%
def
ecti
ve
go
od
s
Lea
d-t
ime
(Tah
erdo
ost
et
al.
, 2
019
.,
Cer
na
et a
l.,
20
16
)
Pro
duct
Del
iver
y
20
%-5
0%
lat
e
del
iver
y d
uri
ng t
he
contr
act
per
iod
20
% l
ate
del
iver
y
duri
ng t
he
con
trac
t
per
iod
10
% l
ate
del
iver
y
duri
ng t
he
con
trac
t
per
iod
So
me
item
s ar
e o
n
sched
ule
, so
me
item
s ar
e la
te
As
per
the
agre
ed
sched
ule
duri
ng
the
contr
act
per
iod
Fle
xib
ilit
y
(Kurn
iaw
an e
t a
l.,
20
17
.,
Cer
na
et a
l.,
20
16
)
Pro
duct
ion
Cap
acit
y
No
t fl
exib
le o
nly
acco
rdin
g t
o t
he
avai
lab
le c
apac
ity
Fle
xib
le 1
0%
of
the
avai
lab
le
cap
acit
y
Fle
xib
le 2
0%
of
the
avai
lab
le
cap
acit
y
Fle
xib
le 2
0%
-50
%
of
the
avai
lab
le
cap
acit
y
Fle
xib
le >
50
% o
f
the
avai
lab
le
cap
acit
y
Rel
atio
nsh
ip
(Dam
lin e
t a
l.,
20
12)
Tru
st
(Gra
ca e
t a
l., 2
015
.,
Ban
dar
a et
al.
, 2
016
.,
Yo
on e
t a
l.,
201
9)
So
lvin
g P
rob
lem
D
istr
ust
in
over
com
ing
exis
tin
g p
rob
lem
s
Co
nfi
den
ce i
n
solv
ing p
rob
lem
s
is l
imit
ed t
o
pro
ble
ms
acco
rdin
g t
o t
he
inte
rest
s o
f th
e
sup
pli
er /
bu
yer
(cal
cula
tive)
Co
nfi
den
ce t
o
solv
e th
e sa
me
pro
ble
m,
and
no
thin
g m
ore
than
the
exis
tin
g
pro
ble
m
(co
gnit
ive)
Tru
st i
n
over
com
ing
com
mo
n p
rob
lem
s
in t
he
form
of
gen
eral
pro
ble
ms
in t
he
form
of
com
mo
n v
iew
s,
exp
ecta
tio
ns,
and
resp
onsi
bil
itie
s
that
have
bee
n
mu
tual
ly a
gre
ed
up
on (
no
rmat
ive)
Tru
st i
n
over
com
ing a
ll
exis
tin
g i
nte
rnal
and
exte
rnal
pro
ble
ms
such a
s
finan
cial
pro
ble
ms,
sup
ply
chai
n p
rob
lem
s o
f
sup
pli
ers
/ b
uyer
s
wh
ich a
re
char
acte
rize
d b
y
alw
ays
kee
pin
g
pro
mis
es.
13

Inte
rna
tion
al
Co
nfe
ren
ce o
n M
an
ag
emen
t E
con
om
ics
an
d B
usi
nes
s (I
Co
nM
EB
)
Oct
ob
er 2
9–
No
vem
ber
1, 20
20
, A
nta
lya
/TU
RK
EY
Cat
ego
ry
Cri
teri
a
Ind
icat
or
Sca
le 1
S
cale
2
Sca
le 3
S
cale
4
Sca
le 5
Po
wer
(Dam
lin e
t a
l.,
20
12.
Ban
dar
a et
al.
, 2
016
)
Rep
uta
tio
n
Bra
nd
ing
The
po
wer
of
sup
pli
ers
in
bra
nd
ing i
s th
at
bu
yer
s d
epen
d o
n
sup
pli
ers
on
stan
dar
d g
oo
ds.
The
po
wer
of
sup
pli
ers
in
bra
nd
ing i
s th
at
bu
yer
s d
epen
d o
n
sup
pli
ers
on
crit
ical
go
od
s.
Bal
ance
of
sup
pli
er-b
uyer
bra
nd
rep
uta
tio
n
so t
hat
it
is
inte
rdep
end
ent.
The
dep
end
ence
of
sup
pli
ers
in s
elli
ng
stan
dar
d g
oo
ds.
Str
ong b
uyer
's
bra
nd
rep
uta
tio
n
so t
hat
sup
pli
ers
dep
end
on b
uyer
s
for
crit
ical
go
od
s.
Tra
nsp
aran
cy
(Gar
dner
et
al,
20
19
,
Gyam
pah e
t al
., 2
01
9)
Info
rmati
on a
nd
Dec
isio
ns
Ther
e is
no
tran
spar
ency i
n
shar
ing
info
rmat
ion o
r
pro
vid
ing
info
rmat
ion t
o
par
ties
who
nee
d
info
rmat
ion
Lim
ited
tran
spar
ency o
f
sup
pli
er-b
uyer
exte
rnal
nee
ds
(sal
es t
arget
s)
Tra
nsp
aren
cy i
s
lim
ited
to
the
nee
ds
of
the
sup
pli
er /
bu
yer
(no
thin
g m
ore
)
and
is
rele
vant
to
the
sup
pli
er-b
uyer
rela
tio
nsh
ip.
Tra
nsp
aren
cy o
f
inte
rnal
and
exte
rnal
info
rmat
ion i
s
lim
ited
to
bu
yer
sup
pli
er
rela
tio
nsh
ips
such
as l
ogis
tics
, b
uyin
g
/ se
llin
g,
and
pro
duct
ion /
op
erat
ions
sched
ule
s.
Full
tra
nsp
aren
cy
in p
rovid
ing
info
rmat
ion
wit
ho
ut
rest
rict
ions
such a
s
com
pan
y
obje
ctiv
es,
cust
om
er
info
rmat
ion a
nd
mar
ket
ing.
Co
mm
unic
ati
on
(Gra
ca e
t a
l., 2
015
., V
os
et
al.
, 2
01
6.,
Mae
stri
ni
et a
l.,
20
18)
Co
mm
unic
ati
on
Qual
ity
Can
no
t b
e re
ached
exce
pt
in p
erso
n.
Dif
ficult
to
conta
ct,
thro
ug
h
man
y t
erra
ins
and
long w
aiti
ng t
imes
.
Eas
y t
o c
onta
ct,
ver
y l
on
g w
aiti
ng
tim
e.
Co
nta
ctab
le o
nly
by e
mai
l, a
nd
on
tim
e.
Eas
y t
o c
onta
ct b
y
pho
ne,
cel
l p
ho
ne,
fax,
em
ail
or
web
site
, go
od
resp
onse
, ti
mely
and
co
nsi
der
ate.
Co
mm
itm
ent
(Gra
ca e
t a
l., 2
015
., Y
oo
n
et a
l.,
201
9., B
and
ara
et
al.
, 2
01
6)
Lo
ng t
erm
Rel
atio
nsh
ip
Dis
com
mit
ted
,
irre
spo
nsi
ble
, an
d
dis
loyal
.
Mak
e d
eals
but
do
n't
com
mit
.
Co
mm
itte
d t
o
agre
ed g
oal
s,
irre
spo
nsi
ble
,
dis
loyal
.
Co
mm
it t
o a
gre
ed
go
als
and
be
resp
onsi
ble
.
Full
y c
om
mit
ted
to
real
izin
g a
gre
ed
go
als,
res
po
nsi
ble
and
lo
yal
.
14
Inte
rna
tion
al
Co
nfe
ren
ce o
n M
an
ag
emen
t E
con
om
ics
an
d B
usi
nes
s (I
Co
nM
EB
)
Oct
ob
er 2
9–
No
vem
ber
1, 20
20
, A
nta
lya
/TU
RK
EY
Cat
ego
ry
Cri
teri
a
Ind
icat
or
Sca
le 1
S
cale
2
Sca
le 3
S
cale
4
Sca
le 5
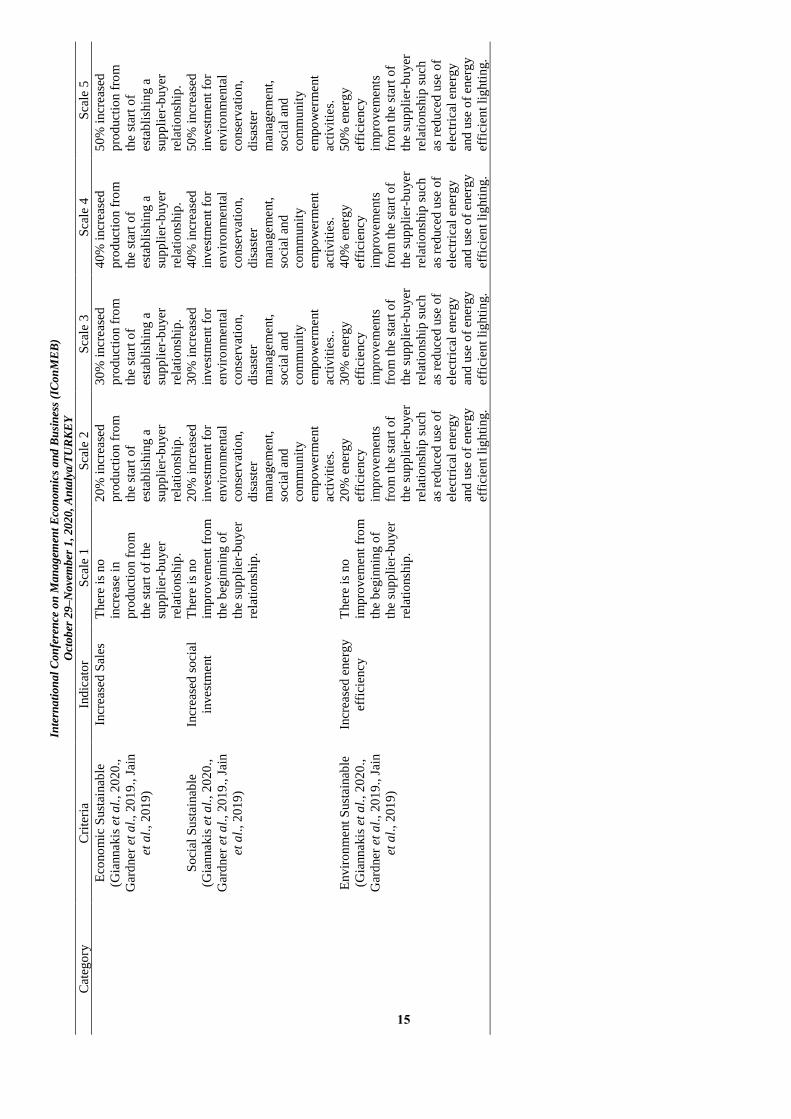
Eco
no
mic
Sust
ainab
le
(Gia
nnakis
et
al.
, 2
020
.,
Gar
dner
et
al.
, 20
19
., J
ain
et a
l.,
201
9)
Incr
ease
d S
ales
T
her
e is
no
incr
ease
in
pro
duct
ion f
rom
the
star
t o
f th
e
sup
pli
er-b
uyer
rela
tio
nsh
ip.
20
% i
ncr
ease
d
pro
duct
ion f
rom
the
star
t o
f
esta
bli
shin
g a
sup
pli
er-b
uyer
rela
tio
nsh
ip.
30
% i
ncr
ease
d
pro
duct
ion f
rom
the
star
t o
f
esta
bli
shin
g a
sup
pli
er-b
uyer
rela
tio
nsh
ip.
40
% i
ncr
ease
d
pro
duct
ion f
rom
the
star
t o
f
esta
bli
shin
g a
sup
pli
er-b
uyer
rela
tio
nsh
ip.
50
% i
ncr
ease
d
pro
duct
ion f
rom
the
star
t o
f
esta
bli
shin
g a
sup
pli
er-b
uyer
rela
tio
nsh
ip.
So
cial
Su
stai
nab
le
(Gia
nnakis
et
al.
, 2
020
.,
Gar
dner
et
al.
, 20
19
., J
ain
et a
l.,
201
9)
Incr
ease
d s
oci
al
invest
ment
Ther
e is
no
imp
rovem
ent
fro
m
the
beg
inn
ing o
f
the
sup
pli
er-b
uyer
rela
tio
nsh
ip.
20
% i
ncr
ease
d
invest
ment
for
envir
on
menta
l
conse
rvat
ion,
dis
aste
r
man
agem
ent,
soci
al a
nd
com
mu
nit
y
em
po
wer
ment
acti
vit
ies.
30
% i
ncr
ease
d
invest
ment
for
envir
on
menta
l
conse
rvat
ion,
dis
aste
r
man
agem
ent,
soci
al a
nd
com
mu
nit
y
em
po
wer
ment
acti
vit
ies.
.
40
% i
ncr
ease
d
invest
ment
for
envir
on
menta
l
conse
rvat
ion,
dis
aste
r
man
agem
ent,
soci
al a
nd
com
mu
nit
y
em
po
wer
ment
acti
vit
ies.
50
% i
ncr
ease
d
invest
ment
for
envir
on
menta
l
conse
rvat
ion,
dis
aste
r
man
agem
ent,
soci
al a
nd
com
mu
nit
y
em
po
wer
ment
acti
vit
ies.
Envir
on
ment
Sust
ainab
le
(Gia
nnakis
et
al.
, 2
020
.,
Gar
dner
et
al.
, 20
19
., J
ain
et a
l.,
201
9)
Incr
ease
d e
ner
gy
effi
cien
cy
Ther
e is
no
imp
rovem
ent
fro
m
the
beg
inn
ing o
f
the
sup
pli
er-b
uyer
rela
tio
nsh
ip.
20
% e
ner
gy
effi
cien
cy
imp
rovem
ents
fro
m t
he
star
t o
f
the
sup
pli
er-b
uyer
rela
tio
nsh
ip s
uch
as r
educe
d u
se o
f
elec
tric
al e
ner
gy
and
use
of
ener
gy
effi
cien
t li
ghti
ng.
30
% e
ner
gy
effi
cien
cy
imp
rovem
ents
fro
m t
he
star
t o
f
the
sup
pli
er-b
uyer
rela
tio
nsh
ip s
uch
as r
educe
d u
se o
f
elec
tric
al e
ner
gy
and
use
of
ener
gy
effi
cien
t li
ghti
ng.
40
% e
ner
gy
effi
cien
cy
imp
rovem
ents
fro
m t
he
star
t o
f
the
sup
pli
er-b
uyer
rela
tio
nsh
ip s
uch
as r
educe
d u
se o
f
elec
tric
al e
ner
gy
and
use
of
ener
gy
effi
cien
t li
ghti
ng.
50
% e
ner
gy
effi
cien
cy
imp
rovem
ents
fro
m t
he
star
t o
f
the
sup
pli
er-b
uyer
rela
tio
nsh
ip s
uch
as r
educe
d u
se o
f
elec
tric
al e
ner
gy
and
use
of
ener
gy
effi
cien
t li
ghti
ng.
15

Inte
rna
tion
al
Co
nfe
ren
ce o
n M
an
ag
emen
t E
con
om
ics
an
d B
usi
nes
s (I
Co
nM
EB
)
Oct
ob
er 2
9–
No
vem
ber
1, 20
20
, A
nta
lya
/TU
RK
EY
Tab
le 2
. M
od
el s
up
pli
er r
elat
ionsh
ip p
efo
rman
ce m
easu
rem
ent
sup
pli
er s
atis
fact
ion
Cat
ego
ry
Cri
teri
a
Ind
icat
or
Sca
le 1
S
cale
2
Sca
le 3
S
cale
4
Sca
le 5
Tra
dit
ional
(Dam
lin e
t a
l.,
20
12)
Co
st
(Asi
f e
t a
l.,
20
19
.,
Cer
na
et a
l.,
20
16
Tah
erd
oo
st e
t a
l.,
20
19
., G
angurd
e et
al.
,
20
15)
Pro
duct
Pri
ce
20
%
> O
wn
Est
imate
10
% >
Ow
n E
stim
ate
Ow
n E
stim
ate
10
% <
Ow
n E
stim
ate
20
% <
Ow
n E
stim
ate
Qual
ity
(Vo
s et
al.
, 2
01
6.,
Cer
na
et a
l.,
20
16
.,
Tah
erd
oo
st e
t a
l.,
20
19
., G
angurd
e et
al.
,
20
15)
Purc
has
ing
Ord
er
Duri
ng t
he
purc
hase
contr
act
per
iod
,
ther
e is
alw
ays
a
chan
ge
of
> 5
0%
fro
m t
he
init
ial
purc
has
e am
ou
nt
agre
ed u
po
n f
rom
the
beg
inn
ing o
f th
e
contr
act.
Duri
ng t
he
purc
hase
contr
act
per
iod
, th
ere
is a
lways
a ch
ange
of
20
% -
50
% f
rom
the
init
ial
purc
has
e
am
ou
nt
agre
ed u
po
n
fro
m t
he
beg
innin
g o
f
the
contr
act.
.
Duri
ng t
he
purc
hase
contr
act
per
iod
, th
ere
is a
lways
a ch
ange
of
20
% f
rom
the
init
ial
purc
has
e am
ou
nt
agre
ed u
po
n f
rom
the
beg
innin
g o
f th
e
contr
act.
Duri
ng t
he
purc
hase
contr
act
per
iod
, th
ere
is a
lways
a ch
ange
of
10
% f
rom
the
init
ial
purc
has
e am
ou
nt
agre
ed u
po
n f
rom
the
beg
innin
g o
f th
e
contr
act.
Ver
y g
oo
d,
as l
ong a
s
the
purc
hase
co
ntr
act
per
iod
is
fixed
/ t
her
e
is n
o c
han
ge
acco
rdin
g t
o t
he
nu
mb
er o
f p
urc
hase
s
per
mo
nth
that
has
bee
n a
gre
ed s
ince
the
beg
innin
g o
f th
e
contr
act.
Lea
d-t
ime
(Tah
erdo
ost
et
al.
,
20
19
., C
erna
et a
l.,
20
16
., G
angurd
e et
al.
,
20
15
.)
Pay
men
t >
50
% l
ate
pay
ment
duri
ng t
he
con
trac
t
per
iod
or
mo
re t
han
6 t
imes
lat
e d
uri
ng
the
contr
act
per
iod
.
20
-50
% l
ate
pay
ment
duri
ng t
he
con
trac
t
per
iod
or
mo
re t
han 2
-
6 t
imes
lat
e d
uri
ng t
he
contr
act
per
iod
20
% l
ate
pay
ment
duri
ng t
he
con
trac
t
per
iod
or
mo
re t
han 2
tim
es
late
duri
ng t
he
contr
act
per
iod
10
% l
ate
pay
ment
duri
ng t
he
con
trac
t
per
iod
or
mo
re t
han 1
tim
es
late
duri
ng t
he
contr
act
per
iod
.
Acc
ord
ing t
o t
he
agre
ed s
ched
ule
ever
y m
onth
duri
ng
the
contr
act
per
iod
.
Fle
xib
ilit
y
(Exp
ert,
20
19
,
Gyam
pah e
t al
., 2
01
9.,
Cer
na
et a
l.,
20
16
)
Pro
duct
Del
iver
y
No
t fl
exib
le i
n
ship
pin
g p
rod
uct
s
wit
h v
aryin
g
quan
titi
es,
mu
st b
e
acco
rdin
g t
o t
he
agre
ed s
ched
ule
.
10
% f
lexib
le d
eliv
ery
wit
h v
aryin
g q
uan
titi
es
or
10
% f
aste
r d
eliv
ery
of
pro
duct
s ac
cord
ing
to t
he
pre
det
erm
ined
sched
ule
fo
r ea
ch
ship
men
t.
20
% f
lexib
le d
eliv
ery
wit
h v
aryin
g
quan
titi
es o
r 2
0%
fast
er d
eliv
ery o
f
pro
duct
s ac
cord
ing t
o
the
pre
det
erm
ined
sched
ule
fo
r ea
ch
ship
men
t.
50
% f
lexib
le d
eliv
ery
wit
h v
aryin
g
quan
titi
es o
r 5
0%
fast
er d
eliv
ery o
f
pro
duct
s ac
cord
ing t
o
the
pre
det
erm
ined
sched
ule
fo
r ea
ch
ship
men
t.
Fle
xib
le i
n d
eliv
ery
of
var
iou
s q
uan
titi
es
duri
ng t
he
con
trac
t
per
iod
.
16

Inte
rna
tion
al
Co
nfe
ren
ce o
n M
an
ag
emen
t E
con
om
ics
an
d B
usi
nes
s (I
Co
nM
EB
)
Oct
ob
er 2
9–
No
vem
ber
1, 20
20
, A
nta
lya
/TU
RK
EY
Cat
ego
ry
Cri
teri
a
Ind
icat
or
Sca
le 1
S
cale
2
Sca
le 3
S
cale
4
Sca
le 5
Rel
atio
nsh
ip
(Dam
lin e
t a
l.,
20
12)
Tru
st
(Gra
ca e
t a
l., 2
015
.,
Ban
dar
a et
al.
, 2
016
.,
Yo
on e
t a
l.,
201
9)
So
lvin
g
Pro
ble
m
Dis
tru
st i
n
over
com
ing e
xis
tin
g
pro
ble
ms
Co
nfi
den
ce i
n s
olv
ing
pro
ble
ms
is l
imit
ed t
o
pro
ble
ms
acco
rdin
g t
o
the
inte
rest
s o
f th
e
sup
pli
er /
bu
yer
(cal
cula
tive)
Co
nfi
den
ce t
o s
olv
e
the
sam
e p
rob
lem
,
and
no
thin
g m
ore
than
the
exis
tin
g
pro
ble
m (
cognit
ive)
Tru
st i
n o
ver
com
ing
com
mo
n p
rob
lem
s in
the
form
of
gener
al
pro
ble
ms
in t
he
form
of
com
mo
n v
iew
s,
exp
ecta
tio
ns,
and
resp
onsi
bil
itie
s th
at
hav
e b
een m
utu
ally
agre
ed u
po
n
(no
rmat
ive)
Tru
st i
n o
ver
com
ing
all
exis
tin
g i
nte
rnal
and
exte
rnal
pro
ble
ms
such a
s
finan
cial
pro
ble
ms,
sup
ply
chai
n
pro
ble
ms
of
sup
pli
ers
/ b
uyer
s w
hic
h a
re
char
acte
rize
d b
y
alw
ays
kee
pin
g
pro
mis
es.
Po
wer
(Dam
lin e
t a
l.,
20
12.
Ban
dar
a et
al.
, 2
016
)
Rep
uta
tio
n
Bra
nd
ing
The
po
wer
of
bu
yer
s in
bra
nd
ing
is t
hat
sup
pli
ers
dep
end
on b
uyer
s
on s
tand
ard
go
od
s.
The
po
wer
of
bu
yer
s
in b
rand
ing i
s th
at
sup
pli
ers
dep
end
on
bu
yer
s o
n c
riti
cal
go
od
s.
Bal
ance
of
sup
pli
er-
bu
yer
bra
nd
rep
uta
tio
n s
o t
hat
it i
s
inte
rdep
end
ent.
The
dep
end
ence
of
bu
yer
s in
sel
lin
g
stan
dar
d g
oo
ds.
Str
ong s
up
pli
ers
bra
nd
rep
uta
tio
n s
o
that
bu
yer
s d
epen
d
on s
up
pli
ers
for
crit
ical
go
od
s.
Tra
nsp
aran
cy
(Gar
dner
et
al,
20
19
,
Gyam
pah e
t al
., 2
01
9)
Info
rmati
on
and
Dec
isio
ns
Ther
e is
no
tran
spar
ency i
n
shar
ing i
nfo
rmat
ion
or
pro
vid
ing
info
rmat
ion t
o
par
ties
who
nee
d
info
rmat
ion
Lim
ited
tra
nsp
aren
cy
of
sup
pli
er-b
uyer
exte
rnal
nee
ds
(sal
es
targ
ets)
Tra
nsp
aren
cy i
s
lim
ited
to
the
nee
ds
of
the
sup
pli
er /
bu
yer
(no
thin
g m
ore
) an
d i
s
rele
van
t to
the
sup
pli
er-b
uyer
rela
tio
nsh
ip.
Tra
nsp
aren
cy o
f
inte
rnal
and
exte
rnal
info
rmat
ion i
s li
mit
ed
to b
uyer
sup
pli
er
rela
tio
nsh
ips
such
as
logis
tics,
bu
yin
g /
sell
ing,
and
pro
duct
ion /
op
erat
ions
sched
ule
s.
Full
tra
nsp
aren
cy i
n
pro
vid
ing
info
rmat
ion w
itho
ut
rest
rict
ions
such a
s
com
pan
y o
bje
ctiv
es,
cust
om
er i
nfo
rmat
ion
and
mar
keti
ng.
Co
mm
unic
ati
on
(Gra
ca e
t a
l., 2
015
.,
Vo
s et
al.
, 2
01
6.,
Mae
stri
ni
et a
l.,
20
18
)
Co
mm
unic
ati
on
Qual
ity
Can
no
t b
e re
ached
exce
pt
in p
erso
n.
Dif
ficult
to
co
nta
ct,
thro
ugh m
an
y t
erra
ins
and
lo
ng w
aiti
ng
tim
es.
Eas
y t
o c
onta
ct,
ver
y
long w
aiti
ng t
ime.
Co
nta
ctab
le o
nly
by
em
ail,
and
on t
ime.
Eas
y t
o c
onta
ct b
y
pho
ne,
cel
l p
ho
ne,
fax,
em
ail
or
web
site
,
go
od
res
po
nse
,
tim
ely a
nd
consi
der
ate.
17

Inte
rna
tion
al
Co
nfe
ren
ce o
n M
an
ag
emen
t E
con
om
ics
an
d B
usi
nes
s (I
Co
nM
EB
)
Oct
ob
er 2
9–
No
vem
ber
1, 20
20
, A
nta
lya
/TU
RK
EY
Cat
ego
ry
Cri
teri
a
Ind
icat
or
Sca
le 1
S
cale
2
Sca
le 3
S
cale
4
Sca
le 5
Co
mm
itm
ent
(Gra
ca e
t a
l., 2
015
.,
Yo
on e
t a
l.,
201
9.,
Ban
dar
a et
al.
, 2
016
)
Lo
ng t
erm
Rel
atio
nsh
ip
Dis
com
mit
ted
,
irre
spo
nsi
ble
, an
d
dis
loyal
.
Mak
e d
eals
but
do
n't
com
mit
.
Co
mm
itte
d t
o a
gre
ed
go
als,
irr
esp
onsi
ble
,
dis
loyal
.
Co
mm
it t
o a
gre
ed
go
als
and
be
resp
onsi
ble
.
Full
y c
om
mit
ted
to
real
izin
g a
gre
ed
go
als,
res
po
nsi
ble
and
lo
yal
.
Eco
no
mic
Sust
ainab
le
(Gia
nnakis
et
al.
,
20
20
., G
ard
ner
et
al.
,
20
19
., J
ain e
t a
l., 2
019
)
Incr
ease
d
Sal
es
Ther
e is
no
incr
ease
in p
rod
uct
ion f
rom
the
star
t o
f th
e
sup
pli
er-b
uyer
rela
tio
nsh
ip.
20
% i
ncr
ease
d
pro
duct
ion f
rom
the
star
t o
f es
tab
lish
ing a
sup
pli
er-b
uyer
rela
tio
nsh
ip.
30
% i
ncr
ease
d
pro
duct
ion f
rom
the
star
t o
f es
tab
lish
ing a
sup
pli
er-b
uyer
rela
tio
nsh
ip.
40
% i
ncr
ease
d
pro
duct
ion f
rom
the
star
t o
f es
tab
lish
ing a
sup
pli
er-b
uyer
rela
tio
nsh
ip.
50
% i
ncr
ease
d
pro
duct
ion f
rom
the
star
t o
f es
tab
lish
ing a
sup
pli
er-b
uyer
rela
tio
nsh
ip.
So
cial
Su
stai
nab
le
(Gia
nnakis
et
al.
,
20
20
., G
ard
ner
et
al.
,
20
19
., J
ain e
t a
l., 2
019
)
Incr
ease
d
soci
al
invest
ment
Ther
e is
no
imp
rovem
ent
fro
m
the
beg
inn
ing o
f th
e
sup
pli
er-b
uyer
rela
tio
nsh
ip.
20
% i
ncr
ease
d
invest
ment
for
envir
on
menta
l
conse
rvat
ion,
dis
aste
r
man
agem
ent,
so
cial
and
co
mm
unit
y
em
po
wer
ment
acti
vit
ies.
30
% i
ncr
ease
d
invest
ment
for
envir
on
menta
l
conse
rvat
ion,
dis
aste
r
man
agem
ent,
so
cial
and
co
mm
unit
y
em
po
wer
ment
acti
vit
ies.
.
40
% i
ncr
ease
d
invest
ment
for
envir
on
menta
l
conse
rvat
ion,
dis
aste
r
man
agem
ent,
so
cial
and
co
mm
unit
y
em
po
wer
ment
acti
vit
ies.
50
% i
ncr
ease
d
invest
ment
for
envir
on
menta
l
conse
rvat
ion,
dis
aste
r
man
agem
ent,
so
cial
and
co
mm
unit
y
em
po
wer
ment
acti
vit
ies.
Envir
on
ment
Sust
ainab
le
(Gia
nnakis
et
al.
,
20
20
., G
ard
ner
et
al.
,
20
19
., J
ain e
t a
l., 2
019
)
Incr
ease
d
ener
gy
effi
cien
cy
Ther
e is
no
imp
rovem
ent
fro
m
the
beg
inn
ing o
f th
e
sup
pli
er-b
uyer
rela
tio
nsh
ip.
20
% e
ner
gy e
ffic
iency
imp
rovem
ents
fro
m
the
star
t o
f th
e
sup
pli
er-b
uyer
rela
tio
nsh
ip s
uch a
s
red
uce
d u
se o
f
elec
tric
al e
ner
gy a
nd
use
of
ener
gy e
ffic
ient
lig
hti
ng.
30
% e
ner
gy
effi
cien
cy
imp
rovem
ents
fro
m
the
star
t o
f th
e
sup
pli
er-b
uyer
rela
tio
nsh
ip s
uch a
s
red
uce
d u
se o
f
elec
tric
al e
ner
gy a
nd
use
of
ener
gy
effi
cien
t li
ghti
ng.
40
% e
ner
gy
effi
cien
cy
imp
rovem
ents
fro
m
the
star
t o
f th
e
sup
pli
er-b
uyer
rela
tio
nsh
ip s
uch a
s
red
uce
d u
se o
f
elec
tric
al e
ner
gy a
nd
use
of
ener
gy e
ffic
ient
lig
hti
ng.
50
% e
ner
gy
effi
cien
cy
imp
rovem
ents
fro
m
the
star
t o
f th
e
sup
pli
er-b
uyer
rela
tio
nsh
ip s
uch a
s
red
uce
d u
se o
f
elec
tric
al e
ner
gy a
nd
use
of
ener
gy
effi
cien
t li
ghti
ng.
18

International Conference on Management Economics and Business (IConMEB)
October 29–November 1, 2020, Antalya/TURKEY
19
After the proposed framework is made, expert validation is then carried out to obtain a framework that suits the needs in
the field. The results of data collection of the proposed framework validation criteria are considered important by all
experts so that the proposed framework can be accepted according to field needs. To determine the level of the supplier-
buyer relationship, this study proposes the SRPM model. The basic concept in measuring the level of supplier-buyer
relationship is the low / small gap between actual perceptions of supplier-buyer. The SRPM model for measuring
supplier-buyer relationships uses a scale of 1-5. The SRPM model table is given in Tables 1 and 2.
Case Study
To implement the designed model, direct measurements were made at manufacturing companies, namely PT. X, P. Y
and PT. Z. SRPM performance measurement in manufacturing companies is by distributing questionnaires and
interviews to companies that are responsible and which deal directly with supplier buyers. There are 2 questionnaires
used in this study, namely the SRPM measurement questionnaire and the pairwise comparison questionnaire in each
company. The method used is the Analitycal Hirarchy Process (AHP). After distributing the questionnaires, the SRPM
measurement results for each company were obtained which explained that the position of the relationship and the
results of pairwise comparisons between the SRPM criteria aims to obtain the priority weight of each criterion.
Furthermore, the measurement of the SRPM level score is carried out on each supplier-buyer relationship. The
following is a summary of the results of the research conducted:
Table 3. Score supplier relationship peformance measurement
PT. X and PT. Y
No Criteria PT. X to PT. Y PT. X to PT. Y
Score Criteria
Weights
Final
Score
Score Criteria
Weights
Final
Score
1 Cost 4 0.161 0.644 5 0.131 0.655
2 Quality 4 0.142 0.568 5 0.144 0.720
3 Lead-time 5 0.125 0.625 4 0.131 0.524
4 Flexibility 5 0.12 0.600 5 0.119 0.595
5 Trust 4 0.053 0.212 4 0.052 0.208
6 Power 3 0.111 0.333 3 0.111 0.333
7 Transparancy 5 0.042 0.210 5 0.042 0.210
8 Communication 5 0.088 0.440 5 0.099 0.495
9 Commitment 5 0.081 0.405 5 0.09 0.450
10 Economic Sustainable 1 0.027 0.027 1 0.028 0.028
11 Social Sustainable 1 0.024 0.024 1 0.026 0.026
12 Environment
Sustainable
1 0.027 0.027 1 0.028 0.028
Total 4.115 4.272
Table 4. Score supplier relationship peformance measurement
PT. X and PT. Z
No Criteria PT. X to PT. Z PT. Z to PT. X
Score Criteria
Weights
Final
Score
Score Criteria
Weights
Final
Score
1 Cost 4 0.161 0.644 4 0.142 0.568
2 Quality 3 0.142 0.426 5 0.158 0.790
3 Lead-time 5 0.125 0.625 4 0.118 0.472
4 Flexibility 5 0.12 0.600 5 0.105 0.525
5 Trust 4 0.053 0.212 4 0.053 0.212
6 Power 3 0.111 0.333 3 0.11 0.330
7 Transparancy 5 0.042 0.210 5 0.042 0.210
8 Communication 5 0.088 0.440 5 0.098 0.490
9 Commitment 5 0.081 0.405 5 0.089 0.445
10 Economic Sustainable 1 0.027 0.027 1 0.029 0.029
11 Social Sustainable 1 0.024 0.024 1 0.027 0.027
12 Environment Sustainable 1 0.027 0.027 1 0.029 0.029
Total 3.973 4.127

International Conference on Management Economics and Business (IConMEB)
October 29–November 1, 2020, Antalya/TURKEY
20
Figure 3. Matriks SRPM PT. X and PT. Y
Figure 4. Matriks SRPM PT. X and PT. Z
Based on the research results above, the final value of PT. X and PT. Y with a score of 4,115 and 4,272, while PT. X
and PT. Z has a score of 3,973 and 4,127. From the final value of the SRPM supplier-buyer matrix results can be seen in
Figures 3 and 4 , where the supplier-buyer relationship is in quadrant A, which means that the supplier-buyer is equally
satisfied. However, in this study, the researcher proposes to improve the performance of two supplier-buyer
relationships in sustainable quality criteria so as to produce a more perfect SRPM score (5 and 5) as follows:
Standardizing quality by mutual agreement to overcome quality problems that often occur in recycled products
and replacement products.
Integrate supply chain systems to produce better information, communication and transparency.
Build sustainable programs in living relationships to achieve mutual sustainability.
Conclusion
Based on the research that has been done, a comprehensive SRPM model was found to make it easier for companies to
implement SRPM in the company. This model was built to determine the scale of measurement within the scope of
SRPM. Companies are expected to have guidelines for assessing and planning for improvements in supplier-buyer
relationships.
The proposal to improve the performance of SRPM in this study is to standardize quality by mutual agreement to solve
quality problems that often occur in recycled and substituted products, integrate supply chain systems to produce better
information, communication, and transparency, and build sustainable programs in relationship to achieve sustainability
together.

International Conference on Management Economics and Business (IConMEB)
October 29–November 1, 2020, Antalya/TURKEY
21
Recommendations
In research there are weaknesses and strengths as well as research that has been done, this can be developed again in
future research or research. The recommendation for further research is to validate the supplier relationship
performance measurement model using SEM or other statistical methods.
Acknowledgements or Notes
Alhamdulillah, all praise and gratitude be to Allah SWT who never stops giving all pleasures and graces to all of His
servants. Salawat and greetings to our prophet Prophet Muhammad and his successors who have brought Islam to all
mankind. With the Grace and Hidayah of Allah SWT, the research entitled "Model Design Supplier Relationship
Performance Measurement" can be completed properly. In completing his research, he received support, mentoring and
guidance from various parties. For that, the authors would like to express their gratitude and highest appreciation for
providing support directly or indirectly.
References
Amoako-Gyampah, K., Boakye, K, G. Adaku, E. & Famiyeh, S. (2019). Supplier relationship management and firm
performance in developing economics: A moderated mediation analysis of flexibility capability and ownership
structure. Production Economics. 208, pp. 160-170.
Asif, M., Jajja, M, S, S., & Searcy, C. (2019). Social compliance standarts: re-evaluating the buyer and supplier
perspectives.Cleaner Production, 227, pp.457-471.
Bandara, S., Leckie, C., Lobo, A., & Hewege, C. (2017). Power and relationship quality in supply chains the case of
Australian organics fruit and vegetable industry. Asia Pacific Journal of Marketing and Logistics. 29(3), pp.
501-518.
Boiko, A., Shendryk, V., & Boiko, O. (2019). Information systems for supply chain management: uncertainties risks
and cyber security.Procedia Computer Science, 149, pp. 65-70.
Beikkhakhian, Y., Javanmardi, M., Karbasian, M., & Khayambashi, B. (2015). The application of ISM model in
evaluating agile suppliers selection criteria and ranking suppliers using fuzzy TOPSIS-AHP methods. Expert
Systems with Applications, 42(15–16), pp. 6224–6236.
Cerna, L., & Bukova, B. (2016). Supplier evaluation methodology in the logistic company. Procedia engineering, 134,
pp. 377-385.
Damlin, A., Dietersdottir, K., Fornander, D., Brykt, J, M., Polyantseva, E., & Sundquist, D. (2012). Measuring buyer-
supplier relationship performance. Retrieved from
http://publications.lib.chalmers.se/records/fulltext/170612/local_170612.pdf
Gangurde, S, R., & Chavan, A, A. (2016). Benchmarking of purchasing practices using Kraljic approach.
Benchmarking: An International Journal, 23(7), 1751-1779.
Gardner, T, A., Benzie, M., Borner, J., Dawkins, E., Fick, S., Garrett, R., Godar, J., Grimard, A., Lake, S., Larsen, R,
K., Mardas, N., McDermott, C, L., Meyfroidt, P., Osbeck, M., Person, M., Sembers, T., Suavet, C., Strassburg,
B., Trevisan, A., West, C., & Wolvekamp, P. (2019). Transparency and sustainability in global commodity
supply chains. World Development. 121, 163-177.
Giannakis, M., Dubey, R., Vlachos, I., & Ju, Y. (2020). Supplier sustainability performance evaluation using the
analytic network process. Cleaner Production. 247, 119439.
Graca, S, S., Barry, J, M., & Doney, P, M. (2015). Performance outcomes of behavioral attributes in buyer-supplier
relationships. Journal of Business & Industrial Marketing, 30(7), 805-816.
Huang, S., Wang, C., & Chiou, C. (2014). FAHP application for green supplier selection in electronic industry. The
Journal of Human Resource and Adult Learning, 10(2), 50-58.
Johnson, P, F., & Flynn, A, E. (2015). Purchasing and supply management, fifteenth edition. McGraw Hill.
Khan, S, A., Sarpong, S, K., Arhin, F, K., & Sarpong, H,K. (2018). Supplier sustainability performance evaluations and
selection: a framework and methodology. Cleaner Production, 205, 964-979.
Kurniawan, R., Hasibuan., S., & Nugroho., R. E. (2017). Analisis Kriteria Dan Proses Seleksi Kontraktor Chemical
Sektor Hulu Migas: Aplikasi Metode Delphi-Ahp. Jurnal Ilmu Manajemen, VII(2), 316–329.
Maestrini,V., Maccarrone, P., Caniato, F., & Luzzini, D. (2018). Supplier performance measurement systems:
communication and reaction modes. Industrial Marketing Management, 74, 298-308.
Oghazi, P., Rad, F, F., Zaefarian, G., & Mortazavi, S. (2016). Unity is strength: A study of supplier relationship
management integration. Business Research, 69, 4804-4810.

International Conference on Management Economics and Business (IConMEB)
October 29–November 1, 2020, Antalya/TURKEY
22
Rajagopal., & Rajagopal, A. (2009). Buyer-supplier relationship and operational dynamics. Operation Research
Society, 60, 313-320.
Taherdoost, H., & Brard, A. (2019). Analyzing the process of supplier selection criteria and methods. Procedia
Manufaturing, 32, 1024-1034.
Thanh H, T. (2015). A case study of intergrative creation of supplier relationship management process. Master Thesis.
Depertment of Information and Service Econmoy, Aalto University Espoo, Finland.
Vos, F, G, S., Schiele, H., & Huttinger, L. (2016). Supplier satisfaction: Explanation and out-of-sample prediction.
Business Research, 69, 4613-4623.
Yoon, J., & Moon, J. (2019). The Moderating effect of buyer purchasing strategy on the relationship between supplier
transaction-specific investment and supplier firm performance. Business Research, 99, 516-523.
Author Information Rizki Prakasa Hasibuan University of Putera Batam
R.Soeprapto, Muka Kuning, Batam, Indonesia
Contact e-mail: [email protected]
Elisa Kusrini Islamic University of Indonesia
Kaliurang, Umbulmartani, Sleman, Indonesia

The Eurasia Proceedings of
Educational & Social Sciences (EPESS)
ISSN: 2587-1730
- This is an Open Access article distributed under the terms of the Creative Commons Attribution-Noncommercial 4.0 Unported License,
permitting all non-commercial use, distribution, and reproduction in any medium, provided the original work is properly cited.
- Selection and peer-review under responsibility of the Organizing Committee of the Conference
© 2020 Published by ISRES Publishing: www.isres.org
The Eurasia Proceedings of Educational & Social Sciences (EPESS), 2020
Volume 19, Pages 23-30
IConMEB 2020: International Conference on Management, Economics and Business
Perceived Supervisor Support, Work Engagement and Career-Related
Self-Efficacy: An Empirical Study
Emre Burak EKMEKCIOGLU
Ankara Yildirim Beyazit University
Abstract: The purpose of this study is to examine the mediating effect of career-related self-efficacy in the
relationship between the perceived supervisor support and work engagement. A cross-sectional research design
was performed in the present study. Data were collected from a total of 184 participants employed full time in
the manufacturing sector in Ankara. Structural equation modeling approach was used to estimate direct and
indirect effects between variables. The results indicated that employees' perception of supervisor support is a
positive predictor of their work engagement. Moreover, career-related self-efficacy was found to have a
mediating role in the relationship between perception of supervisor support and work engagement. This study
revealed that the perception of supervisor support is an important predictor in increasing employees' work
engagement and the key importance of career-related self-efficacy in this relationship. In addition, the
theoretical and practical contributions of this study, its limitations and implications for future research on the
perception of supervisor support and work engagement were discussed.
Keywords: Perceived supervisor support, Work engagement, Career-related Self-efficacy
Introduction
Work engagement has drawn a lot of attention from scholars and practitioners becasue it is positively correlated
with job performance (Yalabik et al., 2013), organizational citizenship behaviour (Runhaar et al., 2013;
Babcock-Roberson and Strickland, 2010), job satisfaction (Lu et al., 2016), career satisfaction (Joo and Lee,
2017). Studies show an evidence that highly engaged employees are more positive about their jobs and
organizations, treat their colleagues more respectfully, and continuously improve their job-related skills (Bakker
and Demerouti, 2009). Considering these positive contributions of work engagement to the organization,
organizations take action to support policies and practices that encourage employees's work engagement (Lu et
al., 2016). Work engagement is defined as “a positive, fulfilling, work-related state of mind characterized by
vigor (elevated levels of energy and resilience at work), dedication (deep involvement in one's work as well as a
sense of significance and enthusiasm), and absorption (feeling of being completely concentrated and
comfortably engrossed on one's work)” (Schaufeli et al., 2002, p. 74; Schaufeli et al., 2006).
Empirical studies indicated that perceived supervisor support was a significant predictor of work engagement
(Ibrahim et al., 2019; Pattnaik and Panda, 2020; Swanberg et al., 2011). Perceived supervisor support is
defined as employees' general views about the degree to which their supervisors value their contribution and care about their well-being (Eisenberger et al., 2002). Perceived supervisor support can be explained in the perspective of social exchange theory (Blau, 1964). In the line with the social exchange theory, employees who are treated well by their supervisors are able to respond with more positive attitudes towards their supervisors. As supervisors are agents of the organization, employees' perception of high levels of supervisor support will return to their organizations with positive attitude and behavior (Pattnaik and Panda, 2020). Emprical studies had an evidence that employees with a high perception of supervisor support are more motivated and engaged in their work (Swanberg et al., 2011; Suan and Nasurdin, 2016, Ibrahim et al., 2019).
The present study investigated work engagement by adopting a conceptual framework that focuses on the role of
perceived supervisor support and the employees’s career-related efficacy belief in work engagement. Career-
related self-efficacy can be described as the personal belief that career aspirations can be effectively followed

International Conference on Management, Economics and Business (IConMEB)
October 29–November 1, 2020, Antalya/TURKEY
24
(Lent and Hackett, 1987). Previous studies paid little attention to the mediating role of career-related self-
efficacy in the relationship between perceived supervisor support and work engagement . The underlying
mechanisms that could explain the relationship between perceived supervisor support and work engagement.
This study aimed to fill this gap by investigating the mediating role of career-related self-efficacy in the
relationship between perceived supervisor support and work engagement.
Figure 1. Research model
H1=Perceived supervisor support relates significantly and positively to work engagement.
H2=Perceived supervisor support relates significantly and positively to career-related self-efficacy.
H3=Career-related self-efficacy relates significantly and positively to work engagement.
H4=Career-related self-efficacy mediates the relationship between perceived supervisor support and work
engagement.
Research Method
A cross-sectional research design was performed in the present study. This study was also carried out on
employees in manufacturing enterprises between October 2019 and December 2019. A total of 250
questionnaires were submitted to the full-time employees working in ten different companies in manufacturing
sector. The employees were invited to rate their level of agreement involving perceived supervisor support,
work engagement, and career-related self-efficacy, and additionally provide their demographic information. The
anonymity and privacy of the participants were stated to be ensured. Moreover, a paper-and-pencil survey was
administered. Data collection was carried out with the aid of the human resources department of the
manufacturing enterprises during daily operating hours. 198 questionnaires were returned. However, incomplete
information led to the elimination of 14 questionnaires. Consequently, 184 usable questionnaires were obtained.
First, descriptive statistics, validity and reliability analyzes were conducted in the study. Then, structural
equation modeling approach was used to test the hypotheses in line with the research model.
To measure perceived supervisor support, an eight-item perceived organizational support scale developed by
Eisenberger et al. (1986) was used. Perceived supervisor support scale was modified by replacing the word
“organization” with “supervisor”, as has been done in many other studies (Eisenberger et al., 2002; Maertz et
al., 2007; DeConinck, 2010). The mediating variable “career-related self-efficacy” was assessed with the five-
item scale developed by Higgins et al. (2008). The dependent variable “work engagement” was operationalized
by the shortened version of the Utrecht Work Engagement Scale given by Schaufeli et al. (2006), consisting of
nine items. Since this scale is a student version of work engagement scale, it was modified for organizational
analysis. The scale for perceived supervisor support and career-related self-efficacy each had a range from 1
(strongly disagree) to 5 (strongly agree). However, work engagement scale was coded from 0 (never) to 6
(always). Table 1 below contains information about the scales used in the research.
Table 1. Scales used in the study
Scale Researchers Number of Items
Perceived Supervisor Support Eisenberger et al. (1986) 8-item scale
Career-related Self-efficacy Higgins et al. (2008) 5-item scale
Work Engagement Schaufeli et al. (2006) 9-item scale
H4

International Conference on Management, Economics and Business (IConMEB)
October 29–November 1, 2020, Antalya/TURKEY
25
Research Findings
Frequency Analysis
As can be seen in Table 2 below, the sample for the study had 147 male (79.9%) respondents and 37 female
(20.1%) respondents. Agewise, 64 (34.8%) were 23 to 27 years and 45 (24.4%) were in the age bracket of 18 to
22 years. In terms of education level, 135 have bachelor’s degree (73.4%). Of the respondents, 78 had tenures
between 6 and 10 years (42.4%).
Table 2. Frequency analysis
n Percentage (%)
Gender Female 37 20.1
Male 147 79.9
Age
18-22 45 24.4
23-27 64 34.8
28-33 38 20.7
34-39 37 20.1
Education Level High school degree 32 17.4
Bachelor’s degree 135 73.4
Master's degree 17 9.2
Tenure 1-5 years 65 35.3
6-10 years 78 42.4
11-15 years 41 22.3
Total 184 100
Common Method Variance
Harman’s single-factor test (Podsakoff and Organ, 1986) was utilized to control common method variance. In
order for the common method variance to emerge, a single factor structure should emerge or the first factor
obtained should constitute a significant part of the total variance (Podsakoff and Organ, 1986: 536; Podsakoff et
al., 2003: 889). Unrotated exploratory factor analysis revealed that the first factor explained 39.3 percent of the
total variance. The first factor explained less than 50 percent of the total variance. Accordingly, common
method varience did not appear to pose a issue.
Measurement Model
To test the validity of all constructs, confirmatory factor analysis (CFA) was conducted. According to the
results, it was determined that the measurement model has acceptable fit values and the standardized regression
coefficients of each of the observed variables are greater than 0.50 (Bagozzi and Yi, 1988: 82). The fit indices
that was used to demonstrate model adequacy were CMIN/df, comparative fit index (CFI), Incremental Fit Inde
(IFI), root mean square error of approximation (RMSEA), Tucker–Lewis index (TLI), and standardized root
mean square residual (SRMR).
Tablo 3. Measurement model- factor loadings
Variables Range of Factor Loadings
Perceived Supervisor Support 0.60-0.88
Career-related Self-efficacy 0.70-0.89
Work Engagement 0.77-0.95
Note: CMIN/df = 488,219 / 199 = 2,453, p = 0,000, IFI=0,94; TLI=0,93; CFI=0,94; RMSEA = 0,08;
SRMR=0,06
In line with the data obtained as a result of the confirmatory factor analysis, there are composite reliability (CR),
average variance extracted value (AVE) as seen in Table 4. Accordingly, both reliability and validity tests of the
study were conducted. Cronbach alphas, means, standard deviations among all variables are also reported in
Table 4. Moreover, as seen in Table 4, pearson correlation analysis was conducted to examine the relationship
between research variables.

International Conference on Management, Economics and Business (IConMEB)
October 29–November 1, 2020, Antalya/TURKEY
26
According to Hair et al. (2010), an acceptable fit should have CFI, IFI and TLI values >0.90, RMSEA <0.08 and
SRMR <0.09. The three-factor model of measurement model of the study (perceived supervisor support, career-
related self-efficacy, and work engagement) indicated a good fit with the data: CMIN/df = 488,219 /199 =
2.453, p <0.001, CFI=0.94, IFI=0.94, TLI=0.93, RMSEA=0.08 and SRMR=0.06. Factor loadings of the
perceived supervisor support were between 0.60-0.88; The factor loadings of career-related self-efficacy were
between 0.70-0.89; The factor loadings of the work engagement were values between 0.77-0.95. Moreover, t
values were greater than 1.96 (p<0.001) (Schumacker and Lomax, 2004). Value ranges and goodness of fit
indices of factor loadings are given in Table 3 below.
Table 4. Means, standard deviations, CR, AVE and correlations among study variables
Variables M SD. Cronbach’s α CR AVE 1 2 3
1. CSE 3.76 0.91 0.87 0.88 0.61 (0.78)
2. PSS 2.71 0.80 0.88 0.89 0.52 0.30*
(0.72)
3. WE 2.63 1.45 0.96 0.96 0.75 0.23* 0.34
* (0.87)
Note = n = 184, *p<0,01, CSE =Career-related Self-efficacy, PSS = Perceived Supervisor
Support, WE = Work Engagement, M= Mean, SD. = Standard Deviations; CR= Composite
Reliability AVE: Average Variance Extracted, values in parentheses on the diagonal are the
square roots of the AVE of each scale.
Results reported in Table 4 indicated that work engagement was significantly and positively correlated with
both career-related self-efficacy (r= 0.23, p 0.01), and perceived supervisor support (r= 0.34, p 0.01).
Furthermore, it was found that perceived supervisor support was positively associated with career-related self-
efficacy (r= 0.30, p 0.01). On the other hand, career-related self-efficacy has the highest mean (M = 3.76, SD. =
0.91), while the employees' work engagement is the least (M = 2.63, SD.=1.45).
The critical value for the composite reliability value is 0.70 and above (Hair et al., 2010). In this study,
composite reliability values are between 0.88 and 0.96 and are greater than 0.70 critical value. For convergent
validity, average variance value (AVE) should be greater than 0.5 and CR should be greater than AVE; For
discriminant validity, the square root of the AVE value calculated for each structure should be greater than the
correlation of each other variable (Hair et al., 2010). AVE values in the present study are between 0.52 - 0.75,
and all values are higher than 0.50, and the square root of the AVE value of each structure is greater than its
correlation with other structures. As stated in Table 4, correlations between latent variables are less than 0.85
(Kline, 2011). These results obtained as a result of the measurement model made show that this study is a
reliable and valid study.
Hypotheses testing
Structural equation modeling was performed in order to examine the direct and indirect effects between
variables. Accordingly, the mediating effect of career-related self-efficacy in the relationship between the
perveived supervisor support and work engegament was examined. As seen in Figure 2, the research model
showed acceptable fit indices (CMIN / df = 488.219 / 199 = 2.453, p = 0.000, IFI=0.94, TLI=0.93, CFI=0.94,
RMSEA = 0.08, SRMR=0.06).
Figure 2. Direct and indirect effects Note: n = 184, *Standardized Beta Coefficients, CMIN / df = 488.219 / 199 = 2.453, p = 0.000, IFI=0.94, TLI=0.93, CFI=0.94,
RMSEA = 0.08, SRMR=0.06.
β= 0.14*; p0.05
β= 0.30*; p0.001
β= 0.30*; p0.001
Career-related
Self-efficacy
Perceived
Supervisor Support Work Engagement
R2 = 10
R2 = 14

International Conference on Management, Economics and Business (IConMEB)
October 29–November 1, 2020, Antalya/TURKEY
27
According to the model, it was found that perceived supervisor support had a significant and positive effect on
work engagement (standardized β = 0.30, p0.001). Accordingly, the hypothesis (H1) that “perceived supervisor
support relates significantly and positively to work engegament” was accepted. Similarly, the model established
showed that perceived supervisor support had a significant and positive effect on career-related self-efficacy
(standardized β = 0.30, p0.001). This result was evidence that the hypothesis (H2) that “perceived supervisor
support relates significantly and positively to career-related self-efficacy” was accepted. It was also found that
career-related self-efficacy affects work engagement significantly and positively (standardized β = 0.14,
p0.05). According to this result, the hypothesis (H3) that “Career-related self-efficacy relates significantly and
positively to work engagement” was accepted.
Tablo 5. Direct, indirect and total effects
Standardized Total Effects Standardized Direct Effects Standardized Indirect Effects
PSS→CSE 0,30** 0,30** -
PSS→WE 0,34** 0,30** 0,04*
CSE→WE 0,14* 0,14* -
Note = n = 184, **
p<0,001, * p<0,05, PSS = Perceived Supervisor Support, CSE = Career-related Self-efficacy,
WE =Work Engagement; In order to test the indirect effect of career-related self-efficacy in the relationship
between perceived supervisor support and work engagement, (n=2000) bias-corrected bootsrapping - 95%
confidence interval method was used (Preacher and Hayes, 2008; Mallinckrodt et al., 2006).
To examine the indirect effect of perceived supervisor support on work engagement through career-related self-
efficacy, bias-corrected bootsrapping method was used. Accordingly, indirect effect values were calculated by
resampling (n = 2000). The indirect effect of perceived supervisor support on work engagement through career-
related self-efficacy at 95% confidence interval was found to be significant (standardized β = 0.04, p<0.05).
Accordingly, the total effect of perceived supervisor support on work engagement was (0.30 + 0.04) 0.34. The
results showed that the mediating role of career-related self-efficacy in the relationship between perceived
supervisor support and work engagement. Accordingly, the hypothesis (H4) that “career-related self-efficacy
mediates the relationship between perceived supervisor support and work engagement” was accepted.
Results and Discussion
In this study, the mediating role of career-related self-efficacy in the relationship between perceived supervisor
support and work engagement was investigated. The empirical data support the hypothesized relationships. This
study is significant in the context of career research as it is based on the career-related self efficacy of
employees. Because many studies on career have been carried out on university students.
Both perceived supervisor support and career-related self-efficacy increase work engagement of employees.
Such adequate support from supervisors helps employees feel effective (Nisula, 2015). Accordingly, self-
sufficient employees who receive adequate support from their supervisors exhibit high levels of work
engagement.
In line with social exchange theory (Blau, 1964), when there is adequate supportive supervision, employees pay
back to the organization via high work engagement. In addition to consistent with social exchange theory, the
finding regarding the effect of perceived supervisor support on work engagement through the partial mediating
role of career-related self-efficacy in this study also supports also Naeem et al. (2018)'s the empirical study.
Moreover, it should be noted that the direct effect of perceived supervisor support (0.30) on work engagement
was greater than that of career-related self-efficacy (0.14). Accordingly, employees' perception of supervisor
support may have a stronger effect on work engagement than that of career-related self-efficacy.
According to the results obtained in this study, the perception of supervisor support enhances career-related self-
efficacy of emloyees, which in turn increase their work engagement. In other words, employees's feelings of
supported and appreciation to supervisors in their career aspirations are composing a high degree of career-
related self-efficacy that increases work engagement. The partial mediation finding in the study also supports
the previous empirical studies (Caesens and Stinglhamber, 2014). Self-efficacy enables a belief to employees to
carry out on difficult tasks when faced with challenges (Ibrahim et al., 2019). Accordingly, an increase in
individuals 'perception of career-related self-efficacy means an increase in individuals' personal beliefs about
reaching their career goals. This can further motivate the employee and increase work engagement.

International Conference on Management, Economics and Business (IConMEB)
October 29–November 1, 2020, Antalya/TURKEY
28
In the perspective of social exchange theory, career-related self-efficacy was included as a mediating variable in
the relationship between perceived supervisor support and work engagement. Then, path analysis and bias-
corrected bootsrapping was performed and the effect of the mediating variable between these two constructs was
evaluated. As a result, it was confirmed that although career-related self efficacy is a partial mediating variable,
it serves as a considerable variable in this relationship. In other words, as the employees' perception of
supervisor support increases, the belief to accomplish career-related goals and tasks will be increase and the
expectation and belief that they will achieve positive results related to their work engagement will be increase.
Work engagement is an important variable in terms of individual and organizational results. Work engagement
aids in increasing performance (Kim et al., 2012), career satisfaction (Joo and Lee, 2017; Karatepe, 2012),
innovative work behavior (De Spiegelaere et al., 2016), and in decreasing intention to quit (Yalabik et al., 2013).
This study thus has a several of a practical implications. Organizations need to bring in motion the kind of
organizational strategies that allow employees to maximize their work engagement (Naeem et al., 2018). Thus,
organizations needs to coordinate on-going training activities to ensure that each supervisor is supportive and
can serve as advisors throughout the operation (Ibrahim et al., 2019). For these purposes, organizations can
facilitate for supervisors to support their employees, and as a result, employees can enhance their belief in their
ability to fulfill their career goals and objectives, increasing their work engagement.
Limitations and future directions
The data were obtained from a single source and by the participants' self-reports. This may lead to a possible
common method variance problem. Although Harman single factor test was performed in this study, it is not
sufficient by itself (Podsakoff et al., 2003). A marker variable can be used in future studies (Simmering et al.,
2015).
This research is also the first study conducted on employees in Ankara, Turkey. And a cross-sectional research
design was established and carried out. Consequently, such a research design cannot determine causality.
Longitudinal studies are needed to extend and validate the results of the study and for determining causality.
The study used only data from the manufacturing industry. Future researchers should replicate the results for
other industries to boost generalizability. In this study, perceived supervisor support was only used to predict
work engagement. Other dimensions of social support can also be assessed by scholars. This study used career-
related self-efficacy as a mediator variable in the relationship between perceived career support and work
engagement. In a way to support career studies, other variables that can be tested as mediators such as career
optimism can be used.
References
Babcock-Roberson, M. E., & Strickland, O. J. (2010). The relationship between charismatic leadership, work
engagement, and organizational citizenship behaviors. The Journal of psychology, 144(3), 313-326.
Bagozzi, R. P., & Yi, Y. (1988). On the evaluation of structural equation models. Journal of the academy of
marketing science, 16(1), 74-94.
Bakker, A.B., & Demerouti, E. (2009), The crossover of work engagement between working couples: a closer
look at the role of empathy, Journal of Managerial Psychology, 24(3), 220-236.
Blau, P. M. (1964). Exchange and power in social life. New York: Wiley.
Caesens, G., & Stinglhamber, F. (2014). The relationship between perceived organizational support and work
engagement: The role of self-efficacy and its outcomes. European Review of Applied
Psychology, 64(5), 259-267.
De Spiegelaere, S., Van Gyes, G., & Van Hootegem, G. (2016). Not all autonomy is the same. Different
dimensions of job autonomy and their relation to work engagement & innovative work
behavior. Human Factors and Ergonomics in Manufacturing & Service Industries, 26(4), 515-527.
DeConinck, J. B. (2010). The effect of organizational justice, perceived organizational support, and perceived
supervisor support on marketing employees' level of trust. Journal of Business Research, 63(12), 1349-
1355.
Eisenberger, R., Huntington, R., Hutchison, S., & Sowa, D. (1986). Perceived organizational support. Journal of
Applied psychology, 71(3), 500-507.
International Conference on Management, Economics and Business (IConMEB)
October 29–November 1, 2020, Antalya/TURKEY
29
Eisenberger, R., Stinglhamber, F., Vandenberghe, C., Sucharski, I. L., & Rhoades, L. (2002). Perceived
supervisor support: contributions to perceived organizational support and employee retention. Journal
of applied psychology, 87(3), 565-573.
Hair, J. F., Black, W. C., Babin, B. J., & Anderson, R. E. (2010). Multivariate Data Analysis (7 th ed.). Upper
Saddle River, NJ: Pearson Education.
Higgins, M. C., Dobrow, S. R., & Chandler, D. (2008). Never quite good enough: The paradox of sticky
developmental relationships for elite university graduates. Journal of Vocational Behavior, 72(2), 207-
224.
Ibrahim, S. N. H., Suan, C. L., & Karatepe, O. M. (2019). The effects of supervisor support and self-efficacy on
call center employees’ work engagement and quitting intentions. International Journal of Manpower,
40(4), 688-703.
Joo, B. K., & Lee, I. (2017). Workplace happiness: Work engagement, career satisfaction, and subjective well-
being. Evidence-based HRM: A Global Forum for Empirical Scholarship, 5(2), 206-221.
Karatepe, O. M. (2012). Job resources, work engagement, and hotel employee outcomes: a time-lagged
analysis. Economic research-Ekonomska istraživanja, 25(3), 644-665.
Kim, W., Kolb, J. A., & Kim, T. (2012). The relationship between work engagement and performance: A
review of empirical literature and a proposed research agenda. Human Resource Development
Review, 12(3), 248-276.
Kline, R. B. (2011). Principles and practice of structural equation modeling (3 rd ed.). Guilford publications.
Lent, R. W., & Hackett, G. (1987). Career self-efficacy: Empirical status and future directions. Journal of
vocational Behavior, 30(3), 347-382.
Lu, L., Lu, A. C. C., Gursoy, D., & Neale, N. R. (2016). Work engagement, job satisfaction, and turnover
intentions. International Journal of Contemporary Hospitality Management, 28(4), 737-761.
Maertz Jr, C. P., Griffeth, R. W., Campbell, N. S., & Allen, D. G. (2007). The effects of perceived
organizational support and perceived supervisor support on employee turnover. Journal of
Organizational Behavior: The International Journal of Industrial, Occupational and Organizational
Psychology and Behavior, 28(8), 1059-1075.
Mallinckrodt, B., Abraham, W. T., Wei, M., & Russell, D. W. (2006). Advances in Testing the Statistical
Significance of Mediation Effects. Journal of Counseling Psychology, 53(3), 372-378.
Naeem, R. M., Channa, K. A., Hameed, Z., Akram, M., & Sarki, I. H. (2019). How does perceived career
support make employees bright-eyed and bushy-tailed? The mediating role of career self-
efficacy. Australian Journal of Career Development, 28(2), 92-102.
Nisula, A. M. (2015). The relationship between supervisor support and individual improvisation. Leadership &
Organization Development Journal, 36(5), 473-488.
Pattnaik, S. C., & Panda, N. (2020). Supervisor support, work engagement and turnover intentions: evidence
from Indian call centres. Journal of Asia Business Studies, https://doi.org/10.1108/JABS-08-2019-0261
Podsakoff, P. M., & Organ, D. W. (1986). Self-reports in organizational research: Problems and
prospects. Journal of management, 12(4), 531-544.
Podsakoff, P. M., MacKenzie, S. B., Lee, J. Y., & Podsakoff, N. P. (2003). Common method biases in
behavioral research: a critical review of the literature and recommended remedies. Journal of applied
psychology, 88(5), 879-903.
Preacher, K. J., & Hayes, A. F. (2008). Asymptotic and resampling strategies for assessing and comparing
indirect effects in multiple mediator models. Behavior Research Methods, 40(3), 879-891.
Runhaar, P., Konermann, J., & Sanders, K. (2013). Teachers' organizational citizenship behaviour: Considering
the roles of their work engagement, autonomy and leader–member exchange. Teaching and Teacher
Education, 30, 99-108.
Schaufeli, W. B., Bakker, A. B., & Salanova, M. (2006). The measurement of work engagement with a short
questionnaire: A cross-national study. Educational and psychological measurement, 66(4), 701-716.
Schaufeli, W. B., Salanova, M., González-Romá, V., & Bakker, A. B. (2002). The measurement of engagement
and burnout: A two sample confirmatory factor analytic approach. Journal of Happiness studies, 3(1),
71-92.
Schumacker, R. E., & Lomax, R. G. (2004). A beginner's guide to structural equation modeling (2nd ed.).
Lawrence Erlbaum Associates, Inc.
Simmering, M. J., Fuller, C. M., Richardson, H. A., Ocal, Y., & Atinc, G. M. (2015). Marker variable choice,
reporting, and interpretation in the detection of common method variance: A review and
demonstration. Organizational Research Methods, 18(3), 473-511.
Suan, C. L., & Nasurdin, A. M. (2016). Supervisor support and work engagement of hotel employees in
Malaysia. Gender in Management: An International Journal, 31(1), 2-18.

International Conference on Management, Economics and Business (IConMEB)
October 29–November 1, 2020, Antalya/TURKEY
30
Swanberg, J. E., McKechnie, S. P., Ojha, M. U., & James, J. B. (2011). Schedule control, supervisor support
and work engagement: A winning combination for workers in hourly jobs? Journal of Vocational
Behavior, 79(3), 613-624.
Yalabik, Z. Y., Popaitoon, P., Chowne, J. A., & Rayton, B. A. (2013). Work engagement as a mediator between
employee attitudes and outcomes. The International Journal of Human Resource Management, 24(14),
2799-2823.
Author Information Emre Burak EKMEKÇİOĞLU Ankara Yildirim Beyazit University
Business School, Ankara, Turkey
Contact e-mail: [email protected]

The Eurasia Proceedings of
Educational & Social Sciences (EPESS)
ISSN: 2587-1730
- This is an Open Access article distributed under the terms of the Creative Commons Attribution-Noncommercial 4.0 Unported License,permitting all non-commercial use, distribution, and reproduction in any medium, provided the original work is properly cited.
- Selection and peer-review under responsibility of the Organizing Committee of the Conference
© 2020 Published by ISRES Publishing: www.isres.org
The Eurasia Proceedings of Educational & Social Sciences (EPESS), 2020
Volume 19, Pages 31-40
IConMEB 2020: International Conference on Management, Economics and Business
The Relationship between Governance and Economic Development:
An Empirical Analysis from 1996 to 2019 for Albania
Teuta XHINDI
Mediterranean University
Olgerta IDRIZI
Mediterranean University
Abstract: There is an on-going debate on the effect of governance on the economic development of a country. In
an effort to shed some light on this matter, this article aims to identify the relationship between good governance and
economic growth in Albania, considering that good governance might create the right habitat for economic
growth.The values for the good governance index are calculated using the Principal Component Analysis and the
values for the World Governance Indicators – WGI for Albania, taken from the World Bank database for 1996-2019
time periods. This period coincides with a series of important transformations undertaken by governments in
Albania after the fall of the communist regime in 1990. The methods used are the regression analysis and the
Granger Causality test. Main results: By analyzing the 1996-2019 time period data, we conclude that Good
Governance is not a statistically significant factor for economic development in Albania and the Granger causality
test indicates that neither of variables causes the other.
Keywords: Good Governance, economic growth, indicators, principal component analysis, Granger causality.
Introduction
Good governance is an important tool for stimulating sustainable development and is widely considered a significant
instrument that should be included in development strategies. Good governance promotes transparency,
accountability, efficiency and the rule of law at all levels and permits a fait and non-partisan management of natural,
human, economic and financial resources by guaranteeing the participation of civil society in the decision – making
processes. Sustainable development and good governance are two closely related concepts. Although good
governance does not guarantee sustainable development, its absence considerably limits it. The definition of good
governance and how to measure it has been the object of many institutions. In this paper we will refer mainly to the
definition of good governance given by the World Bank, but not excluding other resources. In the 1992 report
entitled “Governance and Development”, the World Bank set out its definition of good governance. This term is
defined as “the manner in which power is exercised in the management of a country’s economic and social resources
for development”.
There is an ongoing debate on the effect of governance on the economic development of a country. Many scholars
and policymakers argue that the good governance is a necessity for the economic development of a country but
some others argue that the so-called good governance policies are relevant only if countries reach an adequate level
of economic and social development that enable institutions of good governance to boost growth (Mira &
Hammadache, 2017). But what happens in Albanian situation? Is the good governance a factor that explains the
International Conference on Management, Economics and Business (IConMEB)
October 29–November 1, 2020, Antalya/TURKEY
32
economic growth? This paper aims to respond this question using data for World Governance Indicators and
economic growth taken from World Bank database, for 1996-2019 time period. Based on the Freedom House report
2020, entitled “Democracy under Lockdown”, the democracy and human rights has worsened in 80 countries,
including Albania. The president of Freedom House, Michael J.Abramwitz, said: “What started as a worldwide
health crisis has become part of the global crisis for democracy. Governments around the world have abused their
power in the name of public health, grabbing the opportunity to undermine democracy and human rights”.
In the Freedom House report “Freedom in the World – Albania Country Report 2020”, the score for Global Freedom
in Albania is presented 67/100, so characterising Albania as partly free country. Corruption and organized crime
remain serious problems despite recent government efforts to address them. Referring to the same report, there are
problems with the implementation of the law on access to information, the underfunded courts are often subject to
political pressure and influence, and public trust in judicial institutions is low. Also, in the Transparency
International report for 2019, Albania ranked 106th out of 180 countries in total, ranking last in Europe and the
Balkans. This result shows that Albania, with a CPI score of 35, is still far from the average score of 50, not to
mention almost a third of the way to a corruption- free country with good governance. The economic effect is the
most touchable effect of corruption, because it directly affects both the country's economy and life of the
individual citizens. After the fall of the communist dictatorship, economic growth in Albania has had irregular
patterns. There have been large fluctuations, reflecting the specifics of the Albanian transition. The country
experienced a growth rate 5-6% in 1994-96, negative growth rate in 1997, almost 8% in 2008, plummeting to 1.3%
in 2012 and 0.9% in 2013. The 2013-2018 period was characterized by a positive growth tendency, reaching 4.2% in
2018 (World Bank).
The economic growth in Albania has been based mostly on consumption, remittances and imports, but not on
production, investments and exports. This growth rate has had more of a quantitative rather than a qualitative nature,
coming from sectors and activities with high efficiency and modern technology and innovation. According to the
Normative Act “On same changes in Law No.88/2019 “For the 2020 budget”, it is projected that the real economic
growth for 2020, previously forecasted at 4.1%, will drop to 2%. The earthquake of November 2019 and most
importantly COVID-19 pandemic, severely impacted the Albanian economy. The most affected sectors have been
tourism, the wholesale sector, and the manufacturing industry. The present-day situation raises the need to design
wise policies that would foster job creation and resurrect the economy.This paper does not aim to draw universal
conclusion on the relationship between good governance and economic growth, but only to illustrate the relationship
between these variables on Albania during 1996-2019 period.This paper is organized as follows: Section 2 contains
the literature review. Section 3 contains the data and graphic presentations about the six components of good
governance for Albania. Section 4 contains the methodology and empirical analysis and in the section 5 are the
conclusions.
Literature Review
There are many studies evaluating the relationship between economic growth and good governance. After all this
historical point of view, there is a clear understanding that good governance is one of the main factors on the
economic progress. From e general review on the literature, a positive trend has been obtained between these two
variables on developed countries. According to neo-institutionalism economists, there are two main theories related
to the relationship between these two concepts in developing countries:
The first theory, defended by neo-institutionalism authors, considers the government as having an
independent role and being a well-being government. The function of trade market is correlated with the
function of state governance and all institutions derivate. Consequently, low economic growth performance
and underdevelopment of countries could be explained by “state failure” due to the increase in corruption,
instability of property rights, market distortions, and lack of democracy.
The second theory, developed by Mushtaq Khan and Dany Rodrik, concerns the capability of the
government to implement social changes and follow a controlled strategy of economic development: They
need to establish efficient institutions in relation of sharing the political power in such countries to transit
the developing countries towards a capitalist system similar to that of developed countries. Otherwise,

International Conference on Management, Economics and Business (IConMEB)
October 29–November 1, 2020, Antalya/TURKEY
33
those countries would face state failure as a result of an inconsistency between institutions and an economic
policy of development. (Mira. R, Hammadache. A, 2018)
Based on these approaches, the results of Hall and Jones (1998) have revealed that a country’s long-run productivity,
capital accumulation, and thereby productivity per worker are influenced the most by institutions and government
policies. The main hypothesis of Hall and Jones describe that the major factor for a long-term economic growth is its
social infrastructure (institutions and government policies). Alam, Kitenge and Bedane (2017), using a panel of 81
countries, found a significant positive effect of government effectiveness on economic growth.
AlBassam (2013) present that the global economic crisis has had an unnoticeable influence on the relationship
between good governance and economic growth. However, this study found that different levels of development of
nations affect the relationship between governance and growth in various ways during times of crisis. According to
Aikins (2009), without appropriate economic strategy and regulatory structure, a nation’s financial system becomes
vulnerable to crisis and exposes the stability of the entire economy.
Usual, governments respond to crises with short-term remedial plans, potentially resulting in a harmful long-term
economy recovery (Davidoff &Zaring, 2008; Reinhart &Rogoff, 2009). Davidoff and Zaring (2008) said that
governments focus more on economic growth than on governance development during economic crises.
Consequently, governments can be encouraged to adopt strategies that will improve governance quality and
economic growth in the long term without sacrificing good governance practices in short term, if the influence of
economic crises on the relationship between governance and growth is understood. So, studying economic growth
and its relationship to the governing process will help explain the factors that influence it during times of crisis and
the ways in which it might be improved.
Many authors describe the positive effect of the good governance on economic growth, but this correlation is not
always positive in overall countries and in any conditions. Daniel Kaufmann and Aart Kraayĺ (2010) indicate that
there is not a positive relationship between capital income and governance. The positive or negative causality
depends on the implementation of a good strategy of governance that builds a set of efficient institutions and
forward improvement the so-called good governance. His thesis involve that causality could not be automatically
positive without considering the political will and the existence of feedback mechanisms between economic growth
and good governance, to create a “virtuous circle” of good governance and national wealth. Kaufmann followed in a
certain way the thesis developed by Mushtaq Khan (1995) on the role of the political factor in economic growth: in
effect, the theory of Mushtaq Khan explain that good governance can only occur if one overcomes the symptoms of
“state failure”.
Hashem (2019), in his paper “The Impact of Governance on Economic Growth and Human Development During
Crisis in Middle East and North Africa” concluded that there is no relationship between governance and economic
growth in MENA countries and no impact of the global financial crisis in 2008 on the relationship between
governance and economic growth. Pere (2015), using a panel data for western Balkan countries for the period (1996-
2012), concludes that not all aspects of good governance have the same impact on economic growth and for some of
them this impact is faster than others. The statistical analysis shows that political stability, absence of violence (stb)
and the strengthening of law enforcement (law) affect the growth of the same period, but it is not evident for other
indicators. The analysis by Pere (2015) concluded that the impact of good governance in economic development
cannot be interpreted in short term, only 12 years study. Overcoming from this interpretation we have analyzed 23
years of data, period that coincides with a series of important transformations undertaken by governments in Albania
after the fall of the communist regime in 1990.
Indicators of good governance according to the world bank and the values of these indicators for Albania
The Worldwide Governance Indicators (WGI) project reports aggregate and individual governance indicators for
over 200 countries and territories over the period 1996–2019, for six dimensions of governance:
Voice and Accountability
Political Stability and Absence of Violence
Government Effectiveness
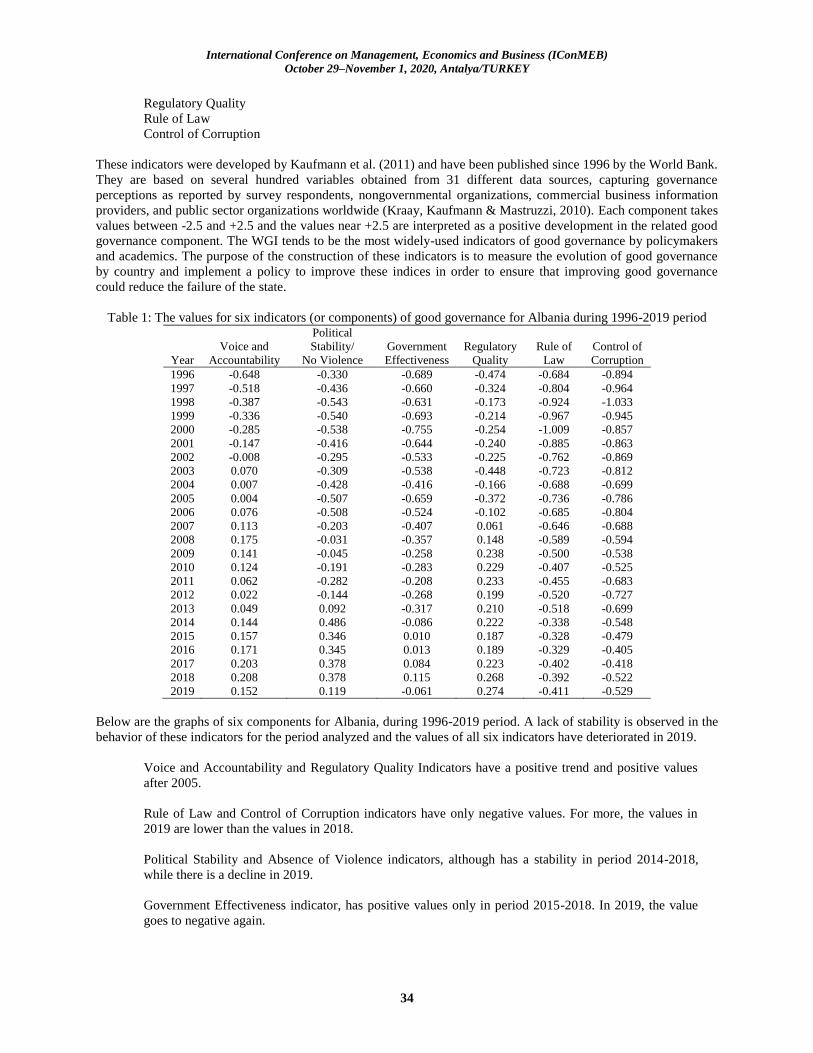
International Conference on Management, Economics and Business (IConMEB)
October 29–November 1, 2020, Antalya/TURKEY
34
Regulatory Quality
Rule of Law
Control of Corruption
These indicators were developed by Kaufmann et al. (2011) and have been published since 1996 by the World Bank.
They are based on several hundred variables obtained from 31 different data sources, capturing governance
perceptions as reported by survey respondents, nongovernmental organizations, commercial business information
providers, and public sector organizations worldwide (Kraay, Kaufmann & Mastruzzi, 2010). Each component takes
values between -2.5 and +2.5 and the values near +2.5 are interpreted as a positive development in the related good
governance component. The WGI tends to be the most widely-used indicators of good governance by policymakers
and academics. The purpose of the construction of these indicators is to measure the evolution of good governance
by country and implement a policy to improve these indices in order to ensure that improving good governance
could reduce the failure of the state.
Table 1: The values for six indicators (or components) of good governance for Albania during 1996-2019 period
Year
Voice and
Accountability
Political
Stability/
No Violence
Government
Effectiveness
Regulatory
Quality
Rule of
Law
Control of
Corruption
1996 -0.648 -0.330 -0.689 -0.474 -0.684 -0.894
1997 -0.518 -0.436 -0.660 -0.324 -0.804 -0.964
1998 -0.387 -0.543 -0.631 -0.173 -0.924 -1.033
1999 -0.336 -0.540 -0.693 -0.214 -0.967 -0.945
2000 -0.285 -0.538 -0.755 -0.254 -1.009 -0.857
2001 -0.147 -0.416 -0.644 -0.240 -0.885 -0.863
2002 -0.008 -0.295 -0.533 -0.225 -0.762 -0.869
2003 0.070 -0.309 -0.538 -0.448 -0.723 -0.812
2004 0.007 -0.428 -0.416 -0.166 -0.688 -0.699
2005 0.004 -0.507 -0.659 -0.372 -0.736 -0.786
2006 0.076 -0.508 -0.524 -0.102 -0.685 -0.804
2007 0.113 -0.203 -0.407 0.061 -0.646 -0.688
2008 0.175 -0.031 -0.357 0.148 -0.589 -0.594
2009 0.141 -0.045 -0.258 0.238 -0.500 -0.538
2010 0.124 -0.191 -0.283 0.229 -0.407 -0.525
2011 0.062 -0.282 -0.208 0.233 -0.455 -0.683
2012 0.022 -0.144 -0.268 0.199 -0.520 -0.727
2013 0.049 0.092 -0.317 0.210 -0.518 -0.699
2014 0.144 0.486 -0.086 0.222 -0.338 -0.548
2015 0.157 0.346 0.010 0.187 -0.328 -0.479
2016 0.171 0.345 0.013 0.189 -0.329 -0.405
2017 0.203 0.378 0.084 0.223 -0.402 -0.418
2018 0.208 0.378 0.115 0.268 -0.392 -0.522
2019 0.152 0.119 -0.061 0.274 -0.411 -0.529
Below are the graphs of six components for Albania, during 1996-2019 period. A lack of stability is observed in the
behavior of these indicators for the period analyzed and the values of all six indicators have deteriorated in 2019.
Voice and Accountability and Regulatory Quality Indicators have a positive trend and positive values
after 2005.
Rule of Law and Control of Corruption indicators have only negative values. For more, the values in
2019 are lower than the values in 2018.
Political Stability and Absence of Violence indicators, although has a stability in period 2014-2018,
while there is a decline in 2019.
Government Effectiveness indicator, has positive values only in period 2015-2018. In 2019, the value
goes to negative again.

International Conference on Management, Economics and Business (IConMEB)
October 29–November 1, 2020, Antalya/TURKEY
35
-1.1
-1.0
-0.9
-0.8
-0.7
-0.6
-0.5
-0.4
-0.3
96 98 00 02 04 06 08 10 12 14 16 18
RuleofLaw
-.5
-.4
-.3
-.2
-.1
.0
.1
.2
.3
96 98 00 02 04 06 08 10 12 14 16 18
RegulatoryQuality
-.6
-.4
-.2
.0
.2
.4
.6
96 98 00 02 04 06 08 10 12 14 16 18
PoliticalStability/NoViolence
-.8
-.6
-.4
-.2
.0
.2
96 98 00 02 04 06 08 10 12 14 16 18
GovermentEffectiveness
-1.1
-1.0
-0.9
-0.8
-0.7
-0.6
-0.5
-0.4
96 98 00 02 04 06 08 10 12 14 16 18
ControlofCorruption
Figure 1: The graphs of six components for Albania, during 1996-2019 period
Methodology and Empirical Analysis
Methodology
In this study the relationship between good governance and economic development is tested using regression
analysis. In order to define the good governance, is used the database of World Bank for six different World
Governance Indicators (WGI), which are: government effectiveness, political stability, control of corruption and
regulatory quality, voice and accountability, and rule of law.
In order to avoid the multicollinearity problem, caused by the correlation between the six components (see table 2),
is calculated a unique composite index using principal component analysis, and this index was named the Good
Governance Index (GGI). Firstly, since the values for the six components are missing for years 1997, 1999 and
2001, they are supplemented by the average of the neighboring values. For example, the missing value for Control
-.8
-.6
-.4
-.2
.0
.2
.4
96 98 00 02 04 06 08 10 12 14 16 18
VoiceandAccountability

International Conference on Management, Economics and Business (IConMEB)
October 29–November 1, 2020, Antalya/TURKEY
36
of Corruption for the year 1997 is calculated as the average of values for Control of Corruption for years 1996 and
1998.
After that, using Principal Component Analysis, is constructed the Good Governance Index (GGI), which will be
used to perform regression analysis. The principal Component Analysis is a statistical technique which is used for to
reduce the dimensionality of large data sets, by transforming the original set of correlated variables into e new
smaller set of uncorrelated ones. The PCA is recommended in cases when the researcher is interested to determine
the minimum number of factors that explain the maximum variance in original data. The first component founded by
PCA, which is linear combination of original variables, is the one that explain the most variability in the original
data, after the second and so on. After performing the PCA, is identified the unique component that explain about
the 85% of variability in the original data. This component is called Good Governance Index and is taken into
consideration to test for the relationship between Good Governance and economic growth.
Table 2: The correlation matrix for the 6 components values for Albania for 1996-2019 time period
The values for economic growth were transform into logarithmic form to improve the distribution and avoid the
effect of outliers. In order to avoid the spurious regression, before performing the regression analysis, the variables
are tested for stationarity. The test used for stationarity is Augmented Dickey Fuller test (ADF). As the both series:
Good Governance Index (GGI)t and economic growth (lnEG)t result non stationary, they are differenced. After that,
the new series d(GGI)t and d(lnEG)t, result stationary. On the other hand, the simple regression analysis is used to
test for the effect of good governance to economic growth. The model of simple linear regression is:
d(lnEG)t = γ0 + γ1 d(GGI)t+εt, where εt is the error term. (1)
Finally, the Granger Causality Test was performed to test which kind of causality exists between two stationary
variables d(GGI)t and d(EG)t: Unidirectional causality, bilateral causality or the series are independent.
Data Analysis
In order to study the relationship between the two variables good governance and economic growth in the Albanian
context, we have utilized data taken from the website of the World Bank, corresponding to the 1996-2019 time
period. The data for economic growth are in (%) while the values for each of six different World Governance
Indicators (WGI): government effectiveness, political stability, control of corruption and regulatory quality, voice
and accountability, and rule of law are between -2.5 and +2.5. The Table 3 below presents the result from Kaiser –
Meyer – Olkin measure of sampling Adequacy and Bartlett’s Test of Sphericity.
Table 3: KMO and bartlett's test Kaiser-Meyer-Olkin Measure of Sampling Adequacy. 0.887
Bartlett's Test of Sphericity
Approx. Chi-Square 169.4
df 15
Sig. 0
As the value of KMO is greater than 0.8, this is an indication that principal Component Analysis is useful in our
case.This result can be stressed by the result from Bartlett’s test of Sphericity as the significance value is 0.000,
smaller than 𝛼=0.05.This result demonstrate that there is a certain redundancy between the variables that can
Correlation
Coefficient
Voiceand
Accountability
Political
Stability
Government
Effectiveness
Regulatory
Quality
Ruleof
Law
Controlof
Corruption
Voiceand Accountability
1 0.639 0.757 0.726 0.717 0.818
PoliticalStability 0.639 1 0.916 0.753 0.869 0.855
Government Effectiveness
0.757 0.916 1 0.865 0.925 0.912
RegulatoryQuality 0.726 0.753 0.865 1 0.812 0.814
RuleofLaw 0.717 0.869 0.925 0.812 1 0.903
ControlofCorruption 0.818 0.855 0.912 0.814 0.903 1

International Conference on Management, Economics and Business (IConMEB)
October 29–November 1, 2020, Antalya/TURKEY
37
summarize with a few number of components. Based on the findings of PCA, conducted on original data, only a
single principal component was obtained, with an eigenvalue of 5.105.
Figure 2: The scree plot identifies one component
From Table 4, can be seen that the principal component explains about 85.084% of variances from the original data
set.
Table 4: The result from principal component analysis Component Initial Eigenvalues Extraction Sums of Squared Loadings
Total % of
Variance
Cumulative % Total % of Variance Cumulative
%
1 5.105 85.084 85.084 5.105 85.084 85.084
2 0.406 6.76 91.844
3 0.241 4.009 95.854 4 0.124 2.063 97.917
5 0.079 1.31 99.227
6 0.046 0.773 100
Extraction Method: Principal Component Analysis.
Also, the variables are loaded on the principal component with very high loading values ranging between 83.7% and
97.4%.
Table 5: The component matrix Component 1
VoiceandAccountability 0.837
PoliticalStability 0.913
GovermentEffectiveness 0.974
RegulatoryQuality 0.898
RuleofLaw 0.947
ControlofCorruption 0.959
Extraction Method: Principal Component Analysis.
a. 1 components extracted.
So, for further analysis, is taken into consideration the first component identified by principal component analysis
and this component is called Good Governance Index. In order to avoid spurious regression, before performing the
regression analysis, is necessary doing the stationary tests for both variables. The test used is the Augmented Dickey
– Fuller for unit roots.
The results for all three cases, for both series (GGI)t and (lnEG)t are shown below.
Table 6: ADF test results for unit roots for (GGI)t and for (lnEG)t Null Hypothesis: (GGI)t has a unit root Null Hypothesis: (lnEG)t has a unit root
Exogenous:
None
Exogenous:
Constant, Linear
Trend
Exogenous:
Constant
Exogenous:
None
Exogenous:
Constant, Linear
Trend
Exogenous:
Constant
p=0.2850 p=0.0517 p=0.7572 p=0.3354 p=0.5967 p=0.0521

International Conference on Management, Economics and Business (IConMEB)
October 29–November 1, 2020, Antalya/TURKEY
38
As p-values are greater than 𝛼=0.05, we conclude that both series are not stationary. After that, the variables are
tested in first difference for stationarity using again the ADF test and both variables became stationary at 5% level of
significance.
Table 7: ADF test results for unit roots for d(GGI)t and for d(lnEG)t
Null Hypothesis: d(GGI)t has a unit root Null Hypothesis: d(lnEG)t has a unit root
Exogenous:
None
Exogenous:
Constant,
Linear Trend
Exogenous:
Constant
Exogenous:
None
Exogenous:
Constant,
Linear Trend
Exogenous:
Constant
p=0.0014 p= 0.0350 p=0.0063 p=0.000 p=0.000 p=0.000
So, both series d(GGI)t and d(lnEG)t are stationary.
The table 8 presents the result from regression analysis, considering as dependent variable d(lnEG)t and as
independent variable d(GGI)t.
Table 8: The estimated equation of model (1)
Variable
Estimated
coefficients S.E t-statistic P-value
c -0.022379 0.205078 -0.10912 0.9141
d(GGI)t 0.050968 0.700725 0.072736 0.9427
So, the estimated equation is: �� = - 0.022 + 0.051 x
The result from table 8 shows that although the sign before the independent variable d(GGI)t is positive, this
variable is not statistically significant as the p-value is 0.9427. This result shows that the variable Good Governance
Index is not statistically important to explain the variability of economic growth. Before testing for direction of
causality between variables d(lnEG)t and d(GGI)t using Granger Causality test, it is necessary to select an
appropriate lag order of the variables.
Table 9: Lag order selection criteria
VAR Lag Order Selection Criteria
Endogenous variables: GOODGOVERNANCEINDEX LNECONOMICGROWTH
Exogenous variables: C
Date: 10/14/20 Time: 00:37
Sample: 1996 2019
Included observations: 20
Lag LogL LR FPE AIC SC HQ
0 -6.150517 NA 0.007746 0.815052 0.914625 0.834489
1 21.02558 46.19937* 0.000766* -1.502558* -1.203838* -1.444245*
2 23.69811 4.008790 0.000890 -1.369811 -0.871945 -1.272622
3 24.40727 0.921904 0.001288 -1.040727 -0.343714 -0.904662
4 26.91496 2.758467 0.001615 -0.891496 0.004663 -0.716557
* indicates lag order selected by the criterion
LR: sequential modified LR test statistic (each test at 5% level)
FPE: Final prediction error
AIC: Akaike information criterion
SC: Schwarz information criterion
HQ: Hannan-Quinn information criterion
Table 9 presents the lag order of the variables selected by different tests. We have selected the lag 1, as it is
suggested from all criterions: LR, FPE, AIC, SC and HQ.

International Conference on Management, Economics and Business (IConMEB)
October 29–November 1, 2020, Antalya/TURKEY
39
The final step is identifying the direction of causality between variables (GGI)t and (lnEG)t. To test for causality,
we will use the Granger causality test. As for this test the variables are assumed to be stationary, it is necessary to
operate with the variables d(GGI)𝑡 and d(lnEG)𝑡. Using the results of table 9, the lag order of variables is 1.
The Granger Causality test involves estimating the pair of regressions:
d(GGI)𝑡= c + 𝛼1 d(lnEG)𝑡−1 + 𝛼2d(GGI)𝑡−1+ 𝑢1𝑡 (2)
d(lnEG)𝑡 = k + 𝛽1d(GGI)𝑡−1 + 𝛽2d(lnEG)𝑡−1+ 𝑢2𝑡 (3)
Where it is assumed that the disturbances 𝑢1𝑡 and 𝑢2𝑡 are uncorrelated. Equation (2) postulates that the current
(GGI)𝑡 is related to past values of itself as well as that of (lnEG)𝑡 and equation (3) postulates a similar behavior of
(lnEG)𝑡 . The Table 10 shows the results of the Granger Causality test.
Table 10: Granger Causality test results
Granger Causality test results
Lag 1 Null Hypothesis Prob
d(GGI)𝑡 does not Granger Cause
d(lnEG)𝑡 0.5302
d(lnEG)𝑡 does not Granger Cause
d(GGI)𝑡 0.9324
From Table 10, as the p values are both greater than 𝛼=5%, the null hypothesis is not rejected. In other words, the
d(GGI)𝑡 does not Granger Cause d(lnEG)𝑡 and vice versa. So, we conclude that the data-generating processes for
the two series: (GGI)𝑡 and (lnEG)𝑡, are independent variables.
Conclusions
This study used Principal Component Analysis and the simple regression analysis to examine the relationship
between Good Governance and Economic Development in Albania, using data from World Bank for 1996-2019
time period. Through Principal Component Analysis, using all the data for six indicators: government effectiveness,
political stability, control of corruption and regulatory quality, voice and accountability, and rule of law, is identified
the unique component that explain about the 85% of variability in the original data. This component is called Good
Governance Index and is taken in consideration for regression analysis. The results indicate that Good Governance
is not statistically important to explain economic growth in Albania. For more, using Granger Causality test results
that neither of variables cause the other. This result can be explained with the current model of economic growth in
Albania that is based mainly on remittances, public debt, donations, soft loans and foreign aid. It is time to
implement wise and solid policies for economic growth to guarantee its long term sustainability.
References
Aikins, S., (2009), Global financial crisis and government intervention: A Case for effective regulatory governance,
International Public Management Review, 10(2): 23-43.
Alam, R., Kitenge E., Bedane B., (2017). Government effectiveness and economic growth, economics bulletin,
Access Econ, 37(1), 222-227.
AlBassam, B. A. (2013). The relationship between governance and economic growth during times of
crisis. European Journal of Sustainable Development, 2(2), 1.
Civici, A. (2020). Tiparet E Rritjes Ekonomike Në Shqipëri 1992-2018. Ndërtimi I Profilit Të Ri Të Ekonomisë
Shqiptare. Forumi – Modeli Ekonomik & Sfidat.
Davidoff, S. M., & Zaring, D. (2009). Regulation by deal: The government's response to the financial crisis. Admin.
L. Rev., 61, 463.
Freedom House Raport, (2020), Freedom in the World – Albania Country Report 2020, Retrieved from
https://freedomhouse.org/report/special-report/2020/democracy-under-lockdown

International Conference on Management, Economics and Business (IConMEB)
October 29–November 1, 2020, Antalya/TURKEY
40
Hall, R. E., & Jones, C. I. (1999). Why do some countries produce so much more output per worker than others?
(No. w6564). National Bureau of Economic Research.
Hashem, E. (2019). The Impact of governance on economic growth and human development during crisis in middle
east and north africa. International Journal of Economics and Finance, 11, 8; 61-79.
Kaufmann D., Kraay A., & Mastruzzi M., (2010), The worldwide governance indicators methodology and analytical
issues. The World Bank Development Research Group Macroeconomics and Growth Team, Policy
Research Working Paper 5430
Kaufman, D,, Kraay, A & Mastruzzi, M (2015). The worldwide governance indicators methodology and analytical
issues, Hague Journal on the Rule of Law volume 3, 220–246.
Khan, M.H. (1995). State failure in weak states: A critique of new institutionalist explanations, in harriss, John,
Janet Hunter and Colin M. Lewis (eds). The New Institutional Economics and Third World Development,
London: Routledge.
Kraay A., Kaufmann D., & Mastruzzi M., (2010). The worldwide governance indicators: Methodology
andanalytical issues. Draft Policy Research Working Paper, World Bank.
Mira. R, Hammadache. A, (2018). Good Governance and Economic Growth: A Contribution to the Institutional
Debate about State Failure in Middle East and North Africa. Journal of Middle Eastern and Islamic
Studies, 11(3), 107-120
Pere, E., (2015). The impact of good governance in the economic development of western Balkan countries.
European Journal of Government and Economics, 4(1), 25-45.
World Bank (1992). Governance and Development. Washington, D.C.
Author Information Teuta Xhindi Mediterranean University
Bulevardi Gjergj Fishta 52, Tirana 1023, Albania
Contact e-mail: [email protected]
Olgerta Idrizi Mediterranean University
Bulevardi Gjergj Fishta 52, Tirana 1023, Albania
The Eurasia Proceedings of
Educational & Social Sciences (EPESS)
ISSN: 2587-1730
- This is an Open Access article distributed under the terms of the Creative Commons Attribution-Noncommercial 4.0 Unported License,
permitting all non-commercial use, distribution, and reproduction in any medium, provided the original work is properly cited.
- Selection and peer-review under responsibility of the Organizing Committee of the Conference
© 2020 Published by ISRES Publishing: www.isres.org
The Eurasia Proceedings of Educational & Social Sciences (EPESS), 2020
Volume 19, Pages 41-49
IConMEB 2020: International Conference on Management, Economics and Business
Comparison of Financial Performances of Banks by Multi Criteria
Decision Making Methods: The Case of Turkey
Mehmet Nuri SALUR
Necmettin Erbakan University
Yasin CIHAN
Necmettin Erbakan University
Abstract: The share of participation banking in the finance sector has been growing in recent years. This
growth indicates that participation banking will be an important competitor for traditional banking in the
banking system. In this context, the financial performances of traditional banking and participation banking are
compared in this study. While measuring, primarily the data obtained from banks' financial statements were
used. These data, consisting of 15 financial ratios in 5 different categories, have been obtained from banks’
financial statements and income statements. In this study, the financial performance of 18 traditional banks and
3 participation banks operating in Turkey between 2010 and 2018 were analyzed with multivariate decision-
making methods. The Technique for Order Preference by Similarity to Ideal Solution (TOPSIS) method was
used to measure the financial performance. As a result of the analysis, it was determined which banks showed
better financial performance and the results were commented.
Keywords: Financial Performance, Multi Criteria Decision Making, TOPSIS
Introduction
Banks are institutions that provide the funds they collect from people and institutions with excess funds as loans
to people and institutions in need of funds in exchange for a certain interest. Besides intermediation activities
between the real sector and the financial sector, banks are institutions that bring the idle funds in the economic
life to the real economy (Bektaş, 2020: 794).
Banks have vital importance in delivering the funds required for individuals and institutions in the country’s
economy, and in this respect, they play an important role in the economic development and growth of countries. These features make them an indispensable element of economic life. Banks are also involved in other activities
besides loan transactions such as investment consulting, mediation, guarantee and ownership, property
assurance (Özkan and Deliktaş, 2020: 32) (Yetkin and Sandalcılar, 2017: 51).
There are serious groups of people in the world trying to stay away from the banks because of interest,
especially in countries with a large Muslim population. Turkey is one of these countries. Although this system,
which purposes risk sharing based on participation in profit and loss, is known as interest-free banking in the
world, it is called participation banking in Turkey. Thanks to this system, which is an alternative to traditional
banking, funds that are not directed to traditional banks because of the interest sensitivity of the savers are
brought to the real economy (Parlakkaya and Çürük, 2011: 397). This alternative system, which has gained an
increasingly important place in the financial system, has complemented traditional banks in recent years and
adds depth and diversity to the financial sector (Özulucan and Deran, 2009: 86).
Since both traditional banking and participation banking are important actors of the financial sector, they
significantly affect the national economies. For this reason, an accurate and reliable measurement of the
financial performance of banks and realistic analysis of their financial structures are of vital importance for a
sound banking system (Kaygusuz, Ersoy and Bozdoğan, 2020: 68). It is important to measure and evaluate their

International Conference on Management, Economics and Business (IConMEB)
October 29–November 1, 2020, Antalya/TURKEY
42
financial performance, as participation banks have increased their shares in the Turkish banking sector in recent
years. Monitoring the financial performance of banks in a comparative, holistic, and practical way can be done
with multi-criteria decision making (MCDM) techniques (Sarı and Kabakçı, 2019: 371).
In this study, the financial performances of 18 traditional banks and 3 participation banks operating in Turkey
between 2010-2018 were compared. We divided the data used in the study into 5 different categories comprises
15 financial ratios. We got these financial ratios from the financial statements of the banks. In our study,
TOPSIS method, which is one of the Multi-Criteria Decision Making (MCDM) techniques often used in
financial performance comparisons, was used.
Literature
The table below summarizes some studies in this field.
Table 1. Summary of Literature
Research Year Method Result
Yudistira (2004) 1998-1999 DEA
As a result of the research, it was concluded that
inefficiency in Islamic banks was low and Islamic
banks performed very well during the 1998-1999
global crisis.
Demireli (2010) 2001-2007 TOPSIS
As a result of the study, it was concluded that
state-owned banks were affected by local and
global financial crises.
Özgür (2008) 2001-2005 DEA
As a result of the analysis, it was concluded that
total factor productivity is closely related to
efficiency.
Dinçer and
Görener (2011)
VIKOR and
TOPSIS
As a result of the study, they found that foreign
banks had a better performance than other banks.
Çetin and Bıtırak
(2010) 2005- 2007 AHS
As a result of this study, Akbank ranked first
among commercial banks during the research
period.
Yayar and
Baykara (2012) 2005–2011 TOPSIS
As a result of this study, AlbaraTurk ranked first
among participation banks in the research period.
Onour and
Abdalla (2011) 2007-2008 DEA
It has been demonstrated that bank size is an
important factor for scale efficiency.
Sakarya and Kaya
(2013) 2005-2012
Panel Data
Methods
According to the results of the research, it has
been concluded that while the participation banks
have higher equity and focus on financial
intermediation activities, they do not differ from
other banks in terms of efficiency and
profitability.
Doğan (2013) 2005-2011 t test
As a result of the analysis, it has been determined
that traditional banks have higher liquidity,
solvency and capital adequacy and lower risk than
participation banks. However; There is no
statistically significant difference between the
profitability of participation banks and traditional
banks.
Kandemir (2016) 2004-2014 TOPSIS-
VIKOR
As a result of the research; Vakıfbank was the
bank with the highest financial performance and
Şekerbank was the bank with the lowest financial
performance.
Esmer and Bağcı
(2016) 2005-2014 TOPSIS
As a result, financial performance analysis can
provide the investor with opportunities to invest
by providing tips on predicting the future.

International Conference on Management, Economics and Business (IConMEB)
October 29–November 1, 2020, Antalya/TURKEY
43
Financial Performance
Performance is a concept that determines the output quantitatively and qualitatively in line with the determined
target (Vural, 2013: 45). We can define the efficient use of resources in an enterprise and the financial position
of the enterprise as financial performance. In other words, financial performance is a measure of how effectively
resources are used rather than total output (Karaoğlan and Şahin, 2018: 63).
Financial performance plays an important role in determining the financial structures of enterprises,
investments, and the efficiency and risk level of these investments. Business managers also need financial
performance measurements for the realistic evaluation of past term activities and for future investments and
financing decisions (Uygurtürk and Korkmaz, 2012: 96). In business life, that there is intense competition, it is
necessary for the banks to make the best decisions, to continue their activities effectively, and to maximize
profits. The effective operation of the banking sector, which determines the resource distribution and acts as a
financial intermediary, unlike other sectors in the economy, is of great importance for the economy. This
situation has brought the banking sector to a central position in the economic development of the countries
(Ertuğrul and Karakaşoğlu, 2009: 20). Especially with the global crisis in the 2000s, it is an undeniable reality
that financial performance measures are now important in the banking sector.
Financial performance is the measure of the level of achievement of financial targets for banks. By measuring
their financial performance, banks make more accurate evaluations in terms of how much they achieve their
profitability and growth targets, customer satisfaction levels, service quality, employee performance, and
accordingly regulating wages (Latifi, 2015: 30). Therefore, analyzing financial performance is a vital issue for
all banks.
TOPSIS Method
The TOPSIS method is one of multi-criteria decision-making methods developed by Hwang and Yoon in 1981
to solve multi-criteria decision-making problems.“The chosen alternative should have the shortest distance from
the ideal solution and the farthest from the negative-ideal solution” (Yoon and Hwang, 1995: 75). With this
method, it is possible to rank alternative options according to certain criteria and by analyzing their distance to
the ideal solution between the maximum and minimum values that the criteria can take. Topsis method
comprises the following steps and a series of mathematical calculations.
Step 1: Construct the decision matrix
The figure below shows the Decision matrix.
In matrix Aij, m shows the number of decision points and n shows the number of evaluation factors.
Step 2: Normalized Decision Matrix (R) The Normalized matrix is calculated according to the following formula:

International Conference on Management, Economics and Business (IConMEB)
October 29–November 1, 2020, Antalya/TURKEY
44
Step 3: Weighted Normalized Decision Matrix (V)
The weights are distributed so that the sum of the weight values is 1.
Then the elements in each column of the Matrix R are multiplied by Wi, creating The Matrix V.
Step 4: Determination of Ideal (A+) and Negative Ideal (A
-) Solution
At this stage, the maximum and minimum values in each column in the weighted decision matrix are
determined.
A+ = {v1
+, v2
+, …, vn
+} (Max Values)
A- = {v1
-, v2
-, …, vn
-} (Min Values)
Step 5: Calculation Of Distance Measures Between Alternatives
In this step, the distance values to the maximum and minimum ideal points are calculated using the following
formulas.
Step 6: Calculation of the relative closeness to the ideal solution
The relative closeness of each decision point to the ideal solution is calculated according to the formula below.
i = 1, …,m j = 1,…,n

International Conference on Management, Economics and Business (IConMEB)
October 29–November 1, 2020, Antalya/TURKEY
45
The value of Cİ lies in the range 0 to 1. Ci=1 shows the ideal solution, Ci=0 shows the negative ideal solution
(Ömürbek and Kınay, 2013:352-355).
Application
In this study, the financial performance of 18 traditional banks and 3 participation banks operating in Turkey
between 2010 and 2018 was examined with multivariate decision-making methods. The figure1 below shows
the financial ratios used in the study.
Figure1. Financial performance ratios
Banks whose financial performances were calculated in the study are shown in Appendix. There are two steps in
the study. In the first step, we got an overall ranking of all banks. In the second step, banks were grouped as
conventional public banks, conventional private banks and participation banks and then sorted. All stages of the
TOPSIS method are shown in the Appendix. The last stage, the ranking table, is shown below. According to this
table;
Table 2. TOPSIS Ranking Results
Si* Sİ- Ci* Rank
Akbank T.A.Ş. 0.022890514 0.053203738 0.699182091 1
Türkiye Garanti Bankası A.Ş. 0.024511167 0.053428983 0.685512962 2
Türkiye Cumhuriyeti Ziraat Bankası A.Ş. 0.025455672 0.053690506 0.678371432 3
Türkiye İş Bankası A.Ş. 0.027128045 0.050050708 0.648503713 4
Anadolubank A.Ş. 0.029776015 0.048547491 0.619832964 5
Türkiye Halk Bankası A.Ş. 0.033150335 0.048498452 0.59398864 6
KVYT 0.030428258 0.044491173 0.593853588 7
Yapı ve Kredi Bankası A.Ş. 0.0312249 0.045550475 0.593295372 8
Citibank A.Ş. 0.03660039 0.052784105 0.590528647 9
Denizbank A.Ş. 0.030809651 0.044121487 0.588827132 10
Türk Ekonomi Bankası A.Ş. 0.031376977 0.043001772 0.578145946 11
TF 0.032807265 0.041012664 0.555577127 12
ING Bank A.Ş. 0.034118523 0.040472286 0.54259079 13
Türkiye Vakıflar Bankası T.A.O. 0.035030401 0.04046617 0.536000103 14
ALB 0.036526271 0.039832633 0.521650145 15
Fibabanka A.Ş. 0.04034131 0.040989603 0.503985525 16
Turkish Bank A.Ş. 0.040256662 0.037165972 0.480040143 17
Alternatifbank A.Ş. 0.042226715 0.033033065 0.438920562 18
Şekerbank T.A.Ş. 0.041958285 0.032783199 0.438621193 19
HSBC Bank A.Ş. 0.046263847 0.025486478 0.355210624 20
Turkland Bank A.Ş. 0.055156928 0.027749041 0.334704985 21

International Conference on Management, Economics and Business (IConMEB)
October 29–November 1, 2020, Antalya/TURKEY
46
Akbank is the most successful bank according to our calculations. It is followed by Garanti Bank and Ziraat
Bank. According to the report published by Brand Finance, these three banks are in the list of the most powerful
Turkish banks between 2014-2020. The last three banks are Şekerbank HSBC Bank and Turkland Bank.
As a second step, banks were grouped as conventional public, conventional private and participation, and ranked
using the same methods. As seen in the table, the most successful bank group is state banks, secondly to
participation banks and third to private banks.
Table 3. TOPSIS Ranking Results (Group)
Si* Sİ- Ci* Rank
Public Conventional 0.024296859 0.037735749 0.608321181 1
Private Participation 0.036537564 0.029478287 0.446533471 2
Private Conventional 0.039451644 0.028353273 0.418159541 3
Conclusion
In this study, we analyzed the financial performance of conventional banks and participation banks operating in
Turkey using the TOPSIS method. According to the results of the first analysis, Akbank took first place.
According to the results of the second analysis, public banks took first place. According to the results of the
study, while the positive performances of public banks were similar to the studies of Demireli (2010) and
Kandemir (2016), opposite results with the studies of Dinçer and Görener (2011). The result is not surprising.
Because public banks can find deposits more easily and provide services to more customers compared to other
banks. The reason private banks are in the last place is that banks such as Turkland Alternatifbank and
Turkishbank and Fiba bank have tiny volumes and limited banking transactions. These banks lowered the
average of the private bank's group.
In future studies, contributions to the literature can be made by adding new participation banks, removing small
volume private banks, and using different financial ratios.
References
Akgüç, Ö. (2007). Banka Yönetimi ve Performans Analizi. İstanbul: Arayış Basım ve Yayıncılık, 1. Baskı.
Aydın, N., Başar, M. & Coşkun, M. (2010). Finansal yönetim. İstanbul: Detay Yayıncılık (2. Baskı).
Bektaş, S. (2020). Mevduat bankalarının finansal performanslarının sıralanması: Türk mevduat bankalarının
entropi ve mairca yöntemleriyle performans analizi. Akademik İncelemeler Dergisi, 15(2), 784-814.
Bozdoğan, T., Ersoy, B. & Kaygusuz M. (2018), CAMELS değerlendirme sistemiyle katılım bankalarının
finansal performanslarının TOPSIS yöntemiyle analizi. Journal of Social and Humanities Sciences
Research, 5(30), 4309-4323.
Çetin, A.C. & Bıtırak İ.A. (2010). Banka karlılık performansının analitik hiyerarşi süreci ile değerlendirilmesi:
Ticari bankalar ile katılım bankalarında bir uygulama, Uluslararası Alanya İşletme Fakültesi Dergisi,
2(2).
Demireli, E. (2010). TOPSİS çok kriterli karar verme sistemi: Türkiye’deki kamu bankaları üzerine bir
uygulama. Girişimcilik ve Kalkınma Dergisi, 5(1).
Doğan, M. (2013). Katılım ve geleneksel bankaların finansal performanslarının karşılaştırılması: Türkiye
örneği. Muhasebe ve Finansman Dergisi,58, 175-188.
Dinçer, H. & Görener, A. (2011). Analitik hiyerarşi süreci ve vikor tekniği ile dinamik performans analizi:
Bankacılık sektöründe bir uygulama. İstanbul Ticaret Üniversitesi Sosyal Bilimler Dergisi, 10
(19).109-127.
Esmer, Y., & Bağcı, H. (2016). Katılım bankalarında finansal performans analizi: Türkiye örneği-Financial
performance analysis of participation banks: The case of Turkey. Mehmet Akif Ersoy Üniversitesi
Sosyal Bilimler Enstitüsü Dergisi, 8(15), 17-30.
Ertuğrul, İ., & Karakaşaoğlu, N. (2009). Banka şube performanslarının vikor yöntemi ile
değerlendirilmesi. Endüstri Mühendisliği Dergisi, 20(1), YA/EM 2008 Özel Sayısı, 19-28.
Kandemir, T., & Karataş, H. (2016). Ticari bankaların finansal performanslarının çok kriterli karar verme
yöntemleri ile incelenmesi: Borsa İstanbul’da işlem gören bankalar üzerine bir uygulama (2004-
2014). İnsan ve Toplum Bilimleri Araştırmaları Dergisi, 5(7), 1766-1776.

International Conference on Management, Economics and Business (IConMEB)
October 29–November 1, 2020, Antalya/TURKEY
47
Karaoğlan, S., & Şahin, S. (2018). BİST XKMYA işletmelerinin finansal performanslarının çok kriterli karar
verme yöntemleri ile ölçümü ve yöntemlerin karşılaştırılması. Ege Akademik Bakış Dergisi, 18(1), 63-
80.
Kaygusuz, Ö, Ersoy, Ö, Bozdoğan, D. (2020). Camels değerlendirme sistemiyle bankaların finansal
performanslarının TOPSIS yöntemiyle analizi. İnsan ve Toplum Bilimleri Araştırmaları Dergisi, 9(1),
67-95.
Latifi, P. (2015). Arnavut bankacılık sektöründe finansal performans değerlendirmesi. Yayımlanmamış Yüksek
Lisans Tezi, Dokuz Eylül Üniversitesi, Sosyal Bilimler Enstitüsü, İzmir.
Onour, I. A., & Abdalla, A. M. (2011). Efficiency of Islamic banks in Sudan: A non-parametric approach.
Journal of Islamic Economics, Banking and Finance, 7(4), 79-92.
Özgür, E. (2008). Katılım bankalarının finansal etkinliği. Afyon Kocatepe Üniversitesi İktisadi ve İdari Bilimler
Fakültesi Dergisi, 10(1), 159-175.
Özkan, G., & Deliktaş, E. (2020). Banka performanslarının TOPSIS yöntemiyle analizi. İzmir Katip Çelebi
Üniversitesi İktisadi ve İdari Bilimler Fakültesi Dergisi, 3(1), 31-40.
Özulucan, A. & Deran, A. (2009). Katılım bankacılığı ile geleneksel bankaların bankacılık hizmetleri ve
muhasebe uygulamaları açısından karşılaştırılması. Mustafa Kemal Üniversitesi Sosyal Bilimler
Enstitüsü Dergisi, 6(11), 85-108. ,
Ömürbek, V., & Kınay, Ö. G. B. (2013). Havayolu taşimaciliği sektöründe TOPSIS yöntemiyle finansal
performans değerlendirmesi. Süleyman Demirel Üniversitesi İktisadi ve İdari Bilimler Fakültesi
Dergisi, 18(3), 343-363.
Parlakkaya, R. & Çürük Akten, S. (2011). Finansal rasyoların katılım bankaları ve geleneksel bankalar arasında
bir tasnif aracı olarak kullanımı: Türkiye örneği. Ege Akademik Bakış, 11(3), 397-405.
Sakarya, B., & Kaya, Y. (2013). Katılım bankaları mevduat bankalarından farklı mı çalışıyor? EY International
Congress on Economics I "Europe and Global Economic Rebalancing”, 24- 25 Ekim, Ankara/Turkey,
(1-13).
Sarı, E. B., & Kabakçı, C. Ç. (2019). Türk bankacılık sektöründe finansal performansın tercih seçim endeksi
(PSI) yöntemiyle analizi. Ekonomi Politika ve Finans Araştırmaları Dergisi, 4(3), 370-383.
Uygurtürk, H., & Korkmaz, T. (2012). Finansal performansın TOPSIS çok kriterli karar verme yöntemi ile
belirlenmesi: Ana metal sanayi işletmeleri üzerine bir uygulama. Eskişehir Osmangazi Üniversitesi
İktisadi ve İdari Bilimler Dergisi, 7(2), 95-115.
Vural, U. (2013). Geleneksel olmayan para politikalarının yükselişi, TCMB uzmanlık yeterlilik tezi, Ankara.
Yayar, R. & Baykara, H.V. (2012). TOPSIS yöntemi ile katılım bankalarının etkinliği ve verimliliği üzerine bir
uygulama. Business and Economics Research Journal, 3(4), 21-42.
Yetkin, F., & Sandalcılar, A. R. (2017). Türkiye'de bankacılık sektörünün sürdürülebilir kalkınmaya
etkileri. Recep Tayyip Erdoğan Üniversitesi Sosyal Bilimler Dergisi, 4(7), 43-65.
Yoon, P. & Ching-Lai, H. (1995). Multiple attribute decision making: An introduction, quantitative applications
in the social sciences. Sage Publications.
Yudistira, D. (2004). Efficiency in islamic banking: An empirical analysis of eighteen banks. Islamic Economic
Studies, 12(1), 1-19.
Author Information Mehmet Nuri SALUR Necmettin Erbakan University
Faculty of Political Science
Konya, TURKEY
Contact e-mail: [email protected]
Yasin CİHAN Necmettin Erbakan University
Faculty of Political Science
Konya, TURKEY
Contact e-mail: [email protected]

International Conference on Management, Economics and Business (IConMEB)
October 29–November 1, 2020, Antalya/TURKEY
48
Appendix
1) Normalized Decision Matrix ROA ROE Net Income/ DepositsOpe.exp/Asset Ope. Inc/Asset Net.In.M Non-per lo/loans Loan/Depo Loan/Asset Pro/Loan Depo/Asset Debt/Equity Asset/Equity Cash/Asset Cash/Depo
Türkiye Cumhuriyeti Ziraat Bankası A.Ş. 0.291 0.331 0.273687681 0.188246527 0.208088905 0.205051769 0.104454778 0.181796978 0.190852635 0.108801026 0.229309847 0.226951883 0.226469395 0.230109907 0.210203851
Türkiye Halk Bankası A.Ş. 0.287 0.323 0.257053992 0.199659951 0.214817842 0.181751451 0.180945945 0.200080488 0.219995967 0.199995216 0.235276549 0.237026086 0.235521399 0.148708634 0.137115301
Türkiye Vakıflar Bankası T.A.O. 0.219 0.25 0.227601893 0.204854148 0.218399701 0.18345768 0.234167142 0.232741237 0.225331165 0.299808701 0.207075658 0.236247295 0.23482163 0.181174352 0.171510215
Akbank T.A.Ş. 0.296 0.256 0.323058622 0.177165166 0.205747078 0.18725826 0.114954935 0.211414379 0.195592289 0.155253075 0.196903378 0.172550285 0.177587762 0.250635171 0.241423117
Anadolubank A.Ş. 0.287 0.221 0.271128622 0.262423112 0.275099287 0.256679668 0.171695121 0.210921578 0.230275388 0.185597074 0.233513114 0.153300483 0.160291179 0.171596052 0.168966095
Fibabanka A.Ş. 0.099 0.146 0.102419267 0.240649008 0.219665976 0.188830618 0.106534104 0.240615729 0.260543172 0.062142025 0.232879239 0.277229697 0.271645672 0.153055884 0.14641666
Şekerbank T.A.Ş. 0.144 0.143 0.136224725 0.292651108 0.282214726 0.251324707 0.31316723 0.216142627 0.23005549 0.254520712 0.226868443 0.219383425 0.219668885 0.150936452 0.142474474
Turkish Bank A.Ş. 0.04 0.031 0.036321019 0.214328792 0.179612525 0.184618954 0.142378104 0.175053084 0.189971817 0.114634357 0.228714365 0.146769318 0.154422711 0.293862505 0.282478442
Türk Ekonomi Bankası A.Ş. 0.187 0.207 0.185418616 0.244968707 0.236507517 0.226629106 0.150998974 0.23334448 0.237879998 0.13981694 0.216939687 0.224146666 0.223948815 0.190888258 0.186650514
Türkiye İş Bankası A.Ş. 0.269 0.252 0.285479279 0.194067685 0.209066528 0.185897374 0.125279623 0.225014339 0.211232319 0.15261941 0.201052589 0.185635311 0.18934509 0.194918473 0.192571916
Yapı ve Kredi Bankası A.Ş. 0.256 0.249 0.274387511 0.190458942 0.209366795 0.182918461 0.219256057 0.235137372 0.220912469 0.222791094 0.199906018 0.200234827 0.202463237 0.169292791 0.175739276
Alternatifbank A.Ş. 0.105 0.152 0.12413991 0.230787837 0.227387828 0.193650004 0.265560031 0.269769472 0.232798951 0.2076432 0.184154364 0.305392382 0.296950773 0.155445045 0.149353274
Citibank A.Ş. 0.336 0.237 0.29247405 0.253024615 0.258399291 0.329097303 0.360989913 0.118465321 0.136057751 0.46103808 0.243203037 0.139051279 0.147487799 0.421930577 0.416550576
Denizbank A.Ş. 0.248 0.264 0.263600517 0.227338474 0.235757229 0.237937214 0.249293119 0.226070399 0.21573216 0.249161039 0.203254359 0.223955755 0.223777275 0.195834316 0.198375987
HSBC Bank A.Ş. 0.061 0.043 0.06077844 0.25324999 0.235220883 0.248471042 0.377550325 0.205912232 0.195992698 0.366678836 0.205488182 0.226378237 0.225953955 0.29409049 0.293657133
ING Bank A.Ş. 0.143 0.147 0.169009975 0.235855121 0.22984772 0.269028554 0.171601861 0.290453649 0.245373275 0.155899331 0.180101496 0.209303701 0.21061192 0.175360712 0.17092116
Turkland Bank A.Ş. -0.08 -0.07 -0.059243932 0.311865592 0.265458294 0.194301377 0.284931325 0.185498097 0.217717007 0.168731474 0.250464575 0.162502836 0.168559797 0.219430552 0.20879675
Türkiye Garanti Bankası A.Ş. 0.305 0.273 0.338914621 0.189089022 0.218013906 0.210827329 0.140822214 0.22778851 0.206575045 0.161476983 0.193106122 0.176467527 0.181107533 0.211544123 0.208194075
ALB 0.17 0.224 0.144735116 0.104725163 0.109292472 0.183630128 0.201440649 0.199204815 0.233263958 0.179523517 0.24898243 0.28373079 0.277675787 0.183040361 0.200789195
KVYT 0.191 0.241 0.174900236 0.113159532 0.119522907 0.200598632 0.134587259 0.197371083 0.217085207 0.15287552 0.233956122 0.261148556 0.257316274 0.223543444 0.260327938
TF 0.189 0.197 0.187612011 0.116287779 0.12149034 0.212921616 0.218798632 0.241498956 0.238187595 0.197009295 0.211276121 0.218724635 0.219162375 0.173311226 0.225334467
2) Weighted Normalized Decision Matrix ROA ROE Net Income/ DepositsOpe.exp/Asset Ope. Inc/Asset Net.In.M Non-per lo/loans Loan/Depo Loan/Asset Pro/Loan Depo/Asset Debt/Equity Asset/Equity Cash/Asset Cash/Depo
Türkiye Cumhuriyeti Ziraat Bankası A.Ş.0.019214898 0.021832706 0.018063387 0.012424271 0.013733868 0.013533417 0.006894015 0.011998601 0.012596274 0.007180868 0.01513445 0.014978824 0.01494698 0.015187254 0.013873454
Türkiye Halk Bankası A.Ş. 0.018921224 0.021344478 0.016965563 0.013177557 0.014177978 0.011995596 0.011942432 0.013205312 0.014519734 0.013199684 0.015528252 0.015643722 0.015544412 0.00981477 0.00904961
Türkiye Vakıflar Bankası T.A.O. 0.014454619 0.016492517 0.015021725 0.013520374 0.01441438 0.012108207 0.015455031 0.015360922 0.014871857 0.019787374 0.013666993 0.015592321 0.015498228 0.011957507 0.011319674
Akbank T.A.Ş. 0.01954129 0.01687924 0.021321869 0.011692901 0.013579307 0.012359045 0.007587026 0.013953349 0.012909091 0.010246703 0.012995623 0.011388319 0.011720792 0.016541921 0.015933926
Anadolubank A.Ş. 0.01892113 0.014566078 0.017894489 0.017319925 0.018156553 0.016940858 0.011331878 0.013920824 0.015198176 0.012249407 0.015411866 0.010117832 0.010579218 0.011325339 0.011151762
Fibabanka A.Ş. 0.006544728 0.009609433 0.006759672 0.015882835 0.014497954 0.012462821 0.007031251 0.015880638 0.017195849 0.004101374 0.01537003 0.01829716 0.017928614 0.010101688 0.0096635
Şekerbank T.A.Ş. 0.009513601 0.009427064 0.008990832 0.019314973 0.018626172 0.016587431 0.020669037 0.014265413 0.015183662 0.016798367 0.014973317 0.014479306 0.014498146 0.009961806 0.009403315
Turkish Bank A.Ş. 0.002617215 0.002067289 0.002397187 0.0141457 0.011854427 0.012184851 0.009396955 0.011553504 0.01253814 0.007565868 0.015095148 0.009686775 0.010191899 0.019394925 0.018643577
Türk Ekonomi Bankası A.Ş. 0.012360373 0.013665026 0.012237629 0.016167935 0.015609496 0.014957521 0.009965932 0.015400736 0.01570008 0.009227918 0.014318019 0.01479368 0.014780622 0.012598625 0.012318934
Türkiye İş Bankası A.Ş. 0.017738727 0.016599394 0.018841632 0.012808467 0.013798391 0.012269227 0.008268455 0.014850946 0.013941333 0.010072881 0.013269471 0.012251931 0.012496776 0.012864619 0.012709746
Yapı ve Kredi Bankası A.Ş. 0.01690566 0.016465931 0.018109576 0.01257029 0.013818208 0.012072618 0.0144709 0.015519067 0.014580223 0.014704212 0.013193797 0.013215499 0.013362574 0.011173324 0.011598792
Alternatifbank A.Ş. 0.006951047 0.010057385 0.008193234 0.015231997 0.015007597 0.0127809 0.017526962 0.017804785 0.015364731 0.013704451 0.012154188 0.020155897 0.019598751 0.010259373 0.009857316
Citibank A.Ş. 0.022200037 0.015632976 0.019303287 0.016699625 0.017054353 0.021720422 0.023825334 0.007818711 0.008979812 0.030428513 0.0160514 0.009177384 0.009734195 0.027847418 0.027492338
Denizbank A.Ş. 0.01634335 0.017418531 0.017397634 0.015004339 0.015559977 0.015703856 0.016453346 0.014920646 0.014238323 0.016444629 0.013414788 0.01478108 0.0147693 0.012925065 0.013092815
HSBC Bank A.Ş. 0.004009384 0.002846768 0.004011377 0.016714499 0.015524578 0.016399089 0.024918321 0.013590207 0.012935518 0.024200803 0.01356222 0.014940964 0.014912961 0.019409972 0.019381371
ING Bank A.Ş. 0.009452448 0.009674302 0.011154658 0.015566438 0.01516995 0.017755885 0.011325723 0.019169941 0.016194636 0.010289356 0.011886699 0.013814044 0.013900387 0.011573807 0.011280797
Turkland Bank A.Ş. -0.005186142 -0.004522056 -0.003910099 0.020583129 0.017520247 0.012823891 0.018805467 0.012242874 0.014369322 0.011136277 0.016530662 0.010725187 0.011124947 0.014482416 0.013780586
Türkiye Garanti Bankası A.Ş. 0.020144584 0.018027757 0.022368365 0.012479875 0.014388918 0.013914604 0.009294266 0.015034042 0.013633953 0.010657481 0.012745004 0.011646857 0.011953097 0.013961912 0.013740809
ALB 0.011241711 0.014772127 0.009552518 0.006911861 0.007213303 0.012119588 0.013295083 0.013147518 0.015395421 0.011848552 0.01643284 0.018726232 0.018326602 0.012080664 0.013252087
KVYT 0.012593925 0.015896609 0.011543416 0.007468529 0.007888512 0.01323951 0.008882759 0.013026491 0.014327624 0.010089784 0.015441104 0.017235805 0.016982874 0.014753867 0.017181644
TF 0.012456411 0.012991163 0.012382393 0.007674993 0.008018362 0.014052827 0.01444071 0.015938931 0.015720381 0.013002613 0.013944224 0.014435826 0.014464717 0.011438541 0.014872075

International Conference on Management, Economics and Business (IConMEB)
October 29–November 1, 2020, Antalya/TURKEY
49
Ideal (A+) and Negative Ideal (A
-) Solution
ROA ROE
Net
Income/
Deposits
Ope.exp/
Asset
Ope.
Inc/Ass
et
Net.In.
M
Non-per
lo/loans
Loan/
Depo
Loan/
Asset
Pro/Lo
an
Depo/
Asset
Debt/E
quity
Asset/
Equity
Cash/
Asset
Cash/
Depo
S
*
0.0222
00037
0.0218
32706
0.022368
365
0.006911
861
0.01862
6172
0.0217
20422
0.006894
015
0.0191
69941
0.0171
95849
0.0041
01374
0.0118
86699
0.0091
77384
0.0097
34195
0.0278
47418
0.0274
92338
S-
-
0.0051
86142
-
0.0045
22056
-
0.003910
099
0.020583
129
0.00721
3303
0.0119
95596
0.024918
321
0.0078
18711
0.0089
79812
0.0304
28513
0.0165
30662
0.0201
55897
0.0195
98751
0.0098
1477
0.0090
4961
3) Distance Measures Between Alternatives
Si* Si-
Türkiye Cumhuriyeti Ziraat Bankası A.Ş. 0.025455672 0.053691
Türkiye Halk Bankası A.Ş. 0.033150335 0.048498
Türkiye Vakıflar Bankası T.A.O. 0.035030401 0.040466
Akbank T.A.Ş. 0.022890514 0.053204
Anadolubank A.Ş. 0.029776015 0.048547
Fibabanka A.Ş. 0.04034131 0.04099
Şekerbank T.A.Ş. 0.041958285 0.032783
Turkish Bank A.Ş. 0.040256662 0.037166
Türk Ekonomi Bankası A.Ş. 0.031376977 0.043002
Türkiye İş Bankası A.Ş. 0.027128045 0.050051
Yapı ve Kredi Bankası A.Ş. 0.0312249 0.04555
Alternatifbank A.Ş. 0.042226715 0.033033
Citibank A.Ş. 0.03660039 0.052784
Denizbank A.Ş. 0.030809651 0.044121
HSBC Bank A.Ş. 0.046263847 0.025486
ING Bank A.Ş. 0.034118523 0.040472
Turkland Bank A.Ş. 0.055156928 0.027749
Türkiye Garanti Bankası A.Ş. 0.024511167 0.053429
ALB 0.036526271 0.039833
KVYT 0.030428258 0.044491
TF 0.032807265 0.041013
.
Recommended