Issues associated with Integrating Transport
and Environmental Models
PresenterRichard Bradley, Technical Director, Transport Planning, Mouchel
Talk Content
• Talk based on recent experience for HA Managed Motorways
• Transport modeller’s view
• Overview of processes involved
• Issues encountered when integrating models
• How the procedures may be improved
Traffic Modelling & Appraisal
• Traffic model required to model impact of scheme and for scheme appraisal
• Predict scheme impacts in terms of flows, speeds, and numerous traveller choices
• Macro models using aggregations and approximations based on mathematical relationships
• HA models tend to cover large regional geographical areas and complex choice
• Outputs used for economics, environment, and operational assessments
• Primary focus on the Treasury and providing robust value for money assessment that considers traffic growth uncertainty
• Investment decision tends to be Pass or Fail (does scheme pay for itself?)
Air Quality Modelling & Appraisal
• Environmental appraisal a legal requirement
• AQ models rely on traffic model outputs
• AQ screening criteria specified in DMRB:
- Road alignment change >= 5m- Daily traffic flows change >= 1,000 AADT- HGV flows change >= 200 AADT- Daily average speed change >= 10km/hr- Peak hour speed change >= 20km/hr
• Assessed by link and aggregated by direction
• EU upper limit for nitrogen dioxide (NO2) concentrations of 40 microgram’s per cubic metre (of air)
• Detailed screening thresholds used
Scheme Programme Implications
• Exceedence thresholds based on traffic flow and speed, particularly sensitive to HGVs
• AQ screening requires traffic outputs from Do-Minimum and Do-Something
• Complex nature of traffic model and inaccuracy can lead to unanticipated exceedence locations
• Detailed model development defined through screening
• AQ monitoring data can take up to 6 months to collect (> model accuracy)
• Inconsistency found between traffic model and AQ model
• Traffic and then AQ modelling programme critical
• Significant upfront public cost for planning and design at risk while AQ investigated
Integration Issues
A. Model Specification – issues related to how the traffic models are developed which can make them incompatible with AQ analysis
B. Model Interpretation – issues related to how the data produced by traffic models is interpreted and used in the AQ modelling process
C. Accuracy and Uncertainty – general issues relating to the quality of the data produced by a traffic model

A. Model Specification Issues
A1. Model Area
• Geographic model coverage allows for:
- strategic re-routeing impacts of interventions- potential for alternative destinations- ensure full lengths of trips
• Little consideration of AQ issues
• Spatial model detail concentrated in Area of Interest or simulation area
• Environmental assessment therefore also limited to the simulation area
• But AQMAs can span simulation boundary
• Large areas may require outputs from two traffic models that are not consistent
A2. Traffic Model Validation
• Traffic models interested in origin–destination movements and journey routes
• Validation criteria checks translation of origin–destination trips to link flows
• Journey time criteria based on routes
• Neither guarantee accuracy at the link level

A3. Lack of Network Detail
• Network chosen to include significant roads and allow correct routing
• Links can often be missing approaching junctions
• No data collected for missing links
• Local validation issues where links missing
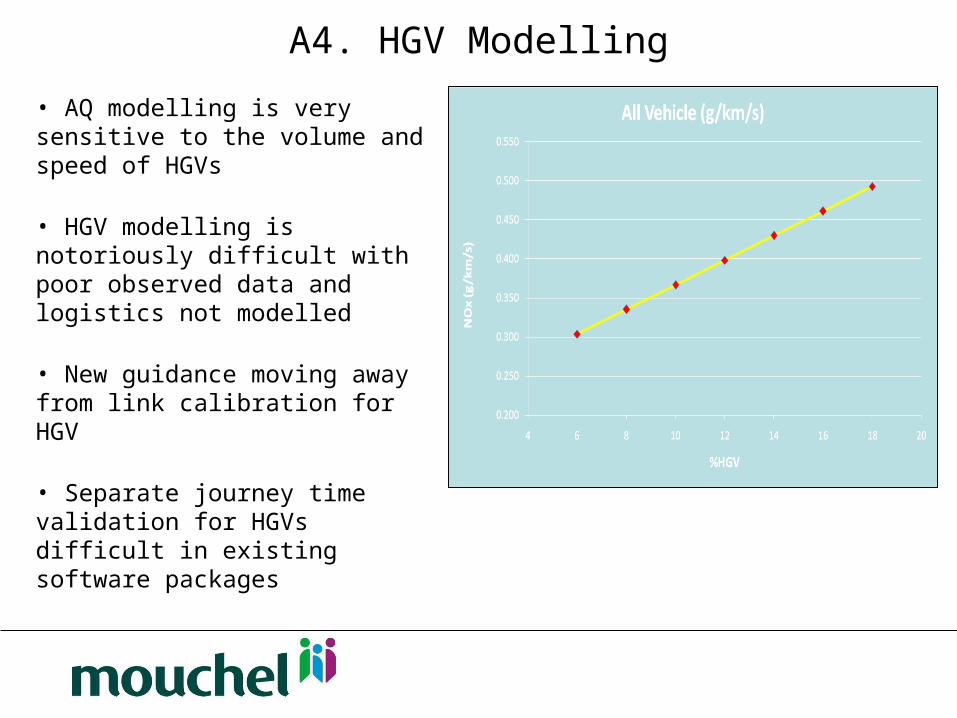
A4. HGV Modelling
• AQ modelling is very sensitive to the volume and speed of HGVs
• HGV modelling is notoriously difficult with poor observed data and logistics not modelled
• New guidance moving away from link calibration for HGV
• Separate journey time validation for HGVs difficult in existing software packages
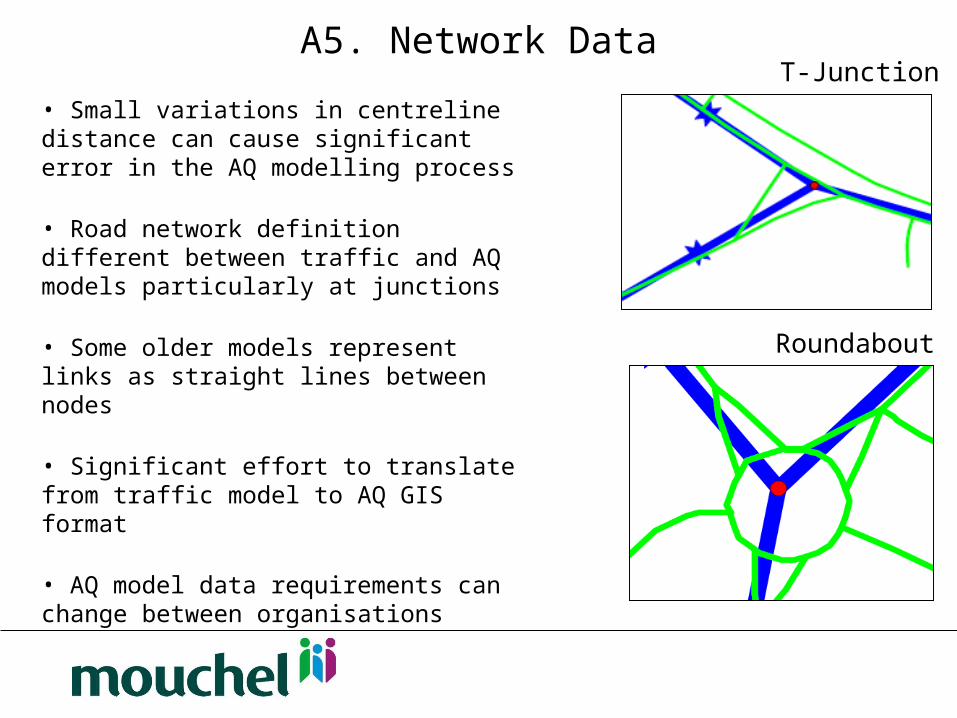
A5. Network Data
• Small variations in centreline distance can cause significant error in the AQ modelling process
• Road network definition different between traffic and AQ models particularly at junctions
• Some older models represent links as straight lines between nodes
• Significant effort to translate from traffic model to AQ GIS format
• AQ model data requirements can change between organisations
T-Junction
Roundabout
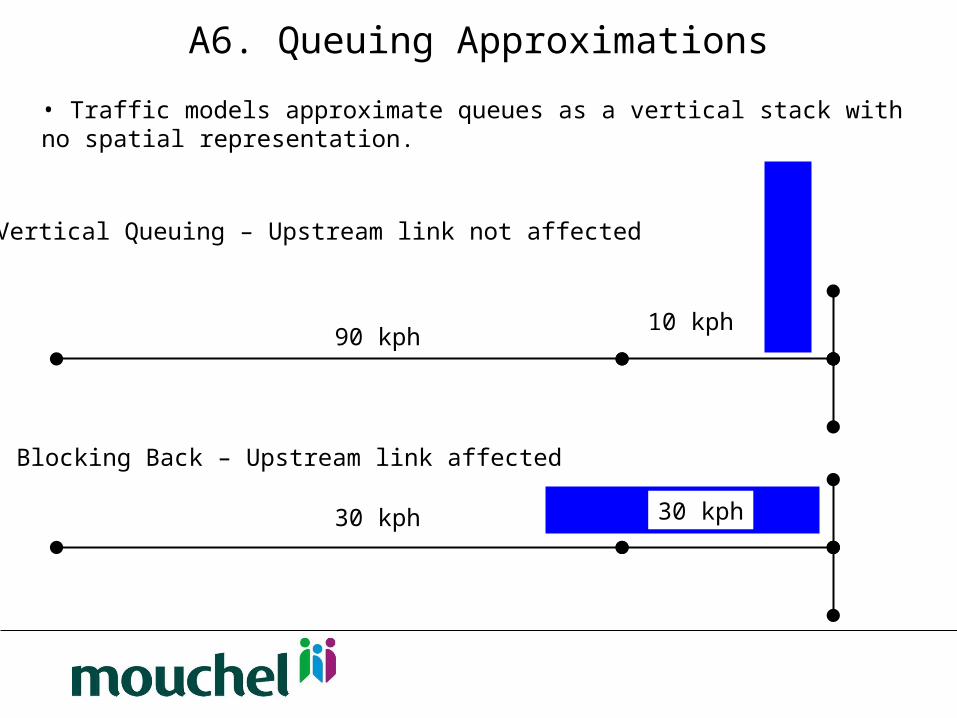
A6. Queuing Approximations
• Traffic models approximate queues as a vertical stack with no spatial representation.
10 kph90 kph
Vertical Queuing – Upstream link not affected
Blocking Back – Upstream link affected
30 kph 30 kph
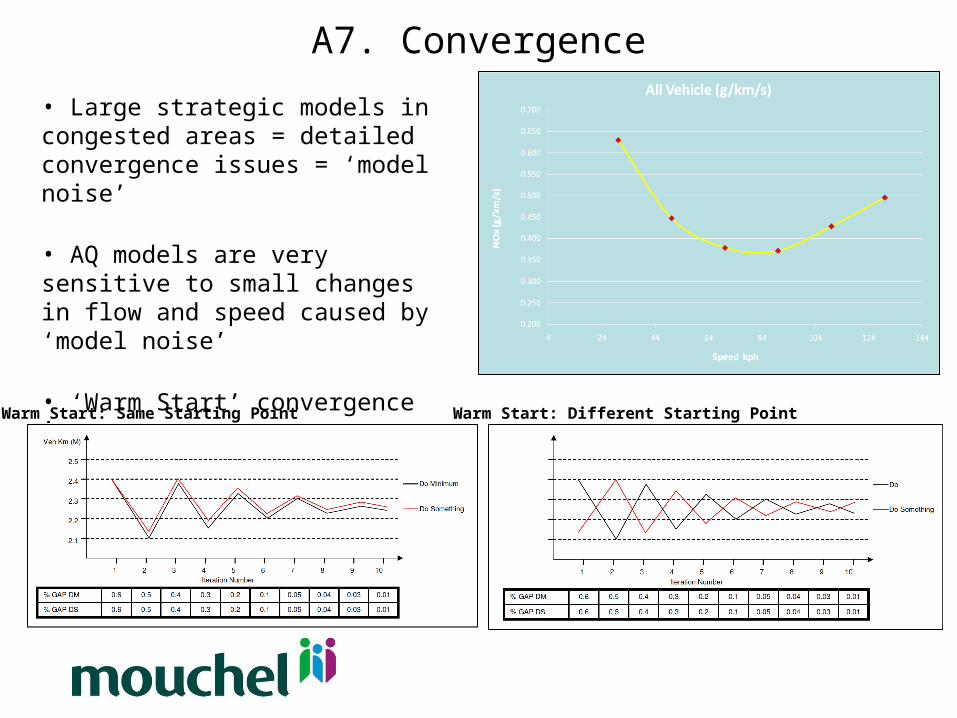
A7. Convergence
• Large strategic models in congested areas = detailed convergence issues = ‘model noise’
• AQ models are very sensitive to small changes in flow and speed caused by ‘model noise’
• ‘Warm Start’ convergence issues
Warm Start: Same Starting Point Warm Start: Different Starting Point
B. Model Interpretation Issues
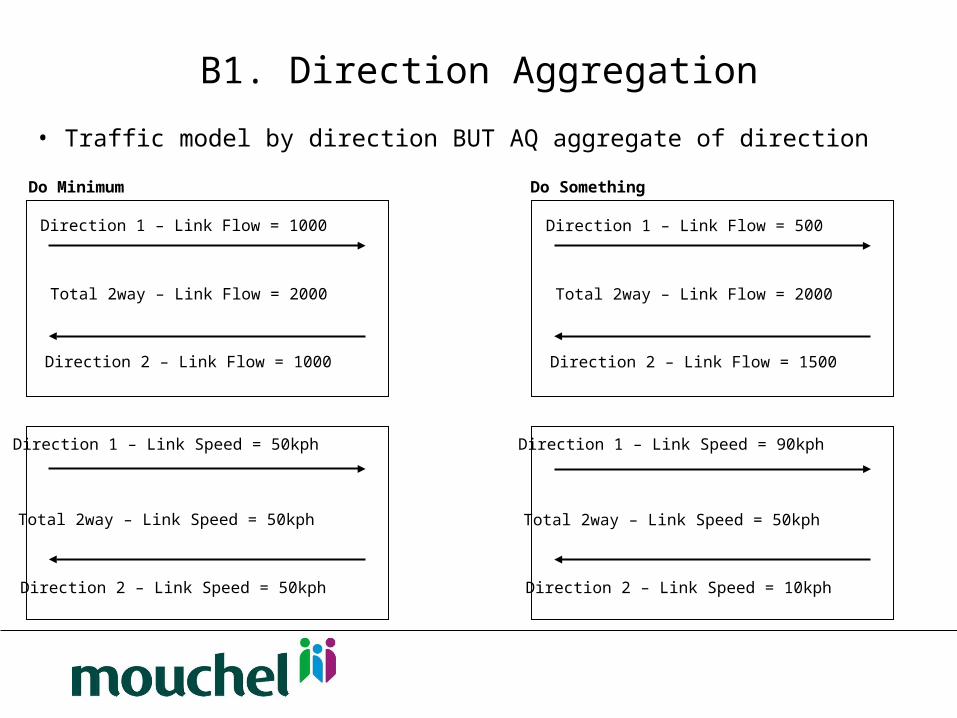
B1. Direction Aggregation
• Traffic model by direction BUT AQ aggregate of direction
Direction 1 – Link Flow = 1000
Direction 2 – Link Flow = 1000
Total 2way – Link Flow = 2000
Do Minimum
Direction 1 – Link Flow = 500
Direction 2 – Link Flow = 1500
Total 2way – Link Flow = 2000
Do Something
Direction 1 – Link Speed = 50kph
Direction 2 – Link Speed = 50kph
Total 2way – Link Speed = 50kph
Direction 1 – Link Speed = 90kph
Direction 2 – Link Speed = 10kph
Total 2way – Link Speed = 50kph
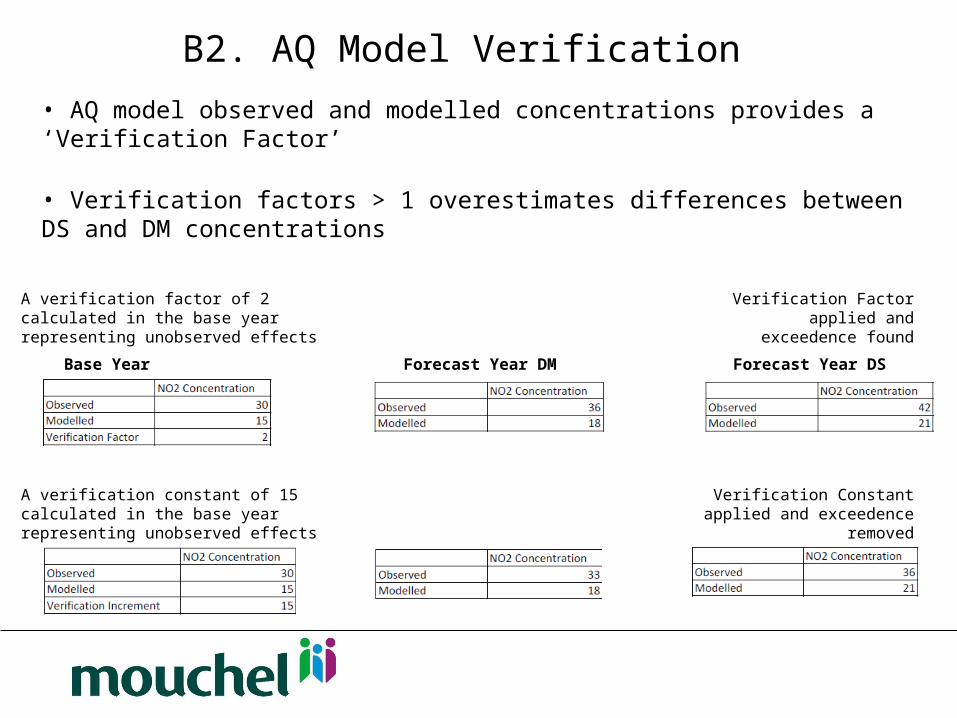
B2. AQ Model Verification • AQ model observed and modelled concentrations provides a ‘Verification Factor’
• Verification factors > 1 overestimates differences between DS and DM concentrations
Base Year Forecast Year DM Forecast Year DS
A verification factor of 2 calculated in the base year representing unobserved effects
Verification Factor applied and exceedence found
Verification Constant applied and exceedence removed
A verification constant of 15 calculated in the base year representing unobserved effects
C. Accuracy and Uncertainty Issues
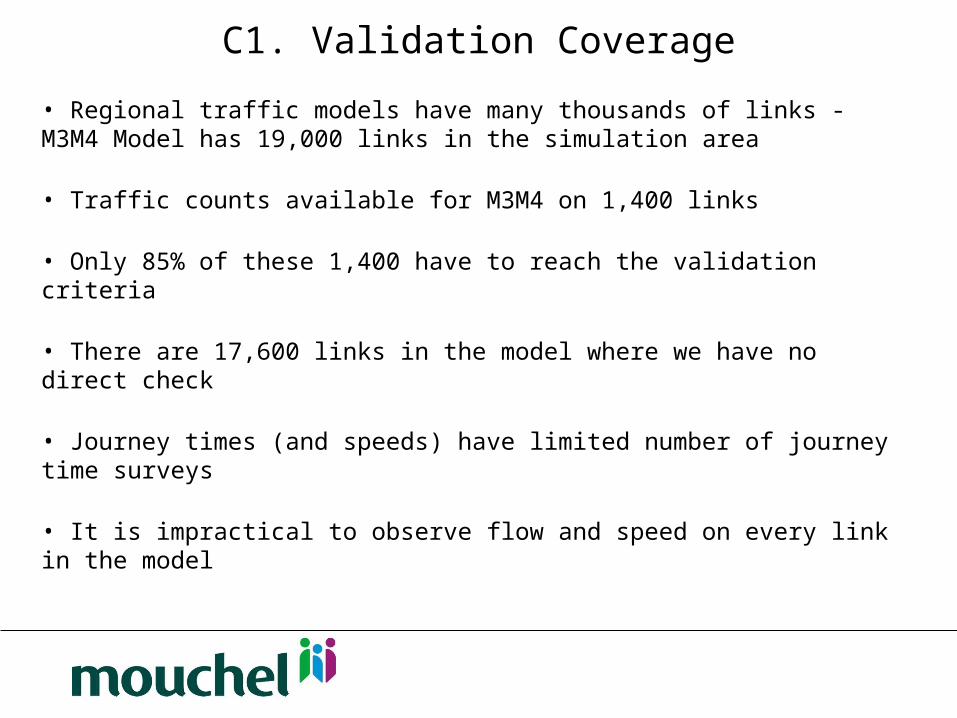
C1. Validation Coverage
• Regional traffic models have many thousands of links - M3M4 Model has 19,000 links in the simulation area
• Traffic counts available for M3M4 on 1,400 links
• Only 85% of these 1,400 have to reach the validation criteria
• There are 17,600 links in the model where we have no direct check
• Journey times (and speeds) have limited number of journey time surveys
• It is impractical to observe flow and speed on every link in the model
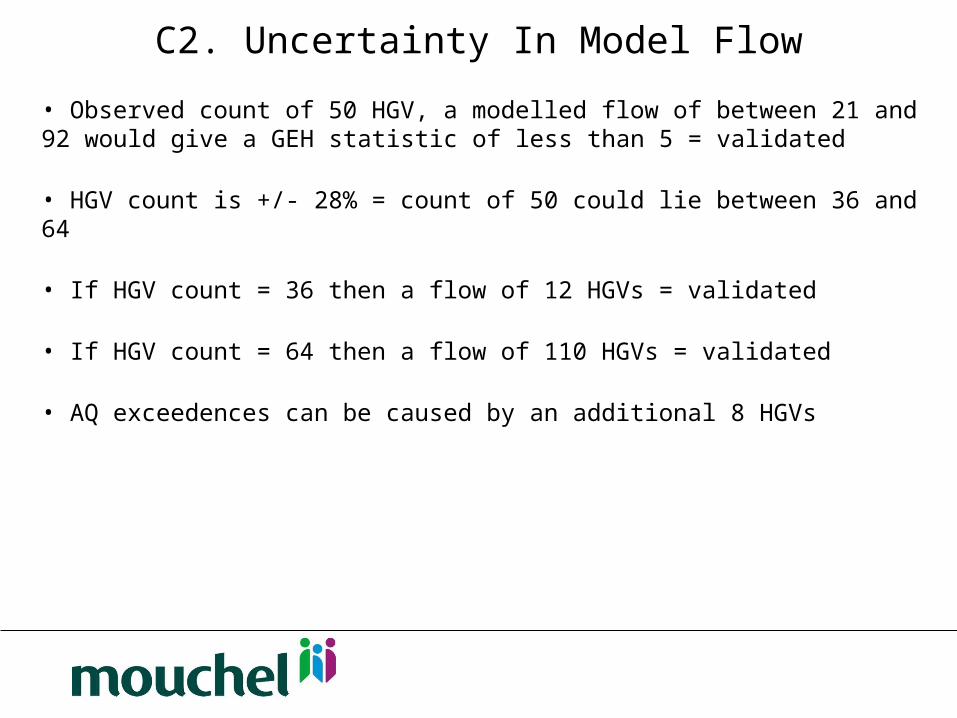
C2. Uncertainty In Model Flow
• Observed count of 50 HGV, a modelled flow of between 21 and 92 would give a GEH statistic of less than 5 = validated
• HGV count is +/- 28% = count of 50 could lie between 36 and 64
• If HGV count = 36 then a flow of 12 HGVs = validated
• If HGV count = 64 then a flow of 110 HGVs = validated
• AQ exceedences can be caused by an additional 8 HGVs
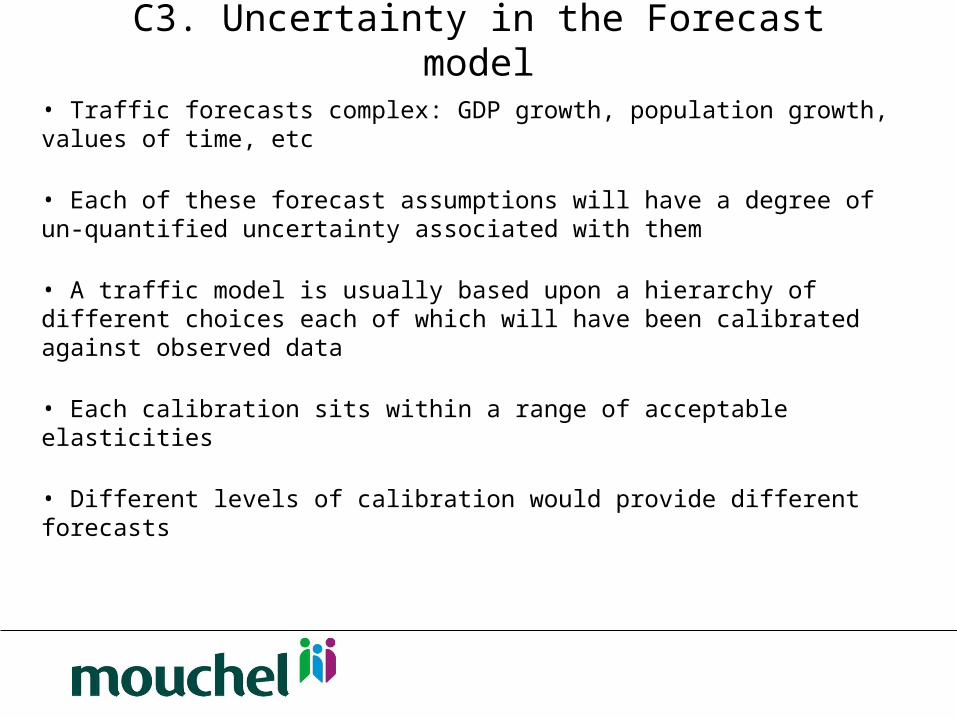
C3. Uncertainty in the Forecast model
• Traffic forecasts complex: GDP growth, population growth, values of time, etc
• Each of these forecast assumptions will have a degree of un-quantified uncertainty associated with them
• A traffic model is usually based upon a hierarchy of different choices each of which will have been calibrated against observed data
• Each calibration sits within a range of acceptable elasticities
• Different levels of calibration would provide different forecasts
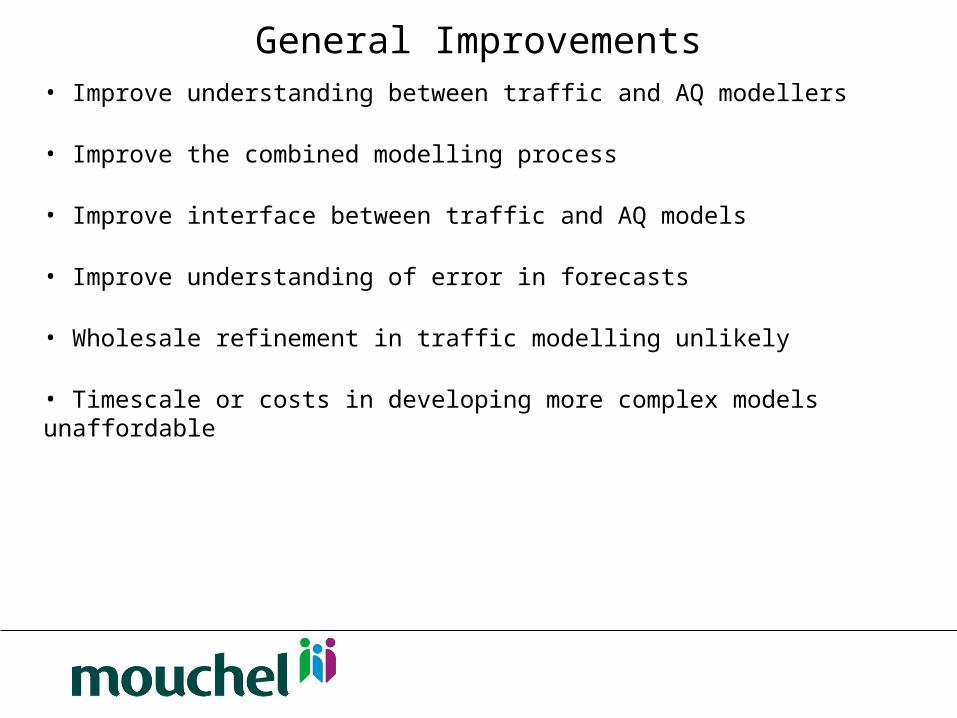
General Improvements• Improve understanding between traffic and AQ modellers
• Improve the combined modelling process
• Improve interface between traffic and AQ models
• Improve understanding of error in forecasts
• Wholesale refinement in traffic modelling unlikely
• Timescale or costs in developing more complex models unaffordable
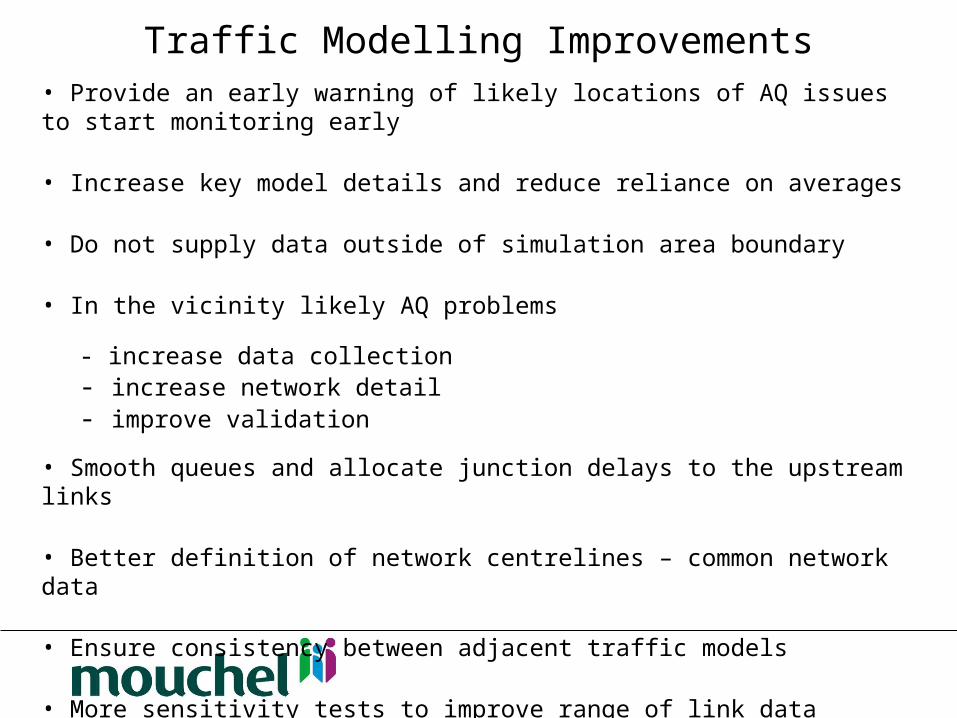
Traffic Modelling Improvements• Provide an early warning of likely locations of AQ issues to start monitoring early
• Increase key model details and reduce reliance on averages
• Do not supply data outside of simulation area boundary
• In the vicinity likely AQ problems
- increase data collection- increase network detail - improve validation
• Smooth queues and allocate junction delays to the upstream links
• Better definition of network centrelines – common network data
• Ensure consistency between adjacent traffic models
• More sensitivity tests to improve range of link data
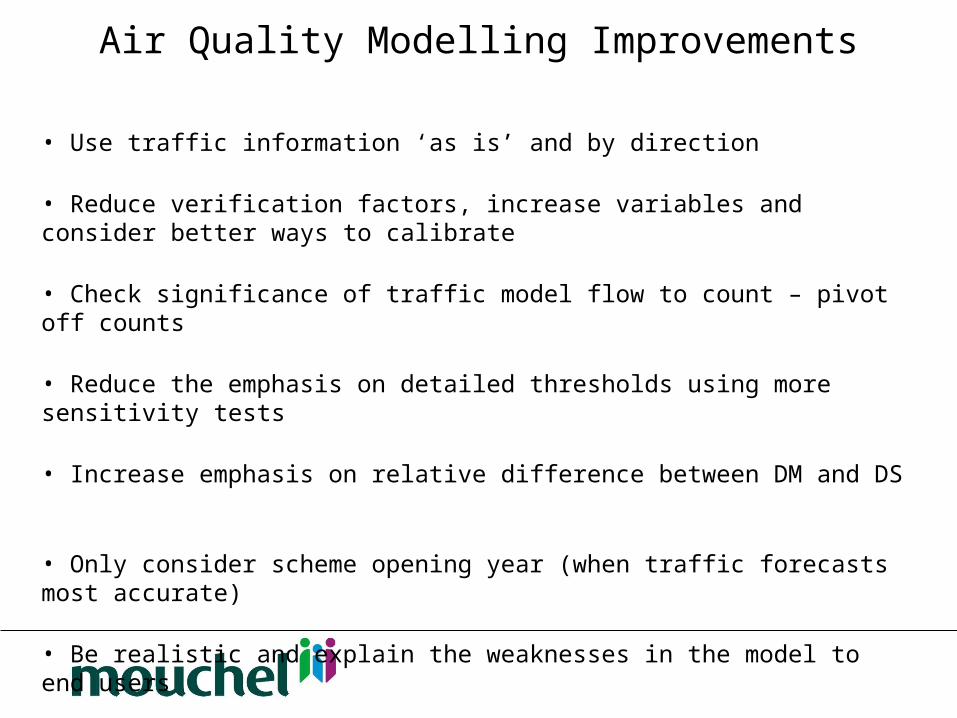
Air Quality Modelling Improvements
• Use traffic information ‘as is’ and by direction
• Reduce verification factors, increase variables and consider better ways to calibrate
• Check significance of traffic model flow to count – pivot off counts
• Reduce the emphasis on detailed thresholds using more sensitivity tests
• Increase emphasis on relative difference between DM and DS
• Only consider scheme opening year (when traffic forecasts most accurate)
• Be realistic and explain the weaknesses in the model to end users
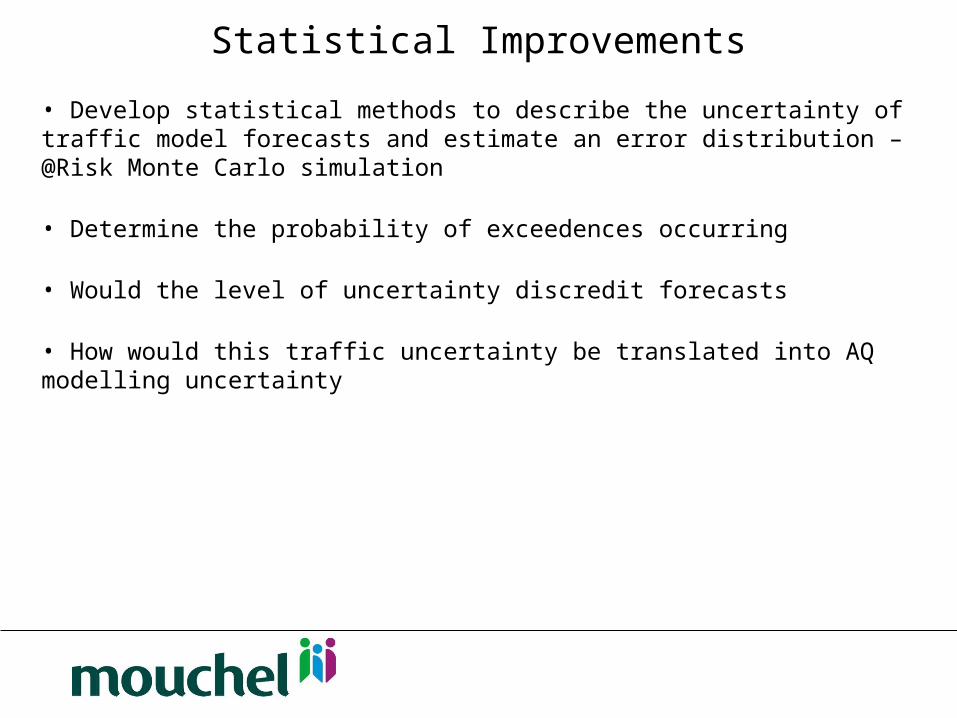
Statistical Improvements
• Develop statistical methods to describe the uncertainty of traffic model forecasts and estimate an error distribution – @Risk Monte Carlo simulation
• Determine the probability of exceedences occurring
• Would the level of uncertainty discredit forecasts
• How would this traffic uncertainty be translated into AQ modelling uncertainty
Recommended