1
Bay REN Forum
October 24, 2017
Rory Cox, Analyst, Energy Efficiency Branch
It All Adds up to Zero California’s Zero Net Energy Future (and What We’re
Doing About it)
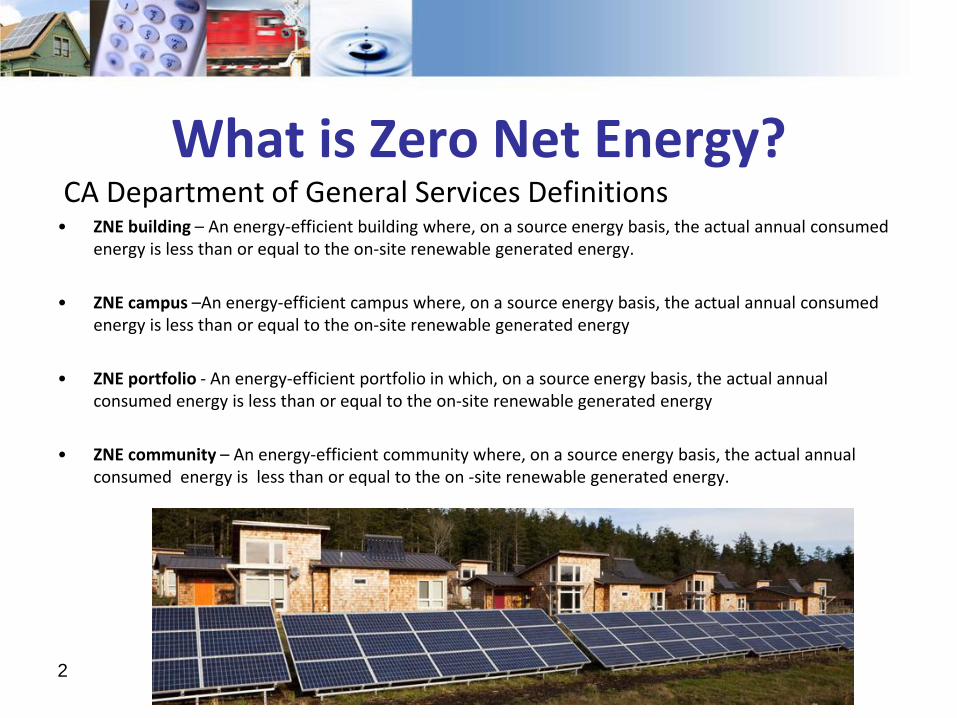
What is Zero Net Energy?CA Department of General Services Definitions
• ZNE building – An energy-efficient building where, on a source energy basis, the actual annual consumedenergy is less than or equal to the on-site renewable generated energy.
• ZNE campus –An energy-efficient campus where, on a source energy basis, the actual annual consumedenergy is less than or equal to the on-site renewable generated energy
• ZNE portfolio - An energy-efficient portfolio in which, on a source energy basis, the actual annual consumed energy is less than or equal to the on-site renewable generated energy
• ZNE community – An energy-efficient community where, on a source energy basis, the actual annual consumed energy is less than or equal to the on -site renewable generated energy.
2
3
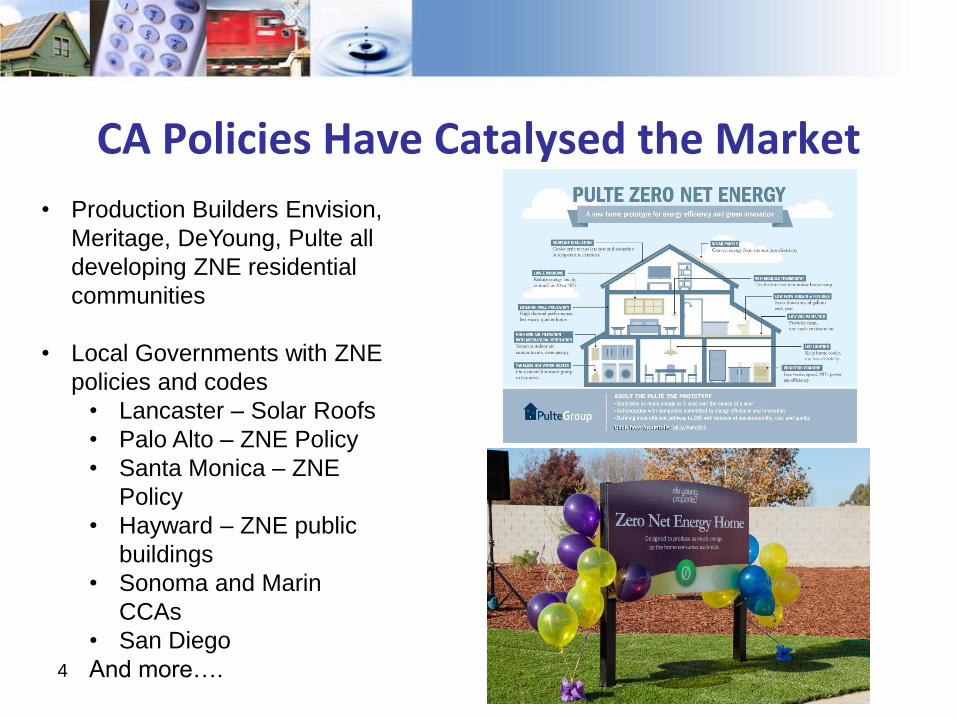
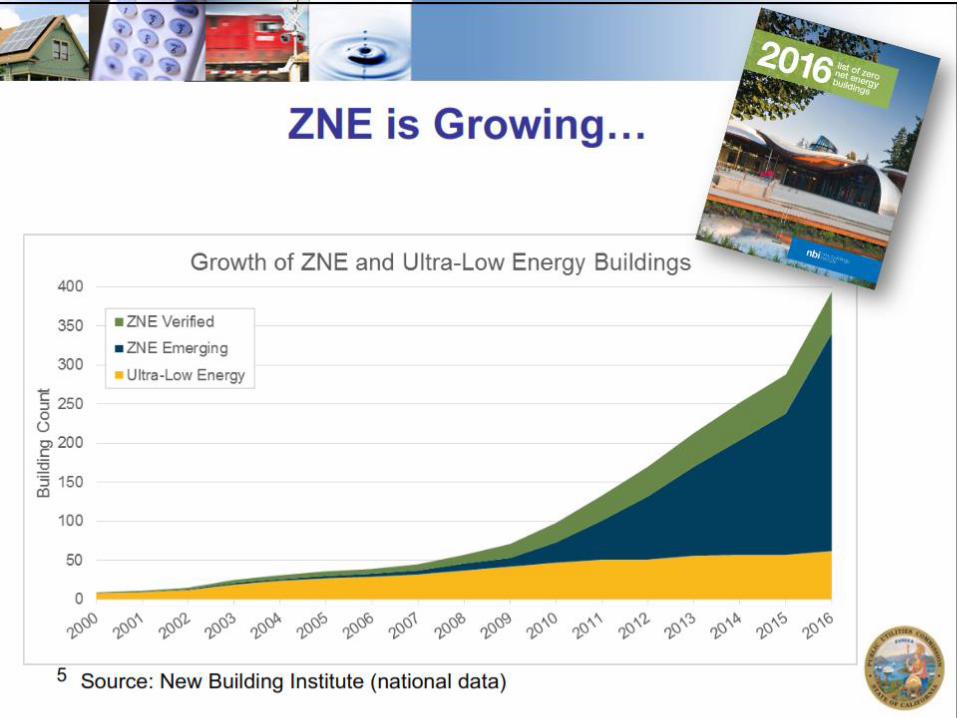
CA Policies Have Catalysed the Market
4
• Production Builders Envision,
Meritage, DeYoung, Pulte all
developing ZNE residential
communities
• Local Governments with ZNE
policies and codes
• Lancaster – Solar Roofs
• Palo Alto – ZNE Policy
• Santa Monica – ZNE
Policy
• Hayward – ZNE public
buildings
• Sonoma and Marin
CCAs
• San Diego
And more….
5
CA Policies Have Catalysed the Market
6
• Production Builders Envision,
Meritage, DeYoung, Pulte all
developing ZNE residential
communities
• Local Governments with ZNE
policies and codes
• Lancaster – Solar Roofs
• Palo Alto – ZNE Policy
• Santa Monica – ZNE
Policy
• Hayward – ZNE public
buildings
• Sonoma and Marin
CCAs
• San Diego
And more….
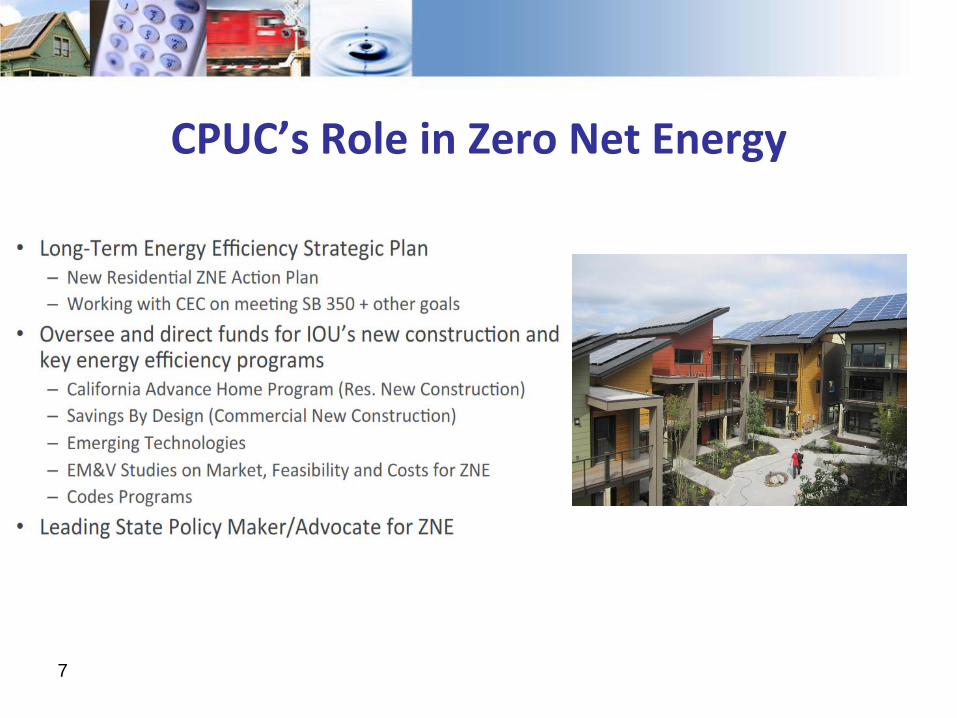
CPUC’s Role in Zero Net Energy
7
What’s Next: Residential
87
What’s Next: Residential
99
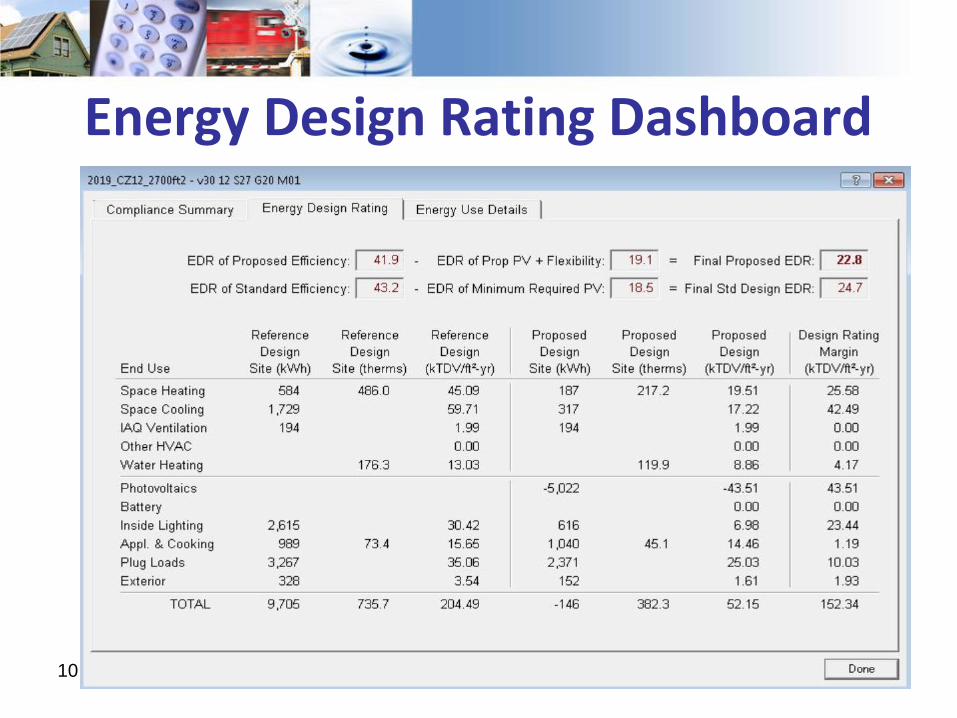
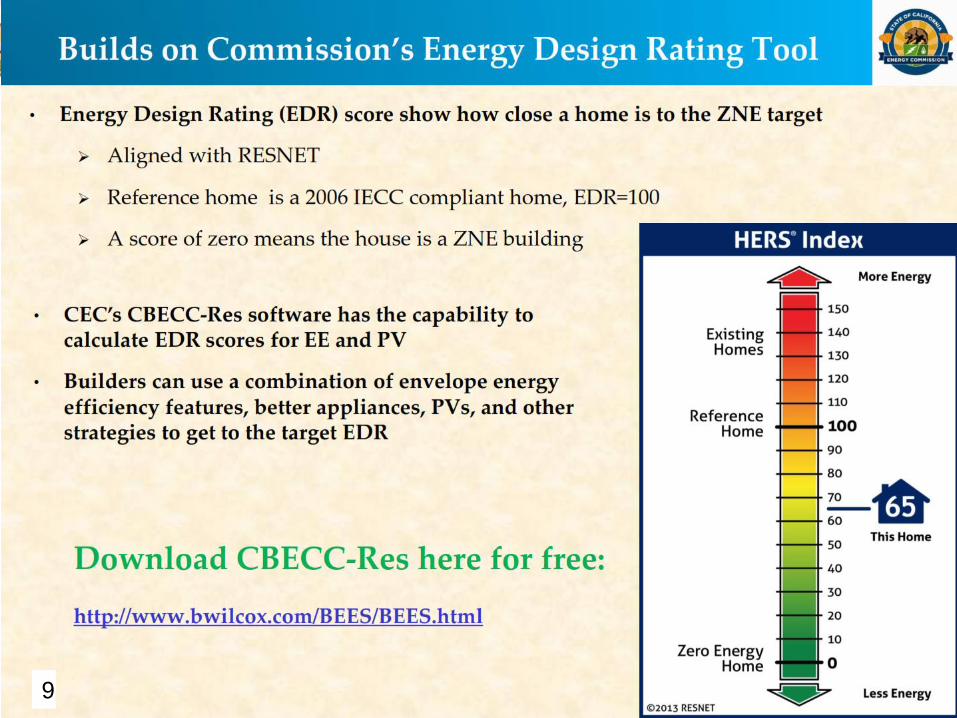
Energy Design Rating Dashboard
10
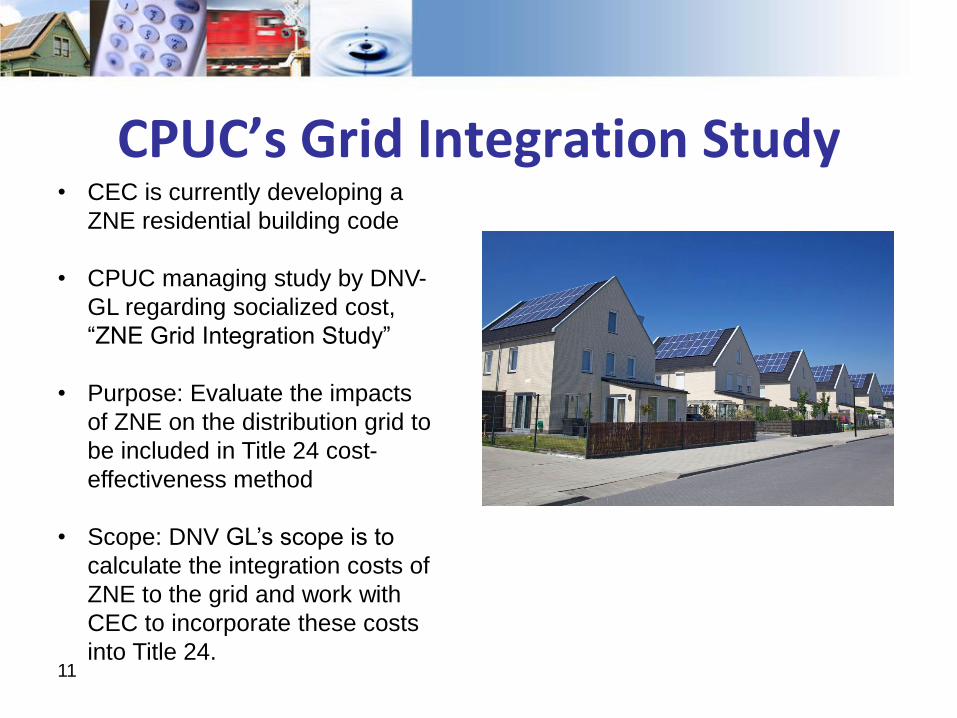
CPUC’s Grid Integration Study
11
• CEC is currently developing a
ZNE residential building code
• CPUC managing study by DNV-
GL regarding socialized cost,
“ZNE Grid Integration Study”
• Purpose: Evaluate the impacts
of ZNE on the distribution grid to
be included in Title 24 cost-
effectiveness method
• Scope: DNV GL’s scope is to
calculate the integration costs of
ZNE to the grid and work with
CEC to incorporate these costs
into Title 24.
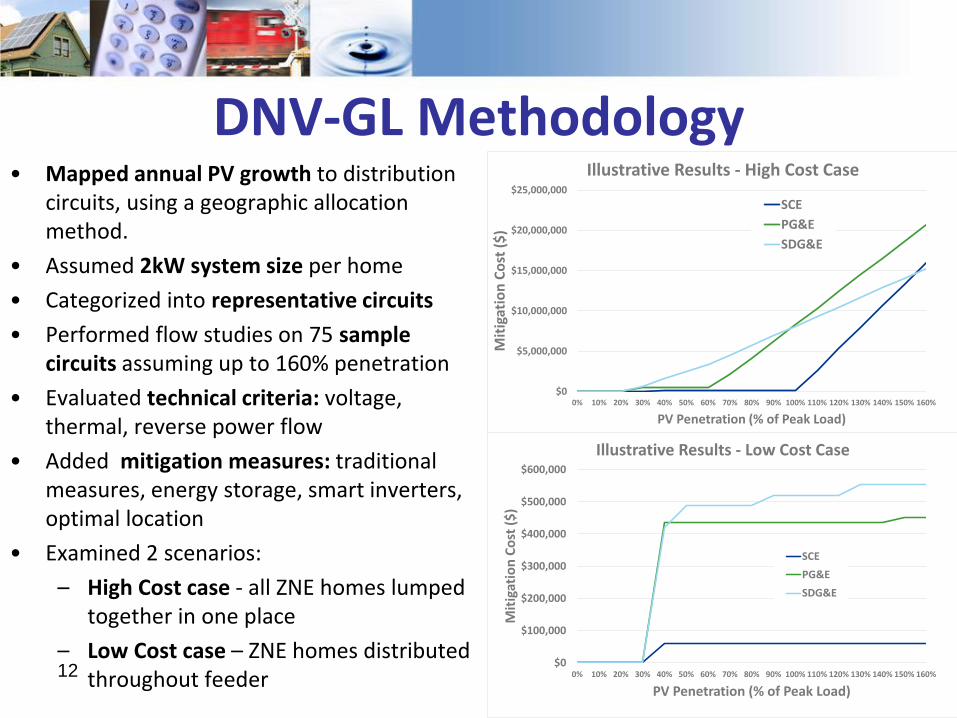
DNV-GL Methodology• Mapped annual PV growth to distribution
circuits, using a geographic allocation method.
• Assumed 2kW system size per home
• Categorized into representative circuits
• Performed flow studies on 75 sample circuits assuming up to 160% penetration
• Evaluated technical criteria: voltage, thermal, reverse power flow
• Added mitigation measures: traditional measures, energy storage, smart inverters, optimal location
• Examined 2 scenarios:
– High Cost case - all ZNE homes lumped together in one place
– Low Cost case – ZNE homes distributed throughout feeder12
$0
$5,000,000
$10,000,000
$15,000,000
$20,000,000
$25,000,000
0% 10% 20% 30% 40% 50% 60% 70% 80% 90% 100% 110% 120% 130% 140% 150% 160%
Mit
igat
ion
Co
st (
$)
PV Penetration (% of Peak Load)
Illustrative Results - High Cost Case
SCE
PG&E
SDG&E
$0
$100,000
$200,000
$300,000
$400,000
$500,000
$600,000
0% 10% 20% 30% 40% 50% 60% 70% 80% 90% 100% 110% 120% 130% 140% 150% 160%
Mit
igat
ion
Co
st (
$)
PV Penetration (% of Peak Load)
Illustrative Results - Low Cost Case
SCE
PG&E
SDG&E
13
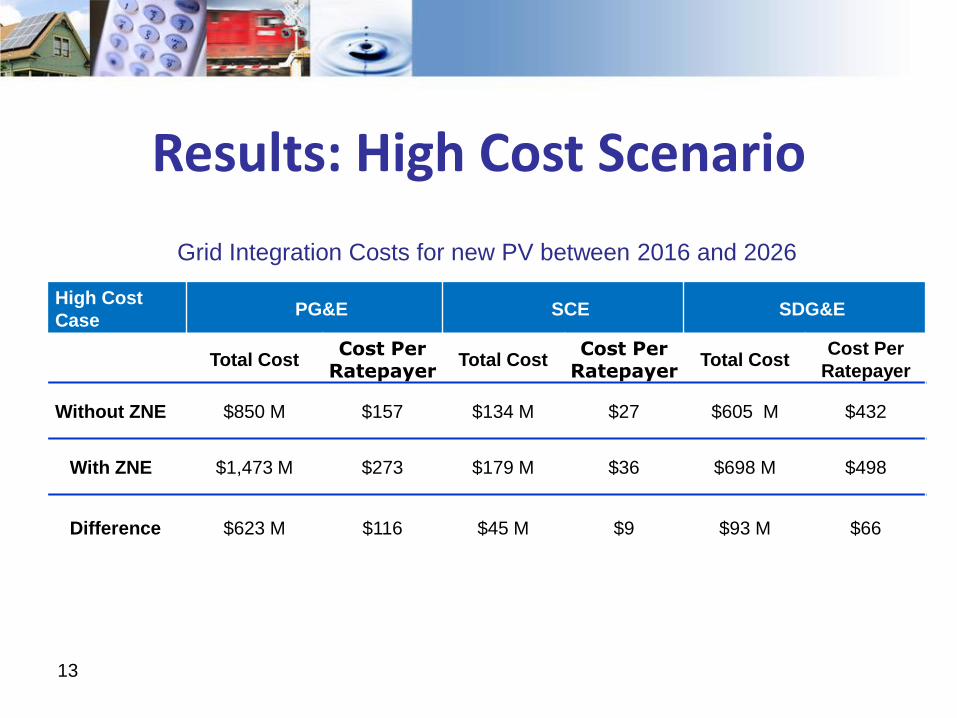
High Cost
CasePG&E SCE SDG&E
Total CostCost Per
RatepayerTotal Cost
Cost Per Ratepayer
Total CostCost Per
Ratepayer
Without ZNE $850 M $157 $134 M $27 $605 M $432
With ZNE $1,473 M $273 $179 M $36 $698 M $498
Difference $623 M $116 $45 M $9 $93 M $66
Results: High Cost Scenario
Grid Integration Costs for new PV between 2016 and 2026
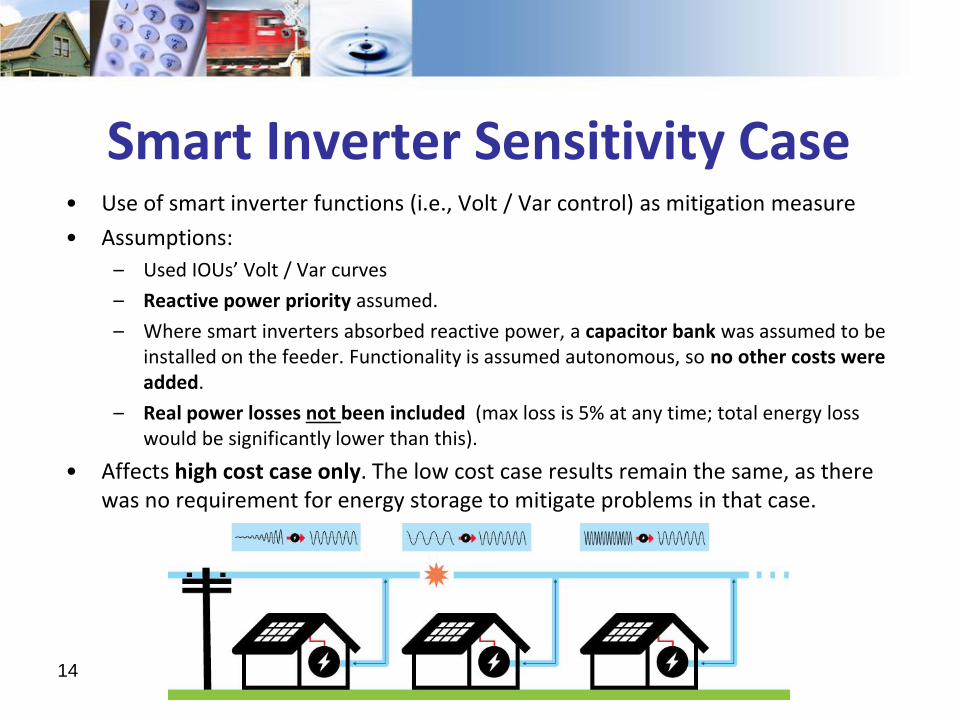
Smart Inverter Sensitivity Case
14
• Use of smart inverter functions (i.e., Volt / Var control) as mitigation measure
• Assumptions:
– Used IOUs’ Volt / Var curves
– Reactive power priority assumed.
– Where smart inverters absorbed reactive power, a capacitor bank was assumed to be installed on the feeder. Functionality is assumed autonomous, so no other costs were added.
– Real power losses not been included (max loss is 5% at any time; total energy loss would be significantly lower than this).
• Affects high cost case only. The low cost case results remain the same, as there was no requirement for energy storage to mitigate problems in that case.
15
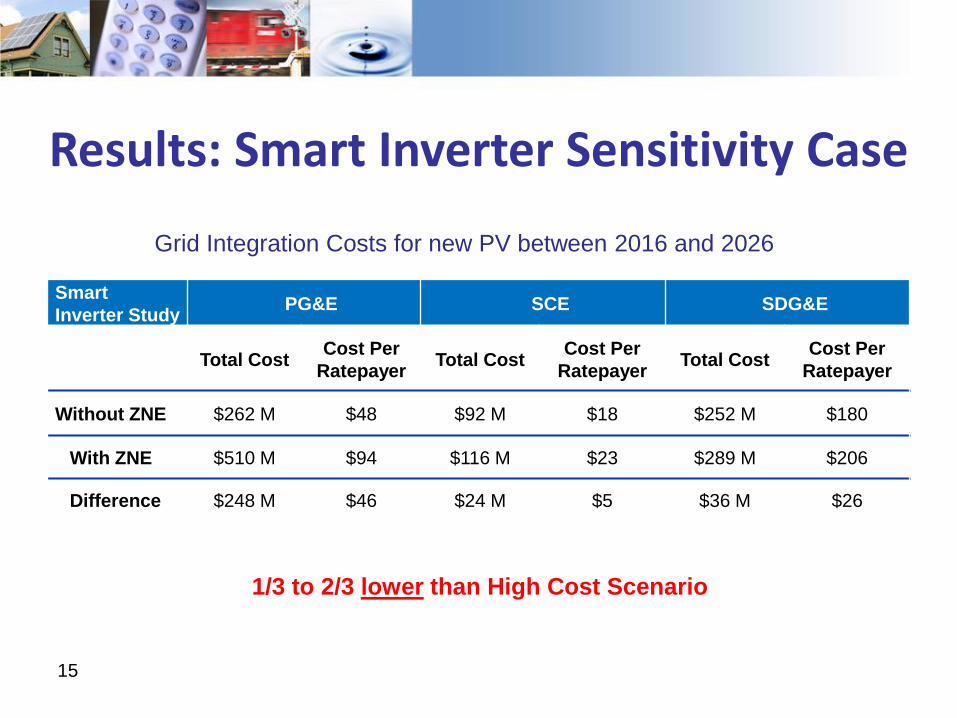
Results: Smart Inverter Sensitivity Case
Smart
Inverter StudyPG&E SCE SDG&E
Total CostCost Per
RatepayerTotal Cost
Cost Per
RatepayerTotal Cost
Cost Per
Ratepayer
Without ZNE $262 M $48 $92 M $18 $252 M $180
With ZNE $510 M $94 $116 M $23 $289 M $206
Difference $248 M $46 $24 M $5 $36 M $26
Grid Integration Costs for new PV between 2016 and 2026
1/3 to 2/3 lower than High Cost Scenario
16
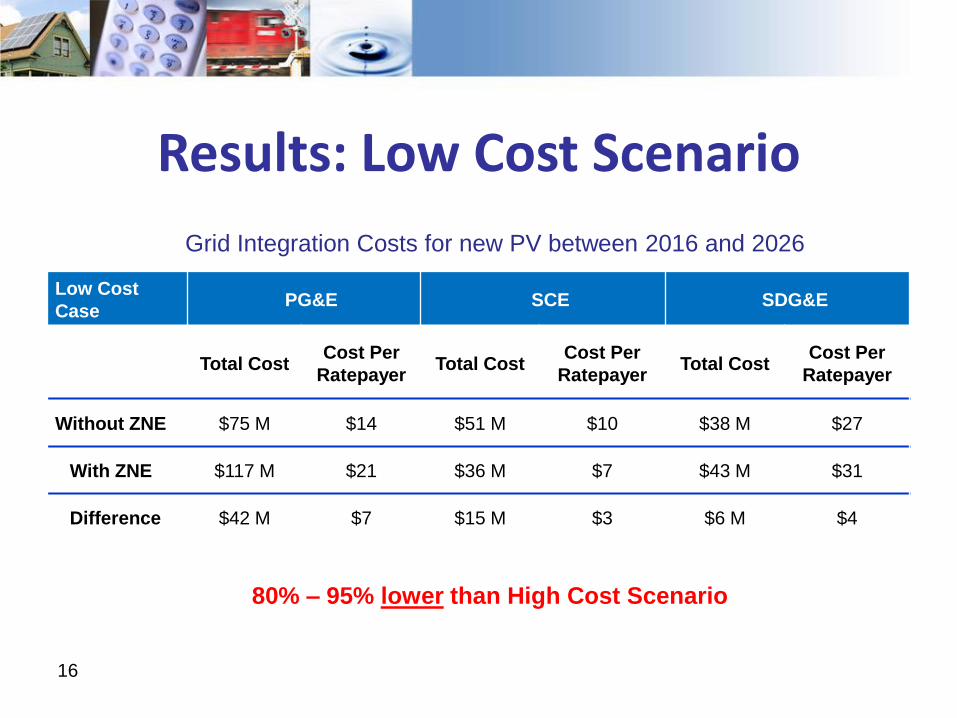
Results: Low Cost Scenario
Low Cost
CasePG&E SCE SDG&E
Total CostCost Per
RatepayerTotal Cost
Cost Per
RatepayerTotal Cost
Cost Per
Ratepayer
Without ZNE $75 M $14 $51 M $10 $38 M $27
With ZNE $117 M $21 $36 M $7 $43 M $31
Difference $42 M $7 $15 M $3 $6 M $4
Grid Integration Costs for new PV between 2016 and 2026
80% – 95% lower than High Cost Scenario
17
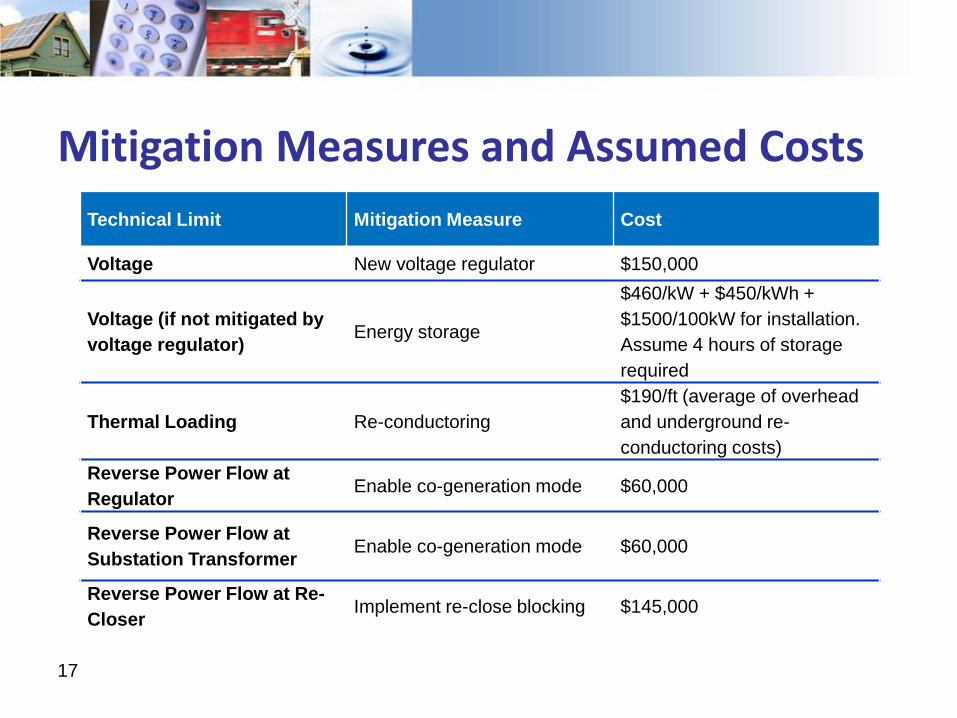
Technical Limit Mitigation Measure Cost
Voltage New voltage regulator $150,000
Voltage (if not mitigated by
voltage regulator)Energy storage
$460/kW + $450/kWh +
$1500/100kW for installation.
Assume 4 hours of storage
required
Thermal Loading Re-conductoring
$190/ft (average of overhead
and underground re-
conductoring costs)
Reverse Power Flow at
RegulatorEnable co-generation mode $60,000
Reverse Power Flow at
Substation TransformerEnable co-generation mode $60,000
Reverse Power Flow at Re-
CloserImplement re-close blocking $145,000
Mitigation Measures and Assumed Costs
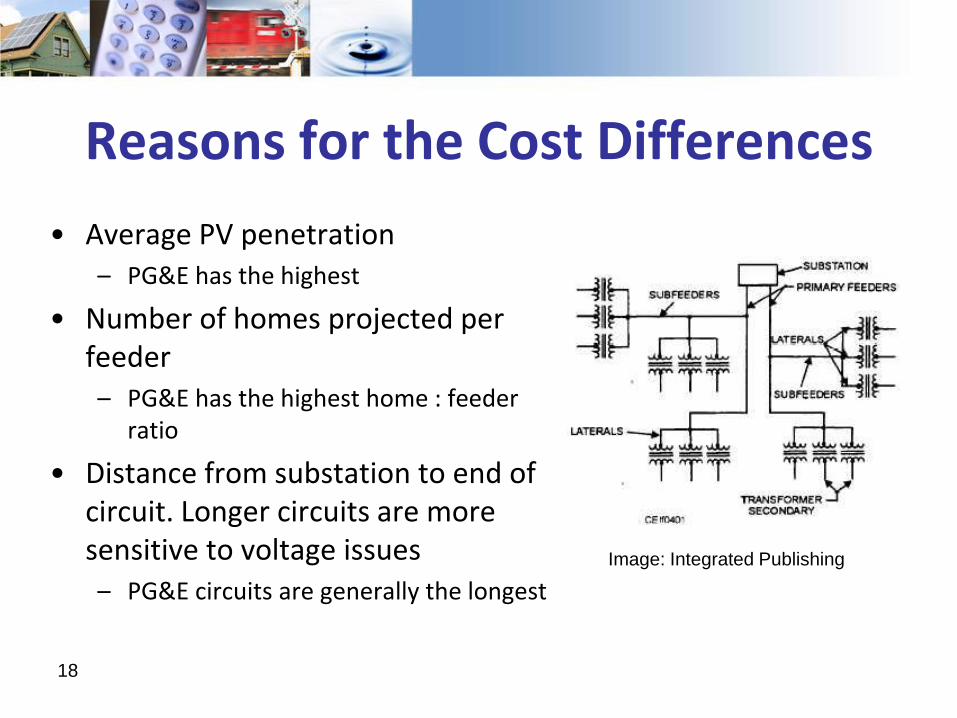
Reasons for the Cost Differences
• Average PV penetration – PG&E has the highest
• Number of homes projected per feeder– PG&E has the highest home : feeder
ratio
• Distance from substation to end of circuit. Longer circuits are more sensitive to voltage issues– PG&E circuits are generally the longest
18
Image: Integrated Publishing
Staff Conclusions
• Integration costs of high penetration PV – whether driven by ZNE policy or NEM policy alone – can be high if not mitigated.
• Mitigation measures are available to reduce grid upgrade costs to more acceptable levels
– Smart inverters: CPUC should update required smart inverter settings.
– Optimal location: IOUs Integration Cost Analysis (ICA) tool should be helpful to indicate low cost locations.
• Most likely case is probably in the range indicated by the Smart Inverter Sensitivity Case
– Effective Sept 2017 : Smart Inverter Phase 1 capabilities will be required
– CPUC staff proposal to modify Rule 21 to require reactive power priority (in Volt / Var settings)
– Debatable whether realistic to assume that PV will be installed throughout a circuit19
Questions?
20
Rory Cox, Senior Analyst
California Public Utilities Commission –Energy Division
415-703-1093
Recommended


![Sarah Titus...OGR S ADDS UP TO '16 RESULTS -f] TUS](https://img.pdfslide.net/doc/110x75/60801a16cb9ecf0e1359bb5a/-sarah-titus-ogr-s-adds-up-to-16-results-f-tus.jpg)