1
Polyoxometalates as artificial nucleases: hydrolytic cleavage of DNA promoted by a highly negatively charged ZrIV-substituted Keggin polyanion
T. K. N. Luong,a I. Govaerts,a J. Robben,a P. Shestakova,b and T. N. Parac-Vogt*a
aDepartment of Chemistry, KU Leuven Celestijnenlaan 200F and 200G, 3001 Heverlee, BelgiumE-mail: [email protected] of Organic Chemistry with Centre of Phytochemistry, Bulgarian Academy of SciencesAcad. G. Bontchev Street, Bl.9, 1113 Sofia, Bulgaria
Supporting Information
Electronic Supplementary Material (ESI) for ChemComm.This journal is © The Royal Society of Chemistry 2016

2
A B
Fig. S1 31P NMR spectra of 2.0 mM of ZrK 2:2 in different concentrations (10.0 mM to 50.0 mM) of Tris-HCl buffer pH 7.0 after mixing (A) and after 3 days at 50 °C (B). (600 MHz, D2O, 293K, NS = 256, 25% H3PO4)
Fig. S2 31P NMR spectra of 0.25 mM of ZrK 2:2 in 10 mM Tris-HCl buffer pH 7.0 - 9.0 after mixing. (600 MHz, D2O, 293K, NS = 256, 25% H3PO4)
3
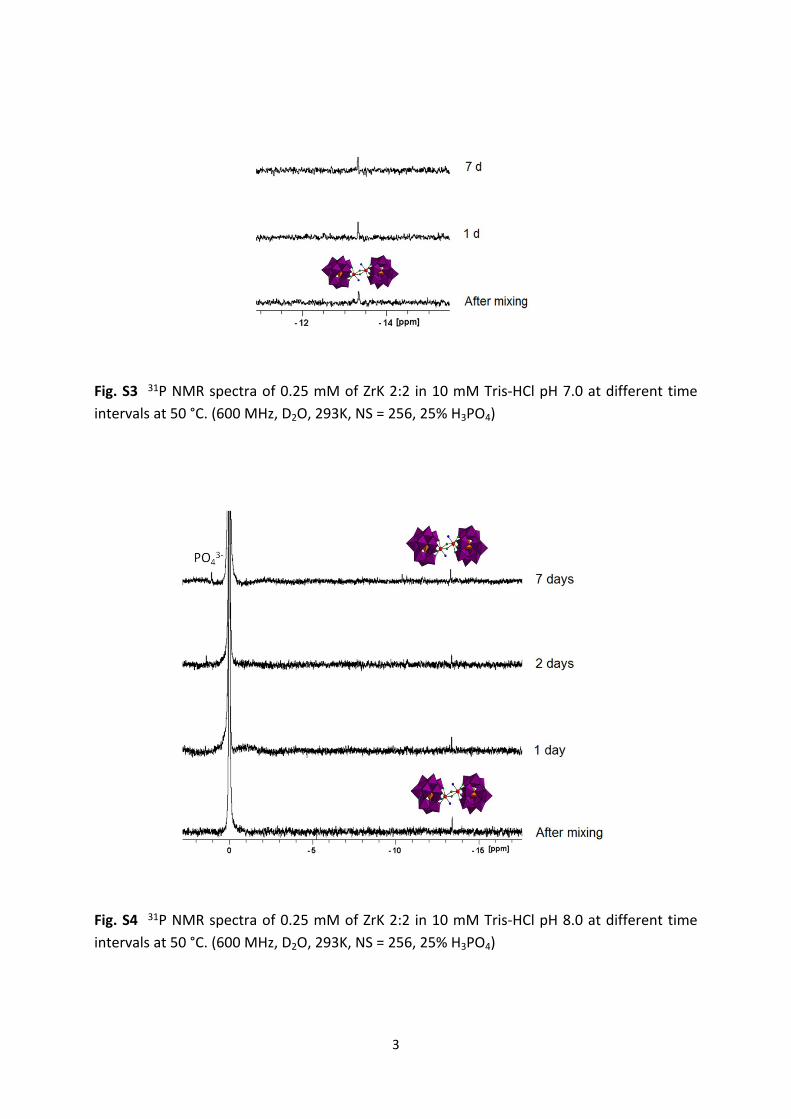
Fig. S3 31P NMR spectra of 0.25 mM of ZrK 2:2 in 10 mM Tris-HCl pH 7.0 at different time intervals at 50 °C. (600 MHz, D2O, 293K, NS = 256, 25% H3PO4)
Fig. S4 31P NMR spectra of 0.25 mM of ZrK 2:2 in 10 mM Tris-HCl pH 8.0 at different time intervals at 50 °C. (600 MHz, D2O, 293K, NS = 256, 25% H3PO4)
4
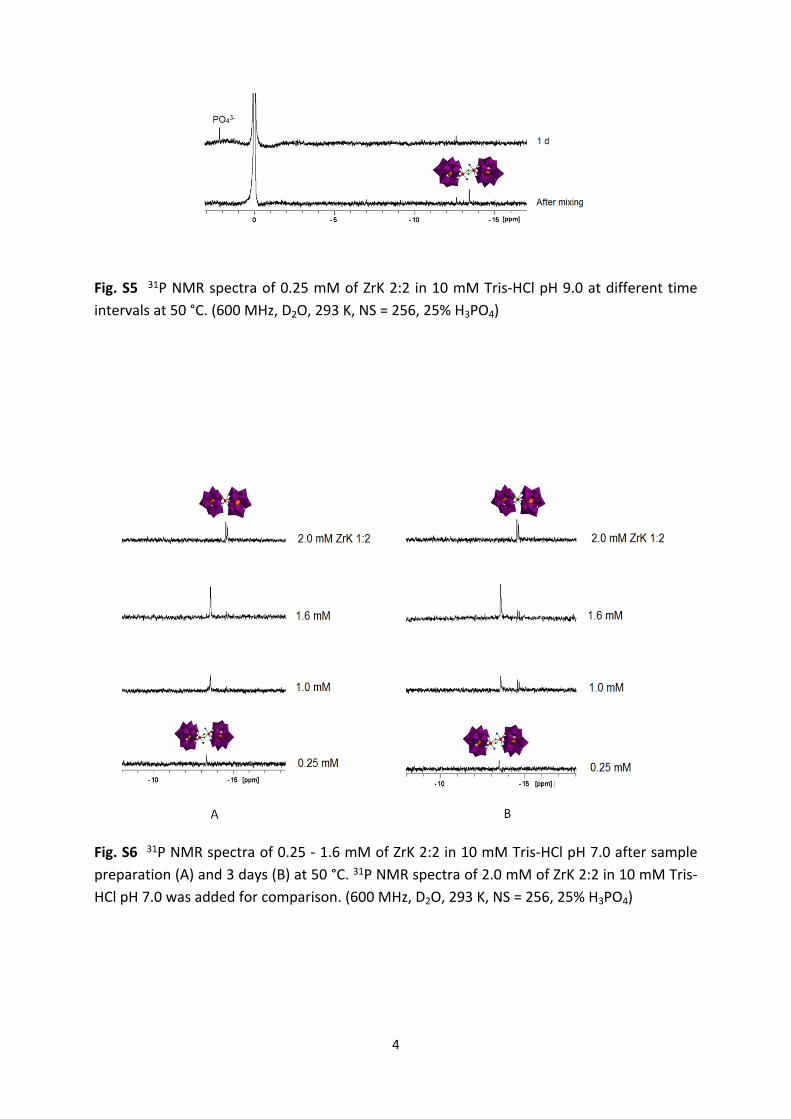
Fig. S5 31P NMR spectra of 0.25 mM of ZrK 2:2 in 10 mM Tris-HCl pH 9.0 at different time intervals at 50 °C. (600 MHz, D2O, 293 K, NS = 256, 25% H3PO4)
Fig. S6 31P NMR spectra of 0.25 - 1.6 mM of ZrK 2:2 in 10 mM Tris-HCl pH 7.0 after sample preparation (A) and 3 days (B) at 50 °C. 31P NMR spectra of 2.0 mM of ZrK 2:2 in 10 mM Tris-HCl pH 7.0 was added for comparison. (600 MHz, D2O, 293 K, NS = 256, 25% H3PO4)
5
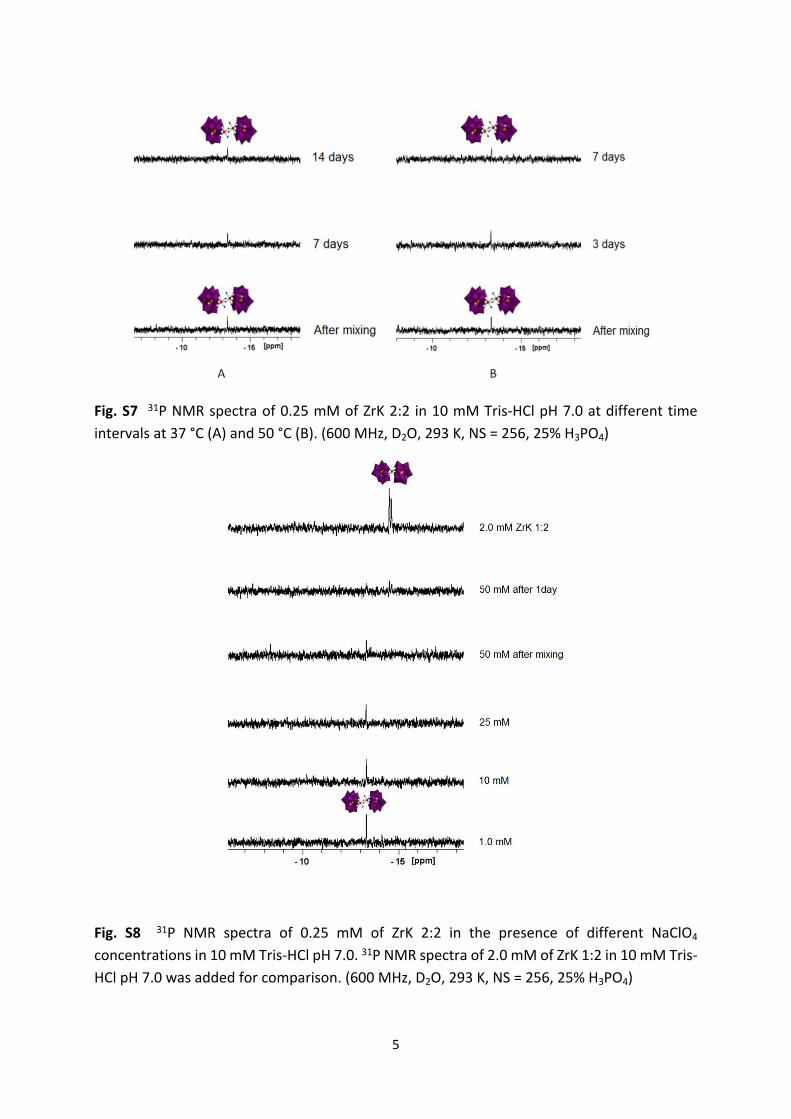
Fig. S7 31P NMR spectra of 0.25 mM of ZrK 2:2 in 10 mM Tris-HCl pH 7.0 at different time intervals at 37 °C (A) and 50 °C (B). (600 MHz, D2O, 293 K, NS = 256, 25% H3PO4)
Fig. S8 31P NMR spectra of 0.25 mM of ZrK 2:2 in the presence of different NaClO4 concentrations in 10 mM Tris-HCl pH 7.0. 31P NMR spectra of 2.0 mM of ZrK 1:2 in 10 mM Tris-HCl pH 7.0 was added for comparison. (600 MHz, D2O, 293 K, NS = 256, 25% H3PO4)
6
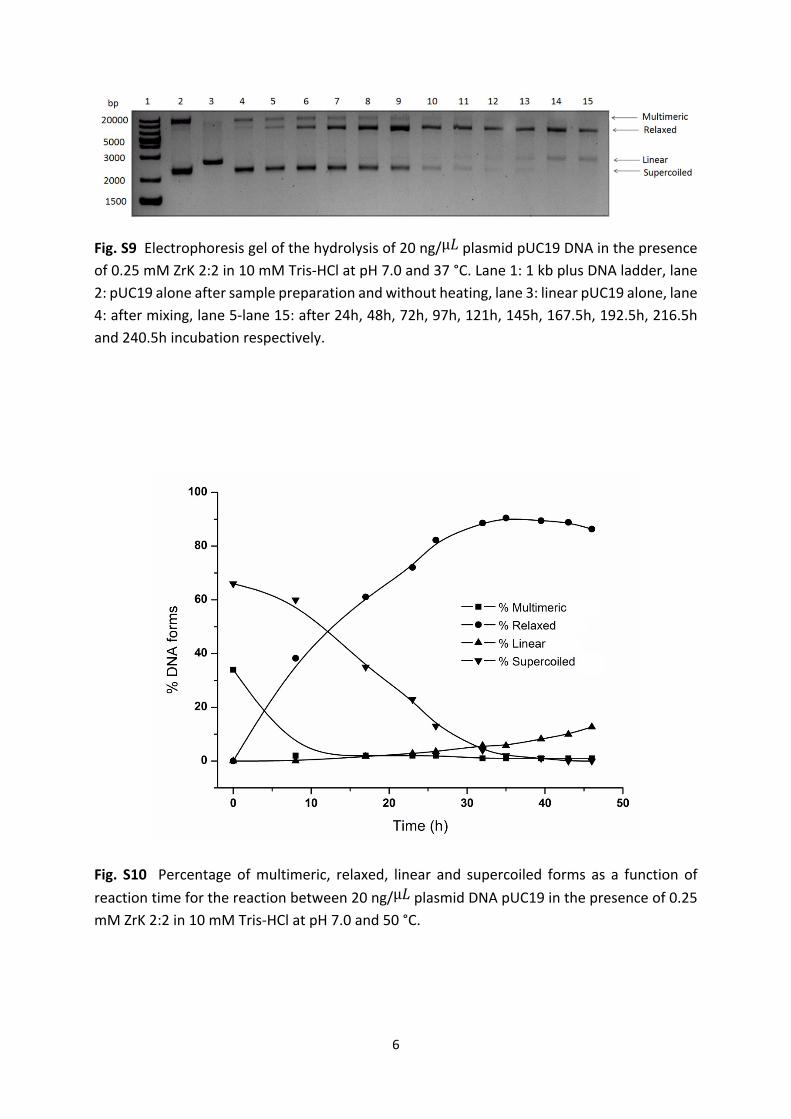
Fig. S9 Electrophoresis gel of the hydrolysis of 20 ng/ plasmid pUC19 DNA in the presence µ𝐿of 0.25 mM ZrK 2:2 in 10 mM Tris-HCl at pH 7.0 and 37 °C. Lane 1: 1 kb plus DNA ladder, lane 2: pUC19 alone after sample preparation and without heating, lane 3: linear pUC19 alone, lane 4: after mixing, lane 5-lane 15: after 24h, 48h, 72h, 97h, 121h, 145h, 167.5h, 192.5h, 216.5h and 240.5h incubation respectively.
Fig. S10 Percentage of multimeric, relaxed, linear and supercoiled forms as a function of reaction time for the reaction between 20 ng/ plasmid DNA pUC19 in the presence of 0.25 µ𝐿mM ZrK 2:2 in 10 mM Tris-HCl at pH 7.0 and 50 °C.
7
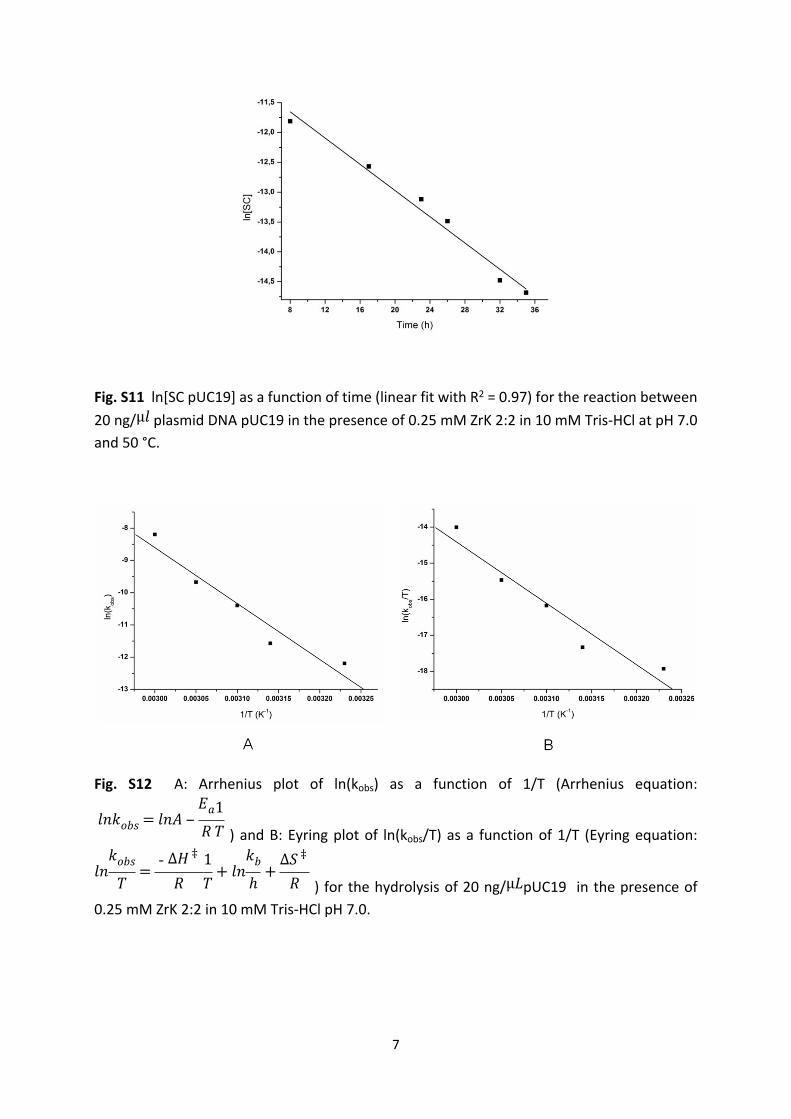
Fig. S11 ln[SC pUC19] as a function of time (linear fit with R2 = 0.97) for the reaction between 20 ng/ plasmid DNA pUC19 in the presence of 0.25 mM ZrK 2:2 in 10 mM Tris-HCl at pH 7.0 µ𝑙and 50 °C.
Fig. S12 A: Arrhenius plot of ln(kobs) as a function of 1/T (Arrhenius equation:
) and B: Eyring plot of ln(kobs/T) as a function of 1/T (Eyring equation: 𝑙𝑛𝑘𝑜𝑏𝑠 = 𝑙𝑛𝐴 ‒
𝐸𝑎
𝑅1𝑇
) for the hydrolysis of 20 ng/ pUC19 in the presence of 𝑙𝑛
𝑘𝑜𝑏𝑠
𝑇=- Δ𝐻 ‡
𝑅1𝑇
+ 𝑙𝑛𝑘𝑏
ℎ+
Δ𝑆 ‡
𝑅 µ𝐿0.25 mM ZrK 2:2 in 10 mM Tris-HCl pH 7.0.
8
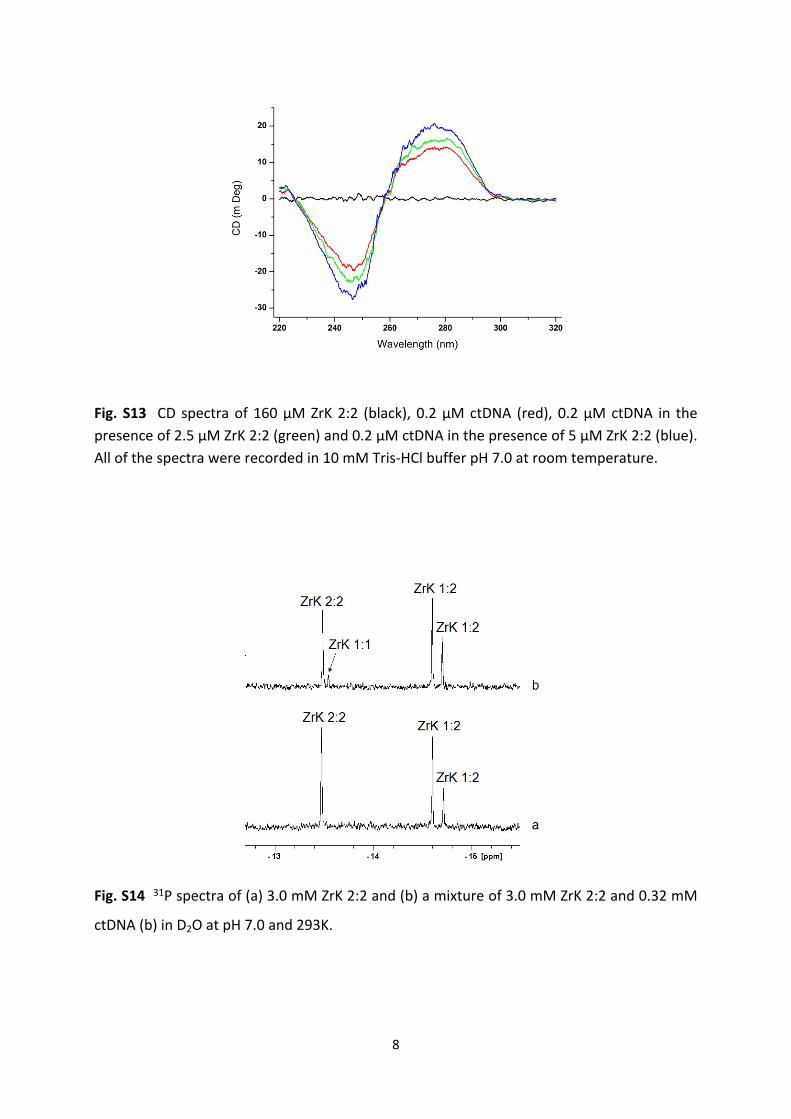
Fig. S13 CD spectra of 160 µM ZrK 2:2 (black), 0.2 µM ctDNA (red), 0.2 µM ctDNA in the presence of 2.5 µM ZrK 2:2 (green) and 0.2 µM ctDNA in the presence of 5 µM ZrK 2:2 (blue). All of the spectra were recorded in 10 mM Tris-HCl buffer pH 7.0 at room temperature.
Fig. S14 31P spectra of (a) 3.0 mM ZrK 2:2 and (b) a mixture of 3.0 mM ZrK 2:2 and 0.32 mM
ctDNA (b) in D2O at pH 7.0 and 293K.
9
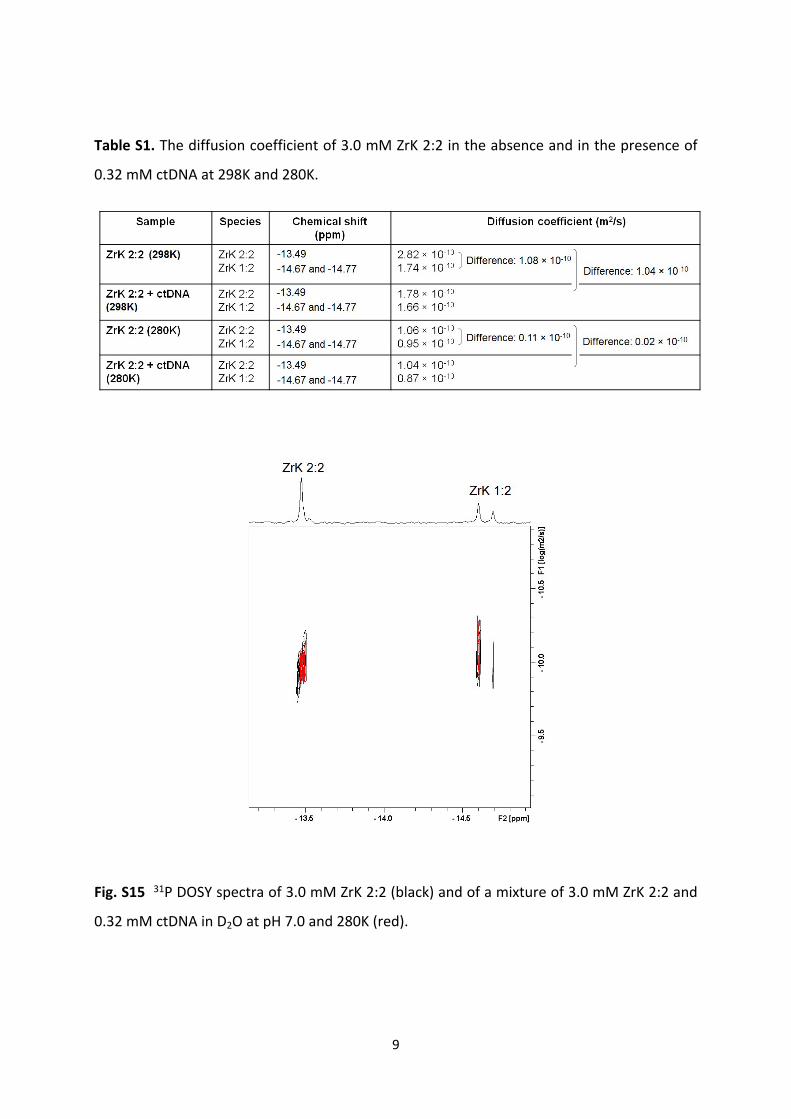
Table S1. The diffusion coefficient of 3.0 mM ZrK 2:2 in the absence and in the presence of
0.32 mM ctDNA at 298K and 280K.
Fig. S15 31P DOSY spectra of 3.0 mM ZrK 2:2 (black) and of a mixture of 3.0 mM ZrK 2:2 and
0.32 mM ctDNA in D2O at pH 7.0 and 280K (red).
Recommended