HandelsbankenJanuary – December 2017
7 February 2018

0
25
50
75
100
125
150
175
Q30
7Q
407
Q10
8Q
208
Q30
8Q
408
Q10
9Q
209
Q30
9Q
409
Q11
0Q
210
Q31
0Q
410
Q11
1Q
211
Q31
1Q
411
Q11
2Q
212
Q31
2Q
412
Q11
3Q
213
Q31
3Q
413
Q11
4Q
214
Q31
4Q
414
Q11
5Q
215
Q31
5Q
415
Q11
6Q
216
Q31
6Q
416
Q11
7Q
217
Q31
7Q
417
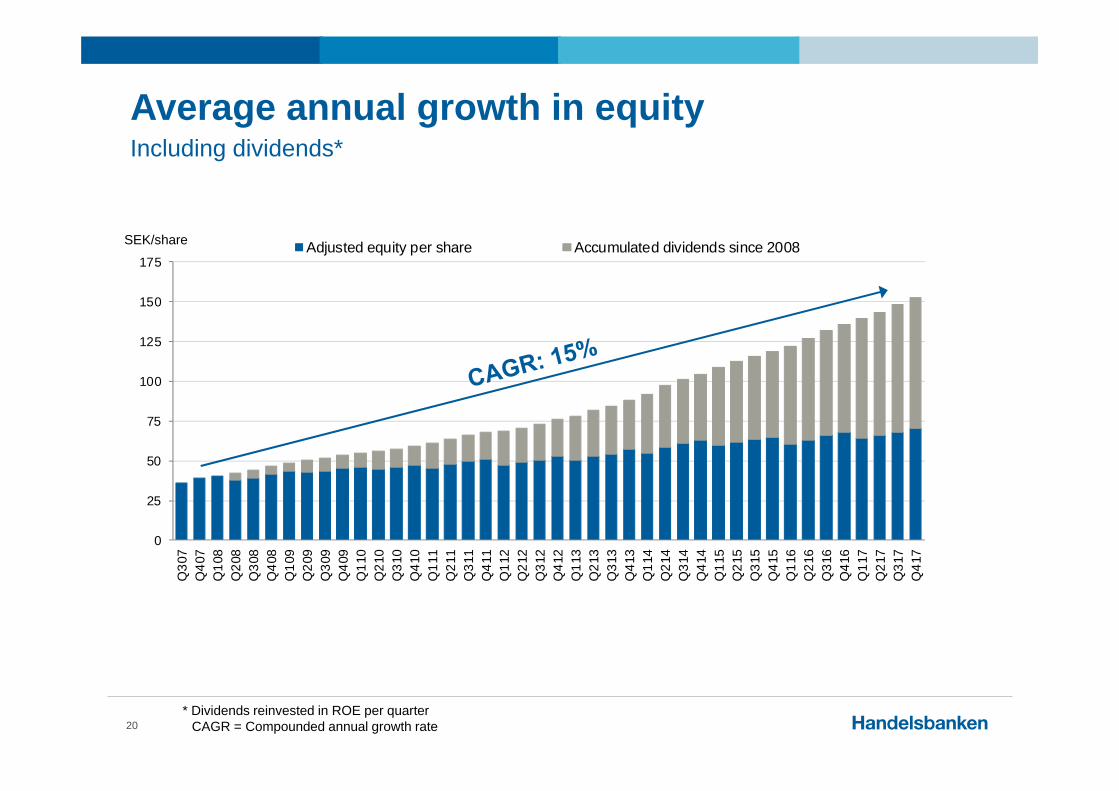
Adjusted equity per share Accumulated dividends since 2008
Average annual growth in equityIncluding dividends*
2
SEK/share
* Dividends reinvested in ROE per quarterCAGR = Compounded annual growth rate
Summary 2017
3
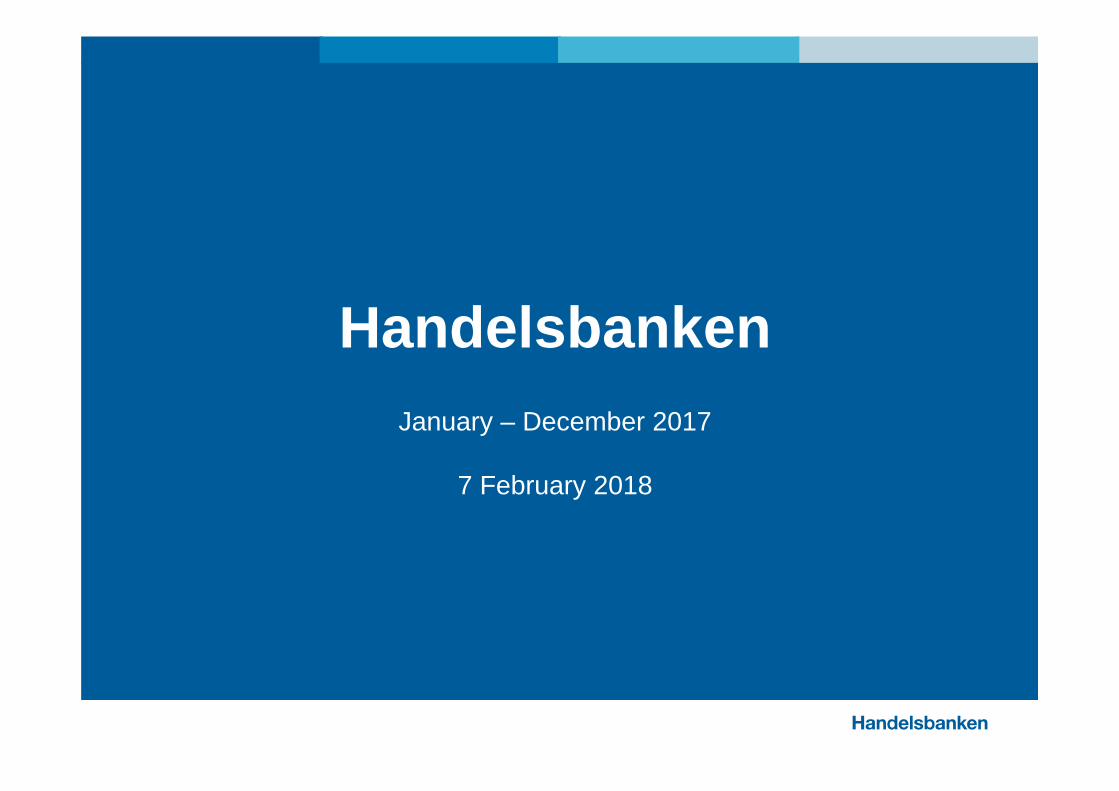
Operating profit amounted to SEK 21,025m (20,633) and increased by 3% adjusted for non-recurring items
EPS amounted to SEK 8.28 (8.43)
ROE went down to 12.3% (13.1)
Income increased to SEK 41,674m (40,763) and grew by 5% adjusted for non-recurring items
Net interest income rose by 7% to SEK 29,766m (27,943)
Net fee and commission income rose by 6% to SEK 9,718m (9,156)
Continued growth in lending and assets under management in all home markets
The loan loss ratio fell to 0.08% (0.09)
The CET1 ratio amounted to 22.7% (25.1) and the total capital ratio amounted to 28.3% (31.4)
The Board proposes an ordinary dividend per share of SEK 5.50 and an extra dividend per share of 2.00, and that the current buy-back mandate is extended one more year
Income statement, January – December
4
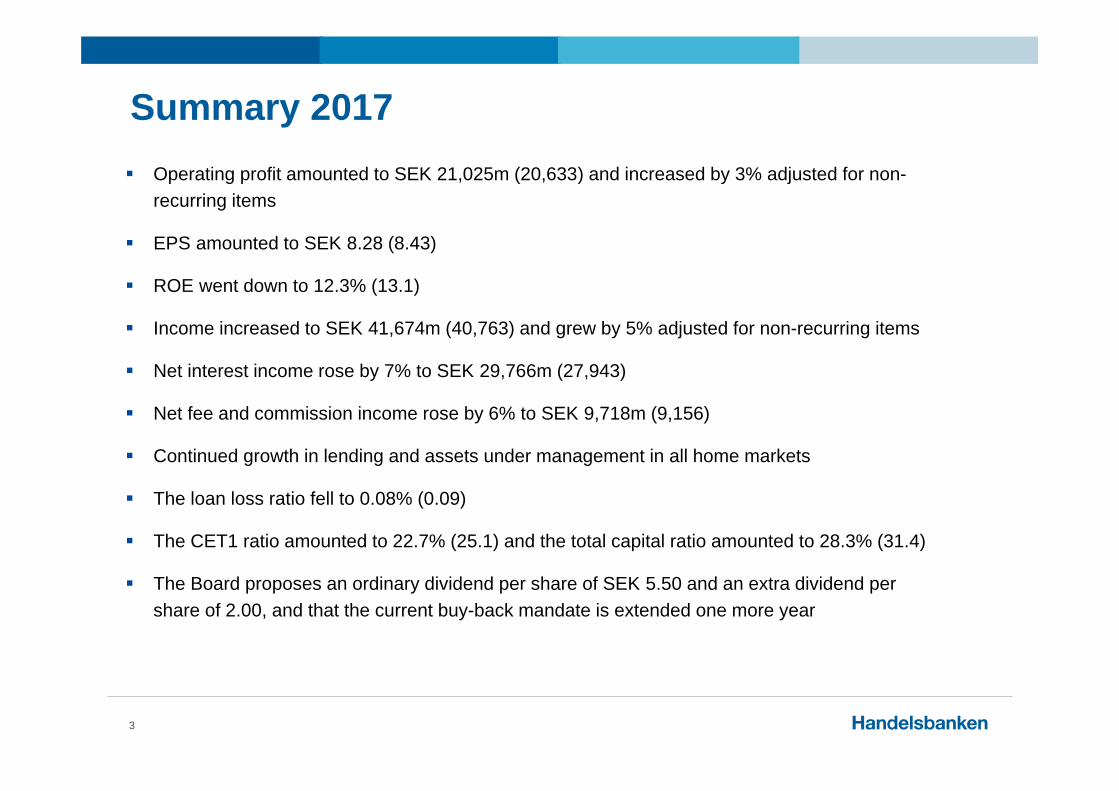
SEK mFull year
2017Full year
2016 ChangeNet interest income 29,766 27,943 7%Net fee and commission income 9,718 9,156 6%Net gains/losses on financial transactions 1,271 3,066 -59%Risk result - insurance 142 142 0%Other income 777 456 70%Total income 41,674 40,763 2%Staff costs -12,472 -12,542 -1%Other expenses -6,508 -5,896 10%Total expenses -18,980 -18,438 3%Profit before loan losses 22,694 22,325 2%Net loan losses -1,683 -1,724 -2%Gains/losses on disposal of property, equipment and intangible assets 14 32 -56%
Operating profit 21,025 20,633 2%Taxes -4,923 -4,401 12%Net profit from discontinued operations - 13Profit for the period 16,102 16,245 -1%
+1% adjusted for:
SEK -700m reserve 2016
SEK -768m Oktogonen 2017
SEK +239m one-off in Norway 2017
SEK 1.7bn realised gains in 2016
+7% adjusted for the above
SEK 0.6bn in received dividend from VISA Sweden 2017
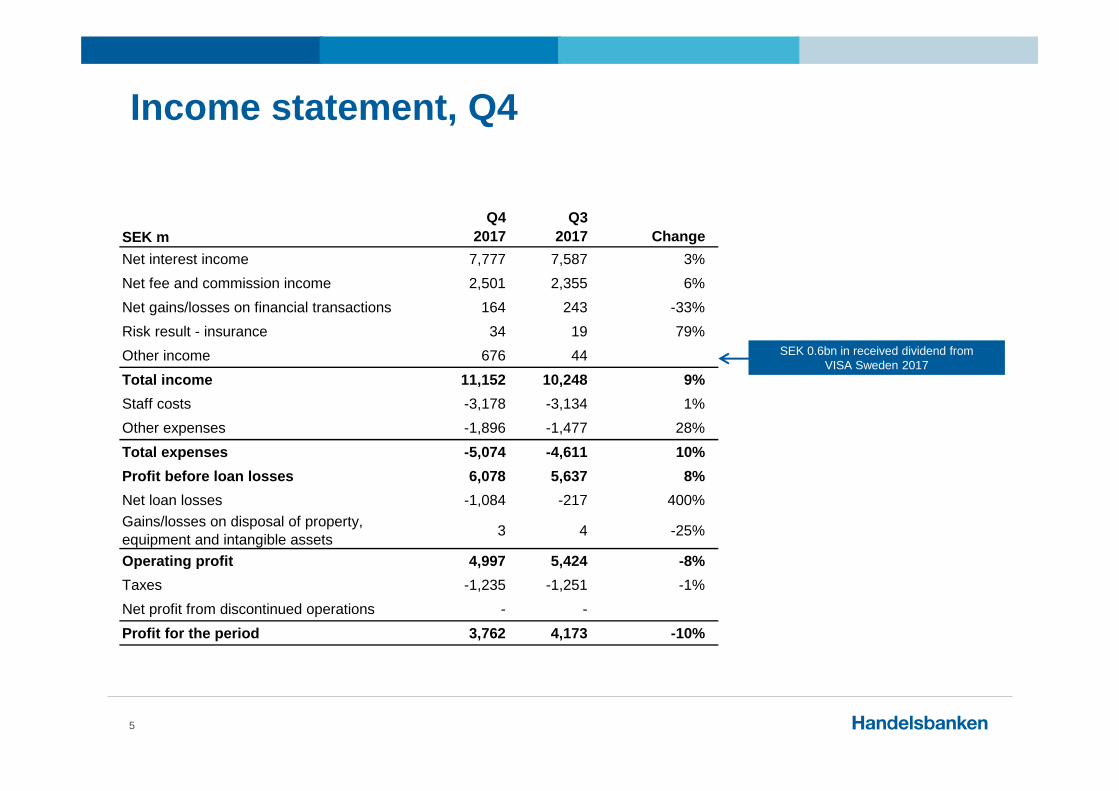
Income statement, Q4
5
SEK mQ4
2017Q3
2017 ChangeQ4
2016 ChangeNet interest income 7,777 7,587 3% 7,299 7%Net fee and commission income 2,501 2,355 6% 2,447 2%Net gains/losses on financial transactions 164 243 -33% 269 -39%Risk result - insurance 34 19 79% 6 467%Other income 676 44 104Total income 11,152 10,248 9% 10,125 10%Staff costs -3,178 -3,134 1% -2,981 7%Other expenses -1,896 -1,477 28% -1,632 16%Total expenses -5,074 -4,611 10% -4,613 10%Profit before loan losses 6,078 5,637 8% 5,512 10%Net loan losses -1,084 -217 400% -832 30%Gains/losses on disposal of property, equipment and intangible assets 3 4 -25% 18 -83%
Operating profit 4,997 5,424 -8% 4,698 6%Taxes -1,235 -1,251 -1% -1,254 -2%Net profit from discontinued operations - - -Profit for the period 3,762 4,173 -10% 3,444 9%
SEK 0.6bn in received dividend from VISA Sweden 2017
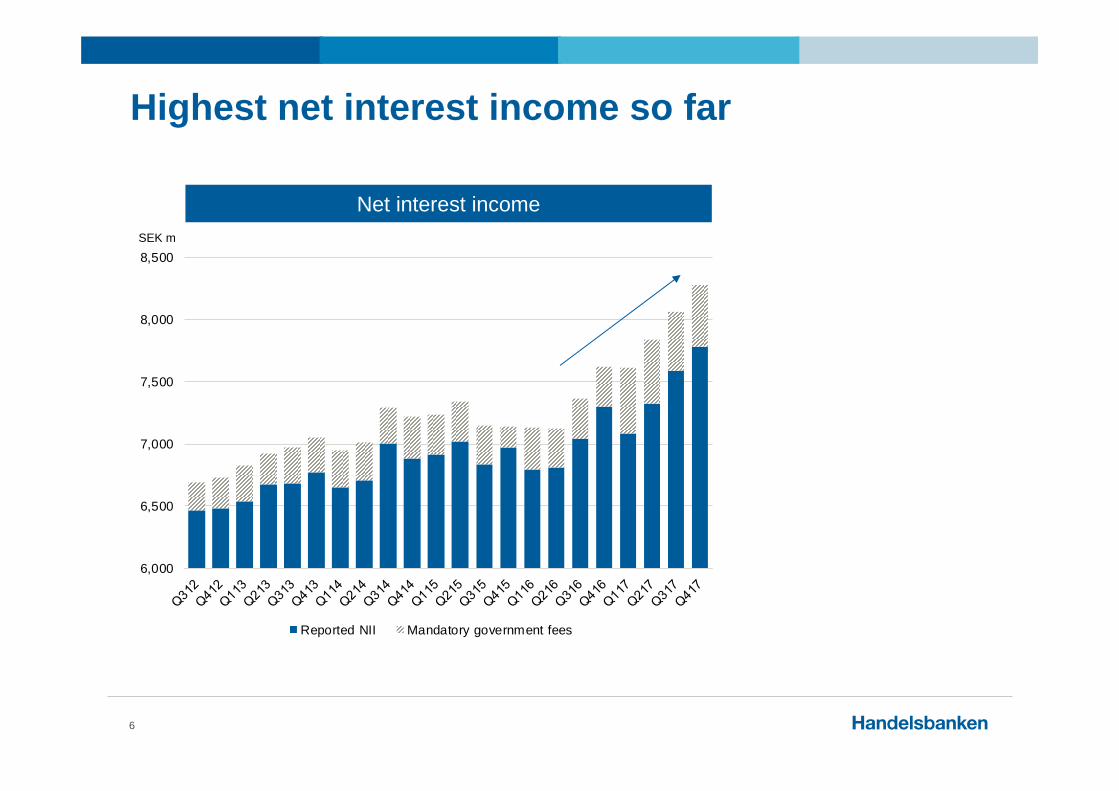
Highest net interest income so far
6
Net interest income
6,000
6,500
7,000
7,500
8,000
8,500
Reported NII Mandatory government fees
SEK m

Widespread increase in net interest income in the Group
7
Net interest income Q2 2016 – Q4 2017 Local currency, index=100 Q2 2016
115
121117
102 103
146
114
60
70
80
90
100
110
120
130
140
150
160
Sweden UK Norway Denmark Finland TheNetherlands
Group
Index

105
122
112109
106
204
103106
70
80
90
100
110
120
130
140
150
160
Sweden UK Denmark Finland Norway TheNetherlands
CapitalMarkets
Group
Widespread increase in net fee and commissions income in the Group
8
Net fee and commission income Q4 2016 – Q4 2017*Local currency, index=100 Q4 2016
Index
* 12-month rolling
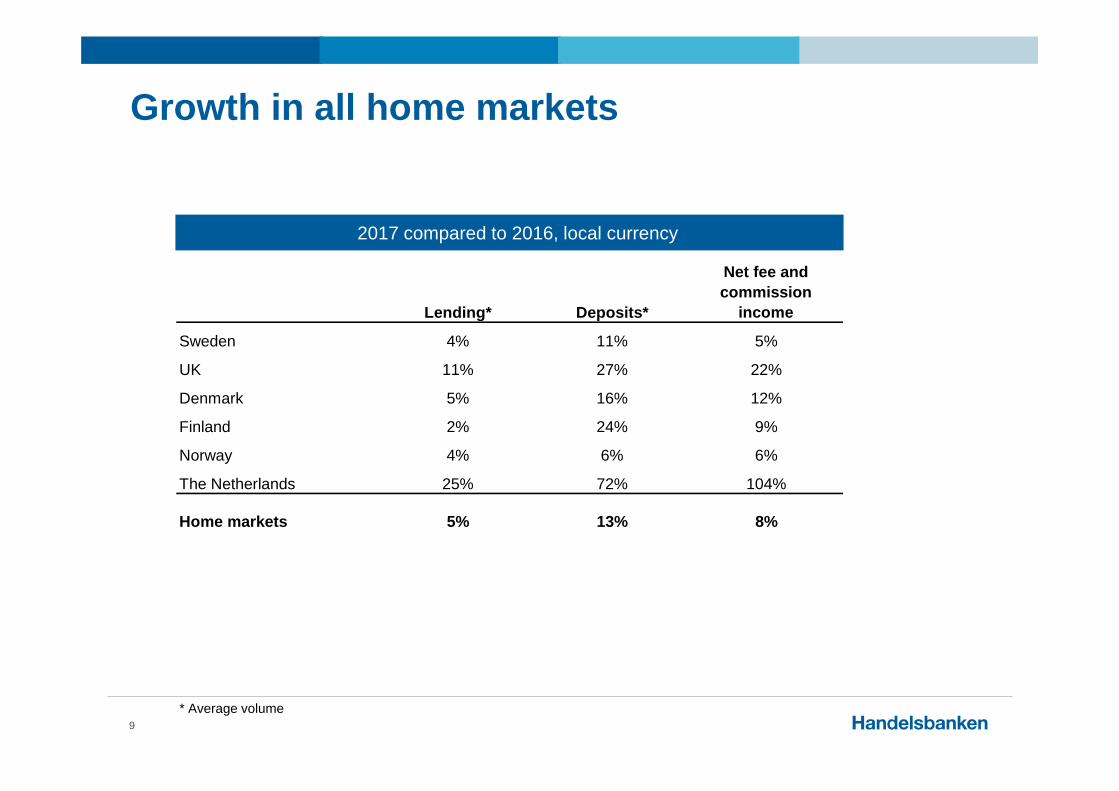
Growth in all home markets
9
2017 compared to 2016, local currency
Lending* Deposits*
Net fee and commission
income
Sweden 4% 11% 5%
UK 11% 27% 22%
Denmark 5% 16% 12%
Finland 2% 24% 9%
Norway 4% 6% 6%
The Netherlands 25% 72% 104%
Home markets 5% 13% 8%
* Average volume
154
106
32 44
8
-20
0
20
40
60
80
100
120
140
160
180
2010 2011 2012 2013 2014 2015 2016 2017
Handelsbanken
Bank 1
Bank 2
Bank 3
Bank 4
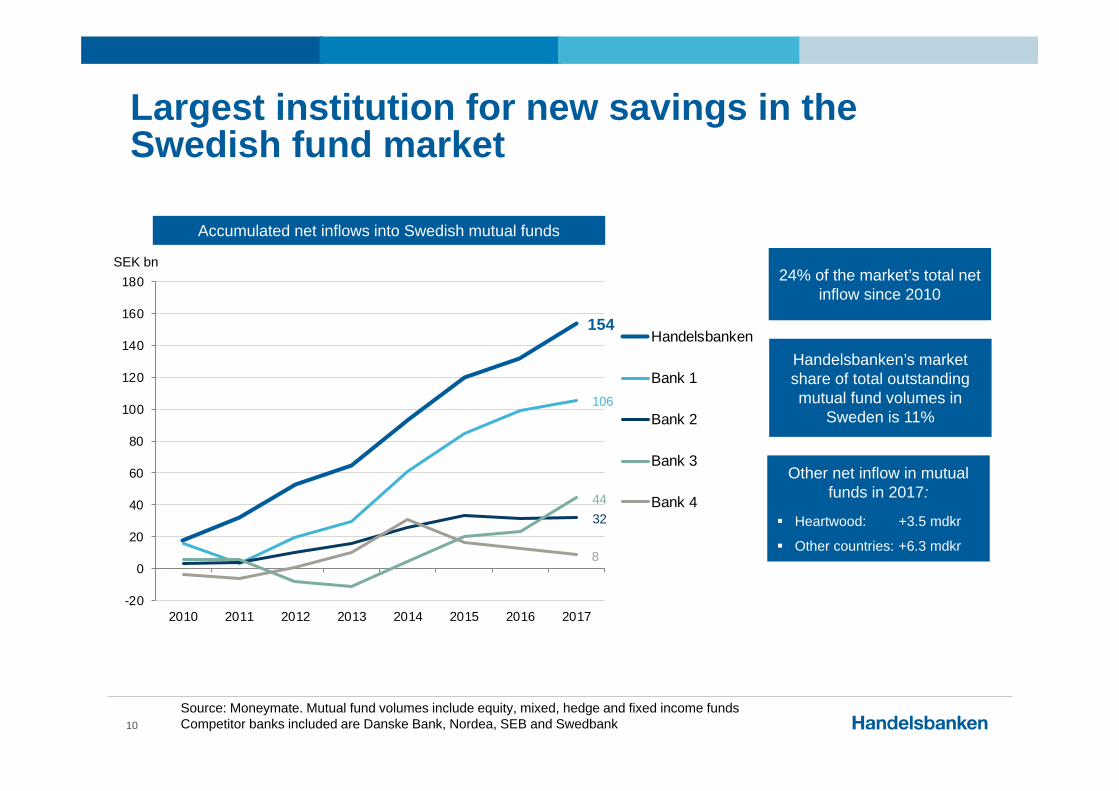
Largest institution for new savings in the Swedish fund market
10
Accumulated net inflows into Swedish mutual funds
SEK bn24% of the market’s total net
inflow since 2010
Handelsbanken’s market share of total outstanding mutual fund volumes in
Sweden is 11%
Other net inflow in mutual funds in 2017:
Heartwood: +3.5 mdkr
Other countries: +6.3 mdkr
Source: Moneymate. Mutual fund volumes include equity, mixed, hedge and fixed income fundsCompetitor banks included are Danske Bank, Nordea, SEB and Swedbank
0
100
200
300
400
500
600
Q416 Q117 Q217 Q317 Q417
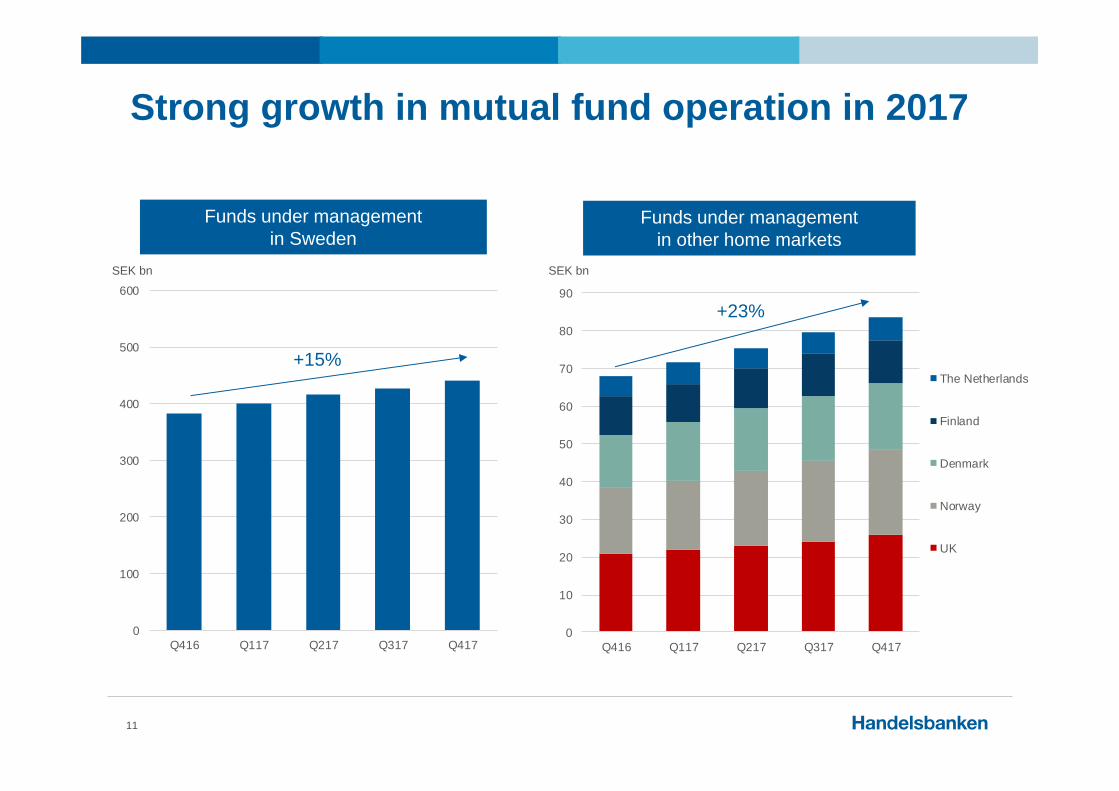
Strong growth in mutual fund operation in 2017
11
SEK bn
Funds under managementin Sweden
+15%
0
10
20
30
40
50
60
70
80
90
Q416 Q117 Q217 Q317 Q417
The Netherlands
Finland
Denmark
Norway
UK
Funds under managementin other home markets
+23%
SEK bn

Deepen and strengthen local relations with the help of digital tools
12
0
5 000
10 000
15 000
20 000
25 000
Net interestincome
Net fee andcommission
income
Income Staff costs* Otherexpenses
Loan losses Operatingprofit*
2016
2017
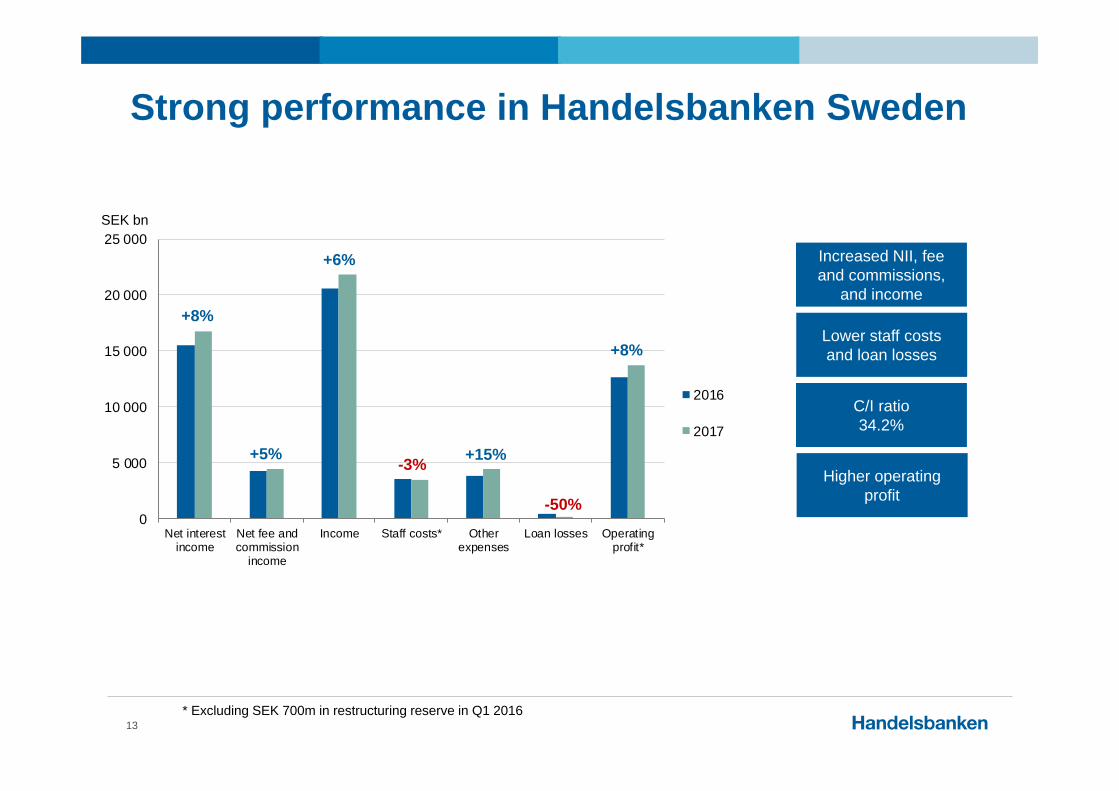
Strong performance in Handelsbanken Sweden
13
+8%
+5%
-50%
+8%
SEK bn
+6%
-3% +15%
Increased NII, fee and commissions,
and income
Lower staff costs and loan losses
Higher operating profit
C/I ratio34.2%
* Excluding SEK 700m in restructuring reserve in Q1 2016
0
100
200
300
400
500
600
2009 2010 2011 2012 2013 2014 2015 2016 2017
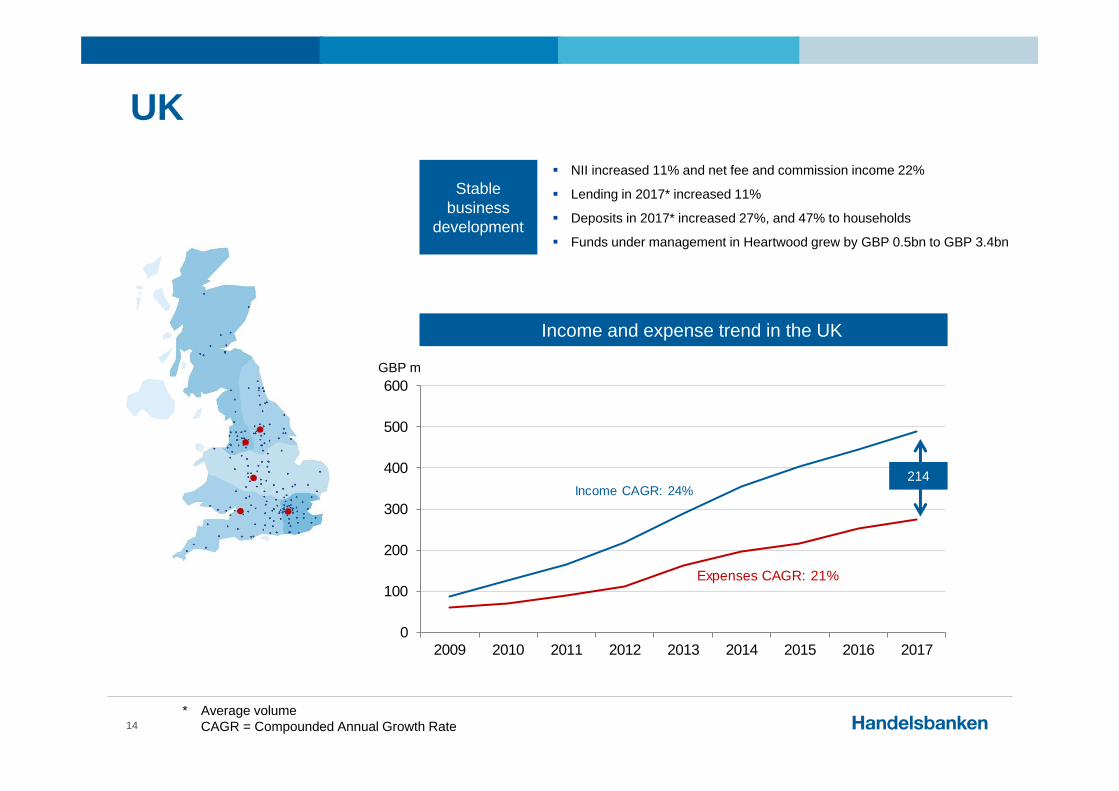
Income CAGR: 24%
Expenses CAGR: 21%
UK
14
Income and expense trend in the UK
* Average volumeCAGR = Compounded Annual Growth Rate
214
GBP m
Stable business
development
NII increased 11% and net fee and commission income 22%
Lending in 2017* increased 11%
Deposits in 2017* increased 27%, and 47% to households
Funds under management in Heartwood grew by GBP 0.5bn to GBP 3.4bn
Selection of recognitions during the year
15
Most satisfied private and corporate customers in the UK
Best Private Bank in the UK Best Small Business bank

Brexit preparations bring forward the next step in UK development
16
446
251
490
268
0
100
200
300
400
500
600
Income Expenses, excluding Brexit related
2016 2017
Stable business development driven by satisfied customers
+10.1%
+6.9%
GBP m
SEK 86m in Brexit-related expenses in 2017
SEK 300m for continued development in 2018
Income and expenses in the UK
Ongoing development initiatives:
Costs/investments: Administration, organisation, reporting, IT support and development
Operating effects: Brought forward development and improved business support increases the possibilities for new business and add support for our employees and customers
0
5
10
15
20
25
30
2016 2017
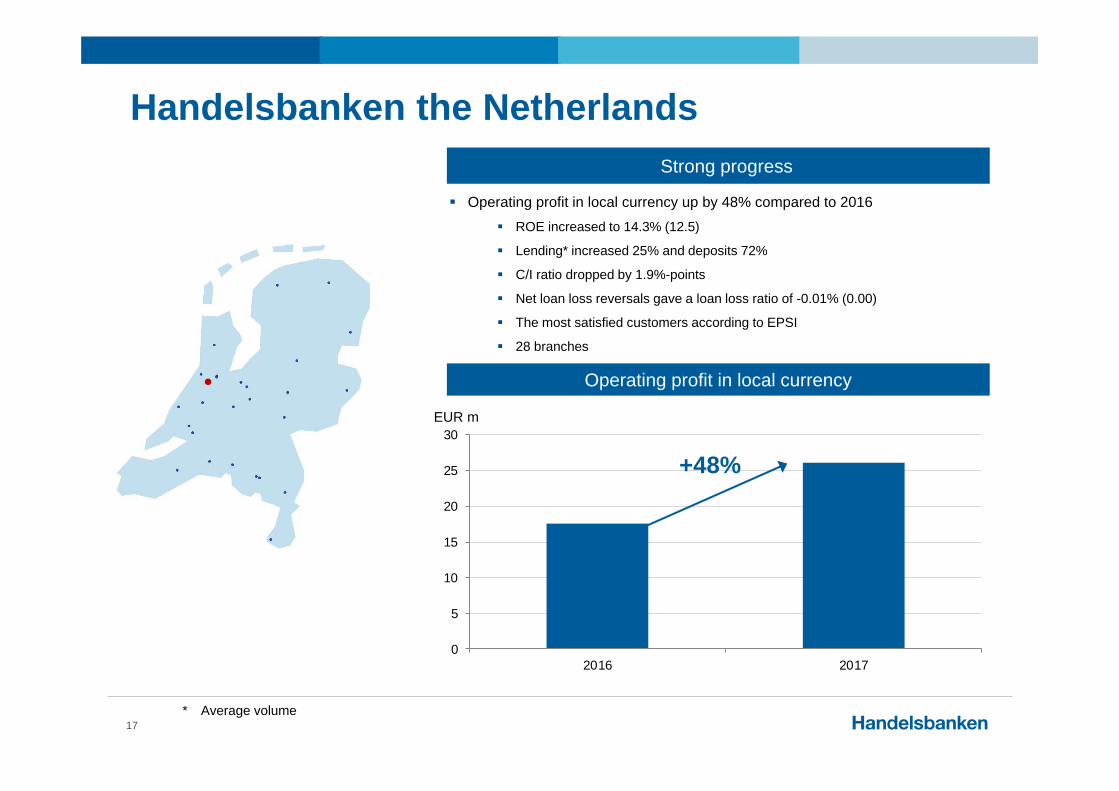
Handelsbanken the Netherlands
17
+48%
Operating profit in local currency
EUR m
Operating profit in local currency up by 48% compared to 2016 ROE increased to 14.3% (12.5)
Lending* increased 25% and deposits 72%
C/I ratio dropped by 1.9%-points
Net loan loss reversals gave a loan loss ratio of -0.01% (0.00)
The most satisfied customers according to EPSI
28 branches
Strong progress
* Average volume

Target range:21.2-23.2
Capital CRR/CRD IV, %31 Dec 2017
30 Sep 2017 Change
Capital ratio, % 28.3 28.5 -0.2%-pointsTier 1 ratio, % 25.0 25.9 -0.9%-pointsCommon equity tier 1 ratio, % 22.7 23.6 -0.9%-points
Total own funds, SEK bn 144.1 144.6 -0.5Common equity tier 1 capital, SEK bn 115.8 119.5 -3.7
Leverage ratio, % 4.6 4.4 +0.2%-points
Liquidity31 Dec 2017
LCR Total* 133%LCR EUR* 175%LCR USD* 482%LCR according to the EU Commission's delegated act 139%
NSFR 102%
103116
20.2%
22.7%
0%
5%
10%
15%
20%
25%
30%
Regulatoryminimum**
Common equitytier 1 capital
0
25
50
75
100
125
150
Financial stability
18
CET1 ratioQ4 2017
SEK bn
* According to the Swedish FSA’s definition** Estimated FSA requirement at the end of Q4 2017
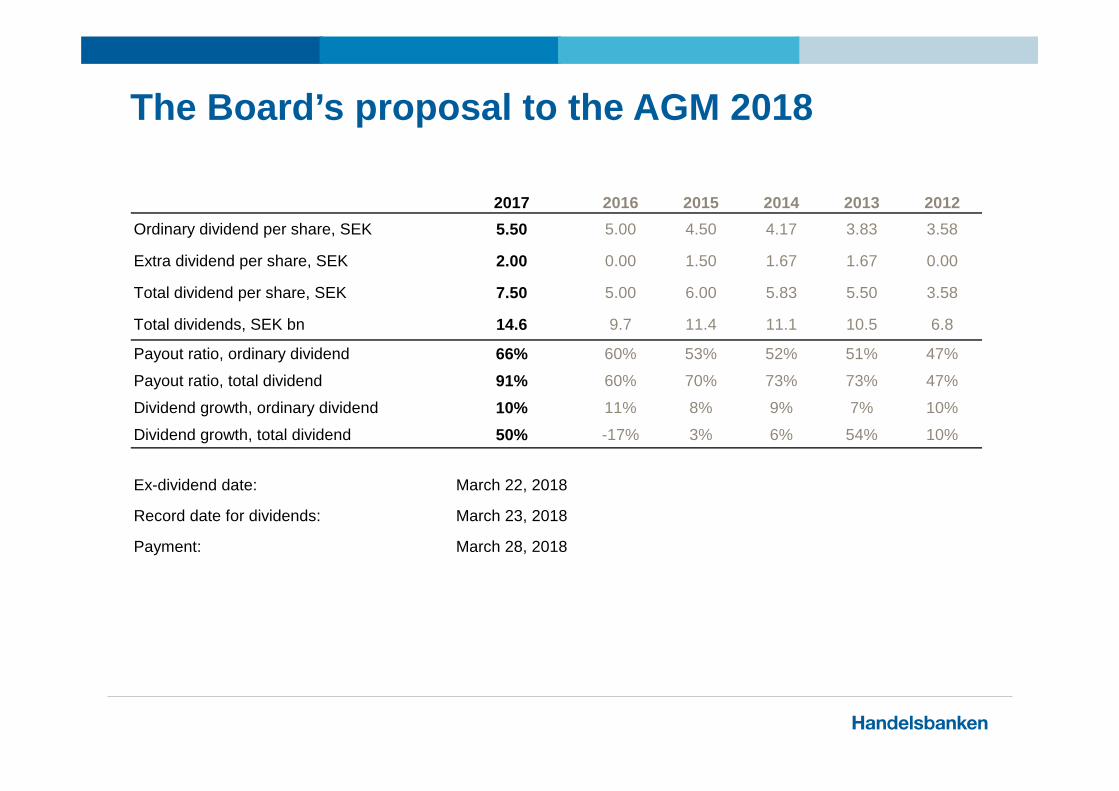
The Board’s proposal to the AGM 2018
2017 2016 2015 2014 2013 2012Ordinary dividend per share, SEK 5.50 5.00 4.50 4.17 3.83 3.58
Extra dividend per share, SEK 2.00 0.00 1.50 1.67 1.67 0.00
Total dividend per share, SEK 7.50 5.00 6.00 5.83 5.50 3.58
Total dividends, SEK bn 14.6 9.7 11.4 11.1 10.5 6.8
Payout ratio, ordinary dividend 66% 60% 53% 52% 51% 47%
Payout ratio, total dividend 91% 60% 70% 73% 73% 47%
Dividend growth, ordinary dividend 10% 11% 8% 9% 7% 10%
Dividend growth, total dividend 50% -17% 3% 6% 54% 10%
Ex-dividend date: March 22, 2018
Record date for dividends: March 23, 2018
Payment: March 28, 2018
0
25
50
75
100
125
150
175
Q30
7Q
407
Q10
8Q
208
Q30
8Q
408
Q10
9Q
209
Q30
9Q
409
Q11
0Q
210
Q31
0Q
410
Q11
1Q
211
Q31
1Q
411
Q11
2Q
212
Q31
2Q
412
Q11
3Q
213
Q31
3Q
413
Q11
4Q
214
Q31
4Q
414
Q11
5Q
215
Q31
5Q
415
Q11
6Q
216
Q31
6Q
416
Q11
7Q
217
Q31
7Q
417
Adjusted equity per share Accumulated dividends since 2008
Average annual growth in equityIncluding dividends*
20
SEK/share
* Dividends reinvested in ROE per quarterCAGR = Compounded annual growth rate

Appendix

Swedish housing market – stabilisation most likely
Marknadsförutsättningar
Sweden is in a booming economy Rising employment and population Improved state of surrounding economies
Households High savings rate and strong balance sheets Adapts to macro prudential supervisory initiatives
Price correction most apparent on owner-occupied apartments Longer sales processes, but sustained turnover
Construction sector and property developers New builds add to supply – wrong allocations? Buyers exist on the professional property market
Low interest rates in the foreseeable future
No credit restrictions in the banking sector
Handelsbanken Lending growth in line with market share. Local presence offers
comfort in volatile markets
Trend of falling LTVs on new lending. 67% of Stadshypotek’scustomers amortise
Lending based on repayment capacity – imputed rate of interest 7.5%
Debt to income ratio as part of the credit process for several years
Handelsbanken’s credit portfolio
Non-existent loan losses in Stadshypotek
Very low share of impaired loans and late payments in Stadshypotek
No signs of deteriorating credit quality in the mortgage book
No signs of deteriorating credit quality in lending to construction companies or property developers
Market conditions Handelsbanken
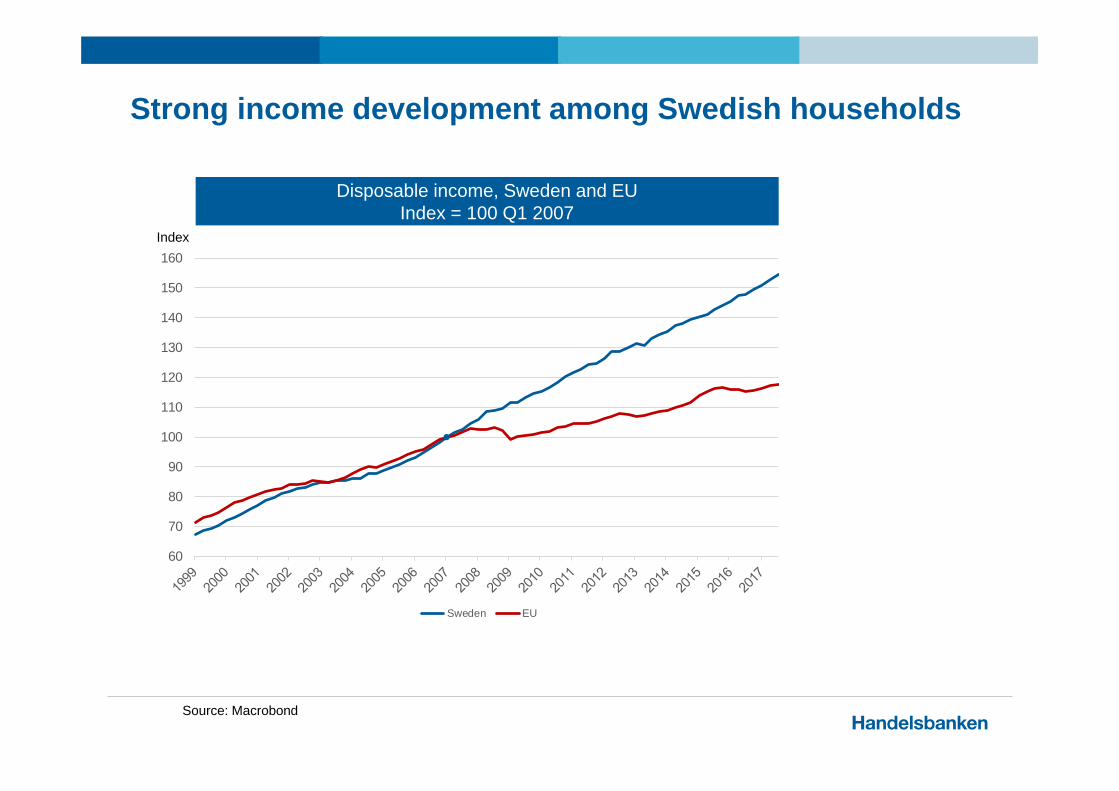
Strong income development among Swedish households
Source: Macrobond
Disposable income, Sweden and EUIndex = 100 Q1 2007
60
70
80
90
100
110
120
130
140
150
160
Sweden EU
Index
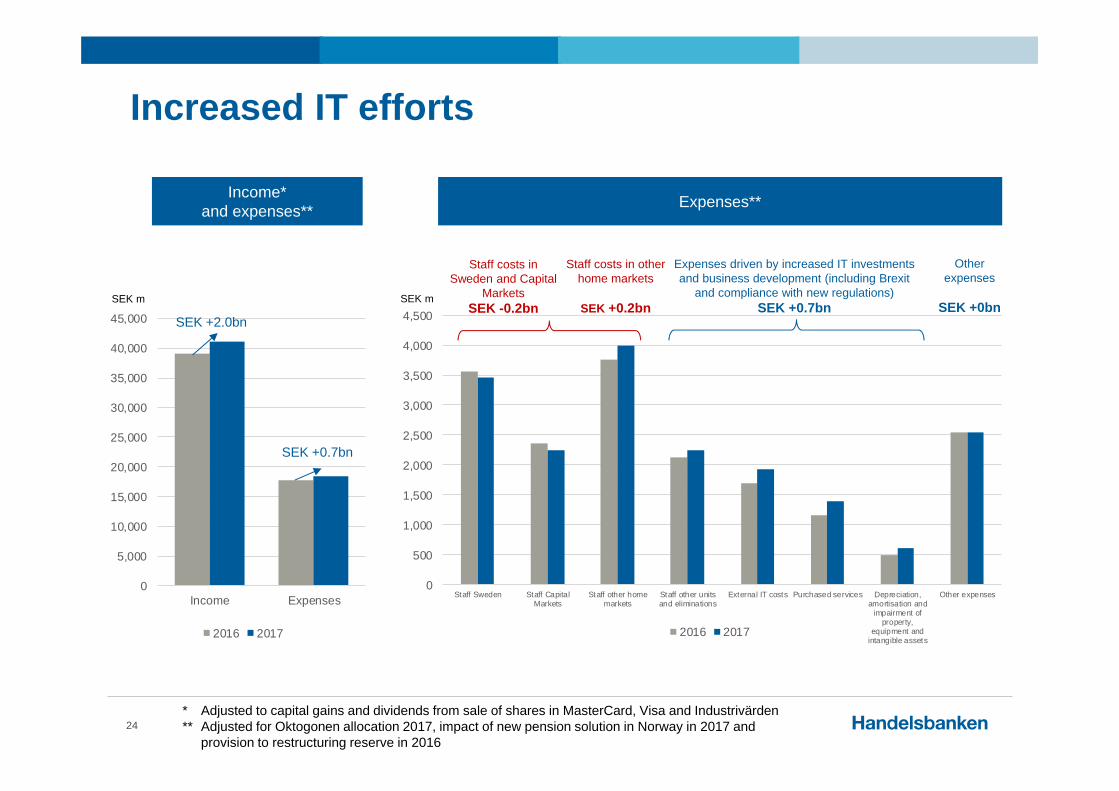
Increased IT efforts
24
0
5,000
10,000
15,000
20,000
25,000
30,000
35,000
40,000
45,000
Income Expenses
2016 2017
0
500
1,000
1,500
2,000
2,500
3,000
3,500
4,000
4,500
Staff Sweden Staff CapitalMarkets
Staff other homemarkets
Staff other unitsand eliminations
External IT costs Purchased services Depreciation,amortisation and
impairment ofproperty,
equipment andintangible assets
Other expenses
2016 2017
SEK +2.0bn
SEK +0.7bn
Staff costs in Sweden and Capital
Markets SEK -0.2bn
Income* and expenses**
* Adjusted to capital gains and dividends from sale of shares in MasterCard, Visa and Industrivärden** Adjusted for Oktogonen allocation 2017, impact of new pension solution in Norway in 2017 and
provision to restructuring reserve in 2016
Expenses**
Staff costs in other home markets
SEK +0.2bn
Expenses driven by increased IT investments and business development (including Brexit
and compliance with new regulations)SEK +0.7bn
Other expenses
SEK +0bnSEK m SEK m

Return on equity per home market
25
Full year 2017
Handelsbanken Sweden 15.3%
Handelsbanken the Netherlands 14.3%
Handelsbanken Norway 14.1%
Handelsbanken Finland 12.8%
Handelsbanken UK 10.2%
Handelsbanken Denmark 9.7%
Handelsbanken Group 12.3%
*
* 13.1% excluding one-off effect
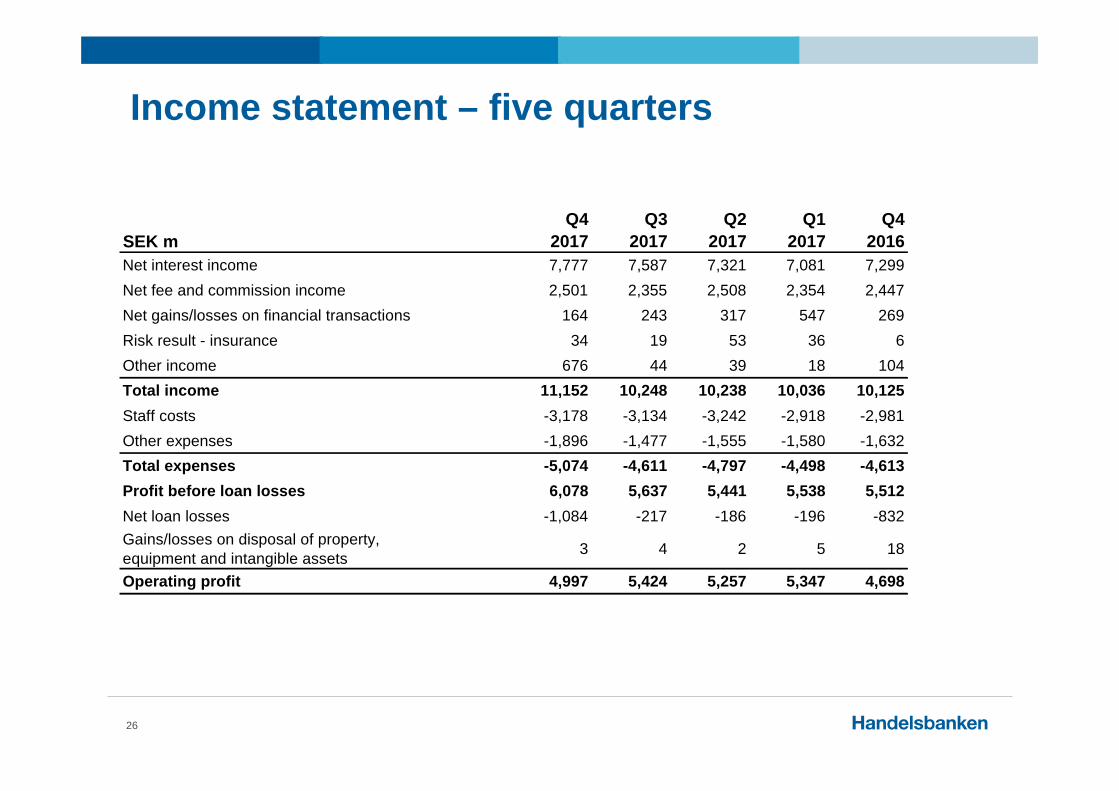
Income statement – five quarters
26
SEK mQ4
2017Q3
2017Q2
2017Q1
2017Q4
2016Net interest income 7,777 7,587 7,321 7,081 7,299Net fee and commission income 2,501 2,355 2,508 2,354 2,447Net gains/losses on financial transactions 164 243 317 547 269Risk result - insurance 34 19 53 36 6Other income 676 44 39 18 104Total income 11,152 10,248 10,238 10,036 10,125Staff costs -3,178 -3,134 -3,242 -2,918 -2,981Other expenses -1,896 -1,477 -1,555 -1,580 -1,632Total expenses -5,074 -4,611 -4,797 -4,498 -4,613Profit before loan losses 6,078 5,637 5,441 5,538 5,512Net loan losses -1,084 -217 -186 -196 -832Gains/losses on disposal of property, equipment and intangible assets 3 4 2 5 18
Operating profit 4,997 5,424 5,257 5,347 4,698

Change in net interest income from previous quarter
27
NII Q3 2017, SEK m 7,587
Lending margin -1Lending volume 55Deposit margin 4Deposit volume 8Day count effect 0Mandatory government fees -24Other, including allocation from Central Treasury 28Handelsbanken Sweden 70 1%
Lending margin -3Lending volume 53Deposit margin 10Deposit volume 2Day count effect 0Exchange rate movements 59Mandatory government fees -3Other, including allocation from Central Treasury 30Home markets outside Sweden 148 2%
Capital Markets -4 0%
Benchmark effect -50Other in Central Treasury and other units 66Allocated out from Central Treasury -40Other units and other -24 0%
Change in NII 190 3%Of which related to government fees -26 0%Of which related to currency effects 65 1%
NII Q4 2017 7,777
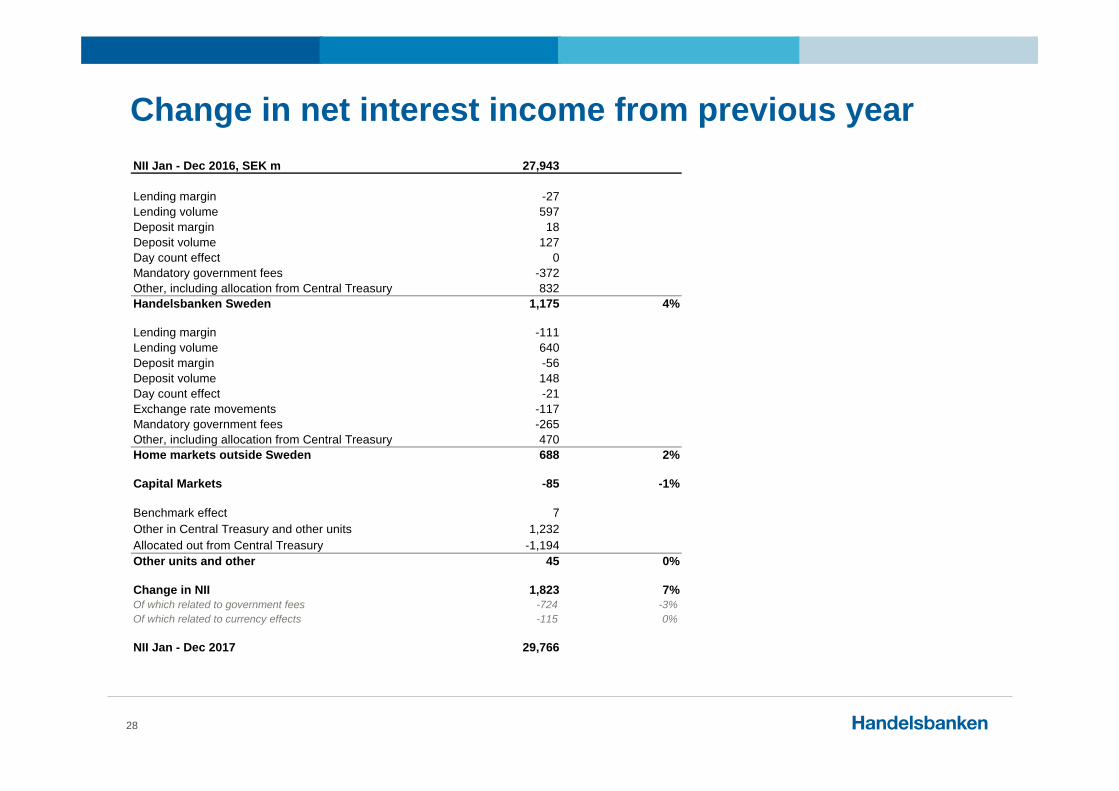
Change in net interest income from previous year
28
NII Jan - Dec 2016, SEK m 27,943
Lending margin -27Lending volume 597Deposit margin 18Deposit volume 127Day count effect 0Mandatory government fees -372Other, including allocation from Central Treasury 832Handelsbanken Sweden 1,175 4%
Lending margin -111Lending volume 640Deposit margin -56Deposit volume 148Day count effect -21Exchange rate movements -117Mandatory government fees -265Other, including allocation from Central Treasury 470Home markets outside Sweden 688 2%
Capital Markets -85 -1%
Benchmark effect 7Other in Central Treasury and other units 1,232Allocated out from Central Treasury -1,194Other units and other 45 0%
Change in NII 1,823 7%Of which related to government fees -724 -3%Of which related to currency effects -115 0%
NII Jan - Dec 2017 29,766
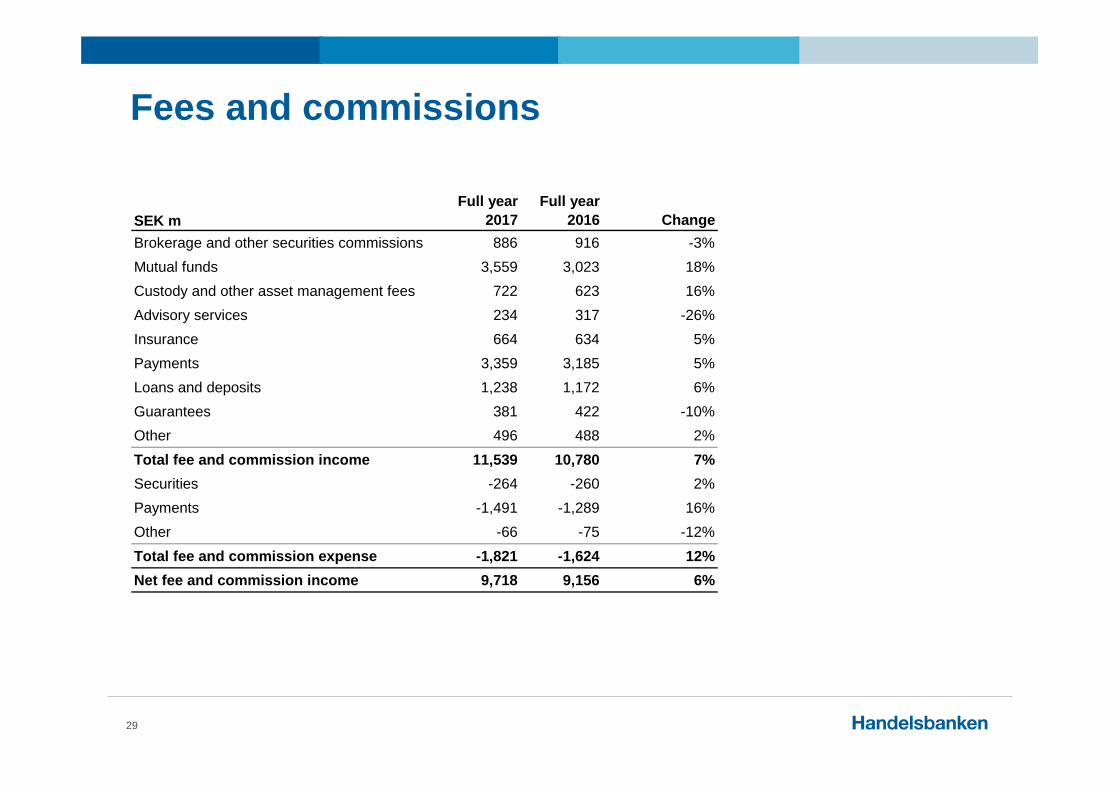
Fees and commissions
29
SEK mFull year
2017Full year
2016 ChangeBrokerage and other securities commissions 886 916 -3%Mutual funds 3,559 3,023 18%Custody and other asset management fees 722 623 16%Advisory services 234 317 -26%Insurance 664 634 5%Payments 3,359 3,185 5%Loans and deposits 1,238 1,172 6%Guarantees 381 422 -10%Other 496 488 2%Total fee and commission income 11,539 10,780 7%Securities -264 -260 2%Payments -1,491 -1,289 16%Other -66 -75 -12%Total fee and commission expense -1,821 -1,624 12%Net fee and commission income 9,718 9,156 6%

Mandatory government fees
30
2017 Resolution fund Deposit guarantee TotalSweden -812 -225 -1,037UK -154 -19 -173Denmark -59 -15 -74Finland -90 -11 -101Norway -169 -23 -192The Netherlands -18 0 -18Capital Markets -65 -1 -66Other -363 - -363Total -1,730 -294 -2,024

0
50
100
150
200
250
300
350
400
450
500
Q12009
Q12010
Q12011
Q12012
Q12013
Q12014
Q12015
Q12016
Q12017
Oktogonen quarterly
31
mkr

Effective tax rate
32
Effective tax rateQ4
2017Q3
2017Q2
2017Q1
2017Q4
2016Q3
2016Q2
2016Q1
2016Q4
2015Per quarter 24.7% 23.1% 22.8% 23.1% 26.7% 19.8% 20.7% 18.7% 19.4%
Accumulated year to date 23.4% 23.0% 23.0% 23.1% 21.3% 19.7% 19.7% 18.7% 20.9%

Change in common equity tier 1 ratio from previous quarterCRR/CRD IV
33
Common equity tier 1 ratio Q3 2017, % 23.6Change, percentage points:
Common equity tier 1 capital -0.7 Earnings after estimated dividends -0.6 Currency effects 0.1 IAS 19 0.0 AFS holdings -0.1 Other and rounding -0.1
Lending volume -0.2 Lending growth -0.1 Currency effects -0.1
Net effect different quality of inflows and outflows in loan portfolio -0.1Credit risk migration in the lending portfolio -0.3Other effects, net 0.4
Change in common equity tier 1 ratio -0.9Common equity tier 1 ratio Q4 2017, % 22.7
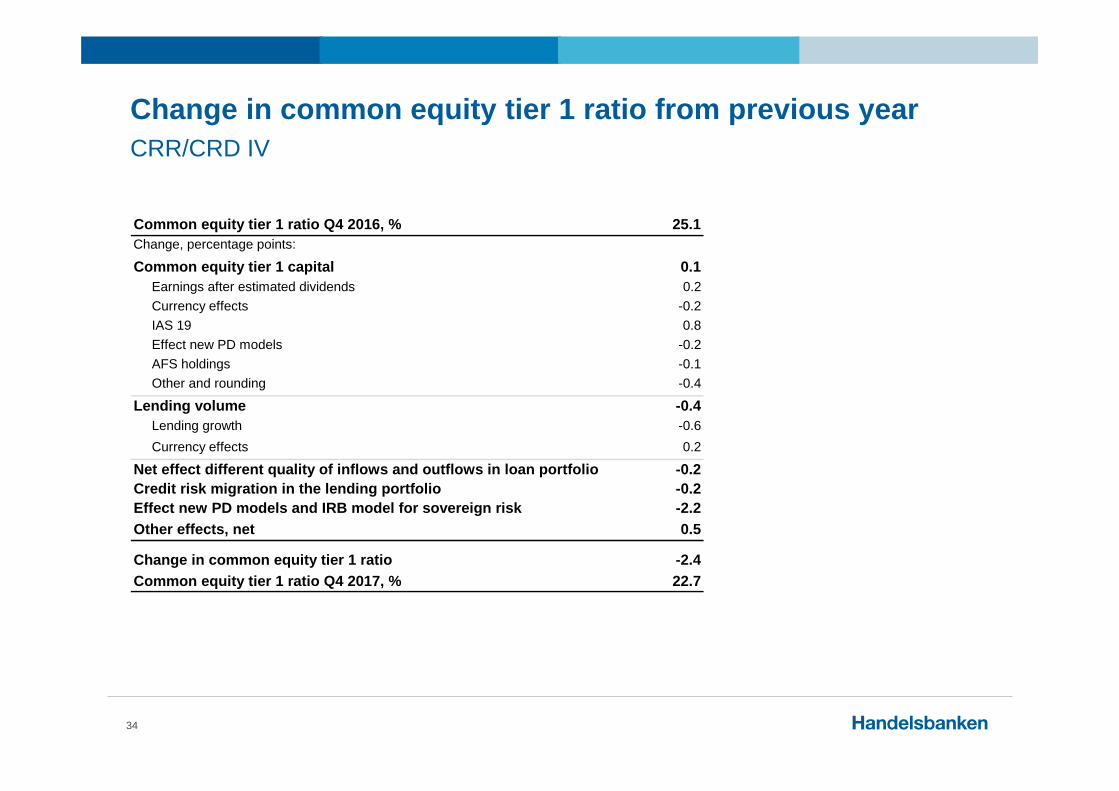
Change in common equity tier 1 ratio from previous yearCRR/CRD IV
34
Common equity tier 1 ratio Q4 2016, % 25.1Change, percentage points: Common equity tier 1 capital 0.1 Earnings after estimated dividends 0.2 Currency effects -0.2 IAS 19 0.8 Effect new PD models -0.2 AFS holdings -0.1 Other and rounding -0.4
Lending volume -0.4 Lending growth -0.6 Currency effects 0.2
Net effect different quality of inflows and outflows in loan portfolio -0.2Credit risk migration in the lending portfolio -0.2Effect new PD models and IRB model for sovereign risk -2.2Other effects, net 0.5
Change in common equity tier 1 ratio -2.4Common equity tier 1 ratio Q4 2017, % 22.7

Balance sheet
35
SEK bnFull year
2017Full year
2016 ChangeCash and central banks 265 225 18%Loans to the public 2,066 1,964 5%Loans to other credit institutions 20 31 -37%Interest-bearing securities 179 161 11%Other assets 237 247 -4%Total assets 2,767 2,628 5%
Deposits and borrowing from the public 942 829 14%Due to credit institutions 175 179 -2%Issued securities 1,277 1,262 1%Other liabilities 231 222 4%Total equity 142 136 4%Total liabilities and equity 2,767 2,628 5%

Non-encumbered assets, NEA31 December 2017
36
SEK bn NEA
Accumulated coverage ratio in % of unsecured
funding*
Cash with central banks and securities in the liquidity portfolio 444 53%
Mortgage loans 549 118%
Other household lending 190 141%
Property company lending lowest risk class (1-3) 276 174%
Other corporate lending lowest risk class (1-3) 141 191%
Loans to credit institutions lowest risk class (1-3) 19 193%
Other corporate lending 248 223%
Other assets 9 224%
Total non-encumbered assets (NEA) 1,876 224%
Encumbered assets without underlying liabilities** 61
Encumbered assets with underlying liabilities 830
Total assets, Group 2,767
* Issued short and long unsecured funding and due to credit institutions** Over-collateralisation in cover pool (OC)

Long-term bond funding
37
Long term bond issuance, SEK bn 2017 2016 ChangeSenior bonds 22 50 -28
Covered bonds 138 148 -10
Subordinated loans 3 0 3
Total 163 198 -35
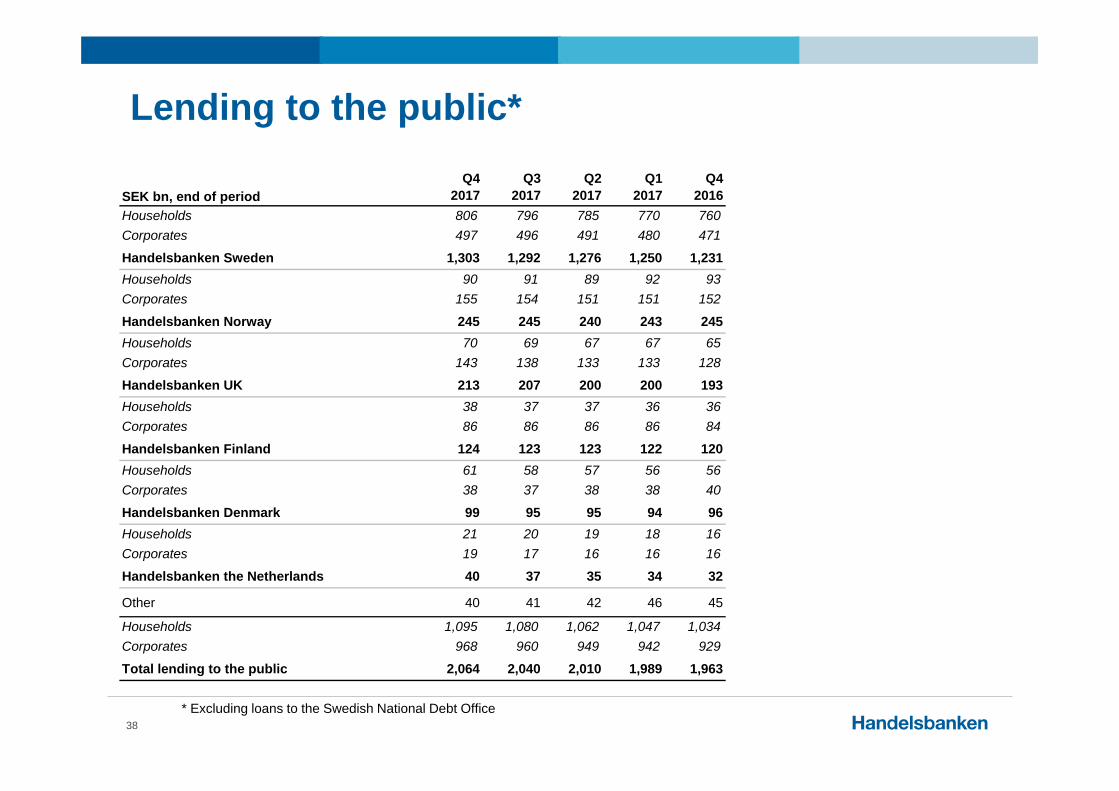
Lending to the public*
38
SEK bn, end of periodQ4
2017Q3
2017Q2
2017Q1
2017Q4
2016Households 806 796 785 770 760Corporates 497 496 491 480 471
Handelsbanken Sweden 1,303 1,292 1,276 1,250 1,231Households 90 91 89 92 93Corporates 155 154 151 151 152
Handelsbanken Norway 245 245 240 243 245Households 70 69 67 67 65Corporates 143 138 133 133 128
Handelsbanken UK 213 207 200 200 193Households 38 37 37 36 36Corporates 86 86 86 86 84
Handelsbanken Finland 124 123 123 122 120Households 61 58 57 56 56Corporates 38 37 38 38 40
Handelsbanken Denmark 99 95 95 94 96Households 21 20 19 18 16Corporates 19 17 16 16 16
Handelsbanken the Netherlands 40 37 35 34 32
Other 40 41 42 46 45
Households 1,095 1,080 1,062 1,047 1,034Corporates 968 960 949 942 929
Total lending to the public 2,064 2,040 2,010 1,989 1,963
* Excluding loans to the Swedish National Debt Office

Deposits from the public
39
SEK bn, end of periodQ4
2017Q3
2017Q2
2017Q1
2017Q4
2016Households 336 335 328 314 309Corporates 233 232 232 247 199
Handelsbanken Sweden 569 567 560 561 508Households 48 45 41 38 37Corporates 98 97 95 88 80
Handelsbanken UK 146 142 136 126 117Households 20 21 21 20 21Corporates 40 47 45 52 44
Handelsbanken Norway 60 68 66 72 65Households 15 16 15 14 14Corporates 26 27 25 25 22
Handelsbanken Finland 41 43 40 39 36Households 17 17 17 16 16Corporates 24 22 27 18 21
Handelsbanken Denmark 41 39 44 34 37Households 1 1 1 1 1Corporates 6 7 6 8 2
Handelsbanken the Netherlands 7 8 7 9 3
Other 78 245 266 209 64
Households 445 443 430 410 404Corporates 497 669 690 640 425
Total deposits from the public 942 1,112 1,120 1,050 829
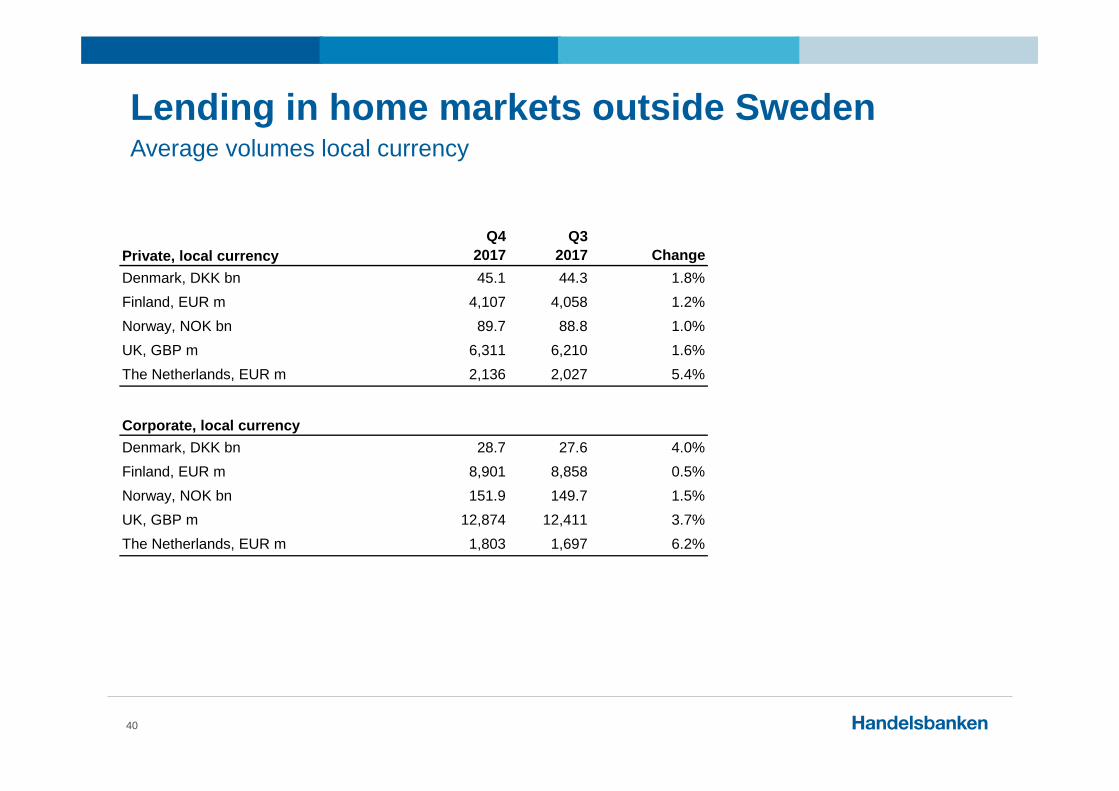
Lending in home markets outside SwedenAverage volumes local currency
40
Private, local currencyQ4
2017Q3
2017 ChangeDenmark, DKK bn 45.1 44.3 1.8%Finland, EUR m 4,107 4,058 1.2%Norway, NOK bn 89.7 88.8 1.0%UK, GBP m 6,311 6,210 1.6%The Netherlands, EUR m 2,136 2,027 5.4%
Corporate, local currencyDenmark, DKK bn 28.7 27.6 4.0%Finland, EUR m 8,901 8,858 0.5%Norway, NOK bn 151.9 149.7 1.5%UK, GBP m 12,874 12,411 3.7%The Netherlands, EUR m 1,803 1,697 6.2%

Lending in home markets outside SwedenAverage volumes local currency
41
Private, local currencyFull year
2017Full year
2016 ChangeDenmark, DKK bn 44.1 40.8 8.1%Finland, EUR m 4,061 3,975 2.2%Norway, NOK bn 88.7 85.9 3.3%UK, GBP m 6,127 5,527 10.9%The Netherlands, EUR m 1,959 1,434 36.6%
Corporate, local currencyDenmark, DKK bn 28.7 28.8 -0.3%Finland, EUR m 8,935 8,761 2.0%Norway, NOK bn 149.1 143.1 4.2%UK, GBP m 12,264 11,007 11.4%The Netherlands, EUR m 1,728 1,519 13.8%
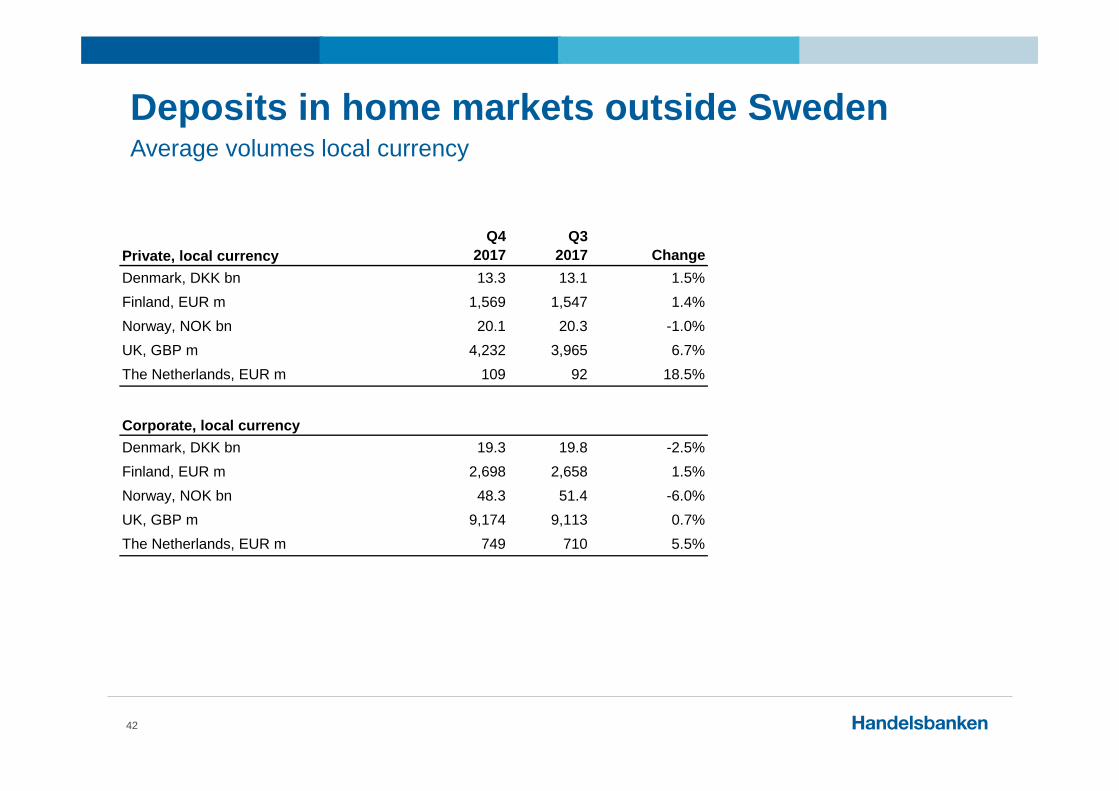
Deposits in home markets outside SwedenAverage volumes local currency
42
Private, local currencyQ4
2017Q3
2017 ChangeDenmark, DKK bn 13.3 13.1 1.5%Finland, EUR m 1,569 1,547 1.4%Norway, NOK bn 20.1 20.3 -1.0%UK, GBP m 4,232 3,965 6.7%The Netherlands, EUR m 109 92 18.5%
Corporate, local currencyDenmark, DKK bn 19.3 19.8 -2.5%Finland, EUR m 2,698 2,658 1.5%Norway, NOK bn 48.3 51.4 -6.0%UK, GBP m 9,174 9,113 0.7%The Netherlands, EUR m 749 710 5.5%
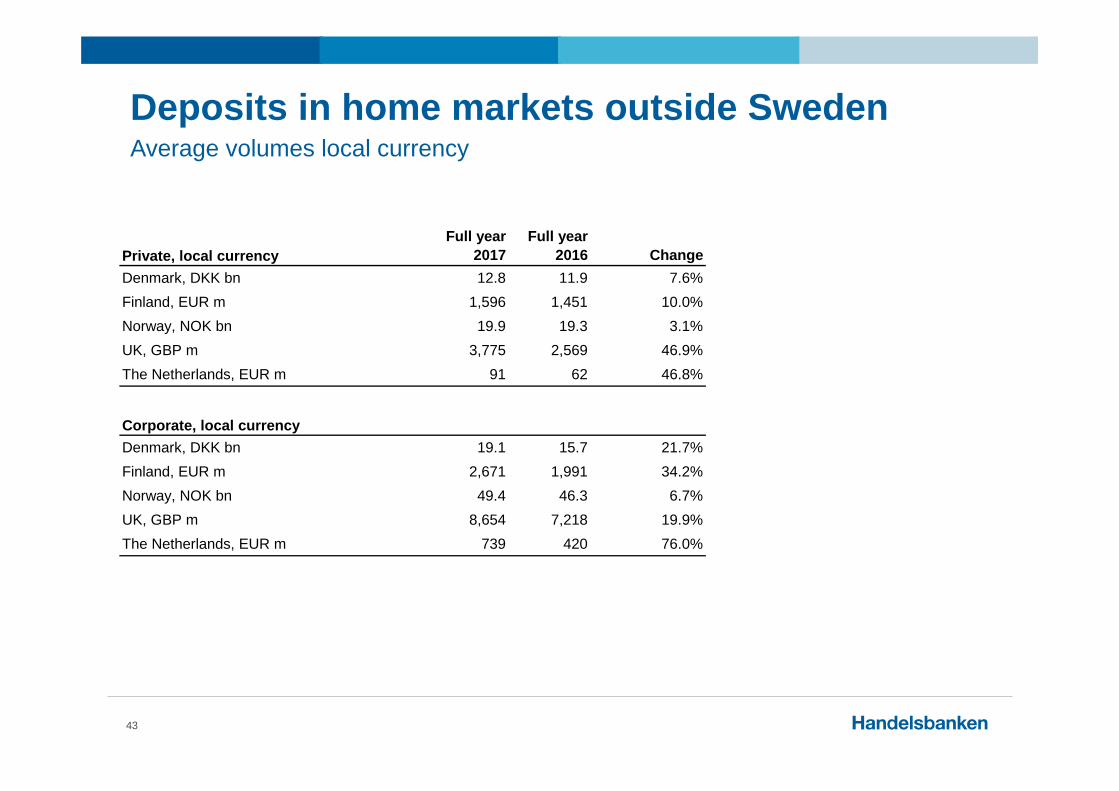
Deposits in home markets outside SwedenAverage volumes local currency
43
Private, local currencyFull year
2017Full year
2016 ChangeDenmark, DKK bn 12.8 11.9 7.6%Finland, EUR m 1,596 1,451 10.0%Norway, NOK bn 19.9 19.3 3.1%UK, GBP m 3,775 2,569 46.9%The Netherlands, EUR m 91 62 46.8%
Corporate, local currencyDenmark, DKK bn 19.1 15.7 21.7%Finland, EUR m 2,671 1,991 34.2%Norway, NOK bn 49.4 46.3 6.7%UK, GBP m 8,654 7,218 19.9%The Netherlands, EUR m 739 420 76.0%

Disclaimer
44
Certain statements made in this presentation are forward looking statements. Such statements are based on current expectations and are subject to a number of risks and uncertainties that could cause actual results and performance to differ materially from any expected future results or performance, express or implied, by the forward looking statements. Factors that might cause forward looking statements to differ materially from actual results include, among other things, regulatory and economic factors. Handelsbanken Group assumes no responsibility to update any of the forward looking statements contained herein.
No representation or warranty, express or implied, is made or given by or on behalf of Handelsbanken Group or its directors, officers or employees or any other person as to the accuracy, completeness or fairness of the information or opinions contained in this presentation. None of Handelsbanken Group or any of its directors, officers or employees nor any other person accepts any liability whatsoever for any loss howsoever arising from any use of this presentation or its contents or otherwise arising in connection therewith.
This presentation does not constitute or form part of any offer or invitation to sell or issue, or any solicitation of any offer to purchase or subscribe for, any securities of Handelsbanken Group, nor shall it or any part of it nor the fact of its distribution form the basis of, or be relied on in connection with, any contract or investment decision.
Recommended