1
November 2013
JBF INDUSTRIES LTD Investor Presentation
2
Index
Company Overview
Upcoming Projects
Industry Overview
Financial Performance
Index
3
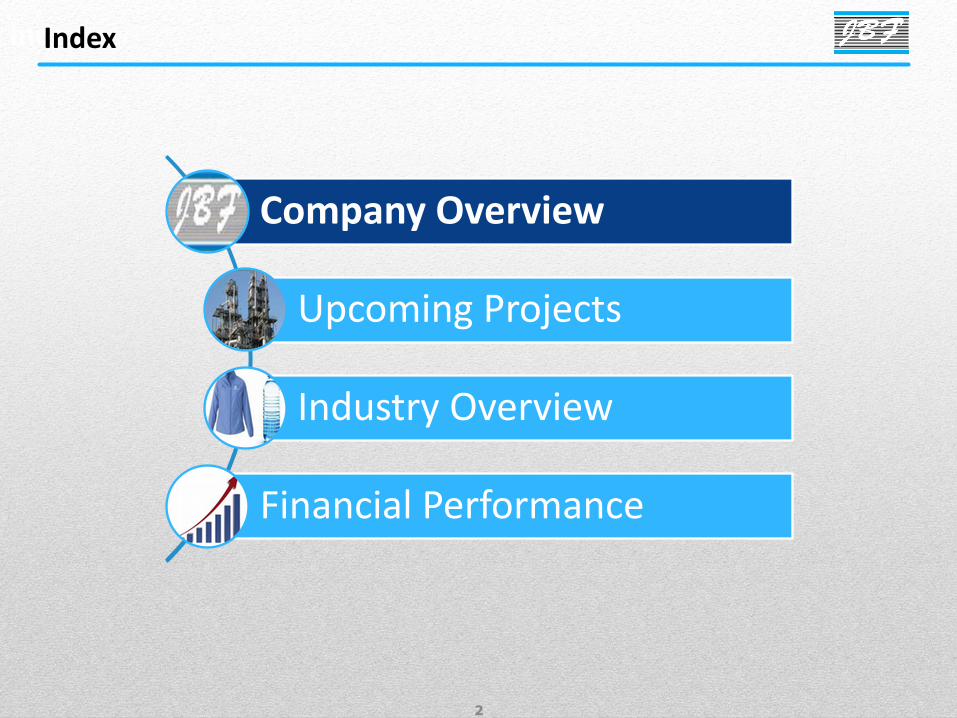
Overview
JBF Industries is a global company engaged in the production of the polyester value chain Current polymerisation capacity of 1.04 MMT p.a. and downstream capacity of 381 KMT p.a. Operates out of 3 domestic facilities, 1 in Gujarat and 2 in Silvassa, and 1 overseas facility in Ras Al-
Khaimah, UAE Promoted by Mr. Bhagirath C. Arya, a technocrat entrepreneur Listed on the BSE and NSE with a market cap of INR 5,334.4 mn (as on October,31 2013)
Products& Business Mix
Product Mix can be divided into three broad categories:- I. Polyethylene Terephthalate (PET) Chips:Textile Grade and Bottle Grade II. Polyester Yarn: Partially Oriented Yarn, Full Drawn Yarn etc. III. Biaxially-Oriented Polyethylene Terephthalate (BOPET) Films:Thin, Thick, Metallized FY 13 Sales Mix (By Value) :-Chips – 58%, Polyester Yarn – 29%, BOPET Films – 13%
Markets
Indian facilities cater to the Indian and exports markets: 2nd largest domestic supplier of textile grade chips with a capacity share of ~20% 3rd largest domestic supplier of bottle grade chips with a capacity share of ~20% 3rd largest domestic supplier of Polyester Yarn with a capacity share of ~15%
RAK facility (Bottle grade chips and Films) caters to European, MEAF and North American markets Market share of 70 % in the UAE and 45% in GCC region in the Bottle grade chips segment
Financial Performance
Highlights
Income has grown from INR 43,537 mn in FY 09 to 74,588mn in FY 13 – 5 year CAGR of 14.4% FY 13 Performance: Income – INR 74,588 mn, EBITDA – INR 6,903 mn, Net Profit – INR 1,135 mn JBF announced FY 13 Dividend of INR 1/share and completed buy back of 7,500,000 shares
Integrated Polyester
Player of Global scale
JBF is amongst the Top 10 producers of PET chips and of BOPET Films globally JBF is setting up a 1.25 MMT Purified Terephthalic Acid (PTA) plant at Mangalore SEZ thereby will
become an integrated petrochemical company. JBF is also setting up a 390 KT p.a. PET plant in Belgium and a 90KT p.a. BoPET Film plant in Bahrain.
Executive Summary
4
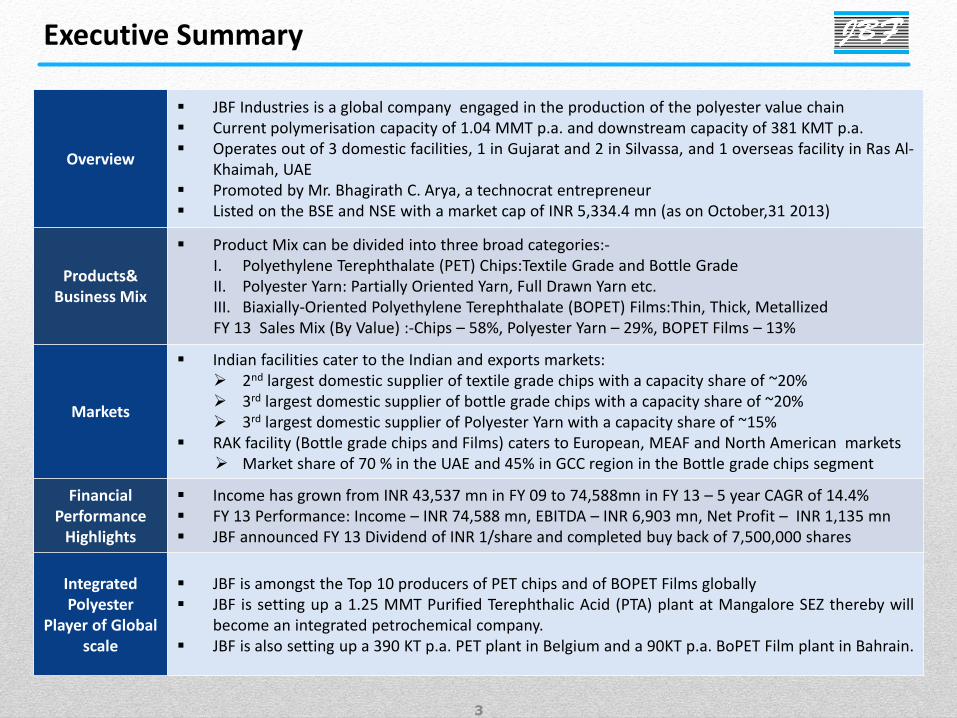
Established in 1982, JBF Industries was founded by Mr. Bhagirath Arya as a Yarn Texturising company, the company has
since backward integrated into the polyester value chain
Company is currently engaged in the production of products in the Polyester value chain such as: Polyethylene
Terephthalate (PET) chipswhich are of Bottle grade, Textile grade and Film grade; Polyester Yarn, such as Partially Oriented
Yarn (POY), Polyester Filament Yarn (PFY), Full Drawn Yarn (FDY) and Other Specialized Yarn; and PET Films, which are of
Thin grade, Thick grade and Metallised grade
It commenced its international operations in 2006 by foraying into the PET chips and PET Film business by setting up plant
at Ras-Al-Khaimah (RAK) UAE
JBF achieved ~USD 1.4bn revenues (> 45% overseas) and company recommended a Dividend of INR 1/share for FY13.
As on 27th September 2013, the company has bought back 75,00,000 shares and utilized Rs 73.2 cr for the Buy Back.
INR Mn FY 11 FY 12 FY13
Total Income 64,711 71,793 74,558
EBIDTA 9,563 7,127 6,903
EBIDTA Margin 14.8% 9.9% 9.3%
Net Profit 5,461 2,230 1,135
Net Profit Margin 8.44% 3.1% 1.5%
Diluted EPS (INR) 75.8 31.0 15.24
Company Overview
Financial Highlights Production Highlights (‘000 tons)
Company Background
0
200
400
600
800
1000
1200
FY11 FY12 FY13
823 802 760
219 226 249
75 66 77
Chips Yarns Films
5
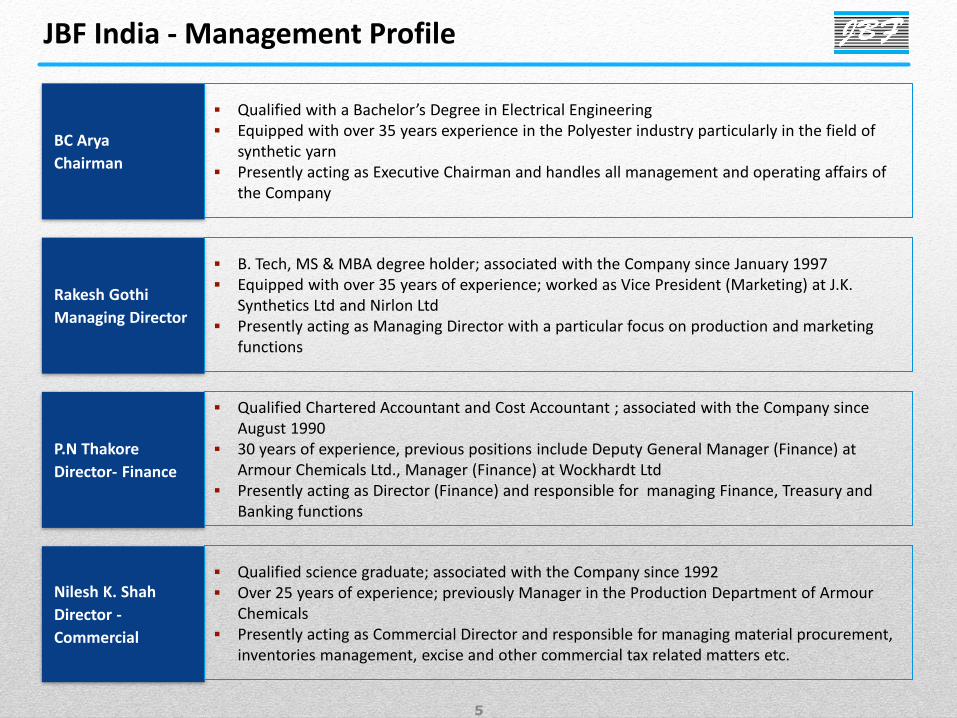
JBF India - Management Profile
BC Arya
Chairman
Qualified with a Bachelor’s Degree in Electrical Engineering Equipped with over 35 years experience in the Polyester industry particularly in the field of
synthetic yarn Presently acting as Executive Chairman and handles all management and operating affairs of
the Company
Rakesh Gothi
Managing Director
P.N Thakore
Director- Finance
Nilesh K. Shah
Director -
Commercial
B. Tech, MS & MBA degree holder; associated with the Company since January 1997 Equipped with over 35 years of experience; worked as Vice President (Marketing) at J.K.
Synthetics Ltd and Nirlon Ltd Presently acting as Managing Director with a particular focus on production and marketing
functions
Qualified Chartered Accountant and Cost Accountant ; associated with the Company since August 1990
30 years of experience, previous positions include Deputy General Manager (Finance) at Armour Chemicals Ltd., Manager (Finance) at Wockhardt Ltd
Presently acting as Director (Finance) and responsible for managing Finance, Treasury and Banking functions
Qualified science graduate; associated with the Company since 1992 Over 25 years of experience; previously Manager in the Production Department of Armour
Chemicals Presently acting as Commercial Director and responsible for managing material procurement,
inventories management, excise and other commercial tax related matters etc.
6
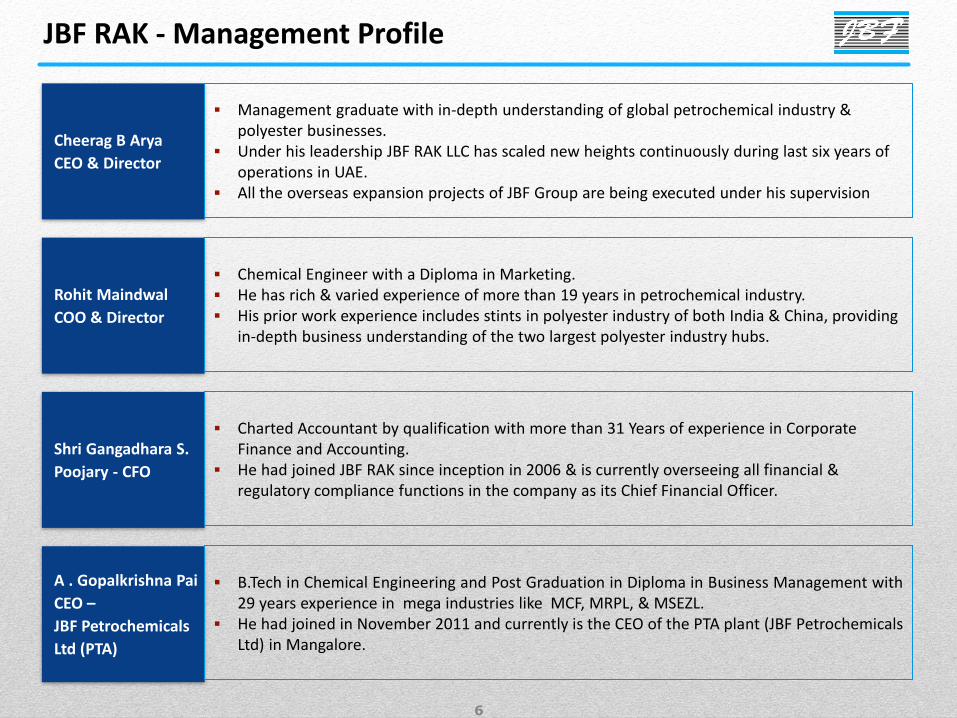
JBF RAK - Management Profile
Cheerag B Arya
CEO & Director
Management graduate with in-depth understanding of global petrochemical industry & polyester businesses.
Under his leadership JBF RAK LLC has scaled new heights continuously during last six years of operations in UAE.
All the overseas expansion projects of JBF Group are being executed under his supervision
Rohit Maindwal
COO & Director
Shri Gangadhara S.
Poojary - CFO
A . Gopalkrishna Pai
CEO –
JBF Petrochemicals
Ltd (PTA)
Chemical Engineer with a Diploma in Marketing. He has rich & varied experience of more than 19 years in petrochemical industry. His prior work experience includes stints in polyester industry of both India & China, providing
in-depth business understanding of the two largest polyester industry hubs.
Charted Accountant by qualification with more than 31 Years of experience in Corporate Finance and Accounting.
He had joined JBF RAK since inception in 2006 & is currently overseeing all financial & regulatory compliance functions in the company as its Chief Financial Officer.
B.Tech in Chemical Engineering and Post Graduation in Diploma in Business Management with
29 years experience in mega industries like MCF, MRPL, & MSEZL. He had joined in November 2011 and currently is the CEO of the PTA plant (JBF Petrochemicals
Ltd) in Mangalore.
7
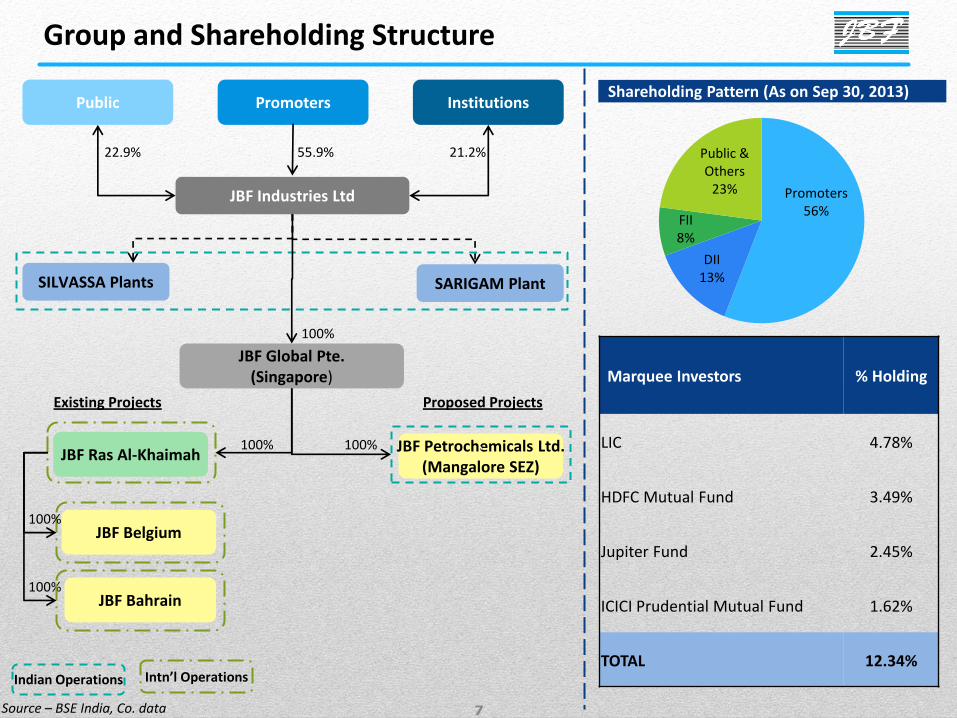
JBF Industries Ltd
Promoters
SILVASSA Plants SARIGAM Plant
JBF Global Pte. (Singapore)
JBF Ras Al-Khaimah
100%
55.9%
Group and Shareholding Structure
Public Institutions
22.9% 21.2%
Marquee Investors % Holding
LIC 4.78%
HDFC Mutual Fund 3.49%
Jupiter Fund 2.45%
ICICI Prudential Mutual Fund 1.62%
TOTAL 12.34%
`
Intn’l Operations Indian Operations
Source – BSE India, Co. data
Shareholding Pattern (As on Sep 30, 2013)
Promoters 56%
DII 13%
FII 8%
Public & Others
23%
JBF Petrochemicals Ltd. (Mangalore SEZ)
` 100%
Existing Projects Proposed Projects
JBF Belgium
100%
100%
100% JBF Bahrain
8
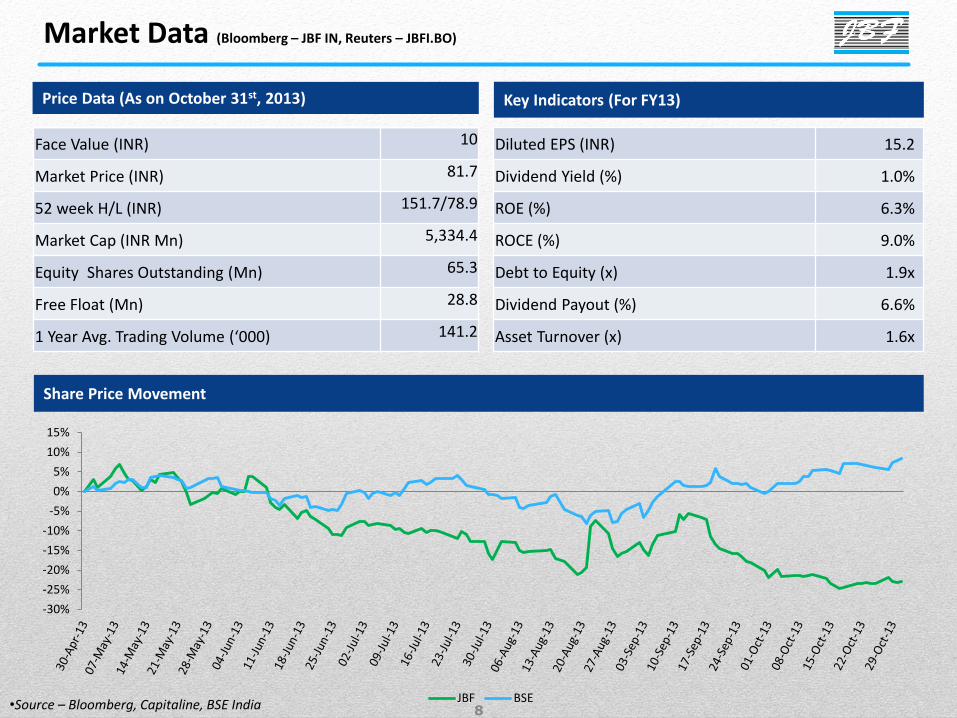
Market Data (Bloomberg – JBF IN, Reuters – JBFI.BO)
Price Data (As on October 31st, 2013)
Share Price Movement
Key Indicators (For FY13)
•Source – Bloomberg, Capitaline, BSE India
Face Value (INR) 10
Market Price (INR) 81.7
52 week H/L (INR) 151.7/78.9
Market Cap (INR Mn) 5,334.4
Equity Shares Outstanding (Mn) 65.3
Free Float (Mn) 28.8
1 Year Avg. Trading Volume (‘000) 141.2
Diluted EPS (INR) 15.2
Dividend Yield (%) 1.0%
ROE (%) 6.3%
ROCE (%) 9.0%
Debt to Equity (x) 1.9x
Dividend Payout (%) 6.6%
Asset Turnover (x) 1.6x
-30%
-25%
-20%
-15%
-10%
-5%
0%
5%
10%
15%
JBF BSE

9
1982-1994
• Incorporated in 1982, established itself as one of India’s Leading Polyester Texturisers
1995-1999
• Entered yarn manufacturing in 1996, capacity 18,000 MT/ Expanded to 36,000 in 1999
2000-2002
• Backward integration into chips production with 36,000 MT in Mar 01/ Expanded to 72,000 in Nov. 01
2003-2005
• Expansion: Chips – 108 KTA, Yarns – 144 KTA Setup Sarigam facility; 216 KTA textile grade chips
2006-2007
• Commissioned Ras Al Khaima UAE plant; Capacity: 216 KTA grade chips and BOPET Film capacity of 48 KTA
2008-2011
• Increased India Textile chips capacity to 460 KTA, RAK Bottle grade chips capacity to 390 KTA and BOPET Film capacity of 66 KTA at RAK
2012-2015
• Backward integration by setting up a PTA plant. And setting up greenfield capacities in Belgium for PET Chips, in Bahrain for BOPET Film.
Ability to grow continuously through backward integration and scale...
Key Milestones
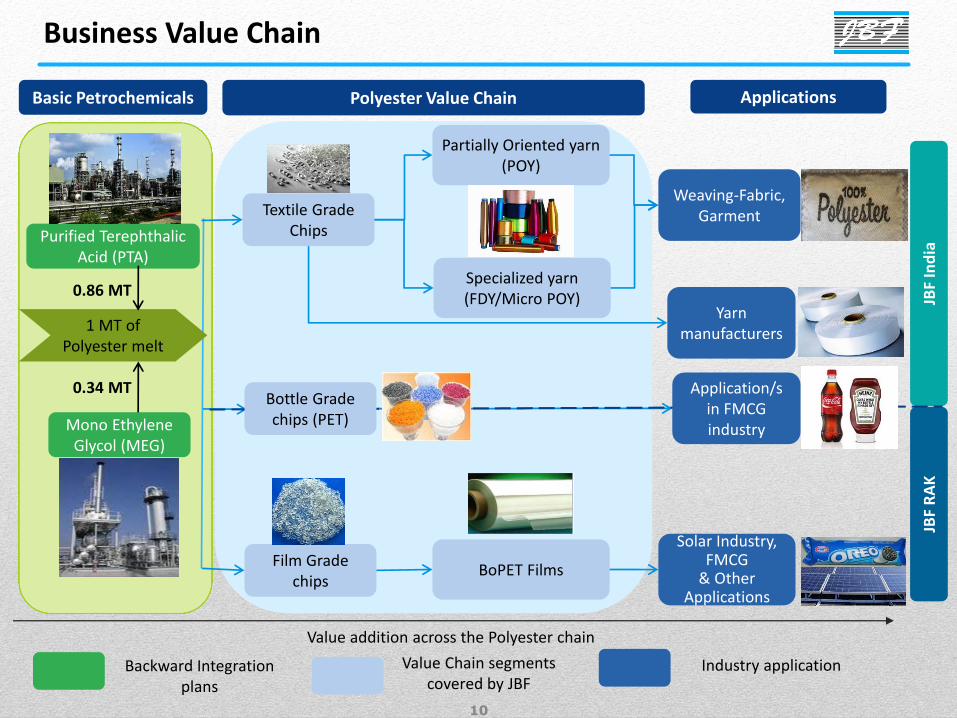
10
Purified Terephthalic Acid (PTA)
Mono Ethylene Glycol (MEG)
Textile Grade Chips
Partially Oriented yarn (POY)
Specialized yarn (FDY/Micro POY)
Film Grade chips
BoPET Films
Yarn manufacturers
Weaving-Fabric, Garment
JBF
Ind
ia
Value Chain segments covered by JBF
Value addition across the Polyester chain
Backward Integration plans
Industry application
Basic Petrochemicals Polyester Value Chain Applications
Solar Industry, FMCG
& Other Applications
1 MT of Polyester melt
0.86 MT
0.34 MT
JBF
RA
K
Business Value Chain
Bottle Grade chips (PET)
Application/s in FMCG industry
11
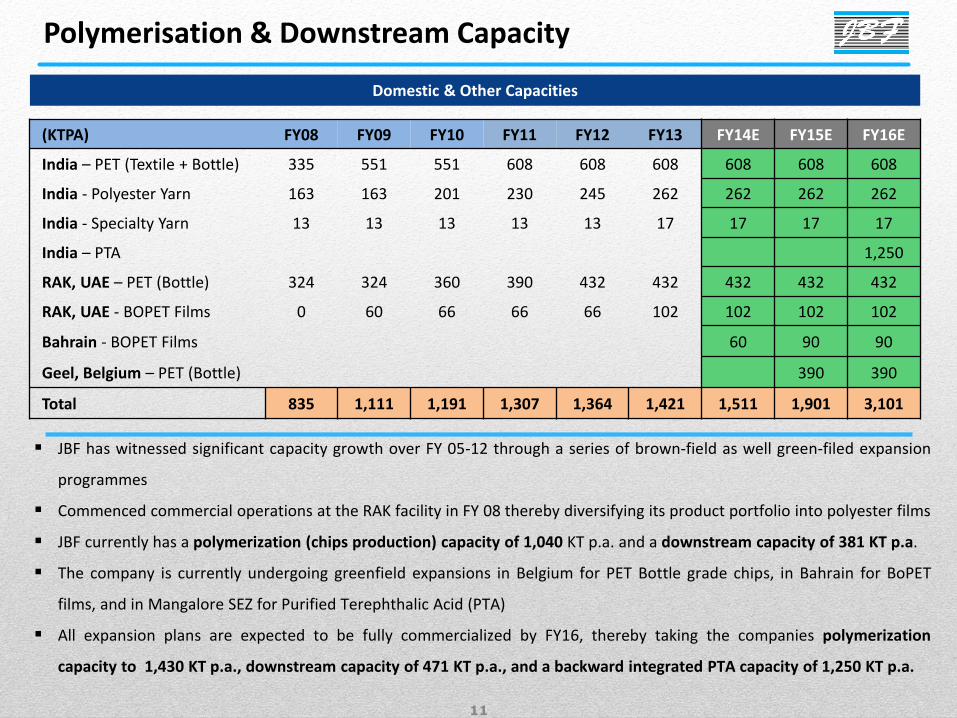
JBF has witnessed significant capacity growth over FY 05-12 through a series of brown-field as well green-filed expansion
programmes
Commenced commercial operations at the RAK facility in FY 08 thereby diversifying its product portfolio into polyester films
JBF currently has a polymerization (chips production) capacity of 1,040 KT p.a. and a downstream capacity of 381 KT p.a.
The company is currently undergoing greenfield expansions in Belgium for PET Bottle grade chips, in Bahrain for BoPET
films, and in Mangalore SEZ for Purified Terephthalic Acid (PTA)
All expansion plans are expected to be fully commercialized by FY16, thereby taking the companies polymerization
capacity to 1,430 KT p.a., downstream capacity of 471 KT p.a., and a backward integrated PTA capacity of 1,250 KT p.a.
Polymerisation & Downstream Capacity
Domestic & Other Capacities
(KTPA) FY08 FY09 FY10 FY11 FY12 FY13 FY14E FY15E FY16E
India – PET (Textile + Bottle) 335 551 551 608 608 608 608 608 608
India - Polyester Yarn 163 163 201 230 245 262 262 262 262
India - Specialty Yarn 13 13 13 13 13 17 17 17 17
India – PTA 1,250
RAK, UAE – PET (Bottle) 324 324 360 390 432 432 432 432 432
RAK, UAE - BOPET Films 0 60 66 66 66 102 102 102 102
Bahrain - BOPET Films 60 90 90
Geel, Belgium – PET (Bottle) 390 390
Total 835 1,111 1,191 1,307 1,364 1,421 1,511 1,901 3,101
12
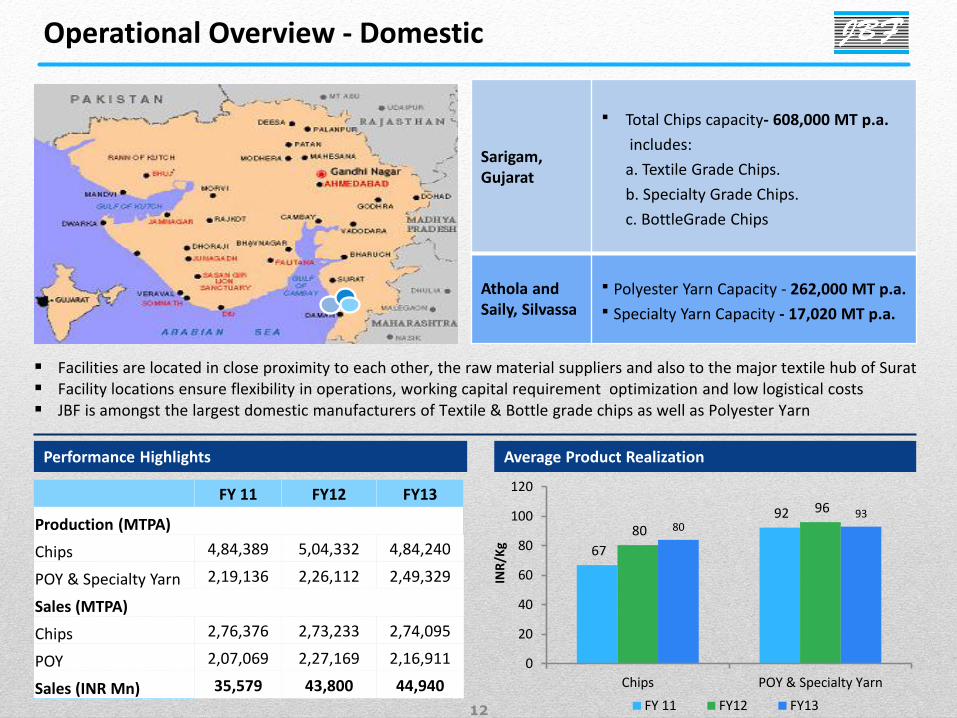
Operational Overview - Domestic
Sarigam, Gujarat
Total Chips capacity- 608,000 MT p.a.
includes:
a. Textile Grade Chips.
b. Specialty Grade Chips.
c. BottleGrade Chips
Athola and Saily, Silvassa
Polyester Yarn Capacity - 262,000 MT p.a.
Specialty Yarn Capacity - 17,020 MT p.a.
Facilities are located in close proximity to each other, the raw material suppliers and also to the major textile hub of Surat Facility locations ensure flexibility in operations, working capital requirement optimization and low logistical costs JBF is amongst the largest domestic manufacturers of Textile & Bottle grade chips as well as Polyester Yarn
FY 11 FY12 FY13
Production (MTPA)
Chips 4,84,389 5,04,332 4,84,240
POY & Specialty Yarn 2,19,136 2,26,112 2,49,329
Sales (MTPA)
Chips 2,76,376 2,73,233 2,74,095
POY 2,07,069 2,27,169 2,16,911
Sales (INR Mn) 35,579 43,800 44,940
INR
/Kg
Performance Highlights Average Product Realization
67
92 80
96 80
93
0
20
40
60
80
100
120
Chips POY & Specialty Yarn
FY 11 FY12 FY13

13
JBF Sarigam Plant Aerial View JBF Silvassa Plant
Partially Oriented Yarn Manufacturing Units POY Texturising Units
Domestic Facilities

14
Operational Overview – International
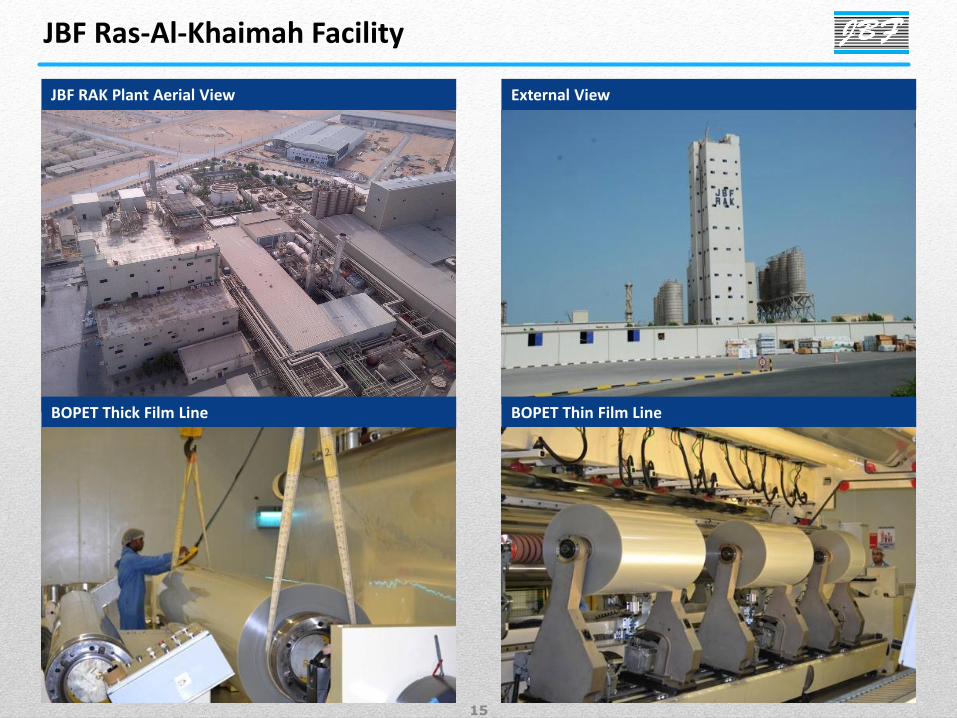
Ras Al-Khaimah, UAE
Bottle Grade Chips – 432,000 MT p.a.
BOPET Films – 102,000 MT p.a.
Strategic Advantage of production facility in RAK, UAE: Tax free and no export duty zone Easy availability of raw material Major Port, giving easy access for exporting to USA and
Europe Tap growth potential of the MEAF and GCC markets, which
are the fastest growing PET markets in the world with more than 10% growth YoY
First mover advantage in the Middle East region has helped secure preferred supplier contracts for bottle grade chips
Expansion into higher value added products like Thick films and Metallised films
Performance Highlights
FY 11 FY12 FY13
Production (MTPA)
Bottle Grade Chips 3,39,010 2,97,871 2,76,055
Films 75,462 68,112 77,435
Sales (MTPA)
Bottle Grade Chips 2,78,356 2,56,279 2,48,625
Films 76,374 65,769 77,010
Sales (INR Mn) 29,076 27,875 29,837
66
150
79
124
79
124
0
20
40
60
80
100
120
140
160
Bottle Grade Chips Films
FY 11 FY12 FY13
INR
/Kg
Average Product Realization
15
JBF RAK Plant Aerial View External View
BOPET Thick Film Line BOPET Thin Film Line
JBF Ras-Al-Khaimah Facility

16
Chips, 154,700
POY, 81,679
Revenue Mix
Well Diversified Business Model….
Total Chips - India 31%
POY^ 30%
PET Chips RAK 27%
Films 13%
Textile grade Chips 66%
POY 34%
FY 07 FY 13
India 54%
ME/Africa 30%
Americas 3% Europe
13%
…..Ensures acceleration into higher value added products
Product Delta ~
Chips – India (INR/Kg) 6-12
POY (INR/Kg) 13-30
Chips – RAK (USD/MT) 133-300
PET Film (USD/MT) 556-2,223
~Delta is calculated as Revenue (Less) Raw Material
FY 13
^ Includes Speciality Yarn
Product Mix (By Value)
Sales Mix (By Geography) **
India 100%
FY 07
Product Deltas – FY13
Product Mix* (By Volume)
*India and RAK Sales
FY 07 FY 13
Chips - India, 2,74,095
Chips - RAK, 2,48,625
POY, 2,16,911
PET Film, 77,010
** Company Estimates

17
Textile Grade Chips
Bottle Grade Chips
Film
Yarn
Clientele Mix
18
Company Overview
Upcoming Projects
Industry Overview
Financial Performance
Index
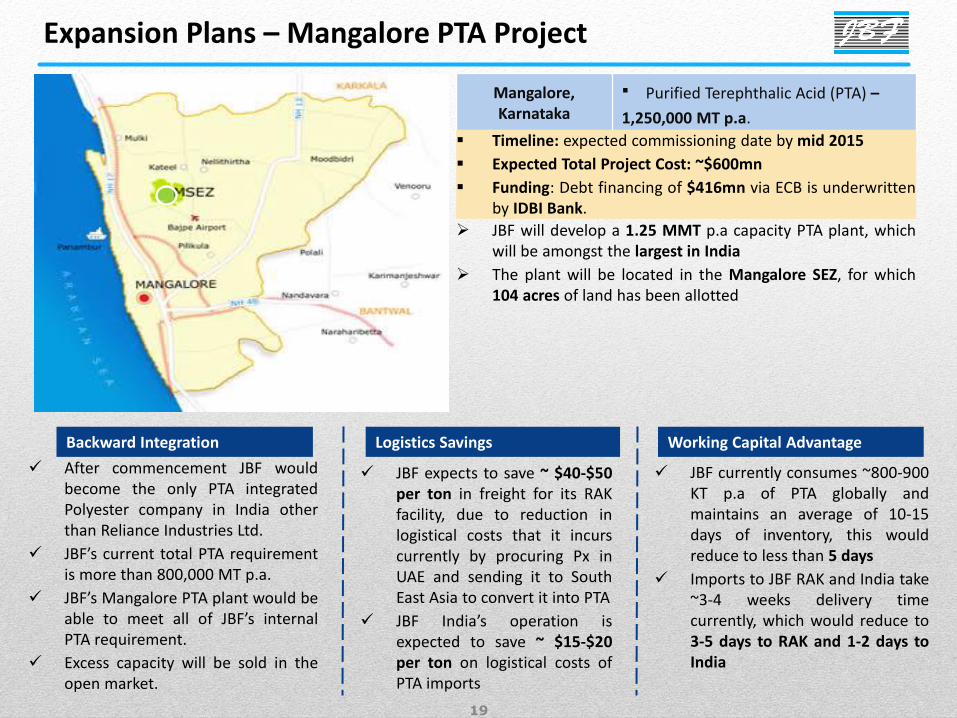
19
Mangalore, Karnataka
Purified Terephthalic Acid (PTA) –
1,250,000 MT p.a.
JBF will develop a 1.25 MMT p.a capacity PTA plant, which will be amongst the largest in India
The plant will be located in the Mangalore SEZ, for which 104 acres of land has been allotted
JBF currently consumes ~800-900 KT p.a of PTA globally and maintains an average of 10-15 days of inventory, this would reduce to less than 5 days
Imports to JBF RAK and India take ~3-4 weeks delivery time currently, which would reduce to 3-5 days to RAK and 1-2 days to India
JBF expects to save ~ $40-$50 per ton in freight for its RAK facility, due to reduction in logistical costs that it incurs currently by procuring Px in UAE and sending it to South East Asia to convert it into PTA
JBF India’s operation is expected to save ~ $15-$20 per ton on logistical costs of PTA imports
Working Capital Advantage Logistics Savings
Timeline: expected commissioning date by mid 2015
Expected Total Project Cost: ~$600mn
Funding: Debt financing of $416mn via ECB is underwritten by IDBI Bank.
Expansion Plans – Mangalore PTA Project
Backward Integration
After commencement JBF would become the only PTA integrated Polyester company in India other than Reliance Industries Ltd.
JBF’s current total PTA requirement is more than 800,000 MT p.a.
JBF’s Mangalore PTA plant would be able to meet all of JBF’s internal PTA requirement.
Excess capacity will be sold in the open market.

20
Project Update: All necessary permits, clearances have been received to
begin plant construction. Leveling of Land, Boundary Wall construction,
peripharal drain, road development all have ben completed.
The site has been handed over to the EPC contractor Technip and the Technology provider British Petroleum.
Construction and Engineering work has begun.
Raw Material Sourcing: The company will source Paraxylene (Px) from the
OMPL Aromatics Refinery that is expected to be commissioned soon, and is only 1km away within the same SEZ
JBF also has the ability to import Px as the plant is 7Km from the Mangalore Port.
Technology:
British Petroleum’s First Third Party, Non-Affiliate, Licensing of latest generation PTA technology
Originally developed in the 1950’s, improved through successful iterations
Significantly lower capital and operating costs compared to conventional PTA plants
Relies on proprietary technology to deliver 75% lower water discharge, 65% lower GHG emissions, and 95% lower solid waste generation than conventional PTA plants
Expansion Plans – Mangalore PTA Project
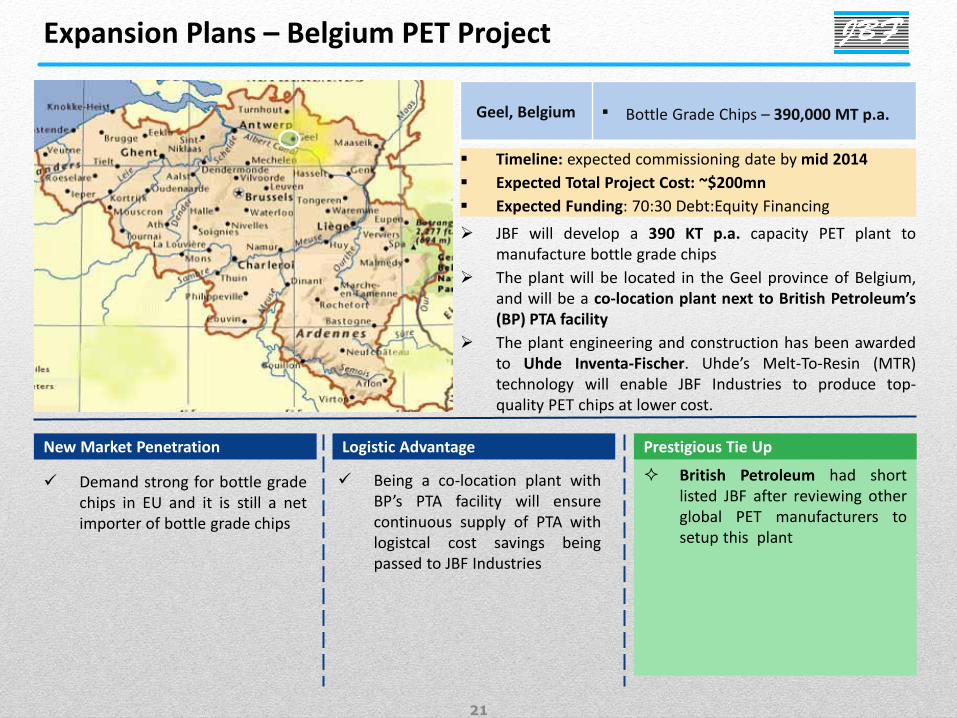
21
Geel, Belgium Bottle Grade Chips – 390,000 MT p.a.
JBF will develop a 390 KT p.a. capacity PET plant to manufacture bottle grade chips
The plant will be located in the Geel province of Belgium, and will be a co-location plant next to British Petroleum’s (BP) PTA facility
The plant engineering and construction has been awarded to Uhde Inventa-Fischer. Uhde’s Melt-To-Resin (MTR) technology will enable JBF Industries to produce top-quality PET chips at lower cost.
Demand strong for bottle grade chips in EU and it is still a net importer of bottle grade chips
Being a co-location plant with BP’s PTA facility will ensure continuous supply of PTA with logistcal cost savings being passed to JBF Industries
British Petroleum had short listed JBF after reviewing other global PET manufacturers to setup this plant
New Market Penetration Logistic Advantage Prestigious Tie Up
Timeline: expected commissioning date by mid 2014
Expected Total Project Cost: ~$200mn
Expected Funding: 70:30 Debt:Equity Financing
Expansion Plans – Belgium PET Project
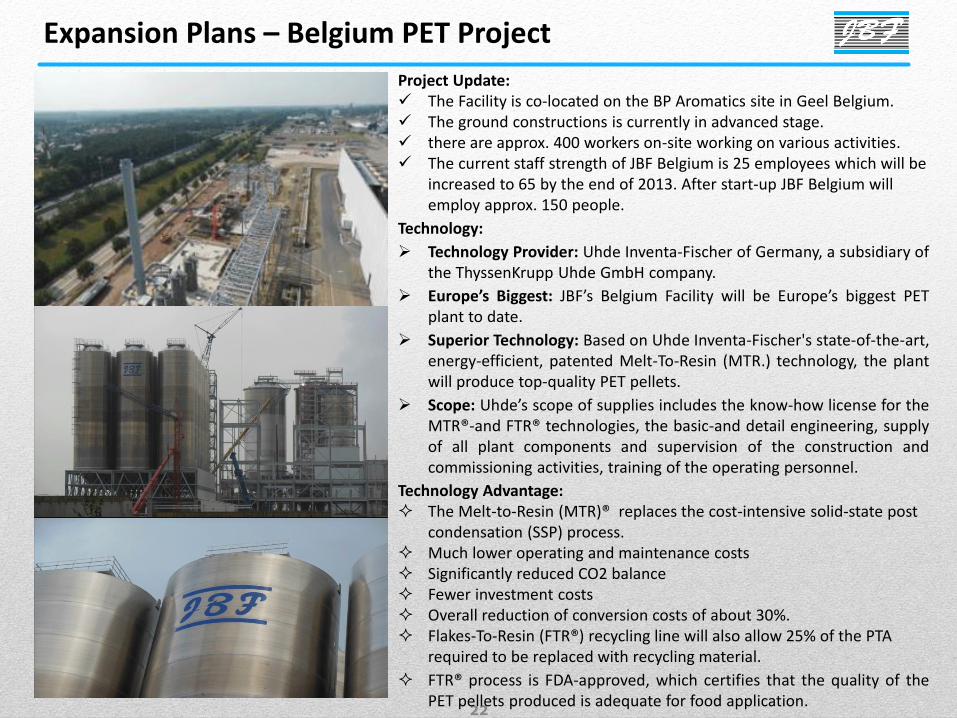
22
Project Update: The Facility is co-located on the BP Aromatics site in Geel Belgium. The ground constructions is currently in advanced stage. there are approx. 400 workers on-site working on various activities. The current staff strength of JBF Belgium is 25 employees which will be
increased to 65 by the end of 2013. After start-up JBF Belgium will employ approx. 150 people.
Technology:
Technology Provider: Uhde Inventa-Fischer of Germany, a subsidiary of the ThyssenKrupp Uhde GmbH company.
Europe’s Biggest: JBF’s Belgium Facility will be Europe’s biggest PET plant to date.
Superior Technology: Based on Uhde Inventa-Fischer's state-of-the-art, energy-efficient, patented Melt-To-Resin (MTR.) technology, the plant will produce top-quality PET pellets.
Scope: Uhde’s scope of supplies includes the know-how license for the MTR®-and FTR® technologies, the basic-and detail engineering, supply of all plant components and supervision of the construction and commissioning activities, training of the operating personnel.
Technology Advantage: The Melt-to-Resin (MTR)® replaces the cost-intensive solid-state post
condensation (SSP) process. Much lower operating and maintenance costs Significantly reduced CO2 balance Fewer investment costs Overall reduction of conversion costs of about 30%. Flakes-To-Resin (FTR®) recycling line will also allow 25% of the PTA
required to be replaced with recycling material.
FTR® process is FDA-approved, which certifies that the quality of the PET pellets produced is adequate for food application.
Expansion Plans – Belgium PET Project
23
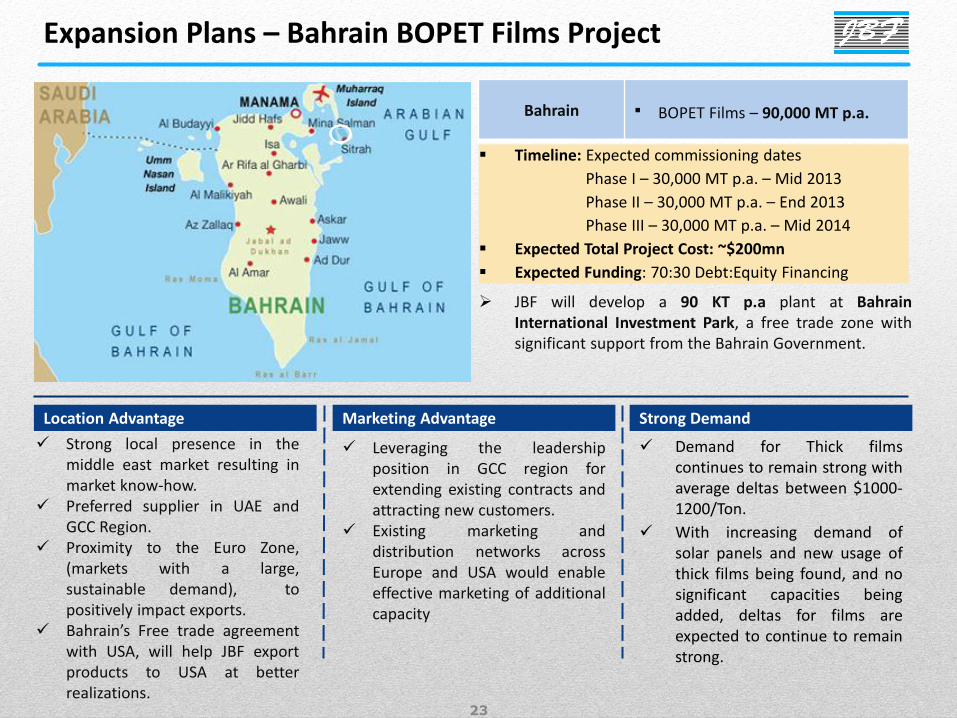
Bahrain BOPET Films – 90,000 MT p.a.
JBF will develop a 90 KT p.a plant at Bahrain International Investment Park, a free trade zone with significant support from the Bahrain Government.
Strong local presence in the middle east market resulting in market know-how.
Preferred supplier in UAE and GCC Region.
Proximity to the Euro Zone, (markets with a large, sustainable demand), to positively impact exports.
Bahrain’s Free trade agreement with USA, will help JBF export products to USA at better realizations.
Leveraging the leadership position in GCC region for extending existing contracts and attracting new customers.
Existing marketing and distribution networks across Europe and USA would enable effective marketing of additional capacity
Demand for Thick films continues to remain strong with average deltas between $1000-1200/Ton.
With increasing demand of solar panels and new usage of thick films being found, and no significant capacities being added, deltas for films are expected to continue to remain strong.
Location Advantage Marketing Advantage Strong Demand
Timeline: Expected commissioning dates
Phase I – 30,000 MT p.a. – Mid 2013
Phase II – 30,000 MT p.a. – End 2013
Phase III – 30,000 MT p.a. – Mid 2014
Expected Total Project Cost: ~$200mn
Expected Funding: 70:30 Debt:Equity Financing
Expansion Plans – Bahrain BOPET Films Project

24
Expansion Plans – Bahrain BOPET Films Project
Project Update: JBF Bahrain is located in the Kingdom of Bahrain’s free trade
International Investment Park. With support from the Bahraini Government, the acquired land of 65,000 square meters by JBF Group at the Salman Industrial City enjoys geographic and economic advantages to cater to the North & South American and Middle East PET markets.
This plant will commence operations in three phases: Phase I – COMPLETED: The first phase of production has
commenced with manufacturing of thin BOPET films and is the only one of its kind in the world producing thickness ranging from 8 Micron to 125 Micron.
Phase II: Second phase scheduled to commence in first quarter of 2014, will produce thin BOPET films ranging from 36 Micron to 250 Micron. This state of the art structure will be capable of delivering deckle width of 6.0 meters.
Phase III: The stage of completion will be marked by the commencement of the third phase of JBF Bahrain’s Line in mid 2014. In a specially built clean room facility will be producing thickness ranging from 8 Micron to 125 Micron
Technology: Technology Provider: The Bahrain factory will be equipped with
the state of the art BOPET film machinery from Dornier of Germany.
Superior Technology: This new factory is equipped with latest and robust production technology, comprising two lines at 8.7 meters wide and one line at 6.0 meters wide machine which will offer films with maximum width of 3300 mm.

25
Company Overview
Upcoming Projects
Industry Overview
Financial Performance
Index
26
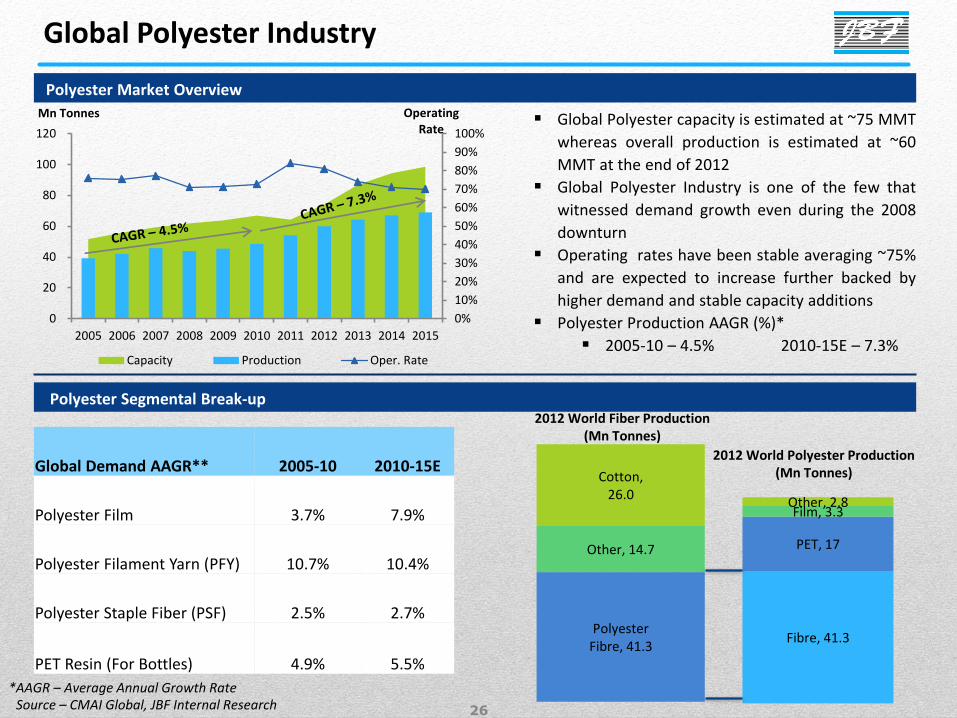
Global Polyester capacity is estimated at ~75 MMT
whereas overall production is estimated at ~60
MMT at the end of 2012
Global Polyester Industry is one of the few that
witnessed demand growth even during the 2008
downturn
Operating rates have been stable averaging ~75%
and are expected to increase further backed by
higher demand and stable capacity additions
Polyester Production AAGR (%)*
2005-10 – 4.5% 2010-15E – 7.3%
0%
10%
20%
30%
40%
50%
60%
70%
80%
90%
100%
0
20
40
60
80
100
120
2005 2006 2007 2008 2009 2010 2011 2012 2013 2014 2015
Operating Rate
Mn Tonnes
Capacity Production Oper. Rate
Source – CMAI Global, JBF Internal Research *AAGR – Average Annual Growth Rate
Polyester Market Overview
Polyester Segmental Break-up 2012 World Fiber Production
(Mn Tonnes)
2012 World Polyester Production (Mn Tonnes) Global Demand AAGR** 2005-10 2010-15E
Polyester Film 3.7% 7.9%
Polyester Filament Yarn (PFY) 10.7% 10.4%
Polyester Staple Fiber (PSF) 2.5% 2.7%
PET Resin (For Bottles) 4.9% 5.5%
Global Polyester Industry
Fibre, 41.3
PET, 17
Film, 3.3 Other, 2.8
Polyester Fibre, 41.3
Other, 14.7
Cotton, 26.0
27
0%
10%
20%
30%
40%
50%
60%
70%
80%
90%
100%
0
1
2
3
4
5
6
7
8
9
10
2005 2006 2007 2008 2009 2010 2011 2012 2013 2014 2015
Operating Rate
Mn Tonnes
Capacity Production Oper. Rate
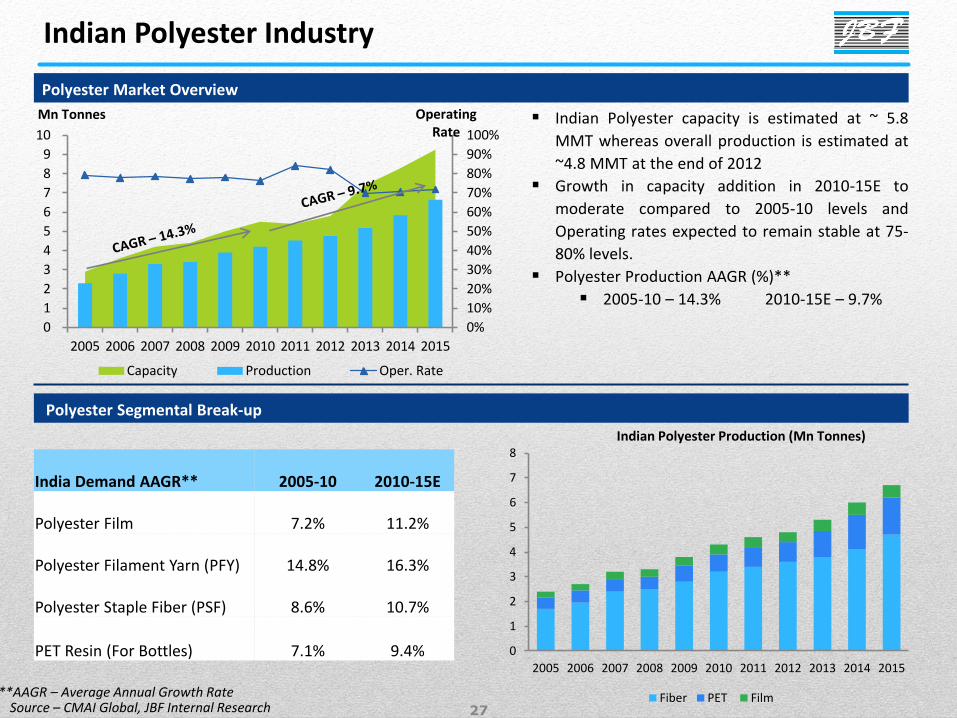
Indian Polyester capacity is estimated at ~ 5.8
MMT whereas overall production is estimated at
~4.8 MMT at the end of 2012
Growth in capacity addition in 2010-15E to
moderate compared to 2005-10 levels and
Operating rates expected to remain stable at 75-
80% levels.
Polyester Production AAGR (%)**
2005-10 – 14.3% 2010-15E – 9.7%
Source – CMAI Global, JBF Internal Research
Polyester Market Overview
Polyester Segmental Break-up
India Demand AAGR** 2005-10 2010-15E
Polyester Film 7.2% 11.2%
Polyester Filament Yarn (PFY) 14.8% 16.3%
Polyester Staple Fiber (PSF) 8.6% 10.7%
PET Resin (For Bottles) 7.1% 9.4%
Indian Polyester Production (Mn Tonnes)
**AAGR – Average Annual Growth Rate
0
1
2
3
4
5
6
7
8
2005 2006 2007 2008 2009 2010 2011 2012 2013 2014 2015
Fiber PET Film
Indian Polyester Industry

28
0%
10%
20%
30%
40%
50%
60%
70%
80%
90%
100%
0
10
20
30
40
50
60
70
2005 2006 2007 2008 2009 2010 2011 2012 2013 2014
Operating Rate
Million Tons
Total Capacity World PTA Demand
Annual global capacity for PTA is estimated to be ~57
MMT at the end of 2012; whereas the global demand
is estimated at ~46 MMT.
Domestic Capacity of PTA is at ~3.5 MMT, while
demand is at ~4.5 MMT
Global Suppliers - Samsung Petrochemicals, Total
Petrochemicals, BP Aromatics, Acetyls
Domestic Suppliers – Reliance Industries, Mitsubishi
Chemical, Indian Oil Corporation
Operating rates expected to moderate due to
relatively higher growth in capacity additions
Demand to remain firm and is expected to grow at a
CAGR of 6.4% from 2010-14
Annual global capacity for Monoethylene Glycol (MEG)
is estimated to be ~25 MMT at the end of 2012;
whereas the global demand is estimated at ~23 MMT
Domestic Capacity of MEG is expected at ~1.2 MMT,
while demand is at ~1.7 MMT
Major Suppliers
Global - SABIC, Sinopec Group, Formosa
Petrochemical, Shell, ME Global
Domestic – Reliance Industries, Indian Oil Corp
2012-13 period witnessed over capacity in MEG
globally
Purified Terephthalic Acid Supply-Demand
Monoethylene Glycol Supply-Demand
Source – CMAI Global, JBF Internal Research
Raw Material Scenario
65
70
75
80
85
90
95
0
5
10
15
20
25
30
35
2005 2006 2007 2008 2009 2010 2011 2012 2013 2014
Operating Rate
Million Tons
Total Capacity MEG Demand Operating Rate
29
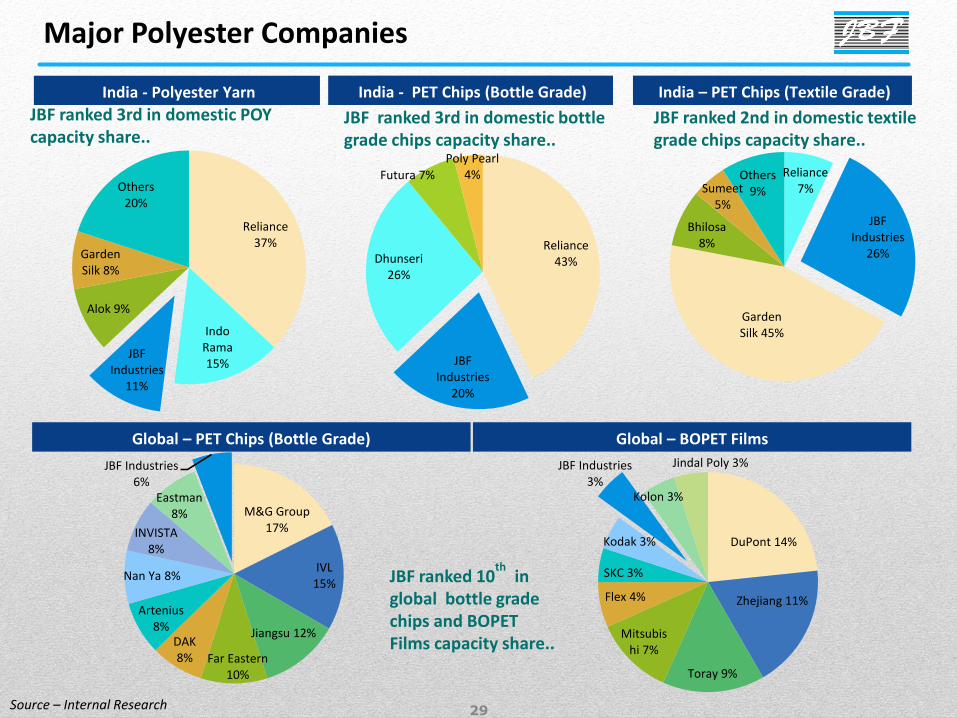
Reliance 37%
Indo Rama 15%
JBF Industries
11%
Alok 9%
Garden Silk 8%
Others 20%
Reliance 43%
JBF Industries
20%
Dhunseri 26%
Futura 7%
Poly Pearl 4% Reliance
7%
JBF Industries
26%
Garden Silk 45%
Bhilosa 8%
Sumeet 5%
Others 9%
JBF ranked 3rd in domestic POY capacity share..
JBF ranked 3rd in domestic bottle grade chips capacity share..
JBF ranked 2nd in domestic textile grade chips capacity share..
JBF ranked 10th
in global bottle grade chips and BOPET Films capacity share..
India - Polyester Yarn India - PET Chips (Bottle Grade) India – PET Chips (Textile Grade)
Global – BOPET Films Global – PET Chips (Bottle Grade)
M&G Group 17%
IVL 15%
Jiangsu 12%
Far Eastern 10%
DAK 8%
Artenius 8%
Nan Ya 8%
INVISTA 8%
Eastman 8%
JBF Industries 6%
DuPont 14%
Zhejiang 11%
Toray 9%
Mitsubishi 7%
Flex 4%
SKC 3%
Kodak 3%
JBF Industries 3%
Kolon 3%
Jindal Poly 3%
Major Polyester Companies
Source – Internal Research
30
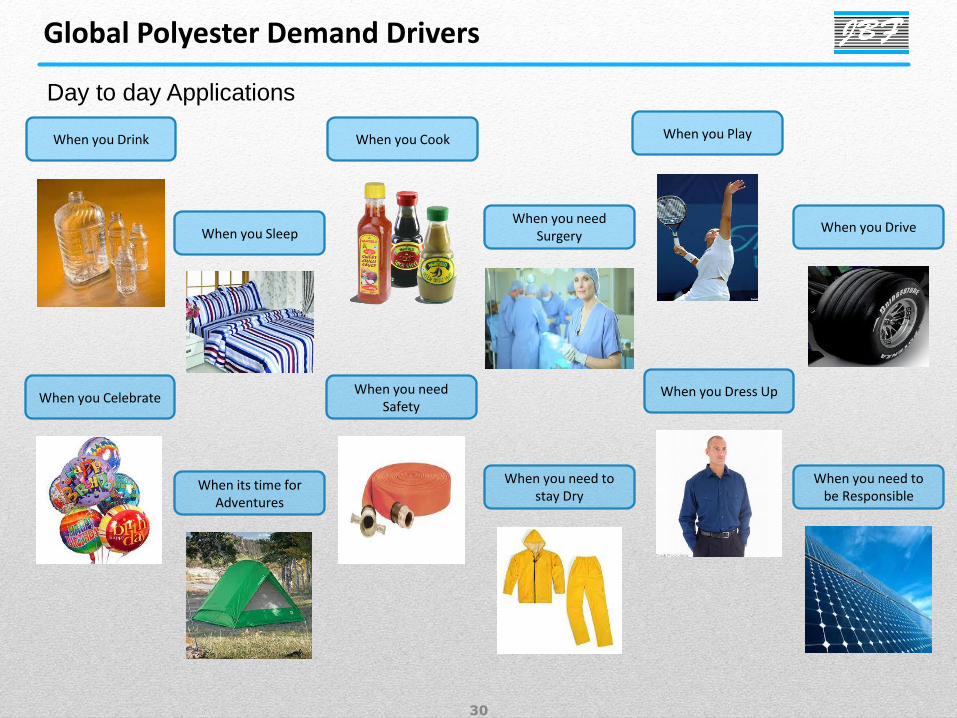
Day to day Applications
When you Drink When you Cook When you Play
When you Sleep When you need
Surgery When you Drive
When you Celebrate When you need
Safety When you Dress Up
When its time for Adventures
When you need to stay Dry
When you need to be Responsible
Global Polyester Demand Drivers
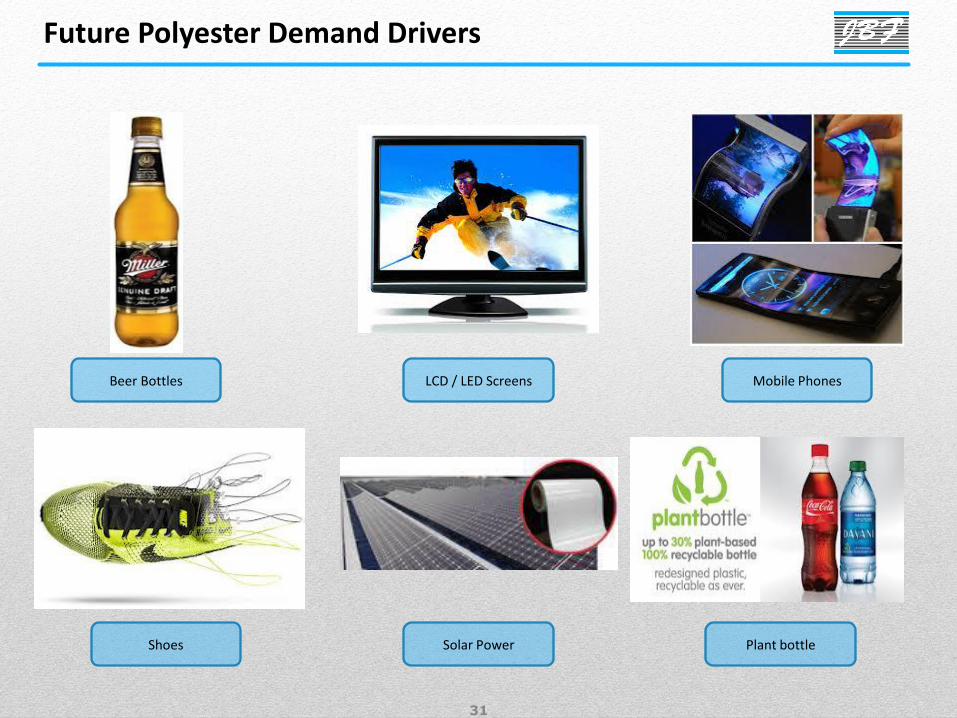
31
Beer Bottles
Plant bottle
LCD / LED Screens Mobile Phones
Shoes Solar Power
Future Polyester Demand Drivers
32
Company Overview
Upcoming Projects
Industry Overview
Financial Performance
Index

33
49,444
64,711 71,793 74,558
0
10,000
20,000
30,000
40,000
50,000
60,000
70,000
80,000
FY 10 FY 11 FY 12 FY13
4,704
9,563
7,127 6,903
0
2,000
4,000
6,000
8,000
10,000
FY 10 FY 11 FY 12 FY13
1,904
5,461
2,229
1,135
0
1,500
3,000
4,500
6,000
FY 10 FY 11 FY 12 FY13
Total Income EBITDA PAT
All Figures in INR Million
FY 10-13 CAGR : 13.6% FY 10-13 CAGR : 14.7%
Margin Analysis (%) Efficiency Ratios (%)
23.7%
46.9%
13.8%
6.3%
7.7%
18.7%
12.5%
9.0%
0.0%
5.0%
10.0%
15.0%
20.0%
25.0%
30.0%
0.0%
5.0%
10.0%
15.0%
20.0%
25.0%
30.0%
35.0%
40.0%
45.0%
50.0%
FY10 FY11 FY12 FY13
ROE (LHS) ROCE (RHS)
FY 10-13 CAGR : -15.8%
9.5%
14.8%
9.9%
9.3%
3.9%
8.4%
3.1%
1.5%
0.0%
2.0%
4.0%
6.0%
8.0%
10.0%
12.0%
14.0%
16.0%
FY10 FY11 FY12 FY13
EBITDA PAT
Financial Summary
34
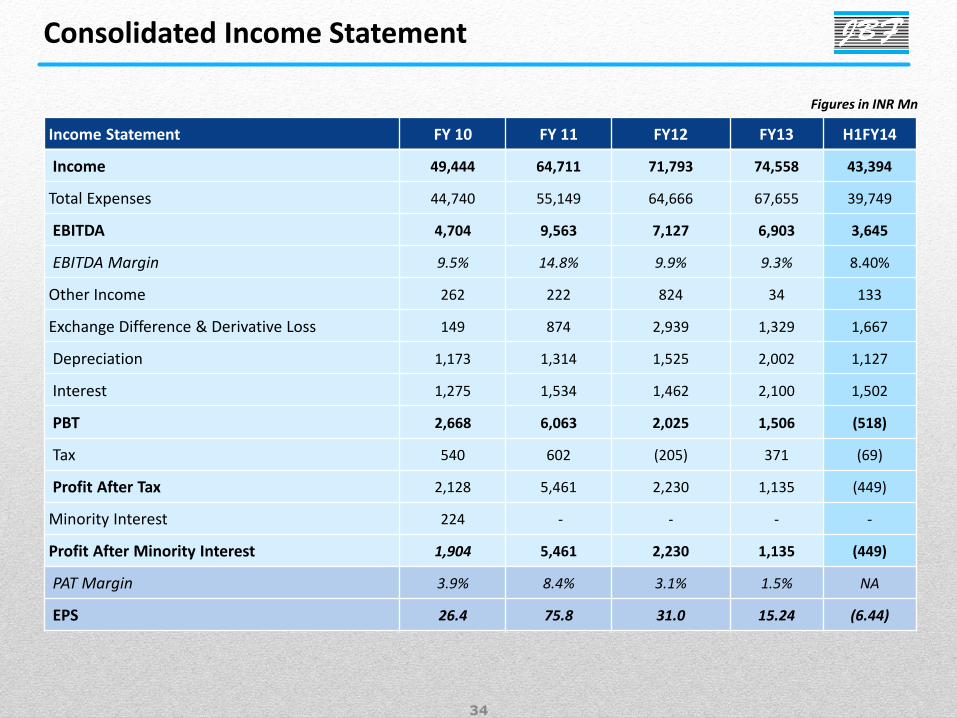
Figures in INR Mn
Income Statement FY 10 FY 11 FY12 FY13 H1FY14
Income 49,444 64,711 71,793 74,558 43,394
Total Expenses 44,740 55,149 64,666 67,655 39,749
EBITDA 4,704 9,563 7,127 6,903 3,645
EBITDA Margin 9.5% 14.8% 9.9% 9.3% 8.40%
Other Income 262 222 824 34 133
Exchange Difference & Derivative Loss 149 874 2,939 1,329 1,667
Depreciation 1,173 1,314 1,525 2,002 1,127
Interest 1,275 1,534 1,462 2,100 1,502
PBT 2,668 6,063 2,025 1,506 (518)
Tax 540 602 (205) 371 (69)
Profit After Tax 2,128 5,461 2,230 1,135 (449)
Minority Interest 224 - - - -
Profit After Minority Interest 1,904 5,461 2,230 1,135 (449)
PAT Margin 3.9% 8.4% 3.1% 1.5% NA
EPS 26.4 75.8 31.0 15.24 (6.44)
Consolidated Income Statement

35
Particulars H1FY14 FY 13 FY12
A EQUITIES & LIABILITIES
Part -1 Shareholder Funds
(A) Equity Share Capital 1,793 1,830 1,604
(B) Reserves & Surplus 17,165 16,873 15,340
Total - Shareholder Funds 18,958 18,703 16,944
Part 2 Non Current Liabilities (A) Long Term Borrowings 39,188 23,173 13,768
(B) Deferred Tax Liabilities (Net) 1,508 1,581 1,223
(C) Long Term provisions 464 271 114
Total - Non – Current Liabilities 41,160 25,026 15,105
Part 3 Current Liabilities (A) Short term Borrowings 15,906 13,216 11,451
(B) Trade Payables 13,528 11,230 8,322
(C) Other Current Liabilities 7,919 7,940 4,640
(D) Short-term provisions 836 538 910
Total – Current Liabilities 38,189 32,924 25,323
A GRAND TOTAL - EQUITIES & LIABILITES
98,307 76,653 57,372
Particulars H1FY14 FY 13 FY12
B ASSETS
Part -1 Non Current Assets
(A) Fixed Assets 52,668 38,830 29,333
(B) Goodwill on Consolidation 1,098 951 891
(C) Non-Current Investments 28 30 37
(D) Long Term Loans & Advances 7,886 4,704 2,913
(E) Other Non-Current Assets 6
Total - Non – Current Assets 61,686 44,515 33,174
Part 2 Current Assets
(A) Current Investments 380 486 629
(B) Inventories 12,158 9,231 7,918
(C) Trade Receivables 11,510 10,348 7,149
(D) Cash and Bank Balances 5,672 5,968 3,987
(E) Short-term loans and advances
6,666 5,841 4,399
(F) Other current assets 235 264 116
Total – Current Assets 36,621 32,138 24,198
B GRAND TOTAL – ASSETS 98,307 76,653 57,372
Figures in INR Mn Figures in INR Mn
Consolidate Balance Sheet
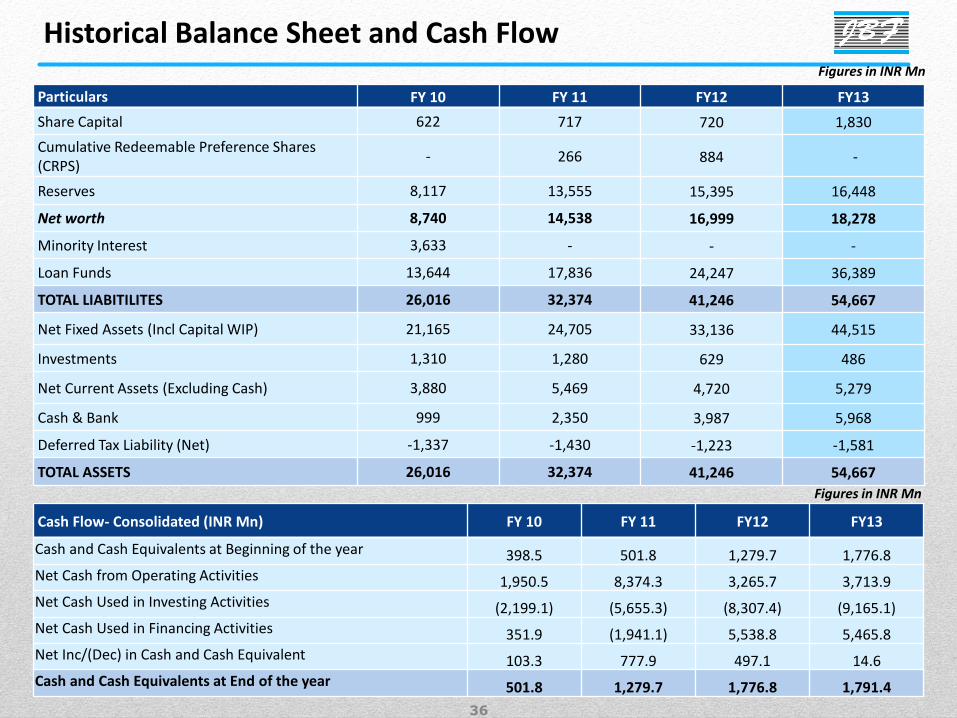
36
Cash Flow- Consolidated (INR Mn) FY 10 FY 11 FY12 FY13
Cash and Cash Equivalents at Beginning of the year 398.5 501.8 1,279.7 1,776.8
Net Cash from Operating Activities 1,950.5 8,374.3 3,265.7 3,713.9
Net Cash Used in Investing Activities (2,199.1) (5,655.3) (8,307.4) (9,165.1)
Net Cash Used in Financing Activities 351.9 (1,941.1) 5,538.8 5,465.8
Net Inc/(Dec) in Cash and Cash Equivalent 103.3 777.9 497.1 14.6
Cash and Cash Equivalents at End of the year 501.8 1,279.7 1,776.8 1,791.4
Figures in INR Mn
Figures in INR Mn
Particulars FY 10 FY 11 FY12 FY13
Share Capital 622 717 720 1,830
Cumulative Redeemable Preference Shares (CRPS)
- 266 884 -
Reserves 8,117 13,555 15,395 16,448
Net worth 8,740 14,538 16,999 18,278
Minority Interest 3,633 - - -
Loan Funds 13,644 17,836 24,247 36,389
TOTAL LIABITILITES 26,016 32,374 41,246 54,667
Net Fixed Assets (Incl Capital WIP) 21,165 24,705 33,136 44,515
Investments 1,310 1,280 629 486
Net Current Assets (Excluding Cash) 3,880 5,469 4,720 5,279
Cash & Bank 999 2,350 3,987 5,968
Deferred Tax Liability (Net) -1,337 -1,430 -1,223 -1,581
TOTAL ASSETS 26,016 32,374 41,246 54,667
Historical Balance Sheet and Cash Flow

37
Thank You
For further details please feel free to contact our Investor Relations Representatives:
JBF Industries Disclaimer: No representation or warranty, express or implied, is made as to, and no reliance should be placed on, the fairness, accuracy, completeness or correctness of the information or opinions contained in this presentation. Such information and opinions are in all events not current after the date of this presentation. Certain statements made in this presentation may not be based on historical information or facts and may be "forward looking statements" based on the currently held beliefs and assumptions of the management of JBF Industries (“Company” or “JBF”), which are expressed in good faith and in their opinion reasonable, including those relating to the Company’s general business plans and strategy, its future financial condition and growth prospects and future developments in its industry and its competitive and regulatory environment. Forward-looking statements involve known and unknown risks, uncertainties and other factors, which may cause the actual results, financial condition, performance or achievements of the Company or industry results to differ materially from the results, financial condition, performance or achievements expressed or implied by such forward-looking statements, including future changes or developments in the Company’s business, its competitive environment and political, economic, legal and social conditions. Further, past performance is not necessarily indicative of future results. Given these risks, uncertainties and other factors, viewers of this presentation are cautioned not to place undue reliance on these forward-looking statements. The Company disclaims any obligation to update these forward-looking statements to reflect future events or developments. This presentation is for general information purposes only, without regard to any specific objectives, financial situations or informational needs of any particular person. This presentation does not constitute an offer or invitation to purchase or subscribe for any securities in any jurisdiction, including the United States. No part of it should form the basis of or be relied upon in connection with any investment decision or any contract or commitment to purchase or subscribe for any securities. None of our securities may be offered or sold in the United States, without registration under the U.S. Securities Act of 1933, as amended, or pursuant to an exemption from registration there from. This presentation is confidential and may not be copied or disseminated, in whole or in part, and in any manner. Valorem Advisors Disclaimer:
Valorem Advisors is an Independent Investor Relations Management Service company. This Presentation has been prepared by Valorem Advisors based on information and data which the Company considers reliable, but Valorem Advisors and the Company makes no representation or warranty, express or implied, whatsoever, and no reliance shall be placed on, the truth, accuracy, completeness, fairness and reasonableness of the contents of this Presentation. This Presentation may not be all inclusive and may not contain all of the information that you may consider material. Any liability in respect of the contents of, or any omission from, this Presentation is expressly excluded. Valorem Advisors also hereby certifies that the directors or employees of Valorem Advisors do not own any stock in personal or company capacity of the Company under review.
Mr. Anuj Sonpal Valorem Advisors Tel: +91-22-6673-0037 Email: [email protected]
Recommended