CHANDRA CALIBRATION STATUSJEREMY J. DRAKE, HERMAN L. MARSHALL AND THE CXC CALIBRATION GROUP
Chandra Calibration
XMM-Newton
I A C H E C2 0 1 9
Chandra Calibration
XMM-Newton
I A C H E C2 0 1 9
Great waves IACHEC Buoys us through calibrating
To bring our fish home
CHANDRA CALIBRATION STATUS
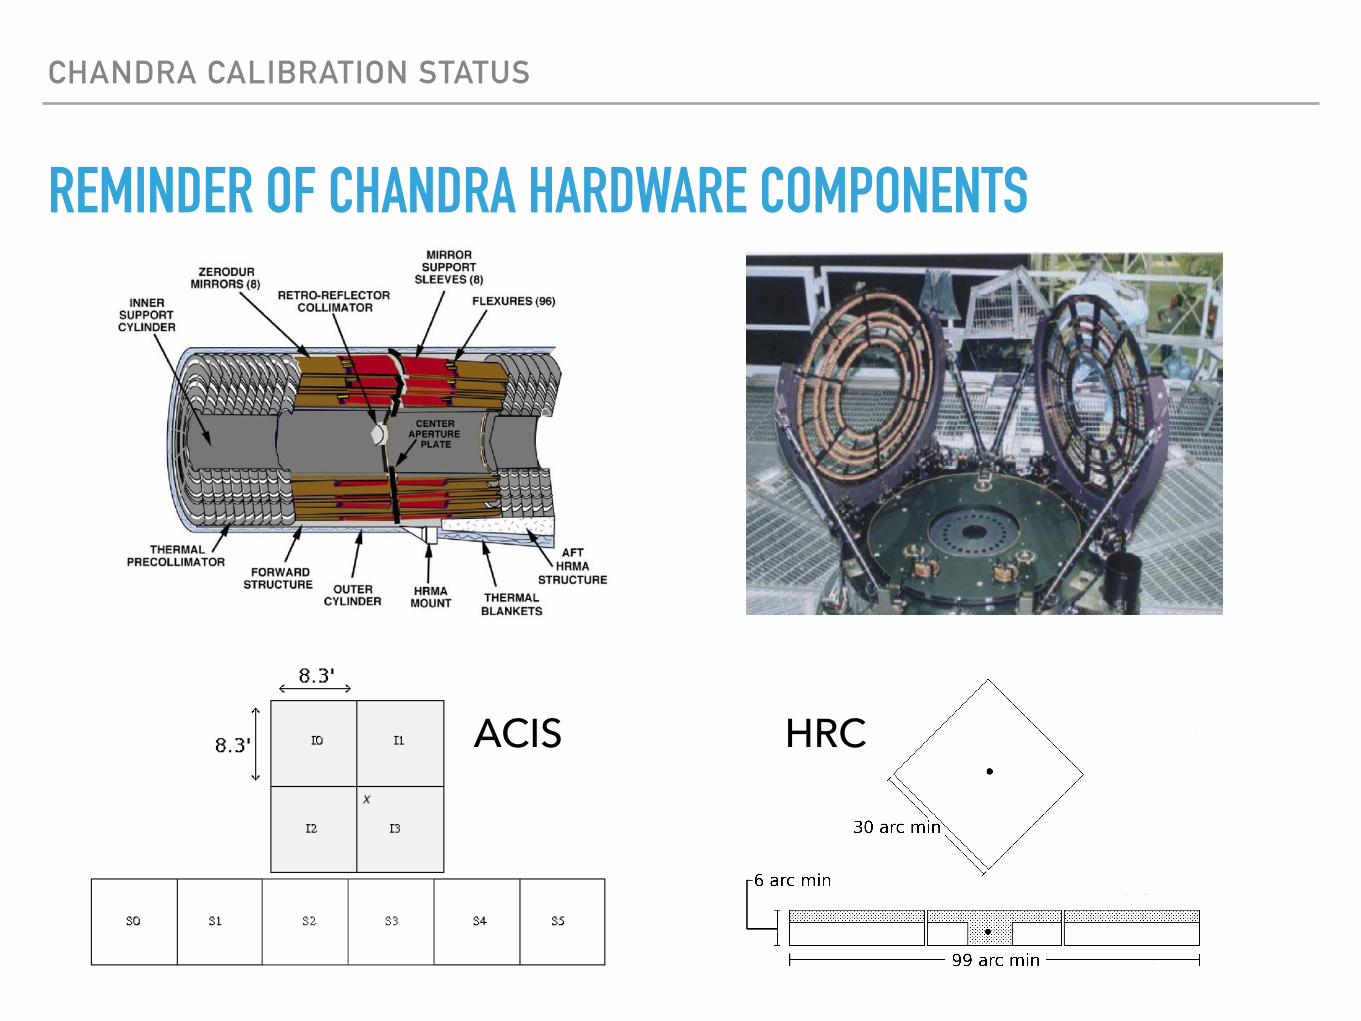
REMINDER OF CHANDRA HARDWARE COMPONENTS
ACIS HRC
CHANDRA CALIBRATION UPDATE
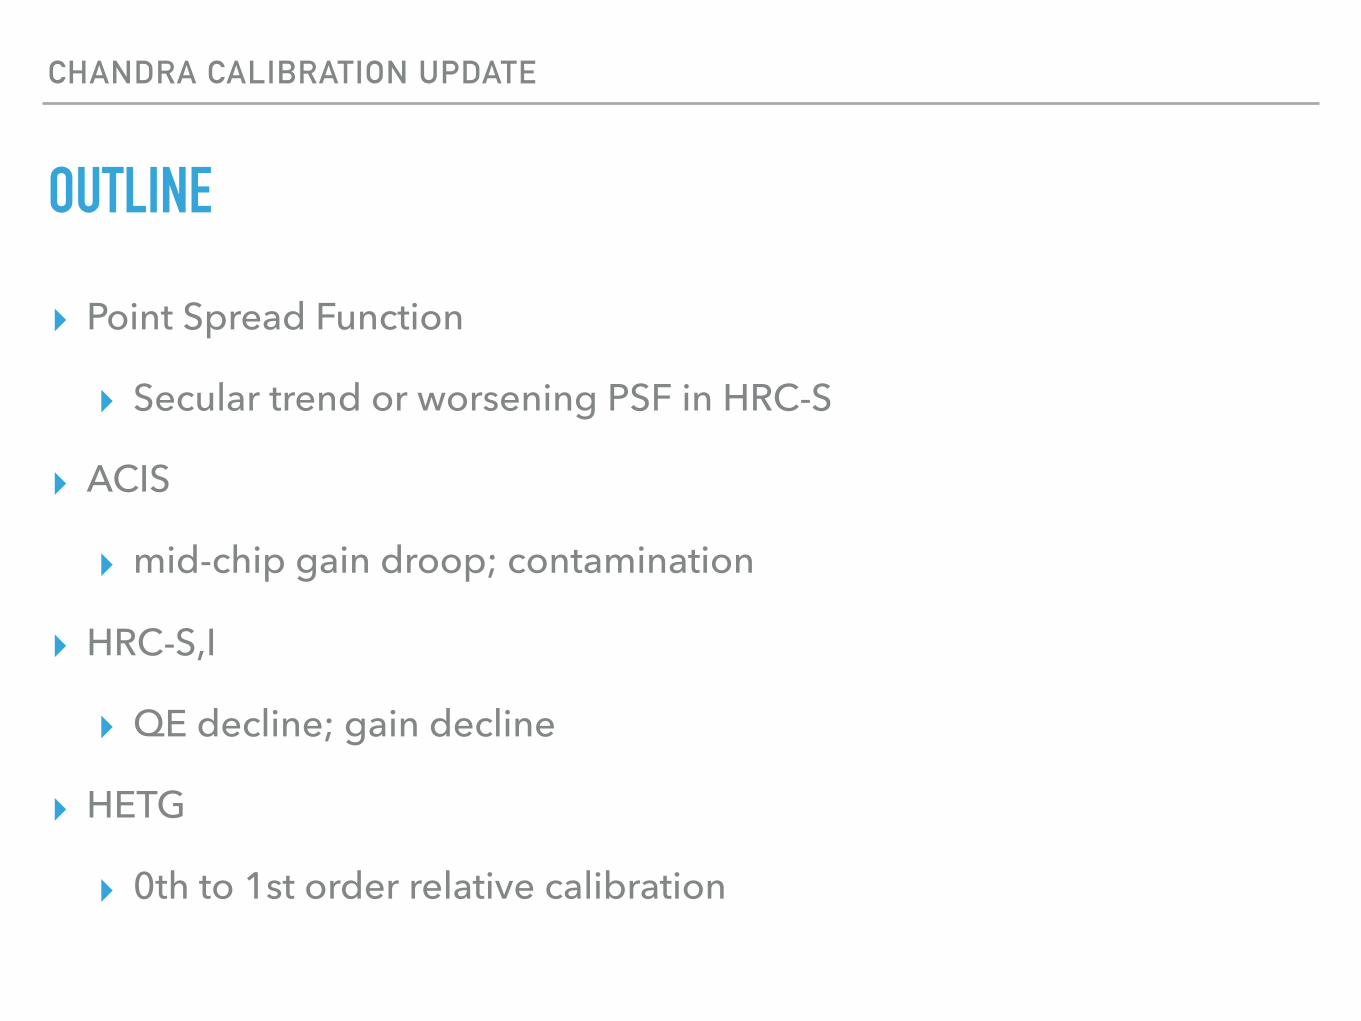
OUTLINE
▸ Point Spread Function
▸ Secular trend or worsening PSF in HRC-S
▸ ACIS
▸ mid-chip gain droop; contamination
▸ HRC-S,I
▸ QE decline; gain decline
▸ HETG
▸ 0th to 1st order relative calibration
POINT SPREAD FUNCTION
POINT SPREAD FUNCTION
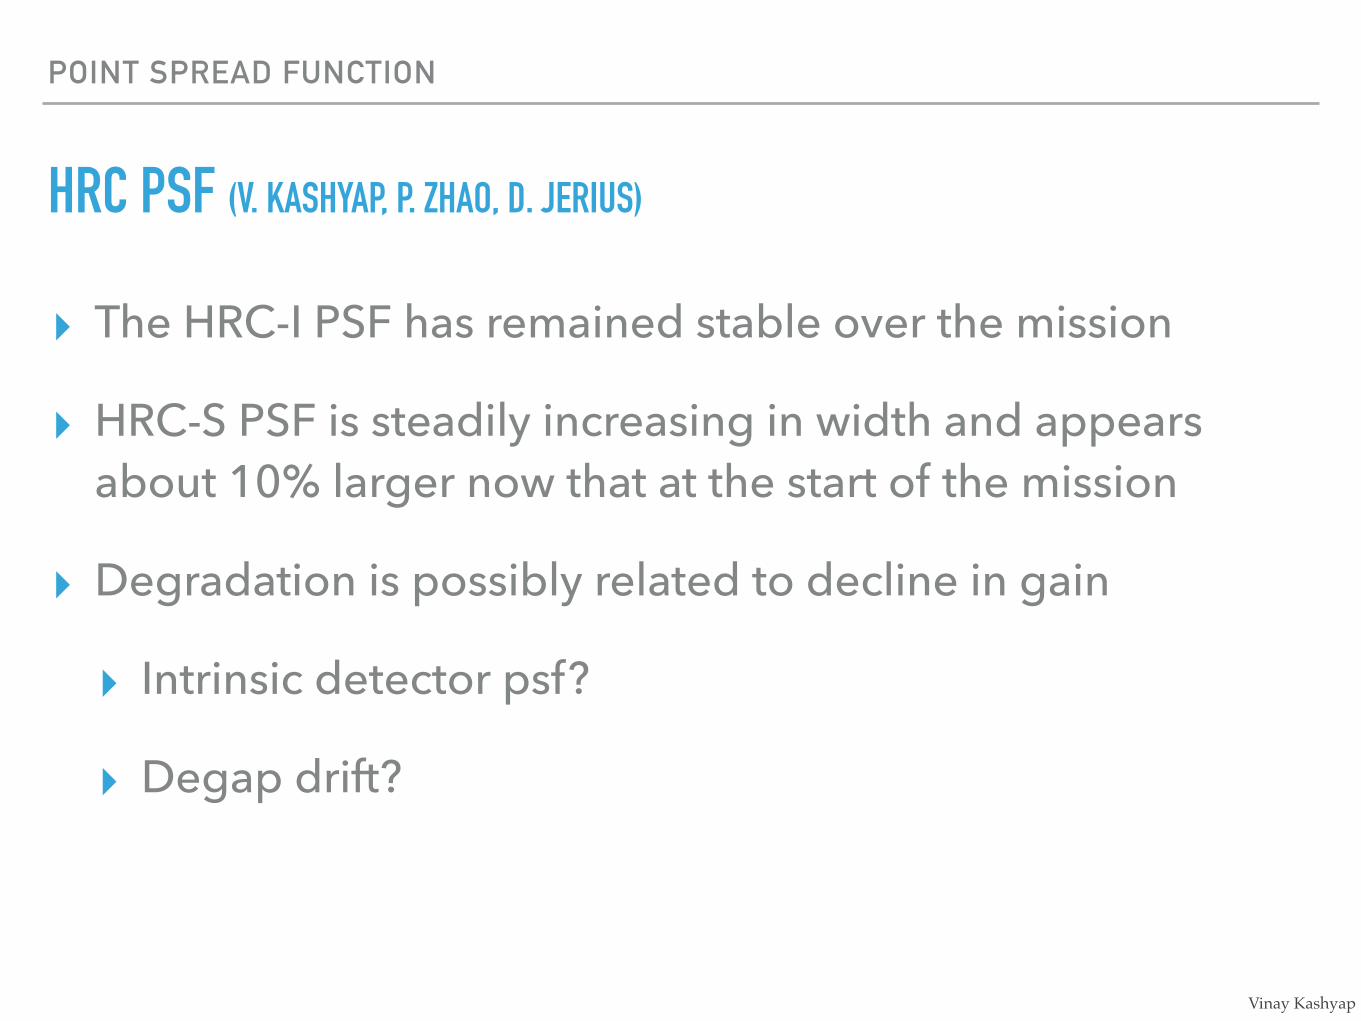
HRC PSF (V. KASHYAP, P. ZHAO, D. JERIUS)
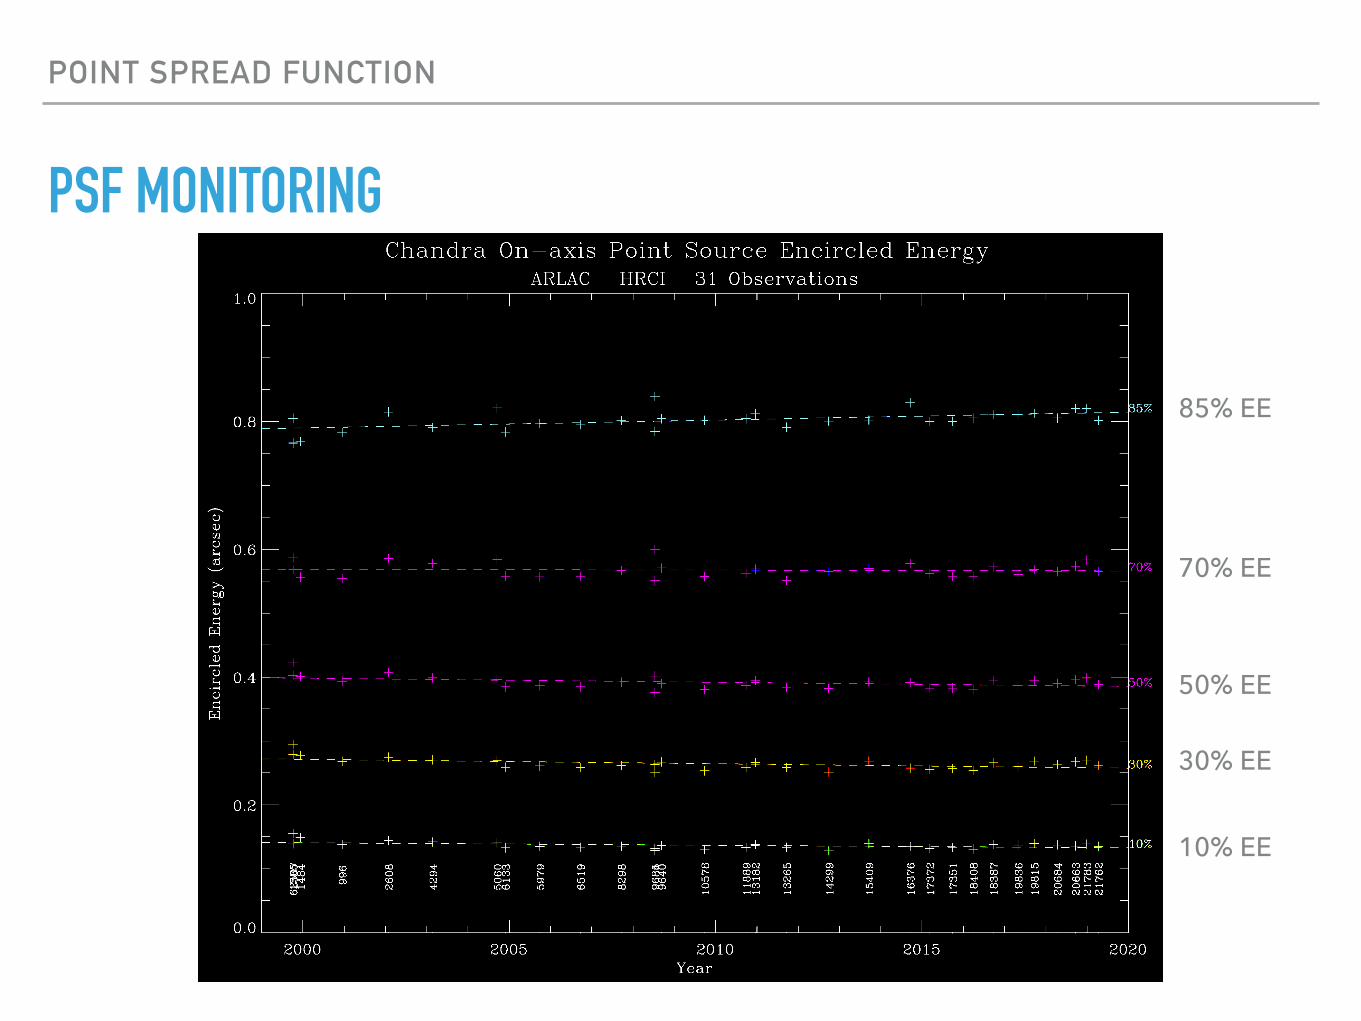
▸ The HRC-I PSF has remained stable over the mission
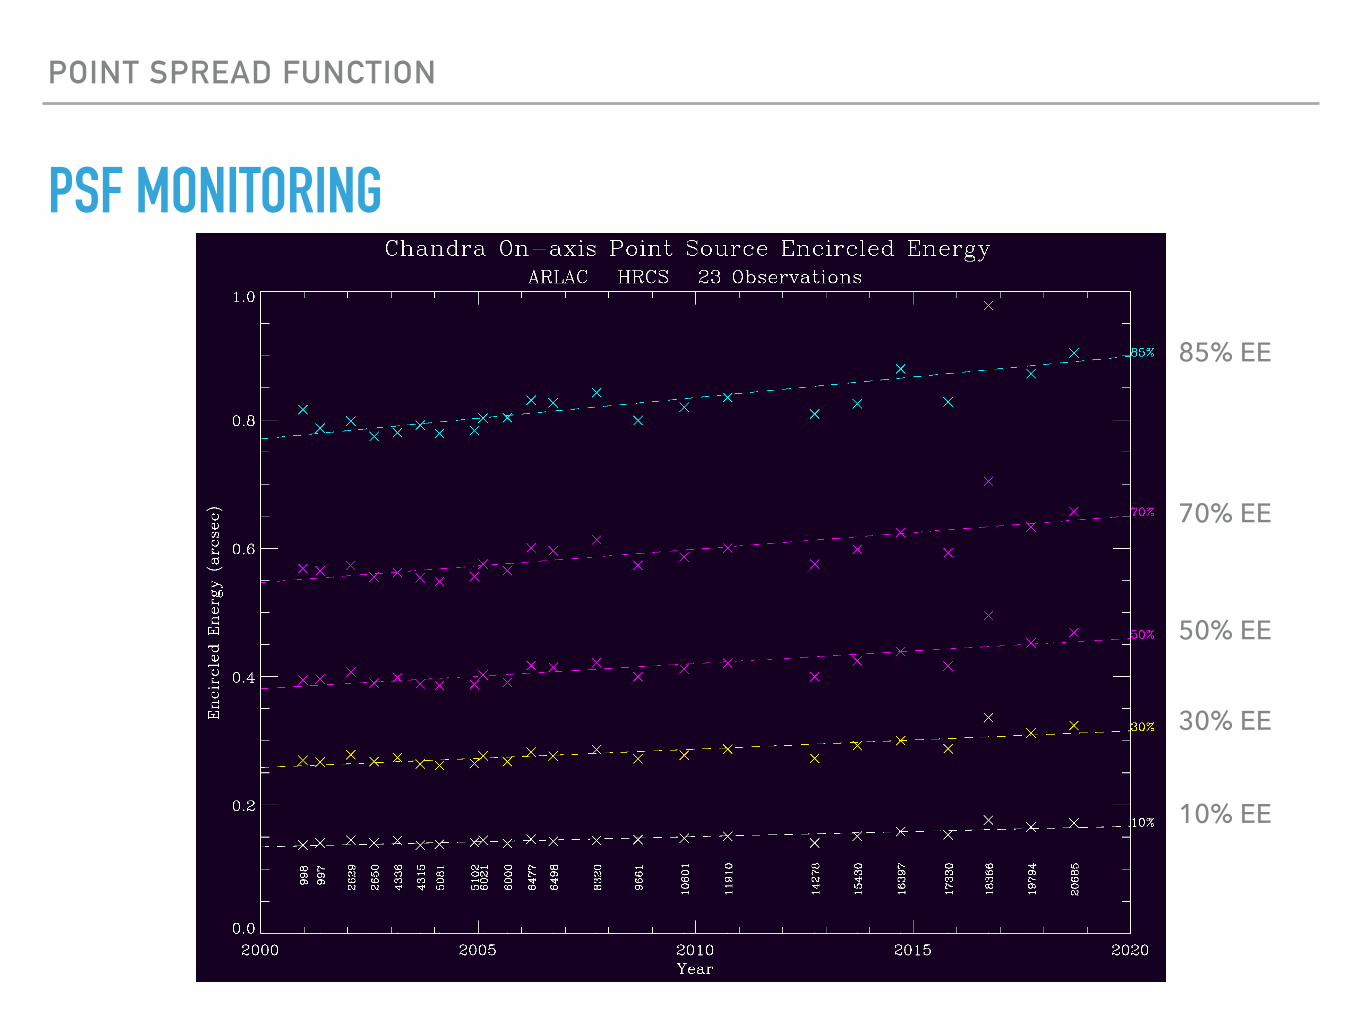
▸ HRC-S PSF is steadily increasing in width and appears about 10% larger now that at the start of the mission
▸ Degradation is possibly related to decline in gain
▸ Intrinsic detector psf?
▸ Degap drift?
Vinay Kashyap
POINT SPREAD FUNCTION
PSF MONITORING
85% EE
50% EE
30% EE
10% EE
70% EE
POINT SPREAD FUNCTION
PSF MONITORING
85% EE
50% EE
30% EE
10% EE
70% EE
ADVANCED CCD IMAGING SPECTROMETER (ACIS)
I0 I1
I2 I3
ADVANCED CCD IMAGING SPECTROMETER (ACIS)
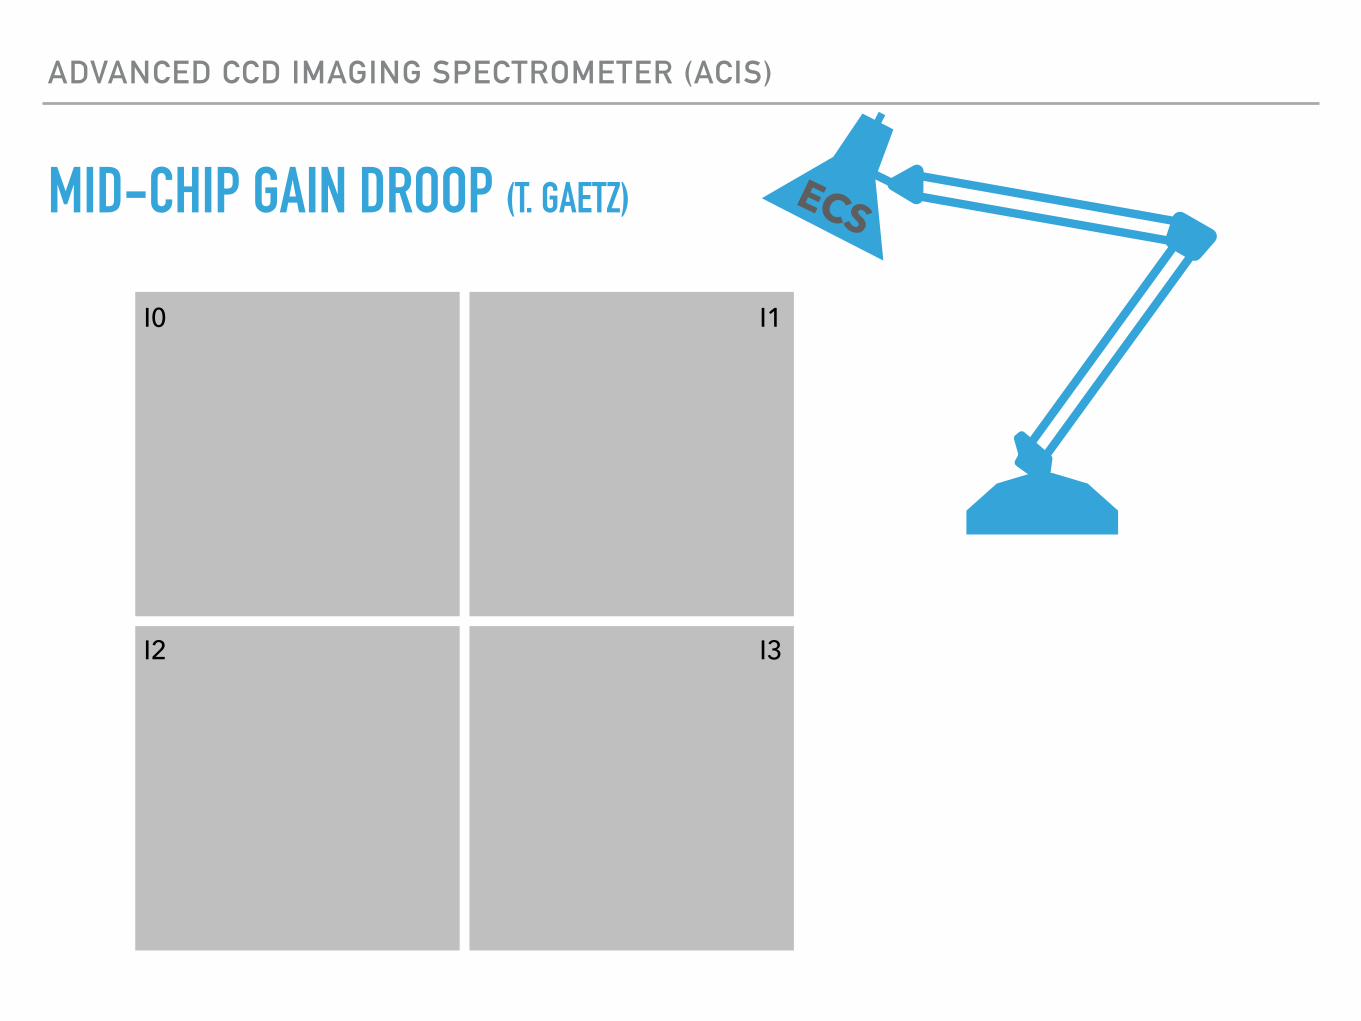
MID-CHIP GAIN DROOP (T. GAETZ) ECS
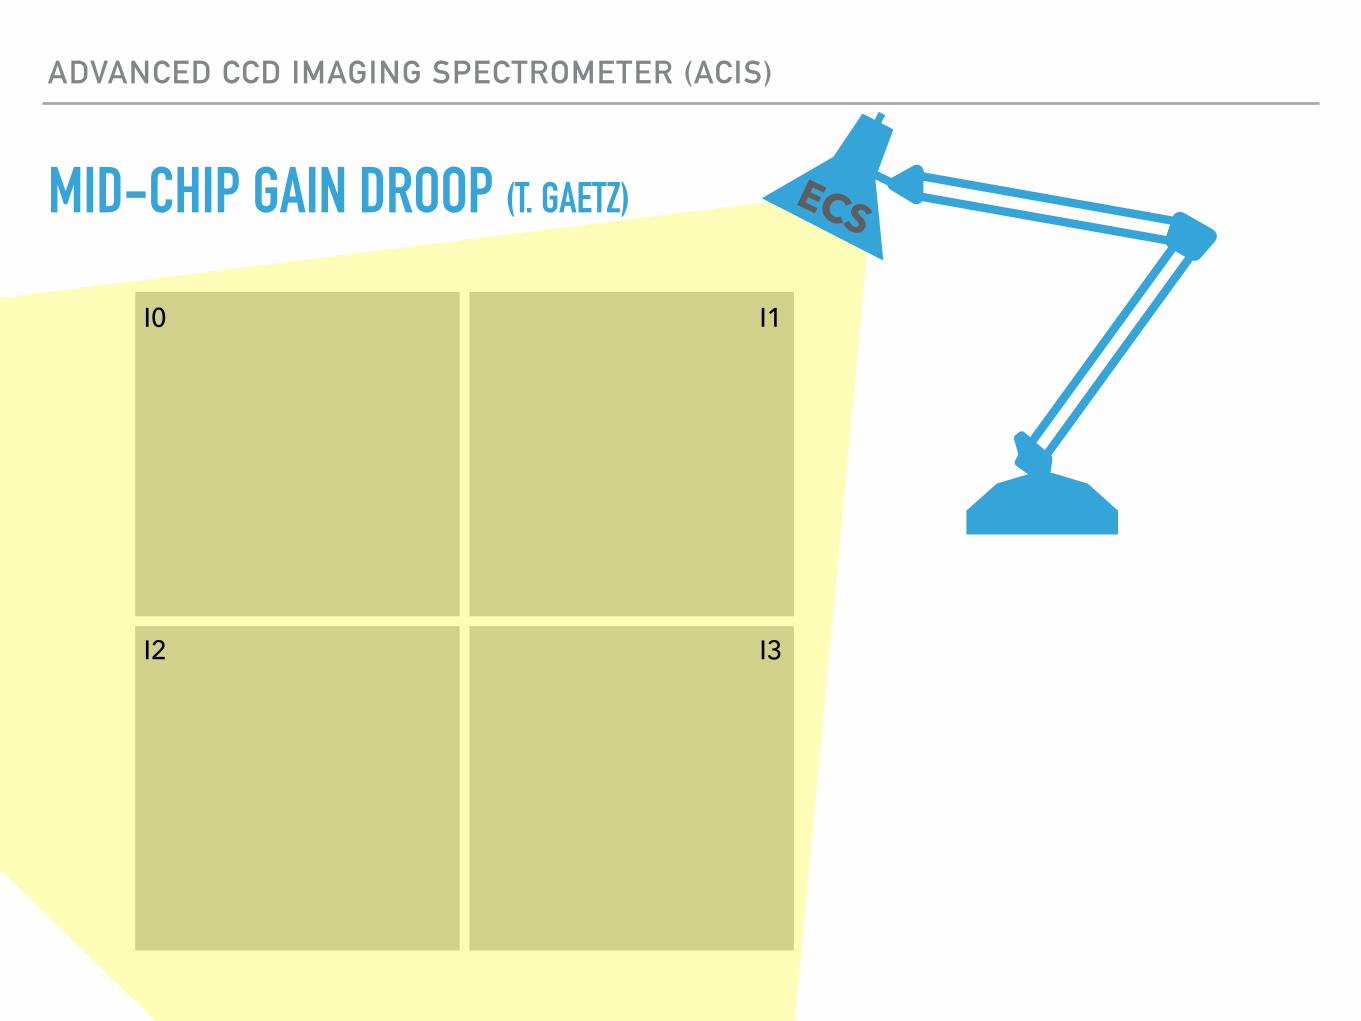
I0 I1
I2 I3
ADVANCED CCD IMAGING SPECTROMETER (ACIS)
MID-CHIP GAIN DROOP (T. GAETZ) ECS
ADVANCED CCD IMAGING SPECTROMETER (ACIS)
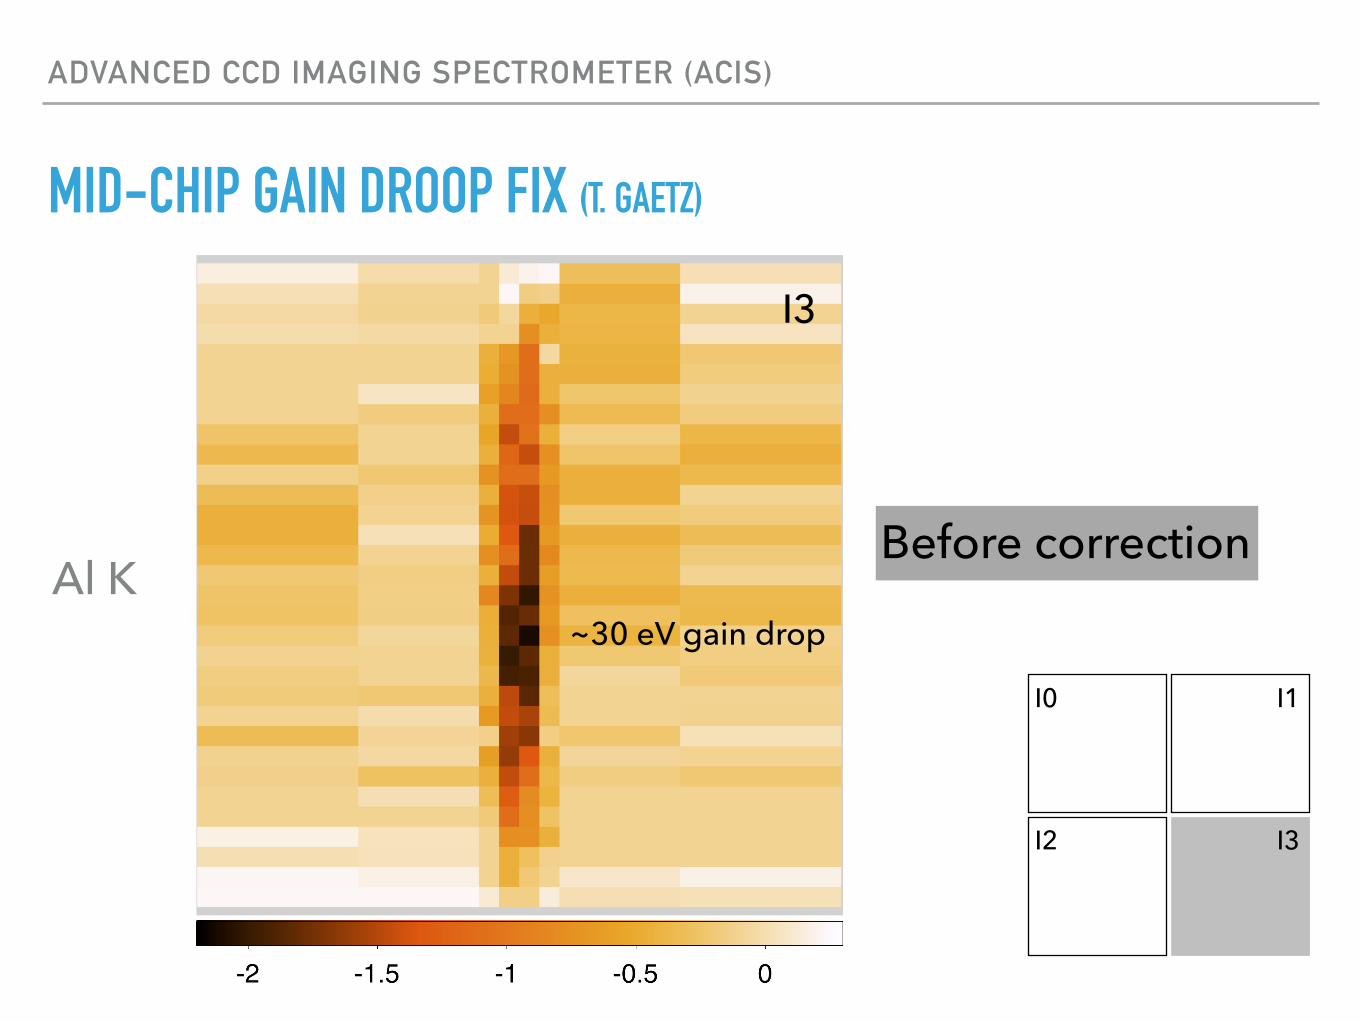
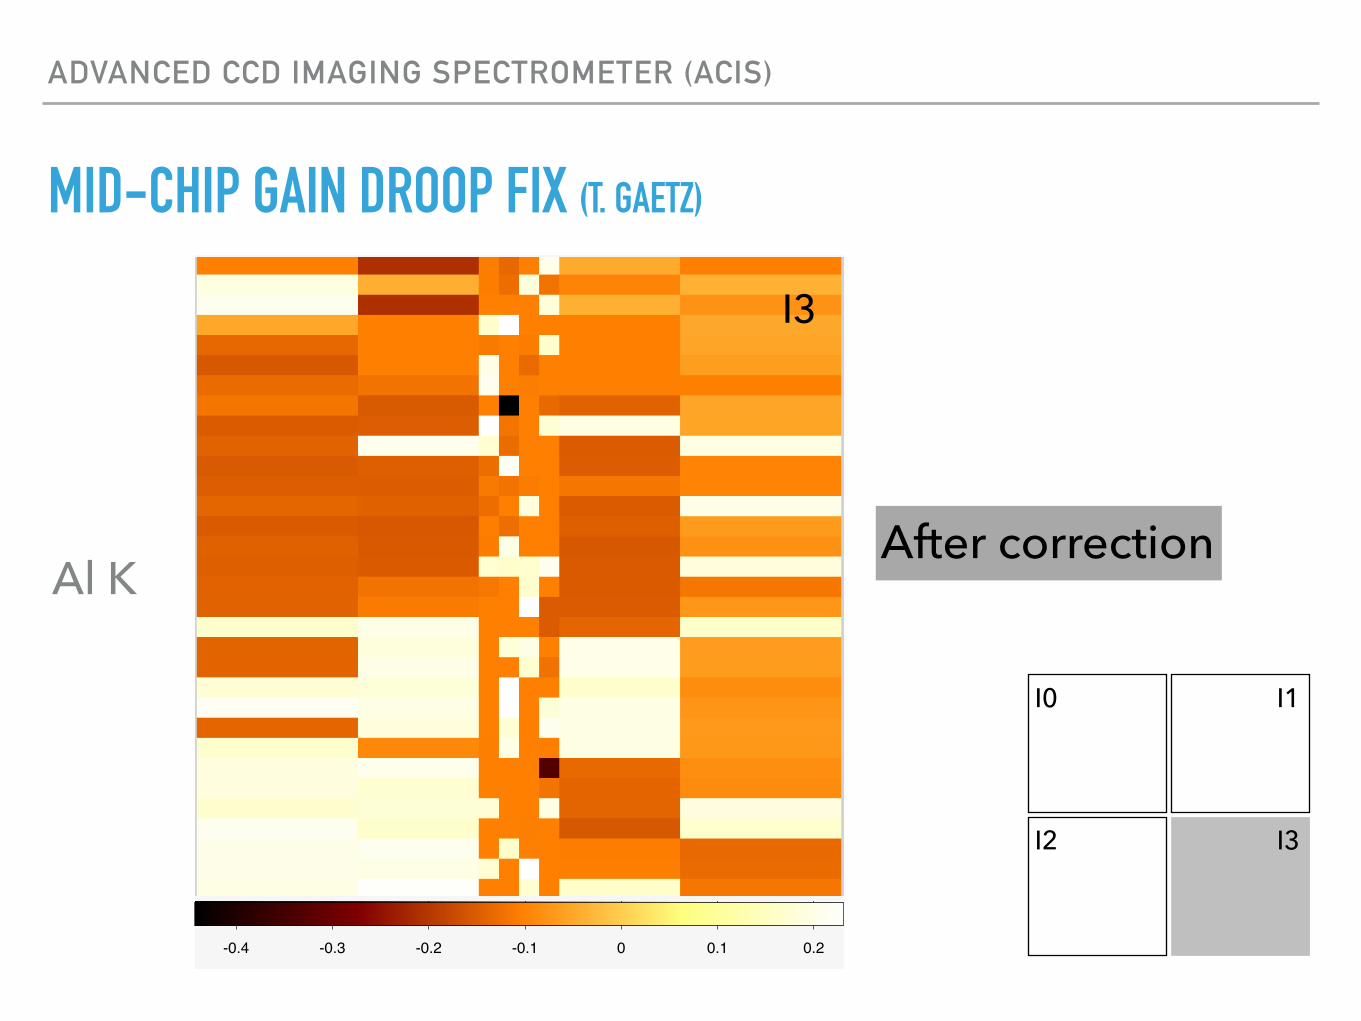
MID-CHIP GAIN DROOP FIX (T. GAETZ)
I0 I1
I2 I3
Al K
I3
~30 eV gain drop
Before correction
ADVANCED CCD IMAGING SPECTROMETER (ACIS)
MID-CHIP GAIN DROOP FIX (T. GAETZ)
I0 I1
I2 I3
Al K
ACIS-I3 Mid-Chip “gain droop” (w/ trial gain, resp)chipy vs. chipx1.49 keV
-0.4 -0.3 -0.2 -0.1 0 0.1 0.2
T. Gaetz (CXC/SAO) Chandra ACIS-I3 Mid-Chip Gain Droop IACHEC 2019 11 / 12
I3
After correction
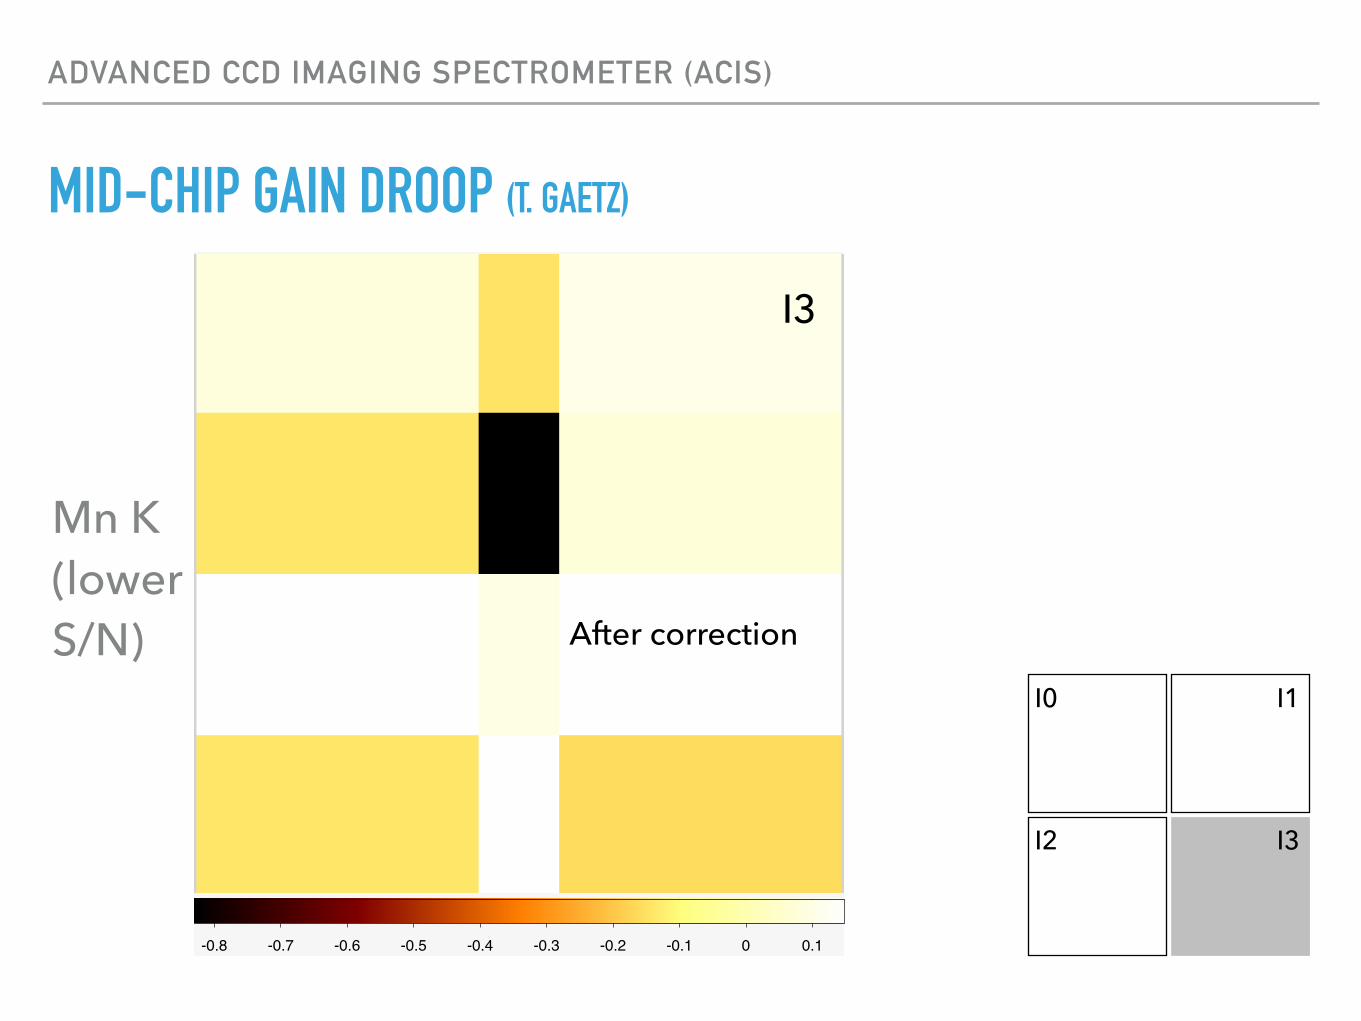
ACIS-I3 Mid-Chip “gain droop” (w/ trial gain, resp)chipy vs. chipx0.64 keV (coarse grid)
-0.8 -0.7 -0.6 -0.5 -0.4 -0.3 -0.2 -0.1 0 0.1
T. Gaetz (CXC/SAO) Chandra ACIS-I3 Mid-Chip Gain Droop IACHEC 2019 11 / 12
ADVANCED CCD IMAGING SPECTROMETER (ACIS)
MID-CHIP GAIN DROOP (T. GAETZ)
I0 I1
I2 I3
Mn K (lower S/N)
I3
After correction
ADVANCED CCD IMAGING SPECTROMETER (ACIS)
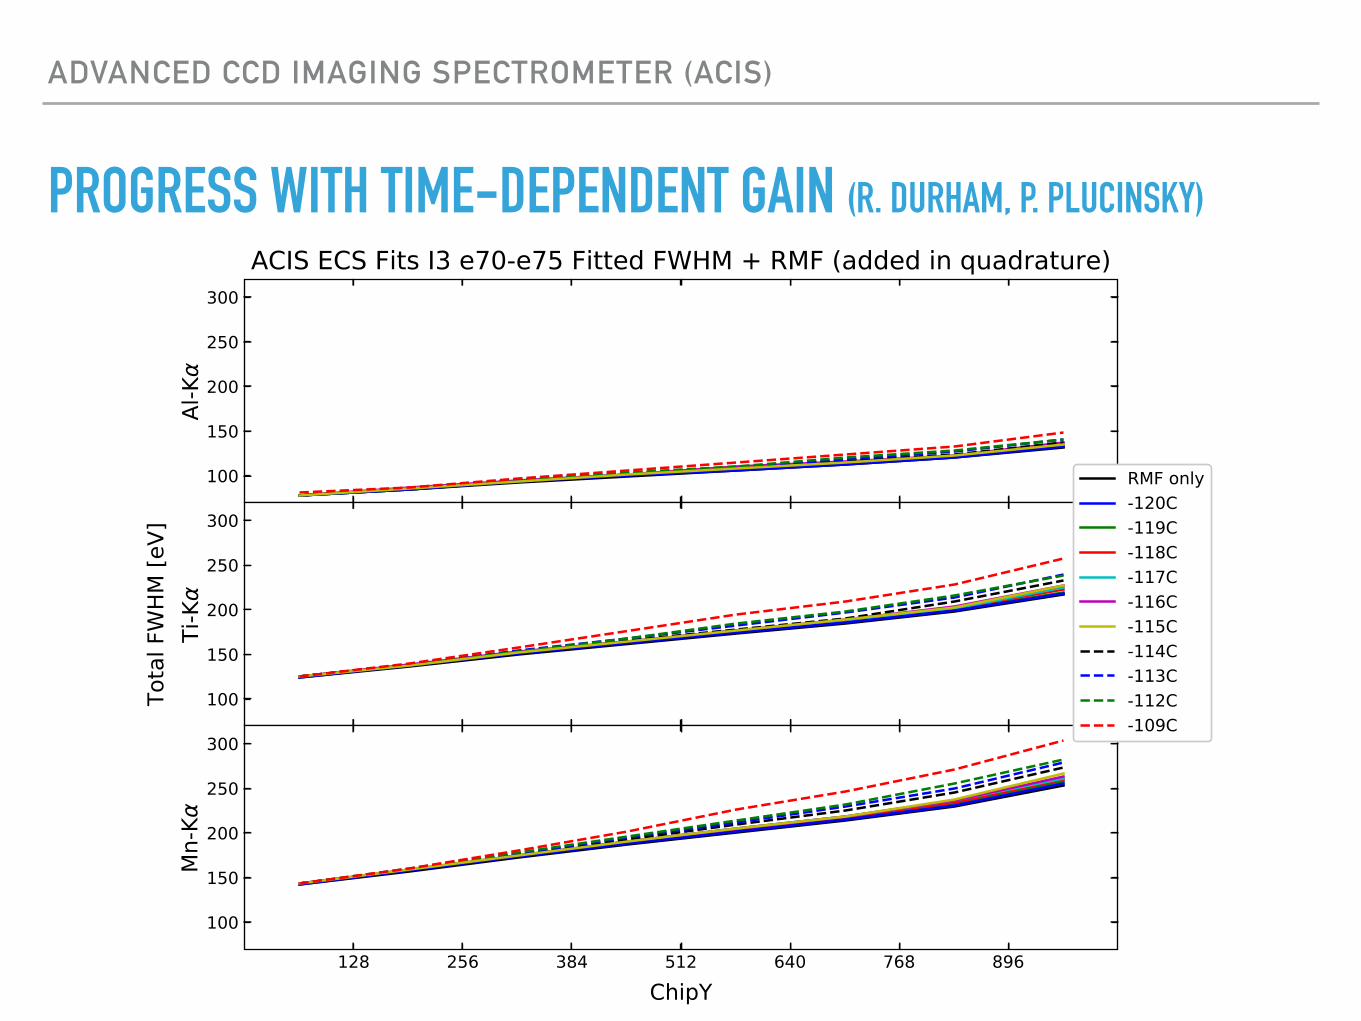
PROGRESS WITH TIME-DEPENDENT GAIN (R. DURHAM, P. PLUCINSKY)
ADVANCED CCD IMAGING SPECTROMETER (ACIS)
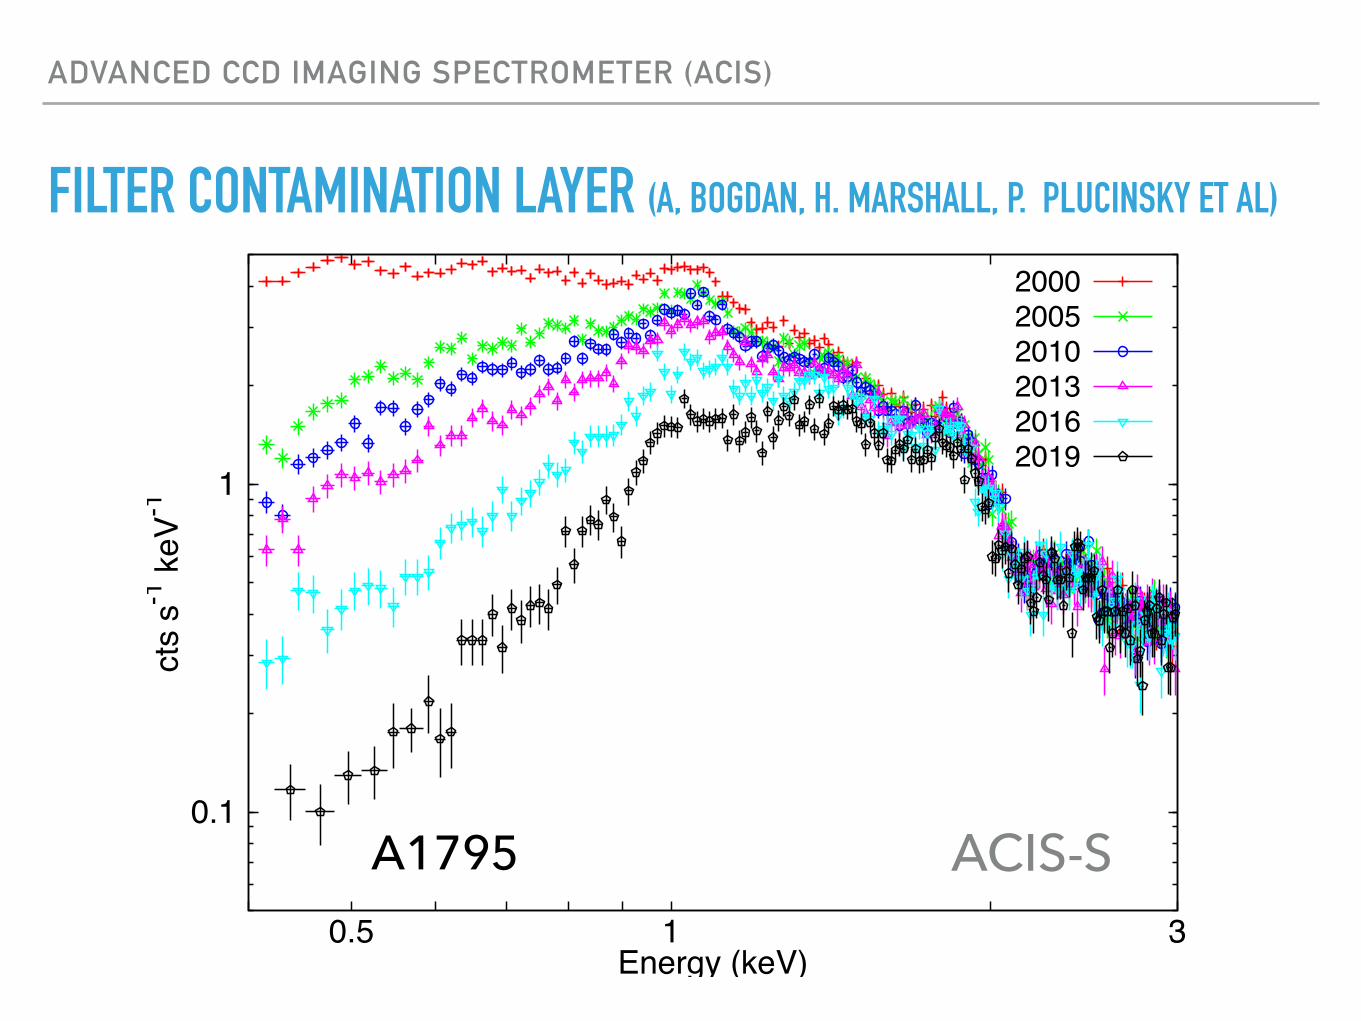
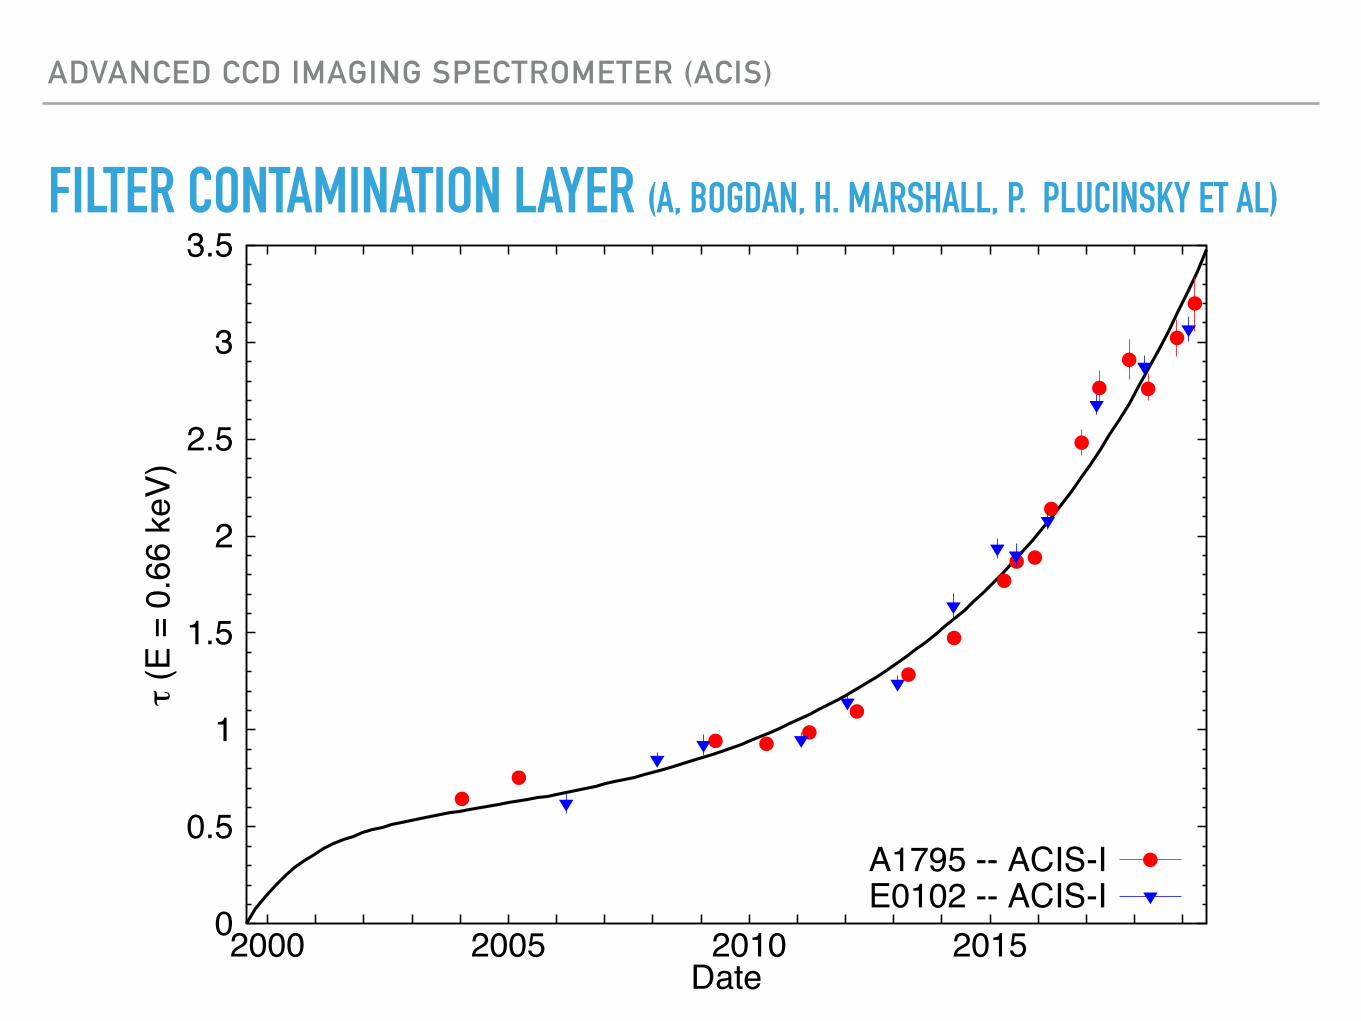
FILTER CONTAMINATION LAYER (A, BOGDAN, H. MARSHALL, P. PLUCINSKY ET AL)
0.1
1
0.5 1 3
cts
s-1 k
eV-1
Energy (keV)
200020052010201320162019
ACIS-SA1795
0
0.5
1
1.5
2
2.5
3
3.5
2000 2005 2010 2015
τ (E
= 0
.66
keV)
Date
A1795 -- ACIS-IE0102 -- ACIS-I
ADVANCED CCD IMAGING SPECTROMETER (ACIS)
FILTER CONTAMINATION LAYER (A, BOGDAN, H. MARSHALL, P. PLUCINSKY ET AL)
ADVANCED CCD IMAGING SPECTROMETER (ACIS)
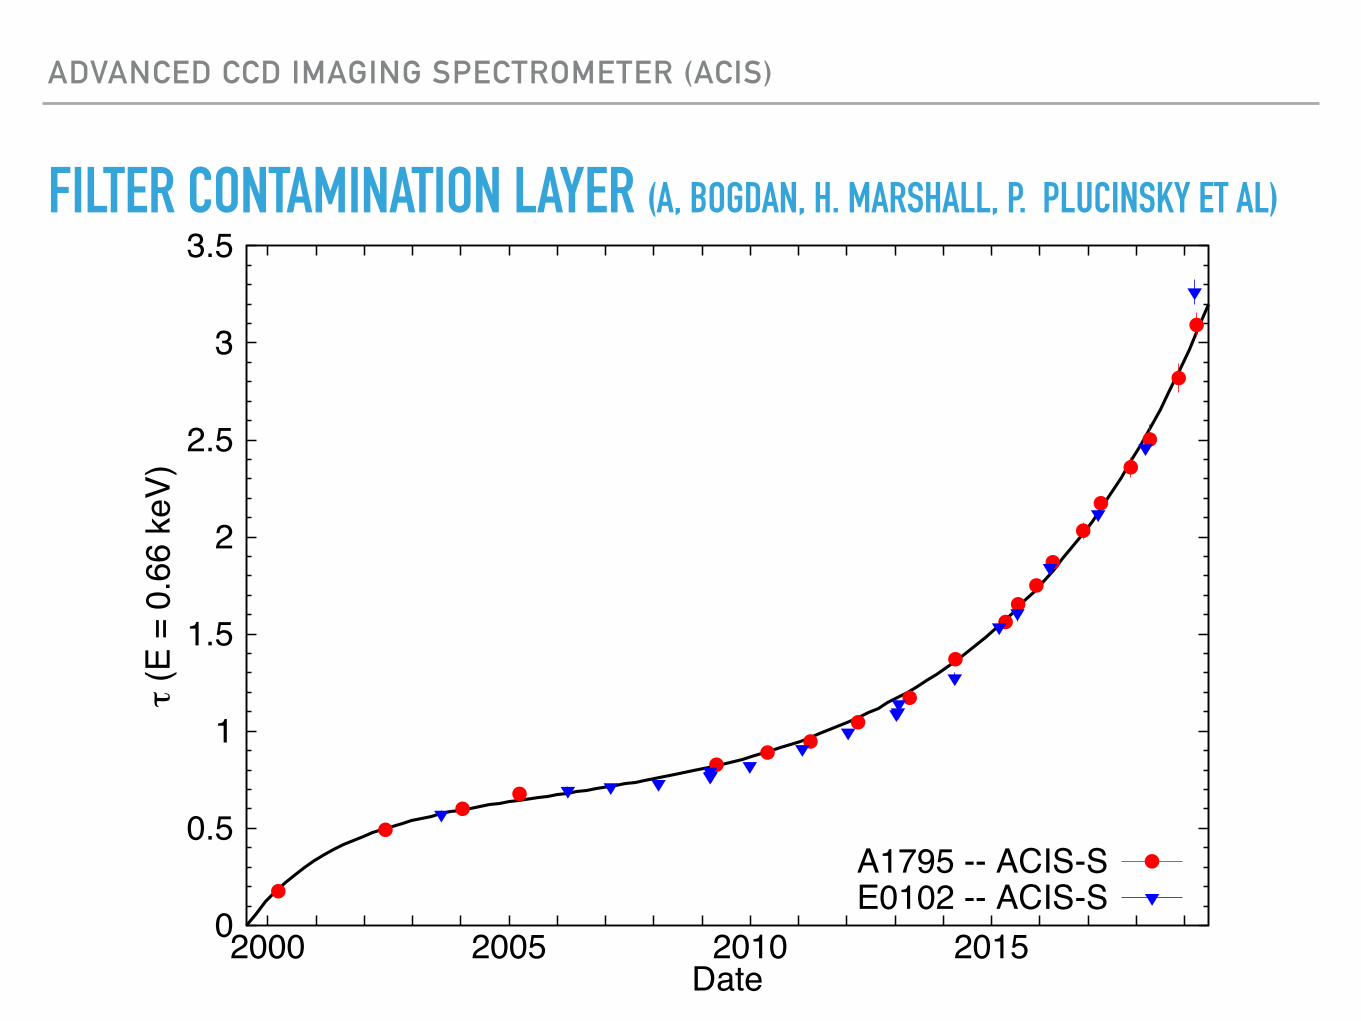
FILTER CONTAMINATION LAYER (A, BOGDAN, H. MARSHALL, P. PLUCINSKY ET AL)
0
0.5
1
1.5
2
2.5
3
3.5
2000 2005 2010 2015
τ (E
= 0
.66
keV)
Date
A1795 -- ACIS-SE0102 -- ACIS-S
HIGH RESOLUTION CAMERA
2000.0 2002.5 2005.0 2007.5 2010.0 2012.5 2015.0 2017.5
0.85
0.90
0.95
1.00
1.05
Rat
e/
2008
.5
HZ 43: HRC/LETG Count Rates
HRC-I: 0th
HRC-S: 0th
HRC-S: -1st: 57-157
HRC-S: +1st: 69-173
2002.5 2005.0 2007.5 2010.0 2012.5 2015.0 2017.5Date
0.7
0.8
0.9
1.0
1.1
1.2
Rat
e/
2008
.5HIGH RESOLUTION CAMERA
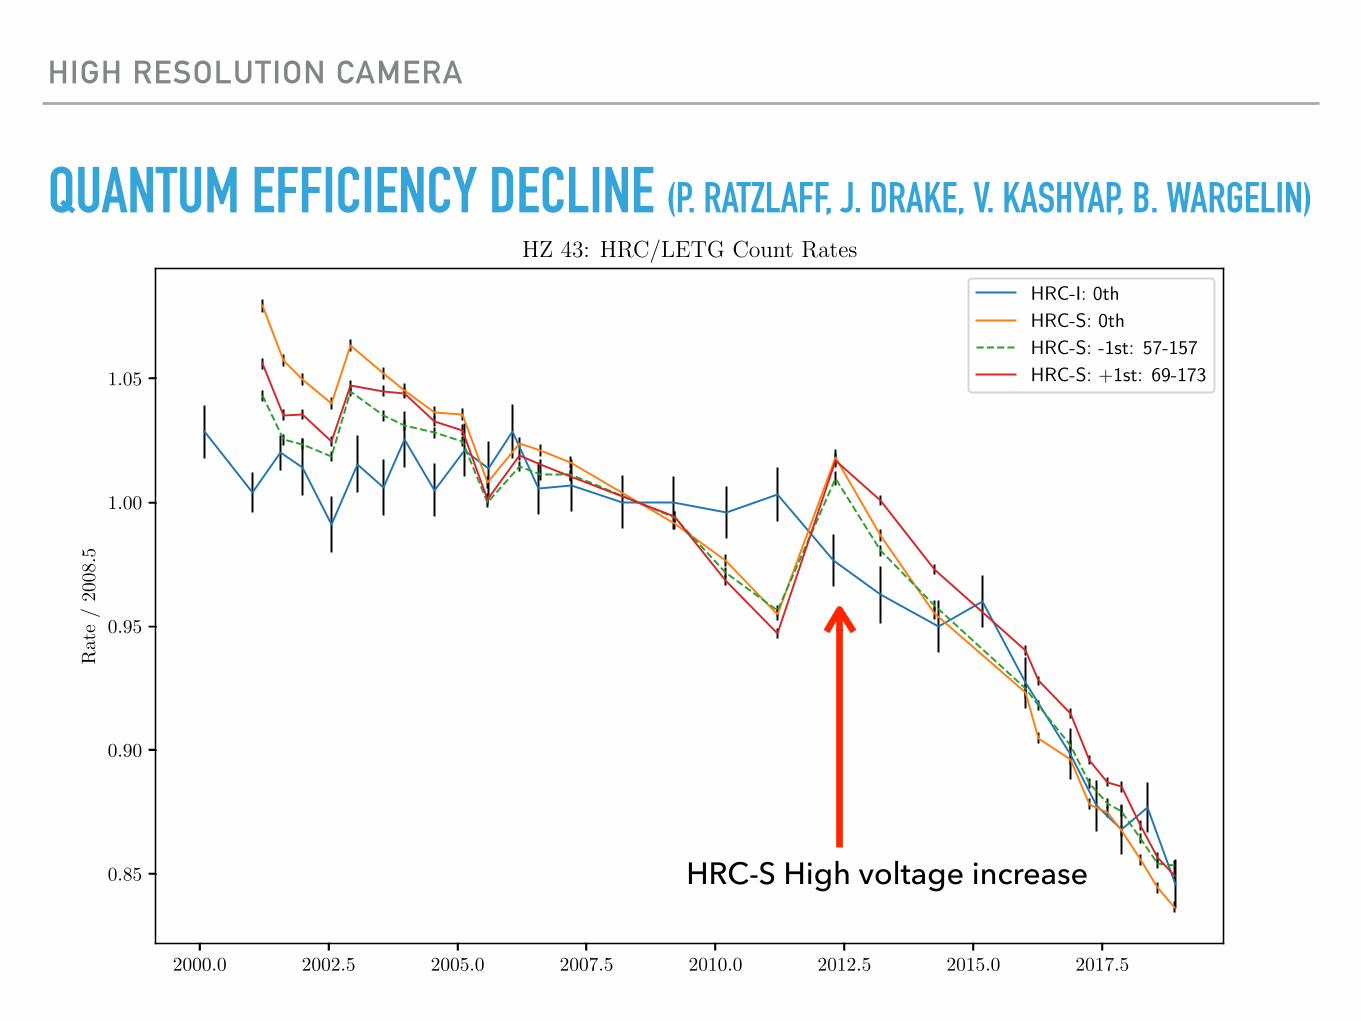
QUANTUM EFFICIENCY DECLINE (P. RATZLAFF, J. DRAKE, V. KASHYAP, B. WARGELIN)
HRC-S High voltage increase
HIGH RESOLUTION CAMERA
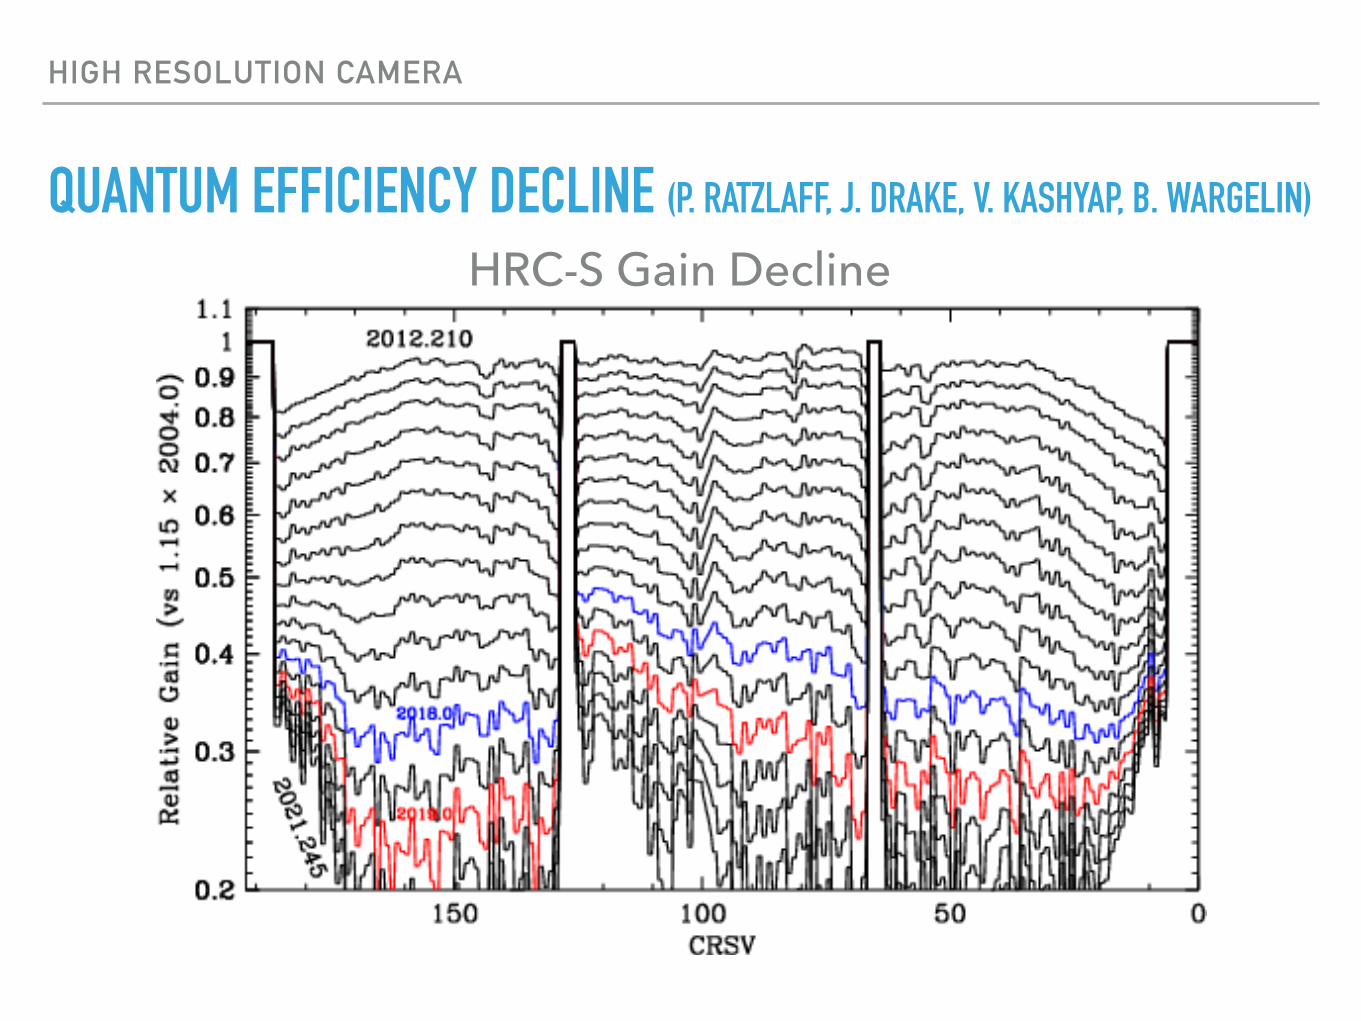
QUANTUM EFFICIENCY DECLINE (P. RATZLAFF, J. DRAKE, V. KASHYAP, B. WARGELIN)
HRC-S Gain Decline
HIGH RESOLUTION CAMERA
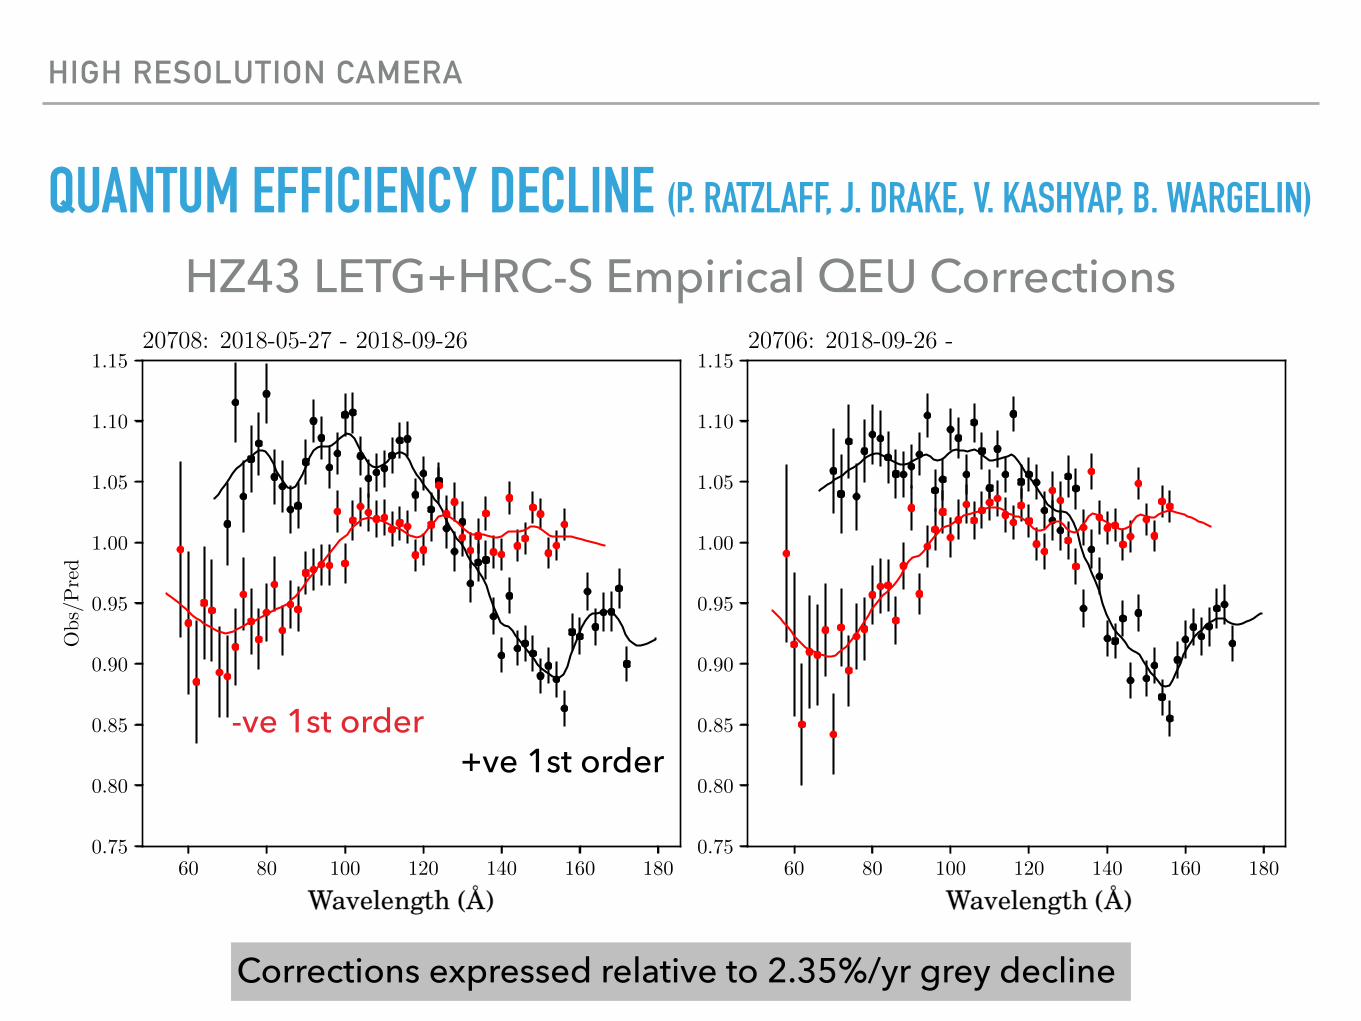
QUANTUM EFFICIENCY DECLINE (P. RATZLAFF, J. DRAKE, V. KASHYAP, B. WARGELIN)
HZ43 LETG+HRC-S Empirical QEU Corrections
60 80 100 120 140 160 1800.75
0.80
0.85
0.90
0.95
1.00
1.05
1.10
1.15
Obs/
Pre
d
20708: 2018-05-27 - 2018-09-26
60 80 100 120 140 160 1800.75
0.80
0.85
0.90
0.95
1.00
1.05
1.10
1.1520706: 2018-09-26 -
-ve 1st order+ve 1st order
Corrections expressed relative to 2.35%/yr grey decline
HIGH RESOLUTION CAMERA - SPECTROSCOPY
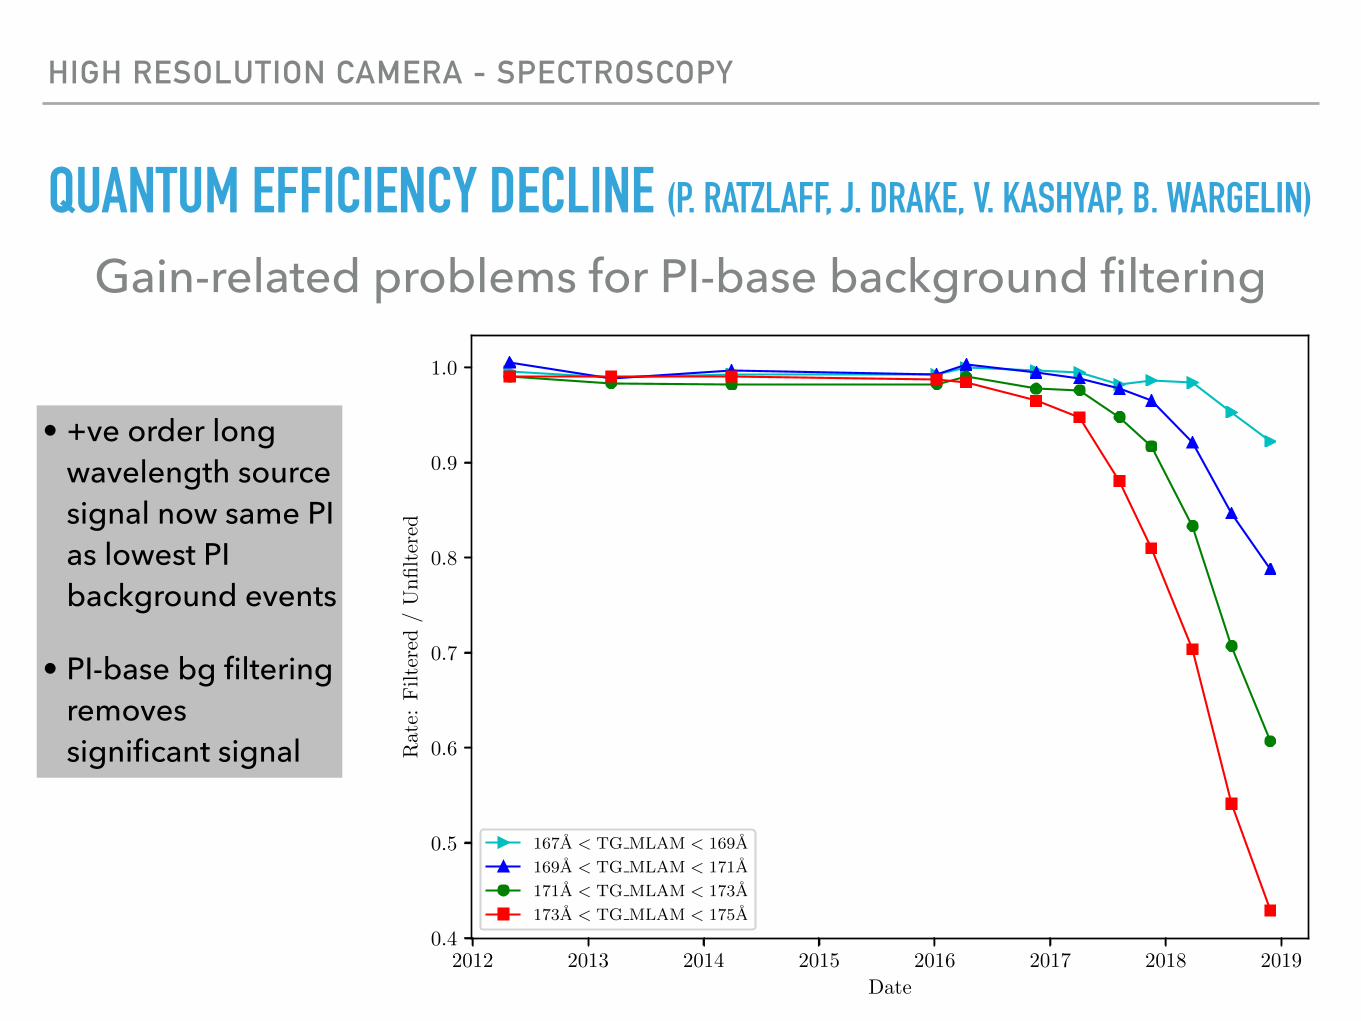
QUANTUM EFFICIENCY DECLINE (P. RATZLAFF, J. DRAKE, V. KASHYAP, B. WARGELIN)
Gain-related problems for PI-base background filtering
2012 2013 2014 2015 2016 2017 2018 2019Date
0.4
0.5
0.6
0.7
0.8
0.9
1.0
Rat
e:Filte
red
/U
nfilter
ed
167A < TG MLAM < 169A
169A < TG MLAM < 171A
171A < TG MLAM < 173A
173A < TG MLAM < 175A
• +ve order long wavelength source signal now same PI as lowest PI background events
• PI-base bg filtering removes significant signal
HETG
HIGH ENERGY TRANSMISSION GRATING (HETG)
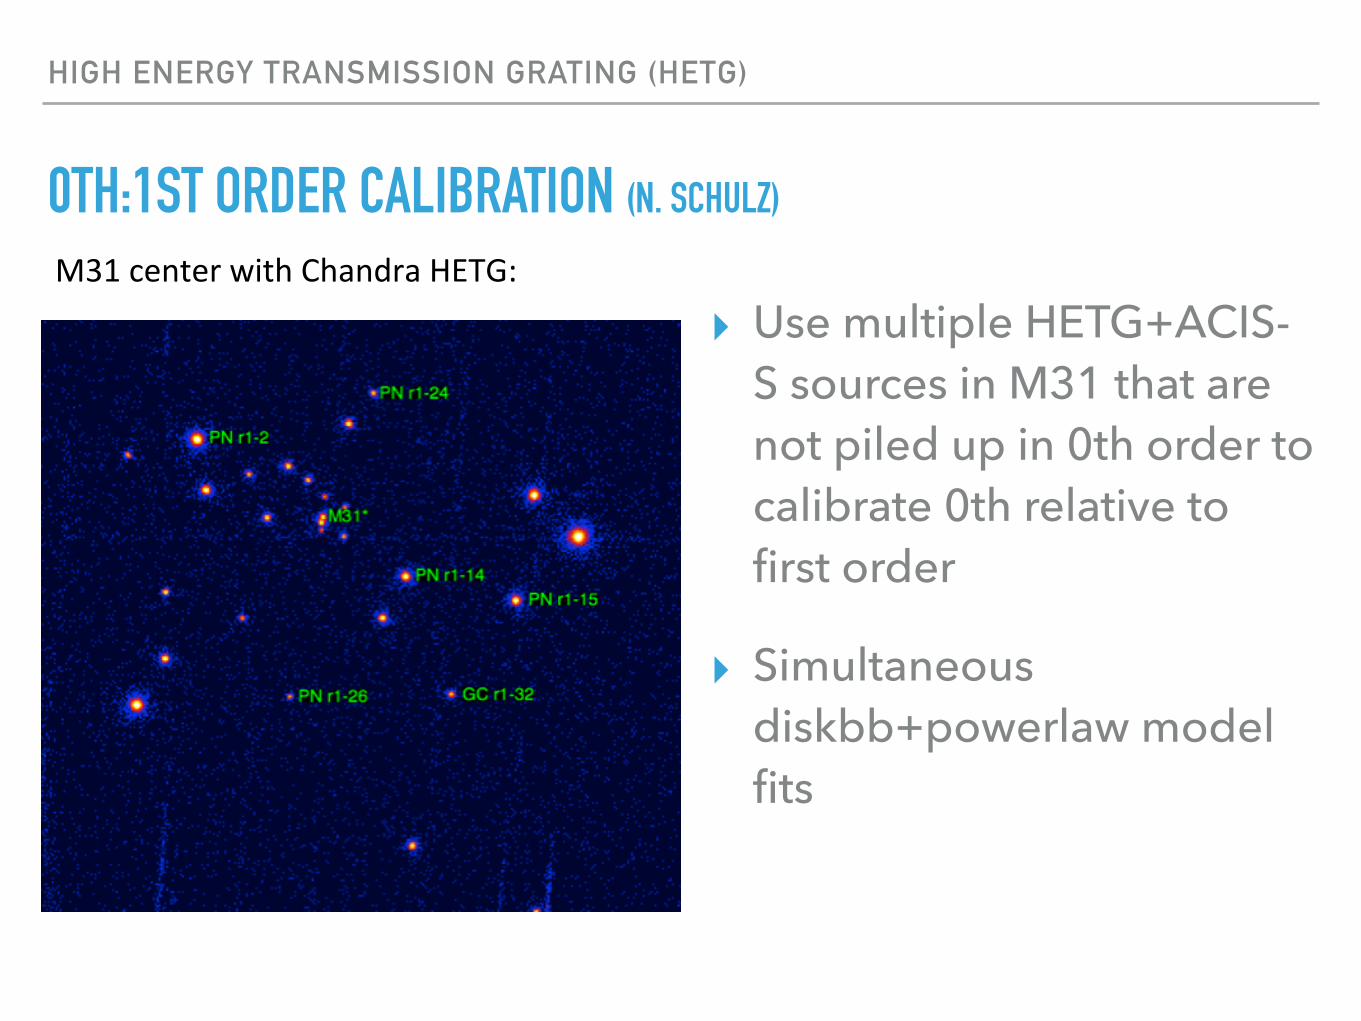
0TH:1ST ORDER CALIBRATION (N. SCHULZ)
▸ Use multiple HETG+ACIS-S sources in M31 that are not piled up in 0th order to calibrate 0th relative to first order
▸ Simultaneous diskbb+powerlaw model fits
M31centerwithChandraHETG:
R.Supperetal.2001,A&A,373,63:SoEdiffuseemissionatM31bulge(~1039ergs-1)
S.eleetal.2011,A&A,534,55:Shireyetal.2001,A&A,365,L195:Powerlawindex=-1.82,NH=6.7x1020cm-2
Needtomodeldispersedso-backgroundinChandraHETGspectra!!!
HIGH ENERGY TRANSMISSION GRATING (HETG)
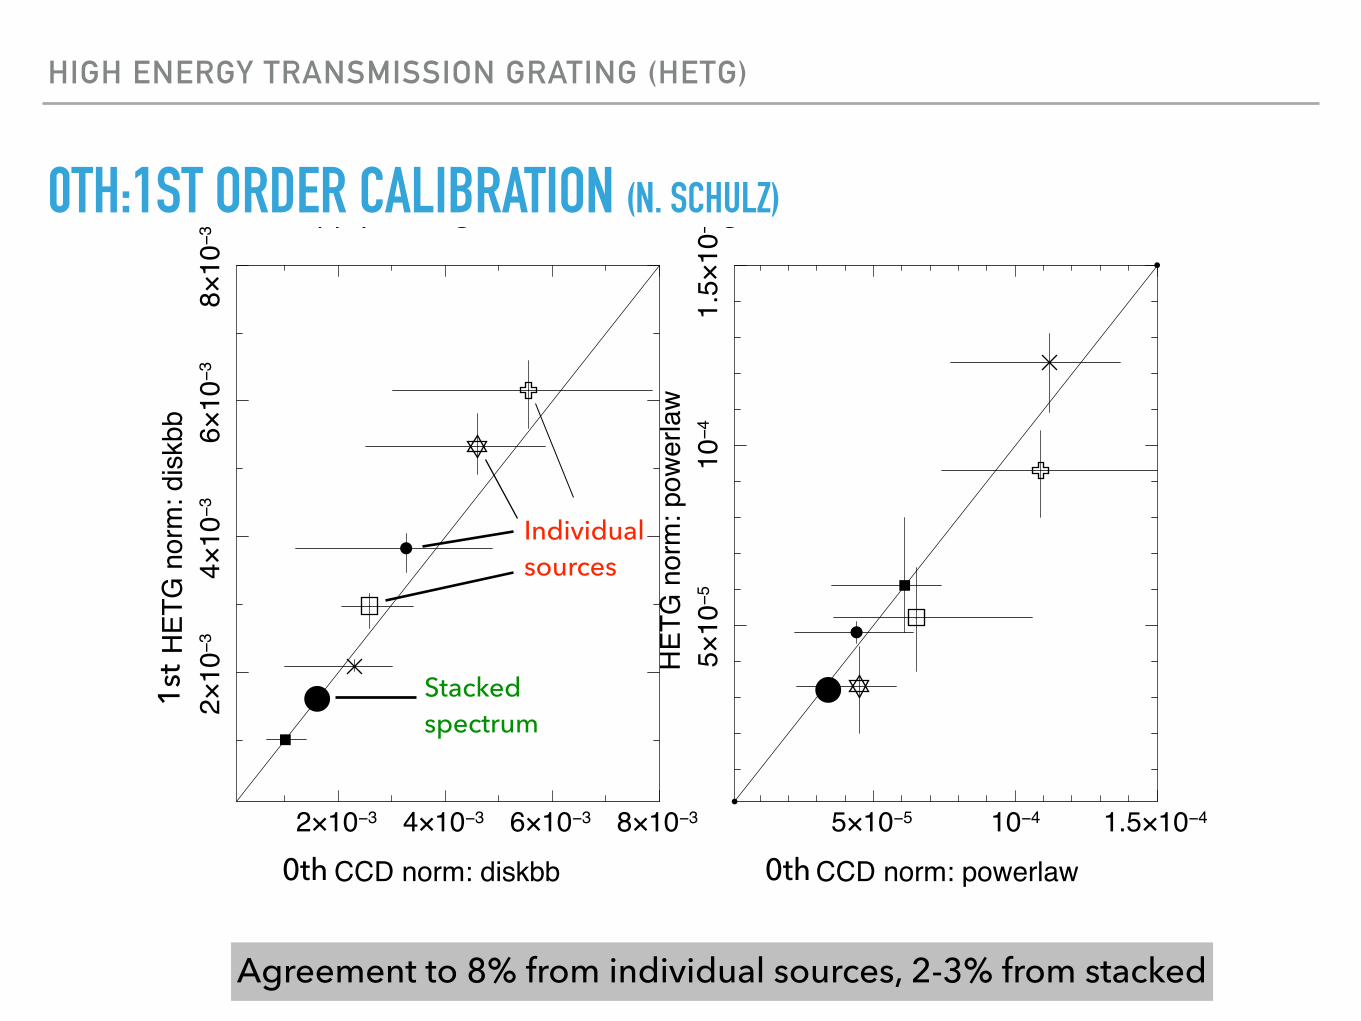
0TH:1ST ORDER CALIBRATION (N. SCHULZ)
Simultaneousmodelfitstoboth:zero-orderandHETGfirstorderSourcemodel:columndensity*(diskblackbody+powerlaw)kTandindex.ed/fixed,normaliza.onsvariableHETG:applyaverageM31diffusebackgroundandallowfor20%varia.ons
2×10⁻³ 4×10⁻³ 6×10⁻³ 8×10⁻³
2×10
−34×
10−3
6×10
−38×
10−3
CCD norm: diskbb
HET
G n
orm
: dis
kbb
5×10⁻⁵ 10−4 1.5×10⁻⁴
5×10
−510
−41.
5×10
−4
CCD norm: powerlaw
HET
G n
orm
: pow
erla
w
ThesmallsymbolsareindividualsourcesThelargefilledcircleistheall6sourcestackedresult.
Individual sources
Stacked spectrum
Agreement to 8% from individual sources, 2-3% from stacked
0th
1st
0th
CHANDRA CALIBRATION UPDATE
SUMMARY
▸ Chandra calibration challenges are as a result of aging and decline of instrument performance and accumulation of contamination on ACIS
▸ HRC-S PSF is increasing and this behavior is not currently understood.
▸ ACIS mid-chip gain droop calibration coming shortly
▸ ACIS contamination model is being regularly updated: slower rate of increase seen last year is not born out in newer data.
▸ Continuing HRC-S QE secular changes are being calibrated (HV increase on HRC-S is only a matter of time).
▸ HETG 0th vs 1st order calibration is looking good - few % - at energies above 1.5 keV; need more data for lower E.
SUPPLEMENTARY MATERIAL
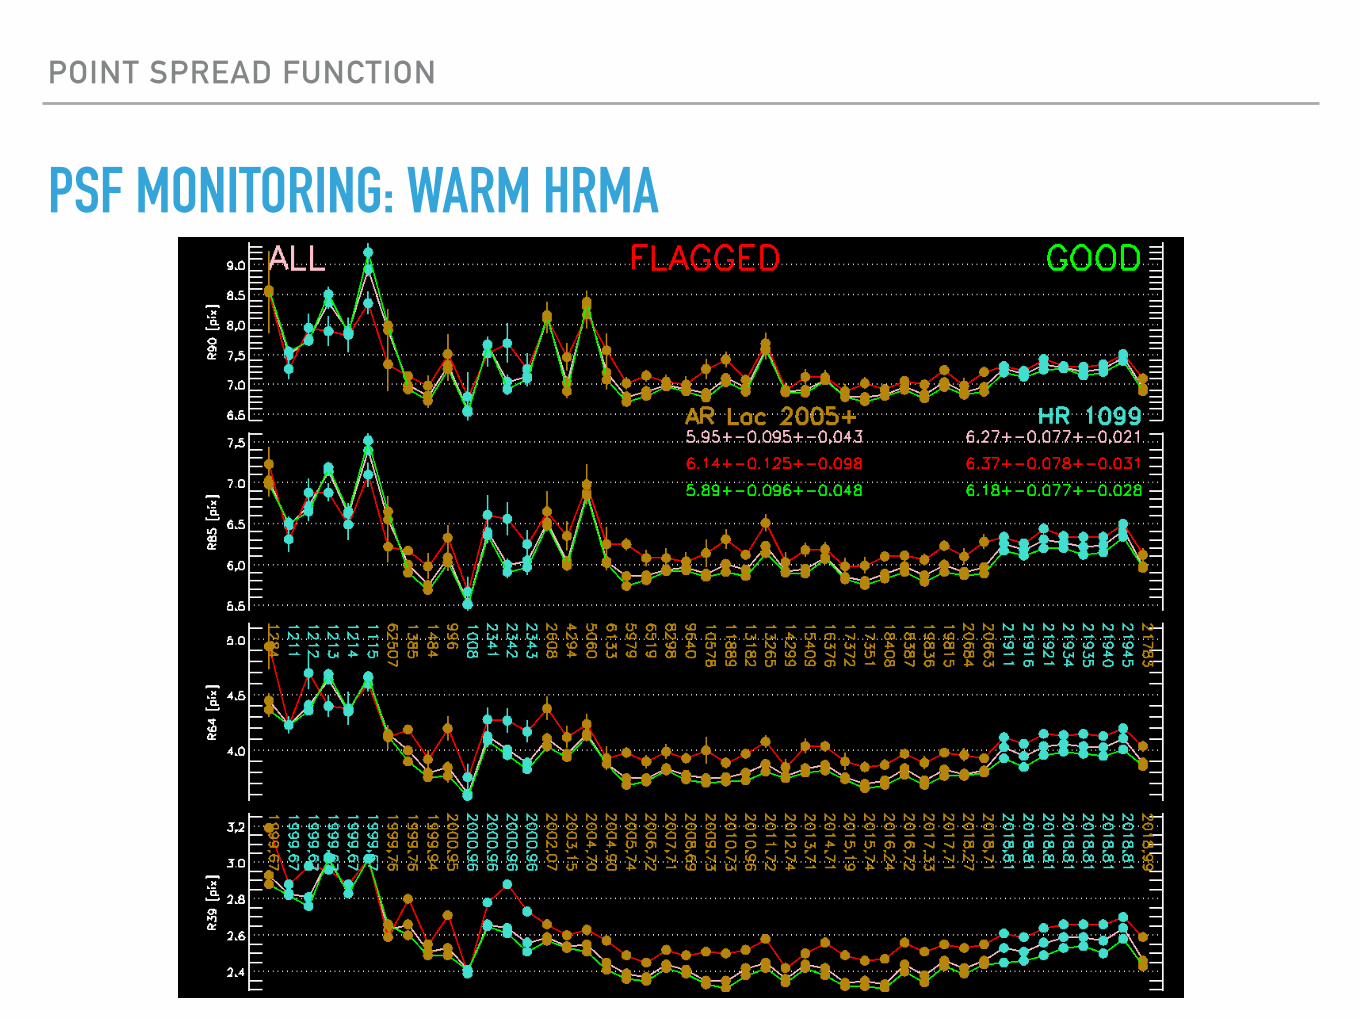
POINT SPREAD FUNCTION
PSF MONITORING: WARM HRMA
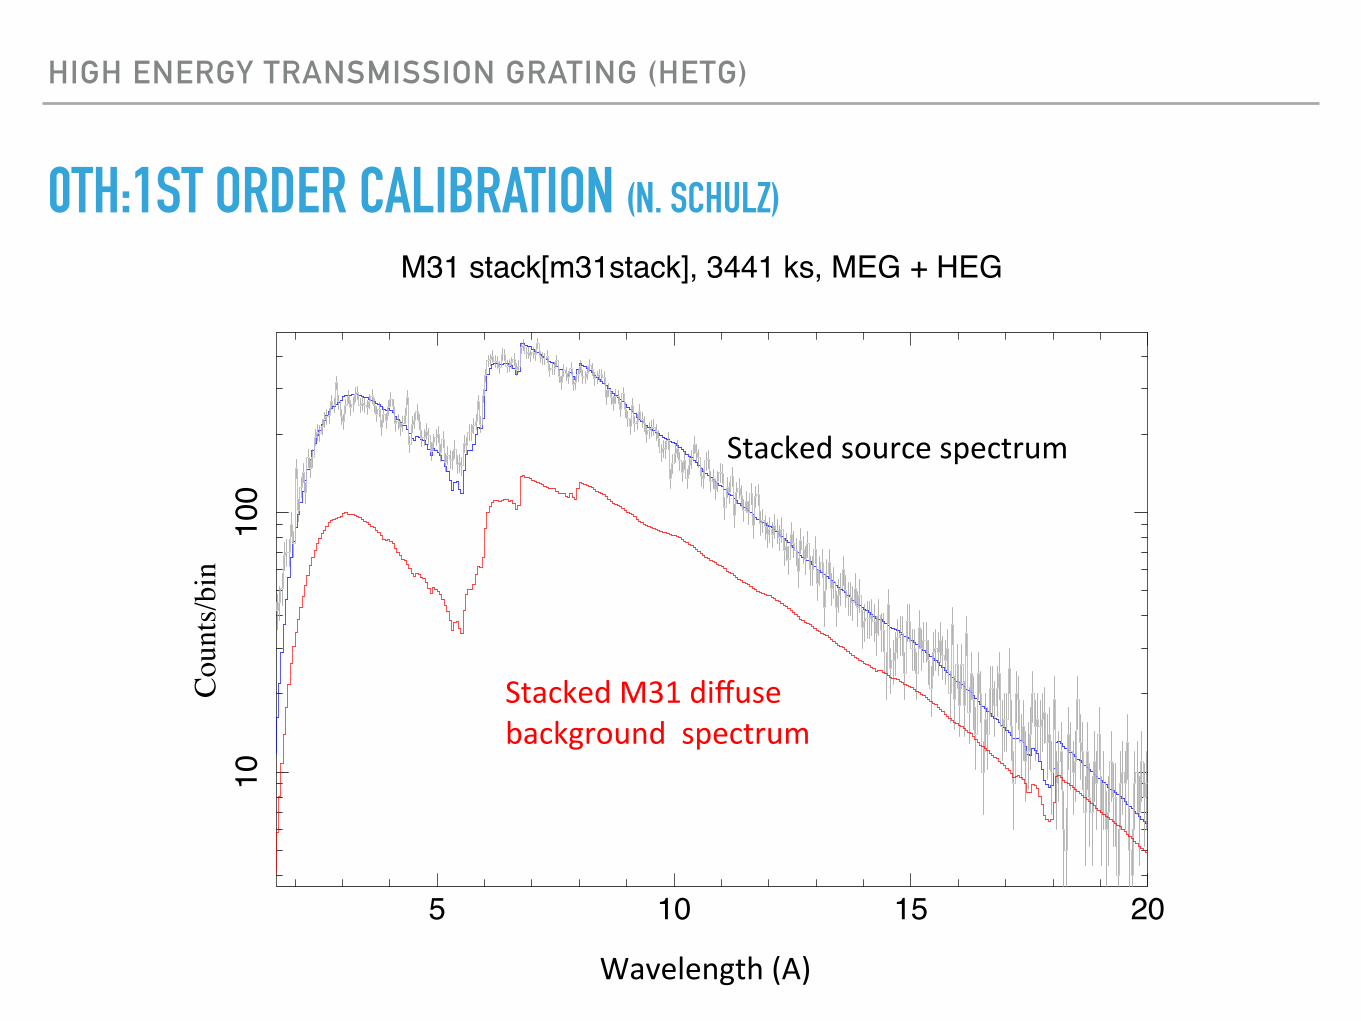
HIGH ENERGY TRANSMISSION GRATING (HETG)
0TH:1ST ORDER CALIBRATION (N. SCHULZ)
5 10 15 20
1010
0M31 stack[m31stack], 3441 ks, MEG + HEG
Counts/bin
Wavelength(A)
Stackedsourcespectrum
StackedM31diffusebackgroundspectrum
Recommended