
Jerry Kornblau December 2, 2016
Finding & Sizing Your MarketAnd
How Much They’ll Pay for Your Product

2
Jerry Kornblau - Bio
• Strategy • Research• Marketing• Biz Dev
Work Experience Mentorship
949-683-3767
President
Contact Info
2

3
Why Size and Research Your Market?
1. Improve your likelihood of success / reduce risk of failure!
2. Get smarter about your market, customers and product
3. Ensure your time & resources are focused in the right direction
4. Determine most effective way to market to your target audience
5. Make it easier to get funding and resources
3
4
Yet Many Start-ups Don’t Do This Work!
• Most common reasons• Think they already know the answers • Fear the results (market smaller than thought, product not a “hit”)
• Don’t want to have to modify the product slow down launch• Time• Cost – think it will be expensive to do
• Many see market research as a burden
• Net Result:• Many start-ups fail or waste time & money because they misread the market
• Much less costly to do the work than to not do it!
• Easier to adjust product / direction early on than post-launch
4
5
Adopt a Different Mindset / Embrace the Process!• As a Start-up company, you are on a journey• Sizing your Market and Understanding Your Customer
are important steps along the way• They are helpful Sherpas or Guides, not burdens!
5

6
Sizing Your Market Opportunity
6
7
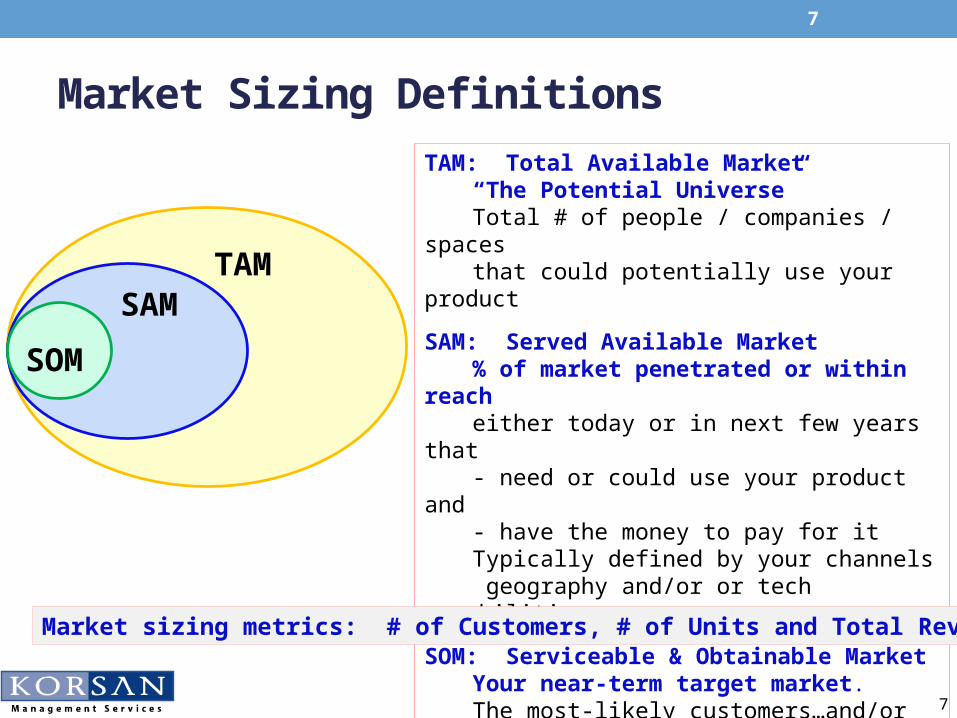
Market Sizing Definitions
SAMTAM
SOM
TAM: Total Available Market“The Potential Universe”Total # of people / companies / spacesthat could potentially use your product
SAM: Served Available Market% of market penetrated or within reach either today or in next few years that- need or could use your product and- have the money to pay for itTypically defined by your channels geography and/or or tech capabilities
SOM: Serviceable & Obtainable MarketYour near-term target market. The most-likely customers…and/or your target share of the market
Market sizing metrics: # of Customers, # of Units and Total Revenues
7

8
Example #1: Projectors
SAMTAM
SOM
TAM: Total Available Market: 50 million unitsAll Conference rooms in businesses + Classrooms /Auditoriums in Education +Movie Theaters +House of Worship facilities +Home “Theaters”
SAM: Served Available Market 20 million60% of Conference rooms80% of Classrooms (K-12 & Univ)100% of Movie Theaters50% of House of Worship3% of Homes
SOM: Serviceable & Obtainable MarketTarget: 10% of SAM = 2 million units and $2 billion (Avg ASP= $1K)
Illustrative Example – All numbers are fictitious8
9
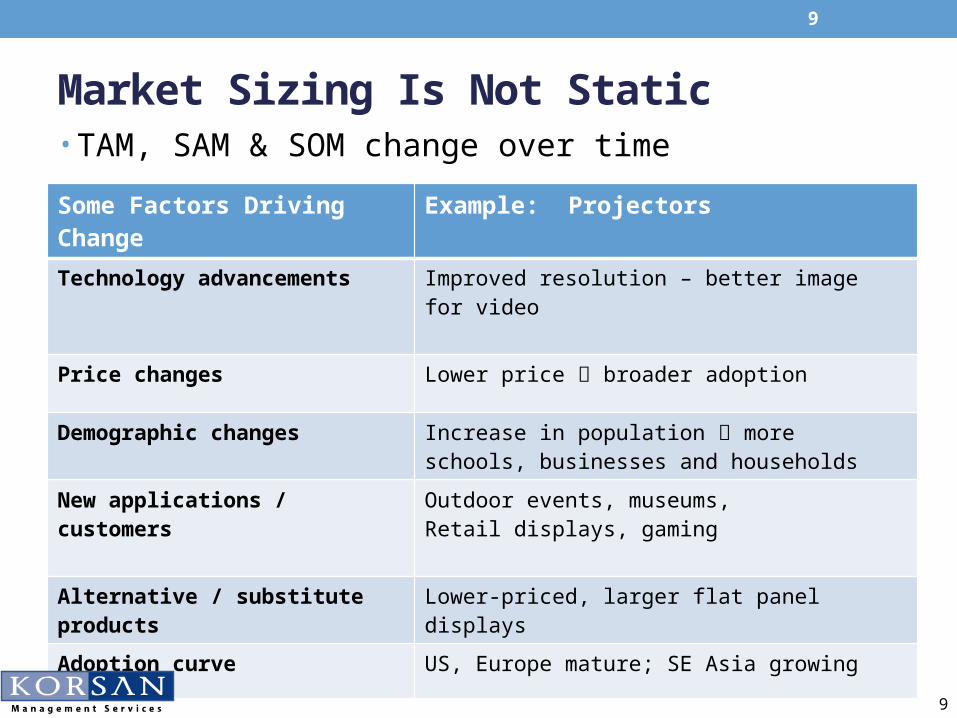
Market Sizing Is Not Static• TAM, SAM & SOM change over time
Some Factors Driving Change Example: ProjectorsTechnology advancements Improved resolution – better image for video
Price changes Lower price broader adoption
Demographic changes Increase in population more schools, businesses and households
New applications / customers Outdoor events, museums,Retail displays, gaming
Alternative / substitute products Lower-priced, larger flat panel displays
Adoption curve US, Europe mature; SE Asia growing
9
10
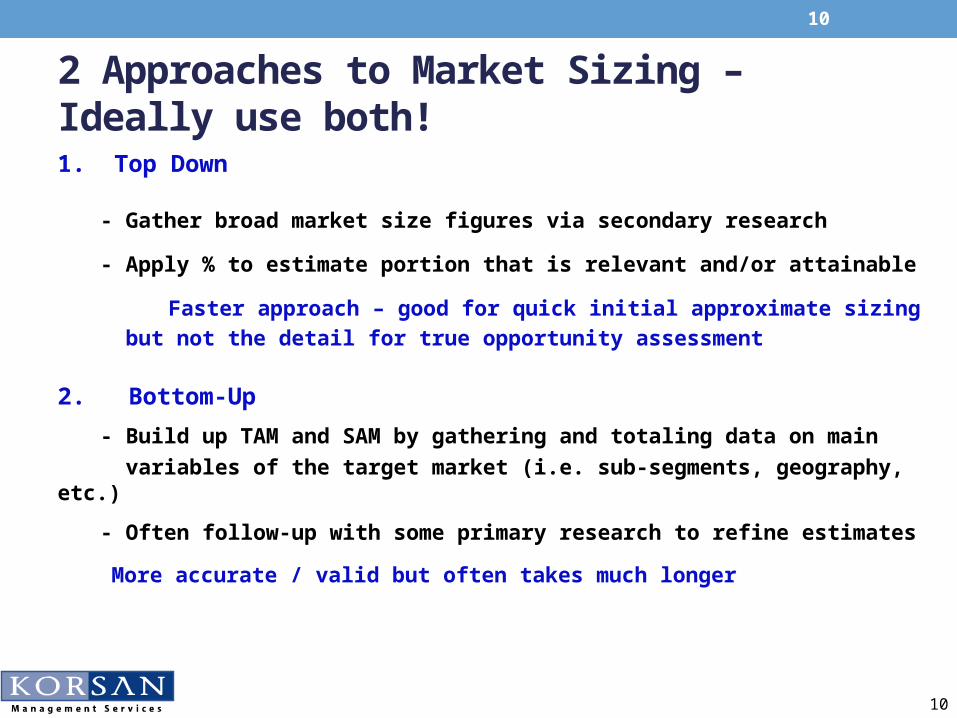
2 Approaches to Market Sizing – Ideally use both!1. Top Down
- Gather broad market size figures via secondary research
- Apply % to estimate portion that is relevant and/or attainable
Faster approach – good for quick initial approximate sizing but not the detail for true opportunity assessment
2. Bottom-Up - Build up TAM and SAM by gathering and totaling data on main variables of the target market (i.e. sub-segments, geography, etc.)
- Often follow-up with some primary research to refine estimates
More accurate / valid but often takes much longer
10
11
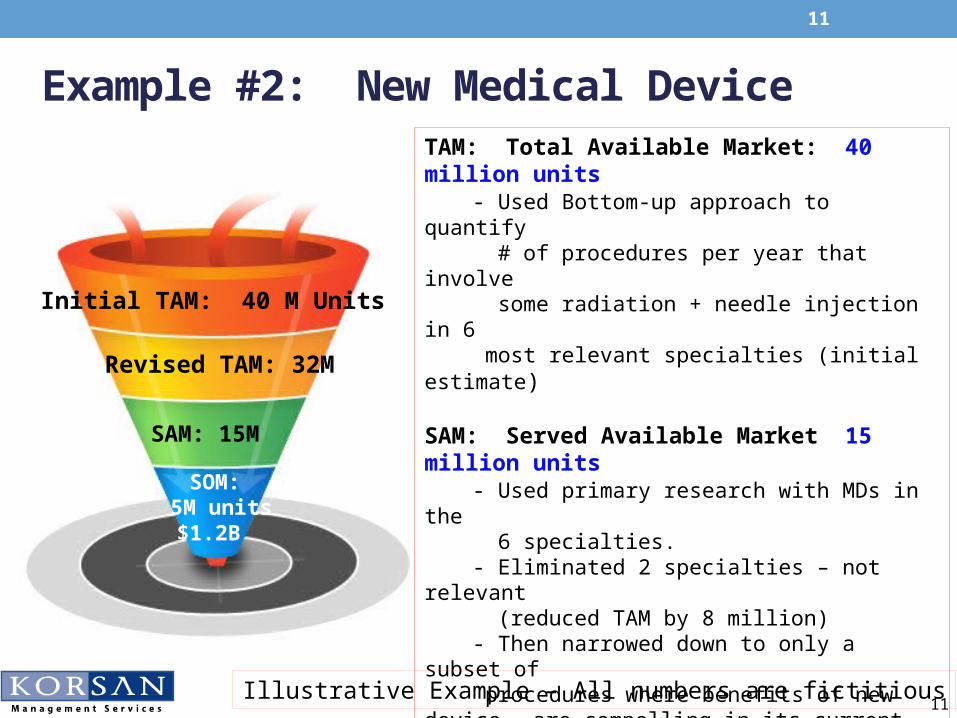
Example #2: New Medical DeviceTAM: Total Available Market: 40 million units
- Used Bottom-up approach to quantify # of procedures per year that involve some radiation + needle injection in 6 most relevant specialties (initial estimate)
SAM: Served Available Market 15 million units- Used primary research with MDs in the 6 specialties. - Eliminated 2 specialties – not relevant (reduced TAM by 8 million) - Then narrowed down to only a subset of procedures where benefits of new device are compelling in its current format
SOM: Serviceable & Obtainable MarketTarget: 40% of SAM = 6 million units and $1.2 billion (Avg ASP= $200)
Initial TAM: 40 M Units
SAM: 15M
SOM: 5M units
$1.2B
Revised TAM: 32M
Illustrative Example – All numbers are fictitious11
12
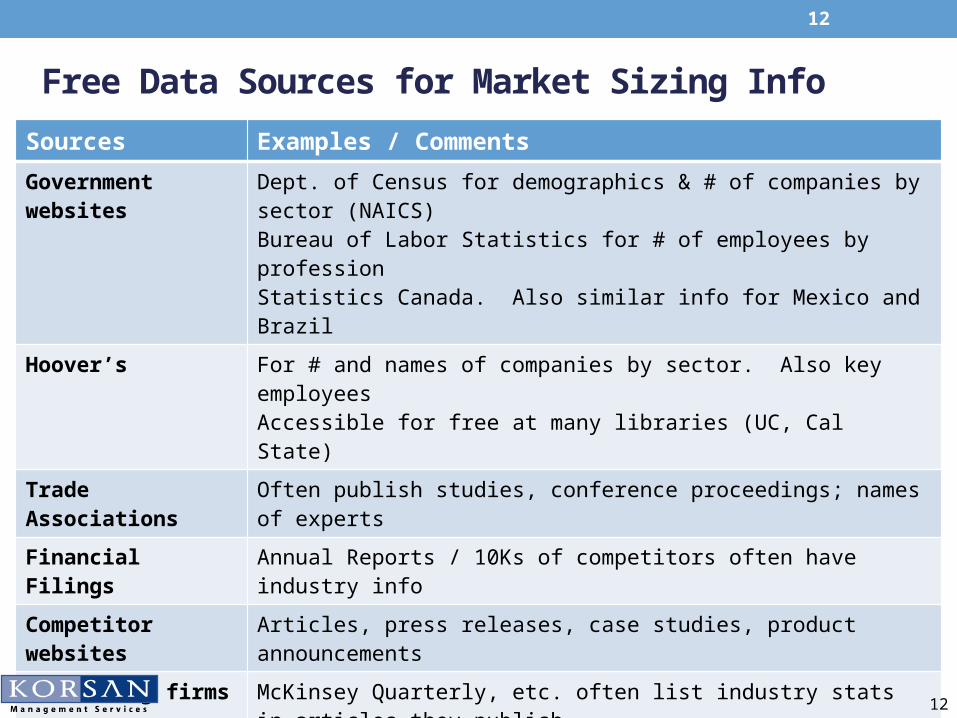
Free Data Sources for Market Sizing Info Sources Examples / CommentsGovernment websites
Dept. of Census for demographics & # of companies by sector (NAICS)Bureau of Labor Statistics for # of employees by professionStatistics Canada. Also similar info for Mexico and Brazil
Hoover’s For # and names of companies by sector. Also key employeesAccessible for free at many libraries (UC, Cal State)
Trade Associations Often publish studies, conference proceedings; names of experts
Financial Filings Annual Reports / 10Ks of competitors often have industry info
Competitor websites Articles, press releases, case studies, product announcements
Consulting firms McKinsey Quarterly, etc. often list industry stats in articles they publish
White Papers From universities, competitors, experts. Useful for Medical & Tech
Fin. Analyst reports May have access via 401K or the library at your alma mater
News articles Especially in business publications (Economist, WSJ, Fortune, etc.)
Mkt Research Co.’s Exec Summary / Samples of reports often give info; Sometimes can buy just individual pages / charts of report.
12
13
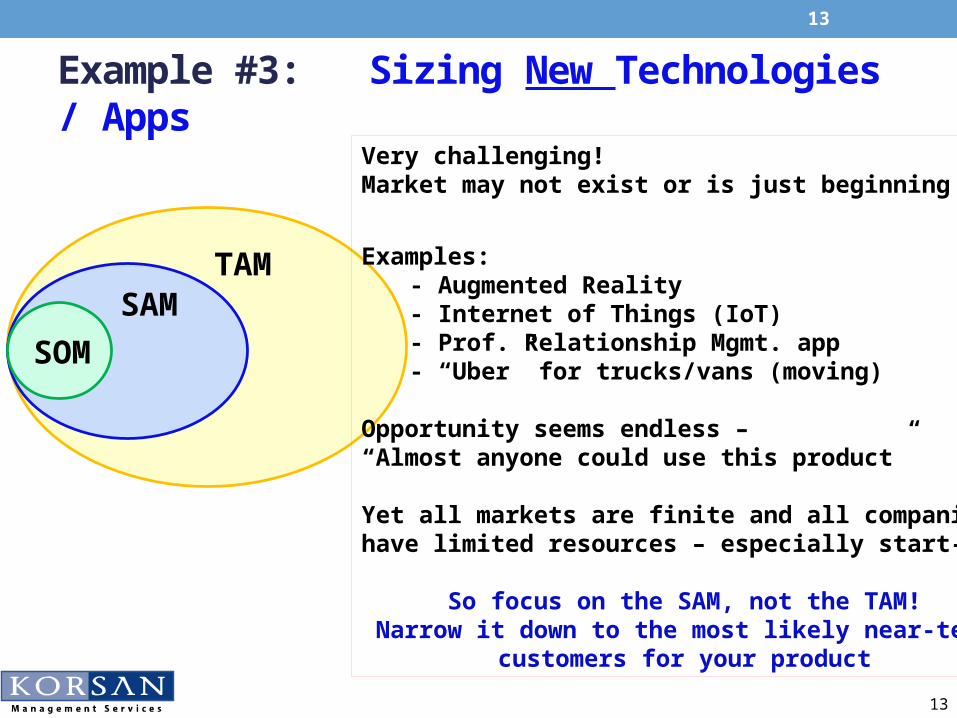
Example #3: Sizing New Technologies / Apps
SAMTAM
SOM
Very challenging!Market may not exist or is just beginning
Examples:- Augmented Reality- Internet of Things (IoT)- Prof. Relationship Mgmt. app- “Uber” for trucks/vans (moving)
Opportunity seems endless –“Almost anyone could use this product”
Yet all markets are finite and all companieshave limited resources – especially start-ups
So focus on the SAM, not the TAM!Narrow it down to the most likely near-term
customers for your product
13
14
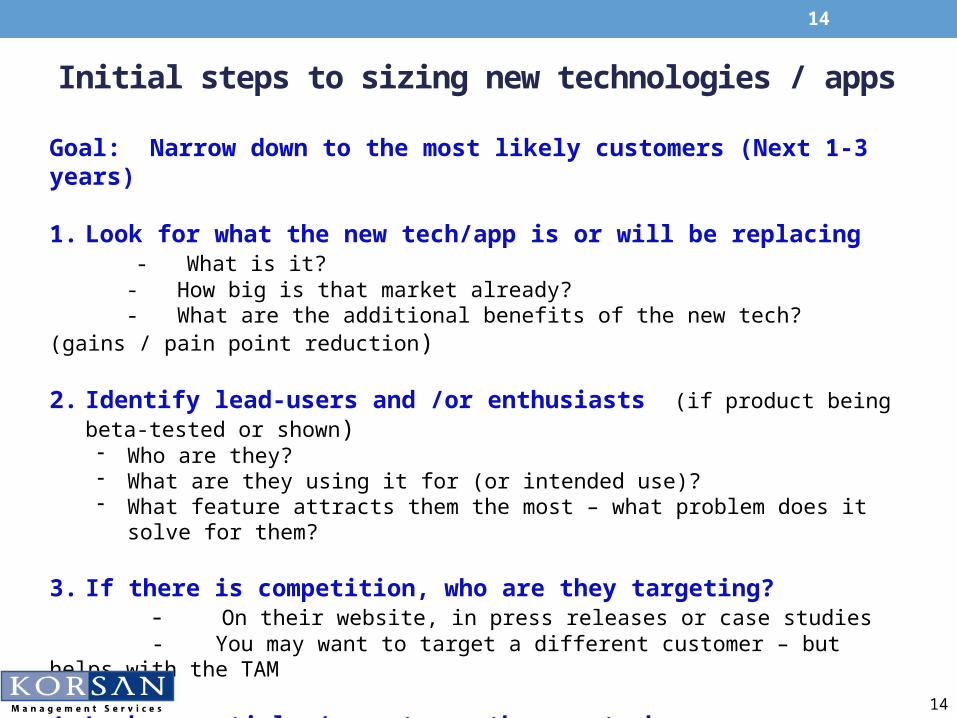
Initial steps to sizing new technologies / appsGoal: Narrow down to the most likely customers (Next 1-3 years)
1. Look for what the new tech/app is or will be replacing - What is it? - How big is that market already? - What are the additional benefits of the new tech? (gains / pain point reduction)
2. Identify lead-users and /or enthusiasts (if product being beta-tested or shown) - Who are they? - What are they using it for (or intended use)?- What feature attracts them the most – what problem does it solve for them?
3. If there is competition, who are they targeting? - On their website, in press releases or case studies - You may want to target a different customer – but helps with the TAM
4. Look up articles/reports on the new tech. - Contact the author to get additional insights / early applications
14
15
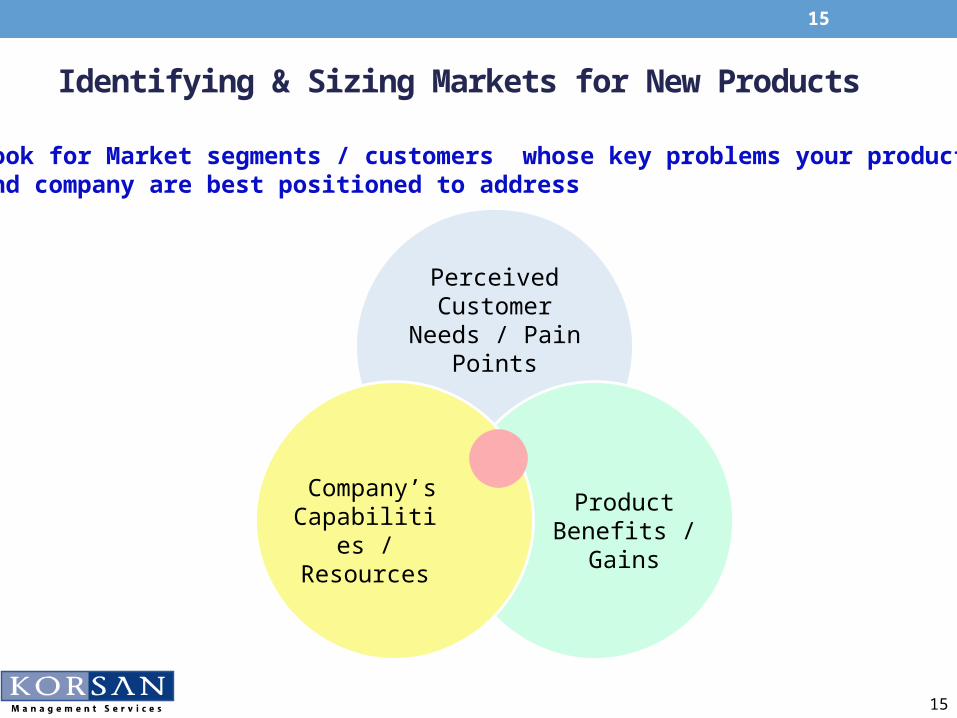
Identifying & Sizing Markets for New Products
Perceived Customer Needs
/ Pain Points
Product Benefits /
Gains
Company’s Capabilities / Resources
Look for Market segments / customers whose key problems your productand company are best positioned to address
15
16
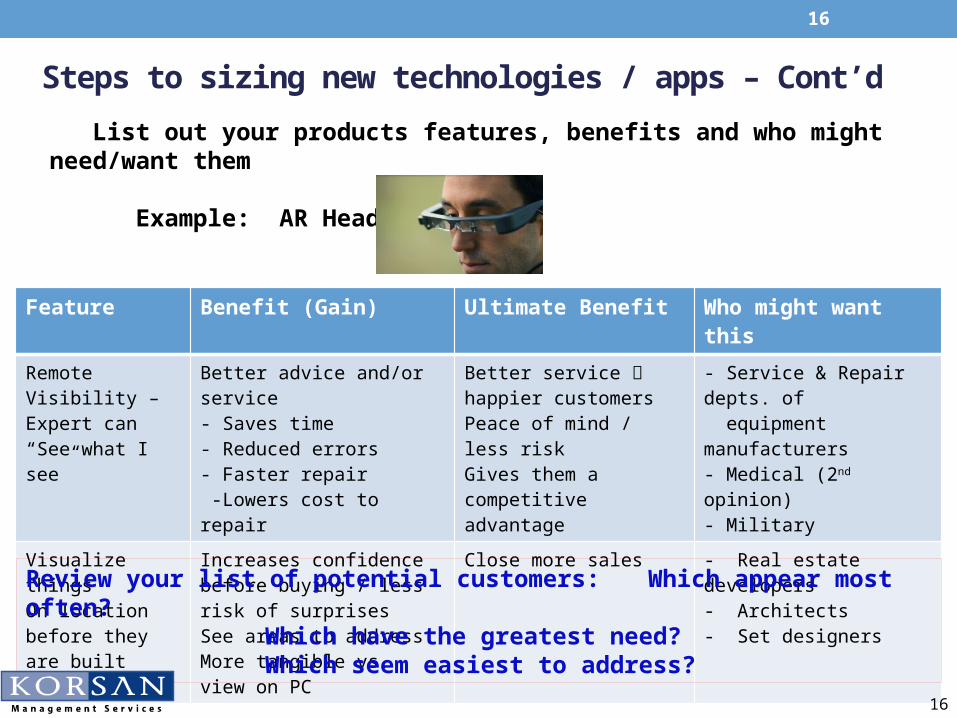
List out your products features, benefits and who might need/want them Example: AR Headsets
Steps to sizing new technologies / apps – Cont’d
Feature Benefit (Gain) Ultimate Benefit Who might want thisRemote Visibility – Expert can “See what I see”
Better advice and/or service - Saves time- Reduced errors - Faster repair -Lowers cost to repair
Better service happier customersPeace of mind / less riskGives them a competitive advantage
- Service & Repair depts. of equipment manufacturers- Medical (2nd opinion)- Military
Visualize thingsOn location before they are built
Increases confidence before buying / less risk of surprisesSee areas to addressMore tangible vs. view on PC
Close more sales - Real estate developers- Architects- Set designers
Review your list of potential customers: Which appear most often? Which have the greatest need?Which seem easiest to address?
16
17
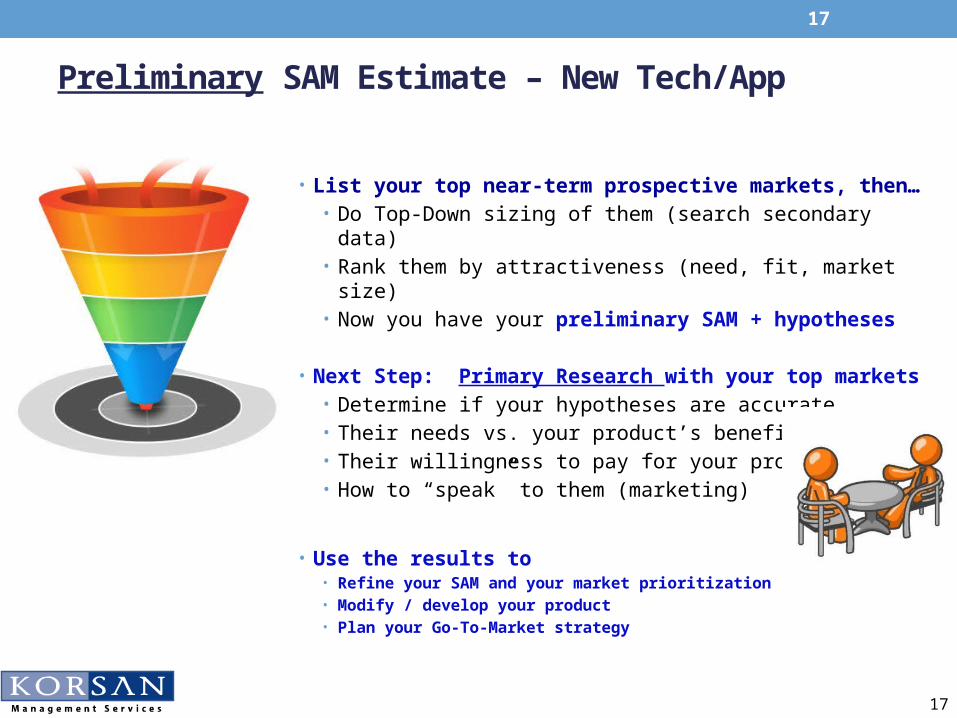
• List your top near-term prospective markets, then…• Do Top-Down sizing of them (search secondary data)• Rank them by attractiveness (need, fit, market size)• Now you have your preliminary SAM + hypotheses
• Next Step: Primary Research with your top markets• Determine if your hypotheses are accurate• Their needs vs. your product’s benefits• Their willingness to pay for your product• How to “speak” to them (marketing)
• Use the results to• Refine your SAM and your market prioritization• Modify / develop your product• Plan your Go-To-Market strategy
Preliminary SAM Estimate – New Tech/App
17

18
Researching Your Potential Customers
18
19
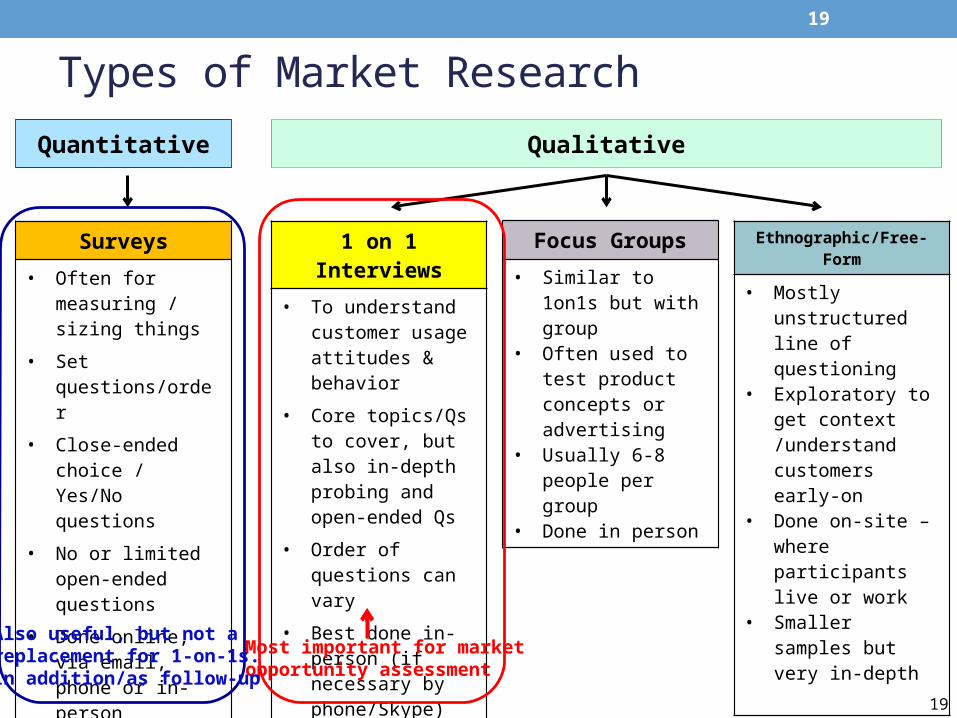
Types of Market Research
Surveys• Often for measuring
/ sizing things • Set questions/order• Close-ended choice
/ Yes/No questions• No or limited open-
ended questions• Done online, via
email, phone or in-person
• Often large samples so results are projectable
1 on 1 Interviews• To understand
customer usage attitudes & behavior
• Core topics/Qs to cover, but also in-depth probing and open-ended Qs
• Order of questions can vary
• Best done in-person (if necessary by phone/Skype)
• Typically smaller samples
Focus Groups• Similar to 1on1s but
with group• Often used to test
product concepts or advertising
• Usually 6-8 people per group
• Done in person
Ethnographic/Free-Form
• Mostly unstructured line of questioning
• Exploratory to get context /understand customers early-on
• Done on-site – where participants live or work
• Smaller samples but very in-depth
Quantitative Qualitative
Most important for marketopportunity assessment
Also useful, but not areplacement for 1-on-1s.In addition/as follow-up
19
20
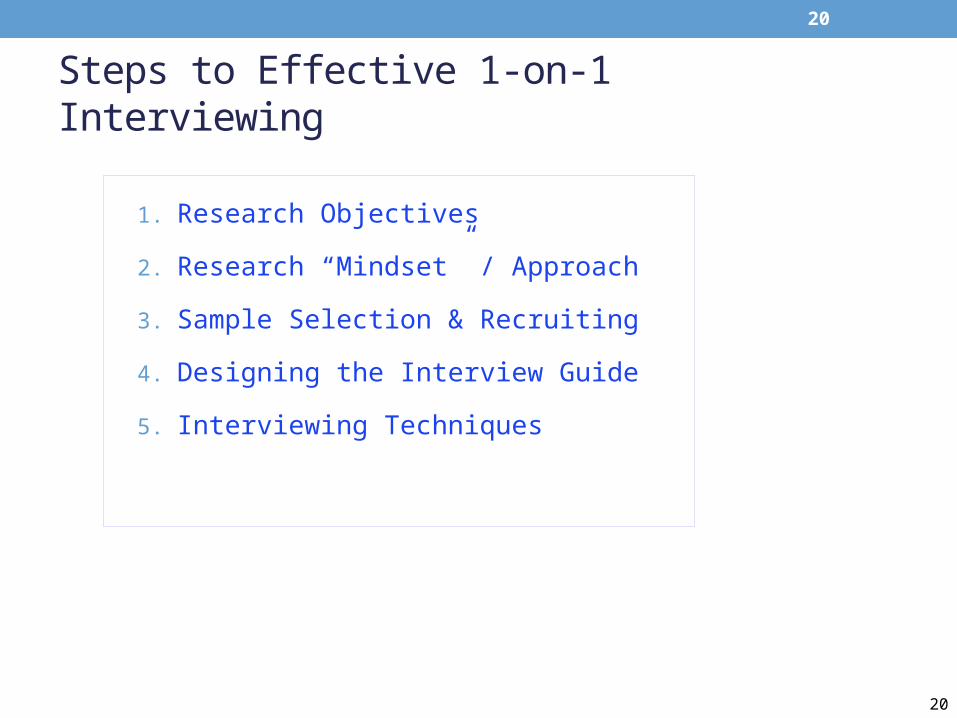
Steps to Effective 1-on-1 Interviewing
1. Research Objectives
2. Research “Mindset” / Approach
3. Sample Selection & Recruiting
4. Designing the Interview Guide
5. Interviewing Techniques
20

21
Research Objectives• Determine what it is you need to know – write it down!
• Prioritize the most critical info vs. secondary/“nice-to-know” info • Tip: Imagine research is done – what do you know now and how will you use it.
Example:
CRITICAL NICE TO KNOW
• How they do “x” today How much paid for current product
• “Pain point” hypothesis – vaild? Where they bought it
• Perception of new product/app Future purchase location preference
• Likes / dislikes, likelihood to seriously consider it Like it more if case color was blue?
• Price they’d be willing to pay
• Who would use it and how often
• Common mistake: trying to cover too much in one research effort• You may have only 10 minutes per interviewee – focus on top priorities!
• Consider doing short survey separately for other / “nice-to-know” questions
21
22
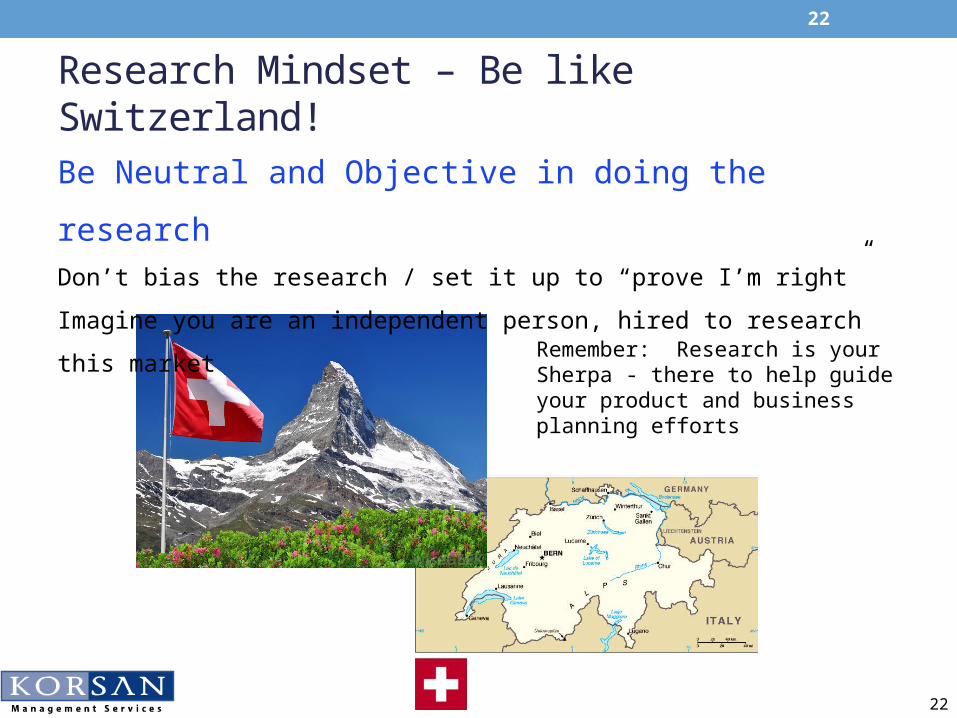
Research Mindset – Be like Switzerland!
Be Neutral and Objective in doing the researchDon’t bias the research / set it up to “prove I’m right”
Imagine you are an independent person, hired to research this market
Remember: Research is your Sherpa - there to help guide your product and business planning efforts
22

23
Research Mindset
Your approach: Be a mindful, observant active listener!!Goal: To understand / see things as they actually are, not as you want them to be
How do target customers think and react? Why?
Does your product meet a need? solve a problem?
If so, is it significant or low priority to them?
Are they willing to pay for your solution?
What motivates them? What worries them?
23
24
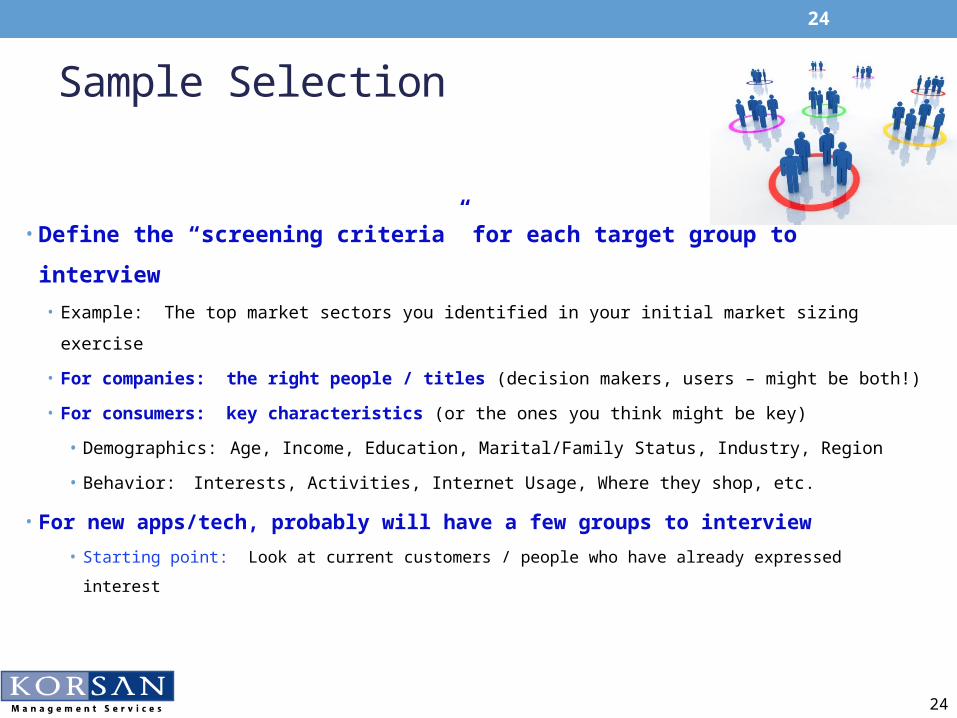
Sample Selection
• Define the “screening criteria” for each target group to interview • Example: The top market sectors you identified in your initial market sizing exercise
• For companies: the right people / titles (decision makers, users – might be both!)
• For consumers: key characteristics (or the ones you think might be key)
• Demographics: Age, Income, Education, Marital/Family Status, Industry, Region
• Behavior:Interests, Activities, Internet Usage, Where they shop, etc.
• For new apps/tech, probably will have a few groups to interview• Starting point: Look at current customers / people who have already expressed interest
24
25
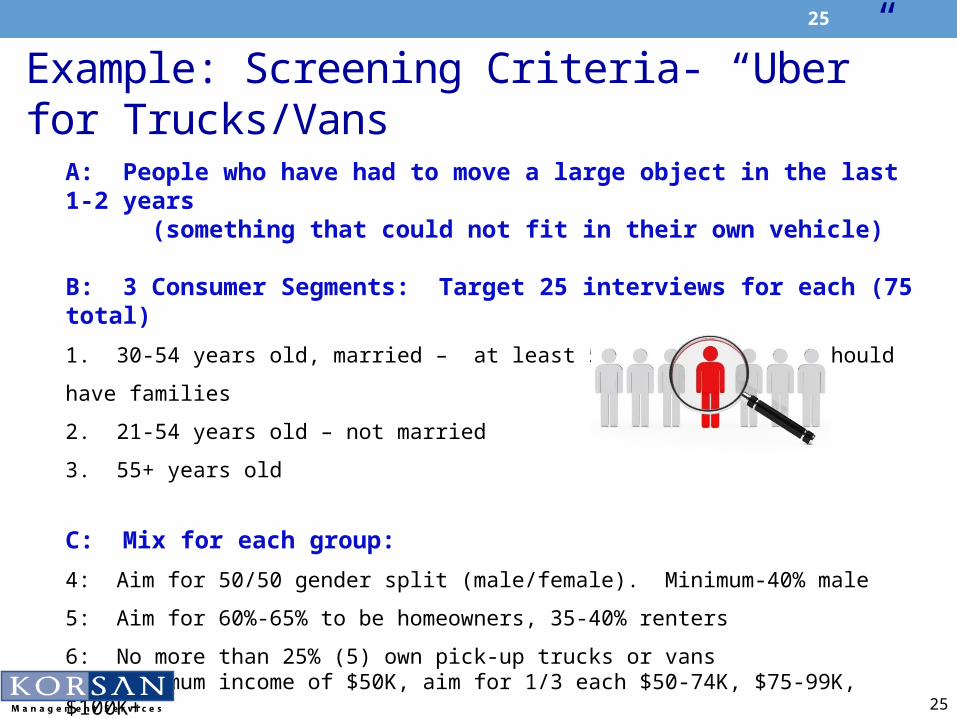
Example: Screening Criteria- “Uber” for Trucks/Vans
A: People who have had to move a large object in the last 1-2 years (something that could not fit in their own vehicle)
B: 3 Consumer Segments: Target 25 interviews for each (75 total)1. 30-54 years old, married – at least 50% of these (10) should have families
2. 21-54 years old – not married
3. 55+ years old
C: Mix for each group:4: Aim for 50/50 gender split (male/female). Minimum-40% male
5: Aim for 60%-65% to be homeowners, 35-40% renters
6: No more than 25% (5) own pick-up trucks or vans7: Minimum income of $50K, aim for 1/3 each $50-74K, $75-99K, $100K+ (Note – if necessary, drop #7 for seniors – retirees may have no/little income)
25

26
Sample Recruiting
• Identify places to recruit people who fit screening criteria• Examples: - LinkedIn, Hoover’s, Trade Association lists for businesses
- Universities, Shopping Centers, Social Media for broader public
Be sure to get a good cross-section – not all from one location / list
• DON’T recruit friends, family members or co-workers – bias!!• For business, ok to ask friends for leads/contacts at target companies – door opener
• Develop “pitch” with relevant hook to get people to participate • Examples: Share topline summary when research done if participate (business)
• Get to see new technology / app not out on the market; “help a local start-up”
• Be clear that this is research only – not selling, not sharing info!• Assure them interview will be brief and info will remain strictly confidential
26
27
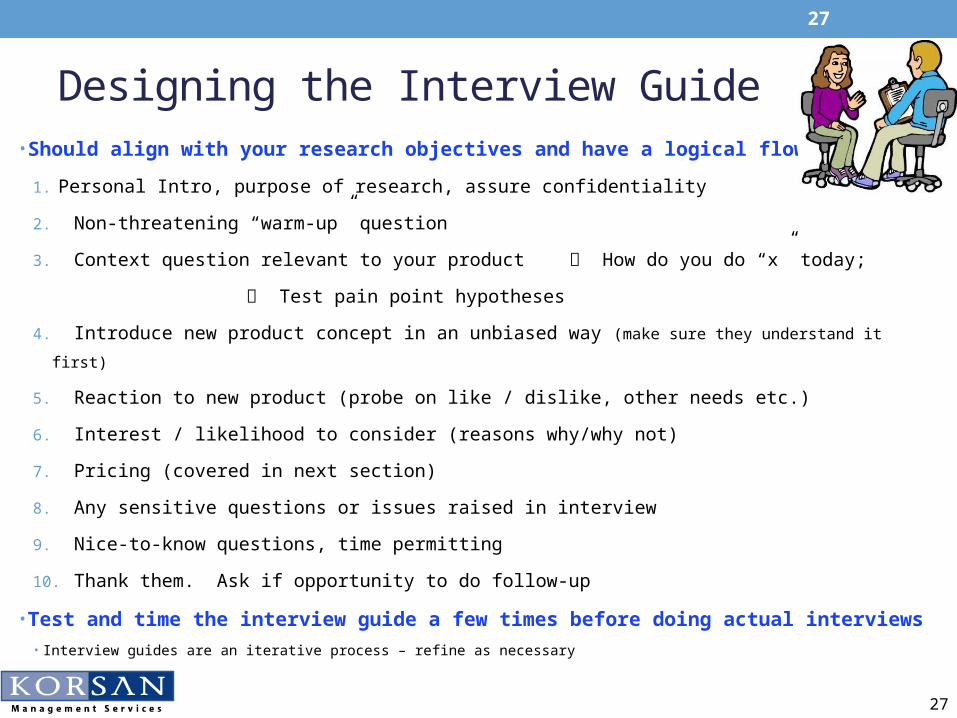
Designing the Interview Guide• Should align with your research objectives and have a logical flow
1. Personal Intro, purpose of research, assure confidentiality
2. Non-threatening “warm-up” question
3. Context question relevant to your product How do you do “x” today;
Test pain point hypotheses
4. Introduce new product concept in an unbiased way (make sure they understand it first)
5. Reaction to new product (probe on like / dislike, other needs etc.)
6. Interest / likelihood to consider (reasons why/why not)
7. Pricing (covered in next section)
8. Any sensitive questions or issues raised in interview
9. Nice-to-know questions, time permitting
10. Thank them. Ask if opportunity to do follow-up
• Test and time the interview guide a few times before doing actual interviews• Interview guides are an iterative process – refine as necessary
27
28
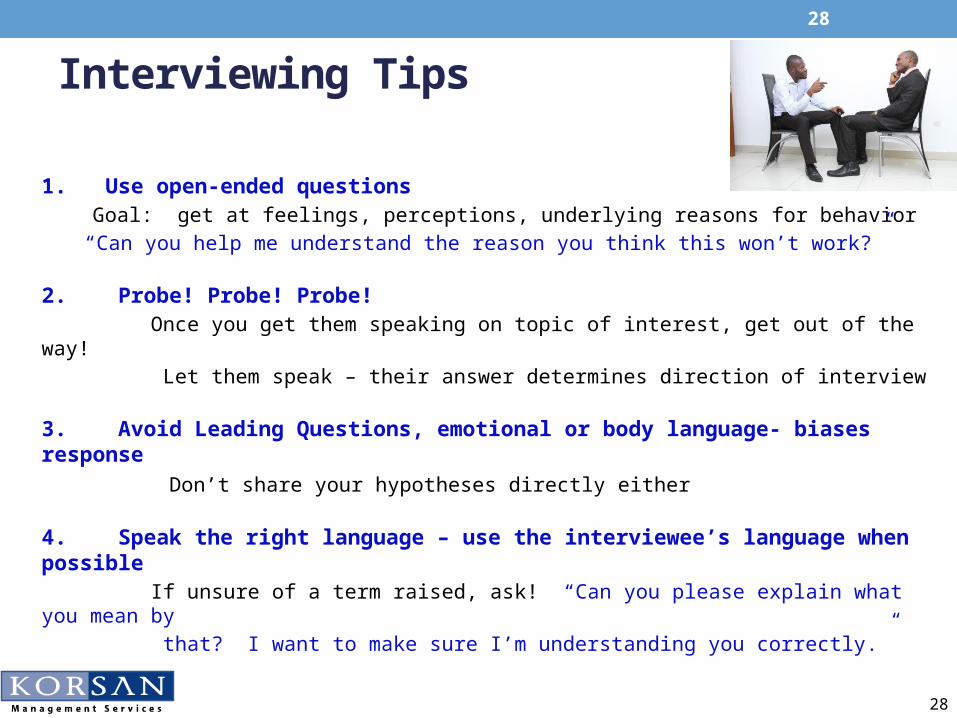
Interviewing Tips
1. Use open-ended questionsGoal: get at feelings, perceptions, underlying reasons for behavior
“Can you help me understand the reason you think this won’t work?”
2. Probe! Probe! Probe! Once you get them speaking on topic of interest, get out of the way! Let them speak – their answer determines direction of interview
3. Avoid Leading Questions, emotional or body language- biases response Don’t share your hypotheses directly either
4. Speak the right language – use the interviewee’s language when possible If unsure of a term raised, ask! “Can you please explain what you mean by that? I want to make sure I’m understanding you correctly.”
28
29
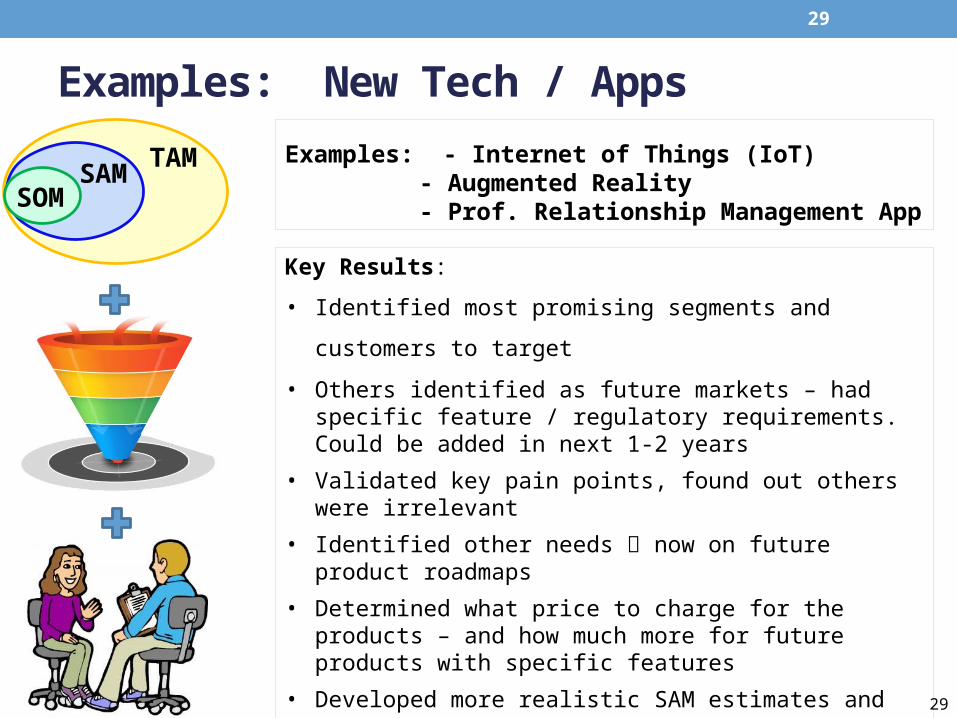
Examples: New Tech / Apps
SAM TAMSOM
Examples: - Internet of Things (IoT) - Augmented Reality - Prof. Relationship Management App
Key Results:
• Identified most promising segments and customers to target
• Others identified as future markets – had specific feature / regulatory requirements. Could be added in next 1-2 years
• Validated key pain points, found out others were irrelevant• Identified other needs now on future product roadmaps• Determined what price to charge for the products – and how
much more for future products with specific features• Developed more realistic SAM estimates and SOM targets
• PRM App client able to raise next round of financing due to better understanding and sizing of market• Determined best marketing vehicles to reach targets
29

30
Determining The Price for Your Product
30

31
Thoughts & Approach to Determining Price
• Premise: You want to charge the maximum price that the market will bear• Key: Determining what value customers associate with your product
• Also determining what is their current “reference” price point?• What did they pay for a comparable product / substitute to yours?
(or however they “solve” that problem today)
• How you ask pricing questions during research matters. Do NOT….• Tell the price you plan to charge and ask if they would buy it or if they think it is a good price
• Ask pricing questions early on in the research
• Recommended Approach: The Van Westendorp Pricing Model• Developed in 1976 by Dutch Economist Peter Van Westendorp
• Involves asking 4 open-ended questions tying price and quality
31
32
Van Westendorp Price Sensitivity Questions
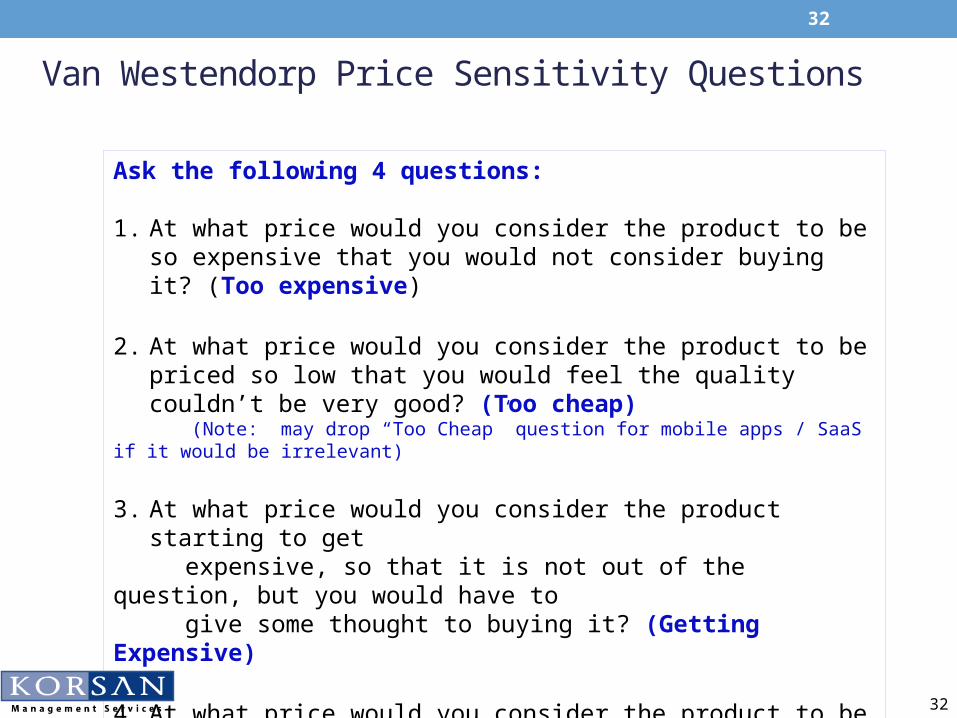
Ask the following 4 questions:
1. At what price would you consider the product to be so expensive that you would not consider buying it? (Too expensive)
2. At what price would you consider the product to be priced so low that you would feel the quality couldn’t be very good? (Too cheap)
(Note: may drop “Too Cheap” question for mobile apps / SaaS if it would be irrelevant)
3. At what price would you consider the product starting to get expensive, so that it is not out of the question, but you would have to give some thought to buying it? (Getting Expensive)
4. At what price would you consider the product to be a bargain—a great buy for the money? (Good Value)
32

33
Van Westendorp Graph - Example%
of R
espo
nden
ts
Price - $
(Question the Quality)
(Getting Expensive)
(Good Value)
33
34
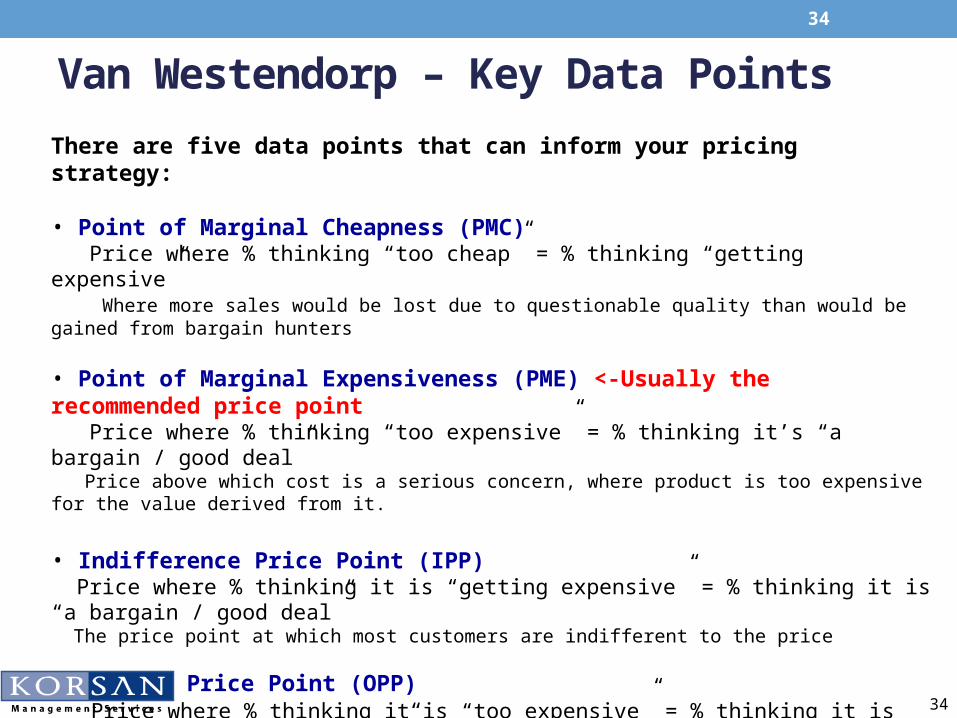
Van Westendorp – Key Data PointsThere are five data points that can inform your pricing strategy:
• Point of Marginal Cheapness (PMC) Price where % thinking “too cheap” = % thinking “getting expensive” Where more sales would be lost due to questionable quality than would be gained from bargain hunters
• Point of Marginal Expensiveness (PME) <-Usually the recommended price point Price where % thinking “too expensive” = % thinking it’s “a bargain / good deal” Price above which cost is a serious concern, where product is too expensive for the value derived from it.
• Indifference Price Point (IPP) Price where % thinking it is “getting expensive” = % thinking it is “a bargain / good deal” The price point at which most customers are indifferent to the price
• Optimal Price Point (OPP) Price where % thinking it is “too expensive” = % thinking it is “too cheap/question quality” Name is misleading – not usually the optimal price for the product
• Range of Acceptable Prices: Price range between Point of Marginal Cheapness and Point of Marginal Expensiveness
34

35%
of R
espo
nden
ts
Price - $
Van Westendorp – Example 2
Recommended Price Point
(Getting)
(Good Deal)
35
Recommended