J. Mater. Environ. Sci. 5 (2) (2014) xxx-xxx Shehdeh et al.
ISSN: 2028-2508
CODEN: JMESCN
1
Adsorption and Kinetics Study of Abamectin and Imidacloprid in
Greenhouse Soil in Palestine
Shehdeh Jodeh1*
, Osamah Khalaf1, M. Haddad
2, Ahmad Abu Obaid
1, Belkheir
Hammouti3, Taibi B. Hadda
4, W. Jodeh
5, Warad
1
1 Department of Chemistry, AN-Najah National University, P. O. Box 7, Nablus, State of Palestine.
2 DepartmWater and Environment Institute, AN-Najah National University, P. O. Box 7, Nablus, State of Palestine.
3LCAE-URAC18, Faculty of Sciences, University Mohammed I
er, Oujda-60000, Morocco.
4Laboratoire LCM, Faculty of Sciences, University Mohammed 1
er, Oujda-60000, Morocco.
5 Department of Medicine, AN-Najah National University, P. O. Box 7, Nablus, State of Palestine.
Received 6 Nov 2013, Revised Nov 2013, Accepted 2013
* Corresponding Author: E-mail: [email protected], .
Abstract Imidaclopid and abamectin are the most pesticides used in Palestine for agricultural purpose. Those pesticides released
some amount to the soil and this will affect both soil and groundwater. Results indicate that the highest percentage of
imidacloprid and abamectin removal was 13.4 % and 7.5 % respectively when adsorbent dosage was 3.0 g. At low pH of
1.5 the percentage of imidacloprid removal increases reached to 12.3 %, but the decrease of imidacloprid removal at high
pH of 12 is highly extreme reached to 7.3 % . At high pH "12" the percentage of abamectin removal increases reached to
14.4 %, but the lowest percentage of abamectin removal at pH 7 reached to 9.1 %. The effect of temperature on adsorption
by soil has also been investigated in the range of 15–47°C.
The investigation of adsorption behavior of the two pesticides on soil, was studied using both Langmuir and Freundlich
isotherms were used to explain equilibrium adsorption, from these isotherms it was evaluated that Langmuir isotherm was
obeyed well.
Keywords: Abamectin, Imidacloprid, Adsorption, Pesticides, Residue
1. Introduction Abamectin is the common name for avermectin B1, a naturally occurring miticide/insecticide,
derived from the soil microorganism, Strewtomvces avermitilis [1]. The pesticidal activity of
abamectin is related to the interaction with the nerve transmitter, gamma aminobutyric acid [2]. A
breakdown product (a delta 8,9-isomer) of abamectin is formed in plants by a reaction with sunlight,
and this compound has similar toxicological properties as abamectin. Imidacloprid is a systemic,
chloronicotinoid insecticide, which kills insects via ingestion or contact. It is effective by disrupting
the nervous system of an insect pest. It is used for controlling sucking insects, soil insects, termites,
and some chewing insects. It is applied as a seed and soil treatment, crop and structural treatment,
and a topical flea control treatment on domestic pets [1-3].
Pesticide residue refers to the pesticides that may remain on or in food after they are applied to food
crops [3]. Many of these chemical residues, especially derivatives of chlorinated pesticides, exhibit
bioaccumulation which could build up to harmful levels in the body as well as in the environment
[4].
Environmental exposure of humans to agrichemicals is common and results in both acute and
chronic health effects, including acute and chronic neurotoxicity (insecticides, fungicides,
fumigants), lung damage, chemical burns, and infant methemoglobinemia (nitrate in groundwater). A
variety of cancers also have been linked to exposure to various pesticides, particularly hematopoietic
cancers [4].
Sorption-desorption processes are important in determining the fate and distribution of
agrochemicals in the soil/water environment because they determine the amount of pesticide that can
J. Mater. Environ. Sci. (Y) (2014) xxx-xxx Warad et al.
ISSN: 2028-2508
CODEN: JMESCN
2
reach the target organism and the amounts that can be volatilized, degraded, or leached. While
sorption is affected by the physical and chemical properties of the pesticide and soil, it also appears
that sorption may be affected by the residence time in the soil [5].
The high molecular weight of the AVMs (>800 daltons) leads liquid chromatography as the most
suitable chromatographic technique for determination. Liquid chromatographic methods using
ultraviolet (UV) detection and fluorescence detection for the AVMs residue in different kind samples
were reported. So, HPLC with fluorescence detection following a fluorescent derivatization of the
parent compounds using trifluoroacetic acid and a basic catalyst has been a common analytical
method for monitoring ABM residues in tissue, milk, fruits, and vegetables [6-10]. In this study a
soil sample was collected from greenhouse used for growing vegetables and adsorption models like
Freuindlich and Langmuir were applied using the HPLC and UV-Vis techniques. Also,a set of goals
and most important of which is to understand the mobility and kinetics of the adsorption of those two
pestecides by greenhouse soil. Several factors studied like the effect of contact time, pH, temperature
and other.
2. Experimental 2.1. Chemicals
All chemicals and solvents which used in these experiments were very pure and purchased from
Aldrich, Germany.
Pesticide standards of abamectin, imidacloprid, and and other reagents were analytical grades
(Wako). Water was purified with a Milli-Q SP TOC system (Nippon Millipore, Tokyo, Japan). Stock
solutions were equally mixed and diluted with methanol to make spiking mixture and working
standard solutions. Standard solutions were stored at 4 ᴼC in the dark.
Appropriate volumes of the standard stock solution were added to dilution water to obtain the desired
concentrations.
For each pesticide experiment five calibration concentrations and a control in two replicates were
made. Astraight calibration curves were obtained with R2 = 0.995.
2.2 Soil Analysis
One kilogram of soil sample was collected from a greenhouse used for growing vegetables weighted accurately,
sieved in 2.0 mm sieve, and dried at 105 ºC. Before any treatment with pesticides. Several tests were conducted
on soil and shown in Table 1.
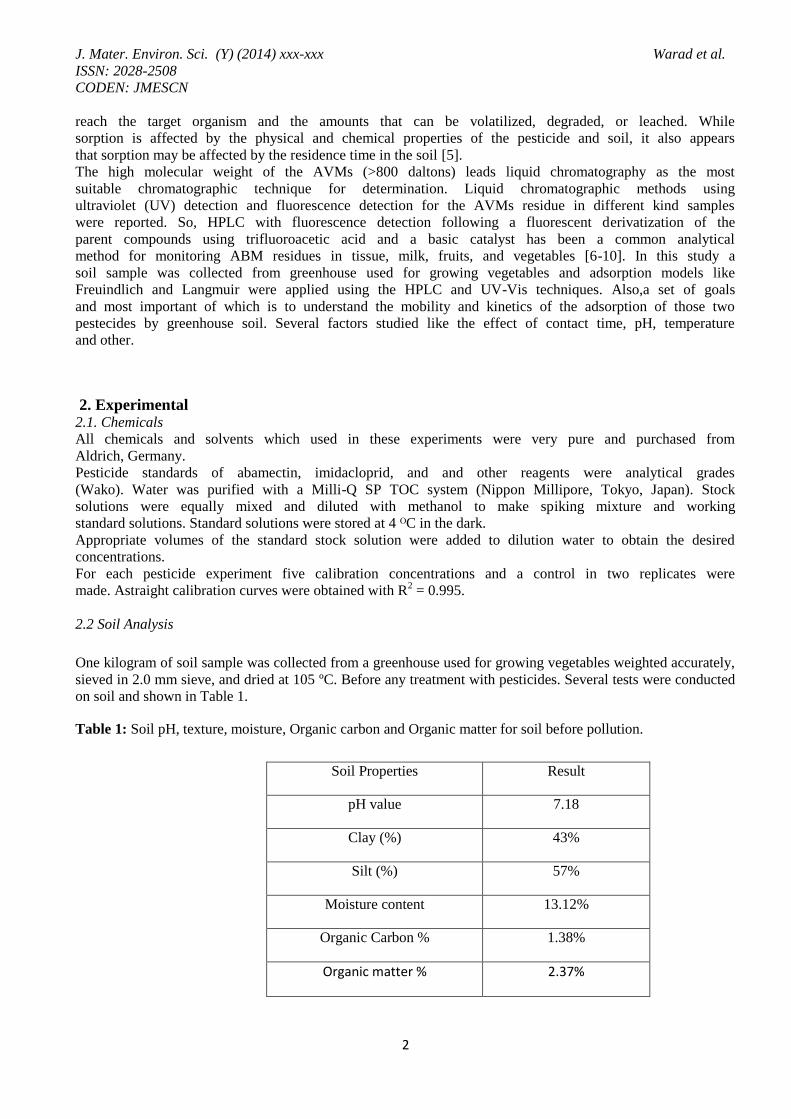
Table 1: Soil pH, texture, moisture, Organic carbon and Organic matter for soil before pollution.
Result Soil Properties
7.18 pH value
43% Clay (%)
57% Silt (%)
13.12% Moisture content
1.38% Organic Carbon %
2.37% Organic matter %

J. Mater. Environ. Sci. (Y) (2014) xxx-xxx Warad et al.
ISSN: 2028-2508
CODEN: JMESCN
3
2.3 Adsorption
2.3.1 Adsorption onto Soil
Adsorption: is the phenomenon of attraction or adhesion of solute molecules to the surface of soil particles at an
interface between two phases which can be solid –liquid. The driving force for adsorption result from specific
affinity of solute to the soil where the atoms at the solid surface subjected to unbalanced force of attraction , so
adsorption is essentially a surface phenomenon [11].
In this study two pesticides were selected, imidacloprid (konfidor®) as an insecticide and abamectin
(vertimec®) as an acaricide, both the widely used in Palestine according to the ministry of agriculture.
2.3.2 Adsorption Experiments
imidacloprid and abamectin adsorption onto greenhouse soil surfaces was studied by batch experiments.
Experiments were conducted in a set of 100 mL capped conical flasks. All used apparatus were thoroughly
precleaned with distilled water. After the addition of pesticides solution to the soil and the adjustment of the pH
of the solutions, experiments flasks were shaken at 120 rpm using a temperature controlled water bath
(Tuttnauer) with shaker (Burell 75). The flasks were left under continued constant-speed shaking for the desired
time. Initial pH of pesticide solutions, used in adsorption experiments, was adjusted by adding few drops of
dilute solutions of sodium hydroxide or hydrochloric acid as desired. Measurement of pH was performed on a
Jenway pH-meter 3510.
A fresh pestecides stock solution (1000 mg/L of the pesticides) was prepared. From this solution, different
solutions (10-50 mg/L) were prepared by dilution. In each pesticide adsorption experiment, an aliquot (50 mL)
of these solutions was used.
Pesticides concentration was analyzed at the end of each experiment. Each experiment was performed in
duplicate using identical conditions. The amount of adsorption at equilibrium, qe (mg/g), was calculated by the
following equation:
qe = (C0 -Ce)V/W (1)
where C0 and Ce (mg/L) are the liquid-phase concentrations of pesticides initially and at equilibrium,
respectively. V is the volume of the solution (L) and W is the mass of dry adsorbent used (g). The data were
fitted to Langmuir and Freundlich isotherms to evaluate the adsorption parameters.
2.3.3 The Effect of Contact Time on Imidacloprid and Abamectin – Soil Adsorption
The purpose of this task is to determine the effect of contact time on the process of hydrolysis and adsorption of
imidacloprid and abamectin onto soil.
Stock solution of imidacloprid (1000 mg/L) were used as a dsorbate and a solution of
a 50 mL of 15 mg/L was prepared from stock solution. ( 1.5 mL of imidacloprid solution to 100 mL volumetric
flask and filled with distilled water to the mark), then we prepared 7 bottles of 330 mL in size, and we put on
each bottle 50 mL of 15 mg/L solution and was mixed with 1.13 g of oven dried sieved soil, and the pH was
adjusted to 4 at 25 ºC using HCl. The adsorbent and a dsorbate suspension were separated by shaking about 150
minutes and by centrifugation at 3000 rpm for 10 minutes using Hermel Z200A centrifuge. Then the
supernatants were filtered through filter paper and the concentrations were analyzed using UV-1601 PC,
SHIMADZU spectrophotometer at different time ( 10, 30, 60, 90, 150, 184 min) to show the effect of contact
time of their uptake by the adsorbent ( soil ).
To determine the concentrations of the pesticides that adsorbed on soil by subtracted the concentration in the
supernatant solution from the origin one ( 15 mg/L ) then plotted graphs of imidacloprid percent removal versus
time intervals is shown in Fig. 1 and the same procedures were followed for abamectin (Fig. 1) [12].
2.3.4 The Effect of Adsorbent Dosage of Imidacloprid and Abamectin

J. Mater. Environ. Sci. (Y) (2014) xxx-xxx Warad et al.
ISSN: 2028-2508
CODEN: JMESCN
4
On this experiment different amounts of soil (0.5, 1.0, 1.5, 2.0, 2.5, 3.0 g) were placed into bottles, then solution
of 50 ml of 15 mg/L of imidacloprid were added to each bottle and the pH was adjusted to 4. The mixtures were
then shaken for 15 minutes at 25 ºC.
Centrifuging the samples, filtering them using Whatman filter paper " no. 42 " and measuring the concentration
of imidacloprid using spectrophotometer. The same procedures were applied for abamectin and the results are
shown in Fig. 2.
2.3.5 The Effect of pH on Imidacloprid and Abamectin-Soil Adsorption
The pH in the range of 1.5 -12 were studied using a 1.3 g of soil and a 50 mL of 15 mg/L of imidacloprid using
0.1M HCl and 0.1M of NaOH to acidify and make the solution basic. The solutions were shaken for 150
minutes at 25 ºC. Centrifuging the samples, filtering them using Whatman filter papers " no. 42 " and
measuring the concentration of imidacloprid using spectrophotometer [13]. The same study was done for
abamectin and the results is shown in Fig. 3.
2.3.6 Effect of Concentration of Imidacloprid and Abamectin on Soil
A 5 bottles of 330 mL in size, and a different concentration of imidacloprid in each bottle as ( 50, 40, 30, 20 and
10 mg/L ), to each bottle 50 mL of these concentrations were added to 1g of soil, and the pH was adjusted to 4.
The bottles were shaken at 25 ºC for 150 minutes and centrifuge and then filtered. The same thing done for
abamectin and the results are shown in Fig. 4.
2.3.7 The Effect of Temperature on (Imidacloprid and Abamectin ) Soil Adsorption
The purpose of this task is to determine the effect of temperature on the process of hydrolysis and adsorption of
imidacloprid and abamectin onto soil.
A 50 mL (15mg/L) concentration was obtained by diluting the stock solution with distilled water and was mixed
with 1.0 g of oven dried sieved soil in a bottle. The study of adsorption experiments were performed following
the same procedure at 15 ºC, 25 ºC, 37 ºC and 47 ºC. Then the supernatants were filtered through filter paper
and imidacloprid concentration was analyzed using UV-1601 PC, SHIMADZU spectrophotometer. The same
experiment was done for abamectin and the results are shown in Fig. 5.
2.4 Chemical Kinetics
Removal process can be explained by using several kinetics models. In this study both the order of the rate and
the rate constants can be determined from those models. Those constants are significant for designing an
effective process. In this study we used the first and pseudo second order models [14].
2.4.1 Pseudo- First Order Kinetics Model
The simple form of first order model by applying the boundary conditions, qt = 0 at t= 0 and qt = qt at t = t, is
shown in Eq.(2).
tkqqq ete 1ln)ln( (2)
Where k1 is the rate constant, qe is the pesticide equilibrium concentration (mg/g); qt (mg/g) is the amount of
adsorbed pesticides at any time t(min).
2.4.2 Pseudo Second Order Model
The general form of the model is given as Eq.(3).
2
2 )( te qqkdt
dq (3)

J. Mater. Environ. Sci. (Y) (2014) xxx-xxx Warad et al.
ISSN: 2028-2508
CODEN: JMESCN
5
by integration and linearization of Eq. (4) gives:
tqqkq
t
eet
112
2
(4)
In which, k2 is the equilibrium rate constant (g/mg.min) of pseudo-second-order chemical sorption; qe is the
amount of adsorption sorbed at equilibrium (mg /g); qt is the amount of adsorbate sorbed at t (min). The straight
line plots of (t/qt) vs t have been tested to obtain rate parameters [15].
Adsorption kinetics is usually controlled by different mechanisms of which the most general are the diffusion
mechanisms which can be explained by intraparticle diffusion model proposed by Weber and Morris.
Intraparticle diffusion model can be expressed as ,
qt = kit0.5
+A (5)
where ki is the intraparticle diffusion constant and the intercept A reflects the boundary layer effects. The value
of ki will be calculated from the slope of plotting qt vs t0.5
.
3. Results and Discussion
3.1 Soil Tests
Samples of red soil were collected from greenhouse and analyzed in order to evaluate the soil texture, moisture
and pH value. Table 1. shows the results obtained from these tests.
From table 1, it was noticed that the silt percentage is larger than that in the clay. Organic carbon and organic
matter are relatively small (1.38 and 2.37%) which reduced the adsorption of pesticides. Sorption of pesticides
to soil generally increases with soil organic matter content [16].
3.2 The Effect of Contact Time on Imidacloprid and Abamectin Soil Adsorption
Effect of contact time on imidacloprid and abamectin are shown in Fig. 1. As we see from the figure, the first
half-hour has a low percent removal about 1.9 % only, but after about an hour of adsorption the percent removal
rise slowly to reach 6.2 %, either after 90 minutes the percent removal has been reached 6.9 %, and after 150
minutes the percent removal was rises more to about 8.9 %, then equilibrium occurs at about 150 minutes but
after 150 minutes most of the adsorption attained.
Effect of contact time on abamectin are shown in Fig. 1. The figure indicates that abamectin adsorption onto soil
increases when increasing treatment time starting from "0 to 150" minutes and then becomes constant after that
until about 24 hours with percentage removal 15.3 %. The same observation obtained for imidacloprid.

J. Mater. Environ. Sci. (Y) (2014) xxx-xxx Warad et al.
ISSN: 2028-2508
CODEN: JMESCN
6
Figure 1: Effect of contact time on the % removal of pesticides by soil (initial conc.: 15 mg/L, initial pH: 4,
temperature: 25 0C, 1 g soil.
3.3 The Effect of Adsorbent Dosage on Imidacloprid and Abamectin
The effect of adsorbent dosage on imidacloprid was studied, using (0.5, 1.0, 1.5, 2.0, 2.5, 3.0 g soil) at an
adsorption time of 150 min. The results are summarized in Fig. 2.
The percent of imidacloprid removal increased by increasing adsorbent dosage. Adsorption increases up to 13.4
% with adsorbent dosage of (3g/50mL) and 7.8% for abamectin due to increasing adsorbent dosage at fixed imidacloprid and abamectin concentrations provided more available adsorption sites and thus increased the
extent of pesticides removal.
Figure 2: Effect of adsorbent dosage on % of pesticides removal at (initial conc.:15 mg/L, initial pH: 4,
temperature: 25oC and contact time: 150 min.).
3.4 The Effect of pH on Imidacloprid and Abamectin Soil Adsorption

J. Mater. Environ. Sci. (Y) (2014) xxx-xxx Warad et al.
ISSN: 2028-2508
CODEN: JMESCN
7
The extent to which adsorption was influenced by varying pesticide ionization state and aquifer material surface
properties with varying pH will be shown in Fig. 3.
The figure shows that the amount of adsorbed imidacloprid increases at lower pH. At pH of 1.5 to 2.5 the
percent of imidacloprid removal was 14.3 %. At pH 7 the percent of imidacloprid removal was decreased from
14.3 % to 10.8 %, suggesting protonation of the –NH group of the imidazol ring. Then as pH increases to "9"
the percent of imidacloprid removal decreased to 9.3 %, the percent of imidacloprid removal decreased rapidly
at the pH "12" to 7.3 %, that indicates adsorption decreases when pH increases for imidacloprid. Imidacloprid
was found to hydrolyze more rapidly in alkaline water [17]. So hydrolysis of imidacloprid produced the
metabolite 1-[(6-chloro-3-pridinyl)methyl]-2-imidazolidone. This may be further broken down via oxidative
cleavage of the N-C bond between the pyridine and imidazolidine rings [18].
As we noticed from Fig. 3b above that the highest abamectin adsorption at pH acidic and alkaline conditions
with more stable over the pH range 5- 7 . This may be due to the presence of large quantities of OH- ions on the
catalysis surface as well as in the reaction media favors the formation of OH• radical.
Figure 3: Effect of pH pesticide removal at different pH: (initial concentration: 15 mg/L, temperature: 25 oC
and contact time: 150 min).
3.5 Effect of Concentrations of Imidacloprid and Abamectin on Soil
The purpose of this experiment to determine the effect of concentration on the adsorption of imidacloprid.
Concentration of imidacloprid was studied using ( 10-50 mg/L)of the two pesticides. The results are shown in
Fig. 4.
From Fig. 4 it was noticed that when there is lower concentration the sorption became larger. Sorption-
desorption is also concentration-dependent, with higher sorption rates when there is a lower initial concentration
of imidacloprid present, At higher initial concentrations of imidacloprid, sorption is low and desorption is high,
therefore there is a greater potential for mobility with increasing concentration [19]. Imidacloprid adsorption to
soil particles increases as the concentration of the insecticide decreases [20].
From Fig. 4 the abamectin showed that when there is lower concentration for abamectin the sorption became
larger. Sorption-desorption is also concentration-dependent, with higher sorption rates when there is a lower
initial concentration of abamectin present, At higher initial concentrations of abamectin, sorption is low and
desorption is high, therefore there is a greater potential for mobility with increasing concentration.

J. Mater. Environ. Sci. (Y) (2014) xxx-xxx Warad et al.
ISSN: 2028-2508
CODEN: JMESCN
8
Figure 4: Effect of imidacloprid concentration onto percentage removal in soil at different concentrations,
initial pH: 4, temperature: 25 ºC and contact time: 150 min).
3.6 The Effect of Temperature on (Imidacloprid and Abamectin) Soil Adsorption
The effect of temperature on imidacloprid adsorption onto soil was investigated in the range 15-47 ᴼC and the
results are shown in Fig. 5. From the figure we notice that the percentage removal of imidacloprid increases
with increasing temperature up to 37 ºC , then return to decrease, so the optimum degree for imidacloprid
removal is about 37 ºC reached to 48% percentage removal, and at 47 ºC the percentage removal reached
about 34%. As we noticed from Fig. 5b, the percentage removal of abamectin increases with increasing
temperature, so the optimum degree for abamectin removal about 47 ºC reached to 41%.
0
10
20
30
40
50
60
0 10 20 30 40 50 60
% o
f P
esti
cid
e R
emoval
Temperature (oC)
(a) Imidacloprid (b) Abamectin
Figure 5: Effect of temperature on percentage removal of pesticide by soil at different temperatures (initial
concentration: 15 mg/L, pH: 4 and contact time: 150 min).
3.7 kinetic Adsorption Study
3.7.1 Pseudo first order model

J. Mater. Environ. Sci. (Y) (2014) xxx-xxx Warad et al.
ISSN: 2028-2508
CODEN: JMESCN
9
First order rate constant was calculated by Equation (1). This model was not followed by adsorption of
imidacloprid and abamectin. The results are shown in Fig 6a and b.
Figure 6: Kinetics of pesticides removal according to the pseudo-first-order model by soil at (initial conc: 15
mg/L, initial pH: 4, temperature: 25oC and solid/liquid ratio 1.0 g/50 mL).
3.7.2 Pseudo second order model
Second order rate constant was calculated by Equation (4). The plot of t/qt versus t had shown straight line with
R2 value 0.988 and 0.99 for imidacloprid and abamectin respectively, as shown in Fig. 7. From the figure it was
concluded that kinetic adsorption of imidacloprid and abamectin had closely correlated with pseudo second
order model [21]. On the other hand, qe (exp) values for the first-order-rate expression do not agree with the
calculated ones obtained from the linear plots. In contrast, qe (calc) values for the second-order-model are close
to qe (exp) for both adsorbents which suggest the process of adsorption is chemisorption. In chemisorption
process, the pseudo second order is superior to pseudo-first order model because it deals with interaction of
adsorbent-adsorbate through their valency forces [22].
The correlation coefficients and other parameters calculated for the Pseudo - first-order model and pseudo-
second-order model are listed in Table 2. From the table, it is clear that the correlation coefficient values (R2) of
the pseudo-second order model for imidacloprid and abamectin greater than those obtained for the pseudo-first
order model.
J. Mater. Environ. Sci. (Y) (2014) xxx-xxx Warad et al.
ISSN: 2028-2508
CODEN: JMESCN
01
y = 0.1929x + 17.614
R² = 0.988
y = 0.1548x + 9.0909
R² = 0.99
0
10
20
30
40
50
60
0 50 100 150 200
t /
qt
Time (min)
(a) Imidacloprid (b) Abamectin
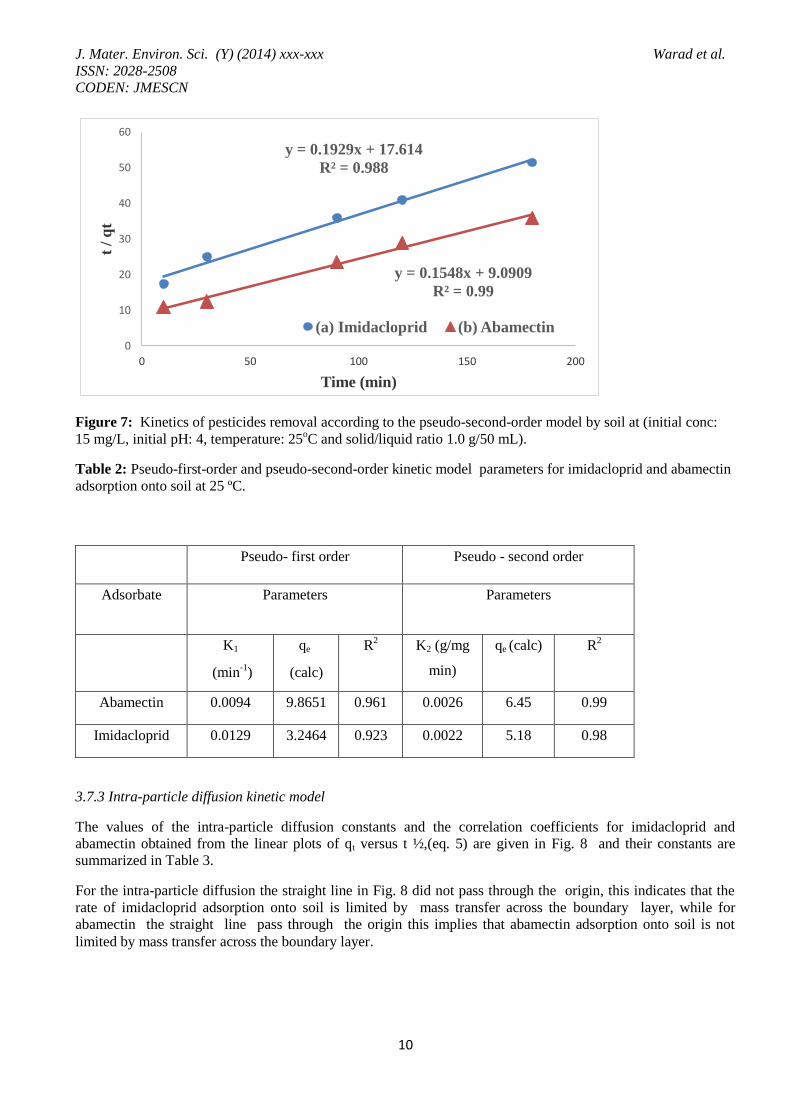
Figure 7: Kinetics of pesticides removal according to the pseudo-second-order model by soil at (initial conc:
15 mg/L, initial pH: 4, temperature: 25oC and solid/liquid ratio 1.0 g/50 mL).
Table 2: Pseudo-first-order and pseudo-second-order kinetic model parameters for imidacloprid and abamectin
adsorption onto soil at 25 ºC.
Pseudo- first order Pseudo - second order
Adsorbate Parameters Parameters
K1
(min-1
)
qe
(calc)
R2
K2 (g/mg
min)
qe (calc) R2
Abamectin 0.0094 9.8651 0.961 0.0026 6.45 0.99
Imidacloprid 0.0129 3.2464 0.923 0.0022 5.18 0.98
3.7.3 Intra-particle diffusion kinetic model
The values of the intra-particle diffusion constants and the correlation coefficients for imidacloprid and
abamectin obtained from the linear plots of qt versus t ½,(eq. 5) are given in Fig. 8 and their constants are
summarized in Table 3.
For the intra-particle diffusion the straight line in Fig. 8 did not pass through the origin, this indicates that the
rate of imidacloprid adsorption onto soil is limited by mass transfer across the boundary layer, while for
abamectin the straight line pass through the origin this implies that abamectin adsorption onto soil is not
limited by mass transfer across the boundary layer.

J. Mater. Environ. Sci. (Y) (2014) xxx-xxx Warad et al.
ISSN: 2028-2508
CODEN: JMESCN
00
Figure 8: Kinetics of pesticides removal according to the intra-particle diffusion model
by soil at (initial conc: 100 mg/L, initial pH: 4,temperature: 25 ᴼC and solid/liquid ratio 1.00 g/50 mL).
Table 3: Intra-particle diffusion kinetic model parameters for imidacloprid and abamectin adsorption onto soil
at 25 ºC.
Adsorbent Kp(mg/g min1/2
) A R2
Abamectin 0.362 0.176- 0.942
Imidacloprid 0.301 -0.401 0.998
3.8 Langmuir Isotherm Model
This model deals with monolayer and homogeneous adsorption because the adsorbed layer is one molecule in
thickness, with adsorption occurring at fixed sites, which are identical and equivalent. Linear form of this model
is given in Equation (2):
Ce/qe = 1/(Q0*b) + Ce/Q0 (6)
Where Ce is the equilibrium concentration of imidacloprid and abamectin in solution and qe is the amount of
imidacloprid and abamectin in soil surface, Q0 is the monolayer adsorption capacity, and b is Langmuir
isotherm which was not obeyed by adsorption of imidacloprid and abamectin.
3.9 Freundlich Isotherm Model
Freundlich isotherm is related to the non-ideal and reversible adsorption, not limited to monolayer formation.
Therefore is applied to multilayer adsorption, with non-uniform distribution of adsorption heat and affinities
over the heterogeneous surface. Linear form of this model is given as in Equation (7).
Log qe = log Kf + (1/n) log Ce (7)
Where Kf is multilayer adsorption capacity and n is adsorption intensity. The parameters of both models are
shown in Table 4.
Table 4: Langmuir and Freundlich isotherm model parameters and correlation coefficient of pesticides
adsorption on grenhouse soil.
Isotherm Langmuir Parameters Freundlich Parameters

J. Mater. Environ. Sci. (Y) (2014) xxx-xxx Warad et al.
ISSN: 2028-2508
CODEN: JMESCN
02
Adsorbate Q0
(mg/g)
b
(L/mg)
R2 Kf ((mg/g)
(L/mg)1/n
)
n R2
Abamectin 37.31 0.025 0.975 6.13 4.5 0.902
Imidacloprid 36.93 0.028 0.984 2.08 3.2 0.971
Adsorption tends to have n between 1 and 10. Larger value of n implies stronger interaction between the soil
and the pesticides [23].
The n values were 3.2 and 4.5 for imidacloprid and abamectin respectively, showing that adsorption process was
favorable and this has to do with high percentage of the clay(43%) and due to the organics and humic acids
available in the greenhouse soil. The multilayey capacity factor of both pesticides (Kf) is higher than one which
shows the good interaction between the soil and the pesticides with more interaction in abamectin than
imidacloprid.. Our results agree with previous studies done on pesticides and regular soil [13]. The Langmuir
adsorption isotherm is commonly applied to monolayer chemisorptions of gases. This isotherm is mainly
applied when no strong adsorption is expected and when the adsorption surface is uniform. The Langmuir
isotherm shows that adsorption will increase with increasing pesticides concentration up to a saturation point, in
which all of the sites are occupied (Fig. 9). The essential feature of the Langmuir isotherm can be expressed by
means of the dimensionless constant separation factor which is calculated using:
Rl = 1/(1 + bL.C0) (8)
Where b is the Langmuir constant and C0 is the initial concentration [25]. The Rl for abamectin and
imidacloprid were 0.43 and 0.41 respectively.
y = 0,027x + 0,959
R² = 0,984
y = 0,026x + 1,040
R² = 0,975
1
1,2
1,4
1,6
1,8
2
2,2
2,4
0 5 10 15 20 25 30 35 40 45 50
Ce /
qe
Ce
(a) Imidacloprid (b) Abamectin
Fig.9. Langmuir plot for pesticides adsorption onto soil at 25 0C, initial pH = 4 and solid/liquid ratio 1.0 g/50 mL.
Both the Langmuir and Freundlich adsorption isotherms showed linear relationship on the present results shown
in Figs. 9 and 10 for the Langmuir and Freundlich adsorption isotherms, respectively, but R2
for the Langmuir
adsorption isotherms is larger than that in Freundlich adsorption isotherms and close to 1.
J. Mater. Environ. Sci. (Y) (2014) xxx-xxx Warad et al.
ISSN: 2028-2508
CODEN: JMESCN
03
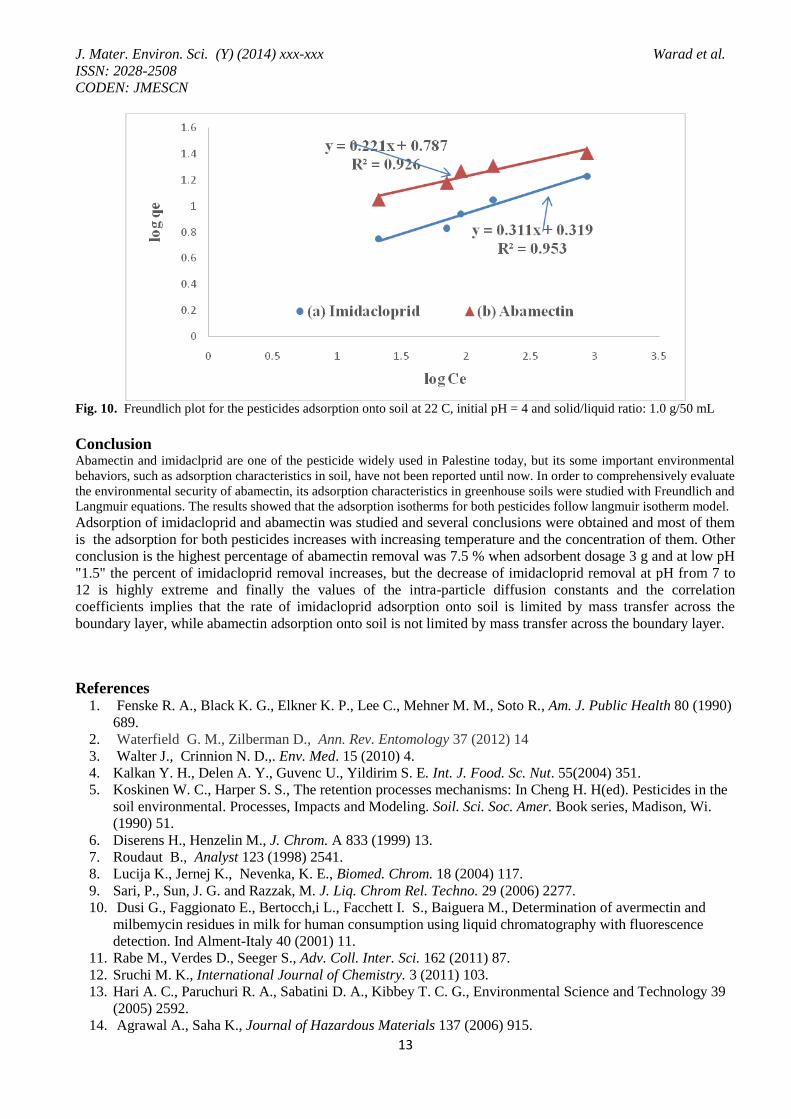
Fig. 10. Freundlich plot for the pesticides adsorption onto soil at 22 C, initial pH = 4 and solid/liquid ratio: 1.0 g/50 mL
Conclusion Abamectin and imidaclprid are one of the pesticide widely used in Palestine today, but its some important environmental
behaviors, such as adsorption characteristics in soil, have not been reported until now. In order to comprehensively evaluate
the environmental security of abamectin, its adsorption characteristics in greenhouse soils were studied with Freundlich and
Langmuir equations. The results showed that the adsorption isotherms for both pesticides follow langmuir isotherm model.
Adsorption of imidacloprid and abamectin was studied and several conclusions were obtained and most of them
is the adsorption for both pesticides increases with increasing temperature and the concentration of them. Other
conclusion is the highest percentage of abamectin removal was 7.5 % when adsorbent dosage 3 g and at low pH
"1.5" the percent of imidacloprid removal increases, but the decrease of imidacloprid removal at pH from 7 to
12 is highly extreme and finally the values of the intra-particle diffusion constants and the correlation
coefficients implies that the rate of imidacloprid adsorption onto soil is limited by mass transfer across the
boundary layer, while abamectin adsorption onto soil is not limited by mass transfer across the boundary layer.
References 1. Fenske R. A., Black K. G., Elkner K. P., Lee C., Mehner M. M., Soto R., Am. J. Public Health 80 (1990)
689.
2. Waterfield G. M., Zilberman D., Ann. Rev. Entomology 37 (2012) 14
3. Walter J., Crinnion N. D.,. Env. Med. 15 (2010) 4.
4. Kalkan Y. H., Delen A. Y., Guvenc U., Yildirim S. E. Int. J. Food. Sc. Nut. 55(2004) 351.
5. Koskinen W. C., Harper S. S., The retention processes mechanisms: In Cheng H. H(ed). Pesticides in the
soil environmental. Processes, Impacts and Modeling. Soil. Sci. Soc. Amer. Book series, Madison, Wi.
(1990) 51.
6. Diserens H., Henzelin M., J. Chrom. A 833 (1999) 13.
7. Roudaut B., Analyst 123 (1998) 2541.
8. Lucija K., Jernej K., Nevenka, K. E., Biomed. Chrom. 18 (2004) 117.
9. Sari, P., Sun, J. G. and Razzak, M. J. Liq. Chrom Rel. Techno. 29 (2006) 2277.
10. Dusi G., Faggionato E., Bertocch,i L., Facchett I. S., Baiguera M., Determination of avermectin and
milbemycin residues in milk for human consumption using liquid chromatography with fluorescence
detection. Ind Alment-Italy 40 (2001) 11.
11. Rabe M., Verdes D., Seeger S., Adv. Coll. Inter. Sci. 162 (2011) 87.
12. Sruchi M. K., International Journal of Chemistry. 3 (2011) 103.
13. Hari A. C., Paruchuri R. A., Sabatini D. A., Kibbey T. C. G., Environmental Science and Technology 39
(2005) 2592.
14. Agrawal A., Saha K., Journal of Hazardous Materials 137 (2006) 915.
J. Mater. Environ. Sci. (Y) (2014) xxx-xxx Warad et al.
ISSN: 2028-2508
CODEN: JMESCN
04
15. Ugurlu M., Gurses A., Acikyildiz M., Microporous and Mesoporous Materials 111 (2007) 228.
16. Tiwari M., Guha S., J. Environ Eng 138(2012) 426.
17. Zheng, W., Liu W., Journal of Agricultural and Food Chemistry 48 (1999) 4320.
18. Sheets L. P., Handbook of Pesticide Toxicology, 2nd ed.; Krieger, R. I., Ed.; Academic Press: San Diego,
CA 2(2001), Chapter 54, 1123-1130.
19. Cox L., Koskinen W. C., Yen, P. Y., J. Agric. Food Chem 45 (1997) 1468.
20. Kamble S. T., Saran R. K., Bull. Environ. Contam. Toxicol 75 (2005) 1077.
21. Fernandez-Bayo J. D., Nogales R., Romeo E., Journal of Agriculture and Food Chemistry 56 (2008)
5266.
22. Bajeer M. A., Nizamani S. M., Sherazi S. T. H., Bhanger M .I., American Journal of Analytical
Chemistry 3 (2012) 604
23. Öztürk N., Bektas T. E., J. Hazar. Mat., 112 (2004) 155.
24. Bronznic D., Milin C., J. Env. Sci. Health, Part B 47 (2012) 779.
25. Weber T. M., Chakrabarti R. K., Am. Inst. Chem. Eng. J. 20 (1974) 228.
(2014) www.jmaterenvironsci.com
Recommended