JOBS, WAGES AND INEQUALITY: The role of non-standard employment
Laval university seminar 14 November 2014
Wen-Hao Chen
Social Analysis Division, Statistics Canada
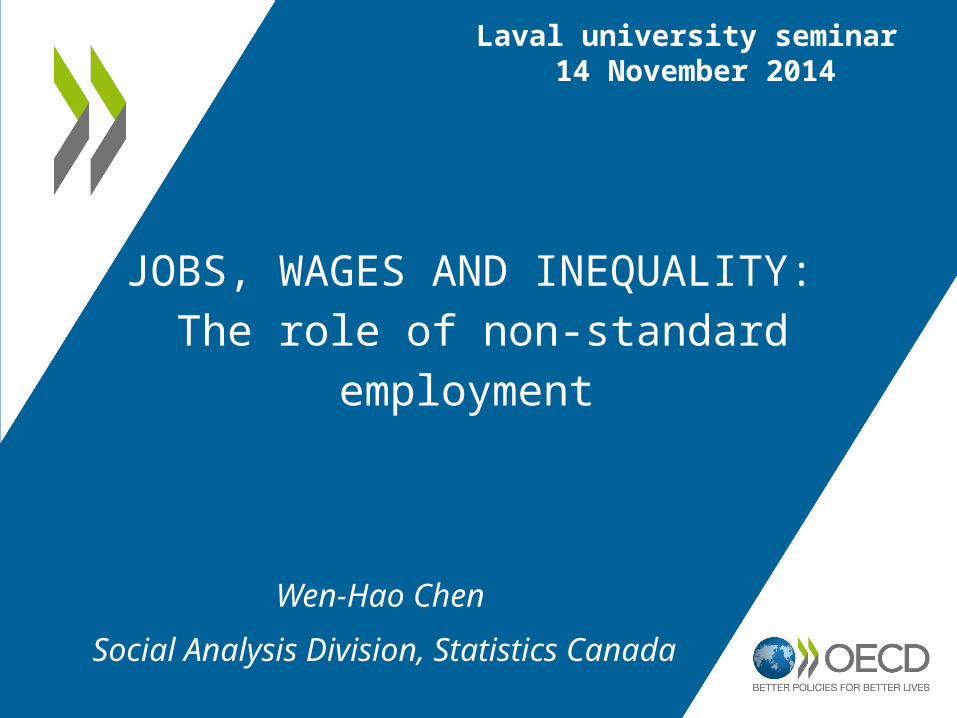
The context - towards an inclusive growth?
The decline of the wage-to-income share in OECD countries, 1990-2009
2/30

Some regulatory reforms tended to increase flexibility, facilitating employer’s adjustments of the workforce via non-standard workers,
Demographic and societal developments also contributed to the supply of atypical workers,
Possible distributional implications,
Research questions
Was employment growth primarily associated with low-paid, unstable jobs or with more productive and rewarding jobs?
To what extent are “atypical” jobs “stepping stones” to improved labour market prospects, or rather “traps”?
How do atypical work patterns affect household earnings and income inequality?
The background and motivation
3/30
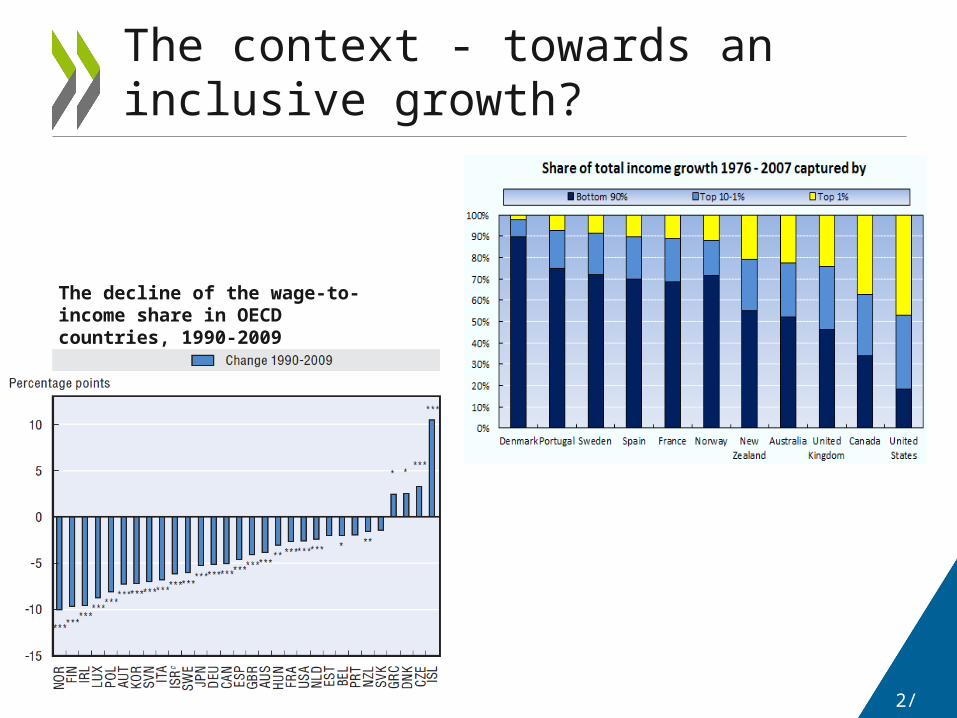
1. Development and characteristics of non-standard employment Defining NSW work and documenting trends & characteristics Are non-standard workers in low-paid or lower quality jobs?
2. Labour market prospects of non-standard workers Are NSW jobs “Stepping stones” or “dead ends”? Employment transitions, wage penalties and upward earnings mobility
3. How does NSW affect household income inequalities and poverty? How is NSW distributed at the household level? Distributional position of NSW in household income distribution In-work poverty risks
4. Conclusions
Structure of the talk
4/30

Country-specific conventionsData issues In its broadest terms, defined by what it is not (full-
time dependent employment with an indefinite duration contract)
includes self-employment (own-account), all temporary and all part-time employees
Broad definition used by Eurofund, ILO, WB Not a normative concept, and different from the
notion of precarious employment
“Non-standard” / “atypical” work: a fuzzy concept
5/30

Different forms of non-standard work: example Germany
Source: EU-LFS
Excluding …- Employers, - FT students,- Apprentices,- Older workers
6/30

The share of non-standard work is sizeable in OECD countriesShare of non-standard employment by type as % of total employment, 2010
Note: Sample restricted to paid and self-employed (own account) workers aged 15-64 years old, excluding employers and student workers.Source: EULFS, KLIPS (2008) for Korea, HILDA (2009) for Australia and LFS for Canada.
0
10
20
30
40
50
60
PT-temp employees FT temporary contract PT-perm employees Self -employment%%
of which 87.1% casual
of which 42.4% casual
33﹪
7/30

Part-time workers are a heterogeneous group
Part-time employment, by type, 2010 or closest
Note: Sample restricted to paid and self-employed (own account) workers aged 15-64 years old, excluding employers, student workers and apprentices.Source: OECD (2014); EULFS; KLIPS for Korea, LFS for Japan, HILDA for Australia and LFS for Canada.
71% voluntary
permanent
temporary
8/30

NSW accounted for about half of employment growth between 1995 and 2010
Employment growth (%) by SW/NSW type, 1995-2010
Note: Sample restricted to paid and self-employed (own account) workers aged 15-64 years old, excluding employers and student workers.Source: EULFS, KLIPS (2008) for Korea, HILDA (2009) for Australia.
-20
-10
0
10
20
30
40
50
60
SW SE (own account) FT temp. PT-perm PT-temp
9/30

Non-standard work is the main source of employment growth, esp. for low-skill jobs
* LFS 1995/98-2010
(C) Non-routine manual Task (low-skill)
(A) Abstract task (high-skill) (B) Routine task (middle-skill)
10/30

Do atypical jobs pay less?
Ratio of median hourly wages (standard workers = 1), 2010
Source: OECD (2014); EULFS; KLIPS for Korea, LFS for Japan, HILDA for Australia and LFS for Canada.
11/30

Do atypical jobs provide less job security?
Ratio of reported probability of job loss within the next 6 months (standard workers = 1), 2010
Source: European Working Condition Survey (EWCS 2010).
PT perm.
12/30
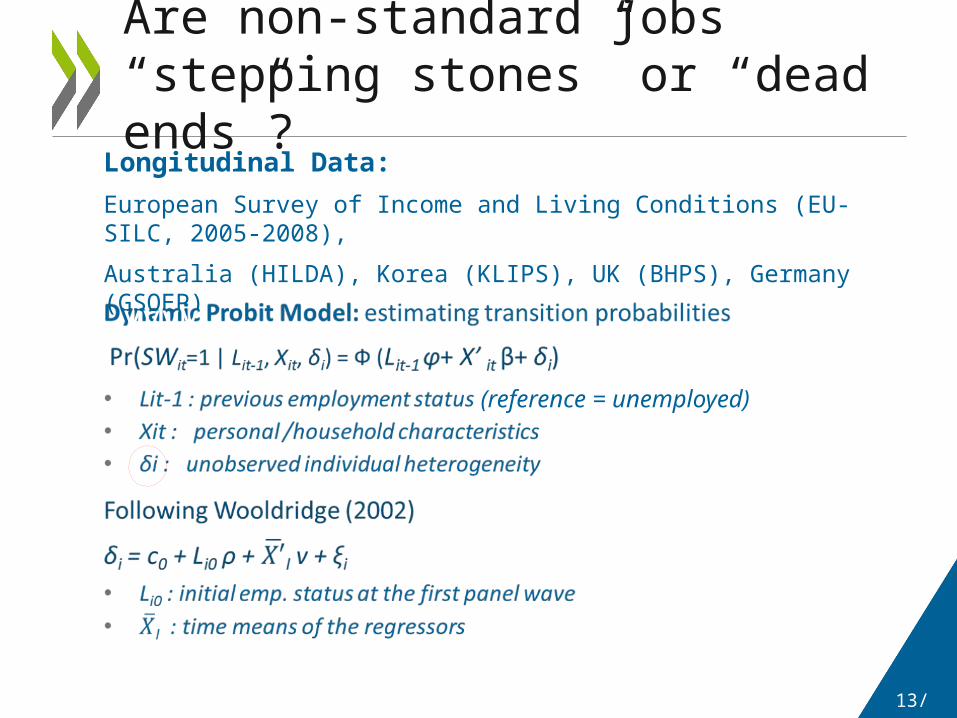
Are non-standard jobs “stepping stones” or “dead ends”?
Longitudinal Data:
European Survey of Income and Living Conditions (EU-SILC, 2005-2008),
Australia (HILDA), Korea (KLIPS), UK (BHPS), Germany (GSOEP)
vvvv
(reference = unemployed)
13/30
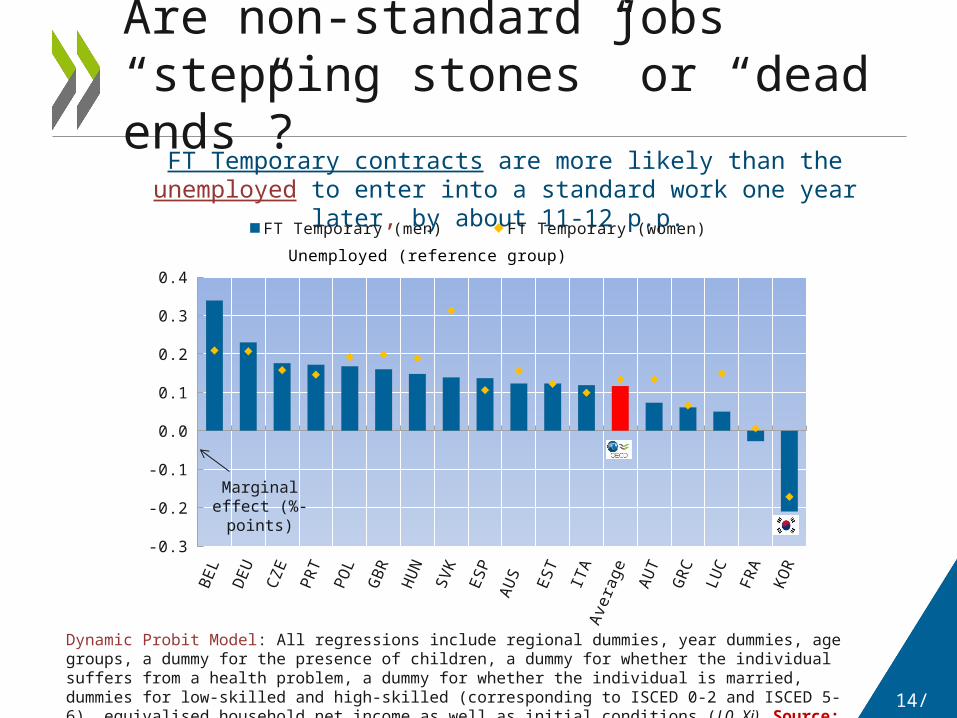
Are non-standard jobs “stepping stones” or “dead ends”?FT Temporary contracts are more likely than the unemployed to enter into a
standard work one year later, by about 11-12 p.p.
Dynamic Probit Model: All regressions include regional dummies, year dummies, age groups, a dummy for the presence of children, a dummy for whether the individual suffers from a health problem, a dummy for whether the individual is married, dummies for low-skilled and high-skilled (corresponding to ISCED 0-2 and ISCED 5-6), equivalised household net income as well as initial conditions (L0, Xi). Source: EU-SILC; KLIPS for Korea, HILDA for Australia.
BE
L
DE
U
CZ
E
PR
T
PO
L
GB
R
HU
N
SV
K
ES
P
AU
S
ES
T
ITA
Ave
rage
AU
T
GR
C
LUC
FR
A
KO
R
-0.3
-0.2
-0.1
0.0
0.1
0.2
0.3
0.4
FT Temporary (men) FT Temporary (women)
Unemployed (reference group)
Marginal effect (%-points)
14/30
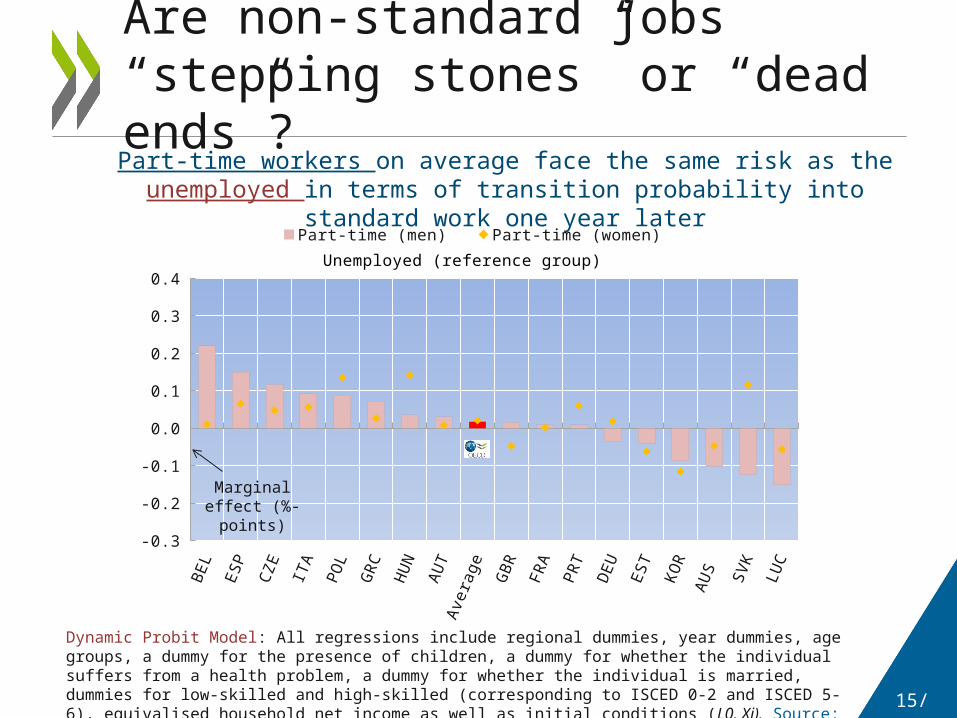
Are non-standard jobs “stepping stones” or “dead ends”?
Part-time workers on average face the same risk as the unemployed in terms of transition probability into standard work one year later
Dynamic Probit Model: All regressions include regional dummies, year dummies, age groups, a dummy for the presence of children, a dummy for whether the individual suffers from a health problem, a dummy for whether the individual is married, dummies for low-skilled and high-skilled (corresponding to ISCED 0-2 and ISCED 5-6), equivalised household net income as well as initial conditions (L0, Xi). Source: EU-SILC; KLIPS for Korea, HILDA for Australia.
BE
L
ES
P
CZ
E
ITA
PO
L
GR
C
HU
N
AU
TA
vera
ge
GB
R
FR
A
PR
T
DE
U
ES
T
KO
R
AU
S
SV
K
LUC
-0.3
-0.2
-0.1
0.0
0.1
0.2
0.3
0.4
Part-time (men) Part-time (women)
Unemployed (reference group)
Marginal effect (%-points)
15/30

For part-timers, transition rates into standard jobs are higher for those with permanent job contracts– Weak stepping-stone effects for temporary PT workers. In Austria and
Germany, these workers are associated with a negative probability of transition from PT to SW
In most countries, self-employed have a lower probability than the unemployed to move into standard work
Mixed evidence of stepping-stone effect of NSW by workers’ characteristics– In some countries, stepping-stone effects are only visible for prime-age
and older workers, but not for young (female) workers with a temporary contract.
Are those in NSW likely to move into standard jobs (2)?
16/30
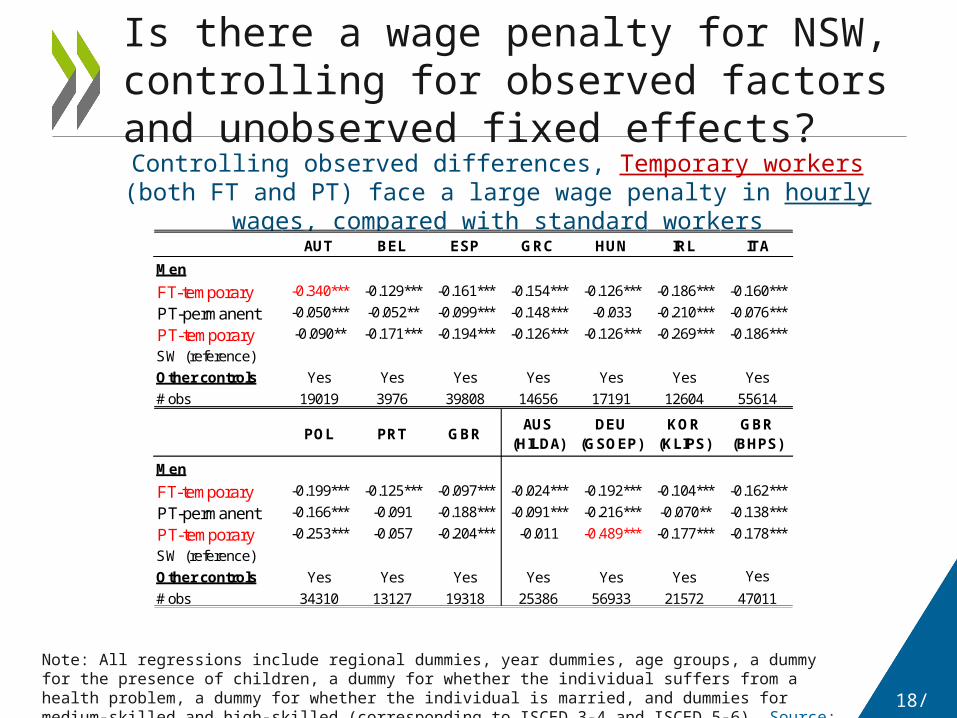
Is there a wage penalty for NSW, controlling for observed factors and unobserved fixed effects?
Controlling observed differences, Temporary workers (both FT and PT) face a large wage penalty in hourly wages, compared with standard workers
Note: All regressions include regional dummies, year dummies, age groups, a dummy for the presence of children, a dummy for whether the individual suffers from a health problem, a dummy for whether the individual is married, and dummies for medium-skilled and high-skilled (corresponding to ISCED 3-4 and ISCED 5-6). Source: EU-SILC, KLIPS, BHPS, HILDA , GSOEP.
AUT BEL ESP GRC HUN IRL ITA
Men
FT-temporary -0.340*** -0.129*** -0.161*** -0.154*** -0.126*** -0.186*** -0.160***
PT-permanent -0.050*** -0.052** -0.099*** -0.148*** -0.033 -0.210*** -0.076***
PT-temporary -0.090** -0.171*** -0.194*** -0.126*** -0.126*** -0.269*** -0.186***
SW (reference)
Other controls Yes Yes Yes Yes Yes Yes Yes
# obs 19019 3976 39808 14656 17191 12604 55614
POL PRT GBRAUS
(HILDA)DEU
(GSOEP)KOR
(KLIPS)GBR
(BHPS)
Men
FT-temporary -0.199*** -0.125*** -0.097*** -0.024*** -0.192*** -0.104*** -0.162***
PT-permanent -0.166*** -0.091 -0.188*** -0.091*** -0.216*** -0.070** -0.138***
PT-temporary -0.253*** -0.057 -0.204*** -0.011 -0.489*** -0.177*** -0.178***
SW (reference)
Other controls Yes Yes Yes Yes Yes Yes Yes
# obs 34310 13127 19318 25386 56933 21572 47011
18/30

The extent of wage penalty is reduced greatly once unobserved heterogeneity is controlled
PT (permanent) workers are no longer associated with wage penalty, and in Australia there shows a wage premium for part-timers
Note: All regressions include regional dummies, year dummies, age groups, a dummy for the presence of children, a dummy for whether the individual suffers from a health problem, a dummy for whether the individual is married, and dummies for medium-skilled and high-skilled (corresponding to ISCED 3-4 and ISCED 5-6). Source: KLIPS, BHPS, HILDA , GSOEP.
AUS (HILDA)
DEU (GSOEP)
KOR (KLIPS)
GBR (BHPS)
AUS (HILDA)
DEU (GSOEP)
KOR (KLIPS)
GBR (BHPS)
Specification (1)
Temporary-FT -0.024*** -0.192*** -0.104*** -0.162*** 0.001 -0.057*** -0.083*** -0.098***
PT-permanent -0.091*** -0.216*** -0.070** -0.138*** 0.169*** -0.029 -0.008 0.021
PT-temporary -0.011 -0.489*** -0.177*** -0.178*** 0.169*** -0.228*** -0.012 -0.028
SW (reference)
Other controls Yes Yes Yes Yes Yes Yes Yes Yes
Constant 3.085*** 2.959*** 9.053*** 2.478*** 2.830*** 2.614*** 8.852*** 2.160***
# obs 25386 56933 21572 47011 25,386 56,933 26,952 47011
# groups 4,926 11,077 5,557 7718
OLS Fixed-effects
19/30
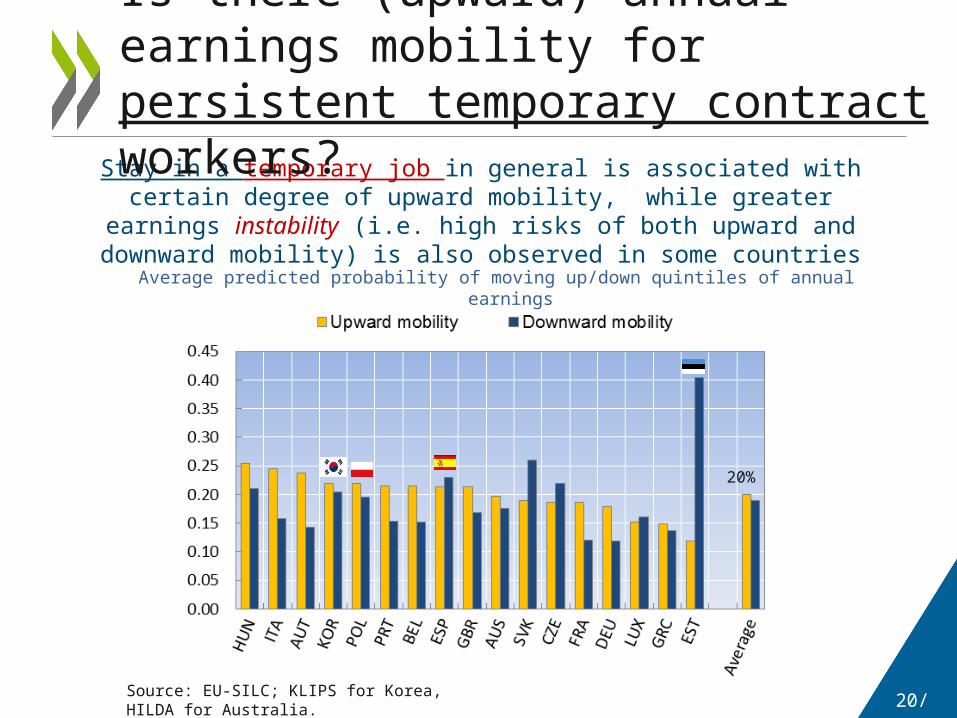
Stay in a temporary job in general is associated with certain degree of upward mobility, while greater earnings instability (i.e. high risks of both
upward and downward mobility) is also observed in some countries
Is there (upward) annual earnings mobility for persistent temporary contract workers?
Average predicted probability of moving up/down quintiles of annual earnings
Source: EU-SILC; KLIPS for Korea, HILDA for Australia.
20%
20/30

Will the growth in NSW lead to higher income inequality and poverty?
An increase in the share of non-standard workers is likely to contribute to increased individual earnings dispersion, but the impact on household income depends on:
“Demography”: in which household do NSW live (alone or with other earners?)
“Earnings”: what is the contribution from NSW earnings at the household level (main or secondary earners?)
“Incomes”: what is the position of NSW workers in the overall income distribution (how much non-labour sources—e.g. investment, benefits received?)
21/30

Non-standard work is a common feature at the household level
41% of all working households include a non-standard worker
Source: EU-SILC, KLIPS for Korea, HILDA for Australia and SLID (2009) for Canada.
41%
22/30
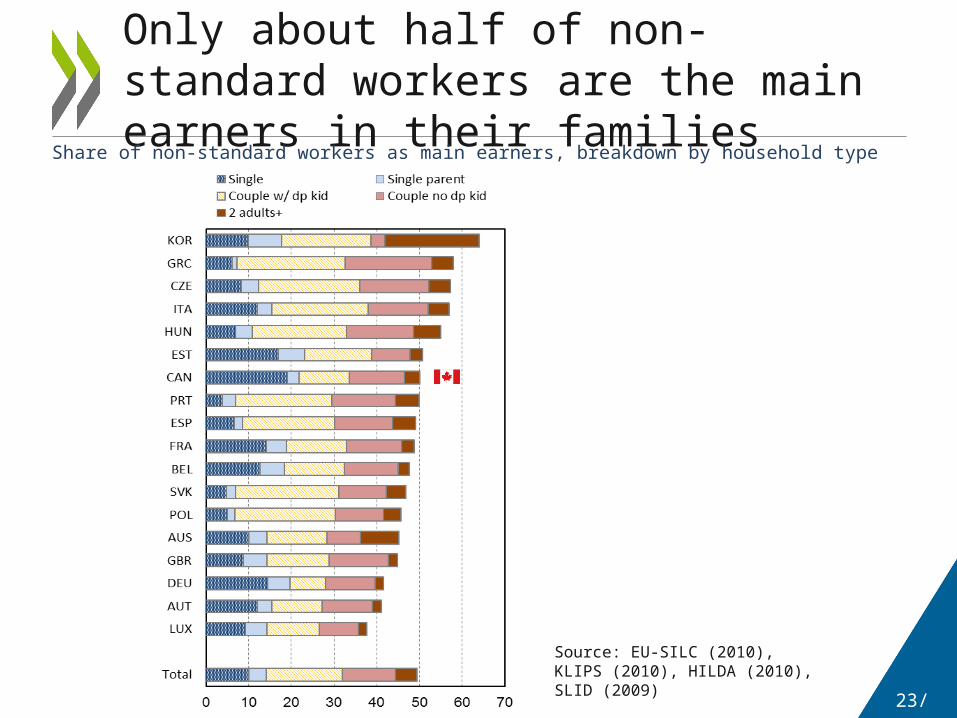
Only about half of non-standard workers are the main earners in their families
Share of non-standard workers as main earners, breakdown by household type
Source: EU-SILC (2010), KLIPS (2010), HILDA (2010), SLID (2009)
23/30
CZE
ITA
KOR
SVK
BEL
HU
NPO
LPR
TG
RCAU
SES
PFR
AAU
TLU
XES
TCA
NG
BRD
EU
Tota
l0.0
0.5
1.0
1.5
2.0
1 earner NSW HH 2 earners NSW HH Mixed SW/NSW HH
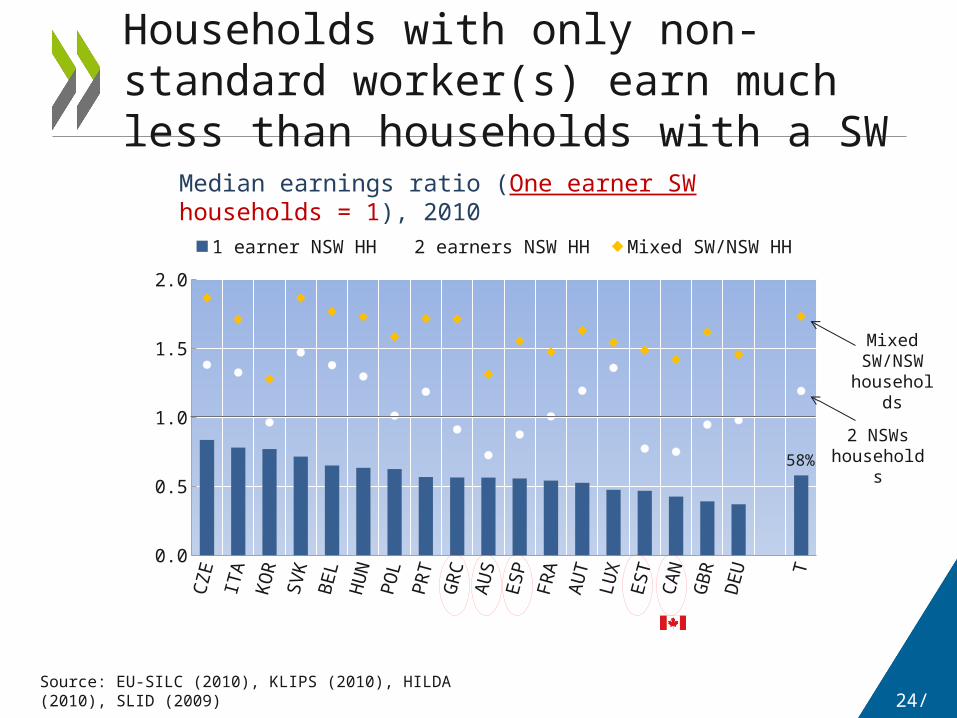
Households with only non-standard worker(s) earn much less than households with a SW
Median earnings ratio (One earner SW households = 1), 2010
Source: EU-SILC (2010), KLIPS (2010), HILDA (2010), SLID (2009)
2 NSWs households
Mixed SW/NSW
households
58%
24/30
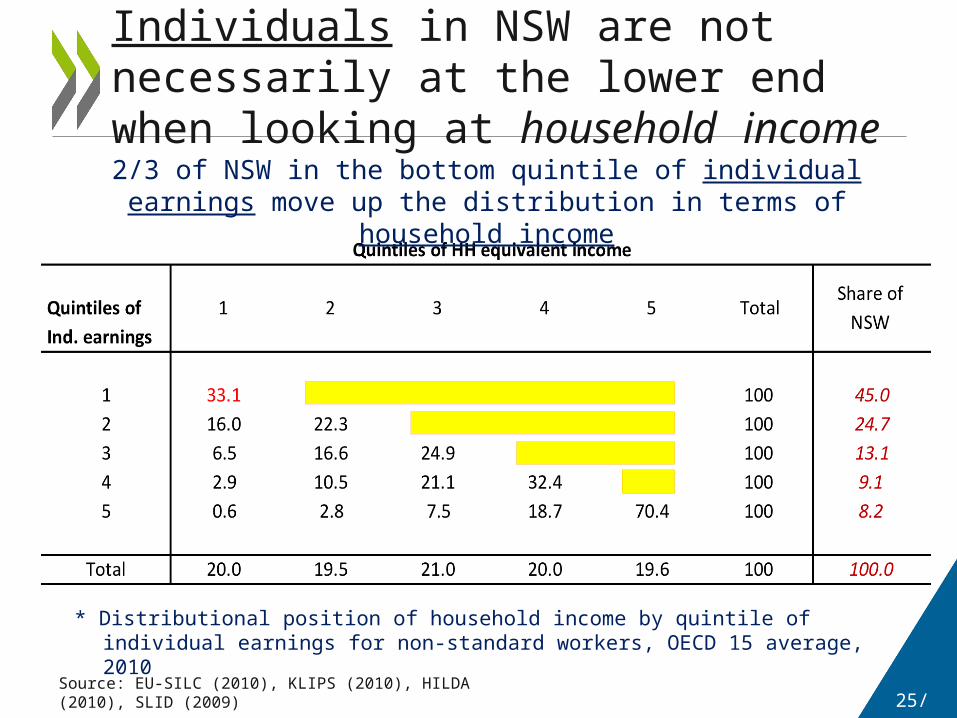
* Distributional position of household income by quintile of individual earnings for non-standard workers, OECD 15 average, 2010
Individuals in NSW are not necessarily at the lower end when looking at household income
2/3 of NSW in the bottom quintile of individual earnings move up the distribution in terms of household income
Source: EU-SILC (2010), KLIPS (2010), HILDA (2010), SLID (2009)25/30
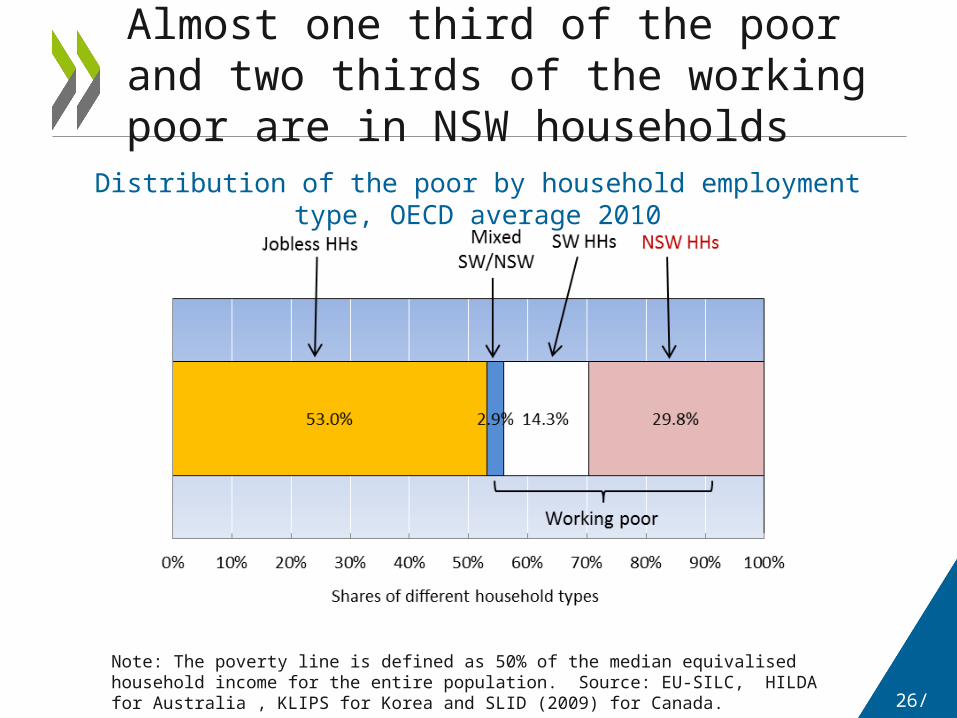
Almost one third of the poor and two thirds of the working poor are in NSW households
Note: The poverty line is defined as 50% of the median equivalised household income for the entire population. Source: EU-SILC, HILDA for Australia , KLIPS for Korea and SLID (2009) for Canada.
Distribution of the poor by household employment type, OECD average 2010
26/30
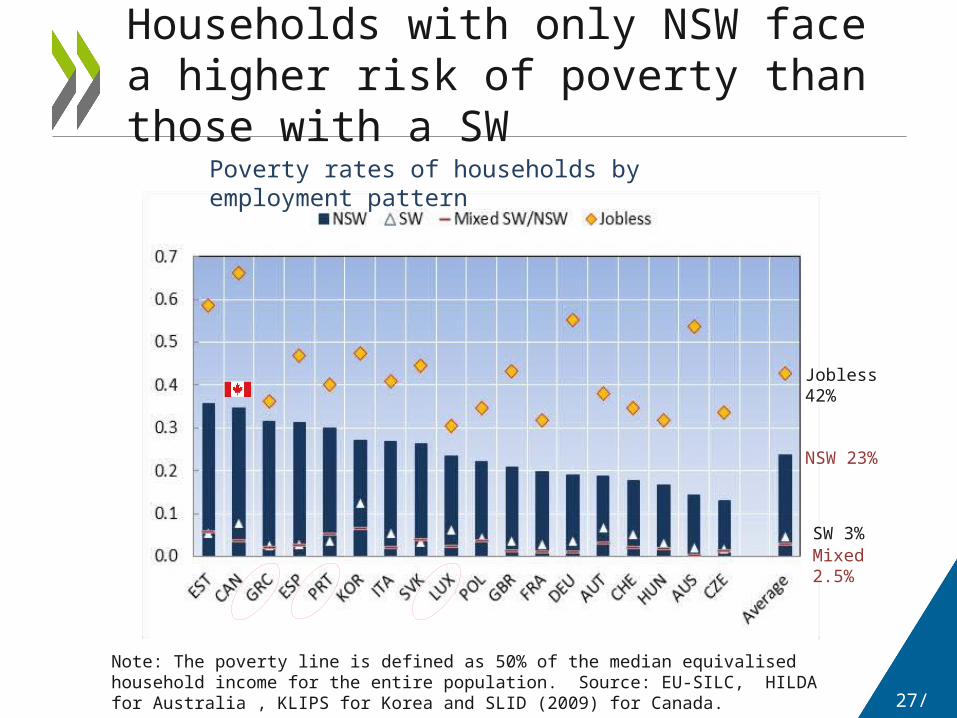
Households with only NSW face a higher risk of poverty than those with a SW
Poverty rates of households by employment pattern
NSW 23%
SW 3% Mixed 2.5%
Jobless 42%
Note: The poverty line is defined as 50% of the median equivalised household income for the entire population. Source: EU-SILC, HILDA for Australia , KLIPS for Korea and SLID (2009) for Canada.
27/30
Non-standard work is increasing and it contributes a significant part to the employment growth in OECD countries,
Great heterogeneity within non-standard workers; the term “non-standard” may not be interpreted as the same notion of “precarious”,
“Stepping-stone” effects for non-standard work exist in most countries, but they depend on the type of non-standard work and there are trade-offs involved,
Temporary workers often face considerable wage penalties and experience greater earnings instability,
Take away (1)
28/30

Inequality and poverty impacts of non-standard work depend also on the “demographic” and “household income” aspects,
About 1/2 of NSW are the main earners,
Only 1/3 of low-earnings NSW are at the bottom of the household income,
There is no straightforward link between growing NSW and rising income inequality and poverty,
Nevertheless, for “pure” NSW households they are disproportionately likely to be poor:
- 40% lower in household earnings,
- 23% are in poverty.
Take away (2)
29/30

Thank you for your attention!
www.oecd.org/social/inequality.htm
Recommended


![arXiv:1804.09399v3 [cs.LG] 6 Oct 2018 · Hao-Wen Dong and Yi-Hsuan Yang Research Center for IT innovation, Academia Sinica, Taipei, Taiwan fsalu133445,yangg@citi.sinica.edu.tw ABSTRACT](https://img.pdfslide.net/doc/110x75/5ebad5560d900506b62de640/arxiv180409399v3-cslg-6-oct-2018-hao-wen-dong-and-yi-hsuan-yang-research-center.jpg)