Copyright © 2011. NJMT
1
NUML Journal of Management & Technology
Vol: 6, No: 1. January, 2011 ISSN 1997-4507
NUML Journal of Management & Technology
ISSN: 1997- 4507
1. Conditional Capital Asset Pricing Model with Stochastic Beta: Evidence from
Pakistani Stock Market Ms. Fauzia Mubarik, Ms. Atia Javed
2. The Impact of Effective Communication and Service Climate on the
Performance of Employees: A Study on Marketing Officers of Private Banks of
Pakistan Kamran Ilyas Raja, Waqas Fazal
3. Discovering the Annals of Competitive Advantage in Business Organizations
Dr. Naveed Akhtar,Dr. Rasheed Ahmed Khan
4. HRD Practices in Banking Sector of Pakistan
Muhammad Arif khattak, Nadeem Iqbal, Dr. Ansar Ali Rajput, Abdul Qadeer
5. Impact of top management support, knowledge management and work
place spirituality on performance: A case study of universities Rawalpindi
and Islamabad. Jawad Javaid, Muhammad Niaz Khan
Volume: 6 - Numbers: 1 - January, 2011
A Research Journal Published by
Faculty of Management Sciences
National University of Modern Languages
Islamabad-Pakistan www.numl.edu.pk
This Issue includes:
Copyright © 2011 NJMT
Copyright © 2011. NJMT
2
NUML Journal of Management & Technology
Vol: 6, No: 1. January, 2011 ISSN 1997-4507
NUML Journal of Management & Technology
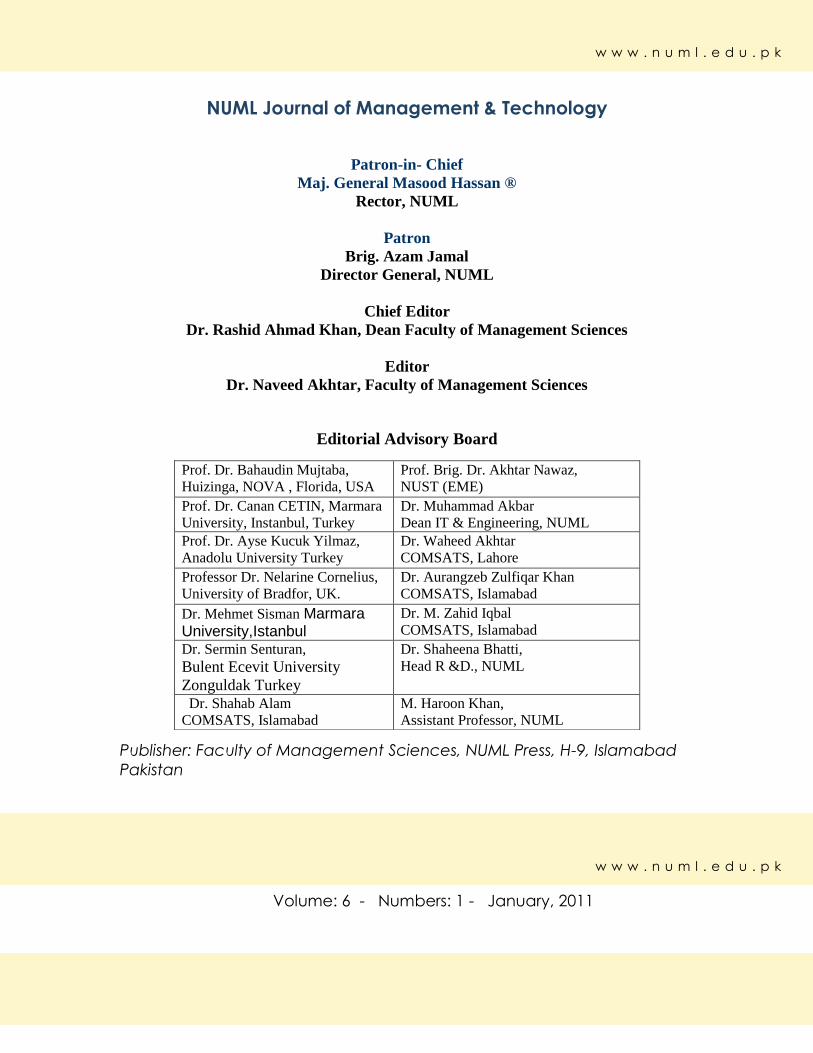
Patron-in- Chief
Maj. General Masood Hassan ®
Rector, NUML
Patron
Brig. Azam Jamal
Director General, NUML
Chief Editor
Dr. Rashid Ahmad Khan, Dean Faculty of Management Sciences
Editor
Dr. Naveed Akhtar, Faculty of Management Sciences
Editorial Advisory Board
Publisher: Faculty of Management Sciences, NUML Press, H-9, Islamabad
Pakistan
Prof. Dr. Bahaudin Mujtaba,
Huizinga, NOVA , Florida, USA
Prof. Brig. Dr. Akhtar Nawaz,
NUST (EME)
Prof. Dr. Canan CETIN, Marmara
University, Instanbul, Turkey
Dr. Muhammad Akbar
Dean IT & Engineering, NUML
Prof. Dr. Ayse Kucuk Yilmaz,
Anadolu University Turkey
Dr. Waheed Akhtar
COMSATS, Lahore
Professor Dr. Nelarine Cornelius,
University of Bradfor, UK.
Dr. Aurangzeb Zulfiqar Khan
COMSATS, Islamabad
Dr. Mehmet Sisman Marmara University,Istanbul
Dr. M. Zahid Iqbal
COMSATS, Islamabad
Dr. Sermin Senturan,
Bulent Ecevit University
Zonguldak Turkey
Dr. Shaheena Bhatti,
Head R &D., NUML
Dr. Shahab Alam
COMSATS, Islamabad M. Haroon Khan,
Assistant Professor, NUML
w w w . n u m l . e d u . p k
w w w . n u m l . e d u . p k
Volume: 6 - Numbers: 1 - January, 2011
Copyright © 2011. NJMT
3
NUML Journal of Management & Technology
Vol: 6, No: 1. January, 2011 ISSN 1997-4507
Table of Contents
1. Conditional Capital Asset Pricing Model with Stochastic Beta:
Evidence from Pakistani Stock Market Ms. Fauzia Mubarik, Ms. Atia Javed
2. The Impact of Effective Communication and Service Climate on the
Performance of Employees: A Study on Marketing Officers of Private
Banks of Pakistan Kamran Ilyas Raja, Waqas Fazal
3. Discovering the Annals of Competitive Advantage in Business
Organizations Dr. Naveed Akhtar, Dr. Rasheed Ahmed Khan
4. HRD Practices in Banking Sector of Pakistan Muhammad Arif khattak,Nadeem Iqbal, ,Dr. Ansar Ali Rajput,Abdul Qadeer
5. Impact of top management support, knowledge management and
work place spirituality on performance: A case study of universities
Rawalpindi and Islamabad. Jawad Javaid, Muhammad Niaz Khan
Copyright © 2011. NJMT
4
NUML Journal of Management & Technology
Vol: 6, No: 1. January, 2011 ISSN 1997-4507
Conditional Capital Asset Pricing Model with
Stochastic Beta: Evidence from Pakistani
Stock Market
Ms. Fauzia Mubarik,
Lecturer, Faculty of Management Sciences, NUML Unversity, Islamabad, Pakistan
Ms. Atia Javed,
Lecturer, Pakistan Institute of Development Economics, Islamabad, Pakistan
ABSTRACT
This study investigates the stochastic behavior of market beta
using capital asset pricing model (CAPM) of 50 stocks listed at
Karachi Stock Exchange Pakistan from January 1999 to December
2009. This time varying behavior is examined by employing the
state space model identified as modified Kalman Filter technique.
The static version of CAPM assumes the beta factor to be constant
but as the return distribution is time varying in nature thus the beta
factor occurs to be non-constant in nature. The stochastic behavior
of beta is examined by one of the three dynamic processes: mean
reverting process, random coefficient with constant and random-
walk beta. The results indicate that there is large support for the
random-walk model for 29 stocks found in the sample random
walk behavior for beta in returns. The improvement in fit of time-
varying beta over the conventional constant beta estimated by
ordinary least square in CAPM model is compared by the
coefficient of determination and the variances of the errors. The
results of time-varying model show significant gains in terms of a
higher explanatory power and lower variance if beta is allowed to
follow an appropriate time-varying model.
JEL Classification: G12, G15
Key Words: Capital Asset Pricing Model, Kalman Filter
Technique, Mean Reverting Process with Constant, Random
Coefficient Process and Random Walk Process.
1. INTRODUCTION
The Sharpe (1964) and Lintner (1965) Capital Asset Pricing Model (CAPM) continues to
be the primary and dominant model when it comes to asset pricing models. However,
after the introduction of CAPM, academics present many critiques invalidating its
statistical significance. The consistent argument has been that the CAPM assumes
Copyright © 2011. NJMT
5
NUML Journal of Management & Technology
Vol: 6, No: 1. January, 2011 ISSN 1997-4507
constant beta whereas return distribution is time varying in nature and so does the beta. In
addition, the market risk captured by beta being an efficient measure of riskiness of a
security is an important financial instrument in investment decisions regarding estimation
of market models, development of investment portfolios, and estimation of cost of capital
and emerging derivative markets.
The constant status of beta in estimating stock returns is questionable by the academic
researchers for the high-low variation in its parameters. As systematic risk is time variant
in nature, thus it is necessary to consider beta as a time series process withholding within
it the stochastic behavior. Faff, Hillier and Hillier (2000) have demonstrated three
modeling techniques to estimate time-varying beta namely multivariate generalized
ARCH model (M-GARCH), another time varying heteroskedastic market models
identified as EGARCH, TARCH and Kalman Filter approach and find that of all the three
models, Kalman Filter approach along with random-walk parameterization out-performs
in efficiently explaining the stochastic behavior of betas in the daily stock returns of UK.
The Kalman filter approach is algorithmic calculation of current state dependent on
previous state. In other words, the Kalman filter is essentially a set of mathematical
equations based on Gaussian distribution that minimizes the estimated error covariance of
state variables in the sample. From the time it has been developed, the Kalman filter
technique has been the subject of extensive research and application in its original
formulation (Kalman, 1960) in the field of finance and economics to acutely analyze the
influential variables for individual and institutional investors to make investment
decisions.
The main objective of this research study is to investigate the stochastic behavior of beta
of 50 listed stocks on Karachi Stock Exchange Pakistan from January 1999 to December
2009 by employing state space model identified as modified Kalman Filter technique.
This technique efficiently captures the unobserved variables in the data and estimates the
variation in beta along with observed variables. If the Gaussian assumption is relaxed,
the Kalman filter is deemed to be the best (minimum error variance) filter out of the class
of linear unbiased filters as is evident from the study of Mergner and Bulla, 2008.
The present study investigates the stochastic behavior of beta of 50 listed stocks on
Karachi Stock Exchange Pakistan from January 1999 to December 2009. This study
contributes to the existing literature on asset pricing model in several ways. This study
examines the time varying behavior by employing the state space model identified as
modified Kalman Filter technique which identifies the underlying dynamic process in
beta and take account of autoregressive and heteroskedasticity in stock returns by taking
GARCH specification of variance. This study provides guidelines in investment decisions
regarding portfolios formation, cost of capital and derivative markets decisions. The
study provides comparison of constant beta with time varying beta and finds robust
results for portfolio diversification and dynamic hedging strategies because of its
stochastic nature to capture variation in systematic risk.
The plan of the study is as follows. This study is further divided into four sections.
Section two provides literature review of the relevant literature, section three discusses
Copyright © 2011. NJMT
6
NUML Journal of Management & Technology
Vol: 6, No: 1. January, 2011 ISSN 1997-4507
the data and methodology, section four is comprised of data analysis and interpretation of
empirical results and section five offers the conclusion.
2. LITERATURE REVIEW
The standard CAPM is extensively tested by many studies and evidence shows that there
is no significant relationship between average returns and market beta. The time varying
CAPM is mostly tested for the developed markets, very few studies are done for
developing markets.
Jostova and Philipov (2005) have examined the mean-reverting stochastic process of
systematic risk. The sample comprises of U.S. industry portfolios of financial, utilities,
manufacturing, retail and wholesale firms. The stochastic beta model is employed and the
results conclude that the model outperforms in providing best forecasts for beta in the
stock returns and also strongly supports conditional CAPM model in analyzing the
stochastic behavior of systematic risk. Lin and Lin (2000) demonstrate the stochastic
behavior of betas for international markets by employing one-factor international capital
asset pricing model (ICAPM) within a framework of random coefficients models for
United States, the United Kingdom, Canada, France, Germany, Japan, South Korea,
Singapore, Taiwan, Hong Kong and Australia are selected for testing time varying
country betas for the time period of February 1975 to June 1998. Based on generalized
least squares method technique, the ICAPM model shows stochastic behavior of country
betas and its power to forecast. Jong (2000) has examined the term structure of U.S.
interest rates with maturities running from 1-month to 30 years for the time period of
1947 to 1991 by combining time series and cross section information. The affine class of
term-structure models along with Kalman Filter quasi-maximum likelihood approach is
employed for estimation and results conclude that these models are easy to implement
and identify and develop panel data in a consistent manner.
Asgharian and Hansson (2000) have investigated the explanatory power of time-varying
beta along with other factors for cross sectional variation in stock returns of Swedish
stock market for the time period of 1983 to 1986. The study is tested by employing
bivariate GARCH (1,1) process to estimate stochastic behavior of beta of the sample
against the constant beta that is measured by the application of ordinary least squares
technique. The results show the efficient performance of bivariate GARCH(1,1) to
capture the dynamic behavior of beta due to fluctuating behavior of stock returns. It is
also evident from the result that risk premium for beta; size and book-to-market rely on
one another to avoid any biases in the estimated coefficient for beta. Choudary (2001)
has investigated the stochastic behavior of beta of three emerging Asian markets based on
daily data for the time period of January 1989 to December 1998. The study has
employed bivariate GARCH-M model and autoregressive fractionally moving average
(ARFIMA) model to demonstrate the time-varying beta of daily returns. The tests find a
slow mean reverting beta indicating its ability to forecast beta and stock returns by
possessing a long memory in the parameters. Lam (2001) has examined the asymmetric
risk-return relationship in the Hong Kong stock market for daily returns of 132 stocks for
the time period of January 1980 to December 1995 characterized to two bull and two bear
Copyright © 2011. NJMT
7
NUML Journal of Management & Technology
Vol: 6, No: 1. January, 2011 ISSN 1997-4507
markets. The results demonstrate strong relationship between positive betas and returns in
bull markets and between negative betas and returns in bear markets. Grieb and Reyes
(2001) have analyzed the time-variation in betas for 38 Brazilian investable stocks
through the application of Schwert and Seguin (SS) single factor model. This model is
followed by applying maximum likelihood techniques used to estimate MA(1)-GJR-
GARCH(1,1) to obtain estimates of world market volatility to test SS market model. The
results indicate that the systematic risk of Brazilian stocks increases as the fluctuation in
aggregate market increases. Rockinger and Urga (2001) have examined the time varying
parameters of Central and Eastern European Financial Markets for the time period of Aril
1994 to July 1997 by applying Kalman-Filter framework to capture time-varying latent
factors in stock indexes and analyze the GARCH effects in the stock markets. The
findings indicate significant GARCH effects in the selected stock markets and show high
asymmetric volatile effects particularly in case of Hungary. Lettau and Ludvigson (2001)
have investigated the time variation of beta across stock returns and portfolios by
employing conditional capital asset pricing model. The results show that the model
significantly captures the time varying parameters across returns in contrast to static
measure of beta across returns as is evident through the static capital asset pricing model.
This stochastic behavior of the model provides room for more multiple factors to be
employed in the study to capture cross-sectional effects of time-varying parameters
across stock returns and portfolios
Moonis and Shah (2003) have studied time variation in beta in Indian stock market by
employing modified Kalman Filter approach on 50 daily returns for the time period of
May 1996 to March 2000. In contrary to bivariate GARCH models, modified Kalman
Filter approach clearly indicates beta to mean reverting with less evidence of random
walk process. The results also show that it best captures the reduction in variance of
market model if beta is time varying in nature. The study finds this model to be robust for
portfolio diversification and dynamic hedging strategies because of its stochastic nature
to capture variation in systematic risk. Chan and Maheu (2002) have examined jump
dynamics in stock returns through a simple-filter approach identified as autoregressive
conditional jump intensity (ARJI). The study supports the time varying jump behavior of
stock returns in forecasting behavior and ex-ante probability of jumps during stock
market downturns. Ang and Liu (2004) have studied the dynamic behavior of betas, risk
premium and risk-free rates for valuing discounted cash flows. The results find betas to
be time varying in nature thereby deriving dynamic discounted cash flow based on
conditional capital asset pricing model. The study support the discount curve in the model
efficiently indicates the dynamic cash flows of time varying betas, and risk premiums.
Hodgson and Vorkink (2003) have studied the conditional betas through Gaussian quasi-
maximum likelihood estimation technique for daily stock returns with three portfolios
placed into quartiles developed by sorting firms traded on NYSE, AMEX and NASDAQ
for the time period of January 1996 to December 1997. The results indicate that the semi
parametric efficient estimates of the conditional betas work better on the Gaussian quasi-
maximum likelihood estimates with the presence of non-normality in the conditional
capital asset pricing model.
Copyright © 2011. NJMT
8
NUML Journal of Management & Technology
Vol: 6, No: 1. January, 2011 ISSN 1997-4507
Compton and Costa e Silva (2005) have examined the relationship between finance-
business cycles for the recession period of 2001 by investigating the contribution of stock
market, debt and money markets to U.S. business cycles by employing dynamic factor
model and Markov-switching model and time varying transition probability model. The
result indicate that all the three models provide support for stock return movement with
business cycle and one way relationship from stock markets to GDP evident from
Granger causality test. Mergner and Bulla (2005) have demonstrated based on in-sample
forecasting results, the standard ordinary least square estimates show the weakest results
as compared to stochastic volatility models with Kalman Filter out-performing the most
among all results. Similarly, for out-sample forecasting results, the time-varying betas are
best explained by the random walk process of Kalman filter for weekly excess returns of
eighteen pan-European industry portfolios for the time period of December 1987 to
February 2005.
Choudhry and Wu (2008) have investigated the stochastic behavior of beta with GARCH
models and Kalman Filter method. Kalman Filter is employed to explicitly model the
stochastic process of beta of twenty U.K. firms for the time period of January 1989 to
December 2003 and is compared with bivariate GARCH, bivariate BEKK GARCH,
GARCH-GJR and bivariate GARCH-X. The Kalman Filter technique shows asymmetric
distribution of conditional betas having a wider range as compared to GARCH models
and accurately forecasts the future returns to actual returns of the firms. Bali, Cakici and
Tang (2009) investigate the relationship of time-varying conditional betas based on the
dynamic information available for the industry portfolios for the daily returns of financial
and non-financial firms listed on NYSE, AMEX and NASDAQ stock exchanges for 1963
to 2004. The autoregressive, moving average and generalized autoregressive conditional
heteroskedasticity in mean (GARCH-M) model to obtain time-varying conditional betas
for each stock based on ex-ante measures of risk are employed. The results indicate
positive relation between conditional betas and expected returns and show that the
average portfolio returns increases from the low-beta movement to high-beta movement
both at firm level and portfolio level. Bauer, Cosemans and Schotman (2008) have tested
the time-varying risk on three factor model of Fama and French model on 16 European
markets for the February 1985 to June 2002. Seemingly unrelated regressions technique
and time series tests show significant time variation in risk factor loadings. The study
finds that size, book-to-market and macro-economic variables forecast significant time
variation in expected returns. In the present century, researcher have examined the time-
variation in investor risk aversion preferences for 25 portfolios on book-to-market and
size for the time period of 1990 to 2004. Based on Bollerslev, Gibson and Zhou model,
the results show that the explanatory power of time-varying risk aversion innovations for
cross-section of stock returns
3. METHODOLOGY AND DATA
The Capital Asset Pricing Model (CAPM) is devised as an equilibrium asset pricing
model by Sharpe (1964) and Lintner (1965). The basic idea of the CAPM is that if a
share helps to stabilize a portfolio that is to make it more in line with the market portfolio
then a share will earn a similar rate of return to the market portfolio. Whereas, if a share
Copyright © 2011. NJMT
9
NUML Journal of Management & Technology
Vol: 6, No: 1. January, 2011 ISSN 1997-4507
of a portfolio deems to be more risky than the market portfolio, the demand of the share
decreases which in return declines the price of the share and its expected rate of return
rise above the market rate of return. Conversely, if a share reduces the risk of a portfolio
compared to the market portfolio the demand increases and its price stabilizes with a
lower rate of return than the average market rate of return. It also assumes that in an
efficient market all diversifiable risk will be eliminated (given that there is no transaction
cost) so that the risk only risk that will be priced by the market on a portfolio is
systematic or market risk. Thus, CAPM model only caters on the pricing of diversifiable
market risk.
The CAPM model assumes that the behavior of an investor is perfectly rational in the
sense that their only concern is the returns from their investment. The investors are not
only interested in the expected returns on an investment they are also concerned with the
possible distribution of rate of return. The risk accompanying a possible investment is
typically characterized by the distribution of such possible returns. While investors are
virtually unanimous in preferring high returns to low returns, it is also the case that most
investors are risk averse. That means they prefer a lower standard deviation to a higher
one given the same expected returns. This implies that if the risk on an investment
appears to be large, investors are likely to accept such high risk only if it is accompanied
by a high expected return and vice versa.
3.1 Methodology
If investors wish to purchase an asset having zero risk, they still demand a return as an
attempt to rearrange current consumption. Such a return is called a risk free rate of return
(rf) in return used to define risk premium on jth
asset, as the excess return over the risk
free rate (rf), that is (rj) - (rf) = risk premium. Investors minimize the risk by diversifying
their investment to a number of securities with varying degree of risk and this concept is
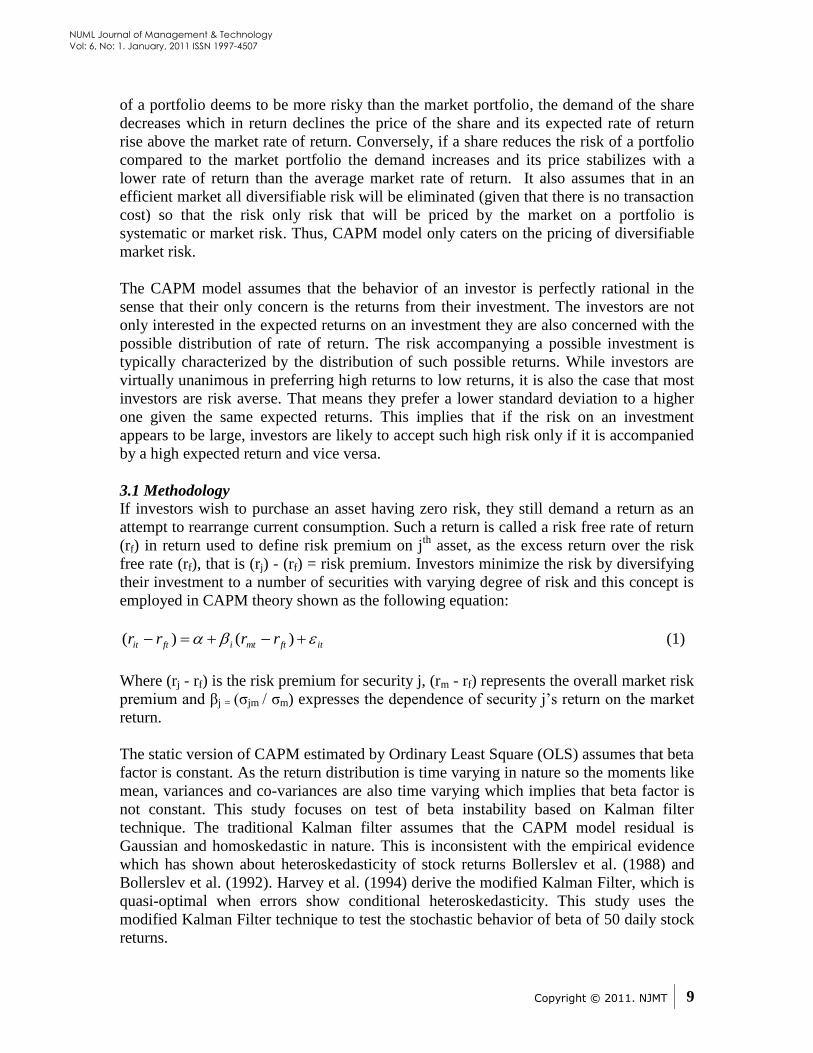
employed in CAPM theory shown as the following equation:
itftmtiftit rrrr )()( (1)
Where (rj - rf) is the risk premium for security j, (rm - rf) represents the overall market risk
premium and βj = (σjm / σm) expresses the dependence of security j‟s return on the market
return.
The static version of CAPM estimated by Ordinary Least Square (OLS) assumes that beta
factor is constant. As the return distribution is time varying in nature so the moments like
mean, variances and co-variances are also time varying which implies that beta factor is
not constant. This study focuses on test of beta instability based on Kalman filter
technique. The traditional Kalman filter assumes that the CAPM model residual is
Gaussian and homoskedastic in nature. This is inconsistent with the empirical evidence
which has shown about heteroskedasticity of stock returns Bollerslev et al. (1988) and
Bollerslev et al. (1992). Harvey et al. (1994) derive the modified Kalman Filter, which is
quasi-optimal when errors show conditional heteroskedasticity. This study uses the
modified Kalman Filter technique to test the stochastic behavior of beta of 50 daily stock
returns.
Copyright © 2011. NJMT
10
NUML Journal of Management & Technology
Vol: 6, No: 1. January, 2011 ISSN 1997-4507
The Kalman Filter technique show best results when errors of state variables with
minimum square estimates are normally distributed Harvey, (1989). However, CAPM
model with this assumption of normality of errors is incompatible as is evident from the
empirical evidence which favors unconditional non-normality in stock returns Bollerslev
et al., (1992) and Harvey et al., (1994) who proposed a modified Kalman filter technique
with presence of GARCH error terms. Influenced by such model, this technique is
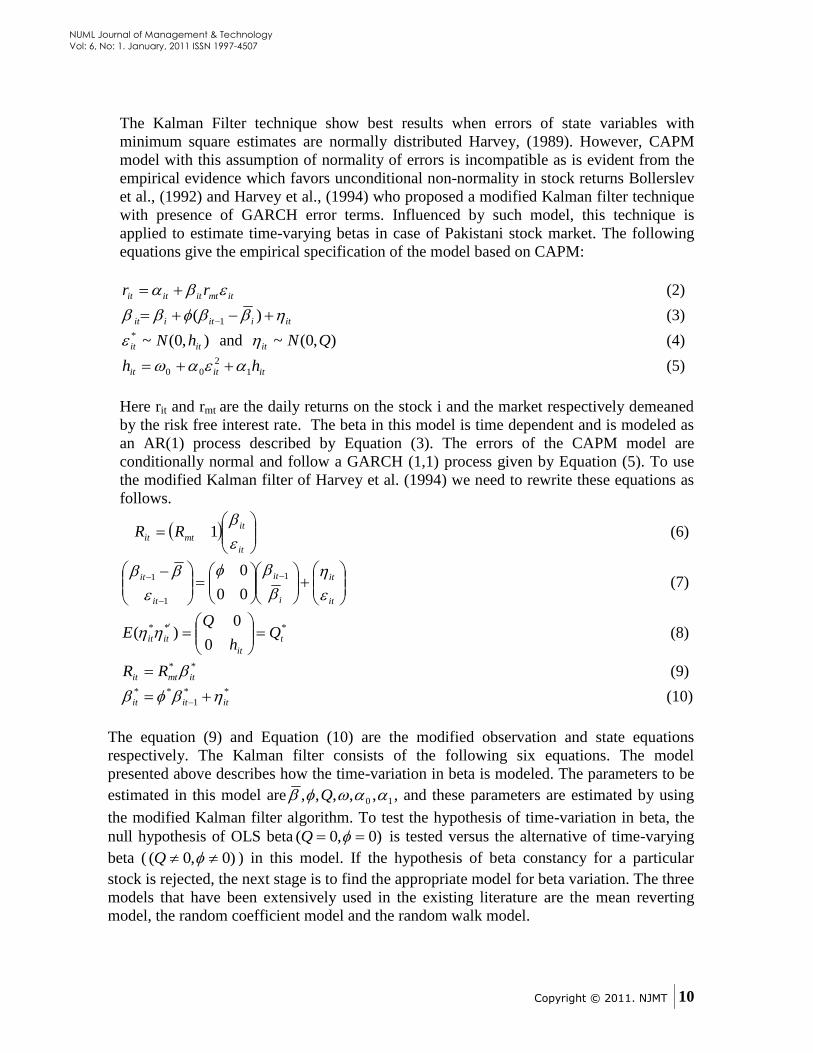
applied to estimate time-varying betas in case of Pakistani stock market. The following
equations give the empirical specification of the model based on CAPM:
itmtititit rr (2)
itiitiit )( 1 (3)
),0(~*
itit hN and ),0(~ QNit (4)
ititit hh 1
2
00 (5)
Here rit and rmt are the daily returns on the stock i and the market respectively demeaned
by the risk free interest rate. The beta in this model is time dependent and is modeled as
an AR(1) process described by Equation (3). The errors of the CAPM model are
conditionally normal and follow a GARCH (1,1) process given by Equation (5). To use
the modified Kalman filter of Harvey et al. (1994) we need to rewrite these equations as
follows.
it
it
mtit RR
1 (6)
it
it
i
it
it
it
1
1
1
00
0 (7)
***
0
0)( t
it
itit Qh
QE
(8)
**
itmtit RR (9) **
1
**
ititit (10)
The equation (9) and Equation (10) are the modified observation and state equations
respectively. The Kalman filter consists of the following six equations. The model
presented above describes how the time-variation in beta is modeled. The parameters to be
estimated in this model are 10 ,,,,, Q , and these parameters are estimated by using
the modified Kalman filter algorithm. To test the hypothesis of time-variation in beta, the
null hypothesis of OLS beta )0,0( Q is tested versus the alternative of time-varying
beta ( )0,0( Q ) in this model. If the hypothesis of beta constancy for a particular
stock is rejected, the next stage is to find the appropriate model for beta variation. The three
models that have been extensively used in the existing literature are the mean reverting
model, the random coefficient model and the random walk model.
Copyright © 2011. NJMT
11
NUML Journal of Management & Technology
Vol: 6, No: 1. January, 2011 ISSN 1997-4507
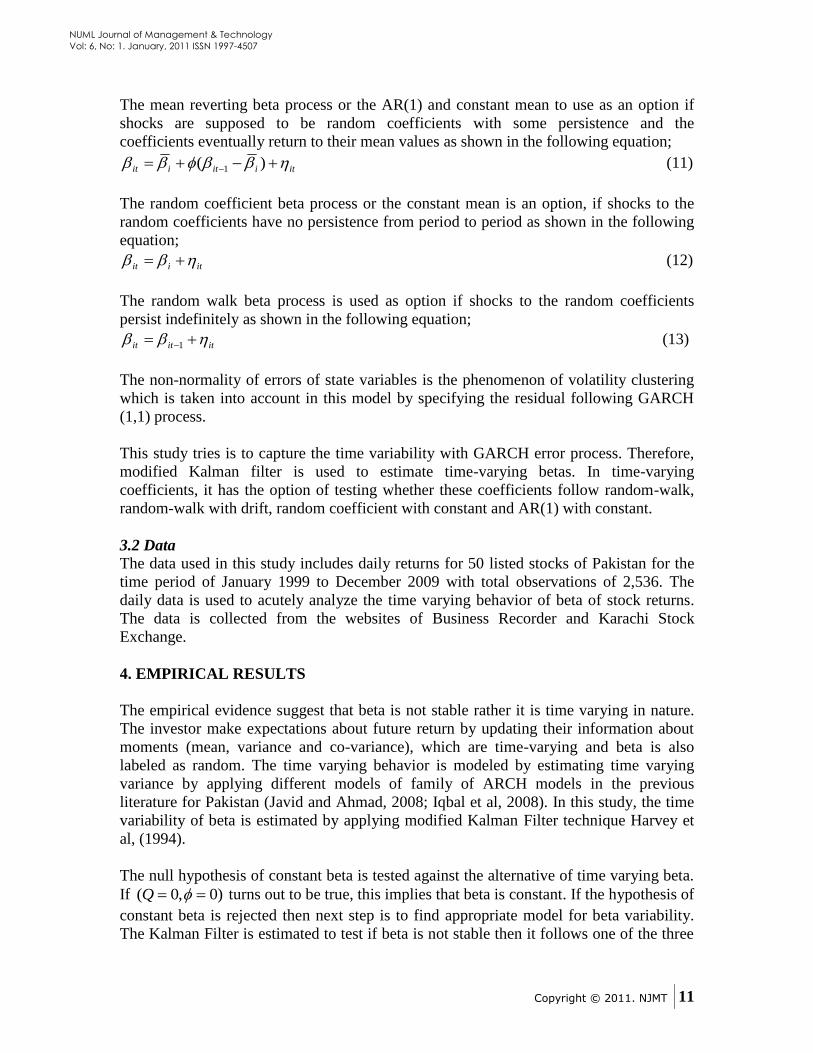
The mean reverting beta process or the AR(1) and constant mean to use as an option if
shocks are supposed to be random coefficients with some persistence and the
coefficients eventually return to their mean values as shown in the following equation;
itiitiit )( 1 (11)
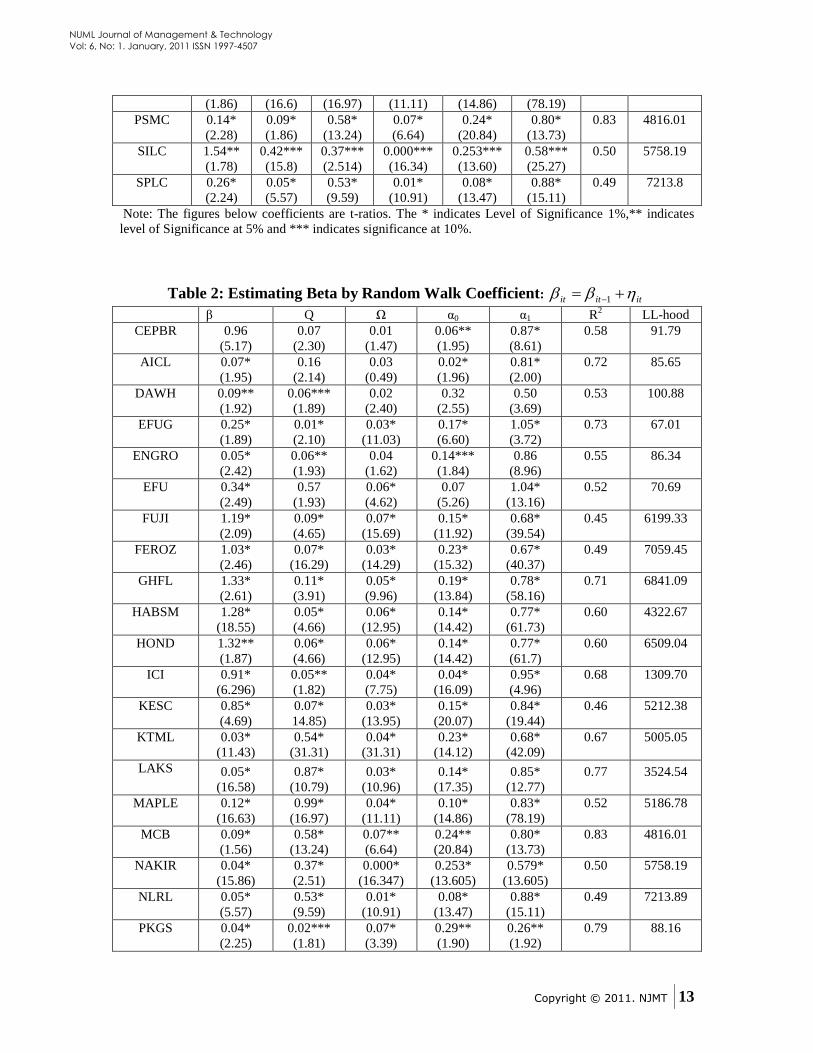
The random coefficient beta process or the constant mean is an option, if shocks to the
random coefficients have no persistence from period to period as shown in the following
equation;
itiit (12)
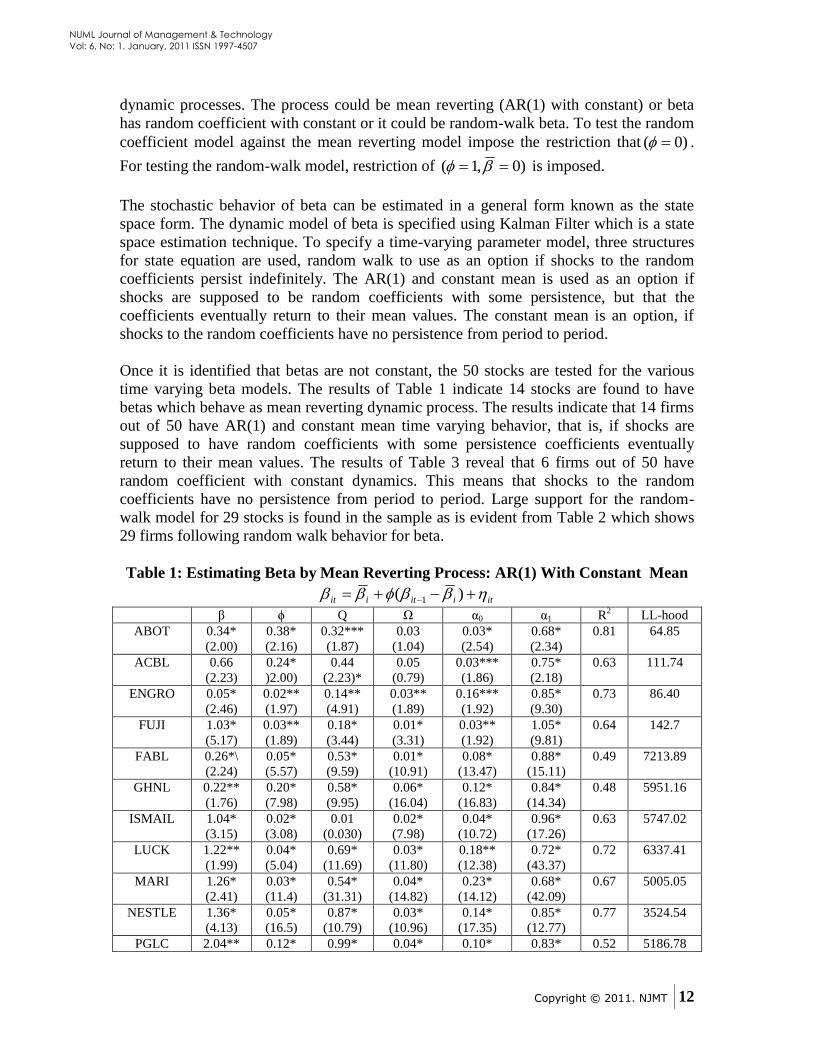
The random walk beta process is used as option if shocks to the random coefficients
persist indefinitely as shown in the following equation;
ititit 1 (13)
The non-normality of errors of state variables is the phenomenon of volatility clustering
which is taken into account in this model by specifying the residual following GARCH
(1,1) process.
This study tries is to capture the time variability with GARCH error process. Therefore,
modified Kalman filter is used to estimate time-varying betas. In time-varying
coefficients, it has the option of testing whether these coefficients follow random-walk,
random-walk with drift, random coefficient with constant and AR(1) with constant.
3.2 Data
The data used in this study includes daily returns for 50 listed stocks of Pakistan for the
time period of January 1999 to December 2009 with total observations of 2,536. The
daily data is used to acutely analyze the time varying behavior of beta of stock returns.
The data is collected from the websites of Business Recorder and Karachi Stock
Exchange.
4. EMPIRICAL RESULTS
The empirical evidence suggest that beta is not stable rather it is time varying in nature.
The investor make expectations about future return by updating their information about
moments (mean, variance and co-variance), which are time-varying and beta is also
labeled as random. The time varying behavior is modeled by estimating time varying
variance by applying different models of family of ARCH models in the previous
literature for Pakistan (Javid and Ahmad, 2008; Iqbal et al, 2008). In this study, the time
variability of beta is estimated by applying modified Kalman Filter technique Harvey et
al, (1994).
The null hypothesis of constant beta is tested against the alternative of time varying beta.
If )0,0( Q turns out to be true, this implies that beta is constant. If the hypothesis of
constant beta is rejected then next step is to find appropriate model for beta variability.
The Kalman Filter is estimated to test if beta is not stable then it follows one of the three
Copyright © 2011. NJMT
12
NUML Journal of Management & Technology
Vol: 6, No: 1. January, 2011 ISSN 1997-4507
dynamic processes. The process could be mean reverting (AR(1) with constant) or beta
has random coefficient with constant or it could be random-walk beta. To test the random
coefficient model against the mean reverting model impose the restriction that )0( .
For testing the random-walk model, restriction of )0,1( is imposed.
The stochastic behavior of beta can be estimated in a general form known as the state
space form. The dynamic model of beta is specified using Kalman Filter which is a state
space estimation technique. To specify a time-varying parameter model, three structures
for state equation are used, random walk to use as an option if shocks to the random
coefficients persist indefinitely. The AR(1) and constant mean is used as an option if
shocks are supposed to be random coefficients with some persistence, but that the
coefficients eventually return to their mean values. The constant mean is an option, if
shocks to the random coefficients have no persistence from period to period.
Once it is identified that betas are not constant, the 50 stocks are tested for the various
time varying beta models. The results of Table 1 indicate 14 stocks are found to have
betas which behave as mean reverting dynamic process. The results indicate that 14 firms
out of 50 have AR(1) and constant mean time varying behavior, that is, if shocks are
supposed to have random coefficients with some persistence coefficients eventually
return to their mean values. The results of Table 3 reveal that 6 firms out of 50 have
random coefficient with constant dynamics. This means that shocks to the random
coefficients have no persistence from period to period. Large support for the random-
walk model for 29 stocks is found in the sample as is evident from Table 2 which shows
29 firms following random walk behavior for beta.
Table 1: Estimating Beta by Mean Reverting Process: AR(1) With Constant Mean
itiitiit )( 1
β ϕ Q Ω α0 α1 R2 LL-hood
ABOT 0.34*
(2.00)
0.38*
(2.16)
0.32***
(1.87)
0.03
(1.04)
0.03*
(2.54)
0.68*
(2.34)
0.81 64.85
ACBL 0.66
(2.23)
0.24*
)2.00)
0.44
(2.23)*
0.05
(0.79)
0.03***
(1.86)
0.75*
(2.18)
0.63 111.74
ENGRO 0.05*
(2.46)
0.02**
(1.97)
0.14**
(4.91)
0.03**
(1.89)
0.16***
(1.92)
0.85*
(9.30)
0.73 86.40
FUJI 1.03*
(5.17)
0.03**
(1.89)
0.18*
(3.44)
0.01*
(3.31)
0.03**
(1.92)
1.05*
(9.81)
0.64 142.7
FABL 0.26*\
(2.24)
0.05*
(5.57)
0.53*
(9.59)
0.01*
(10.91)
0.08*
(13.47)
0.88*
(15.11)
0.49
7213.89
GHNL 0.22**
(1.76)
0.20*
(7.98)
0.58*
(9.95)
0.06*
(16.04)
0.12*
(16.83)
0.84*
(14.34)
0.48
5951.16
ISMAIL 1.04*
(3.15)
0.02*
(3.08)
0.01
(0.030)
0.02*
(7.98)
0.04*
(10.72)
0.96*
(17.26)
0.63
5747.02
LUCK 1.22**
(1.99)
0.04*
(5.04)
0.69*
(11.69)
0.03*
(11.80)
0.18**
(12.38)
0.72*
(43.37)
0.72
6337.41
MARI 1.26*
(2.41)
0.03*
(11.4)
0.54*
(31.31)
0.04*
(14.82)
0.23*
(14.12)
0.68*
(42.09)
0.67
5005.05
NESTLE 1.36*
(4.13)
0.05*
(16.5)
0.87*
(10.79)
0.03*
(10.96)
0.14*
(17.35)
0.85*
(12.77)
0.77
3524.54
PGLC 2.04** 0.12* 0.99* 0.04* 0.10* 0.83* 0.52 5186.78
Copyright © 2011. NJMT
13
NUML Journal of Management & Technology
Vol: 6, No: 1. January, 2011 ISSN 1997-4507
(1.86) (16.6) (16.97) (11.11) (14.86) (78.19)
PSMC 0.14*
(2.28)
0.09*
(1.86)
0.58*
(13.24)
0.07*
(6.64)
0.24*
(20.84)
0.80*
(13.73)
0.83
4816.01
SILC 1.54**
(1.78)
0.42***
(15.8)
0.37***
(2.514)
0.000***
(16.34)
0.253***
(13.60)
0.58***
(25.27)
0.50
5758.19
SPLC 0.26*
(2.24)
0.05*
(5.57)
0.53*
(9.59)
0.01*
(10.91)
0.08*
(13.47)
0.88*
(15.11)
0.49
7213.8
Note: The figures below coefficients are t-ratios. The * indicates Level of Significance 1%,** indicates
level of Significance at 5% and *** indicates significance at 10%.
Table 2: Estimating Beta by Random Walk Coefficient: ititit 1
β Q Ω α0 α1 R2 LL-hood
CEPBR 0.96
(5.17)
0.07
(2.30)
0.01
(1.47)
0.06**
(1.95)
0.87*
(8.61)
0.58 91.79
AICL 0.07*
(1.95)
0.16
(2.14)
0.03
(0.49)
0.02*
(1.96)
0.81*
(2.00)
0.72 85.65
DAWH 0.09**
(1.92)
0.06***
(1.89)
0.02
(2.40)
0.32
(2.55)
0.50
(3.69)
0.53 100.88
EFUG 0.25*
(1.89)
0.01*
(2.10)
0.03*
(11.03)
0.17*
(6.60)
1.05*
(3.72)
0.73 67.01
ENGRO 0.05*
(2.42)
0.06**
(1.93)
0.04
(1.62)
0.14***
(1.84)
0.86
(8.96)
0.55 86.34
EFU 0.34*
(2.49)
0.57
(1.93)
0.06*
(4.62)
0.07
(5.26)
1.04*
(13.16)
0.52 70.69
FUJI 1.19*
(2.09)
0.09*
(4.65)
0.07*
(15.69)
0.15*
(11.92)
0.68*
(39.54)
0.45
6199.33
FEROZ 1.03*
(2.46)
0.07*
(16.29)
0.03*
(14.29)
0.23*
(15.32)
0.67*
(40.37)
0.49
7059.45
GHFL 1.33*
(2.61)
0.11*
(3.91)
0.05*
(9.96)
0.19*
(13.84)
0.78*
(58.16)
0.71
6841.09
HABSM 1.28*
(18.55)
0.05*
(4.66)
0.06*
(12.95)
0.14*
(14.42)
0.77*
(61.73)
0.60
4322.67
HOND 1.32**
(1.87)
0.06*
(4.66)
0.06*
(12.95)
0.14*
(14.42)
0.77*
(61.7)
0.60
6509.04
ICI 0.91*
(6.296)
0.05**
(1.82)
0.04*
(7.75)
0.04*
(16.09)
0.95*
(4.96)
0.68
1309.70
KESC 0.85*
(4.69)
0.07*
14.85)
0.03*
(13.95)
0.15*
(20.07)
0.84*
(19.44)
0.46
5212.38
KTML 0.03*
(11.43)
0.54*
(31.31)
0.04*
(31.31)
0.23*
(14.12)
0.68*
(42.09)
0.67
5005.05
LAKS 0.05*
(16.58)
0.87*
(10.79)
0.03*
(10.96)
0.14*
(17.35)
0.85*
(12.77)
0.77
3524.54
MAPLE 0.12*
(16.63)
0.99*
(16.97)
0.04*
(11.11)
0.10*
(14.86)
0.83*
(78.19)
0.52
5186.78
MCB 0.09*
(1.56)
0.58*
(13.24)
0.07**
(6.64)
0.24**
(20.84)
0.80*
(13.73)
0.83
4816.01
NAKIR 0.04*
(15.86)
0.37*
(2.51)
0.000*
(16.347)
0.253*
(13.605)
0.579*
(13.605)
0.50
5758.19
NLRL 0.05*
(5.57)
0.53*
(9.59)
0.01*
(10.91)
0.08*
(13.47)
0.88*
(15.11)
0.49
7213.89
PKGS 0.04*
(2.25)
0.02***
(1.81)
0.07*
(3.39)
0.29**
(1.90)
0.26**
(1.92)
0.79 88.16
Copyright © 2011. NJMT
14
NUML Journal of Management & Technology
Vol: 6, No: 1. January, 2011 ISSN 1997-4507
PAKMI 0.05*
(16.58)
0.87*
(10.79)
0.03*
(10.96)
0.14*
(17.35)
0.85*
(12.77)
0.77
3524.54
PAKD 0.05*
(2.42)
0.06**
(1.93)
0.04
(1.62)
0.14***
(1.84)
0.86
(8.96)
0.55 86.34
PECO 0.09**
(1.92)
0.06***
(1.89)
0.02
(2.40)
0.32
(2.55)
0.50
(3.69)
0.53 100.88
PAKT 0.25*
(1.89)
0.01*
(2.10)
0.03*
(11.03)
0.17*
(6.60)
1.05*
(3.72)
0.73 67.01
PIAA 1.19*
(2.09)
0.09*
(4.65)
0.07*
(15.69)
0.15*
(11.92)
0.68*
(39.54)
0.45
6199.33
PTCLA 1.03*
(2.46)
0.07*
(16.29)
0.03*
(14.29)
0.23*
(15.32)
0.67*
(40.37)
0.49
7059.45
SHELL 1.28*
(18.55)
0.05*
(4.66)
0.06*
(12.95)
0.14*
(14.42)
0.77*
(61.73)
0.60
4322.67
SITC 1.32**
(1.87)
0.06*
(4.66)
0.06*
(12.95)
0.14*
(14.42)
0.77*
(61.7)
0.60
6509.04
ULEVER 0.04*
(2.25)
0.02***
(1.81)
0.07
(3.39)
0.29**
(1.90)
0.26*
(1.92)
0.79 88.16
Note: The figures below coefficients are t-ratios. The * indicates Level of Significance 1%,** indicates
level of Significance at 5% and *** indicates significance at 10%.
Table 3: Estimating Beta by Random Coefficient: Constant Mean plus Noise
Coefficient: itiit
β Q Ω α0 α1 R2 LL-hood
CEPBR 0.72
(1.96)
0.46
(38.22)
0.01
(1.47)
0.06**
(1.95)
0.87*
(8.61)
0.58 91.79
DADX 0.07***
(1.83)
0.02**
(1.92)
0.03*
(4.79)
0.06*
(13.87)
1.02*
(9.87)
0.84 106.73
DAWH 0.04*
(2.25)
0.02***
(1.81)
0.07
(3.39)
0.29**
(1.90)
0.26*
(1.92)
0.79 88.16
FZTM 1.44*
(3.05)
0.02*
13.06)
0.04**
(16.56)
0.29*
(18.39)
0.68*
(43.27)
0.56
3651.75
JDW 1.01**
(1.84)
0.04*
(17.61)
0.07*
(26.21)
1.17*
(53.66)
0.12*
(10.98)
0.85
5756.27
NIRE 0.05*
(2.42)
0.06**
(1.93)
0.04
(1.62)
0.14***
(1.84)
0.86
(8.96)
0.55 86.34
Note: The figures below coefficients are t-ratios. The * indicates Level of Significance 1%,** indicates
level of Significance at 5% and *** indicates significance at 10%.
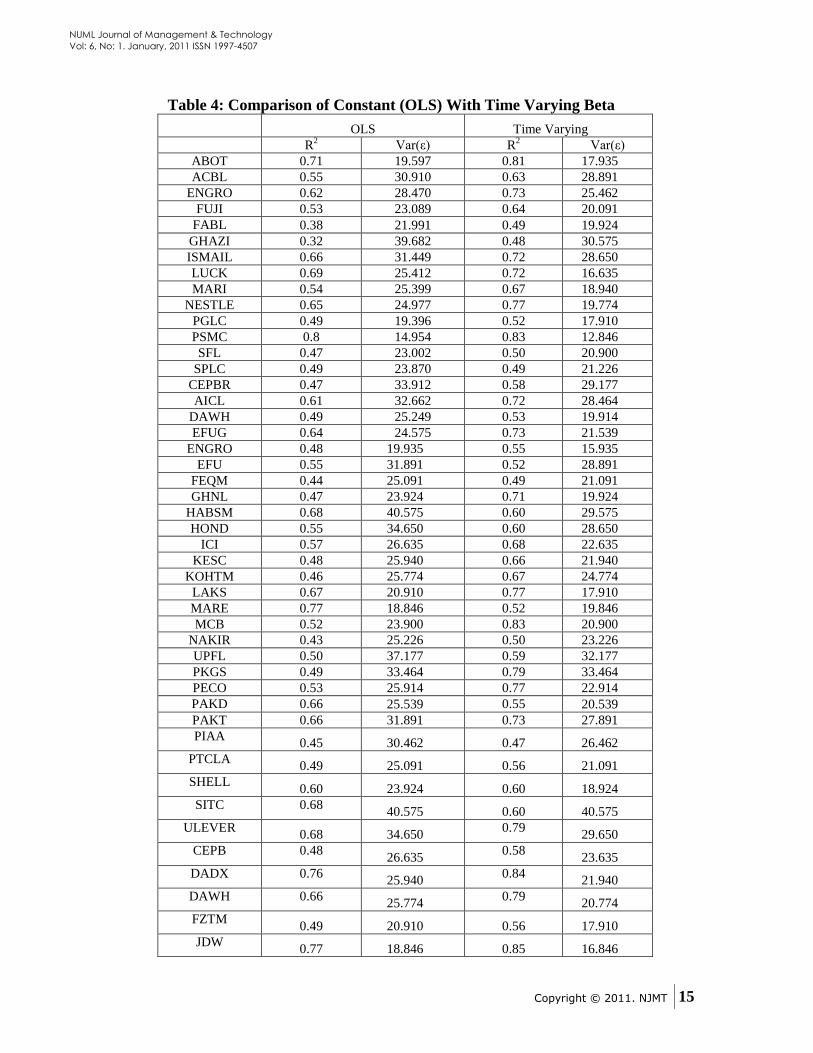
The improvement in fit of time-varying beta over the traditional constant beta estimated
by OLS in CAPM model is compared by two estimation methods; the coefficient of
determination (R2) and the variances of the errors. The results of time-varying model
show significant gains in defining accuracy in terms of a higher R2 and lower variance
when beta is allowed to follow an appropriate time-varying model.
Copyright © 2011. NJMT
15
NUML Journal of Management & Technology
Vol: 6, No: 1. January, 2011 ISSN 1997-4507
Table 4: Comparison of Constant (OLS) With Time Varying Beta
OLS Time Varying
R2 Var(ε) R
2 Var(ε)
ABOT 0.71 19.597 0.81 17.935
ACBL 0.55 30.910 0.63 28.891
ENGRO 0.62 28.470 0.73 25.462
FUJI 0.53 23.089 0.64 20.091
FABL 0.38 21.991 0.49 19.924
GHAZI 0.32 39.682 0.48 30.575
ISMAIL 0.66 31.449 0.72 28.650
LUCK 0.69 25.412 0.72 16.635
MARI 0.54 25.399 0.67 18.940
NESTLE 0.65 24.977 0.77 19.774
PGLC 0.49 19.396 0.52 17.910
PSMC 0.8 14.954 0.83 12.846
SFL 0.47 23.002 0.50 20.900
SPLC 0.49 23.870 0.49 21.226
CEPBR 0.47 33.912 0.58 29.177
AICL 0.61 32.662 0.72 28.464
DAWH 0.49 25.249 0.53 19.914
EFUG 0.64 24.575 0.73 21.539
ENGRO 0.48 19.935 0.55 15.935
EFU 0.55 31.891 0.52 28.891
FEQM 0.44 25.091 0.49 21.091
GHNL 0.47 23.924 0.71 19.924
HABSM 0.68 40.575 0.60 29.575
HOND 0.55 34.650 0.60 28.650
ICI 0.57 26.635 0.68 22.635
KESC 0.48 25.940 0.66 21.940
KOHTM 0.46 25.774 0.67 24.774
LAKS 0.67 20.910 0.77 17.910
MARE 0.77 18.846 0.52 19.846
MCB 0.52 23.900 0.83 20.900
NAKIR 0.43 25.226 0.50 23.226
UPFL 0.50 37.177 0.59 32.177
PKGS 0.49 33.464 0.79 33.464
PECO 0.53 25.914 0.77 22.914
PAKD 0.66 25.539 0.55 20.539
PAKT 0.66 31.891 0.73 27.891
PIAA 0.45 30.462 0.47 26.462
PTCLA 0.49 25.091 0.56 21.091
SHELL 0.60 23.924 0.60 18.924
SITC 0.68 40.575 0.60 40.575
ULEVER 0.68 34.650
0.79 29.650
CEPB 0.48 26.635
0.58 23.635
DADX 0.76 25.940
0.84 21.940
DAWH 0.66 25.774
0.79 20.774
FZTM 0.49 20.910 0.56 17.910
JDW 0.77 18.846 0.85 16.846
Copyright © 2011. NJMT
16
NUML Journal of Management & Technology
Vol: 6, No: 1. January, 2011 ISSN 1997-4507
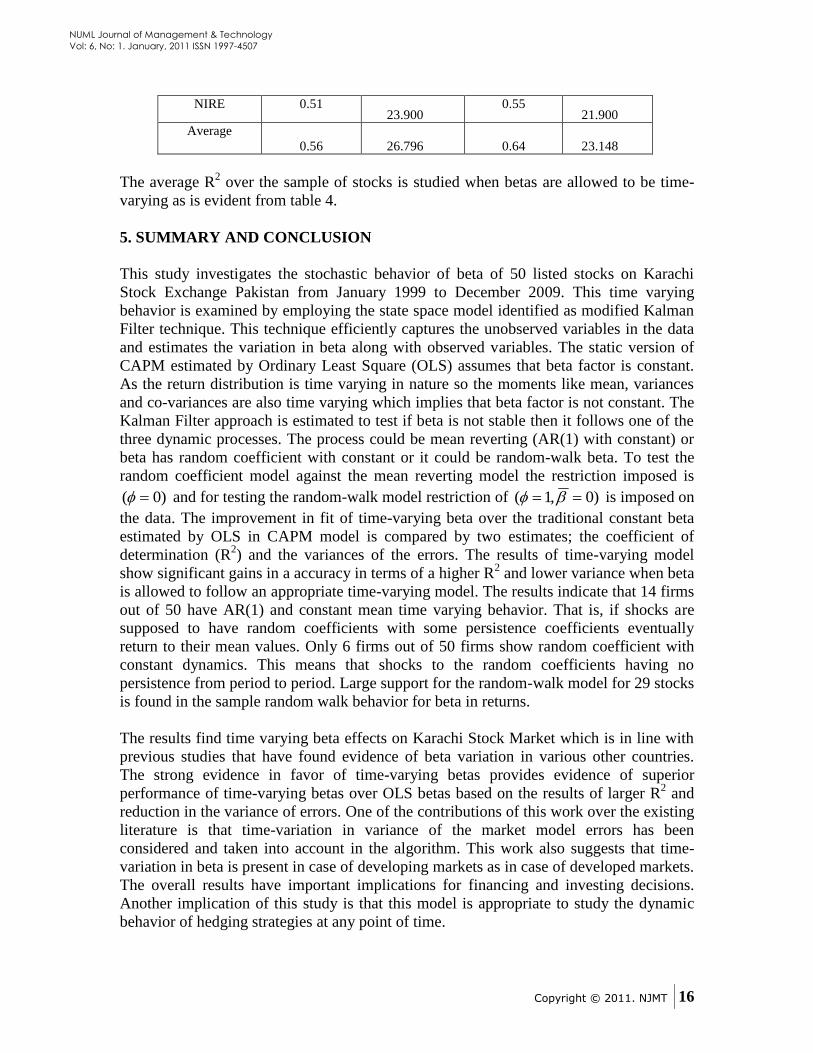
NIRE 0.51 23.900
0.55 21.900
Average
0.56
26.796
0.64 23.148
The average R2 over the sample of stocks is studied when betas are allowed to be time-
varying as is evident from table 4.
5. SUMMARY AND CONCLUSION
This study investigates the stochastic behavior of beta of 50 listed stocks on Karachi
Stock Exchange Pakistan from January 1999 to December 2009. This time varying
behavior is examined by employing the state space model identified as modified Kalman
Filter technique. This technique efficiently captures the unobserved variables in the data
and estimates the variation in beta along with observed variables. The static version of
CAPM estimated by Ordinary Least Square (OLS) assumes that beta factor is constant.
As the return distribution is time varying in nature so the moments like mean, variances
and co-variances are also time varying which implies that beta factor is not constant. The
Kalman Filter approach is estimated to test if beta is not stable then it follows one of the
three dynamic processes. The process could be mean reverting (AR(1) with constant) or
beta has random coefficient with constant or it could be random-walk beta. To test the
random coefficient model against the mean reverting model the restriction imposed is
)0( and for testing the random-walk model restriction of )0,1( is imposed on
the data. The improvement in fit of time-varying beta over the traditional constant beta
estimated by OLS in CAPM model is compared by two estimates; the coefficient of
determination (R2) and the variances of the errors. The results of time-varying model
show significant gains in a accuracy in terms of a higher R2 and lower variance when beta
is allowed to follow an appropriate time-varying model. The results indicate that 14 firms
out of 50 have AR(1) and constant mean time varying behavior. That is, if shocks are
supposed to have random coefficients with some persistence coefficients eventually
return to their mean values. Only 6 firms out of 50 firms show random coefficient with
constant dynamics. This means that shocks to the random coefficients having no
persistence from period to period. Large support for the random-walk model for 29 stocks
is found in the sample random walk behavior for beta in returns.
The results find time varying beta effects on Karachi Stock Market which is in line with
previous studies that have found evidence of beta variation in various other countries.
The strong evidence in favor of time-varying betas provides evidence of superior
performance of time-varying betas over OLS betas based on the results of larger R2 and
reduction in the variance of errors. One of the contributions of this work over the existing
literature is that time-variation in variance of the market model errors has been
considered and taken into account in the algorithm. This work also suggests that time-
variation in beta is present in case of developing markets as in case of developed markets.
The overall results have important implications for financing and investing decisions.
Another implication of this study is that this model is appropriate to study the dynamic
behavior of hedging strategies at any point of time.
Copyright © 2011. NJMT
17
NUML Journal of Management & Technology
Vol: 6, No: 1. January, 2011 ISSN 1997-4507
REFERENCES
Ang, A., and Lin, J., (2004), „How to discount Cash flows With Time Varying Expected
Returns‟, The Journal of Finance, Vol.59 (6):2745-2783.
Asgharian, H., and Hansson, B., (2000), „Cross-Sectional Analysis Of Swedish Stock
Returns With Time Varying Beta: The Swedish Stock Market 1983-96‟,
European Financial Management, Vol.6 (2):213-233.
Bali, T., G., Cakici, N., and Tang, Y., (2009), „The Conditional Beta and the Cross-
Section of expected returns‟, Financial management, Vol.38 (1):103-107.
Bauer, R., Cosean, M., and Schotman, P., C., (2008), „Conditional asset pricing And
Stock Market anomalies In Europe‟, European Financial Management, and
Vol.16 (2):165-190.
Bollerslev, T., Chou, R., and Kroner, F., K., (1992), „ARCH Modeling In Finance:A
Review Of The Theory And Empirical Evidence‟, Journal of Econometrics,
Vol.52:5-59.
Bollerslev, T., Engle, R., F., and Wooldridge, J., M., (1988), „ A Capital Asset Priocing
Model With Time-Varying Covariances‟, Journal of Political Economy,
Vol.96(1):116-131.
Chan, W., H., and Maheu, J., M., (2002), „Conditional Jump Dynamics In Stock market
Returns‟, Journal Of Business And Economic Statistics, Vol.20(3):377-389.
Choudhry, T., (2001), „The Long Memory Of Time-varying Beta: Examination of Three
Emerging Asian Stock Markets‟, Managerial Finance, Vol.27(1/2):5-23.
Choudhry, T., and Wu, H., (2008). „Forecasting Ability of GARCH vs Kalman Filter
Method: Evidence from Daily U.K. Time Varying Beta‟, Journal Of Forecasting,
Vol.27:670-689.
Compton, R., a., and Silva, J., R., (2005), „Finance and The Business Cycle: A Kalman
filter approach With Markov Switching‟, Central Bank of Brazil Working Paper,
No. 97.
Faff, R., W., Hillier, D., and Hillier, J., (2000), „Time Varying Beta Risk: An Analysis of
Alternative Modelling Techniques‟, Journal Of Business Finance and
Accounting, Vol.27(5):523-554.
Grieb, T., and Reyes, M., (2001), „Time-Varying Betas in an Emerging Stock Market,
The case of Brazil‟, American Business Review, Vol.19:118-124.
Harvey, A., C., (1989), „Forecasting, Structural Time Series Models and The Kalman
Filter‟, Cambridge, UK:Cambridge University Press.
Harvey, A., C., Ruiz, E., and Shephard, N., (1994), „Multivariate Stochastic Variance
Models‟, Review of Economic Studies, Vol.61:247-264.
Hodgson, D., J., and Vorkink, K., P., (2003), „Efficient Estimation Of Conditional Asset
Pricing Models‟, Journal Of Business And Economic Statistics, Vol.21(2):269-
283.
Iqbal, J., Brooks, R., D., and Galagedera, D., U., A., Galagedera, (2008), „Testing
Conditional Asset Pricing Model: An Emerging Market Perspective‟, Working
Paper 3/08, Monash University, Australia.
Javid, A., Y., and Ahmad, E., (2008), „Conditional Capital Asset Pricing Model:Evidence
from Pakistani Listed Companies‟, PIDE Working 49.
Copyright © 2011. NJMT
18
NUML Journal of Management & Technology
Vol: 6, No: 1. January, 2011 ISSN 1997-4507
Jong, F., (2000), „Time Series and Cross-Section Information in Affine Term Structure
Models‟, Journal Of Business and Economic Statistics, Vol.18(3):300-314.
Jostova, G., and Philipov, A., (2005), „Bayesian Analysis Of Stochastic Betas‟, The
Journal Of Financial And Quantitative Analysis, Vol.40(4):747-778.
Karathanasis, G., Kassimatis, K., and Spyrou, S., (2010), „Size And Momentum In
European Equity Markets; Empirical Findings From Varying Beta Capital Asset
Pricing Model‟, Accounting And Finance, Vol.50:143-169.
Lam, K., S., K., (2001), „The Conditional Relation Between Beta And Returns In The
Hong Kong Stock Market‟, Applied Financial Economics, Vol.11:669-680.
Lettau, M., and Ludvigson, S., (2001), „Resurrecting The (C)CAPM: A Cross-sectional
Test When Risk Premia Are Time Varying‟, Journal Of Political Economy,
Vol.109(6):1238-1287.
Lin, H., and Lin, W., (2000), „A Dynamic and Stochastic Beta and Its implications in
Global Capital Markets‟, International Finance, Vol.3 (1):123-160.
Lintner, J., (1965), „The Valuation of Risky Assets and the Selection of Risky
Investments in Stock Portfolios and Capital Budgets‟, Review of Economics and
Statistics, Vol.47:13-37.
Mergner, S., and Bulla, J., (2008), „Time Varying Beta Risk of Pan-European Industry
Portfolios: A Comparison Of Alternative Modeling Techniques, European
Journal Of Finance, Vol.14(8):771-802.
Moonis, S., A., and Shah, A., (2003),‟Testing For Time Variation In Beta In India‟,
Journal Of Emerging Markets Finance, Vol.2(2):163-180.
Rockinger, M., and Urga,G., (2001), „A Time Varying Parameter Model To Test For
Predictability And Integration In the Stock Markets Of Transition Economies‟,
Journal Of Business And Economic Statistics, Vol.19(1):73-84.
Sharpe, W., (1964), „Capital Asset Prices: A Theory of Market Equilibrium Under
Conditions of Risk‟, Journal of Finance, Vol.19:425-442.
Copyright © 2011. NJMT
19
NUML Journal of Management & Technology
Vol: 6, No: 1. January, 2011 ISSN 1997-4507
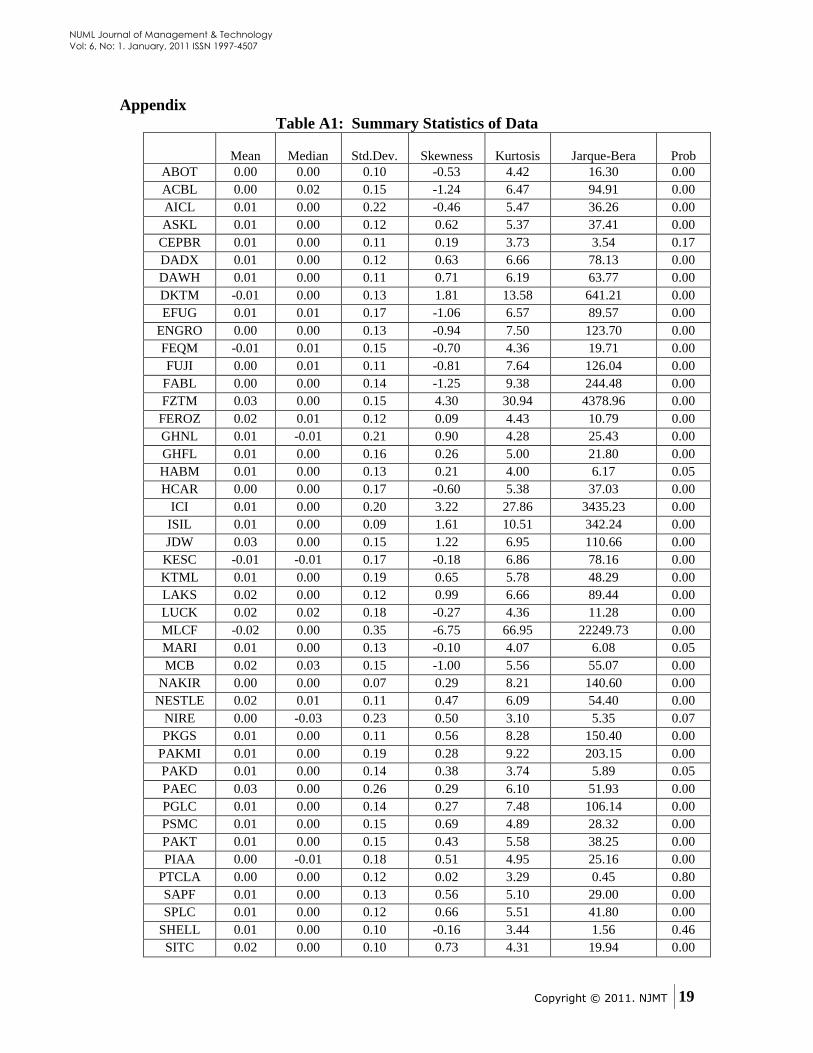
Appendix
Table A1: Summary Statistics of Data
Mean
Median
Std.Dev.
Skewness
Kurtosis
Jarque-Bera
Prob
ABOT 0.00 0.00 0.10 -0.53 4.42 16.30 0.00
ACBL 0.00 0.02 0.15 -1.24 6.47 94.91 0.00
AICL 0.01 0.00 0.22 -0.46 5.47 36.26 0.00
ASKL 0.01 0.00 0.12 0.62 5.37 37.41 0.00
CEPBR 0.01 0.00 0.11 0.19 3.73 3.54 0.17
DADX 0.01 0.00 0.12 0.63 6.66 78.13 0.00
DAWH 0.01 0.00 0.11 0.71 6.19 63.77 0.00
DKTM -0.01 0.00 0.13 1.81 13.58 641.21 0.00
EFUG 0.01 0.01 0.17 -1.06 6.57 89.57 0.00
ENGRO 0.00 0.00 0.13 -0.94 7.50 123.70 0.00
FEQM -0.01 0.01 0.15 -0.70 4.36 19.71 0.00
FUJI 0.00 0.01 0.11 -0.81 7.64 126.04 0.00
FABL 0.00 0.00 0.14 -1.25 9.38 244.48 0.00
FZTM 0.03 0.00 0.15 4.30 30.94 4378.96 0.00
FEROZ 0.02 0.01 0.12 0.09 4.43 10.79 0.00
GHNL 0.01 -0.01 0.21 0.90 4.28 25.43 0.00
GHFL 0.01 0.00 0.16 0.26 5.00 21.80 0.00
HABM 0.01 0.00 0.13 0.21 4.00 6.17 0.05
HCAR 0.00 0.00 0.17 -0.60 5.38 37.03 0.00
ICI 0.01 0.00 0.20 3.22 27.86 3435.23 0.00
ISIL 0.01 0.00 0.09 1.61 10.51 342.24 0.00
JDW 0.03 0.00 0.15 1.22 6.95 110.66 0.00
KESC -0.01 -0.01 0.17 -0.18 6.86 78.16 0.00
KTML 0.01 0.00 0.19 0.65 5.78 48.29 0.00
LAKS 0.02 0.00 0.12 0.99 6.66 89.44 0.00
LUCK 0.02 0.02 0.18 -0.27 4.36 11.28 0.00
MLCF -0.02 0.00 0.35 -6.75 66.95 22249.73 0.00
MARI 0.01 0.00 0.13 -0.10 4.07 6.08 0.05
MCB 0.02 0.03 0.15 -1.00 5.56 55.07 0.00
NAKIR 0.00 0.00 0.07 0.29 8.21 140.60 0.00
NESTLE 0.02 0.01 0.11 0.47 6.09 54.40 0.00
NIRE 0.00 -0.03 0.23 0.50 3.10 5.35 0.07
PKGS 0.01 0.00 0.11 0.56 8.28 150.40 0.00
PAKMI 0.01 0.00 0.19 0.28 9.22 203.15 0.00
PAKD 0.01 0.00 0.14 0.38 3.74 5.89 0.05
PAEC 0.03 0.00 0.26 0.29 6.10 51.93 0.00
PGLC 0.01 0.00 0.14 0.27 7.48 106.14 0.00
PSMC 0.01 0.00 0.15 0.69 4.89 28.32 0.00
PAKT 0.01 0.00 0.15 0.43 5.58 38.25 0.00
PIAA 0.00 -0.01 0.18 0.51 4.95 25.16 0.00
PTCLA 0.00 0.00 0.12 0.02 3.29 0.45 0.80
SAPF 0.01 0.00 0.13 0.56 5.10 29.00 0.00
SPLC 0.01 0.00 0.12 0.66 5.51 41.80 0.00
SHELL 0.01 0.00 0.10 -0.16 3.44 1.56 0.46
SITC 0.02 0.00 0.10 0.73 4.31 19.94 0.00
Copyright © 2011. NJMT
20
NUML Journal of Management & Technology
Vol: 6, No: 1. January, 2011 ISSN 1997-4507
UPFL 0.01 0.00 0.07 1.19 12.07 458.09 0.00
YOUTM 0.00 0.00 0.19 0.20 4.19 8.08 0.02
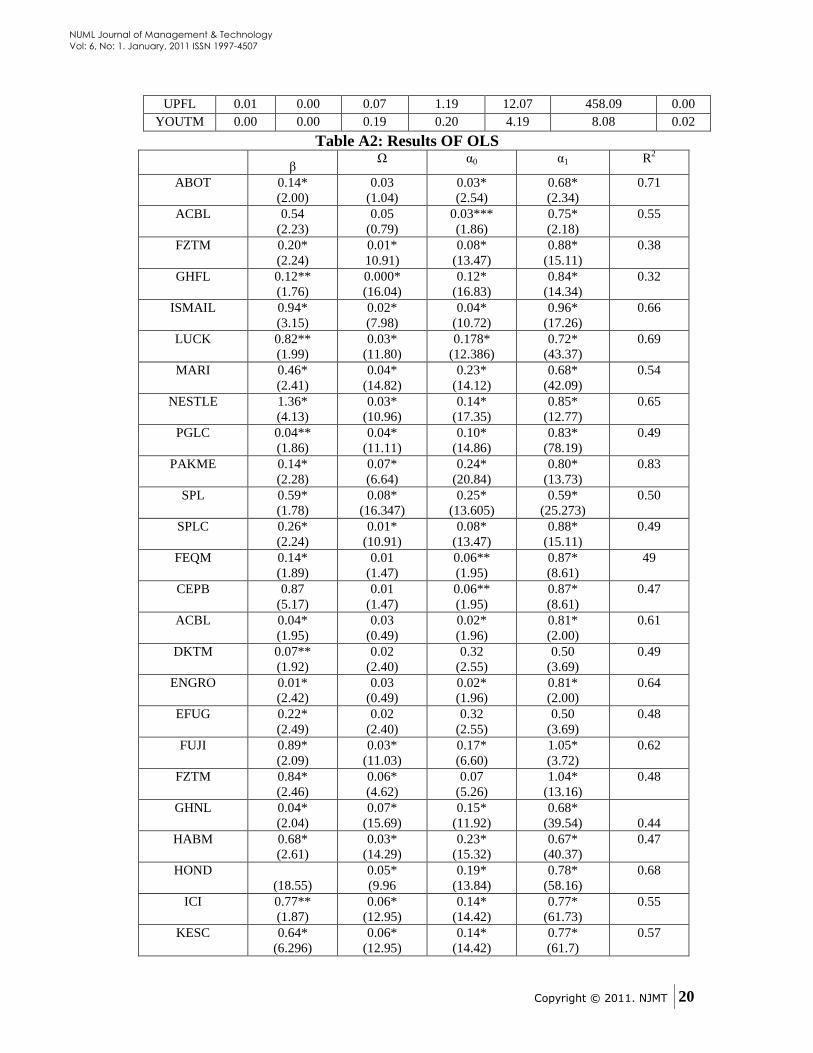
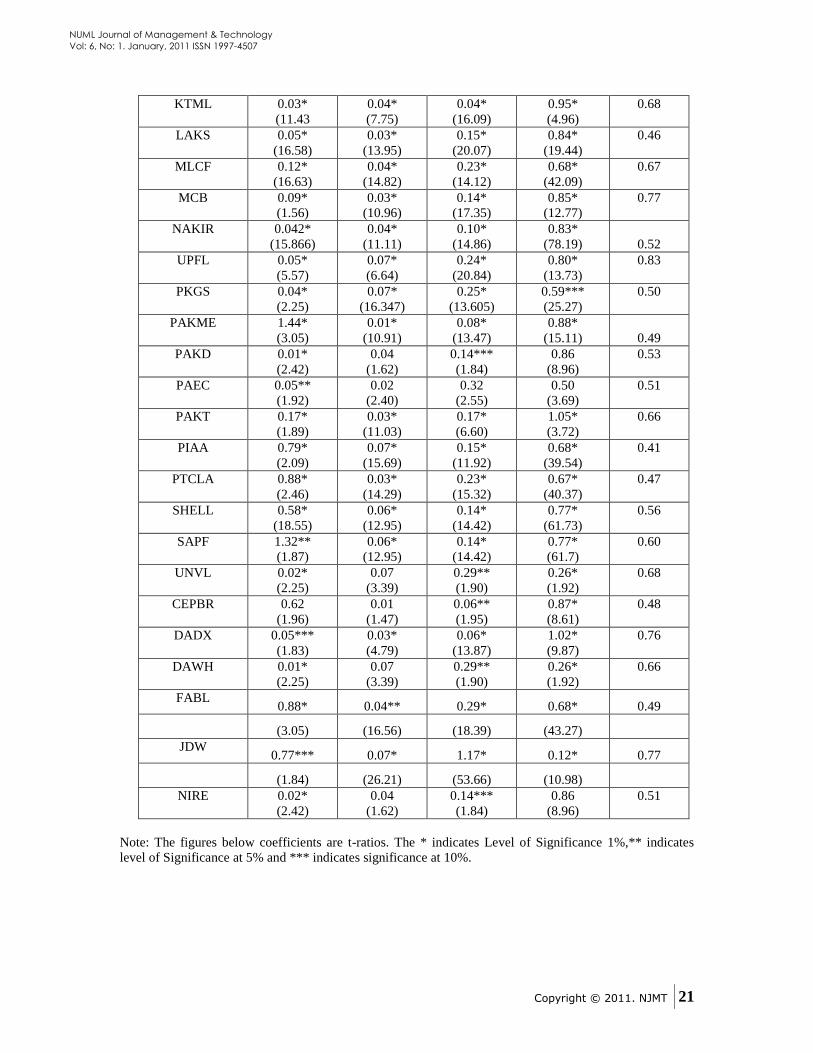
Table A2: Results OF OLS
β Ω α0 α1 R
2
ABOT 0.14*
(2.00)
0.03
(1.04)
0.03*
(2.54)
0.68*
(2.34)
0.71
ACBL 0.54
(2.23)
0.05
(0.79)
0.03***
(1.86)
0.75*
(2.18)
0.55
FZTM 0.20*
(2.24)
0.01*
10.91)
0.08*
(13.47)
0.88*
(15.11)
0.38
GHFL 0.12**
(1.76)
0.000*
(16.04)
0.12*
(16.83)
0.84*
(14.34)
0.32
ISMAIL 0.94*
(3.15)
0.02*
(7.98)
0.04*
(10.72)
0.96*
(17.26)
0.66
LUCK 0.82**
(1.99)
0.03*
(11.80)
0.178*
(12.386)
0.72*
(43.37)
0.69
MARI 0.46*
(2.41)
0.04*
(14.82)
0.23*
(14.12)
0.68*
(42.09)
0.54
NESTLE 1.36*
(4.13)
0.03*
(10.96)
0.14*
(17.35)
0.85*
(12.77)
0.65
PGLC 0.04**
(1.86)
0.04*
(11.11)
0.10*
(14.86)
0.83*
(78.19)
0.49
PAKME 0.14*
(2.28)
0.07*
(6.64)
0.24*
(20.84)
0.80*
(13.73)
0.83
SPL 0.59*
(1.78)
0.08*
(16.347)
0.25*
(13.605)
0.59*
(25.273)
0.50
SPLC 0.26*
(2.24)
0.01*
(10.91)
0.08*
(13.47)
0.88*
(15.11)
0.49
FEQM 0.14*
(1.89)
0.01
(1.47)
0.06**
(1.95)
0.87*
(8.61)
49
CEPB 0.87
(5.17)
0.01
(1.47)
0.06**
(1.95)
0.87*
(8.61)
0.47
ACBL 0.04*
(1.95)
0.03
(0.49)
0.02*
(1.96)
0.81*
(2.00)
0.61
DKTM 0.07**
(1.92)
0.02
(2.40)
0.32
(2.55)
0.50
(3.69)
0.49
ENGRO 0.01*
(2.42)
0.03
(0.49)
0.02*
(1.96)
0.81*
(2.00)
0.64
EFUG 0.22*
(2.49)
0.02
(2.40)
0.32
(2.55)
0.50
(3.69)
0.48
FUJI 0.89*
(2.09)
0.03*
(11.03)
0.17*
(6.60)
1.05*
(3.72)
0.62
FZTM 0.84*
(2.46)
0.06*
(4.62)
0.07
(5.26)
1.04*
(13.16)
0.48
GHNL 0.04*
(2.04)
0.07*
(15.69)
0.15*
(11.92)
0.68*
(39.54) 0.44
HABM 0.68*
(2.61)
0.03*
(14.29)
0.23*
(15.32)
0.67*
(40.37)
0.47
HOND
(18.55)
0.05*
(9.96
0.19*
(13.84)
0.78*
(58.16)
0.68
ICI 0.77**
(1.87)
0.06*
(12.95)
0.14*
(14.42)
0.77*
(61.73)
0.55
KESC 0.64*
(6.296)
0.06*
(12.95)
0.14*
(14.42)
0.77*
(61.7)
0.57
Copyright © 2011. NJMT
21
NUML Journal of Management & Technology
Vol: 6, No: 1. January, 2011 ISSN 1997-4507
KTML 0.03*
(11.43
0.04*
(7.75)
0.04*
(16.09)
0.95*
(4.96)
0.68
LAKS 0.05*
(16.58)
0.03*
(13.95)
0.15*
(20.07)
0.84*
(19.44)
0.46
MLCF 0.12*
(16.63)
0.04*
(14.82)
0.23*
(14.12)
0.68*
(42.09)
0.67
MCB 0.09*
(1.56)
0.03*
(10.96)
0.14*
(17.35)
0.85*
(12.77)
0.77
NAKIR 0.042*
(15.866)
0.04*
(11.11)
0.10*
(14.86)
0.83*
(78.19) 0.52
UPFL 0.05*
(5.57)
0.07*
(6.64)
0.24*
(20.84)
0.80*
(13.73)
0.83
PKGS 0.04*
(2.25)
0.07*
(16.347)
0.25*
(13.605)
0.59***
(25.27)
0.50
PAKME 1.44*
(3.05)
0.01*
(10.91)
0.08*
(13.47)
0.88*
(15.11) 0.49
PAKD 0.01*
(2.42)
0.04
(1.62)
0.14***
(1.84)
0.86
(8.96)
0.53
PAEC 0.05**
(1.92)
0.02
(2.40)
0.32
(2.55)
0.50
(3.69)
0.51
PAKT 0.17*
(1.89)
0.03*
(11.03)
0.17*
(6.60)
1.05*
(3.72)
0.66
PIAA 0.79*
(2.09)
0.07*
(15.69)
0.15*
(11.92)
0.68*
(39.54)
0.41
PTCLA 0.88*
(2.46)
0.03*
(14.29)
0.23*
(15.32)
0.67*
(40.37)
0.47
SHELL 0.58*
(18.55)
0.06*
(12.95)
0.14*
(14.42)
0.77*
(61.73)
0.56
SAPF 1.32**
(1.87)
0.06*
(12.95)
0.14*
(14.42)
0.77*
(61.7)
0.60
UNVL 0.02*
(2.25)
0.07
(3.39)
0.29**
(1.90)
0.26*
(1.92)
0.68
CEPBR 0.62
(1.96)
0.01
(1.47)
0.06**
(1.95)
0.87*
(8.61)
0.48
DADX 0.05***
(1.83)
0.03*
(4.79)
0.06*
(13.87)
1.02*
(9.87)
0.76
DAWH 0.01*
(2.25)
0.07
(3.39)
0.29**
(1.90)
0.26*
(1.92)
0.66
FABL 0.88* 0.04** 0.29* 0.68* 0.49
(3.05) (16.56) (18.39) (43.27)
JDW 0.77*** 0.07* 1.17* 0.12* 0.77
(1.84) (26.21) (53.66) (10.98)
NIRE 0.02*
(2.42)
0.04
(1.62)
0.14***
(1.84)
0.86
(8.96)
0.51
Note: The figures below coefficients are t-ratios. The * indicates Level of Significance 1%,** indicates
level of Significance at 5% and *** indicates significance at 10%.
Copyright © 2011. NJMT
22
NUML Journal of Management & Technology
Vol: 6, No: 1. January, 2011 ISSN 1997-4507
The Impact of Effective Communication and
Service Climate on the Performance of
Employees: A Study on Marketing Officers of
Private Banks of Pakistan
Kamran Ilyas Raja
PHD (Scholar), & Director NAB, Islamabad
Waqas Fazal
PHD (Scholar), Preston University, Islamabad, Pakistan
Abstract
Endeavors have been put in this piece of research to find out the
relationship between the effective communication, service climate
and employee‟s performance working as marketing officers in the
private banks. 72 marketing officers from Mirpur, Islamabad and
Rawalpindi were being given the questionnaire consisting of
standardized scales, using 5-points likert scale, it was also self
administered. The results in the end revealed a positive relationship
between effective communication, service climate and employee‟s
performance in the private banks of Mirpur, Islamabad and
Rawalpindi. Implications of research for sector usage along with
directions for future research and limitations of present study have
also been discussed in the paper
Key words: Communication, Service Climate, Employee
Performance, Banking Sector of Pakistan
1. INTRODUCTION
This research paper is based on the idea that effective communication and service climate
is a basic way to improve performance of employees. There are obvious evidences that
in business practices, effective communication, service climate are getting increased
importance as a competitive parameter in service industry especially the focused banking
sector Effective organizational communication is very important for Employee
performance, according to litearture, there are many mediums that a organization use
with in organization to inform their employees about their responsibilities, tasks and
goals, to know about employees problems faced in different areas of the job
Copyright © 2011. NJMT
23
NUML Journal of Management & Technology
Vol: 6, No: 1. January, 2011 ISSN 1997-4507
(Moriarty,1998). and if firm is sucessful in their communication practices effectivley
they can enjoy employees performance which leads further for organizational
productivity. It is seen, organizations in which there is a lack of organizational
communication practices, creats communication gap among employees, specially
between top and lower level management so it become cause of low employees
performance and productivity when employees don‟t aware about their job responsilities,
task and goals (Orpen,1997). . So with connection of this problem the basic theme of this
research paper is to highlight the impartance of effective organizationl communication
with respect of employees perfromance.
The researchers of earlier time on service climate examined its association with and
argued that climate was positively related to employees perception of service quality,
courtesy, adequate staffing and overall perception of the employees about the workplace.
Schneider,B. ,White,S.S. and Paul,M.M. (1998). Service climate has been shown to relate
to employee performance and satisfaction (Andrews and rogerblerg, 2001) as well as a
variety of employees and customer perception of work place practices. (Schenider et al,
1998)
This study planned to explore the influence of effective organizational communication
and effective service climate on the employee‟s peformance that what is impact of
effective organizational communication and climate on the performance of marketing
officers in the private banks in pakistan. The basic purposes of the study are:
To know the importance of effective organizational communication.
To know the effect of different communication practices on employee
performance.
To know the employee‟s performance in case of lack of organizational
communication practices .
To know the importance of effective service climate practices to increase the
employee performace.
To know the affect of communication pactices and service climate on performace
of bank employees partucarly on marketing officers of the private banks in
pakistan.
This study shall be helpful to banks in Pakistan for need of formulation and development
of different communication practices and applying different service climate structures
that shall make sure high level of marketing team‟s performance resulting in increased
commitment reduce absenteeism, achievement assigned task & goals and productivity.
2. LITERATURE REVIEW
2.1 Effective Communication and Employee Performance
Dictionary.com defines communication as an interchange of thought, ideas etc. however
with the interchange of idea the most important factor to consider is the importance of
communication.
Copyright © 2011. NJMT
24
NUML Journal of Management & Technology
Vol: 6, No: 1. January, 2011 ISSN 1997-4507
Duncan and Moriarity (1998), defines communication as a human activity in order to link
people together while creating relationship. Importance of communication can be
observed in an organizational context when each and every component of an organization
has to communicate effectively for the smooth operation. Large number of theories and
literatures supported the importance of effective communication for effective operation of
an organization.
The success or failure of the organization is directly proportional to communication as
cited by Orpen (1997), clear and timely communication can get good results while
unclear signals can cause operations of the organization. Norman and Joe (1998) are of
the view that a complex situation can be countered through effective communication.
Many things have been written and published above communication, however the main
purpose of this research paper is to figure out the impact of effective communication on
employee‟s performance, however, it is important to discuss the overall effectiveness of
communication before moving further. In their study Nader Sheykh, Anees and Amanita
(2010), established that effective supervisory communication is one of the factors that
affect employee job satisfaction.
As discussed by Nader Sheykh, Anees and Anahita (2010), in order to maintain
competitive advantage and to achieve firm objectives and missions, the need is an
effective application and implementation of communication process. Mueller and Lee
(2002) in their study discussed that in interpersonal (personal feedback and supervisory
communication), group (co-worker communication and organizational integration in the
workgroup), and organizational contexts (corporate communication, communication
climate, and organizational media quality) the quality of LMX have a strong influence on
subordinate‟s communication satisfaction.
Clampitt and Down (1993) in their study confirmed that different communication factors
impacted on employees productivity in number of ways. There was fluctuation in the
degree and reasons for the impact. It is important to clearly define the duties and
responsibilities of the employees in an organization, employees even want to know the
responsibilities they have to undertake and the duties very clearly so that they should
knowing what to do, things should be made clear before they proceed with their
assignments. An argument was made by Velch and Jackson (2007), while communicating
with employees the internal corporate communication concept may be useful for
communication managers. The concept may be defined as a communication amongst
organization‟s strategic managers and internal stakeholders, which is helpful to promote
organizational commitment, a sense of belonging to it, consciousness of changing
environment and understanding of its evolving aims.
The study of Azman et.al (2009) found a positive relation between sufficient support and
good communication which may lead to induced positive attitudinal and behavioral
outcomes such as performance, good working ethics, trust, commitment and satisfaction.
As cited by Litterst and Eyo (1982), productivity has a relation with formal
communication. However, the informal communication cannot be ignored, it is an
inevitable part of any organisation. Nader Sheykh, Anees and Anahita (2010), argued that
Copyright © 2011. NJMT
25
NUML Journal of Management & Technology
Vol: 6, No: 1. January, 2011 ISSN 1997-4507
if the formal form of communication does not provide adequate information to the
employees, the employees will then turn to informal form of communication. According
to Clampitt and Downs (1993), effective communication results in numerous positive
outcomes for managers and then organization ultimately. Factors like greater
commitment to organizational goals, reduced absenteeism and increased productivity are
encompassed by the effective communication.
According to (Adejimola, 2008) it is very crucial to mention that an entrepreneur cannot
succeed without communicating with his or her human elements in the organization. The
major purposes of communication in any business organization, therefore, are
summarized as follows: a. to establish and disseminate the goal of a business enterprise.
b. To develop plans for laudable achievements. c. To organize human and other resources
in the most effective and efficient way. d. To select, develop and apprise members of the
business enterprise. e. To lead, motivate and create a climate in which people want to
contribute. f. To control performance. g. To achieve effective communication.
2.2 Service Climate and Employee Performance
In current era the researchers and practitioners have been largely considering the services
sector. Huge amount of studies have been conducted in service climate by many
researchers. According to Solnet and Paulsen (2005), when a particular firm focuses on
quality of service and motivation of its employees then there exists an effective service
climate. Moreover, the there is a positive relationship between the service climate and
commitment made to the customer in order to acquire excellent services. Andrews and
Rogerblerg (2001) found that the service climate is a missing link between performance
parameters internally and externally.
As proved by Schenider et al (1998), that climate was positively related to customer
perception of service quality, courtesy of staff, adequate staffing and overall
administration. The definition of the service climate given by Schenider et al (1998) has
been mentioned by Andrews and Rogerlbere (2001) along with their main focus on
service climate which is the collective perception of employees that the organizational
practices and procedures facilitate the excellent quality service and management rewards,
supports and encourages the excellent service. Computer mediated communication has
become important part of organizational communication, valuable literature prove for
example Rice (1987) says computer-mediated communication systems not only process
information about innovation that organizations must process, a circumstance that
provides organizations with opportunities and challenges for enhancing their
resourcefulness and responsiveness. After reviewing the literature, simple model
developed.
Copyright © 2011. NJMT
26
NUML Journal of Management & Technology
Vol: 6, No: 1. January, 2011 ISSN 1997-4507
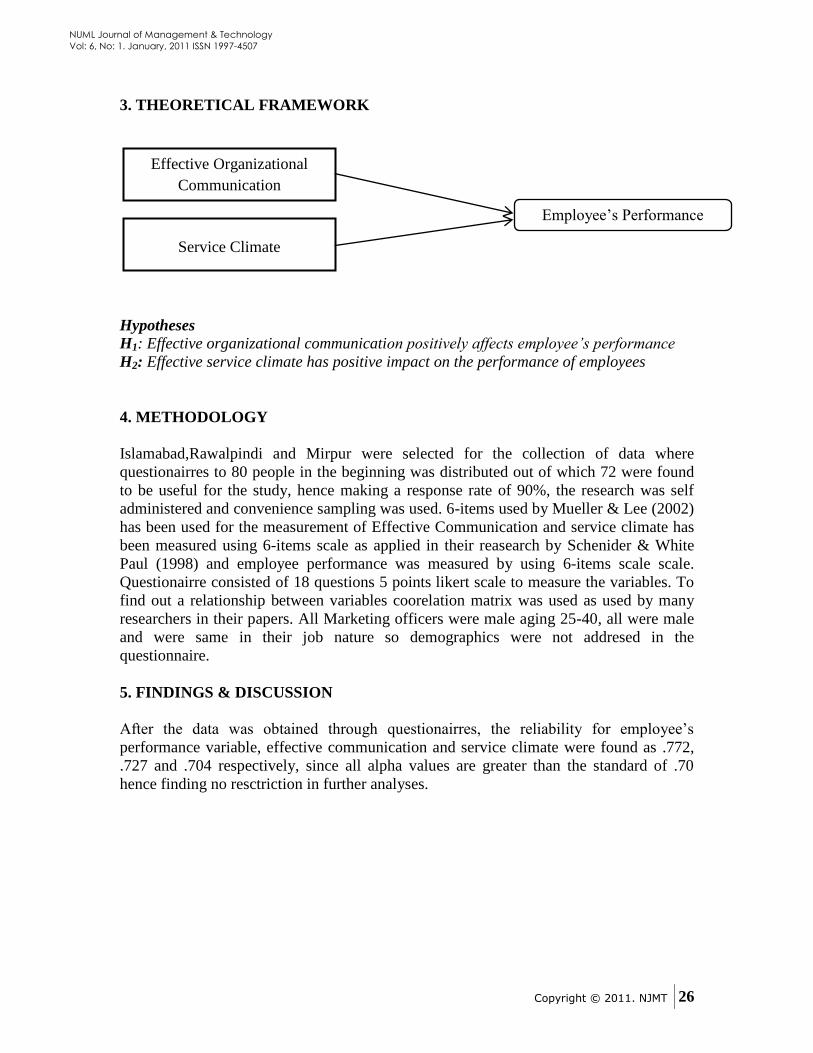
3. THEORETICAL FRAMEWORK
Hypotheses
H1: Effective organizational communication positively affects employee’s performance
H2: Effective service climate has positive impact on the performance of employees
4. METHODOLOGY
Islamabad,Rawalpindi and Mirpur were selected for the collection of data where
questionairres to 80 people in the beginning was distributed out of which 72 were found
to be useful for the study, hence making a response rate of 90%, the research was self
administered and convenience sampling was used. 6-items used by Mueller & Lee (2002)
has been used for the measurement of Effective Communication and service climate has
been measured using 6-items scale as applied in their reasearch by Schenider & White
Paul (1998) and employee performance was measured by using 6-items scale scale.
Questionairre consisted of 18 questions 5 points likert scale to measure the variables. To
find out a relationship between variables coorelation matrix was used as used by many
researchers in their papers. All Marketing officers were male aging 25-40, all were male
and were same in their job nature so demographics were not addresed in the
questionnaire.
5. FINDINGS & DISCUSSION
After the data was obtained through questionairres, the reliability for employee‟s
performance variable, effective communication and service climate were found as .772,
.727 and .704 respectively, since all alpha values are greater than the standard of .70
hence finding no resctriction in further analyses.
Effective Organizational
Communication
Employee‟s Performance
Service Climate
Copyright © 2011. NJMT
27
NUML Journal of Management & Technology
Vol: 6, No: 1. January, 2011 ISSN 1997-4507
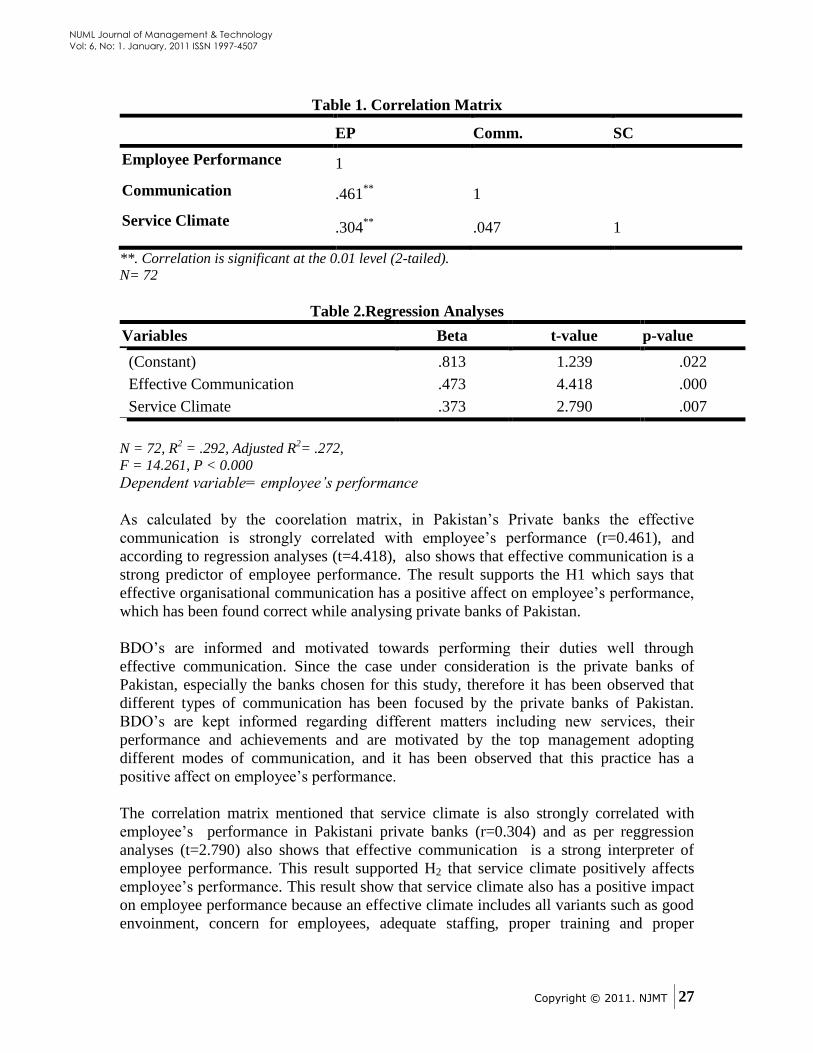
Table 1. Correlation Matrix
EP Comm. SC
Employee Performance 1
Communication .461**
1
Service Climate .304**
.047 1
**. Correlation is significant at the 0.01 level (2-tailed).
N= 72
Table 2.Regression Analyses
Variables Beta t-value p-value
(Constant) .813 1.239 .022
Effective Communication .473 4.418 .000
Service Climate .373 2.790 .007
N = 72, R
2 = .292, Adjusted R
2= .272,
F = 14.261, P < 0.000
Dependent variable= employee’s performance
As calculated by the coorelation matrix, in Pakistan‟s Private banks the effective
communication is strongly correlated with employee‟s performance (r=0.461), and
according to regression analyses (t=4.418), also shows that effective communication is a
strong predictor of employee performance. The result supports the H1 which says that
effective organisational communication has a positive affect on employee‟s performance,
which has been found correct while analysing private banks of Pakistan.
BDO‟s are informed and motivated towards performing their duties well through
effective communication. Since the case under consideration is the private banks of
Pakistan, especially the banks chosen for this study, therefore it has been observed that
different types of communication has been focused by the private banks of Pakistan.
BDO‟s are kept informed regarding different matters including new services, their
performance and achievements and are motivated by the top management adopting
different modes of communication, and it has been observed that this practice has a
positive affect on employee‟s performance.
The correlation matrix mentioned that service climate is also strongly correlated with
employee‟s performance in Pakistani private banks (r=0.304) and as per reggression
analyses (t=2.790) also shows that effective communication is a strong interpreter of
employee performance. This result supported H2 that service climate positively affects
employee‟s performance. This result show that service climate also has a positive impact
on employee performance because an effective climate includes all variants such as good
envoinment, concern for employees, adequate staffing, proper training and proper
Copyright © 2011. NJMT
28
NUML Journal of Management & Technology
Vol: 6, No: 1. January, 2011 ISSN 1997-4507
handlimg of issues etc so that employees get encourged and their performance get better
because of the steps taken by the management.
6. CONCLUSION
It has been concluded from the study carried out that effective communication and
service climate have a positive impact on BDO‟s performance working in the private
banks of Pakistan. It has been observed that the BDO‟s performance is affected in a
positive way by the communication practices adopted by the bank including all type of
communications. According to the study it has been observed that the service climate also
have a positive affect on employee‟s performance, an effective climate includes all
variants such as good environment, concern for employees, adequate staffing, proper
training and issue handling etc. The employees get encouraged and they perform better
provided steps taken by the management. By taking valuable step towards effective
communication practices and by providing an effective service climate employees
performance can be enhanced in every service organization and especially in the private
banks of Pakistan according to our study.
7. RECOMMENDATIONS, DIRECTIONS FOR FUTURE RESEARCH AND
LIMITATIONS
The banking sector can be benefited from this research if they revise their communication
practices along with enhancement of service climate. Future policies can be devised and
implemented with the help of this research. Time constraints along with small sample
size are possible shortcomings of this research and in future it can be applied on a large
scale and more variables may be tested and can also be applied on others service sectors.
Copyright © 2011. NJMT
29
NUML Journal of Management & Technology
Vol: 6, No: 1. January, 2011 ISSN 1997-4507
8. REFERENCE
Adejimola, A. S. (2008). Language, communication and information flow in
Entrepreneurship. African Journal of Business Management, 2 (x), 201-208.
Andrew, T. L. and Rogelberg, S. G. (2001). A new look at service climate: It‟s
relationship with owner service values in small businesses. journal of business and
psychology, 16(1),119-131.
Azman, I., Sieng, L.L.C., Ajis,M.N., Dollah, N.F. & Boerhannoeddin, A. (2009).
Relation between supervisor‟s role and job performance in the workplace training
program.
Clampitt, P. & Downs, C. (1993). Employee perceptions of the relationship between
communication and productivity: a field study. Journal of Business
Communication, 30(1),5-28
Duncan, T., & Moriarty, S. E. (1998). A communication-based marketing model for
managing relationships. Journal of Marketing, 62(2), 1-13.
Litterst, J. K., & Eyo, B. (1982). Gauging the Effectiveness of formal communication
programs: a search for the communication- productivity link. Journal of Business
Communication, 19(2), 15-26.
Mueller, B. H. and Lee, J. (2002). Leader-Member Exchange and Organizational
Communication Satisfaction in Multiple Contexts. The Journal of Business
Communication, 39, 220-244
Nader S. A. E. K., Anees J. A. & Anahita A. (2010). Organizational Citizenship Behavior
in Concern of Communication Satisfaction: The Role of the Formal and Informal
Communication. International Journal of Business and Management, 5(10), 51-
61.
Norman F. & Joe O. (1998). Some consequences of e-mail vs. face-to-face
communication in experiment. Journal of Economic Behavior & Organization,
35, 389-403.
Orpen, C. (1997). The interactive effects of communication quality and job involvement
on managerial job satisfaction and work motivation. The Journal of Psychology,
131(5), 519-522.
Rice, R. E. (1987). Computer-mediated communication and organizational innovation.
Journal of communication, 37(4), 65-94.
Schneider,B. & White,S.S. and Paul,M.M. (1998). Linking Service Climate and
Customer Perceptions of Service Quality Test of a Causal Model. journal of
Applied Psychology,83(2),150-163.
Solnet, D., & Paulsen, N. (2005). Service climate, employee identification, and customer
outcomes in hotel property rebrandings. Journal of Hospitality and Leisure
Marketing. 13(3/4), 3-27. Velch, M. & Jackson, P.R. (2007). Rethinking internal communication: a stakeholder
approach. Corporate Communications: An International Journal, 12 (2), 177-198.
http://dictionary.reference.com/browse/communication
Copyright © 2011. NJMT
30
NUML Journal of Management & Technology
Vol: 6, No: 1. January, 2011 ISSN 1997-4507
Discovering the Annals of Competitive
Advantage in Business Organizations
Dr. Naveed Akhtar, Assistant Professor,
National University of Modern Languages, Islamabad, Pakistan
Dr. Rasheed Ahmed Khan, Dean Faculty of Management Sciences
National University of Modern Languages, Islamabad, Pakistan
ABSTRACT
Competitive advantage is life blood for any organization and is the
aim of each strategy to achieve it and earn above-normal returns.
There are different theories which prescribe different ways to
achieve competitive advantage. This paper aims to explore those
methods, prescriptions, and strategies that enlighten organizations to
outperform the rivals. It is the prime managerial concern to measure
the outcome of their strategies and business performance. It is
observed that competitive advantage entails to superior economic
performance. Therefore, this exploratory and descriptive study will
identify those dimensions which can measure the competitive
advantage. At the end of this research article a questionnaire is
proposed for the academicians and researcher who are interested to
measure the organizational strategies and their ensuing increased
business strategic and economic performance.
Keywords: Competitive advantage, strategy, organizational learning,
business performance
1. INTRODUCTION
Increased competition, global or local, has forced organizations to be agile, and be
competitive in each area that creates value or supports the value creation. It can be within
or outside organizational environment. For that organizations need to know those specific
areas where they can and should create expertise and make their leverage points so that
competitors could be kept at the bay. Moreover, these leverages; internal or external
should be hidden from the eyes of the rivals, or at least the idiosyncratic mix and
exploitation of the internal, external, or internal and external resources remains implicit.
This non-disclosure enables the organizations to sustain the competitive advantage or at
least causes delays in the creation of competitive parity within the industry.
The paper is aimed at exploring different theories that detail the creating the
competitive advantage. The article is aimed at identifying, developing, and proposing the
various dimensions that are important in creating advantage. It will also explore the
dimensions which are considered most appropriate to empirically measure the existence
and outcome of advantage in the business organizations. Furthermore, the questionnaire
will be prescribed for any future research.
Copyright © 2011. NJMT
31
NUML Journal of Management & Technology
Vol: 6, No: 1. January, 2011 ISSN 1997-4507
The coming sections are designed to explore the various concepts of competitive
advantage, theories of competitive advantage, and the concepts that measure these
concepts.
2. COMPETITIVE ADVANTAGE: CONCEPTS AND DEFINITIONS
The section aims to define and discuss the multidimensional concept of
competitive advantage. Different theories that enable organizations to achieve
competitive advantage are elaborated. Finally, it also throws light upon the measurement
of business performance strategy research.
Organizations compete through designing, defining, and implementing strategies.
Put simply competition makes organizations set strategy (Porter, 1985). Competitive
advantage is a key concept in strategic management research. Literature reveals (Barney,
1991) that a firms is able to reap the advantages of its competence only when no other
competing firm in the industry is able to duplicate the strategy or even unable to duplicate
the benefits of the strategy. Hence the competitive advantage is defined as the relative
edge over competitors of similar business because of certain organizational abilities and
resources which are at best exploited by a single firm in a point in time.
3 THEORIES OF COMPETITIVE ADVANTAGE
Literature revealed that the competitive advantage is a multi-dimensional concept
and can be achieved by exploiting different internal capabilities, resource through
creating value to win the competition. For that two parallel streams are available to
manage organizational strategic performance and to design strategies. First, analyze and
understand their internal resource. Second, by analyzing the external market. Before
organization set out to compete they have to understand their markets their internal
resources and capabilities.
3.1 Exploring Internal Leverage
Identification of resources at hand is necessary to further develop them into core
competencies which enable organization to create leverage points to generate super
normal rents and achieve sustainable competitive advantage. It depends on endowment
acquisition, development and exploitation of the resources required by organizations.
Resources, competencies, and capabilities and their behavior determine the competitive
strength of any organization. Because of the little consensus in the strategy literature
regarding the three concepts of resources, competencies, and capabilities; it is decided to
discuss the contributions of all these concepts briefly.
3.1.1 Resource-based View (RBV)
It is relatively easier to know about the organizational “keepings” and
endowments, instead of designing strategies on the basis of the knowledge of external
dynamic environment. Because information regarding the inner strengths can be gathered
with certainty as compared to the information regarding the economic forces in the
external environment in which any organization is operating. Therefore, it is better to
Copyright © 2011. NJMT
32
NUML Journal of Management & Technology
Vol: 6, No: 1. January, 2011 ISSN 1997-4507
identify and know the organizational resources in the first place. In ever changing outer
environment it is experienced that the organizational internal resources and capabilities
can be used as a stable platform to design organizational strategies to a certain extent.
According to Wernerfelt, who used the term resource first time, (1984) a resource
can be tangible or intangible and it is a strength or weakness of a given firm. Resources
can be tangible and intangible and are divided into three broad categories: physical,
human, and organizational i.e. plant and machinery; manager‟s skills and abilities; and
assets, capabilities, organizational processes, information, knowledge economic rents
(Barney, 2002, 1991). Chase, Jacob and Aquilano (2004) identified three key resources,
tangible resources, intangible resource, and organizational capabilities. Tangible
resources help firm create value for its customer. Intangible resources include experience,
and human and managerial skills, innovation resources, and reputation resources.
Capabilities are organizational competencies or skills which help transform inputs into
outputs. For example, outstanding customer service etc. Resources can not generate
advantage but is the specific configuration and complexity of resources which enables
organization to generate rents achieving competitive advantage.
Resources provide sustained competitiveness by creating value. They are
heterogeneous, can not be substituted, immobile, valuable, rare, inimitable and have no
strategic equivalent (Ireland & Hitt, 2005; Barney, 1991). An asset is valuable if
improves organizational efficiency and increases profits. Profit depends on the greater
utility enjoyed by customers i.e. value creation (Sirmon, Ireland & Hitt, 2007).
Inimitabilty means ambiguity between causal link and competitive advantage. This
ambiguity makes it difficult for organizations to duplicate the resource that is being
appropriated by a firm maintaining competitiveness. An inimitable, immobile and non-
substitutable resource creates a barrier to duplication (Fahy, 2000). Firm can achieve
similar advantage by acquiring or developing a resource which enable organization to
launch the similar strategies instead of duplicating the similar resource possess by
competing firm. For example a charismatic leader with a very clear vision of the future
can not be copied instead it can be substituted by managers with a clear vision (Barney,
1991).
Competencies perspective of RBV views that tacitness, specificity, complexity,
and their interaction cause barriers to imitation by making them causally ambiguous and
generate sustained competitive advantage. These characteristics of competencies create a
„lack of understanding‟ and make it difficult for an entrant to understand the processes
that generates returns (Barney, 1986a). A competency is a peculiar skill and a resource
that a firm possesses. It is also the superior way in which these resources are being used.
Firm‟s competencies are manipulated to achieve competitive advantage. According to
Reed & DeFillipi (1990) the competency and competitive advantage are neither
synonymous, nor they generate each other. The advantage is the end-result of the
strategies which are based on the firm‟s competencies. Advantage is best achieved when
it becomes difficult for competitors to identify those competencies which generate it.
Copyright © 2011. NJMT
33
NUML Journal of Management & Technology
Vol: 6, No: 1. January, 2011 ISSN 1997-4507
Tacitness embodies within the skill component of competencies leaving rivals
unable to imitate because it is difficult to decipher the tacit knowledge. Complexity
results from the interrelationship between skills, and between skills and assets.
Complexity arises from core competencies which entails ambiguity and results in a
barrier to imitation. Specificity is the result of skill and resource deployment which are
firm specific and cause barrier to imitation. Specificity is the commitment of skills and
resources to the requirement of individual customer and locks-in the customer.
Competitive advantage remains an advantage only if it is sustainable in future.
Inability to sustain ensues into non existence of advantage. Capability of a firm to
generate value exploiting the resources held by a firm deteriorates with the change in
environment, technology, and industry structure in which a particular firm operates. The
present resources become valueless in changing landscape of competition. New resources
replace the old. Hence, new capabilities are needed to develop and maintain the new
resources.
Culture has been treated in the resource based view as a capability (Fahy, 2000)
and an important organizational resource (Oster, 1999; Barney, 1991, 1986b). Literature
reveals that it is a complex set of assumptions, symbols, values, beliefs, attitudes
practiced by individuals, groups and communities. (Barney, 1986a). A culture is said to
achieve competitive advantage when it puts the customer first, has the ability to change,
and react to challenge. Culture can be a source of sustained financial performance if
exhibits the characteristics that are necessary for a resource that possess a potential for
sustained competitive advantage i.e. imperfect imitability, valuabilty, and rareness.
Barney (1986a) says superior performance is an economic concept so culture must
exhibit the positive economic consequences. So for that culture must be valuable in the
first place and help organizations achieve high sales, low cost, high margins and add
financial value to the possessing organization. Secondly, it must exhibit the
characteristics which are uncommon and unmatched to other firms (being rare). Thirdly,
imperfect imitability must prevail in the culture of the organization which is to achieve
sustained competitive advantage and conversely superior financial performance.
According to him when a firm possesses a culture of this type then it will enjoy the
positive economic consequences of its culture (p. 659)”.
According to Oster (1999) corporate culture is another form of competitive advantage
and is a complex characteristic to be copied. It is composed of a complex set of formal
rules and structures, myths, traditions, and style of leadership. “An organization‟s culture
creates value because it allows that organization to strike deals with its suppliers,
customers, and employees that are not available to other firm (Oster, 1999, p. 139)”.
3.1.2 Capabilities and competitive advantage
Capabilities are organization‟s “collective mix” of internal resources (tangible and
intangible) that provide a competitive advantage in a particular area when used
strategically forming a unique mix of different resources. These can be called a
combination of localized bundles of resources that collectively enable the organization to
Copyright © 2011. NJMT
34
NUML Journal of Management & Technology
Vol: 6, No: 1. January, 2011 ISSN 1997-4507
perform better (Marr, 2006) or an organization‟s capacity which deploys tangible and
intangible resources (Chase et al., 2004). Capabilities are inter-action-based, difficult to
duplicate because of causal ambiguity (Fahy, 2000, p. 98).
3.1.3 Core competencies and competitive advantage
According to Prahalad and Hamel (1990) the core competencies are like a tree,
the trunk represents the core products, branches represent business units, the end products
are represented by leaves. The core competence qualifies as a core competence only
when it carries the potential of providing the access to a wider market; contributes to the
perceived customer benefits of the end products; and difficult to imitate. Therefore a
competitive advantage is achieved through capabilities and competencies only if they are
difficult to imitate, valuable enabling a firm to outperform competitor (Mooney, 2007, p.
112)”. A competitive advantage can be enjoyed by having favourable location or a strong
brand name. Resources do not generate rents, but a firm‟s distinctive competence enables
a firm to use these resources in a better way (Mahoney & Pandian, 1992, p. 365).
3.1.4 Interconnections of competencies, capabilities, and resources
It is observed that the researchers have noted the ambiguity between three
concepts: resources, competencies, and capabilities. Leading authors have addressed the
issue more deeply (Chase et al., 2004; Ray, Barney & Mohanna, 2004; Barney, 2002;
Fahy, 2000; Prahalad & Hamel, 1990). Chase, Jacob and Aquilano (2004) identified that
core capabilities or resources help organizations to develop strategies based on those
capabilities. Ray, Barney and Mohanna (2004), and Barney (2002) have used resources
and capabilities interchangeably. Similarly Prahalad and Hamel (1990) consider the
competencies as corporate resources. In similar vein Fahy (2000) suggests that all terms
i.e. competencies, core competencies, distinctive competencies, capabilities (skills, core
skills) can be replaced by the term resources to reduce any ambiguity. Therefore, the
researchers conclude that to avoid any misunderstanding and to make the concept more
vivid it is viewed that the term “strategic resource” can be used in place of all three above
discussed concepts.
On the basis of insights of literature a resource can be defined as the inherent
ability of an organization to identify, bring out, develop, and express the latent rent
generating potential of all organizational possessions achieving customer perceived
advantage and appropriating above-normal rents persistently.
3.2 ANALYZING EXTERNAL IMPACTS
Competitive advantage can be achieved by following generic strategies, analyzing
industry structure by exploring underlying economic forces and turning then into the
favor of organization. The concepts: competitive forces and competitive advantage;
generic strategies and competitive advantage; technology/Information Technology, Value
Chain and competitive advantage are discussed separately because of their strategic
nature and theoretical explanations.
Copyright © 2011. NJMT
35
NUML Journal of Management & Technology
Vol: 6, No: 1. January, 2011 ISSN 1997-4507
3.2.1 Competitive forces and competitive advantage
The idea of defining the strategies based on the economic forces was first presented by
Porter (2008, 1980). He presented a framework to measure the attractiveness of an
industry by examining the industry structure which comprises an analysis of powers
exerted by buyer and supplier, by studying threats posed by substitute and new entrants.
Finally my considering rivalry among existing competitors. These forces help managers
to design strategies after understanding these economic forces that determine the
attractiveness of the industry. Therefore, to determine success of a firm it is essential to
understand the attractiveness of the industry in which firm competes. According to Porter
(2008) although the nature and organization of five forces is different for different
industries but underlying drivers of profitability and the five forces are the same.
Therefore, it is imperative to turning these five forces, in the favor of a particular
organization, is crucial to strategy.
New entrants desire to gain market share, bring substantial resources (Porter,
1980) and compete through the prices, cost. At the same time customer switching cost,
capital requirements, research and development, advertising, restrictive government
policies, and high investments are threats for the new entrants (Porter, 2008). Suppliers
charge high prices, reduce quality of purchased goods and services to exploit the buyer
switching costs are high for buyers (Porter, 2008). Another player in the industry is the
buyers who exploits when demand better quality, low prices, more service by playing
industry participants against one another at the cost of industry profitability. The threat of
a substitute is high when the switching cost to the substitute product is low. Finally the
rivalry among existing competitors may through price reduction, advertising campaigns,
new product introductions, and service improvements limiting the profitability of an
industry. Number and size of competitors, rate of industry growth (firm strives for market
share), exit barriers determine (because of specialized assets) the rivalry among
competitors.
3.2.1 Generic Strategies and Competitive Advantage
In addition to the attractiveness of the industry discussed in above paragraphs
another competing strategy is through holding attractive relative position. This ability to
position itself in the industry enables firm to achieve above average performance and
sustain an advantage. Literature shows tow basic types of competitive advantage: low
cost, and differentiation (Oster, 1999; Porter, 1985, 1980). Three generic strategies: cost
leadership, differentiation, and focus can be designed (Porter, 1985). Cost-leadership
business strategy gains advantages by reducing economic costs below all of its
competitors (Barney, 2002, p. 233). Differentiation is second generic strategy (Barney,
2002; Porter, 1985, 1980) and aims to provide unique dimensions (Porter, 1985) to the
extent to which customer perceive this product or service is different from the other
competing firms (Pearce & Richard, 2005) and are widely valued by buyers (Porter,
1985). These dimensions can be design changes, brand image, technology, and feature.
Third generic strategy selects a segment or group of segments in the industry and tailors
Copyright © 2011. NJMT
36
NUML Journal of Management & Technology
Vol: 6, No: 1. January, 2011 ISSN 1997-4507
its strategy to serving them to the exclusion of others and may take many forms (Porter,
1985, p. 15).
Technology/Information Technology, Value Chain and Competitive Advantage
Advantage on the basis of exploiting the technology depends on the ability to
exploit it. The technology permeates each activity of today‟s business organization and is
the practical manifestation of knowledge generated on the basis of available amount of
information. Technology interconnects the strategy and competitive advantage, is
regarded as a resource, and is defined as “all the knowledge, products, processes, tools,
methods, and system employed in the creation of goals or in providing services (Khalil,
2000, p.1)”. Advantage can be achieved when technology resource is integrated with the
strategy. The strategies are formed by identifying the activities performed in an
organization and the value chain (Porter, 1985) facilitates reveal those leverage points to
which can be exploited and appropriated for the achievement of competitive advantage.
Value chain has a strategic significance and highlights areas where technology should be
used to add value to products and services (O‟Brien, 2004). Every activity in value chain
has both a physical and an information processing component. Information technology
has transformed the way value activities are performed and the nature of linkages among
them. Value chain (Porter, 1985) identifies technical activities already happening, reveals which
technology is to develop, and facilitate decision making to acquire new or develop present
technologies. Information technology has established new linkages within and outside the
company and enabled organizations to coordinating closely with buyers and suppliers. It
has enhanced the ability to exploit existing linkages.
According O‟Brien (2004) Information technology should be viewed
strategically. Strategic information system shapes the competitive position and develops
strategies of an organization. An organization can succeed by developing competitive
strategies that counter the threats of five competitive forces (Porter, 2008, 1980) in its
industry. These five competitive forces are cost leadership, differentiation, innovation,
growth, alliances and other strategies (O‟Brien, 2004).
3.3 ORGANIZATIONAL LEARNING AS A FIRM COMPETENCY
Organizational learning (OL) or learning organization (OL/LO) has been the
focus of academicians and researcher. Seminal work is done on the concept of OL/LO by
Senge (2006), Garvin (1993), Goh (1993, 2003) and few dimensions have been
recommended which when instituted strategically develop organizations to achieve
competitive advantage. OL is considered as a strategic resource and an important
organizational capability (Smith, Vasudevan & Tanniru, 1996) that can designed,
developed and diverted with strategic intent to achieve of competitive advantage as is
pursued in the resource based view (RBV). LO has the capability to proactively foresee
the future and facilitate and enable individuals and organizations to compete and achieve
advantage by developing new horizons and enlarging the present canvass. A learning
organization build organizational competitive capabilities by building few disciplines;
mental models, shared vision/mission, personal mastery/personal growth, systems
thinking, leadership, knowledge/information flow, team learning (Akhtar, 2010, Akhtar
Copyright © 2011. NJMT
37
NUML Journal of Management & Technology
Vol: 6, No: 1. January, 2011 ISSN 1997-4507
& Khan, 2011). Argyris and Schon (1978) suggest that organizations enhance learning by
challenging basic assumptions and by challenging the basic routines. Institutionalizing
contextual factors and reconsidering the basic routine improves the organizational
learning and makes organizational processes and activities more competitive.
Literature reveals the empirical links between firm competencies and levels of
learning (Murray & Donegan, 2003; Smith et al. (1996). Findings appear closer the
theoretical claims of Goh (1998; Senge, 2006). The claim was that the learning
organizations can expand the capabilities of their employees, learn by identifying the gap
between present and desired level, and by challenging their existing norms and patterns.
Challenging basic assumptions allows new learning and improves organizational
performance.
In view of the above discussion it can be concluded that the resource-based view,
technology/ information technology, generic strategies, culture, and organizational
learning all achieve competitive advantage in their own realms. Moreover their own
strategic existence can not be denied and to excellence in each area demands deliberate
planned operational HRD activities.
Strategies are designed to achieve the advantage and earn super normal rents.
Strategic intervention, change through training or processes is aimed at improving
organizational effectiveness. But, without measurement strategy will be a fruitless effort.
Hence, strategic changes underscore their impact through measuring which is the
objective of next section.
3.4 STRATEGY AND BUSINESS PERFORMANCE
The thing which is measure is noticed (Pfeffer, 2005). Strategy without measuring
the performance is of no value. Research shows that firm performance is the objective of
strategy (Barney, 2002). It is noted that no single measure of performance is without
flaws. Therefore, this paper talks different dimensions of strategy which can be suggested
to measure the competitive advantage of a firm depending upon the nature and business
of a particular firm with few changes.
In addition to superior quality and market share (Garvin, 1993), other tangible
objective in a business can include shareholders return and profit maximization (Shim &
Siegel, 1987; Bharadwaj, Varadarajan, and Fahy, (1993.p.86), and return on investment
(Bharadwaj, Varadarajan, & Fahy, 1993.p.86). There are few studies (Dimovski, 1994;
Bontis, Crossan and Hulland, 2002; Jashapara, 2003; Morgan and Turnell, 2003) which
measured organizational performance by employing the perception of performance
measures.
It is also found that the performance measures include objective and subjective
measures. Literature provides few reasons for collecting perception of the managers on
organizational performance, and using objective and subjective measures. First, as per
McGuire and Schneeweis (1983), Smith (1982) identified 45 reputable U.K. companies
Copyright © 2011. NJMT
38
NUML Journal of Management & Technology
Vol: 6, No: 1. January, 2011 ISSN 1997-4507
using five or more dubious financial engineering techniques (cited in Jashapara, 2003),
therefore using only objective measures can harm the quality of the study. Secondly,
Venkatraman and Ramanujum (1986) found that the perceptual measurement of the
objective measure of organizational performance is valid, which is further supported by
the Morgan and Turnell (2003). They identified a high correlation between objective and
perceptual indicators.
Thirdly, Eccles and Nohria (1992) have noted that there is no wide spread
agreement of a definitive approach to measure performance (cited in Jashapara, 2003).
Finally, it is noted that the measurement development can not be carried out in isolation
of the theoretical network (Venkatraman, 1989). Therefore, this theory focuses to develop
valid measure based upon a particular theoretical conceptualization of strategy concept.
The variables chosen to measure organizational performance are market share,
sales growth (Morgan & Turnell, 2003); overall organizational performance, reputation
(Jashapara, 2003); return on revenue, (Bontis, Crossan & Hulland (2002); ROI, debt/
equity ratio etc., (Dimovski, 1994). Strategy measurement literature reveals business
economic performance (BEP) as being the most focused and commonly used measure of
performance with three dimensions: sales growth, net income growth, and return on
investment (ROI) (Venkatraman, 1989; Venkatraman & Ramanujum, 1986).
Strategy literature revealed firm resources and competencies, management skill
and capabilities, generic strategies, Porter‟s five forces, information technology and value
chain, and finally the business economic performance. Variables chosen from the
literature are: reputation, brand image, research and development (resources or
competences), cost, differentiation, market share (market growth), and financial
performance and sales growth (business economic performance).
3.5 CONCLUSIONS
The extant literature review has revealed that the competitive advantage is a
multifaceted concept and has the linkages with the various concepts like: resource-based
view, competencies, capabilities, culture, technology/ information technology, generic
strategies and organizational learning capability. Organizations have to excel consider,
develop, and excel in these respective areas to fight out the competitors and achieve
sustainable competitive advantage. Strategy can be formulated on the basis of these
concepts which provide internal and external compatibilities to formulate a unique bundle
of strengths. Organizational learning has been taken as a capability. The concepts like:
resource-based view, competencies, and capabilities are suggested to call as strategic
resources as future terms avoiding any ambiguity between these terms. Further the idea of
measurement of all theses concepts is presented in this paper to measure the extent of
competitive advantage of any organization and ensuing business performance along the
dimensions discussed in the „strategy and business performance‟.
Copyright © 2011. NJMT
39
NUML Journal of Management & Technology
Vol: 6, No: 1. January, 2011 ISSN 1997-4507
3.6 FUTURE RESEARCH AREAS
All the strategic concepts given are important and can be taken as distinct
research areas i.e. resource-based view, strategy, business performance etc. All the
concepts discussed under competitive advantage can be measured through a questionnaire
which is presented in the appendix to measure such capability. The competitive
advantage capability can be measured independently by using first part of the
questionnaire as a single distinct concept by simply adding score achieve on all
dimensions. Moreover, all the concepts of competitive advantage can be taken as
independent variables and performance of any organization can be measured on the basis
of specific concepts along the measures given in part-2 of the questionnaire. The
dependent variable suggested for the independent variables of competitive advantage is
the Business Strategic & Economic Performance. Therefore, this questionnaire is
presented for future study in the field of strategy and its measurement across the
organizations and industries.
REFERENCES
Akhtar, N (2010). The Relationship of Organizational Learning and Competitive
Advantage: A case study of Petroleum Companies of Pakistan. An unpublished
Ph. D. dissertation by National University of Modern Languages, Islamabad,
Paksitan.
Akhtar, N. & Khan, Rashid A. (2011). Exploring the Paradox of Organizational Learning
and Learning Organization. Interdisciplinary Journal of Contemporary Research
In Business, 2(9).
Argyris, C., & Schön, D. (1978) Organizational learning: A theory of action perspective,
Reading, Mass: Addison Wesley.
Barney, Jay B. (2002). Gaining and Sustaining Competitive Advantage (Second Edition)
Prentice-Hall of India Private Limited, New Delhi 110001.
Barney, Jay B. (1991). Firm Resources and Sustained Competitive Advantage. Journal of
Management, 17(1), 99-120.
Barney, Jay B. (1986a). Strategic Factor Markets: Expectations, Luck, and Business
Strategy. ManaFFgement Science, 32 (10). 1231-1241. October 1986.
Barney, Jay B. (1986b). Organizational Culture: Can it be a source of sustained
competitive advantage. The Academy of Management Review, 11(30, 656-665.
July 1986.
Bharadwaj, Varadarajan, & Fahy, J. (1993). Sustainable Competitive Advantage in
Service Industries: A conceptual model and research proposition. Journal of
Marketing, 57(4), 83-99
Bontis, N., Crossan, M.M., Hulland, J. (2002). Managing Organizational Learning
Systems by Aligning Stocks and Flows. Journal of Management Studies, 39(4),
June 2002.
Burgelman, Robert A., Maidique, Modesta A., Wheelright, Steven C. (1995). Strategic
Management of Technology and Innovations (second edition). Irwin McGraw
Hill. USA.
Copyright © 2011. NJMT
40
NUML Journal of Management & Technology
Vol: 6, No: 1. January, 2011 ISSN 1997-4507
Chase, Jacob and Aquilano (2004). Operations Management for Competitive Advantage.
Harvard Business School Publishing. McGraw-Hill.
Dimovski, Vlado (1994). Organizational Learning and Competitive Advantage: A
theoretical and Empirical Analysis. Doctoral dissertation. Cleveland State
University. Retrieved on 21st July 2008 from http:// www.cek.ef.uni-
lj.si/dodtor/dimovski.pdf (Received on personal request from Professor Dr. Vlado
Dimovski.
Fahy, John (2000). Section 1: A Capabilities driven perspective. The resource-based view
of the firm: Some stumbling blocks on the road to understanding sustainable
competitive advantage. Journal of European Industrial Training, 24(2/3/4), 94-
104.
Garvin, D. (1993). Building a learning organization. Harvard Business Review, 71(4),
78-92.
Goh, S.C. (1998). Towards a Learning Organization: The Strategic Building Blocks.
SAM Advanced Management Journal, 63 (2). Spring 1998.
Goh, S.C. (2003). Improving Organizational Learning Capability: lessons from tow case
studies, The Learning Organizations, 19(4)
Ireland, R.Duane, Hitt, Michael A. (2005). Achieving and Maintaining Competitiveness
in 21st Century: The role of strategic leadership. Academy of Management
Executive, 19(4), 2005.
Jashapara, Ashok (2003). Cognition, Culture and Competition: an empirical test of the
learning organization. The Learning Organization, 10(1), 31-50.
Khalil, Tarek M. (2000). Management of Technology: The key to competitiveness and
wealth creation. McGraw-Hill, NY.USA
Mahoney, Joseph T., Pandian, Rajendran J.(1992). The Resource-Based View Within the
Conversation of Strategic Management. Strategic Management Journal, 13(5),
June, 363-380.
Mooney, Ann (2007). Core Competence, Distinctive Competence, and Competitive
Advantage: What is the Difference? Journal of Education for Business,
November/December.
Morgan, R.E., Turnell, C.R. (2003). Market-based Organizational Learning and Market
Performance Gains. British Journal of Management, 14, 255-274.
Murray, P., Donegan, K., (2003). Empirical linkages between firm competencies and
organizational learning. The Learning Organization, Vol., 10 (1): pp. 51-62.
Navarro & Moya (2005). Ch-2
O‟Brien, James A. (2004). Management Information Systems: Managing information
technology in business enterprise (Sixth Edition). McGraw-Hill, Boston.
Oster, Sharon M. (1999). Modern Competitive Analysis, Oxford University Press,
Oxford.
Pfeffer, Jeffrey (2005). Producing Sustainable Competitive Advantage through the
effective management of people. Academy of Management Executive, 19(4).
Porter, Michael E. (2008). The Competitive Forces that Shape Strategy. Harvard
Business Review, January 2008.
Porter, Michael E., Miller, Victor E. (1985). How information gives you competitive
Advantage. Harvard Business Review, July-August.
Copyright © 2011. NJMT
41
NUML Journal of Management & Technology
Vol: 6, No: 1. January, 2011 ISSN 1997-4507
Porter, Michael E. (1985). Competitive Advantage: Creating and Sustaining Superior
Performance. The Free Press. New York.
Porter, Michael E. (1980). Competitive Strategy: Techniques for analyzing industries and
competitors. The Free Press. London.
Prahalad, C.K., Hamel, Gary (1990). The Core Competence of the Corporation. Harvard
Business Review, May-June 1990.
Ray, Gautam; Barney, Jay B., Muhannaa Waleed A. (2004). Capabilities, Busienss
Processes, and Competitive Advantage: Choosing the Dependent Variable in
Emprical Tests of the Resource-Based View. Strategic Management Journal, 25,
23-
(This article was received on 5th March 2008 on personal request from Prof. Jay
Barney through e-mail).
Reed, R., & Defillipi, R.J. (1990). Causal Ambiguity, Barriers to Imitation, and
Sustainable Competitive Advantage. The Academy of Management Review,
15(1), 88-102.
Senge, P.M. (2006). The Fifth Discipline: The Art and Practice of the Learning
Organization. Currency Doubleday, New York.
Shim, J. k., Siegel, J. G. (1987). Theory and Problems of Managerial Finance
(International Edition). McGraw-Hill. New York, U.S.A.
Sirmon, David G; Hitt, Michael A., Ireland, R. Duane (2007). Managing Firm Resources
in Dynamic Environment to create Value: Looking Inside the Black Box.
Academy of Management Review, 32(1), 273-292.
Smith, K.A., Vasudevan, Satish P., Tanniru, M.R. (1996). Organizational learning and
Resource-based theory: an integrative model. Journal of Organizational Change
Management, Vol. 9(6): pp. 41-53.
Venkatraman, N. (1989). Strategic Orientation of Business Enterprises: The Construct,
Dimensionality, and Measurement. Management Science, 35(8), 942-962.
Venkatraman, N., Ramanujam, V. (1986). Measurement of Business Performance in
Strategy Research: A comparison of Approaches. The Academy of Management
Review, 11(4), October 1986, 801-914.
Wernerfelt, Berger (1984). A Resource-Based View of the Firm. Strategic Management
Journal, 5, 171-180.
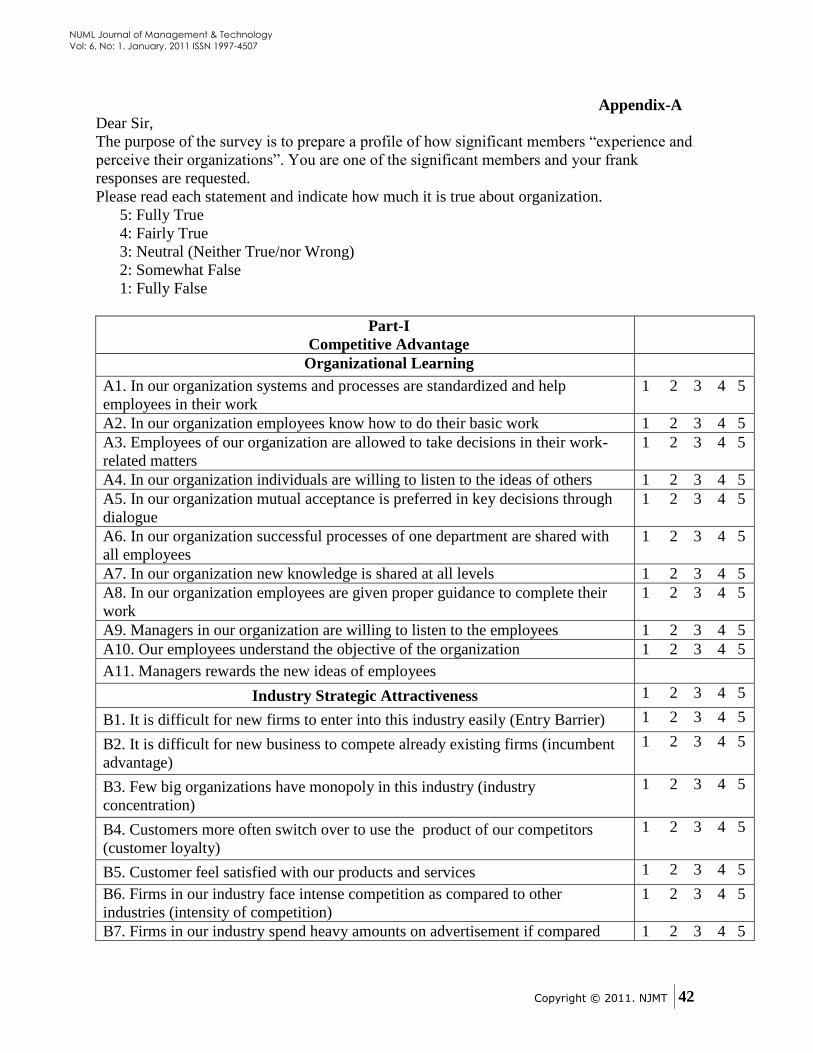
Copyright © 2011. NJMT
42
NUML Journal of Management & Technology
Vol: 6, No: 1. January, 2011 ISSN 1997-4507
Appendix-A
Dear Sir,
The purpose of the survey is to prepare a profile of how significant members “experience and
perceive their organizations”. You are one of the significant members and your frank
responses are requested.
Please read each statement and indicate how much it is true about organization.
5: Fully True
4: Fairly True
3: Neutral (Neither True/nor Wrong)
2: Somewhat False
1: Fully False
Part-I
Competitive Advantage
Organizational Learning
A1. In our organization systems and processes are standardized and help
employees in their work
1 2 3 4 5
A2. In our organization employees know how to do their basic work 1 2 3 4 5
A3. Employees of our organization are allowed to take decisions in their work-
related matters
1 2 3 4 5
A4. In our organization individuals are willing to listen to the ideas of others 1 2 3 4 5
A5. In our organization mutual acceptance is preferred in key decisions through
dialogue
1 2 3 4 5
A6. In our organization successful processes of one department are shared with
all employees
1 2 3 4 5
A7. In our organization new knowledge is shared at all levels 1 2 3 4 5
A8. In our organization employees are given proper guidance to complete their
work
1 2 3 4 5
A9. Managers in our organization are willing to listen to the employees 1 2 3 4 5
A10. Our employees understand the objective of the organization 1 2 3 4 5
A11. Managers rewards the new ideas of employees
Industry Strategic Attractiveness 1 2 3 4 5
B1. It is difficult for new firms to enter into this industry easily (Entry Barrier) 1 2 3 4 5
B2. It is difficult for new business to compete already existing firms (incumbent
advantage)
1 2 3 4 5
B3. Few big organizations have monopoly in this industry (industry
concentration)
1 2 3 4 5
B4. Customers more often switch over to use the product of our competitors
(customer loyalty)
1 2 3 4 5
B5. Customer feel satisfied with our products and services 1 2 3 4 5
B6. Firms in our industry face intense competition as compared to other
industries (intensity of competition)
1 2 3 4 5
B7. Firms in our industry spend heavy amounts on advertisement if compared 1 2 3 4 5
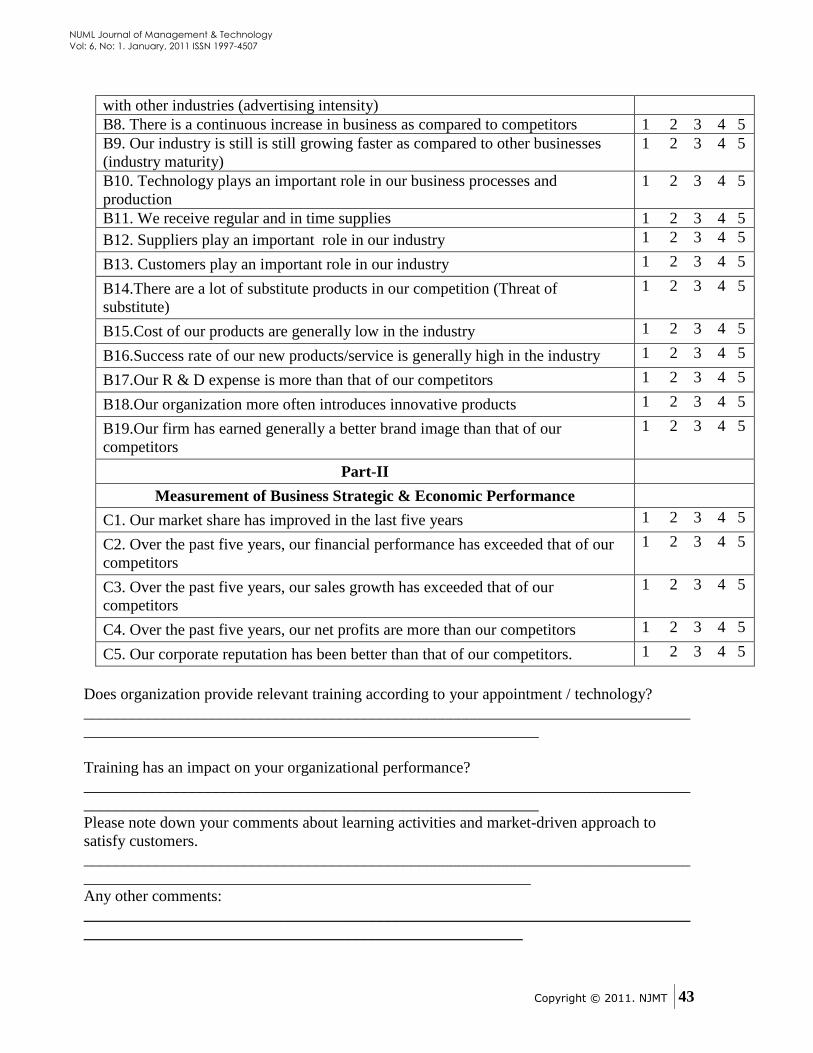
Copyright © 2011. NJMT
43
NUML Journal of Management & Technology
Vol: 6, No: 1. January, 2011 ISSN 1997-4507
with other industries (advertising intensity)
B8. There is a continuous increase in business as compared to competitors 1 2 3 4 5
B9. Our industry is still is still growing faster as compared to other businesses
(industry maturity)
1 2 3 4 5
B10. Technology plays an important role in our business processes and
production
1 2 3 4 5
B11. We receive regular and in time supplies 1 2 3 4 5
B12. Suppliers play an important role in our industry 1 2 3 4 5
B13. Customers play an important role in our industry 1 2 3 4 5
B14.There are a lot of substitute products in our competition (Threat of
substitute)
1 2 3 4 5
B15.Cost of our products are generally low in the industry 1 2 3 4 5
B16.Success rate of our new products/service is generally high in the industry 1 2 3 4 5
B17.Our R & D expense is more than that of our competitors 1 2 3 4 5
B18.Our organization more often introduces innovative products 1 2 3 4 5
B19.Our firm has earned generally a better brand image than that of our
competitors
1 2 3 4 5
Part-II
Measurement of Business Strategic & Economic Performance
C1. Our market share has improved in the last five years 1 2 3 4 5
C2. Over the past five years, our financial performance has exceeded that of our
competitors
1 2 3 4 5
C3. Over the past five years, our sales growth has exceeded that of our
competitors
1 2 3 4 5
C4. Over the past five years, our net profits are more than our competitors 1 2 3 4 5
C5. Our corporate reputation has been better than that of our competitors. 1 2 3 4 5
Does organization provide relevant training according to your appointment / technology?
____________________________________________________________________________
_________________________________________________________
Training has an impact on your organizational performance?
____________________________________________________________________________
_________________________________________________________
Please note down your comments about learning activities and market-driven approach to
satisfy customers.
____________________________________________________________________________
________________________________________________________
Any other comments:
____________________________________________________________________________
_______________________________________________________
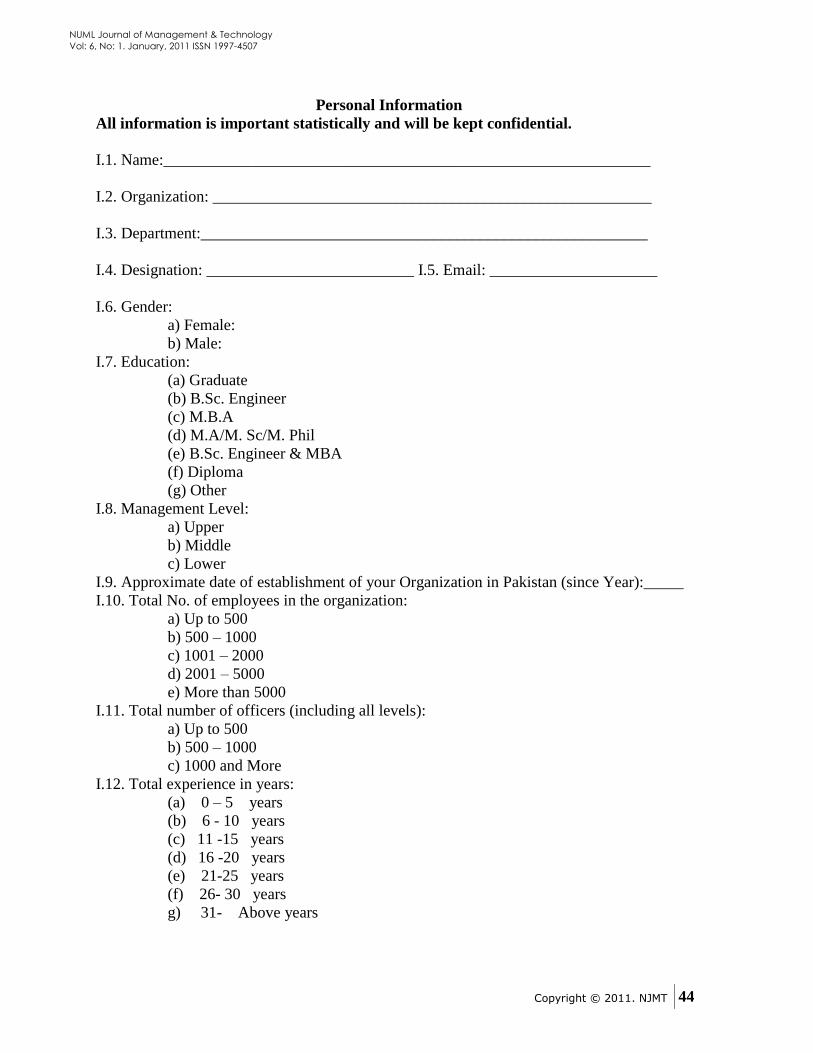
Copyright © 2011. NJMT
44
NUML Journal of Management & Technology
Vol: 6, No: 1. January, 2011 ISSN 1997-4507
Personal Information
All information is important statistically and will be kept confidential.
I.1. Name:_____________________________________________________________
I.2. Organization: _______________________________________________________
I.3. Department:________________________________________________________
I.4. Designation: __________________________ I.5. Email: _____________________
I.6. Gender:
a) Female:
b) Male:
I.7. Education:
(a) Graduate
(b) B.Sc. Engineer
(c) M.B.A
(d) M.A/M. Sc/M. Phil
(e) B.Sc. Engineer & MBA
(f) Diploma
(g) Other
I.8. Management Level:
a) Upper
b) Middle
c) Lower
I.9. Approximate date of establishment of your Organization in Pakistan (since Year):_____
I.10. Total No. of employees in the organization:
a) Up to 500
b) 500 – 1000
c) 1001 – 2000
d) 2001 – 5000
e) More than 5000
I.11. Total number of officers (including all levels):
a) Up to 500
b) 500 – 1000
c) 1000 and More
I.12. Total experience in years:
(a) 0 – 5 years
(b) 6 - 10 years
(c) 11 -15 years
(d) 16 -20 years
(e) 21-25 years
(f) 26- 30 years
g) 31- Above years

Copyright © 2011. NJMT
45
NUML Journal of Management & Technology
Vol: 6, No: 1. January, 2011 ISSN 1997-4507
I.13. Age Group:
(a) 20-30 years
(b) 31-40 years
(c) 41-50 years
(d) 51-60 years
(e) 60+ years
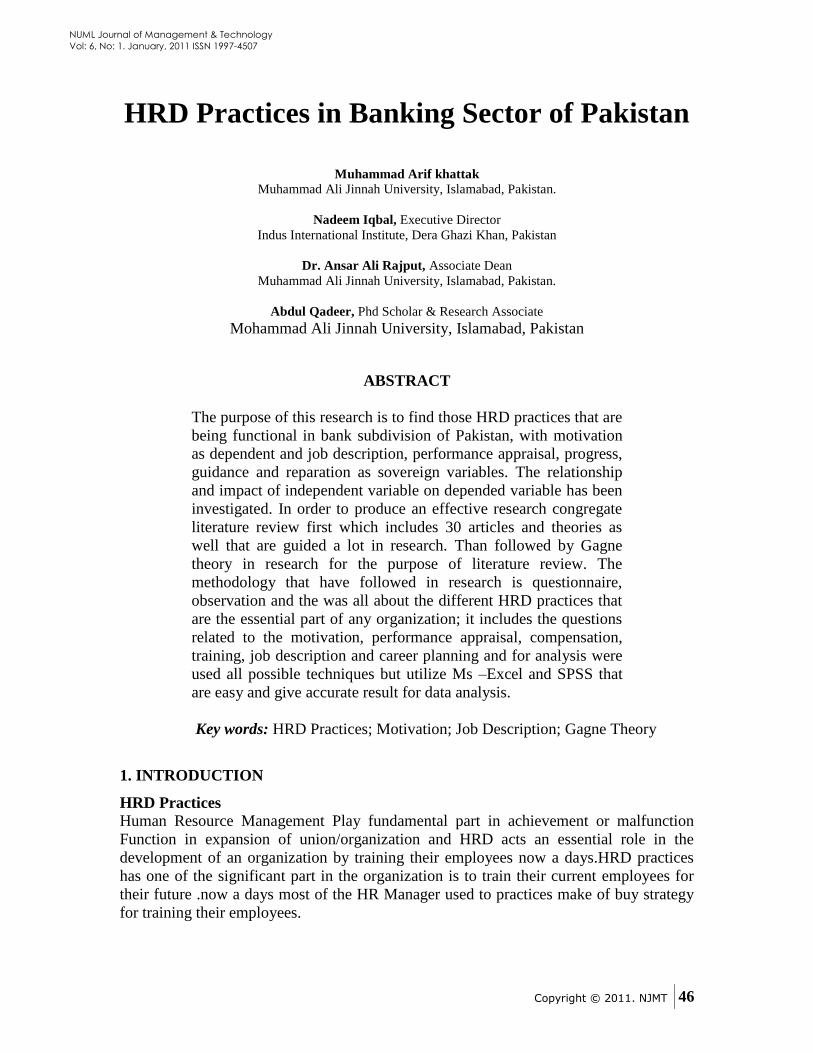
Copyright © 2011. NJMT
46
NUML Journal of Management & Technology
Vol: 6, No: 1. January, 2011 ISSN 1997-4507
HRD Practices in Banking Sector of Pakistan
Muhammad Arif khattak
Muhammad Ali Jinnah University, Islamabad, Pakistan.
Nadeem Iqbal, Executive Director
Indus International Institute, Dera Ghazi Khan, Pakistan
Dr. Ansar Ali Rajput, Associate Dean
Muhammad Ali Jinnah University, Islamabad, Pakistan.
Abdul Qadeer, Phd Scholar & Research Associate
Mohammad Ali Jinnah University, Islamabad, Pakistan
ABSTRACT
The purpose of this research is to find those HRD practices that are
being functional in bank subdivision of Pakistan, with motivation
as dependent and job description, performance appraisal, progress,
guidance and reparation as sovereign variables. The relationship
and impact of independent variable on depended variable has been
investigated. In order to produce an effective research congregate
literature review first which includes 30 articles and theories as
well that are guided a lot in research. Than followed by Gagne
theory in research for the purpose of literature review. The
methodology that have followed in research is questionnaire,
observation and the was all about the different HRD practices that
are the essential part of any organization; it includes the questions
related to the motivation, performance appraisal, compensation,
training, job description and career planning and for analysis were
used all possible techniques but utilize Ms –Excel and SPSS that
are easy and give accurate result for data analysis.
Key words: HRD Practices; Motivation; Job Description; Gagne Theory
1. INTRODUCTION
HRD Practices
Human Resource Management Play fundamental part in achievement or malfunction
Function in expansion of union/organization and HRD acts an essential role in the
development of an organization by training their employees now a days.HRD practices
has one of the significant part in the organization is to train their current employees for
their future .now a days most of the HR Manager used to practices make of buy strategy
for training their employees.
Copyright © 2011. NJMT
47
NUML Journal of Management & Technology
Vol: 6, No: 1. January, 2011 ISSN 1997-4507
In the past decade this field was not used as a specialized department, there were not
enough knowledge related to that field, but with the passage of time Human Resource
Department has become a fundamental of any organization specially bank. Now in the
banking sector the systematically training secession are more important, after the
announcement of SBP they offer training program for bank‟s employee. The main idea
behind the selection of the research about HRD practices in the banking zone of Pakistan
is that there is very limited study of HRD practices in the field of Banking. Although
there is lot of research available on Human Resource Practices in other sector, especially
on the training and motivation but the banking sector had been on the low side.
The scope of Research is to classify the bang of HRD practices on employees‟
enthusiasm and effect of motivation on the workers presentation towards organization
and also identify the impact other HR component that may also affect the employees‟
performance. The research on HRD practices by using same variables can be conducted
on any other sector or industry and Improved the quantity of sample size of survey then
there is very much chances of desired results.
The main purpose of study is to attain useful data concerning the impact of HRD
practices on employee motivation in the functioning of banking sectors which is very
necessary to fully understand the primary functions & hence it fulfill the purpose of the
Research. Know how to write objectives and evaluate whether these objectives are
beneficial for banking sector or new entrance in the bank sector. Aim of explore is to
verify the impulsive role on employees and organization performances and objective of
research is how we can use all possible tools and techniques to accomplish aim
The focus in HRD practices is on the “Employee Performance” through “Motivation”
because it is the main aspect of an organizational success. In Pakistan, Incentive in
banking zone is generally on lower side, although there are certain rules and regulation or
policies regarding HR but some of them are used to accomplish the organization‟s
intention. The studies clearly described the turn over rate high due to employees
dissatisfaction towards their organization.
The geographic area for the project is banks of twin cities Islamabad/Rawalpindi and the
sample size is 100. Research Results will help the Banking Sector to recognize and
develop the new policies according to the changing environmental conditions. Further
classification of the report includes the Literature Reviews, Methodology, Data Analysis
and Conclusion. In literature review describe difference between the literature review and
the actual practices in the banking and followed by Methodology which include data
type, source of collection, link of hypothesis and model used to conclude the data and
analysis which depend on data which we get from survey form filled by different banks
of twin cities Islamabad & Rawalpindi and at the end conclusion of the research.
2. LITERATURE REVIEW
In present age, supervisors are known as „human resource management‟ and submit to the
tasks a union exploits human resources efficiently. Global party should be aware of
Copyright © 2011. NJMT
48
NUML Journal of Management & Technology
Vol: 6, No: 1. January, 2011 ISSN 1997-4507
administration in present inclusive environment. The Gagne Briggs presumption is
relevant to activities and approach learning its also Presentation of sets of methods for
coaching which are attached to communal theory Foremost affair in theory is
concentration parallel to that of communal learning and next affair is enlighten the ideas
and trigger the method of trainees attention. There are several attention seeking gestures
like raising voice or clapping hands etc., “may I have your attention please” but the most
effective technique is the training sessions. Inform the learner of the goal or objective
Recall what you have learnt earlier. It is important to know that what new is going to be
learned in the following training session. This Literature Review suggests that HRD
practices are significance for every organization and nation motivation is crucial for
success of any organization. Organization must invest or separate their budget for HRM
because it makes the organization more productive than others organization.
The main points to be focused in this research are the idea of top management
commitment for HRD practices in organization satisfaction of employees and customers.
In well structured organizations where is an essential part in producing the services and
put positive impact on the Employee satisfaction and commitment. In highly structured
and established organization the financial objectives and quality is achieved by
implementing HRD practices, developing healthy culture and work place environment.
Employee‟s commitment with work affects the service quality of the organization,
Expertise and skills and performing the work proficiently and also the employees'
commitment to providing supervisor services for the customers and their satisfaction. The
research was on the impact of HRD practices in banking sector of Pakistan, in our
research motivation is the depended variable and training, job description, career
planning, performance appraisal, compensation are independent variables. According to
Milkovich and Newman 2002, compensating the employees refers to the financial returns
visible benefits that are given to the employees for building relationships. The importance
of compensation and motivating employees has been described by many researchers. The
major considerations in HRM are the compensation benefits such as pay, medical and
transportation etc because it provides employees with a solid reward for their work.
HRM recognizes that the benefits provided to the employees encourages them and direct
their behavior towards the particular goals. There are different reasons for the people
motivating by money. One of the reasons is that it provides basic necessities for life
(Kovach, 1987). The message of the management for the employees is given by the
benefits that are given provided to them and it tells the employees how to direct their
attitude and behaviors (Beer, et al 1999). Jerald, 1997 has described that there has been
an impact and link between absentees and turnover with employee satisfaction and pay
level. The individual and organizational performance can be affected by link between pay
and behavior of the employees. (W. N. Cooke: 1994) the pay system characteristics and
level of pay can affect the employee‟s decision to join the firm. (E. E. Lawler: 1971).
There has been a study related to strategic decisions to organizational performance
convenience sampling technique was use involving 314 companies response. The results
indicated that no significance difference was found between the performance of company
that make and buy. With reference to (Advance writer, 14 July, 2010).The economy is
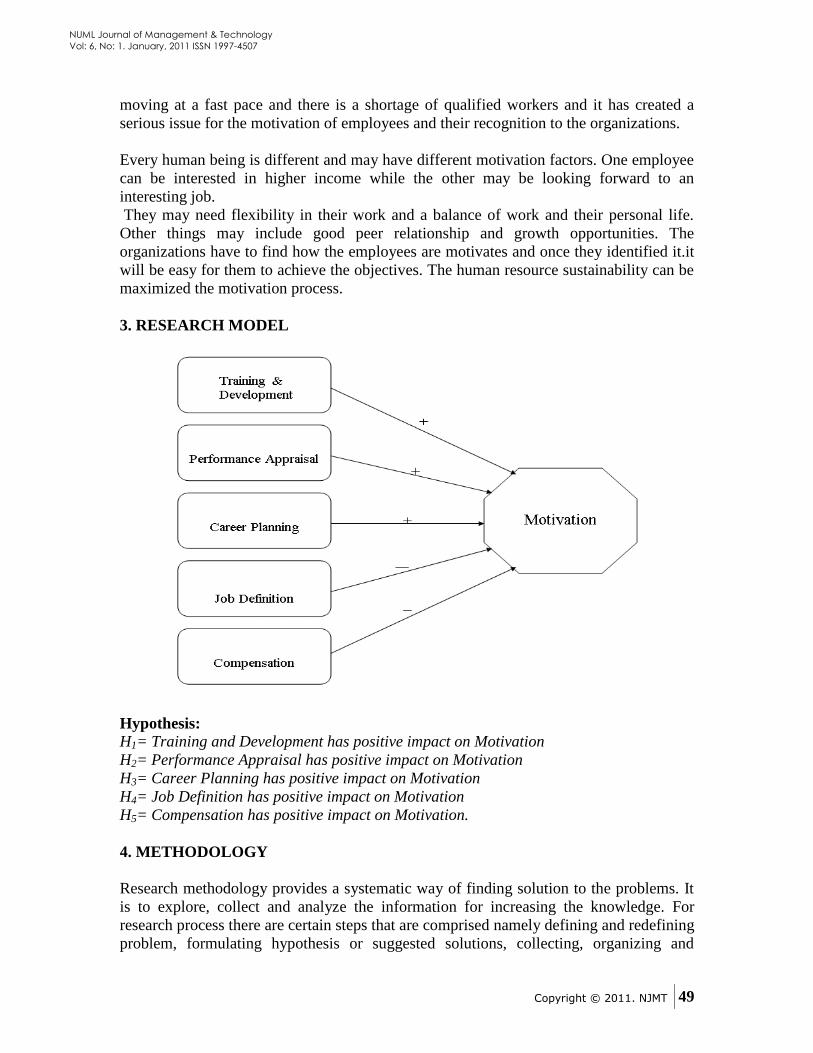
Copyright © 2011. NJMT
49
NUML Journal of Management & Technology
Vol: 6, No: 1. January, 2011 ISSN 1997-4507
moving at a fast pace and there is a shortage of qualified workers and it has created a
serious issue for the motivation of employees and their recognition to the organizations.
Every human being is different and may have different motivation factors. One employee
can be interested in higher income while the other may be looking forward to an
interesting job.
They may need flexibility in their work and a balance of work and their personal life.
Other things may include good peer relationship and growth opportunities. The
organizations have to find how the employees are motivates and once they identified it.it
will be easy for them to achieve the objectives. The human resource sustainability can be
maximized the motivation process.
3. RESEARCH MODEL
Hypothesis:
H1= Training and Development has positive impact on Motivation
H2= Performance Appraisal has positive impact on Motivation
H3= Career Planning has positive impact on Motivation
H4= Job Definition has positive impact on Motivation
H5= Compensation has positive impact on Motivation.
4. METHODOLOGY
Research methodology provides a systematic way of finding solution to the problems. It
is to explore, collect and analyze the information for increasing the knowledge. For
research process there are certain steps that are comprised namely defining and redefining
problem, formulating hypothesis or suggested solutions, collecting, organizing and
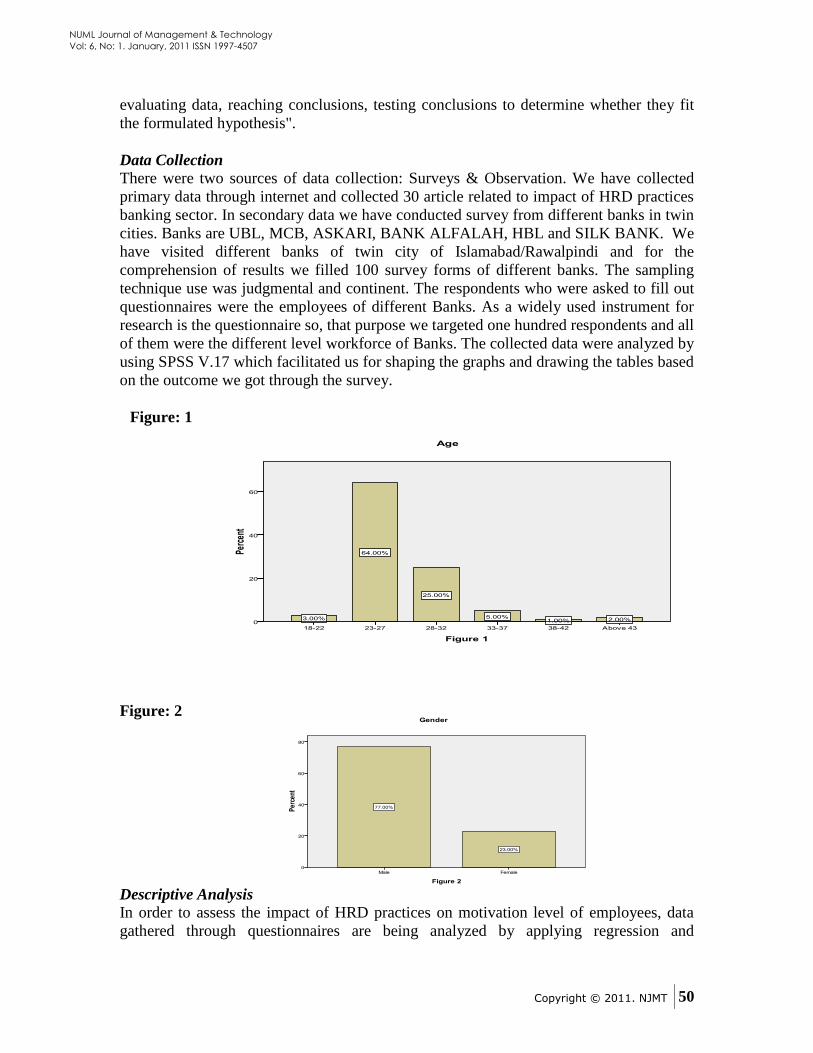
Copyright © 2011. NJMT
50
NUML Journal of Management & Technology
Vol: 6, No: 1. January, 2011 ISSN 1997-4507
evaluating data, reaching conclusions, testing conclusions to determine whether they fit
the formulated hypothesis".
Data Collection
There were two sources of data collection: Surveys & Observation. We have collected
primary data through internet and collected 30 article related to impact of HRD practices
banking sector. In secondary data we have conducted survey from different banks in twin
cities. Banks are UBL, MCB, ASKARI, BANK ALFALAH, HBL and SILK BANK. We
have visited different banks of twin city of Islamabad/Rawalpindi and for the
comprehension of results we filled 100 survey forms of different banks. The sampling
technique use was judgmental and continent. The respondents who were asked to fill out
questionnaires were the employees of different Banks. As a widely used instrument for
research is the questionnaire so, that purpose we targeted one hundred respondents and all
of them were the different level workforce of Banks. The collected data were analyzed by
using SPSS V.17 which facilitated us for shaping the graphs and drawing the tables based
on the outcome we got through the survey.
Figure: 1
Figure: 2
Descriptive Analysis
In order to assess the impact of HRD practices on motivation level of employees, data
gathered through questionnaires are being analyzed by applying regression and
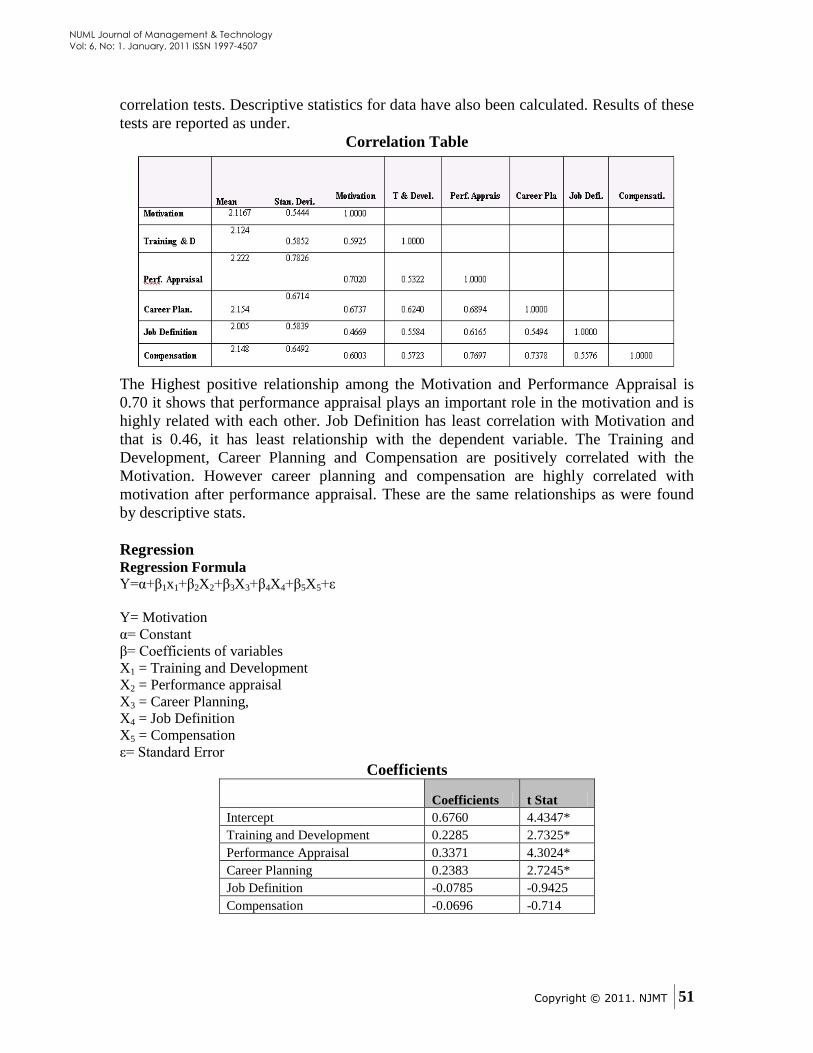
Copyright © 2011. NJMT
51
NUML Journal of Management & Technology
Vol: 6, No: 1. January, 2011 ISSN 1997-4507
correlation tests. Descriptive statistics for data have also been calculated. Results of these
tests are reported as under.
Correlation Table
The Highest positive relationship among the Motivation and Performance Appraisal is
0.70 it shows that performance appraisal plays an important role in the motivation and is
highly related with each other. Job Definition has least correlation with Motivation and
that is 0.46, it has least relationship with the dependent variable. The Training and
Development, Career Planning and Compensation are positively correlated with the
Motivation. However career planning and compensation are highly correlated with
motivation after performance appraisal. These are the same relationships as were found
by descriptive stats.
Regression Regression Formula
Y=α+β1x1+β2X2+β3X3+β4X4+β5X5+ε
Y= Motivation
α= Constant
β= Coefficients of variables
X1 = Training and Development
X2 = Performance appraisal
X3 = Career Planning,
X4 = Job Definition
X5 = Compensation
ε= Standard Error
Coefficients
Coefficients t Stat
Intercept 0.6760 4.4347*
Training and Development 0.2285 2.7325*
Performance Appraisal 0.3371 4.3024*
Career Planning 0.2383 2.7245*
Job Definition -0.0785 -0.9425
Compensation -0.0696 -0.714
Copyright © 2011. NJMT
52
NUML Journal of Management & Technology
Vol: 6, No: 1. January, 2011 ISSN 1997-4507
Table III presents the relationship of training and development, performance appraisal,
career planning, job definition and compensation with motivation of employees in
banking sector. Results shows that training and development, performance appraisal, and
career planning has a significantly positive impact over motivation i-e with an
improvement in these factors employee motivation increases. Surprisingly Job Definition
and Compensation has negative impact on Motivation however these relationships are
found to be insignificant. Literature Review suggests a positive relation between these
factors but in our research project it is found negative. The reason behind is the level of
research we have conducted was limited, the limited number of respondents, limitation or
lack of knowledge of the target population or the respondents were not entitled to
disclose any information related to the personal matter of the organization.
F value shows the overall significance of the model. For our study, F stat is found as
27.56 which is highly significant. This shows that our independent variables (Training
and Development, Performance Appraisal, Career Planning, Job Definition and
Compensation), contributes well towards the motivation level of employees in banking
sector. R2 for the study is found 0.5945 which means 59% of motivation is affected by
HRD practices selected in our study.
5. CONCLUSION
After the research it can be suggested that human resources must be taken into
consideration so as to achieve by competitive edge and be united in the current global
financial recession period than the banking sector is experiencing highly stress and
pressure level from the external environment. Motivation, The important part of the
organization is training and development. The growth of the company is much effected
by employee training and motivation level.
As consideration of result Performance Appraisal is vital in the banking sector because
there is 70% positive impact on the motivation of employees that is huge from rest of the
others factors. The employee‟s performance can be helpful in attaining high levels of
performance. 67% result of Career Planning that shows clearly employees from banking
sector they really want to seek better, bright future in banks. Compensation is always
fruitful and effective tool for the manger‟s to motivate their employees, result shows 60%
employees think that compensation must be given to them for the motivation and
encouragement performance graph move up automatically by using this tool According
to the results the maximum employees in banking sector is master education and satisfy
with reasonably periodically increase in salary High level of compensation and a good
working environment is related to motivation and the banking sector must identify what
type of work place and environment can motivate their employees. How to compensate
their employees that they work benefit for the organization in the long run? Moreover the
banking sector in Pakistan develop a compensation structure that is up to the requirement
of employees and they have no worries for their basic needs
Trainings can be costly and time taking, that‟s why there is 59% impact on the motivation
of employees that‟s low because training session are only specific. Keeping up to date
Copyright © 2011. NJMT
53
NUML Journal of Management & Technology
Vol: 6, No: 1. January, 2011 ISSN 1997-4507
with the trends and the technology and occasional refresher courses will add a new life to
both the employee and the organization. Last point which is Job Description equally
important for employees result shows 46% positive impact on the motivation of the
employees that‟s not good as compared to the others factors employees adds values in the
organization success if they don‟t known what to do and how to do they how they can
perform up to standard which is acceptable .
From the Regression result our two hypothesis Job Description and Compensation show
negative relation with the motivation because in the banking sector there is environment
Bosses cannot define the job to their employees and they can take extra work, employees
can not know what are the responsibilities of their position if they work over time then
they cannot get reward from organization. Training, Performance Appraisal, Career
Planning they shows positive relation with the motivation because employees from
banking sector they known training or performance appraisal can valued for them training
leads to the promotion and career planning that highly appreciated in the banking sector
because employees know that‟s lead to the increase in the salary and other incentive and
satisfaction as well.
6. RECOMMENDATIONS
After the analysis being completed it can be suggested that following recommendations
to the banking sector of Pakistan can be helpful for motivating the employees and
designing better job description including training programs which elevates skills,
abilities and also increases the image of banking sector.
Job Description is defined and if employees go for extra work then they should
compensate or rewarded. Employer must not get extra work and should follow the
working hour‟s policy. In the banking sector performance appraisal is appreciated so they
utilize Training and other factors as well. Employer must make career planning because
employees are motivated by perceiving their future in the sector. Compensation should
value to employees both in terms of promotion and increment in salary. Don‟t expect
everyone to do things your way. Allowing people to be creative and that create a more
optimistic environment and can lead to awesome new ideas.
7. REFERENCES
Beer, M. and Walton, E. R. 1990 “Reward Systems and the Role of Compensation”
Manage People, Not Personnel: Motivation and performance Appraisal. A
Harvard Business Review Book, Chapter 2, pp.15-30.
E. E. Lawler, 1971, Pay & Organizational Effectiveness: A Psychological View, New
York, McGrew-Hill, Inc.
Jerald, G. and Robert, A. B., 1997. Behavior in Organizations: Understanding and
Managing the Human Side of Work, Upper Saddle River, NJ: Prentice-Hall, Inc.
Copyright © 2011. NJMT
54
NUML Journal of Management & Technology
Vol: 6, No: 1. January, 2011 ISSN 1997-4507
Kovach, K., 1987. What Motivates Employees? Workers and Supervisors Give Different
Answers. Business Horizons.
Milkovich & Newman, 2002. Compensation, 7th ed, The McGrew-Hill Companies, Inc.
W. N. Cooke, 1994, “Employee Participation Programs, Group based Incentives &
company Performance,” Industrial and Labour Relations Review 47, pp. 603- 36.
Copyright © 2011. NJMT
55
NUML Journal of Management & Technology
Vol: 6, No: 1. January, 2011 ISSN 1997-4507
Impact of top management support,
knowledge management and work place
spirituality on performance: A case study of Rawalpindi and Islamabad Universities
Jawad Javaid, Lecturer Faculty of Management Sciences, NUML University
Muhammad Niaz Khan, Lecturer Faculty of Management Sciences, NUML University
ABSTRACT
This purpose of this research is to analyze the impact of top
management support, effective knowledge management, work place
spirituality on organization performance in universities of the twin
cities of Rawalpindi and Islamabad. A questionnaire consists of 20
questions was distributed among the faculty members of the
universities. The questionnaire is based on liker five-point scale
items of the questionnaire were adapted from the different
researches. SPSS 16.00 is used for regression. Results show that the
top management support, effective knowledge management, work
place spirituality have positive impact on organization performance.
Sample size and generalization is the limitation of study. This study
may conduct in different organization with greater sample size in
order to generalize
Keywords: Knowledge Management, Work Place Spirituality, Twin
Cities
1. INTRODUCTION
Organization is group of people gel together in a common plate form to achieve common
goals (Wino grad & Flores, 1987). Organization performance is always a primary
concern for the top manager (Day et al., 2000).The primary objective for ever
organization is to improve its performance to achieve the excellence the top manger is
always look for the best practices there are several factors effect the organization
performance (Ali, 2007).
Central theme for every school of management (scientific, classical, behavioral human
relation) is to enhance the organization performance (Smith & Farquhar, 2000).
Knowledge management and work place spirituality are the new dimension through
which organization can drastically improve there performance (Senge, 1994).
Copyright © 2011. NJMT
56
NUML Journal of Management & Technology
Vol: 6, No: 1. January, 2011 ISSN 1997-4507
This paper will determine the impact of top management support, knowledge
management and work place spirituality on organization performance. Knowledge
management is the discipline that helps organizations to manage knowledge for
competitive edge (Ali, 2007). Interest in workplace spirituality has increased steadily
over the last decade of the twentieth century and into the new millennium (Giacalone &
Jurkiewicz, 2004).Workplace spirituality emphasis that divine values has had an impact
on work performance and organization productivity. While some corporations have
institutionalized spirituality, ways that managers and administrators in both the public
and the private sector can use workplace spirituality to increase performance and develop
ethical organizations. The findings suggest that when people experience workplace
spirituality, they feel more affectively attached to their organizations, experience a sense
of obligation/loyalty and feel less instrumentally committed (Hayen, 2007).
Current reform in some of the Malaysian organization put a greater stress or the effective
leadership and school progress. Traditions highlighted the importance of leadership in
successful school development and change (Day et al., 2000)
The objective of this paper is to determine the top management commitment and support
to ward knowledge management, work place spirituality.
1. How much knowledge management and contributing towards organization
performance?
2. How much workplace spirituality contributing towards organization performance?
This paper is significant in ways that in order to which organizations motivate employees
collectively not only fulfill the physiological need of the employees along with it they
need to fulfill their psychological need emotional and spiritual need.
The stakeholders of this research are those organization profit and non-profit
organization. A dynamic organization improves their performance not on the expense of
their employees rather by working with them and achieves both organizational as well as
individual goals. The researcher this paper will help them to understand how mental and
spiritual needs can improve employees‟ performance. The collective use of variables like
knowledge management and workplace spirituality are being rarely seen.
2. LITERATURE REVIEW
Any program will have no fruitful and desired outcomes unless it is initiated driven
supported or sponsored by top management (Senge,1996).Top manager support help
organization in forecasting trends, developing networking, building relationships (Hayen,
2007). Leadership role and top management support is vital and lack of management
support may be the impendent on the firm‟s competitive edge and success (Maponya,
2004). Upper stratum of literature has put emphasis on the role of top managers in
strategy formation and the resulting organizational outcomes (Hambrick, 2007).
Top management support moderates‟ the relation ship between new product development
process and teams learning process (Islam, 2009).Top management support sheltered

Copyright © 2011. NJMT
57
NUML Journal of Management & Technology
Vol: 6, No: 1. January, 2011 ISSN 1997-4507
vital assets for human development, and ease of use and integration of other related in-
house resources in embracing and development process (Hayen, 2007).
Consequences advocate that top management vision is an important addition to top
management support for smooth the progress of and the implementation of supportive
practices (Islam, 2009).Empirical investigation examining the role of top management
vision and top management support in creating managerial prospect for persons with
disabilities (Moore, 2010). the success of knowledge management is dependent on
support of top management are most critical and influential factors(Islam, 2009).top
management support and vision gives employees the direction and motivation to perform
efficiently and effectively in pursuit to achieve organization goals ( Moore, 2010).
Knowledge management is a systematic rational process for creation, inventory,
representation and classification of Knowledge this leads to improve the operational
efficiency (Alryalat & ALHawari, 2008). Knowledge is the most significant and valuable
resource in today‟s competitive world (Gore & Gore, 1999).Knowledge management is
keenly endorsed by various formal and informal manners by the top management of the
organizations (Ribiere & Sitar, 2003).
Top-level managers encourage, inspire and support all organizational employees to
actively participate and engage employees in the knowledge management related
activities. Firms effectively and efficiently manage its knowledge resource to gain long-
term competitive edge to be learning organization to improve over all organizational
performance (Ali, 2007).knowledge management is based on broader and long term ways
to achieve long term goals , it reflect the system ,it shows as a discipline and cultural
values (Waltz , 2003).
Employees are acknowledged and rewarded for giving and sharing valuable and
innovative ideas & information that become the basis for corporate knowledgebase
system (Ribiere & Sitar, 2003). Knowledge can be classified into two forms one is tacit
knowledge which comes from the ones experience include his beliefs ,views and values
where other form is the explicit or codified knowledge which can easily be documented
(waltz ,2003).
Organization performance is always a primary concern for the top manager (Day et al.,
2000).The primary objective for ever organization is to improve its performance to
achieve the excellence the top manger is always look for the best practices there are
several factors effect the organization performance (Ali, 2007). Central theme for every
school of management (scientific, classical, behavioral human relation) is to enhance the
organization performance (Smith & Farquhar, 2000).Organization performance reflects
how effectively and efficiently organization achieves its goals. In order to measure the
impact of knowledge management and work place spirituality on company performance,
easy to follow measures of performance (Baker & Sinkula, 1999).New product
development ensure success, growth, profitability (Han et al., 1998).Improved-
harmonized, more-supportive organizations that generate, attain, and (most importantly)
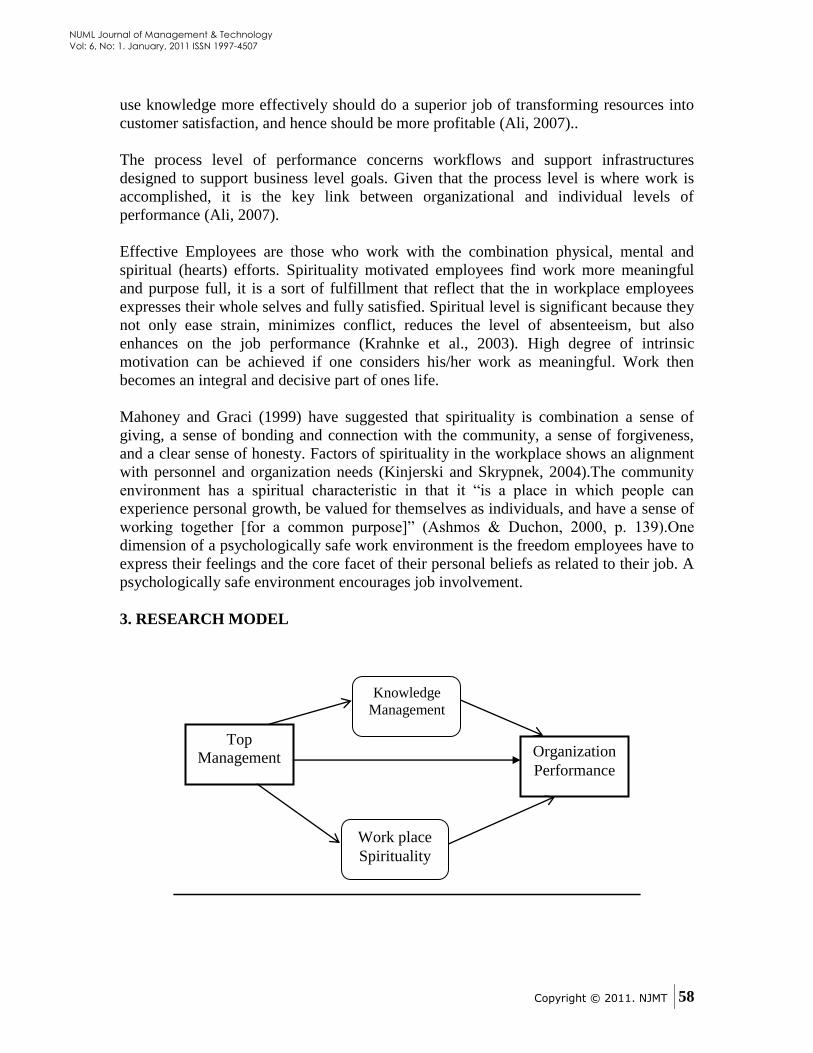
Copyright © 2011. NJMT
58
NUML Journal of Management & Technology
Vol: 6, No: 1. January, 2011 ISSN 1997-4507
use knowledge more effectively should do a superior job of transforming resources into
customer satisfaction, and hence should be more profitable (Ali, 2007)..
The process level of performance concerns workflows and support infrastructures
designed to support business level goals. Given that the process level is where work is
accomplished, it is the key link between organizational and individual levels of
performance (Ali, 2007).
Effective Employees are those who work with the combination physical, mental and
spiritual (hearts) efforts. Spirituality motivated employees find work more meaningful
and purpose full, it is a sort of fulfillment that reflect that the in workplace employees
expresses their whole selves and fully satisfied. Spiritual level is significant because they
not only ease strain, minimizes conflict, reduces the level of absenteeism, but also
enhances on the job performance (Krahnke et al., 2003). High degree of intrinsic
motivation can be achieved if one considers his/her work as meaningful. Work then
becomes an integral and decisive part of ones life.
Mahoney and Graci (1999) have suggested that spirituality is combination a sense of
giving, a sense of bonding and connection with the community, a sense of forgiveness,
and a clear sense of honesty. Factors of spirituality in the workplace shows an alignment
with personnel and organization needs (Kinjerski and Skrypnek, 2004).The community
environment has a spiritual characteristic in that it “is a place in which people can
experience personal growth, be valued for themselves as individuals, and have a sense of
working together [for a common purpose]” (Ashmos & Duchon, 2000, p. 139).One
dimension of a psychologically safe work environment is the freedom employees have to
express their feelings and the core facet of their personal beliefs as related to their job. A
psychologically safe environment encourages job involvement.
3. RESEARCH MODEL
Top
Management
Knowledge
Management
Work place
Spirituality
Organization
Performance
Copyright © 2011. NJMT
59
NUML Journal of Management & Technology
Vol: 6, No: 1. January, 2011 ISSN 1997-4507
4. METHODOLOGY
Present research is being carried out to find out the impact top management support,
effective knowledge management, work place spirituality on organization performance
(universities of the twin cities of Rawalpindi and Islamabad). Data is collected from both
public and private sector universities of twin cities. For the analyses, primary data
collection method is used. In the beginning of the survey an introductory statement given
that, ask respondents to oversee their responses and assure them the confidentiality of
their data. The demographic information was followed this statement.
The questionnaire was distributed among public. This data collection process was done
by distributing the questionnaire, which is self-administered total number of respondents,
were 206. Some of the responses were rejected and the reason appropriate responsive is
missing. This study gauges the respondents through four factors of top management
support, effective knowledge management, and work place spirituality and organization
performance. For the analyses of the construct and hypotheses, SPSS (Statistical Package
for Social Sciences) is used.
Measure
All the constructs used in this study are measured through reliable and established scales
which were used in the previous studies of SHRM. All these factors which were adapted
in this study measured on five point Likert scale from 1= strongly agree to 5= strongly
disagree. Purchase loyalty: The items of purchase for measuring this construct. The
Cronbatch alpha of purchase loyalty was 0.72.
Hypothesis1: Top management support is positively related with organization
performance.
Hypothesis2: Top management support is positively related with work place spirituality.
Hypothesis3: Top management support is positively related with effective knowledge
management.
Hypothesis 4: work place spirituality is positively related with organization performance.
Hypothesis5: Effective knowledge management is positively related with work place
spirituality.
5. RESULTS
The outcome of values marks coefficients β of individuals highlights that the result is
significant and positive if viewed from broader perspective. Research indicates the
dependent variable Organization Performance With Top Management Support i.e. the
independent variable as regression values are greater in number as compared to residuals
value observed in spss test. R Square 0.117 shows that the model has 11.71% variation in
the dependent variable due to independent variable. Gives a significant result as P< .05,
F = 26.988 hence hypothesis is verified in table 2
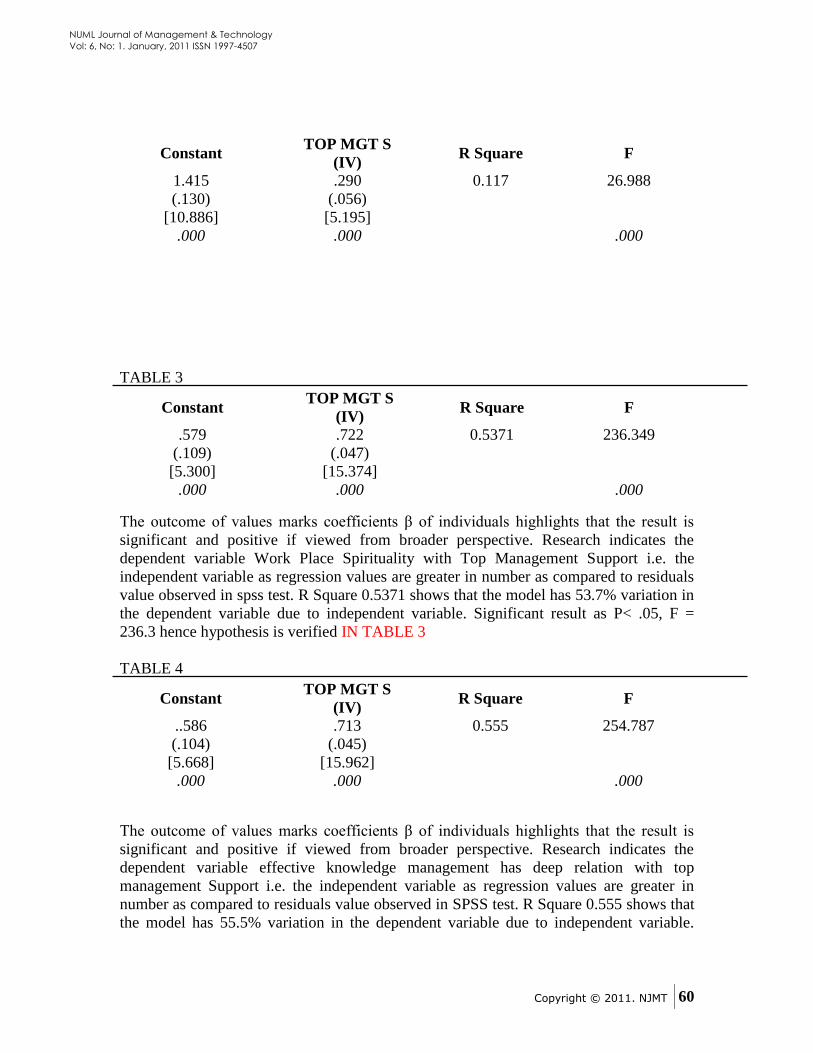
Copyright © 2011. NJMT
60
NUML Journal of Management & Technology
Vol: 6, No: 1. January, 2011 ISSN 1997-4507
TABLE 3
The outcome of values marks coefficients β of individuals highlights that the result is
significant and positive if viewed from broader perspective. Research indicates the
dependent variable Work Place Spirituality with Top Management Support i.e. the
independent variable as regression values are greater in number as compared to residuals
value observed in spss test. R Square 0.5371 shows that the model has 53.7% variation in
the dependent variable due to independent variable. Significant result as P< .05, F =
236.3 hence hypothesis is verified IN TABLE 3
TABLE 4
The outcome of values marks coefficients β of individuals highlights that the result is
significant and positive if viewed from broader perspective. Research indicates the
dependent variable effective knowledge management has deep relation with top
management Support i.e. the independent variable as regression values are greater in
number as compared to residuals value observed in SPSS test. R Square 0.555 shows that
the model has 55.5% variation in the dependent variable due to independent variable.
Constant TOP MGT S
(IV) R Square F
1.415 .290 0.117 26.988
(.130) (.056)
[10.886] [5.195]
.000 .000 .000
Constant TOP MGT S
(IV) R Square F
.579 .722 0.5371 236.349
(.109) (.047)
[5.300] [15.374]
.000 .000 .000
Constant TOP MGT S
(IV) R Square F
..586 .713 0.555 254.787
(.104) (.045)
[5.668] [15.962]
.000 .000 .000
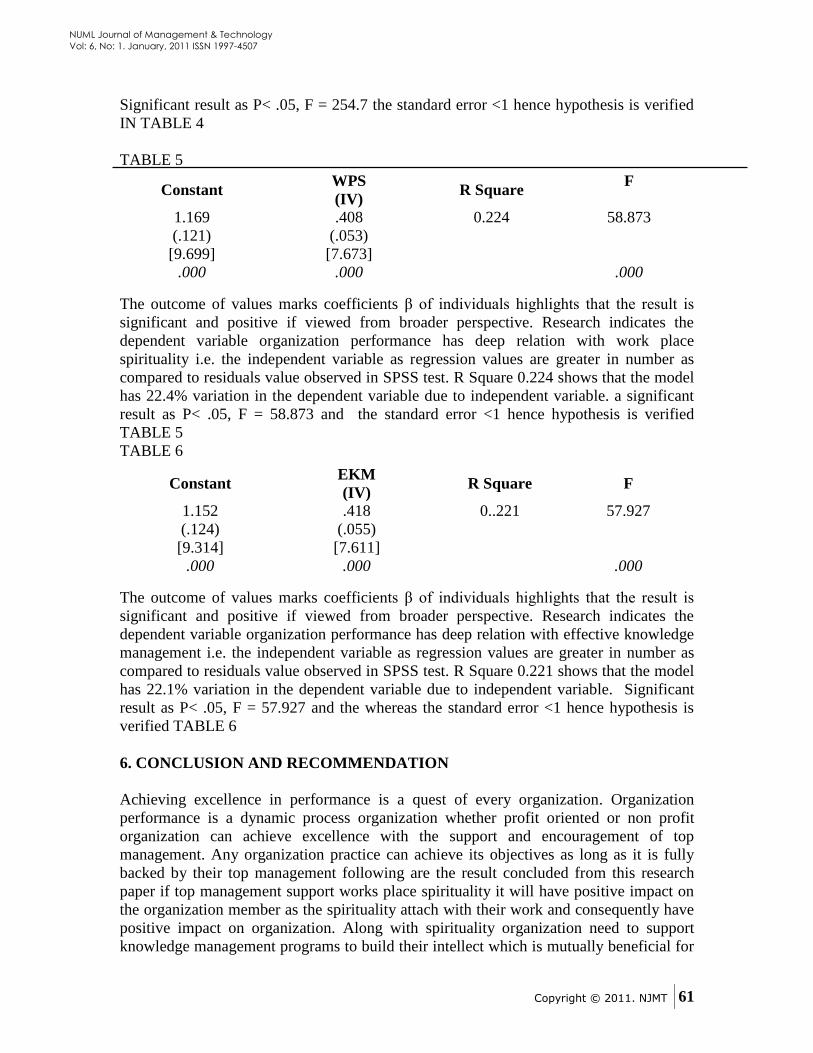
Copyright © 2011. NJMT
61
NUML Journal of Management & Technology
Vol: 6, No: 1. January, 2011 ISSN 1997-4507
Significant result as P< .05, F = 254.7 the standard error <1 hence hypothesis is verified
IN TABLE 4
TABLE 5
The outcome of values marks coefficients β of individuals highlights that the result is
significant and positive if viewed from broader perspective. Research indicates the
dependent variable organization performance has deep relation with work place
spirituality i.e. the independent variable as regression values are greater in number as
compared to residuals value observed in SPSS test. R Square 0.224 shows that the model
has 22.4% variation in the dependent variable due to independent variable. a significant
result as P< .05, F = 58.873 and the standard error <1 hence hypothesis is verified
TABLE 5
TABLE 6
The outcome of values marks coefficients β of individuals highlights that the result is
significant and positive if viewed from broader perspective. Research indicates the
dependent variable organization performance has deep relation with effective knowledge
management i.e. the independent variable as regression values are greater in number as
compared to residuals value observed in SPSS test. R Square 0.221 shows that the model
has 22.1% variation in the dependent variable due to independent variable. Significant
result as P< .05, F = 57.927 and the whereas the standard error <1 hence hypothesis is
verified TABLE 6
6. CONCLUSION AND RECOMMENDATION
Achieving excellence in performance is a quest of every organization. Organization
performance is a dynamic process organization whether profit oriented or non profit
organization can achieve excellence with the support and encouragement of top
management. Any organization practice can achieve its objectives as long as it is fully
backed by their top management following are the result concluded from this research
paper if top management support works place spirituality it will have positive impact on
the organization member as the spirituality attach with their work and consequently have
positive impact on organization. Along with spirituality organization need to support
knowledge management programs to build their intellect which is mutually beneficial for
Constant WPS
(IV) R Square
F
1.169 .408 0.224 58.873
(.121) (.053)
[9.699] [7.673]
.000 .000 .000
Constant EKM
(IV) R Square F
1.152 .418 0..221 57.927
(.124) (.055)
[9.314] [7.611]
.000 .000 .000
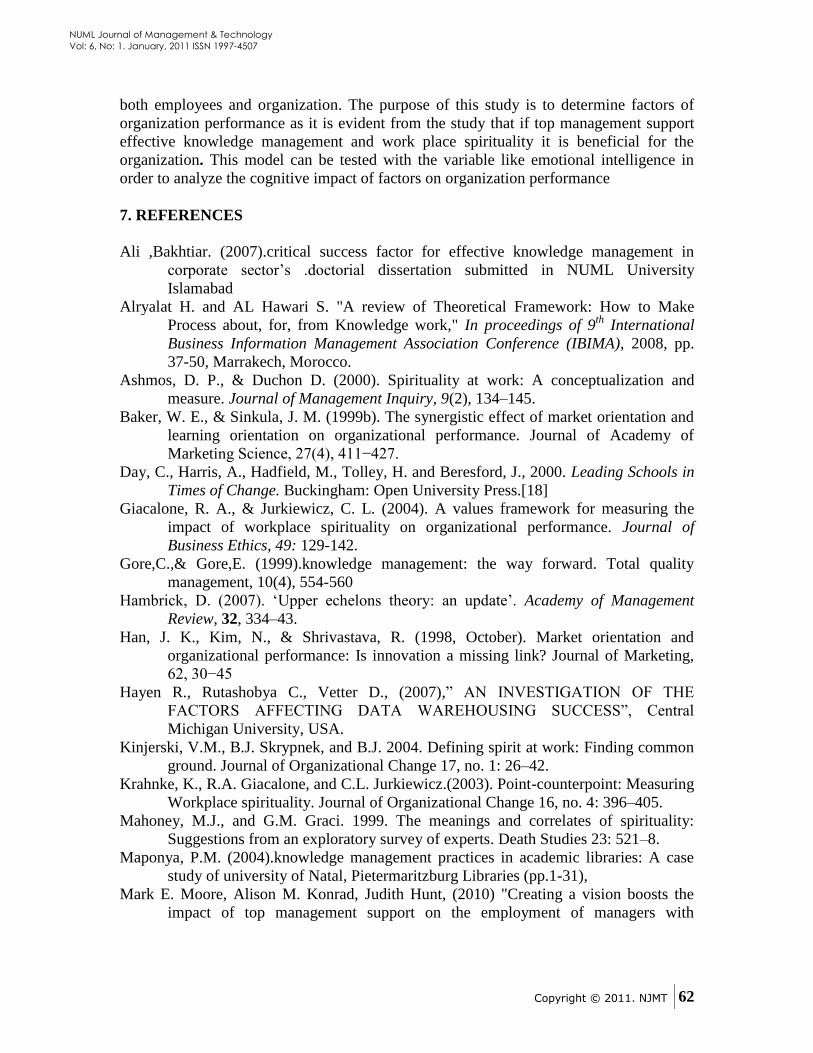
Copyright © 2011. NJMT
62
NUML Journal of Management & Technology
Vol: 6, No: 1. January, 2011 ISSN 1997-4507
both employees and organization. The purpose of this study is to determine factors of
organization performance as it is evident from the study that if top management support
effective knowledge management and work place spirituality it is beneficial for the
organization. This model can be tested with the variable like emotional intelligence in
order to analyze the cognitive impact of factors on organization performance
7. REFERENCES
Ali ,Bakhtiar. (2007).critical success factor for effective knowledge management in
corporate sector‟s .doctorial dissertation submitted in NUML University
Islamabad
Alryalat H. and AL Hawari S. "A review of Theoretical Framework: How to Make
Process about, for, from Knowledge work," In proceedings of 9th
International
Business Information Management Association Conference (IBIMA), 2008, pp.
37-50, Marrakech, Morocco.
Ashmos, D. P., & Duchon D. (2000). Spirituality at work: A conceptualization and
measure. Journal of Management Inquiry, 9(2), 134–145.
Baker, W. E., & Sinkula, J. M. (1999b). The synergistic effect of market orientation and
learning orientation on organizational performance. Journal of Academy of
Marketing Science, 27(4), 411−427.
Day, C., Harris, A., Hadfield, M., Tolley, H. and Beresford, J., 2000. Leading Schools in
Times of Change. Buckingham: Open University Press.[18]
Giacalone, R. A., & Jurkiewicz, C. L. (2004). A values framework for measuring the
impact of workplace spirituality on organizational performance. Journal of
Business Ethics, 49: 129-142.
Gore,C.,& Gore,E. (1999).knowledge management: the way forward. Total quality
management, 10(4), 554-560
Hambrick, D. (2007). „Upper echelons theory: an update‟. Academy of Management
Review, 32, 334–43.
Han, J. K., Kim, N., & Shrivastava, R. (1998, October). Market orientation and
organizational performance: Is innovation a missing link? Journal of Marketing,
62, 30−45
Hayen R., Rutashobya C., Vetter D., (2007),” AN INVESTIGATION OF THE
FACTORS AFFECTING DATA WAREHOUSING SUCCESS”, Central
Michigan University, USA.
Kinjerski, V.M., B.J. Skrypnek, and B.J. 2004. Defining spirit at work: Finding common
ground. Journal of Organizational Change 17, no. 1: 26–42.
Krahnke, K., R.A. Giacalone, and C.L. Jurkiewicz.(2003). Point-counterpoint: Measuring
Workplace spirituality. Journal of Organizational Change 16, no. 4: 396–405.
Mahoney, M.J., and G.M. Graci. 1999. The meanings and correlates of spirituality:
Suggestions from an exploratory survey of experts. Death Studies 23: 521–8.
Maponya, P.M. (2004).knowledge management practices in academic libraries: A case
study of university of Natal, Pietermaritzburg Libraries (pp.1-31),
Mark E. Moore, Alison M. Konrad, Judith Hunt, (2010) "Creating a vision boosts the
impact of top management support on the employment of managers with
Copyright © 2011. NJMT
63
NUML Journal of Management & Technology
Vol: 6, No: 1. January, 2011 ISSN 1997-4507
disabilities: The case of sport organizations in the USA", Equality, Diversity and
Inclusion: An International Journal, Vol. 29 Iss: 6, pp.609 – 626
Md Zahidul Islam, Jason A. Doshi, Hanif Mahtab, Zainal Ariffin Ahmad, (2009) "Team
learning, top management support and new product development success",
International Journal of Managing Projects in Business, Vol. 2 Iss: 2, pp.238 - 260
Ribiere,V.M., sitar , A.S.(2003).critical role of leadership in nurturing a knowledge
supporting culture .knowledge management research and practice.
Senge, P. M. (1994). The fifth discipline: The art and practice of the learning
organization. New York:Currency-Doubleday.
Senge,P.,(1996).leading learning organizations,the bold ,the powerful, and the invisible.
in M.Goldsmith,&F.Hasselbein (eds),leader of the future .san Francisco : jossey
bass
Smith, R. G. and Farquhar, A. (2000). The road ahead for knowledge management: An
AI perspective. AIMagazine, 21, No. 4, Winter 2000, 17-40.
Waltz, E., (2003).knowledge management in the intelligence enterprise.
Norwood,MA:Artech House
Winograd, T. and Flores, F. (1987). Understanding computers and cognition: A new
foundation for design.Reading, MA: Addison-Wesley.

Copyright © 2011. NJMT
64
NUML Journal of Management & Technology
Vol: 6, No: 1. January, 2011 ISSN 1997-4507
A Research Journal Published by
Faculty of Management Sciences
National University of Modern Languages
Islamabad-Pakistan www.numl.edu.pk
Recommended