JPET #178400
1
Title: Efficacy of Ganitumab (AMG 479), Alone and in Combination With Rapamycin, in Ewing’s
and Osteogenic Sarcoma Models*
Authors: Pedro J. Beltran, Young-Ah Chung, Gordon Moody, Petia Mitchell, Elaina Cajulis,
Steven Vonderfecht, Richard Kendall, Robert Radinsky, Frank J. Calzone
PJB, YAC, GM, PM, EC, RK, RR, FJC: Oncology Research Therapeutic Area, Amgen Inc.
SV: Department of Pathology, Amgen Inc
JPET, Journal of Pharmacology and Experimental Therapeutics
JPET Fast Forward. Published on March 8, 2011 as DOI:10.1124/jpet.110.178400
Copyright 2011 by the American Society for Pharmacology and Experimental Therapeutics.
This article has not been copyedited and formatted. The final version may differ from this version.JPET Fast Forward. Published on March 8, 2011 as DOI: 10.1124/jpet.110.178400
at ASPE
T Journals on M
arch 12, 2019jpet.aspetjournals.org
Dow
nloaded from
JPET #178400
2
Running Title: Activity of ganitumab and rapamycin against sarcoma models
Corresponding author: Pedro J. Beltran, Amgen Inc., One Amgen Center Drive, Thousand
Oaks, CA 91320; Phone, 805-447-9221; Fax, 805-375-8524; email: [email protected]
Number of text pages: 38
Numbers of tables: 2
Number of figures: 10
Number of references: 37
Abstract word count: 241
Introduction word count: 701
Discussion word count: 1582
List of abbreviations: IC50, half-maximal inhibitory concentration; IGF-1 or -2, insulin-like
growth factor type 1 or 2; IGF1R, type 1 insulin-like growth factor receptor; pIGF1R,
phosphorylated IGF1R; pAkt, phosphorylated Akt; mTOR, mammalian target of rapamycin;
mTORC1, mammalian target of rapamycin complex 1; IRS, insulin receptor substrate; pIRS-1,
phosphorylated IRS-1; INSR, insulin receptor; pINSR, phosphorylated INSR; pp70S6K,
phosphorylated p70S6K; pGSK3β, phosphorylated GSK3β; PI3K, phosphatidylinositol-3-kinase;
IGFBP, insulin-like growth factor binding protein; MSD, Meso Scale Discovery multiplex assays;
MAPK, mitogen activated protein kinase; BrdU, bromodeoxyuridine; FBS, fetal bovine serum;
PBS, phosphate buffered saline; TBS, tris buffered saline; ND, not detectable; RLU, relative
light units; hIgG1, human immunoglobulin G1.
Section option: Cellular and Molecular
This article has not been copyedited and formatted. The final version may differ from this version.JPET Fast Forward. Published on March 8, 2011 as DOI: 10.1124/jpet.110.178400
at ASPE
T Journals on M
arch 12, 2019jpet.aspetjournals.org
Dow
nloaded from

JPET #178400
3
Abstract
Ewing’s and osteogenic sarcoma are two of the leading causes of cancer deaths in
children and adolescents. Recent data suggest that sarcomas may depend on the type I
insulin-like growth factor receptor (IGF1R) and/or the insulin receptor (INSR) to drive tumor
growth, survival, as well as resistance to mammalian target of rapamycin complex 1 (mTORC1)
inhibitors. We evaluated the therapeutic value of ganitumab (AMG 479), an anti-IGF1R, fully
human monoclonal antibody, alone and in combination with rapamycin (mTORC1 inhibitor) in
Ewing’s (SK-ES-1 and A673) and osteogenic (SJSA-1) sarcoma models. IGF1R was activated
by IGF-1 but not by insulin in each sarcoma model. INSR was also activated by IGF-1 in the
SJSA-1 and SK-ES-1 models, but not in the A673 model where insulin was the preferred INSR
ligand. Ganitumab significantly inhibited the growth of SJSA-1 and SK-ES-1 xenografts;
inhibition was associated with decreased IGF1R and Akt phosphorylation, reduced total IGF1R
and BrdU detection, and increased caspase-3 expression. Ganitumab inhibited rapamycin-
induced IGF1R, Akt, and GSK3β hyperphosphorylation in each sarcoma model. However,
ganitumab in combination with rapamycin also resulted in a marked increase in INSR
expression and activity in the SJSA-1 and A673 models. The in vivo efficacy of ganitumab in
the two ganitumab-sensitive models (SJSA-1 and SK-ES-1) was significantly enhanced in
combination with rapamycin. Our results support studying ganitumab in combination with
mTORC1 inhibitors for the treatment of sarcomas and suggest that INSR signaling is an
important mechanism of resistance to IGF1R blockade.
This article has not been copyedited and formatted. The final version may differ from this version.JPET Fast Forward. Published on March 8, 2011 as DOI: 10.1124/jpet.110.178400
at ASPE
T Journals on M
arch 12, 2019jpet.aspetjournals.org
Dow
nloaded from
JPET #178400
4
Introduction
Sarcomas are among the most common cancers of childhood and early adolescence
(Ries et al., 2008). Osteogenic and Ewing’s sarcoma most frequently occur in adolescents
during rapid bone growth and present clinical challenges due to their aggressiveness and
metastatic tendency. As a result, treatment is aggressive, typically involving surgical resection
preceded and followed by chemotherapy. Despite refinements in surgical techniques (Longhi et
al., 2006; Iwamoto, 2007), overall treatment strategies for sarcomas have not substantially
improved patient survival over the last decade (Hughes, 2009). An autocrine loop involving the
type I insulin-like growth factor receptor (IGF1R) and both of its ligands, IGF-1 and IGF-2, has
long been thought to be a key mechanism driving the proliferation and survival of sarcoma cells
(Kim et al., 2009). Evidence supporting the importance of this axis includes: a) the association
between the IGF-1-driven adolescent growth spurt and peak incidence of osteogenic sarcoma,
b) the direct control of IGF1R pathway-related proteins by the EWS/FLI-1 fusion protein
(oncogenic transcription factor that controls expression of IGF1R, IGF-1, and IGF binding
proteins [BPs] (Arvand and Denny, 2001; Prieur et al., 2004; Mateo-Lozano et al., 2006)) in
Ewing’s sarcomas, and c) overexpression of IGF-2 in rhabdomyosarcomas (Rikhof et al., 2009).
IGF-1 activity is predominantly mediated through IGF1R (homodimers) and IGF1R / insulin
receptor (INSR) hybrid receptors (heterodimers). However, IGF-2 action can also be mediated
through the activity of type A INSR (INSR-A) (Belfiore et al., 2009). Expression of INSR-A on
sarcoma tumor cells has been shown to be complementary to IGF1R activity and ensures
successful activation of the phosphatidylinositol-3-kinase (PI3K) signaling pathway even in the
presence of IGF1R inhibition (Avnet et al., 2009).
The mammalian target of rapamycin (mTOR) is a protein kinase that plays a pivotal role
in the growth and proliferation of cells in response to changes in their environmental and
This article has not been copyedited and formatted. The final version may differ from this version.JPET Fast Forward. Published on March 8, 2011 as DOI: 10.1124/jpet.110.178400
at ASPE
T Journals on M
arch 12, 2019jpet.aspetjournals.org
Dow
nloaded from
JPET #178400
5
nutritional status (Bjornsti and Houghton, 2004). mTOR is activated by a variety of growth
factors and is up-regulated in many human cancers (Wan and Helman, 2007). Treatment of
tumor cells with mTOR Complex 1 (mTORC1) inhibitors, such as rapamycin and everolimus,
inhibits phosphorylation of p70S6K and 4E-BP1 resulting in inhibition of protein synthesis.
mTORC1 inhibitors have been shown to inhibit the proliferation of sarcoma cells, the expression
of EWS/FLI-1 fusion proteins, and the growth of sarcoma xenografts, supporting the
investigation of rapamycin and its analogs as therapeutics for the treatment of sarcomas
(Mateo-Lozano et al., 2003; Wan and Helman, 2007; Wang et al., 2008a).
The limited efficacy of approved mTORC1 inhibitors in cancer patients has motivated
researchers to evaluate potential mechanisms of resistance (O'Reilly et al., 2006; Breuleux et
al., 2009; Meric-Bernstam and Gonzalez-Angulo, 2009). Inhibition of mTORC1 with either
rapamycin or rapamycin analogs has been shown to induce phosphorylation of Akt S473,
highlighting a possible mechanism of resistance to mTORC1 inhibitors (O'Reilly et al., 2006).
Interestingly, rapamycin-induced Akt activation seemed to be dependent on IGF1R / insulin
receptor substrate-1 (IRS-1) / PI3K activity (Sun et al., 2005; Wan et al., 2007; Wang et al.,
2008a), suggesting a potential benefit of combining rapamycin with IGF1R pathway inhibitors
(Kurmasheva et al., 2006; Wang et al., 2008a). Fully human monoclonal antibodies that disrupt
IGF1R signaling without cross reacting with the INSR are currently in clinical development
(Manara et al., 2007; Pollak, 2008; Rodon et al., 2008). Combination of one of these
monoclonal antibodies with rapamycin has been shown to inhibit rapamycin-induced Akt
reactivation (O'Reilly et al., 2006; Cao et al., 2008). Early phase clinical trials of anti-IGF1R
monoclonal antibodies in combination with mTORC1 inhibitors are currently testing this
hypothesis in cancer patients.
This article has not been copyedited and formatted. The final version may differ from this version.JPET Fast Forward. Published on March 8, 2011 as DOI: 10.1124/jpet.110.178400
at ASPE
T Journals on M
arch 12, 2019jpet.aspetjournals.org
Dow
nloaded from
JPET #178400
6
Ganitumab is an investigational, fully human monoclonal antibody (IgG1) against the
human IGF1R and is currently in phase 2 clinical development for multiple oncology indications,
including sarcomas. Previously, we showed that ganitumab blocked the activation of IGF1R
and hybrid receptors by both IGF-1 and IGF-2 and enhanced the effects of gemcitabine against
human pancreatic carcinoma xenograft models (Beltran et al., 2009). The objective of the
present study was to evaluate the efficacy of ganitumab against sarcoma xenograft models
displaying distinct responses to IGF-1 and insulin and to understand the molecular mechanisms
involved in driving the sensitivity and resistance to the combination of ganitumab plus rapamycin
in these models.
This article has not been copyedited and formatted. The final version may differ from this version.JPET Fast Forward. Published on March 8, 2011 as DOI: 10.1124/jpet.110.178400
at ASPE
T Journals on M
arch 12, 2019jpet.aspetjournals.org
Dow
nloaded from
JPET #178400
7
Materials and Methods
Animals
Female athymic nude mice, 4 to 6 weeks old (Harlan Sprague Dawley, Inc., Indianapolis, IN)
were used in all experiments. The laboratory housing the animals met all Association for
Assessment and Accreditation of Laboratory Animal Care specifications. Experimental
procedures were performed in accordance with Institutional Animal Care and Use Committee
and United States Department of Agriculture regulations.
Reagents and Cell Lines
Human sarcoma cell lines, SJSA-1 (osteogenic sarcoma), SK-ES-1 (Ewing’s sarcoma), and
A673 (Ewing’s sarcoma), were purchased from the American Type Culture Collection in 2006
(Manassas, VA). Each cell line was authenticated through identification of EWS/FLI-1 type I
and type II translocations and mutational status of b-raf. Cells were maintained in Dulbecco's
Modified Eagle Medium (DMEM) with 10% fetal bovin serum (FBS) (SJSA-1 and A673), or
McCoy's 5A with 15% FBS (SK-ES-1). Human anti-streptavidin IgG1 (hIgG1) was used as
control antibody. Rapamycin was obtained from LC Laboratories (Woburn, MA). IGF-1 and
insulin were obtained from Sigma-Aldrich (St. Louis, MO).
Determination of Cell-Surface Levels of IGF1R and INSR
SJSA-1, SK-ES-1, and A673 cells were harvested and incubated with 1µg phycoerythrin-
conjugated antibodies specific for human IGF1R or INSR (BD Pharmingen, San Jose, CA) for
1.5h at 4°C. Receptor levels were determined using a quantitative flow cytometry assay relating
the geometric mean cell fluorescence intensity to that in Quantum microbead standards (Bangs
This article has not been copyedited and formatted. The final version may differ from this version.JPET Fast Forward. Published on March 8, 2011 as DOI: 10.1124/jpet.110.178400
at ASPE
T Journals on M
arch 12, 2019jpet.aspetjournals.org
Dow
nloaded from
JPET #178400
8
Laboratories, Fishers, IA). Fluorescence levels were determined in duplicate, and at least 2
determinations were made for each cell line.
In Vitro Cell Growth Assays
SJSA-1 cells were seeded in 96-well plates (2 x 10³ per well) in DMEM with 10% FBS, 2mM
glutamine, and either 500nM ganitumab or hIgG1 plus 0 to 77nM rapamycin (3-fold serial
dilutions). A673 cells were seeded (1.7 x 10⁴ per well) in DMEM with 10% FBS, 2mM
glutamine, and either 250nM ganitumab or hIgG1 plus 0 to 54nM rapamycin (2.5-fold serial
dilutions). SK-ES-1 cells were seeded (1 x 10⁴ per well) in McCoy’s 5A medium with 15% FBS,
2mM glutamine, and either 500nM ganitumab or hIgG1 plus 0 to 54nM rapamycin (3-fold serial
dilutions). Confluence measurements were performed in duplicate for each well at 4-h intervals
over a period of 5 to 7 days using an IncucyteTM phase contrast optical imaging system (Essen
Instruments, Ann Arbor, MI). Prism (GraphPad Software, La Jolla, CA) was used to analyze
dose-response data.
Analysis of IGF1R and INSR Signaling
To determine IGF-1 and insulin EC50 and ganitumab half maximal inhibitory concentration (IC50),
sarcoma cells were plated into 96-well plates (3 to 4 x 10⁴ per well) in FBS-containing growth
medium as described above. After an overnight incubation, the cells were washed once in
phosphate-buffered saline (PBS) and serum-deprived for 18 to 24h in DMEM or McCoy’s 5A.
Dilutions of either hIgG1 or ganitumab with fixed concentrations of either IGF-1 or insulin were
added to the cells in an equal volume of fresh serum-free media, and the cells were harvested
after 20 minutes.
The short-term effects of ganitumab plus rapamycin on the phosphorylation of IGF1R,
p70S6K, and Akt were determined in serum-starved sarcoma cells (6-well format) treated for 1h
This article has not been copyedited and formatted. The final version may differ from this version.JPET Fast Forward. Published on March 8, 2011 as DOI: 10.1124/jpet.110.178400
at ASPE
T Journals on M
arch 12, 2019jpet.aspetjournals.org
Dow
nloaded from
JPET #178400
9
with hIgG1 (0.5µM), ganitumab (0.5µM), rapamycin (27nM), or ganitumab and rapamycin, all in
the presence of 10nM IGF-1.
The long-term effects of ganitumab plus rapamycin on cell proliferation and IGF1R
pathway markers were determined in vitro using an IncucyteTM optical imaging system as
described above. Cells were harvested for analysis after 52h (SJSA-1), 96h (SK-ES-1), or 76h
(A673) of growth for analysis of IGF1R pathway markers.
In each of the experiments described above, levels of total (t) and/or phosphorylated (p)
INSR, IGF1R, IRS-1, Akt, p70S6K, and GSK3β were measured using Meso Scale Discovery™
(MSD) multiplex assays (Meso Scale Discovery, Gaithersburg, MA).
In Vivo Pharmacodynamic Studies
Tumor cells (5 x 10⁶ cells) were injected subcutaneously into the flank of female athymic nude
mice in a 2:1 ratio of cells to Matrigel (BD Bioscience, San Jose, CA). When the average tumor
size reached approximately 300 to 450mm3, mice were randomly assigned into four groups
(n=3). Mice received either a single intraperitoneal dose of ganitumab (1mg) or hIgG1 (1mg)
(total of 4 groups: 2 groups received ganitumab and 2 received hIgG1). After 6h, an ganitumab
group and a hIgG1 group received human IGF-1 (15µg) by tail-vein injection while the other
ganitumab and hIgG1 groups received PBS injections. Xenografts were collected 15 minutes
after IGF-1 or PBS challenge and snap-frozen in liquid nitrogen. Samples were homogenized
with a Polytron in 3 volumes of Tris-buffered saline (TBS) (20mM Tris-HCl pH 8.5, 0.15M NaCl)
and diluted with 3 volumes of TBST (TBS, 2% Triton X-100). Cell lysates were cleared by
centrifugation at 14,000rpm and protein levels (t and p) were analyzed using the MSD™
multiplex assays.
This article has not been copyedited and formatted. The final version may differ from this version.JPET Fast Forward. Published on March 8, 2011 as DOI: 10.1124/jpet.110.178400
at ASPE
T Journals on M
arch 12, 2019jpet.aspetjournals.org
Dow
nloaded from
JPET #178400
10
In a separate experiment, 12 mice bearing 300 to 450mm3 tumors were assigned to four
groups (n=3) and received single intraperitoneal doses of hIgG1 (300μg), ganitumab (300μg),
rapamycin (0.5mg/kg), or the combination of two of these agents. Six hours later, xenografts
were excised, snap frozen in liquid nitrogen, and processed for MSD™ assays as described
above.
In Vivo Antitumor Efficacy Studies
Female athymic nude mice were injected with 5 x 10⁶ cells in a suspension containing a 2:1
ratio of cells to Matrigel (BD Bioscience, San Jose, CA). After 7 to 15 days, mice bearing
tumors (approximately 200mm3) were randomly assigned into groups (n=10 for each) and
administered ganitumab (30, 100, or 300µg per dose) or hIgG1 (300µg) as single agents or in
combination with rapamycin (0.5mg/kg) by intraperitoneal injection twice weekly for the duration
of the experiment. Tumor volumes were measured twice per week with calipers. Tumor growth
inhibition for each treatment group was calculated on the last day of each study and was
expressed relative to the initial and final mean tumor volume of the control group. Body weights
were monitored to assess tolerability of the treatments.
Detection of BrdU and Caspase-3 in Ganitumab-Treated Xenografts and Cultured Cells
Mice bearing SJSA-1 or A673 xenografts (approximately 300mm3) were administered
ganitumab (1mg) or hIgG1 (1mg) by intraperitoneal injection. Xenografts were harvested after 3
or 24h, fixed, and stained for cleaved caspase-3 or BrdU as described previously (Polverino et
al., 2006). Briefly, cleaved caspase-3 was detected using a rabbit anti-caspase-3 antibody (Cell
Signaling, Danvers, MA) followed by a peroxidase-labeled goat anti-rabbit IgG antibody
(Jackson Immunoresearch Laboratories, West Grove, PA) and diaminobenzidine. Incorporation
of BrdU was detected with a rat anti-BrdU antibody (Accurate, Westbury, NY), a biotin-labeled
This article has not been copyedited and formatted. The final version may differ from this version.JPET Fast Forward. Published on March 8, 2011 as DOI: 10.1124/jpet.110.178400
at ASPE
T Journals on M
arch 12, 2019jpet.aspetjournals.org
Dow
nloaded from
JPET #178400
11
rabbit anti-rat IgG secondary antibody, and a Vectastain Elite ABC detection kit (Vector
Laboratories, Burlingame, CA).
Cell lines were incubated in serum-free media in low-adherence culture plates with or
without IGF-1 (200nM) and ganitumab (0.5μM) for 24h. Cells were then pulsed with BrdU
labeling reagent (Invitrogen, Carlsbad, CA) and fixed in ice-cold, 90% methanol. For flow
cytometry, cells were stained with anti-BrdU-Alexa647 antibody (0.2µg/µL, Invitrogen, Carlsbad,
CA) and fluorescein isothiocyanate-labeled anti-caspase-3 antibody (1:5 dilution, Invitrogen,
Carlsbad, CA), followed by treatment with PI/RNAse staining solution (BD Pharmingen, San
Jose, CA).
Statistical Analysis
For in vivo efficacy studies, repeated-measures analysis of variance was used to compare the
reduction in tumor volume in mice treated with the combination of ganitumab plus rapamycin
versus those treated with either agent alone. The in vivo ganitumab dose-response
experiments were analyzed with repeated-measures analysis of variance followed by a post hoc
Scheffé test. Changes in phosphorylation markers in the in vivo or in vitro acute assays were
compared using one-way analysis of variance.
This article has not been copyedited and formatted. The final version may differ from this version.JPET Fast Forward. Published on March 8, 2011 as DOI: 10.1124/jpet.110.178400
at ASPE
T Journals on M
arch 12, 2019jpet.aspetjournals.org
Dow
nloaded from
JPET #178400
12
Results
IGF1R and INSR Levels in Sarcoma Cells
The levels of IGF1R and INSR in each sarcoma cell line were determined by quantitative
flow-cytometry. The levels of IGF1R were: SJSA-1, 9,000/cell; A673, 14,000/cell; and SK-ES-1,
18,000/cell. The levels of INSR were: SJSA-1, 350/cell; A673, 2,100/cell; and SK-ES-1,
13,000/cell. The relatively low expression of INSR in SJSA-1 cells compared with A673 and
SK-ES-1 cells allowed us to distinguish the effect of ganitumab on signaling through IGF1R
homodimers, INSR homodimers, and IGF1R/INSR heterodimers.
Sensitivity of Serum-Starved Sarcoma Cells to IGF-1 and Insulin
The sensitivity of sarcoma cells to IGF-1 and insulin stimulation was determined by
measuring IGF1R, INSR, Akt, IRS-1, GSK3β , and p70S6K activation with MSDTM multiplex
assays (Table 1). The IGF1R response to IGF-1 was similar for the three cell lines (EC50
0.45nM to 1.1nM). However, each cell line displayed a distinct INSR response. IGF-1 was the
preferred INSR agonist in SJSA-1 cells, which have a low INSR/IGF1R ratio (0.04). SK-ES-1
cells, which express higher INSR/IGF1R ratios (0.72), exhibited similar INSR sensitivity to
insulin and IGF-1 (EC50 3.0nM and 7.7nM), whereas in A673 cells, INSR was more responsive
to insulin than to IGF-1 (EC50, 2.2nM and 32nM).
Inhibition of IGF1R, INSR, and Akt Activity by Ganitumab
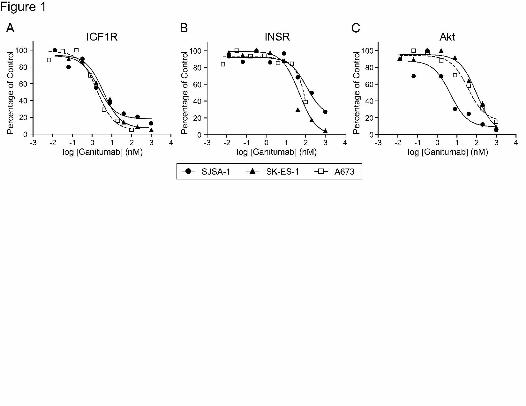
Ganitumab inhibited IGF-1-induced phosphorylation of IGF1R (IC50=2.0nM in SJSA-1
cells; 1.6nM in A673 cells; and 3.7nM in SK-ES-1 cells) and INSR (albeit at higher
concentrations, IC50>50nM) in all three cell lines (Fig. 1A,B). In SJSA-1 cells, the inhibitory
effect of ganitumab on IGF-1-induced Akt phosphorylation was similar to its effect on IGF1R
This article has not been copyedited and formatted. The final version may differ from this version.JPET Fast Forward. Published on March 8, 2011 as DOI: 10.1124/jpet.110.178400
at ASPE
T Journals on M
arch 12, 2019jpet.aspetjournals.org
Dow
nloaded from
JPET #178400
13
phosphorylation (IGF1R IC50, 2.0nM; Akt IC50, 4.7nM) but was about 30-fold less than for IGF1R
phosphorylation in A673 cells (IGF1R IC50, 1.6nM; Akt IC50, 50nM) and SK-ES-1 cells (IGF1R
IC50, 3.7nM; Akt IC50, 102nM) (Fig. 1C).
Inhibition of IGF-1 Signaling and Tumor Growth by Ganitumab
The in vivo effects of ganitumab on IGF-1 signaling were first studied in sarcoma
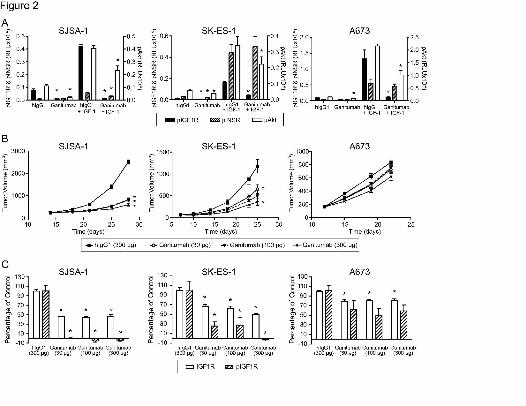
xenografts using a pharmacodynamic assay. Fifteen minutes after IGF-1 treatment,
phosphorylation of IGF1R, INSR, and Akt was increased 4- to 17-fold relative to mice that did
not receive IGF-1 (Fig. 2A). Net levels of pIGF1R, pINSR, and pAkt were plotted to allow
comparison of absolute levels of pINSR between cell lines (Fig. 2A). No changes in the effect of
ganitumab were observed when levels of phosphorylated protein were normalized to levels of
total protein (Supp. Fig. 1). Pretreatment with intraperitoneal ganitumab (1mg) for 6h led to a
significant reduction (73% to 97%) in IGF-1-induced IGF1R phosphorylation in each model
relative to mice pretreated with hIgG1. Basal pIGF1R was significantly inhibited in the SJSA-1
(83%) and SK-ES-1 (64%) models. Ganitumab treatment also significantly inhibited IGF-1-
stimulated pAkt (SJSA-1, 41%; SK-ES-1, 36%; A673, 53%) and basal pAkt (SJSA-1, 80%; SK-
ES-1, 32%). As expected, IGF-1-induced INSR phosphorylation was not inhibited by ganitumab
in either of the two INSR expressing cell lines (SK-ES-1 and A673). Ganitumab did inhibit IGF-
1-induced INSR activation in the SJSA-1 cell line as well as basal INSR in the SK-ES-1 line
(Fig. 2A).
Treatment of mice bearing SJSA-1 xenografts with ganitumab twice per week resulted in
significant tumor-growth inhibition of 75% at 30µg, 74% at 100µg, and 84% at 300µg (Fig. 2B).
SK-ES-1 xenografts were slightly less sensitive to inhibition by ganitumab with significant tumor-
growth inhibition of 47% at 30µg, 61% at 100µg, and 74% at 300µg. Reduced sensitivity to
This article has not been copyedited and formatted. The final version may differ from this version.JPET Fast Forward. Published on March 8, 2011 as DOI: 10.1124/jpet.110.178400
at ASPE
T Journals on M
arch 12, 2019jpet.aspetjournals.org
Dow
nloaded from
JPET #178400
14
ganitumab was observed in the insulin-responsive A673 tumor model: 300µg ganitumab
resulted in 35% tumor-growth inhibition that did not reach statistical significance (p=0.053) (Fig.
2B). Ganitumab treatment did not result in loss of body weight (data not shown).
Tumors harvested from the animals on the last day of the aforementioned study were
assessed for t and pIGF1R (Fig. 2C). Ganitumab significantly reduced the level of tIGF1R in
each model, with the largest reduction (approximately 50%) observed in SJSA-1 tumors.
Ganitumab inhibited IGF1R phosphorylation in SJSA-1 and SK-ES-1 tumors in a dose-
dependent manner, but only modest, non-significant inhibition was observed in A673 tumors.
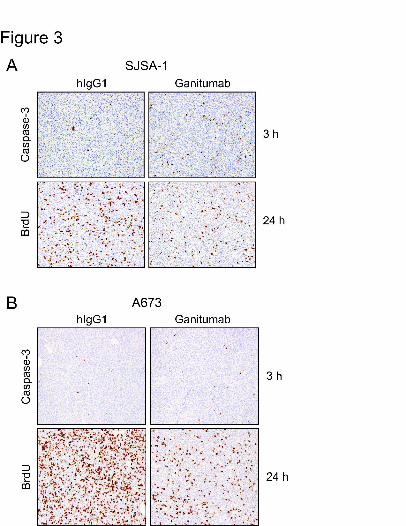
Effect of Ganitumab on Caspase-3 Activation and BrdU Incorporation
To assess the biological consequences of IGF1R and Akt inhibition by ganitumab,
cleavage of caspase-3 and incorporation of BrdU were examined in SJSA-1 xenografts (most
sensitive to inhibition by ganitumab) and A673 xenografts (most resistant to inhibition by
ganitumab). Ganitumab treatment (1mg) of SJSA-1 xenografts led to increased expression of
cleaved caspase-3 after 3h and reduced BrdU incorporation after 24h (Fig. 3A). In A673
xenografts, ganitumab did not alter the expression of cleaved caspase-3 but reduced BrdU-
labeling after 24h (Fig. 3B). Flow cytometry analysis showed that SJSA-1 cells incubated in
serum-free media with IGF-1 had lower levels of cleaved caspase-3 and higher incorporation of
BrdU than cells maintained in serum-free medium alone; the effects of IGF-1 were either
partially or fully reversed by simultaneous exposure of the cells to ganitumab (data not shown).
Ganitumab and Rapamycin Inhibition of Cell Growth In Vitro
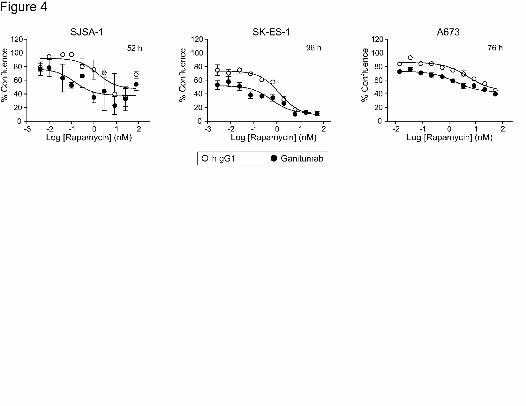
Growth curves (% cell confluency) were generated to evaluate the concentration-
dependent effect of rapamycin in combination with excess ganitumab or hIgG1. Ganitumab
treatment alone consistently increased the cell doubling time (SJSA-1, 1.4 fold; SKES-1, A673
This article has not been copyedited and formatted. The final version may differ from this version.JPET Fast Forward. Published on March 8, 2011 as DOI: 10.1124/jpet.110.178400
at ASPE
T Journals on M
arch 12, 2019jpet.aspetjournals.org
Dow
nloaded from
JPET #178400
15
1.1 fold data not shown). The time at which each cell line treated with hIgG1 reached about
85% confluency was selected to illustrate the effect of ganitumab and rapamycin on cell growth
(Fig. 4). In the presence of hIgG1, the rapamycin IC50 (95% confidence intervals) estimates
were 1.5 nM (0.2-13.7) for SJSA-1, 1.3 nM (0.8-2.1) for SK-ES-1, and 5.0 nM (2.7-9.2) for A673.
In the presence of ganitumab, the rapamycin IC50 estimates were 0.14 nM (0.01-2.8) for SJSA-
1, 0.6 nM (0.2-1.4) for SK-ES-1, and 1.7 nM (0.8-3.5) for A673. Thus, ganitumab treatment of
SK-ES-1 and A673 cells reduced the rapamycin IC50 by 2-3 fold and appeared to potentiate
rapamycin inhibition of SJSA-1 cells. The scatter in SJSA-1 data reflects the tendency of this
cell line to migrate and undergo changes in cell shape (Fig. 4).
Effects of Short-Term Ganitumab Treatment on Rapamycin-Induced Activation of IGF1R,
Akt, and p70S6K
The short-term treatment of established xenografts and of IGF-1-stimulated, serum-
starved cells was performed to further differentiate the immediate effects of ganitumab,
rapamycin, and ganitumab plus rapamycin on IGF1R signaling from the adaptive pathway
responses that occur after long-term treatment. We consider this is an important distinction as
interpretation of long-term treatment experiments can be complicated by changes in cell
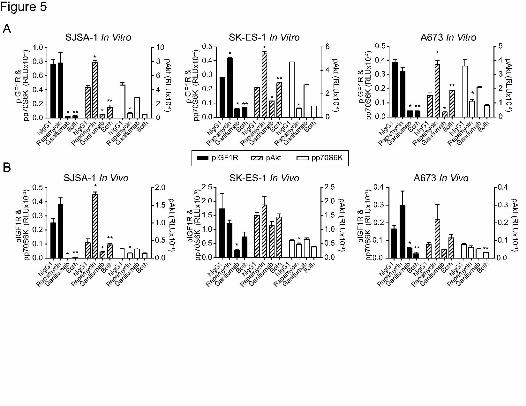
proliferation, cell metabolism, and cell death. Ganitumab significantly inhibited in vitro
phosphorylation of IGF1R and Akt in all three cell lines. Inhibition of pIGF1R was greater than
80% in all three cell lines. Inhibition of pAkt was highest in the SJSA-1 and A673 cell lines
(>80%) while suboptimal inhibition (<50%) was observed in the SK-ES-1 cell line (Fig 5A).
Ganitumab also inhibited phosphorylation of p70S6K (~50%) in all three sarcoma cell lines in
vitro (Fig. 5A). Rapamycin significantly inhibited pp70S6K (>80%) in vitro but induced pAkt (~2-
fold) (Fig. 5A). In the presence of ganitumab, rapamycin-induced Akt activation was significantly
and substantially inhibited to levels observed in untreated samples (Fig. 5A). Strong inhibition of
This article has not been copyedited and formatted. The final version may differ from this version.JPET Fast Forward. Published on March 8, 2011 as DOI: 10.1124/jpet.110.178400
at ASPE
T Journals on M
arch 12, 2019jpet.aspetjournals.org
Dow
nloaded from
JPET #178400
16
pIGF1R by ganitumab was observed in all three sarcoma tumor xenografts (Fig. 5B). This in
vivo receptor blockade was associated with inhibition of pAkt with the most potent activity seen
in low INSR expressing SJSA-1 tumors. In contrast to our in vitro observations, ganitumab did
not consistently inhibit pp70S6K in tumors. Consistent with our in vitro observations, rapamycin
significantly induced pAkt (~2-fold) in the SJSA-1 model and ganitumab completely blocked this
effect. Similar effects were observed in the SK-ES-1 and A673 xenografts but significance was
not achieved. Rapamycin also significantly inhibited pp70S6K (>50%) in the SJSA-1 and SK-
ES-1 models (Fig. 5B).
Effects of Long-Term Ganitumab Treatment on Rapamycin-Induced Activation of IGF1R
Pathway Proteins
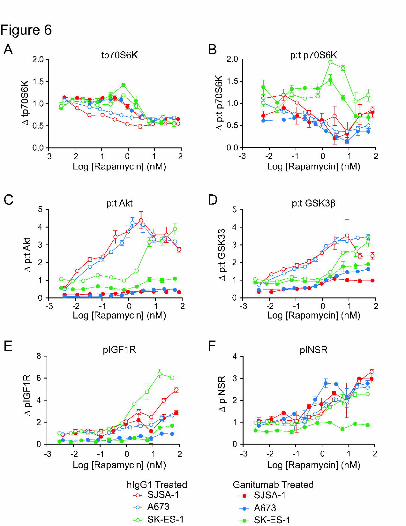
The effect of prolonged drug exposure on IGF1R pathway signaling was determined in
an experiment performed in parallel with the growth analysis shown in Figure 4. The overall
pattern of marker phosphorylation observed with ganitumab treatment alone (Supp. Fig. 2)
suggests that IGF-1 and IGF-2 are responsible for the majority of the PI3K/Akt pathway activity
stimulated by FBS (pAkt inhibition of 55% to 85%). In SJSA-1 and A673 cells, rapamycin
reduced the amount of tp70S6K and p:t p70S6K per cell in a concentration-dependent manner
(Fig. 6A,B). In the presence of ganitumab, higher concentrations of rapamycin were required to
reduce the levels of tp70S6K, and a slight enhancement in the reduction of pp70S6K was also
observed (Fig. 6A,B).
The p:t ratios of Akt and GSK3β (corrected for differences in cell confluency) were
increased in rapamycin-treated cells, and this effect was inhibited by ganitumab (Fig. 6C,D). A
separate plot of phosphorylated and total signals (corrected for cell confluency) suggested that
the feedback response was predominantly the result of increased pAkt and decreased tGSK3β
This article has not been copyedited and formatted. The final version may differ from this version.JPET Fast Forward. Published on March 8, 2011 as DOI: 10.1124/jpet.110.178400
at ASPE
T Journals on M
arch 12, 2019jpet.aspetjournals.org
Dow
nloaded from
JPET #178400
17
(data not shown). To illustrate feedback at the receptor level, we plotted pIGF1R and pINSR
corrected only for differences in cell confluency since rapamycin exhibited strong positive effects
on total protein levels (Fig. 6E,F). Long-term rapamycin treatment increased both pIGF1R and
pINSR levels in all three sarcoma cell lines. Ganitumab treatment inhibited the pIGF1R
induction, but the pINSR increase was inhibited only in SK-ES-1 cells (Fig. 6F).
We determined if levels of tIGF1R, tINSR, tIRS-1, tAkt, and tGSK3β correlated to levels
of tp70S6K after treatment with ganitumab and rapamycin (Table 2). The levels of tp70S6K and
tGSK3β decreased in parallel (slope approximately equal to 1) in response to rapamycin
treatment in the presence and absence of ganitumab. A similar correlation was obtained for
tAkt although the slope was reduced by ganitumab treatment. There was a less consistent
association between the other pathway proteins and tp70S6K. For example, in SJSA-1 cells,
tIGF1R and tINSR remained relatively constant as tp70S6K levels decreased.
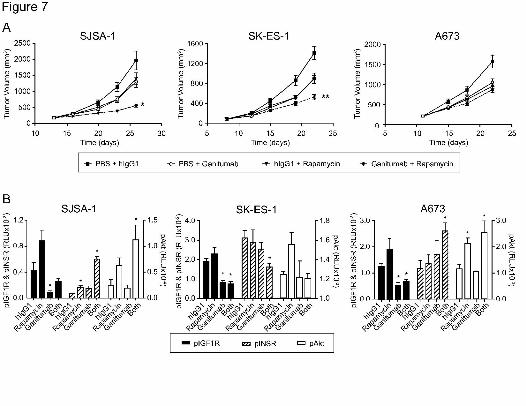
Effect of Ganitumab on the Efficacy of Rapamycin Against SJSA-1 and SK-ES-1 Tumor
Xenografts
Twice-weekly treatment with intraperitoneal ganitumab or rapamycin as single agents
led to 32% to 45% tumor-growth inhibition in mice bearing SJSA-1, SK-ES-1, or A673
xenografts (Fig. 7A). The combination of ganitumab and rapamycin led to additive tumor-growth
inhibition (72%) in the SJSA-1 model, which was significantly better than either agent alone
(p<0.001). The drug combination also led to increased tumor-growth inhibition in the SK-ES-1
model (p=0.02 versus ganitumab and p=0.005 versus rapamycin). No significant combination
effect was observed in the A673 model. The combination of ganitumab and rapamycin did not
result in significant body weight loss (data not shown).
This article has not been copyedited and formatted. The final version may differ from this version.JPET Fast Forward. Published on March 8, 2011 as DOI: 10.1124/jpet.110.178400
at ASPE
T Journals on M
arch 12, 2019jpet.aspetjournals.org
Dow
nloaded from
JPET #178400
18
Tumors were harvested from the animals on the last day of the study and were assayed
for pIGF1R, pINSR, and pAkt (Fig. 7B). Consistent with findings from the in vivo monotherapy
studies (Fig. 2C), xenografts exposed for approximately 3 weeks to a suboptimal (30µg/dose
SJSA-1) or optimal (300µg/dose SK-ES-1 and A673) dose of ganitumab had significantly
reduced levels of net pIGF1R (Fig. 7B). Normalized (p:t) analysis of IGF1R (Supp. Fig. 3)
resulted in the appearance of less-than-optimal pIGF1R inhibition by ganitumab because of the
receptor-downregulating effects of ganitumab following repeated dosing. Rapamycin seemed to
induce pAkt in all xenografts, but statistical significance versus control was only achieved in the
A673 tumors (p=0.076 for SK-ES-1, and p=0.099 for SJSA-1). In contrast to our previous
observations (pharmacodynamic assay, Fig. 5A,B), ganitumab did not inhibit rapamycin-induced
pAkt in these SJSA-1 and A673 efficacy experiments. This lack of activity correlated with
enhanced activation of INSR in the same models (p<0.05 versus hIgG1). In contrast, the
combination treatment resulted in reduced pINSR and pAkt in SK-ES-1 xenografts (Fig. 7B).
This article has not been copyedited and formatted. The final version may differ from this version.JPET Fast Forward. Published on March 8, 2011 as DOI: 10.1124/jpet.110.178400
at ASPE
T Journals on M
arch 12, 2019jpet.aspetjournals.org
Dow
nloaded from
JPET #178400
19
Discussion
Emerging phase 2 clinical data are providing increasing support for targeting IGF1R for
the treatment of human cancers (Rodon et al., 2008). A number of anti-IGF1R antibodies have
demonstrated antitumor activity in patients with Ewing’s sarcoma (Pollak, 2008; Tolcher et al.,
2009), and there is a need to understand the mechanisms underlying this activity (Scotlandi and
Picci, 2008). We have shown that ganitumab inhibited IGF-1 and IGF-2 signaling through
IGF1R homodimers and IGF1R/INSR hybrids (not INSR homodimers) in models of pancreatic
cancer via ligand blockade and receptor downregulation (Beltran et al., 2009). Here we
investigated the efficacy of ganitumab alone and in combination with rapamycin in three
sarcoma models that exhibit distinct signaling responses to IGF-1 and insulin resulting in distinct
dependency and cross-talk of IGF1R and INSR signaling.
Ganitumab significantly inhibited ligand-induced phosphorylation of IGF1R in each
model. Inhibition of IGF1R phosphorylation was associated with significantly reduced tumor
growth in SJSA-1 and SK-ES-1 xenografts; however, A673 xenografts were relatively resistant
to ganitumab treatment. SJSA-1 xenografts, which expressed the lowest level of INSR,
exhibited the greatest sensitivity to ganitumab. SK-ES-1 xenografts expressed INSR but
demonstrated a preference for IGF-1 over insulin and remained sensitive to ganitumab albeit at
a 10-fold higher dose. This decreased sensitivity may be driven by the requirement to achieve
adequate coverage of IGF1R/INSR hybrids. These effects of ganitumab are consistent with the
results reported previously for pancreatic cancer models (Beltran et al., 2009). However, in
contrast to the pancreatic cancer models, in which ganitumab treatment resulted in either anti-
proliferative or pro-apoptotic activities, ganitumab inhibition of SJSA-1 xenografts involved both
potent anti-proliferative and pro-apoptotic activities. This dual mechanism of action may explain
This article has not been copyedited and formatted. The final version may differ from this version.JPET Fast Forward. Published on March 8, 2011 as DOI: 10.1124/jpet.110.178400
at ASPE
T Journals on M
arch 12, 2019jpet.aspetjournals.org
Dow
nloaded from
JPET #178400
20
the high sensitivity of SJSA-1 xenografts to ganitumab. These data suggest that low tINSR
expression and incorporation of INSR into IGF1R/INSR hybrid receptors may be significant
factors determining the efficacy of ganitumab as monotherapy.
The relative resistance of A673 xenografts to ganitumab was unexpected given that the
expression of IGF1R and INSR is within the range observed in other sensitive cells. Our
attempts to try to model this resistance in vitro were not successful: no more than a 2-fold
difference in ganitumab IC50 for IGF1R was observed, and ganitumab treatment led to similar
percent growth inhibition among the three cell lines. The resistance of A673 xenografts to
IGF1R blockade in vivo appeared to be associated with a sub-optimal reduction in the level of
IGF1R expression and appeared to have emerged during repeated dosing of ganitumab (IGF1R
was strongly inhibited by a single ganitumab treatment in established A673 tumors). One
possible explanation for the differential in vitro and in vivo sensitivity of A673 cells is exposure to
circulating hormones (e.g. insulin) or stromal factors within the tumor environment. In this
regard, we observed that A673 cells displayed hypersensitivity to insulin, whereas the preferred
ligand in SJSA-1 and SK-ES-1 cells appeared to be IGF-1. Resistance of INSR to ganitumab
treatment was also observed in long-term cell culture and xenograft experiments. These
observations suggest that INSR homodimers in A673 cells may be disproportionately active
relative to other cell lines that are more sensitive to ganitumab. Alternatively, hybrid receptors in
A673 cells may be preferentially activated by insulin rather than IGF-1 via unknown
mechanisms.
It is well established that inhibition of mTORC1 by rapamycin results in reduced
phosphorylation of p70S6K, a direct target of the mTOR kinase. This effect was readily
detected in serum-starved cultures in the present study. However, it is important to note that in
growing cells (serum-fed) the inhibition of p70S6K activity by rapamycin was due to a reduction
This article has not been copyedited and formatted. The final version may differ from this version.JPET Fast Forward. Published on March 8, 2011 as DOI: 10.1124/jpet.110.178400
at ASPE
T Journals on M
arch 12, 2019jpet.aspetjournals.org
Dow
nloaded from
JPET #178400
21
in the levels of t and pp70S6K. As reported by others (O'Reilly et al., 2006), we found that
rapamycin treatment generated a durable induction of Akt phosphorylation in cancer cell lines in
vitro and in established tumor xenografts in vivo. The ability of ganitumab to inhibit induction of
Akt phosphorylation strongly suggests that this effect depends on IGF1R activity and the PI3K
pathway, a result that is consistent with other studies of rapamycin in combination with an anti-
IGF1R antibody or PI3K inhibitors (Sun et al., 2005; Wang et al., 2008b). Rapamycin treatment
also resulted in a striking increase in GSK3β phosphorylation resulting not from an increase in
pGSK3β, but from a preferential reduction in non-phosphorylated protein. Ganitumab inhibited
the effect of rapamycin on tGSK3β suggesting that Akt activity is essential for this effect.
Several normalization methods (p/t protein, correction for cell-confluency, division by
tp70S6K) were explored to separate direct drug-related effects on IGF1R pathway markers from
indirect drug-related changes on cell size and number. The changes in tGSK3β and tAkt in
response to rapamycin were closely correlated with levels of tp70S6K. This observation
supports the direct involvement of mTOR in regulation of the stability of these three pathway
proteins. The association between tp70S6K and other IGF1R pathway proteins (IRS-1, INSR,
IGF1R) was less consistent (SJSA-1 < A673 < SK-ES-1) although it improved with ganitumab
treatment. The increases in tIGF1R, tINSR, and tIRS-1 relative to tp70S6K (and per unit cell
confluence) with rapamycin exposure in SJSA-1 and A673 cells suggests that receptor levels
and tIRS-1 can be strongly influenced by mTOR-independent mechanisms.
The modest cytostatic effects obtained in vitro with sarcoma cells treated with ganitumab
falls in the range previously reported for IGF1R inhibitors (Maloney et al., 2003; Mitsiades et al.,
2004; Buck et al.). We believe that the rich nutritional composition of cell culture media may be
compensating for the inhibition of metabolic pathways that results from PI3K/Akt pathway
inhibition (Nawijn et al., 2011). The addition of excess ganitumab plus sub-saturating
This article has not been copyedited and formatted. The final version may differ from this version.JPET Fast Forward. Published on March 8, 2011 as DOI: 10.1124/jpet.110.178400
at ASPE
T Journals on M
arch 12, 2019jpet.aspetjournals.org
Dow
nloaded from
JPET #178400
22
concentrations of rapamycin to each sarcoma cell line resulted in growth inhibition that was
generally additive. In vivo, this additive effect was observed in the ganitumab-sensitive SJSA-1
and SK-ES-1 models. It has been suggested that upregulation of Akt activity in response to
mTORC1 inhibition is an acquired mechanism of rapamycin resistance in tumor models and
cancer patients (Sun et al., 2005; O'Reilly et al., 2006; Wang et al., 2008b). This concept is not
universally accepted, as recent preclinical studies have suggested that rapamycin sensitivity
can occur in the presence of Akt feedback induction (Breuleux et al., 2009). The observation
that ganitumab prevented the increase in pAkt in A673 tumors after a single dose but not after
repeated dosing of rapamycin, suggests that regulation of other PI3K/Akt pathway inputs are
important in determining resistance to this drug combination. This is highlighted by the increase
in INSR activation observed after multiple dosing in A673 xenografts and the lack of enhanced
efficacy in the combination group.
We believe that activation of the INSR is a plausible mechanism for the intrinsic
resistance of A673 cells to ganitumab and for the acquired resistance of SJSA-1 cells to the
combination of ganitumab plus rapamycin. In vivo, ganitumab plus rapamycin resulted in
significant increases in pINSR in SJSA-1 and A673 xenograft models, and phosphorylation of
INSR was associated with phosphorylation of Akt. Analysis of small “adapted” SJSA-1 tumors
present in the combination group at the end of the study, suggests that surviving tumor cells are
able to adjust to the combination treatment by activating INSR homodimers, which are resistant
to ganitumab activity. A similar INSR effect was observed with A673 tumors, even though they
are inherently less sensitive to ganitumab. Interestingly, this INSR-mediated resistance was not
observed in the SK-ES-1 model, in agreement with the in vitro data observed in Figure 6F.
Aside from INSR-mediated resistance, it is likely that other factors contribute to the
resistance of A673 cells to ganitumab. One important factor is mutant b-raf (Oliner et al., 1992),
This article has not been copyedited and formatted. The final version may differ from this version.JPET Fast Forward. Published on March 8, 2011 as DOI: 10.1124/jpet.110.178400
at ASPE
T Journals on M
arch 12, 2019jpet.aspetjournals.org
Dow
nloaded from
JPET #178400
23
which has been shown to detach MAPK pathway activation from growth factor receptor
activation at the plasma membrane resulting in constitutive Erk signaling. This results in a
strong proliferative signal that might be insensitive to IGF1R blockade. In addition, it is also
possible that response to ganitumab is governed by the expression of other important IGF1R
axis proteins. For example, SK-ES-1 cells secrete IGF-1 and IGFBP-3 into conditioned media
and SJSA-1 cells produce IGF-2 (unpublished data), which is known to bind to and activate
INSR. The expression of IGFBPs, which can modify local IGF-1 and IGF-2 activity, is known to
vary widely among these cell lines. Moreover, the three cell lines carry distinct genetic
alterations: SJSA-1 cells are amplified for Mdm2; and A673 and SK-ES-1 cells possess EWS-
FLI-1 translocations. (Davies et al., 2002; Smith et al., 2006).
It has been suggested that inhibition of either PI3K or IGF1R may be a useful strategy to
enhance the clinical efficacy of mTORC1 inhibitors like rapamycin (Sun et al., 2005; O'Reilly et
al., 2006; Wang et al., 2008b). This concept is supported by our data, which showed that
blockade of rapamycin-induced Akt activation by ganitumab was associated with increased
efficacy in 2 of the 3 tumor models. These results strongly suggest that maintenance of
PI3K/Akt activity though IGF1R stimulation may be essential for the pathway alterations induced
by inhibition of mTORC1. Our results also point to the potential role of INSR as a mechanism of
resistance and highlights the importance of an effective biomarker strategy to distinguish tumor
phenotypes (SJSA-1 and SK-ES-1) that can benefit from this combination. The effects we
observed on GSK3β suggest that more attention should be devoted to this marker in clinical
studies of IGF1R and mTORC1 inhibitors. Clinical trials are required to determine whether
addition of ganitumab can translate into therapeutic benefit in malignancies influenced by IGF1R
activity, and in those for which the activity of mTORC1 inhibitors has been limited by Akt-
mediated resistance.
This article has not been copyedited and formatted. The final version may differ from this version.JPET Fast Forward. Published on March 8, 2011 as DOI: 10.1124/jpet.110.178400
at ASPE
T Journals on M
arch 12, 2019jpet.aspetjournals.org
Dow
nloaded from
JPET #178400
24
Acknowledgements
We thank Larry Daugherty for assistance with flow cytometry, and Barbara Felder and Efrain
Pacheco for assistance with immunohistochemistry. Kathryn Boorer (Amgen Inc.) assisted with
writing this manuscript. The sequence of ganitumab can be found at:
http://www.who.int/medicines/publications/druginformation/INN_PL103.pdf.
Authorship Contributions
Wrote or reviewed the manuscript and approved the final draft: Beltran, Chung, Moody,
Mitchell, Cajulis, Vonderfecht, Kendall, Radinsky, Calzone
Designed the experiments: Calzone, Beltran, Kendall, Radinsky
Conducted experiments: Chung, Moody, Mitchell, Cajulis
Data analysis: Beltran, Calzone, Vonderfecht, Moody, Cajulis, Chung, Mitchell
This article has not been copyedited and formatted. The final version may differ from this version.JPET Fast Forward. Published on March 8, 2011 as DOI: 10.1124/jpet.110.178400
at ASPE
T Journals on M
arch 12, 2019jpet.aspetjournals.org
Dow
nloaded from
JPET #178400
25
References
Arvand A and Denny CT (2001) Biology of EWS/ETS fusions in Ewing's family tumors.
Oncogene 20:5747-5754.
Avnet S, Sciacca L, Salerno M, Gancitano G, Cassarino MF, Longhi A, Zakikhani M, Carboni
JM, Gottardis M, Giunti A, Pollak M, Vigneri R and Baldini N (2009) Insulin receptor
isoform A and insulin-like growth factor II as additional treatment targets in human
osteosarcoma. Cancer Res 69:2443-2452.
Belfiore A, Frasca F, Pandini G, Sciacca L and Vigneri R (2009) Insulin receptor isoforms and
insulin receptor/insulin-like growth factor receptor hybrids in physiology and disease.
Endocr Rev 30:586-623.
Beltran PJ, Mitchell P, Chung YA, Cajulis E, Lu J, Belmontes B, Ho J, Tsai MM, Zhu M,
Vonderfecht S, Baserga R, Kendall R, Radinsky R and Calzone FJ (2009) AMG 479, a
fully human anti-insulin-like growth factor receptor type I monoclonal antibody, inhibits
the growth and survival of pancreatic carcinoma cells. Mol Cancer Ther.
Bjornsti MA and Houghton PJ (2004) The TOR pathway: a target for cancer therapy. Nat Rev
Cancer 4:335-348.
Breuleux M, Klopfenstein M, Stephan C, Doughty CA, Barys L, Maira SM, Kwiatkowski D and
Lane HA (2009) Increased AKT S473 phosphorylation after mTORC1 inhibition is rictor
dependent and does not predict tumor cell response to PI3K/mTOR inhibition. Mol
Cancer Thera 8:742-753.
Buck E, Gokhale PC, Koujak S, Brown E, Eyzaguirre A, Tao N, Rosenfeld-Franklin M, Lerner L,
Chiu MI, Wild R, Epstein D, Pachter JA and Miglarese MR (2010) Compensatory insulin
This article has not been copyedited and formatted. The final version may differ from this version.JPET Fast Forward. Published on March 8, 2011 as DOI: 10.1124/jpet.110.178400
at ASPE
T Journals on M
arch 12, 2019jpet.aspetjournals.org
Dow
nloaded from
JPET #178400
26
receptor (IR) activation on inhibition of insulin-like growth factor-1 receptor (IGF-1R):
rationale for cotargeting IGF-1R and IR in cancer. Mol Cancer Ther 9:2652-2664.
Cao L, Yu Y, Darko I, Currier D, Mayeenuddin LH, Wan X, Khanna C and Helman LJ (2008)
Addiction to elevated insulin-like growth factor I receptor and initial modulation of the
AKT pathway define the responsiveness of rhabdomyosarcoma to the targeting
antibody. Cancer Res 68:8039-8048.
Davies H, Bignell GR, Cox C, Stephens P, Edkins S, Clegg S, Teague J, Woffendin H, Garnett
MJ, Bottomley W, Davis N, Dicks E, Ewing R, Floyd Y, Gray K, Hall S, Hawes R,
Hughes J, Kosmidou V, Menzies A, Mould C, Parker A, Stevens C, Watt S, Hooper S,
Wilson R, Jayatilake H, Gusterson BA, Cooper C, Shipley J, Hargrave D, Pritchard-
Jones K, Maitland N, Chenevix-Trench G, Riggins GJ, Bigner DD, Palmieri G, Cossu A,
Flanagan A, Nicholson A, Ho JW, Leung SY, Yuen ST, Weber BL, Seigler HF, Darrow
TL, Paterson H, Marais R, Marshall CJ, Wooster R, Stratton MR and Futreal PA (2002)
Mutations of the BRAF gene in human cancer. Nature 417:949-954.
Hughes DP (2009) Novel agents in development for pediatric sarcomas. Curr Opin Oncol
21:332-337.
Iwamoto Y (2007) Diagnosis and treatment of Ewing's sarcoma. Jpn J Clin Oncol 37:79-89.
Kim SY, Toretsky JA, Scher D and Helman LJ (2009) The role of IGF-1R in pediatric
malignancies. Oncologist 14:83-91.
Kurmasheva RT, Huang S and Houghton PJ (2006) Predicted mechanisms of resistance to
mTOR inhibitors. Br J Cancer 95:955-960.
Longhi A, Errani C, De Paolis M, Mercuri M and Bacci G (2006) Primary bone osteosarcoma in
the pediatric age: state of the art. Cancer Treat Rev 32:423-436.
This article has not been copyedited and formatted. The final version may differ from this version.JPET Fast Forward. Published on March 8, 2011 as DOI: 10.1124/jpet.110.178400
at ASPE
T Journals on M
arch 12, 2019jpet.aspetjournals.org
Dow
nloaded from
JPET #178400
27
Maloney EK, McLaughlin JL, Dagdigian NE, Garrett LM, Connors KM, Zhou XM, Blattler WA,
Chittenden T and Singh R (2003) An anti-insulin-like growth factor I receptor antibody
that is a potent inhibitor of cancer cell proliferation. Cancer Res 63:5073-5083.
Manara MC, Landuzzi L, Nanni P, Nicoletti G, Zambelli D, Lollini PL, Nanni C, Hofmann F,
Garcia-Echeverria C, Picci P and Scotlandi K (2007) Preclinical in vivo study of new
insulin-like growth factor-I receptor--specific inhibitor in Ewing's sarcoma. Clin Cancer
Res 13:1322-1330.
Mateo-Lozano S, Gokhale PC, Soldatenkov VA, Dritschilo A, Tirado OM and Notario V (2006)
Combined transcriptional and translational targeting of EWS/FLI-1 in Ewing's sarcoma.
Clin Cancer Res 12:6781-6790.
Mateo-Lozano S, Tirado OM and Notario V (2003) Rapamycin induces the fusion-type
independent downregulation of the EWS/FLI-1 proteins and inhibits Ewing's sarcoma cell
proliferation. Oncogene 22:9282-9287.
Meric-Bernstam F and Gonzalez-Angulo AM (2009) Targeting the mTOR signaling network for
cancer therapy. J Clin Oncol 27:2278-2287.
Mitsiades CS, Mitsiades NS, McMullan CJ, Poulaki V, Shringarpure R, Akiyama M, Hideshima
T, Chauhan D, Joseph M, Libermann TA, Garcia-Echeverria C, Pearson MA, Hofmann
F, Anderson KC and Kung AL (2004) Inhibition of the insulin-like growth factor receptor-1
tyrosine kinase activity as a therapeutic strategy for multiple myeloma, other hematologic
malignancies, and solid tumors. Cancer Cell 5:221-230.
Nawijn MC, Alendar A and Berns A (2011) For better or for worse: the role of Pim oncogenes in
tumorigenesis. Nat Rev Cancer 11:23-34.
This article has not been copyedited and formatted. The final version may differ from this version.JPET Fast Forward. Published on March 8, 2011 as DOI: 10.1124/jpet.110.178400
at ASPE
T Journals on M
arch 12, 2019jpet.aspetjournals.org
Dow
nloaded from

JPET #178400
28
O'Reilly KE, Rojo F, She QB, Solit D, Mills GB, Smith D, Lane H, Hofmann F, Hicklin DJ, Ludwig
DL, Baselga J and Rosen N (2006) mTOR inhibition induces upstream receptor tyrosine
kinase signaling and activates Akt. Cancer Res 66:1500-1508.
Oliner JD, Kinzler KW, Meltzer PS, George DL and Vogelstein B (1992) Amplification of a gene
encoding a p53-associated protein in human sarcomas. Nature 358:80-83.
Pollak M (2008) Insulin and insulin-like growth factor signalling in neoplasia. Nat Rev Cancer
8:915-928.
Polverino A, Coxon A, Starnes C, Diaz Z, DeMelfi T, Wang L, Bready J, Estrada J, Cattley R,
Kaufman S, Chen D, Gan Y, Kumar G, Meyer J, Neervannan S, Alva G, Talvenheimo J,
Montestruque S, Tasker A, Patel V, Radinsky R and Kendall R (2006) AMG 706, an oral,
multikinase inhibitor that selectively targets vascular endothelial growth factor, platelet-
derived growth factor, and kit receptors, potently inhibits angiogenesis and induces
regression in tumor xenografts. Cancer Res 66:8715-8721.
Prieur A, Tirode F, Cohen P and Delattre O (2004) EWS/FLI-1 silencing and gene profiling of
Ewing cells reveal downstream oncogenic pathways and a crucial role for repression of
insulin-like growth factor binding protein 3. Mol Cell Biol 24:7275-7283.
Ries LAG, Melbert D, Krapcho M, Stinchcomb DG, Howlader N, Horner MJ, Mariotto A, Miller
BA, Feuer EJ, Altekruse SF, Lewis DR, Clegg L, Eisner MP, Reichman M and Edwards
BK (2008) SEER Cancer Statistics Review, 1975-2005, in Surveillance Epidemiology
and End Results, National Cancer Institute, Bethesda.
Rikhof B, de Jong S, Suurmeijer AJ, Meijer C and van der Graaf WT (2009) The insulin-like
growth factor system and sarcomas. J Pathol 217:469-482.
This article has not been copyedited and formatted. The final version may differ from this version.JPET Fast Forward. Published on March 8, 2011 as DOI: 10.1124/jpet.110.178400
at ASPE
T Journals on M
arch 12, 2019jpet.aspetjournals.org
Dow
nloaded from
JPET #178400
29
Rodon J, DeSantos V, Ferry RJ, Jr. and Kurzrock R (2008) Early drug development of inhibitors
of the insulin-like growth factor-I receptor pathway: lessons from the first clinical trials.
Mol Cancer Ther 7:2575-2588.
Scotlandi K and Picci P (2008) Targeting insulin-like growth factor 1 receptor in sarcomas. Curr
Opin Oncol 20:419-427.
Smith R, Owen LA, Trem DJ, Wong JS, Whangbo JS, Golub TR and Lessnick SL (2006)
Expression profiling of EWS/FLI identifies NKX2.2 as a critical target gene in Ewing's
sarcoma. Cancer Cell 9:405-416.
Sun SY, Rosenberg LM, Wang X, Zhou Z, Yue P, Fu H and Khuri FR (2005) Activation of Akt
and eIF4E survival pathways by rapamycin-mediated mammalian target of rapamycin
inhibition. Cancer Res 65:7052-7058.
Tolcher AW, Sarantopoulos J, Patnaik A, Papadopoulos K, Lin CC, Rodon J, Murphy B, Roth B,
McCaffery I, Gorski KS, Kaiser B, Zhu M, Deng H, Friberg G and Puzanov I (2009)
Phase I, pharmacokinetic, and pharmacodynamic study of AMG 479, a fully human
monoclonal antibody to insulin-like growth factor receptor 1. J Clin Oncol.
Wan X, Harkavy B, Shen N, Grohar P and Helman LJ (2007) Rapamycin induces feedback
activation of Akt signaling through an IGF-1R-dependent mechanism. Oncogene
26:1932-1940.
Wan X and Helman LJ (2007) The biology behind mTOR inhibition in sarcoma. Oncologist
12:1007-1018.
Wang X, Hawk N, Yue P, Kauh J, Ramalingam SS, Fu H, Khuri FR and Sun SY (2008a)
Overcoming mTOR inhibition-induced paradoxical activation of survival signaling
This article has not been copyedited and formatted. The final version may differ from this version.JPET Fast Forward. Published on March 8, 2011 as DOI: 10.1124/jpet.110.178400
at ASPE
T Journals on M
arch 12, 2019jpet.aspetjournals.org
Dow
nloaded from
JPET #178400
30
pathways enhances mTOR inhibitors' anticancer efficacy. Cancer Biol Ther 7:1952-
1958.
Wang X, Yue P, Kim YA, Fu H, Khuri FR and Sun SY (2008b) Enhancing mammalian target of
rapamycin (mTOR)-targeted cancer therapy by preventing mTOR/raptor inhibition-
initiated, mTOR/rictor-independent Akt activation. Cancer Res 68:7409-7418.
This article has not been copyedited and formatted. The final version may differ from this version.JPET Fast Forward. Published on March 8, 2011 as DOI: 10.1124/jpet.110.178400
at ASPE
T Journals on M
arch 12, 2019jpet.aspetjournals.org
Dow
nloaded from
JPET #178400
31
Footnotes
*Financial support: *This study was funded by Amgen Inc., Thousand Oaks, CA 91320.
Data from this study were previously presented at the 2008 meeting of the American
Association for Cancer Research (AACR).
Reprint requests to: Pedro J. Beltran, Amgen Inc., One Amgen Center Drive, Thousand Oaks,
CA 91320; Phone, 805-447-9221; Fax, 805-375-8524; email: [email protected].
This article has not been copyedited and formatted. The final version may differ from this version.JPET Fast Forward. Published on March 8, 2011 as DOI: 10.1124/jpet.110.178400
at ASPE
T Journals on M
arch 12, 2019jpet.aspetjournals.org
Dow
nloaded from
JPET #178400
32
Figure Legends
Figure 1. Inhibition of IGF-1-stimulated signals in osteogenic and Ewing’s sarcoma cell lines.
Sarcoma cells were treated with increasing concentrations of ganitumab added simultaneously
with 2nM IGF-1 for 20 minutes. Ganitumab inhibition of IGF1R (A), INSR (B), and Akt (C)
phosphorylation was determined using MSD™ multiplex assays. Cells were grown and serum-
starved in a 6-well format prior to each drug treatment. Phosphorylated and total protein levels
from 40µg of protein extract were analyzed. The percent activity remaining was normalized to
‘no antibody’ treatment after subtraction of background. Lowest concentration indicated = no
drug treatment.
Figure 2. Inhibitory effects of ganitumab on IGF1R signaling and tumor growth in sarcoma
xenografts. A, Effect of ganitumab on basal and IGF-1-induced levels of pIGF1R, pINSR, and
pAkt. Mice bearing SJSA-1, SK-ES-1, or A673 xenografts (300 to 450mm3) were randomly
assigned into treatment groups and injected intraperitoneally with 1mg ganitumab or 1mg hIgG1
(n=6 for each treatment group). After 6h, the treatment groups were divided in half (n=3) and
received either intravenous IGF-1 (15μg) or PBS. After 15 minutes, tumors were collected and
analyzed for levels of pIGF1R and pINSR (left axis) and pAkt (right axis). Data are shown as
mean phosphorylated protein signal ± S.E.M. *p<0.05 versus control hIgG1 groups in the
presence or absence of IGF-1. RLU, relative light units. B, In vivo efficacy of ganitumab as
monotherapy. Mice bearing SJSA-1, SK-ES-1, or A673 xenografts (~200mm3) were randomly
assigned into treatment groups (n=10) and treated intraperitoneally (starting the day of first
measurement) twice per week with hIgG1 (300µg/dose) or ganitumab (30, 100, or 300µg/dose)
for the duration of the experiment. Tumor volumes were measured twice per week. Data are
shown as mean tumor volume ± S.E.M. The significance of differences in tumor-growth
This article has not been copyedited and formatted. The final version may differ from this version.JPET Fast Forward. Published on March 8, 2011 as DOI: 10.1124/jpet.110.178400
at ASPE
T Journals on M
arch 12, 2019jpet.aspetjournals.org
Dow
nloaded from
JPET #178400
33
inhibition between ganitumab treatment versus hIgG1 treatment was: *p<0.0001, †p=0.0011,
‡p=0.0172. C, Status of tIGF1R and pIGF1R after long-term ganitumab treatment. Six hours
after the last dose (as described in Fig. 2B), xenografts were excised and processed for MSDTM
detection of tIGF1R and pIGF1R. Data are shown as mean ± S.E.M. *p<0.05 versus control
hIgG1 groups (n=3).
Figure 3. Effects of ganitumab on cell proliferation and apoptosis in vivo. Mice bearing SJSA-1
(A) or A673 (B) xenografts (~300mm3) were treated by intraperitoneal injection with ganitumab
or hIgG1 (1mg). Xenografts were harvested, fixed and processed for immunohistochemical
detection of caspase-3 (after 3 hours) or BrdU (after 24 hours). Images were viewed with a
Nikon Eclipse 90i microscope (Nikon Instruments, Melville, NY) and representative images were
captured with a Nikon DXM1200F digital camera, 20X objective, and Digital Sight ACT-1
software.
Figure 4. The effect of ganitumab and rapamycin on cell growth in vitro. Cell lines were grown
in 10-15% FBS-containing culture media (96-well format) containing a fixed concentration of
ganitumab or hIgG1 (250nM for A673 cells; 500nM for SJSA-1 and SK-ES-1 cells) and 3-fold
serial dilutions of rapamycin. We estimated that the concentration of IGF-1 in the assay media
was 0.6-0.9 nM. Cell confluency was measured every 4 h. The times at which each cell line
treated with hIgG1 reached about 85% confluency (52 h for SJSA-1, 96 h for SK-ES-1, and 76 h
for A673) were selected to illustrate the effect of ganitumab and rapamycin on cell growth. The
percent confluency at these time points in the presence or absence of ganitumab was plotted
against rapamycin concentration and changes in IC50 calculated using Prism. Data are shown
as the mean ± SD.
This article has not been copyedited and formatted. The final version may differ from this version.JPET Fast Forward. Published on March 8, 2011 as DOI: 10.1124/jpet.110.178400
at ASPE
T Journals on M
arch 12, 2019jpet.aspetjournals.org
Dow
nloaded from
JPET #178400
34
Figure 5. Acute effects of ganitumab plus rapamycin on IGF1R activation and signaling.
Levels of pIGF1R, pAkt, pp70S6K were determined using MSD™ multiplex assays. The
pIGF1R and p70S6K results are plotted against the left axis; those for pAkt are plotted against
the right axis. *p<0.05 between hIgG1 versus rapamycin or ganitumab alone and **p<0.05
between rapamycin alone versus rapamycin plus ganitumab. A, In vitro study. The status of
pIGF1R and pp70S6K (left axis) and pAkt (right axis) was determined in serum-starved sarcoma
cells treated for 1h with hIgG1 (0.5µM), ganitumab (0.5µM), rapamycin (27nM), or ganitumab
plus rapamycin, all in the presence of 10nM IGF-1. Data are shown as the mean ± SD. B, In
vivo study. Pathway markers were analyzed in tumor-bearing mice (n=3) treated for 6h with a
single intraperitoneal dose of hIgG1 (300μg), ganitumab (300μg), rapamycin (0.5mg/kg), or
rapamycin plus ganitumab. Data are shown as the mean ± S.E.M.. RLU, relative light units.
Figure 6. Analysis of IGF1R pathway markers in growing cells after long-term treatment with
ganitumab and rapamycin. In parallel with the experiment shown in Figure 4, sarcoma cell lines
were seeded in serum-containing media in 96-well microtitre plates and treated with ganitumab
and rapamycin. IGF1R and Akt MSD™ multiplex assays were performed in triplicate at the
incubation times indicated in Figure 4B. The signals for each treatment were normalized to cells
treated with hIgG1. A,B, The relative change (Δ) in tp70S6K and pp70S6K (corrected for
differences in cell confluency) plotted against log rapamycin concentration in the presence of
ganitumab or hIgG1. C,D, The relative change (Δ) in Akt and GSK3β (p:t) (corrected for
differences in cell confluency) plotted against log rapamycin concentration. E,F, The relative
change (Δ) in pIGF1R and pINSR (corrected for differences in cell confluency) plotted against
log rapamycin concentration. Relative marker changes without normalization are shown in
Supp. Fig. 2.
This article has not been copyedited and formatted. The final version may differ from this version.JPET Fast Forward. Published on March 8, 2011 as DOI: 10.1124/jpet.110.178400
at ASPE
T Journals on M
arch 12, 2019jpet.aspetjournals.org
Dow
nloaded from
JPET #178400
35
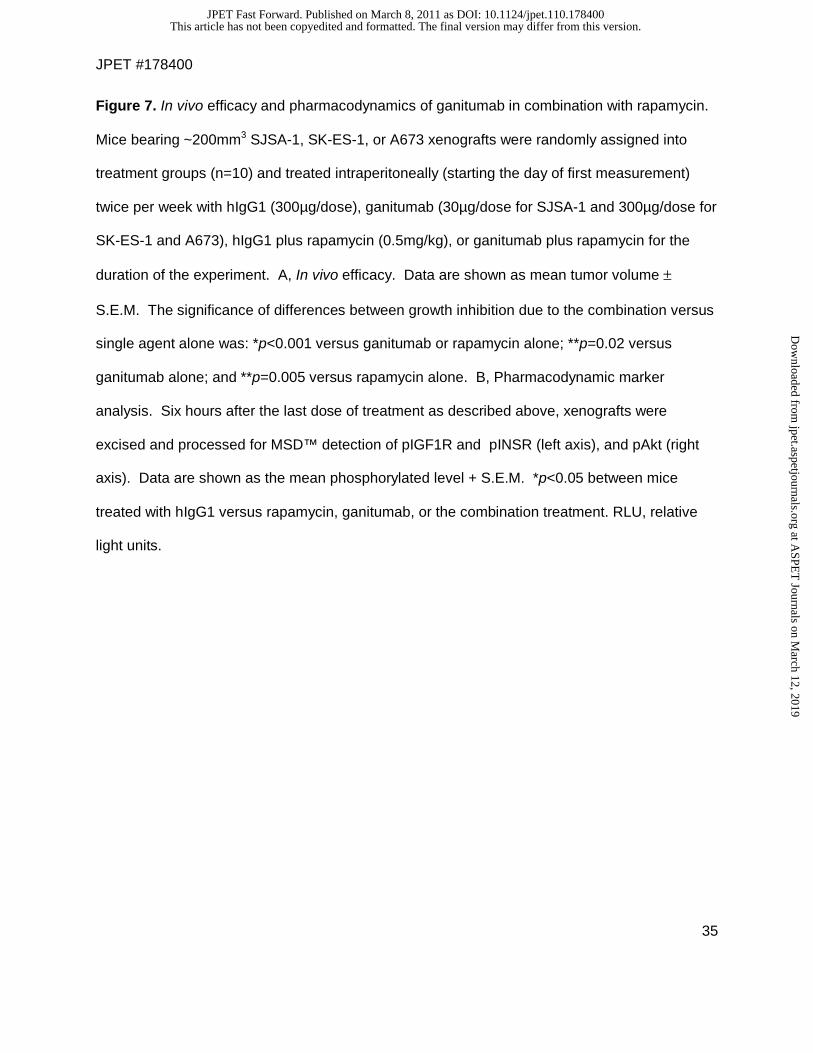
Figure 7. In vivo efficacy and pharmacodynamics of ganitumab in combination with rapamycin.
Mice bearing ~200mm3 SJSA-1, SK-ES-1, or A673 xenografts were randomly assigned into
treatment groups (n=10) and treated intraperitoneally (starting the day of first measurement)
twice per week with hIgG1 (300µg/dose), ganitumab (30µg/dose for SJSA-1 and 300µg/dose for
SK-ES-1 and A673), hIgG1 plus rapamycin (0.5mg/kg), or ganitumab plus rapamycin for the
duration of the experiment. A, In vivo efficacy. Data are shown as mean tumor volume ±
S.E.M. The significance of differences between growth inhibition due to the combination versus
single agent alone was: *p<0.001 versus ganitumab or rapamycin alone; **p=0.02 versus
ganitumab alone; and **p=0.005 versus rapamycin alone. B, Pharmacodynamic marker
analysis. Six hours after the last dose of treatment as described above, xenografts were
excised and processed for MSD™ detection of pIGF1R and pINSR (left axis), and pAkt (right
axis). Data are shown as the mean phosphorylated level + S.E.M. *p<0.05 between mice
treated with hIgG1 versus rapamycin, ganitumab, or the combination treatment. RLU, relative
light units.
This article has not been copyedited and formatted. The final version may differ from this version.JPET Fast Forward. Published on March 8, 2011 as DOI: 10.1124/jpet.110.178400
at ASPE
T Journals on M
arch 12, 2019jpet.aspetjournals.org
Dow
nloaded from
JPET #178400
36
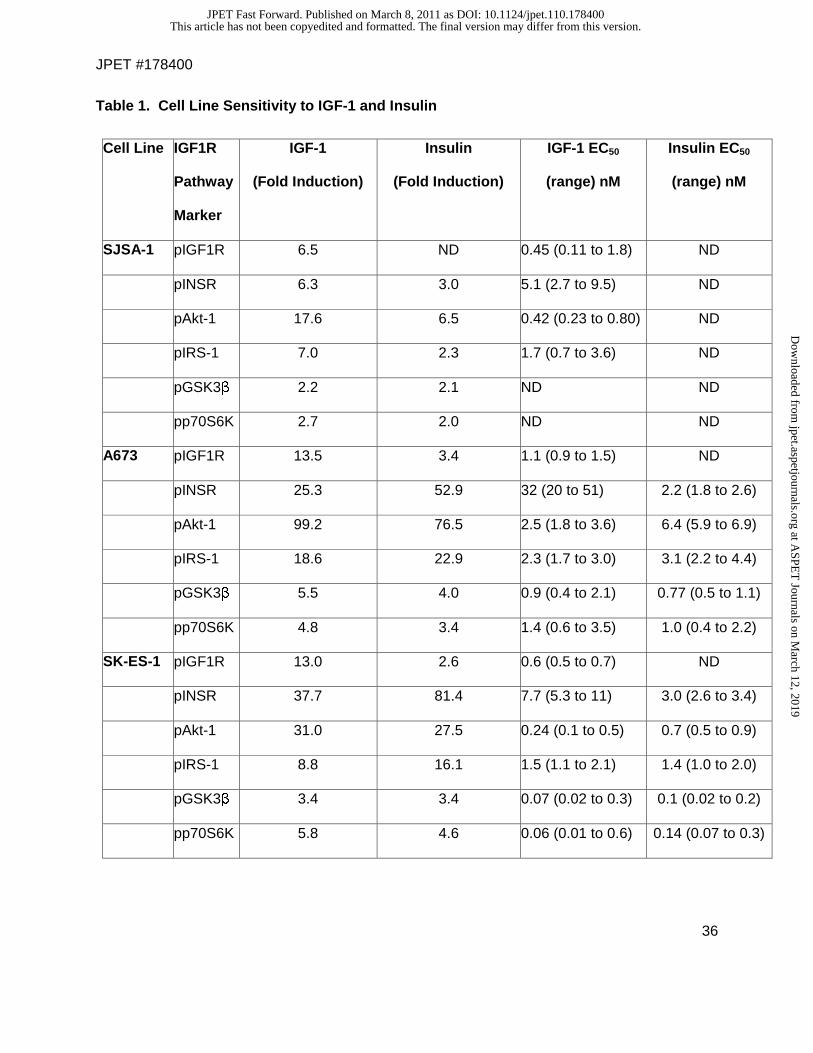
Table 1. Cell Line Sensitivity to IGF-1 and Insulin
Cell Line IGF1R
Pathway
Marker
IGF-1
(Fold Induction)
Insulin
(Fold Induction)
IGF-1 EC50
(range) nM
Insulin EC50
(range) nM
SJSA-1 pIGF1R 6.5 ND 0.45 (0.11 to 1.8) ND
pINSR 6.3 3.0 5.1 (2.7 to 9.5) ND
pAkt-1 17.6 6.5 0.42 (0.23 to 0.80) ND
pIRS-1 7.0 2.3 1.7 (0.7 to 3.6) ND
pGSK3β 2.2 2.1 ND ND
pp70S6K 2.7 2.0 ND ND
A673 pIGF1R 13.5 3.4 1.1 (0.9 to 1.5) ND
pINSR 25.3 52.9 32 (20 to 51) 2.2 (1.8 to 2.6)
pAkt-1 99.2 76.5 2.5 (1.8 to 3.6) 6.4 (5.9 to 6.9)
pIRS-1 18.6 22.9 2.3 (1.7 to 3.0) 3.1 (2.2 to 4.4)
pGSK3β 5.5 4.0 0.9 (0.4 to 2.1) 0.77 (0.5 to 1.1)
pp70S6K 4.8 3.4 1.4 (0.6 to 3.5) 1.0 (0.4 to 2.2)
SK-ES-1 pIGF1R 13.0 2.6 0.6 (0.5 to 0.7) ND
pINSR 37.7 81.4 7.7 (5.3 to 11) 3.0 (2.6 to 3.4)
pAkt-1 31.0 27.5 0.24 (0.1 to 0.5) 0.7 (0.5 to 0.9)
pIRS-1 8.8 16.1 1.5 (1.1 to 2.1) 1.4 (1.0 to 2.0)
pGSK3β 3.4 3.4 0.07 (0.02 to 0.3) 0.1 (0.02 to 0.2)
pp70S6K 5.8 4.6 0.06 (0.01 to 0.6) 0.14 (0.07 to 0.3)
This article has not been copyedited and formatted. The final version may differ from this version.JPET Fast Forward. Published on March 8, 2011 as DOI: 10.1124/jpet.110.178400
at ASPE
T Journals on M
arch 12, 2019jpet.aspetjournals.org
Dow
nloaded from
JPET #178400
37
The maximum fold induction of IGF-1- or insulin-induced phosphorylation after 20-minute
stimulation with 200 nM IGF-1 or insulin was calculated by dividing the stimulation MSD assay
value by the non-stimulation MSD assay value for each phosphorylated marker.
EC50 = the concentration (nM) of IGF-1 or insulin required to achieve 50% maximal
phosphorylation, calculated using a sigmoidal dose-response equation (GraphPad Software, La
Jolla). The range in parenthesis is the 95% confidence interval for the curve fit.
An EC50 was not determined (ND) when the fold simulation was less than 3-fold.
This article has not been copyedited and formatted. The final version may differ from this version.JPET Fast Forward. Published on March 8, 2011 as DOI: 10.1124/jpet.110.178400
at ASPE
T Journals on M
arch 12, 2019jpet.aspetjournals.org
Dow
nloaded from

JPET #178400
38
Table 2. Correlation of Total IGF1R Pathway Markers Relative to tp70S6K After Ganitumab and Rapamycin Treatment
SJSA-1 SK-ES-1 A673
Marker hIgG1 Ganitumab hIgG1 Ganitumab hIgG1 Ganitumab
IGF1R 0.1 (0.11) 0.3 (0.8) 0.6 (0.9) 0.8 (0.9) 0.4 (0.91) 0.5 (1.0)
INSR -0.2 (0.7) 0.1 (0.3) 0.8 (0.9) 0.8 (0.9) 0.6 (0.9) 0.7 (1.0)
IRS-1 ND ND 1.1 (0.8) 1.2 (0.9) 0.2 (0.3) 0.4 (0.3)
Akt 0.7 (0.9) 0.5 (0.9) 0.9 (1.0) 0.8 (1.0) 0.7 (0.8) 0.7 (1.0)
GSK3β 1.0 (1.0) 0.9 (1.0) 1.0 (1.0) 0.9 (1.0) 1.0 (0.9) 0.9 ( 1.0)
The relative change of IGF1R, INSR, IRS-1, Akt, and GSK3β was plotted against tp70S6K, and
the slope of the line fit through the data was determined using GraphPad Prism software by
linear regression. The R2 value for each regression analysis is given in parenthesis. The total
protein levels were taken from the experiment shown in Figure 6 without normalization for cell
confluence. ND indicates that IRS-1 level was too low to generate significant data. Background
for all other markers was generally insignificant (<1% total signal).
This article has not been copyedited and formatted. The final version may differ from this version.JPET Fast Forward. Published on March 8, 2011 as DOI: 10.1124/jpet.110.178400
at ASPE
T Journals on M
arch 12, 2019jpet.aspetjournals.org
Dow
nloaded from
This article has not been copyedited and form
atted. The final version m
ay differ from this version.
JPET
Fast Forward. Published on M
arch 8, 2011 as DO
I: 10.1124/jpet.110.178400
at ASPET Journals on March 12, 2019 jpet.aspetjournals.org Downloaded from
This article has not been copyedited and form
atted. The final version m
ay differ from this version.
JPET
Fast Forward. Published on M
arch 8, 2011 as DO
I: 10.1124/jpet.110.178400
at ASPET Journals on March 12, 2019 jpet.aspetjournals.org Downloaded from
This article has not been copyedited and formatted. The final version may differ from this version.JPET Fast Forward. Published on March 8, 2011 as DOI: 10.1124/jpet.110.178400
at ASPE
T Journals on M
arch 12, 2019jpet.aspetjournals.org
Dow
nloaded from
This article has not been copyedited and form
atted. The final version m
ay differ from this version.
JPET
Fast Forward. Published on M
arch 8, 2011 as DO
I: 10.1124/jpet.110.178400
at ASPET Journals on March 12, 2019 jpet.aspetjournals.org Downloaded from
Recommended