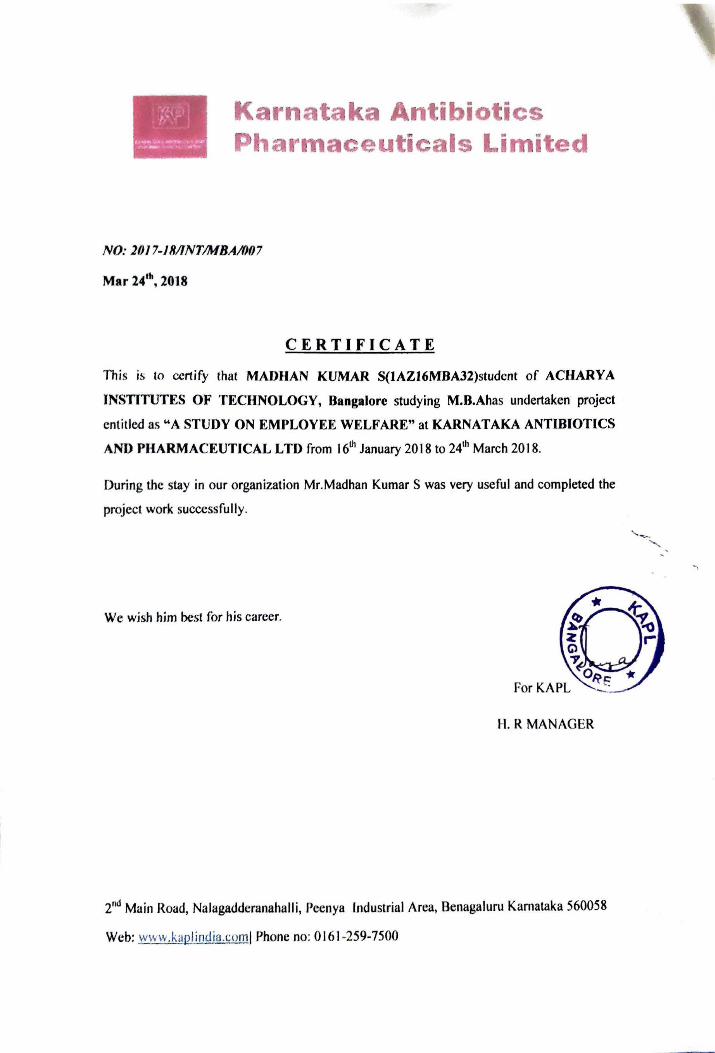
Karnataka Antibiotics Pharmaceuticals
NO: 20/ 7-JRITNTIMBA/007
Mar 24111, 2018
CERTIFICATE
imited
This i~ to certify that MADHAN KUMAR S(1AZJ6MBA32)studcnt of ACHARYA
INSTITUTES OF TECHNOLOGY, Bangalore studying M.B.Ahas undertaken project
entitled as "A STUDY ON EMPLOYEE WELFARE" at KARNATAKA ANTIBIOTICS
AND PHARMACEUTICAL LTD from 16th January 2018 to 241h March 2018.
During the stay in our organization Mr.Madhan Kumar S was very useful and completed the
project work successfully.
We wish him best for his career.
1-1. R MANAGER
2nd Main Road, Nalagaddcranahalli, Pcenya Industrial Area, Benagaluru Karnataka 560058
Web: www.kaplimJia.c:oml Phone no: 0161 -259-7500
,_

ACHARYA INSTITUTE OF TECHNOLOGY
(Affiliated to Visvesvaraya Technological University, Belagavi, Approved by AICTE, New Delhi and Accredited by NBA and NAAC)
Date: 25/05/2018
CERTIFICATE
This is to certify that Mr. Madhan Kumar S bearing USN
1AZ16MBA32 is a bonafide student of Master of Business Administration
course of the Institute 2016-18 batch, affiliated to Visvesvaraya
Technological University, Belgaum. Project report on "A Study on
Employee Welfare with Reference to Karnataka Antibiotics and
Pharmaceuticals Ltd, Bangalore" is prepared by him under the guidance of
Prof. Reena Mahesh Rao, in partial fulfillment of the requirements for the
award of the degree of Master of Business Administration, Visvesvaraya
Technological University, Belgaum, Karnataka.
Signature of Internal Guide
k
0trJ ' ~ ~ature of];;;f
d of the Department Department of MBA
Acharya Institute of Technolol~; .. ;;oldevanahlli. Ba•galore-S80 107
~ ~,r Signnture of Princif'c1l
PRINCIPAL t;CHARYA INSTITUTE OF TEL,rn~OLOGY Soldavanahalli Bangalcre-560 107
Acharya Or. Sarvepalli Radhakrishnan Road, Soladevanahalli, Acharya PO., Bangalore 560 107, Karnataka, India • www acharya.ac.in/ait/ • Ph: +91-80-225 555 55 Extn. : 2102 • Fax: +91-80-237 002 42 • E-mail: [email protected]

DECLARATION
I, MADAN KUMAR S bearing USN 1AZ16MBA42 hereby declared that the project report
entitled " EMPLOYEE WELFARE with reference to "KAPL Ltd" prepared by me under the
guidance of Prof.RE}:::NA MAHESH, facvlty of MBA Department, AIT and external assistance
by .TA GA DISH C HI REMA TH HR Manager-KAPL Ltd. I also declare that this project work is
toward the partial fulfillment of the university Regulations for the de~ree of Master of ijusiness
Administration by Visvesvaraya Technological University, Belgaum. I have undergone a
summer project for the period of ten weeks. I further declare that this project is based on the
original study undertaken by me and has not been submitted for the award of any degree/diploma
from any other University/ Institution.
Place: Bangalore Signature of the Student

ACKNOWLEDGEMENT
I would like to thank my people who have helped and supported me while doing my Project
report and work.
There is not enough word to offer vote of thanks to Dr. Nijaguna G, Head of the Department of
MBA, AIT Bengaluru for his help in initiating the project report in advance for the regular
motivation, my guides Prof. Reena Mahesh faculty of MBA Department, AIT Bengaluru and
Mr,Jagadish C Hiremath Manager, KAPL Ltd for their admirable help, suggestions and opinions
on the contribution during and after the project report period.
Place: Bengaluru Madhan kumar S
Date: USN: 1AZ16MBA32

TABLE OF CONTENTS
CHAPTER
NO.
CHAPTERS PAGE
NO.
EXECUTIVE SUMMARY 1
1 INTRODUCTION
1.1. INTRODUCTION 3
1.2. INDUSTRY PROFILE 3
1.3. COMPANY PROFILE 3-4
1.4. VISION AND MISSION 5
1.5. PRODUCT AND SERVICES
6-7
1.6. AREAS OF OPERATION 7
1.7 INFRASTRUCTURE FACILITIES
7
1.8 COMPETITORS INFORMATION 8
1.9 SWOT Analysis 8-10
1.10 Future Growth And Prospective 10
2
Conceptual Background And Literature Review
11
2.1 Theoretical Background Of The Study 12
2.2. Literature Review 13-16
3 Research Design 17
3.1. Statement Of Problem 18
3.2. Need For The Study 18
3.3 Objective
19
3.4 Scope Of The Study 19

3.5 Research Methodology 19-20
3.6 Hypotheses 20-22
3.7 Limitation 22
4 DATA ANALYSIS AND INTERPRETATION
23-48
5 SUMMARY OF FINDINGS, SUGGESTIONS AND
CONCLUSION
49
5.1. FINDINGS 50
5.2. SUGGESTIONS 51
5.3. CONCLUSION 51
BIBLIOGRAPHY
ANNEXURE
LIST OF TABLES
TABLE
NO.
TITLES PAGE NO.
4.1 Table showing Specify the level of satisfaction towards the work
environment
24
4.2 Table shoingDrinking water facility
25
4.3 Table showing Safety measure
26
4.4 Table showing Medical and first aid facilities
27
4.5 Table showing Settlement of grievances and complains
28
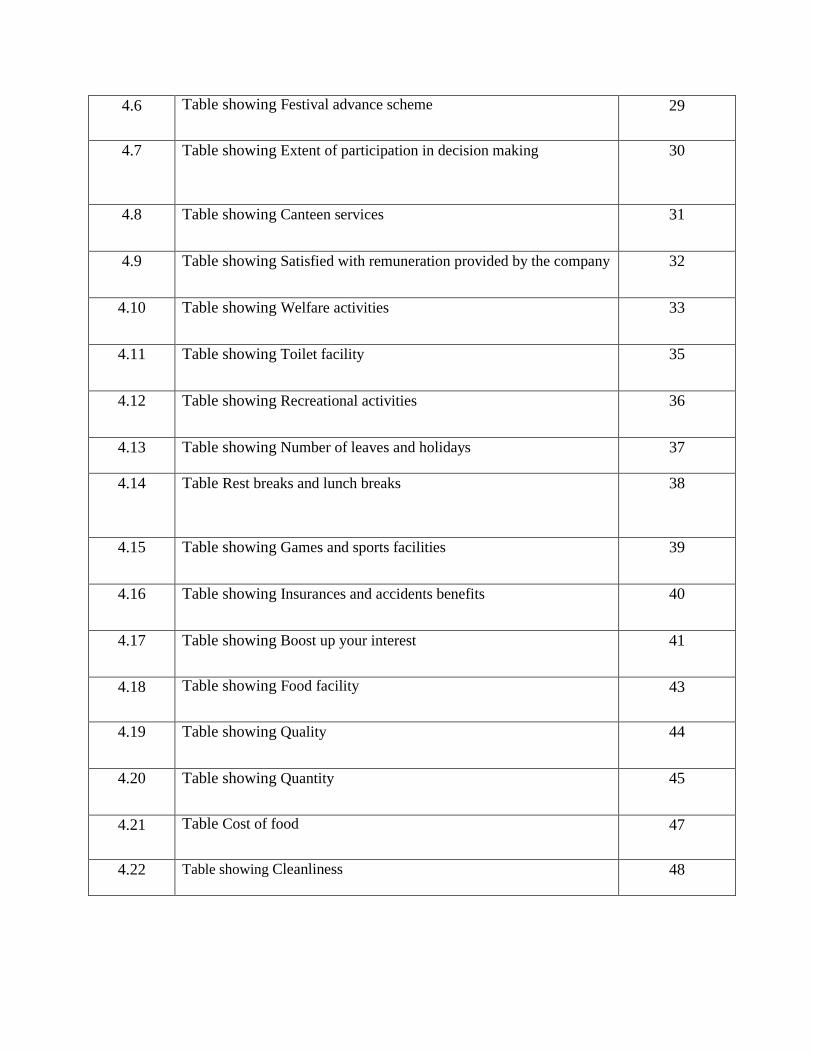
4.6 Table showing Festival advance scheme
29
4.7 Table showing Extent of participation in decision making
30
4.8 Table showing Canteen services
31
4.9 Table showing Satisfied with remuneration provided by the company
32
4.10 Table showing Welfare activities
33
4.11 Table showing Toilet facility
35
4.12 Table showing Recreational activities
36
4.13 Table showing Number of leaves and holidays 37
4.14 Table Rest breaks and lunch breaks
38
4.15 Table showing Games and sports facilities
39
4.16 Table showing Insurances and accidents benefits
40
4.17 Table showing Boost up your interest
41
4.18 Table showing Food facility
43
4.19 Table showing Quality
44
4.20 Table showing Quantity
45
4.21 Table Cost of food
47
4.22 Table showing Cleanliness
48
LIST OF GRAPHS AND FIGURES
GRAPH. TITLES PAGE NO.
4.1 Graph showingSpecify the level of satisfaction towards the work
environment
24
4.2 Graph showing Drinking water facility
25
4.3 Graphshowing Safety measure
26
4.4 Graph showing Medical and first aid facilities
27
4.5 Graphshowing Settlement of grievances and complains
28
4.6 Graph showing Festival advance scheme
29

4.7 Graph showing Extent of participation in decision making
30
4.8 Graph showing Canteen services
31
4.9 Graph showing Satisfied with remuneration provided by the company
32
4.10 Graph showing Welfare activities
33
4.11 Graph showing Toilet facility
35
4.12 Graph showing Recreational activities
36
4.13 Graph showing Number of leaves and holidays
37
4.14 GraphRest breaks and lunch breaks
38
4.15 Graph showing Games and sports facilities
39
4.16 Graph showing Insurances and accidents benefits
40
4.17 Graph showing Boost up your interest
41
4.18 Graph showing Food facility
43
4.19 Graph showing Quality
44
4.20 Graphshowing Quantity
45
4.21 GraphCost of food
47
4.22 Graph showing Cleanliness
48

1
EXECUTIVE SUMMARY Employee welfare is a process taking actions to encourage and motivate workers in the
organisation. It is process in which the employee of the organisation are engaged to stay for a
long run. There are various factors that affect the employee welfare. Several employee welfare
strategies have been implied in order to motivate and encourage the employees to continue with
the organisation for many years.
Employees of today are very different. They tend not to miss opportunity, if they are dissatisfied
with their present job, they tend to change it to the next job which has better prospect and future.
Thus, it is the responsibility of the management to retain the potential employees. A good
management to know how to engage attract and retain employees in the organisation.
The study talks about employee welfare theoretical along with new idea and views that in trend
now. It deals identifying the factors that affect the employee welfare in the organisation. Many
factors like canteen facility benefits working conditions manual review and feedback, etc., are
taken into account.

2
CHAPTER-1
INTRODUTION

3
1.1. INTRODUCTION
Welfare is all about comfortable living at work place and feeling comfortable at working situation.
employee welfare that meansto make better life worth living for workers with inorganization.In an
organization people are the most important assets and an organization should record the value then
they should maintain the outlay of people working in the firm by the accounting profession. The
value of human assets are as important as machinery in the organization as machines need repairs
etc, same way human assets need more investments on their training and welfare activities and
further in training and development etc, and expenditure on welfare activities can be added to
investment separately. Employee welfare means taking care of workman intellectually or socially
and things done foe the improvement and comfort of the worker over and above wage pay which is
not compulsorily followed my the industry or organization.
1.2. INDUTRIAL PROFILE:
This type of industry produces life saving chemicals like antibiotics and drugs, antibiotics and
pharmaceuticals industry is an manufacturing sector industry. This industry mainly concentrate
on health of human beings and animals .this industry has maintained relationship with world
health organisation(WHO) it takes guidancethrough them and other national and local
authoritative bodies.
1.3. COMPANY PROFILE:
KAPL Karnataka antibiotics and pharmaceuticals limited is an manufacturing industry and they
are marketing about the product which ishelpful and life saving they manufacture healthy drug
which is saving many life all over country.
KAPL was established in1984, it has always given importance for its growth and its with ISO
accreditation. Company gives commitment of value and servicesinboth domestic market and
international market. And their facilities are approved by many international clients.
When we talk about its physical establishment land in peenya industrial area, Bengaluru. To
contribute to the environment in order to avoid the pollution which is generated by the industry
they have created some garden area and have planted some trees.

4
KAPL have also made their contribute in SWACHHA BHARAT ABHIYAN on 2nd
October
2014. All contributions towards the PMNRF are notified for 100% deduction from taxable
income under section 80G of the income tax act, 1961.
In order to recommend health requirement of our country they has formed committee. To reach
every state in the country and that should be available in every public sector units, institutions
and hospitals.KAPL is engaged in producing life saving drugs in the form of tablets, parenterals,
capsules, orals, dry powder.
KAPL as a joint Venture was consigned and established in 1981 with investment from central
government 59% state government through KSIIDC and remaining 41% was invested by the
company itself.

5
1.4. VISION,MISSION AND GOALS:
Vision:
To achieve commercial excellence in the field of quality drugs at reasonable prices. To
develop and maintain highly motivated human resources.
To generates internal and external financial resources to diversification projects.
Mission:
To have manufacturing services, complying with worldwide standards.
To make stronger the advertising efforts to achieve growth in exports and private trade market
every year.
To incessantly improve the value in products and services to enhance customer satisfaction.
Goals:
Promote their product and services to other country and market their product in other country.
To help people provide proper medicine and good health condition and less costly.

6
1.5. PRODUCTS AND SERVICES:
They have a very wide variety of product such as:
Tablets:
Moxybiotic kid
Monybiotic kid
Numol tablets
Emidon tablets
Quin tablets
Paracetaol tablets
Liquid injection tablet:
Gentamycin injection veal
Gentamycin injection ampoule
Nufrnac injection
Dry powder injectable:
Benzyl penicillin injection
Benzedrine penicillin injection
Certruax
Amplicillin injection
Cefotaxine injection
Kolamzan penicillin injection
Fortified procaine penicillin
Syrups:
Extol syrup
Vast syrup
Dycon syrup

7
Suspensions:
Remieic
Pediatric
Ampicilin for oral suspension
Capsules:
Zynfc capsule
Cyfolac capsule
Ointments:
Fubac
AG-X
Nufenac-gel
Only few of them have been taken as a sample
1.6. AREAS OF OPERATION:
They have been distributing there products all over the world in some places like
Germany, Denmark, Netherlands, Philippines, Ethiopia and Belgium.In domestic and
international.
1.7. INFRASTRUCTURE FACILITIES:
The KAPL have excellent infrastructure facility. The manufacturing industry which is
located at peenya is provided with 10 acres of land, machinery, chemical lab, furniture
and fixtures, garden area, computers etc. this are owned by company. Apart from this
they distribution centres and outlet units all over India and out of which 8 branches are
owned by the company and rest are given for lease basis. Vehicles are provided for
executives of company.
8
1.8. COMPERTITORS INFORMATION:
There are many competitors in this industry and some are listed here:
Ranbaxy
Glaxosmithkline
Nicholas
Aventis etc.
1.9. SWOT ANALYSIS:
Strength:
It has company goodwill.
It’s having strength of cooperative and good relationship between its entire
workforce those actively contribute to the growth and development of the
organization.
Continuous profit making.
Weakness:
Less marginal profit paid to different levels of distribution.
Low investment in innovative R&D
Huge gaps, tough to find the right resource
9
Major functioning procedures are manual in finance, marketing and administration.
Opportunity:
Marketing alliances to sell MNC’s products in domestic market.
Significant export potential
It has a wide spread markets for its products both from domestic to international
market.
Inject able drugs will drive market growth.

10
Threats:
Ever greening strategy of MNC’s to protect market loss due to expiry of patents.
Macro factors such as economy, will affect the base.
It is to be ever alert by the auditing bodies like internal, stationary, and government
auditors.
Quoting lower prices than competitors is not possible.
1.10 FUTURE GROWTH PROSPECTS:
KAPL recommendation to expand their industry make joint sector pharmaceutical and
also caters to the future needs. This nees was an innovative, organization structure to
have been suggested by the committee to face challenges and future requirements of the
industry.

11
CHAPTER-2
CONCEPTUAL BACKGROUND AND LITERATURE REVIEW
12
2.1 THEORETICAL BACKGROUND:
Today's laborer is ending up noticeably more aware of his power. Association like exchange
unions helps them being capable. The cutting edge idea of work welfare involve each one of
those exercises of the businesses which are matched towards furnish the representatives with
specific offices and administrations despite wages or pay rates.
In the nineteenth century, work requests were kindly stifled, yet those days are no more. The
requests of the laborer have now to be recognized, both on a good and functional plane. That
a plant proprietor must to come in riches, while the laborers, who worry for him, cower in
neediness, is today perceived as something faulty and dishonest.
Each business of work must make satisfactory activities of lodging and cleanliness, must
contain free restorative help and make doctor's facility treatment accessible for the wiped
out, motherhood consideration for the ladies representatives' ought to likewise be given.
An advantage of the welfare does not lie just with the laborers but rather in addition benefits
the businesses. Representative's turnover is decreased because of the arrangement of welfare
office. Legislative body appreciate their employments and work with a sentiment association
and fulfilment. Welfare administrations serve to keep up some peace with the workers
union.
One of the significant worries of the legislature has been the imperative of work welfare and
wellbeing with expanding efficiency and arrangement of a sensible level of government
managed savings.
Representative welfare movements in India are direly required in light of the fact that India
is a recent in reverse nation and the working conditions are not attractive in India ventures.

13
The laborers are poor and ignorant and for the most part reprimand for being flighty and
sluggish
2.2 REVIEW OF LITERATURE:
• Andreas Baldschun (Dec 2014), The purpose of the paper is togenerate awareness of
child welfare and also the description of the model’s seven dimensions of well-being
which are affective , social, professional, cognitive, personal, and psychological well
being.
• Baker. C Richard, Hayes, Rick Stephan(1995), An experiment was conducted on
negative effect caused because of economic decisions engagedby labour welfare which
was handled by corporate management for the accounting stranded.
• Bh. VenkateshwaraRao, J. Durga Prasad (2013), this article states that the coal mining is
the most hazardous operations. Miners are open to danger from various hazards like
explosions, roof falls, noxious gases, etc.. And all these characteristics of the mining
make it more significant for the welfare measures.
• Binquin Li and HuaminPeng (November 2006), In this research, limits that relying
solely on formal social protection schemes which tackle the susceptibility of the workers
from rural regions. It shows the problems that are under the organization its self and also
the problems related to social security.
• Deborah Walker, Stephen La Garden Mark Neilio (Dec 2008), the paper provides an
overview of current development in the area of employee benefits, that include executive
compensation, qualified plans and welfare benefits.
• Deborah walker, oh hyuck, stephen la graden (Dec 2011), This article is two part article
and this talk about the important developments in 2010 and 2011 in labour benefits, that
includes executive recompense, qualified plans, employment taxes, health and welfare
benefits.

14
• Dylan, Michelle Lynn (2002), The goal of the research was to analyze the dependent
variables that makes a demand factors critical to the predicted economic success of
welfare recipients.
• Irwin B.Horwitz, and BRIAN P. McCall, (1990-1997), Investor were interested in
finding out whether the demographic factors are associated with the accident risk and
found that female workers are having higher rate of fatalities as compared to male
workers.
• James W.Yeates (2010), this paper talks about the general saying “death is not a welfare
issue” and it has also been included in welfare legislation and policy in various
countries.
• Javier Irizarry, George Washington, Carver Doctoral Fellow, DULCY M. Abraham ,
Post-Doctoral Research engineer, Carlos Arboleda, Geaduatestudy Assistant. This Paper
describes the analysis of the analysis of the operation in trenching that is not fully
addressed in the OSHA inspection.
• Joel C. (2003), The comparative study was conducted to see the insights of the degree of
the relationship between perceptions and commitment of the organizational support,
with the presence of differences between the various groups of participants with respect
to their commitment and perceptions.
• Laura Leete,NeilBania(1999), This paper talks about developing a market of local
• labour information system that assess the effects of labour market on recently adopted
welfare laws.
• Paul oysterman (Jan 2000), this paper talks about the HPWO practices and its impact on
the productivity and quality gains for the employees benefit.

15
• PeotikBasu, ShovanChowdhury, Paeveen Ahmed Alam (Sep 2015), this model describes
about the need to achieve more with less number of people in the organization environment.
The model was tested and a positive impact of flexibility was found.
• PgMdSalleh, AkMdHasnolAlwee(2015), The purpose of the study is to provide views onto
the different levels of financial literacy in Brunei by focusing on welfare recipients.
• Prasad. Y Ramakrishna (Jul/sept 2014), the study was conducted to determine the explicit
attributes of employee satisfaction towards the measures of welfare and analyse the affect of
the welfare measures in improving the productivity in a sugar industry.
• Pratibha Joshi, Prommila Sharma, T.C and AmitKhatter (April-June, 2012), Multiple
responses were observed of the workers out of which 45%-20% consist of the
construction activities and around 16%were belonging to supervision group and safety
management. Further it was found that respondents decided that hazards the construction
site can removed with the use of PPE and its different kinds which are used for the
protection of the eyes and face which includes impact goggles, safety glasses, chemical
goggles, etc.
• ShriSarbeswaraSahoo, Construction sectors involves work that are unsafe like wring in
an excess height, welding, carry staff to higher place without the use of technology.
Death and injury from those accidents in Indian construction sector are the most and it is
found that 40% of the deaths are due to fall from heights.
• Tracey Dickson, Jeremy Huyton (2008), the study was conducted to examine the extent
to which the employee welfare measures and human resource management ha an impact
on the customer service.
• Valerie K.Kepner (2009), this research was conducted to determine the migration effect
of the various new incentives at the individual responsibility and job opportunity
settlement act (PRWORA).

16
• Vater, A. Joseph (May/Jun 2002), The recent developments have showed that it is
important that employee benefits professionals should be aware of the impact that the
discrimination statues have on health and welfare also on pension plans.
• Vibhapandey, Kankwadhwani (Jan/mar214), this paper studies the various attributes of
Raymond limited. It concentrates on the various welfare measures for the employees in
Raymond limited.
• W. Susan Hicks (Dec 1992), this article talks about AICPA’S statements of position
which are the sources of generally accepted accounting principles.
• Weikel-Morrison, David Alexander (2002), Due to the shortage of the workers in public
child welfare companies in California, the researcher chose to study on the employee job
satisfaction, retention and turnover in central San Joaquin valley.
• Wilson, BusseyBernice(1998), The study was conducted to examine employer’s insight
of contributing factors their participation and also the factors they felt that pretentious
welfare recipients entry into their labour force.

17
CHAPTER 3
RESEARCH DESIGN

18
3.1 Statement Of The Problem:
Topic “A STUDY ON EMPLOYEE WELFARE”
If the workers are uncomfortable in working place they cannot perform there level best in
work same as if the working condition and environment are good in there required to work
the performance of the employee will be better through this the productivity and
improvement in working condition will increase. Welfare facilities provided to workers
willbemorale of the employee and consequent growth in the efficiency and reduction in cost.
Management tings that providing employee welfare will be tool for achievingthere goal or
way to reach their aim.
3.2 NEED FOR THE STUDY:
Workers are facet for organization. To boost and motivate them employer should take care and
provide some facilities to keep them happy so that they can match up with the cost of living.
Employee welfare should be there in every organization so that it can take care of employee’s
health, safe and same while it helps in training and development too.
The welfare measure is needed due to socio economic conditions in industry sector.
Therefore a study is done on employee welfar
19
3.3. OBJECTIVES:
To analyze the level of satisfaction towards welfare facility provided to worker.
To study different aspects involved in employee welfare.
To examine the opinion of employees towards the welfare services provided in the
organization.
To suggest various intervening process thought which employee welfare can be
enhance.
3.4 SCOPE OF THE STUDY:
Study covers 50 respondents who are employees of KAPL. The scope of study is limited only to
employees of KAPL to study and understand the facility provided to them.
3.5. RESEARCH METHODOLOGY:
. Research Design:
Descriptive research design has been adopted for this study. It’s adopted because it deals with
the present suction.
Data And Sources Of Data:
Primary data- primary data should be collected through personal interviews with the important
person in HRD department by asking related questions.
Tools for data collection – The research tool usedfor this project is through questionnaires. The
questionnaires designed for this study was structure and it consisted of multiple choice and close
ended question.

20
. Sampling Techniques:
Population size – 750 employees.
Sample size – A sample of 50 employees will be considered.
Period –02/01/2017 to 10/03/2017
3.6 Hypothesis
Hypothesis testing:
H0: there association between satisfaction towards recreational activities and welfare
facilities is insignificant
H0: there association between satisfaction towards recreational activities and welfare
facilities is significant
Correlations
12) Iam
satisfied with 10) Iam
The satisfied with
recreational welfare
Activities facilites
arranged by conducted by
the company company
12) Iam satisfied with Pearson
1 .801**
the recreational Correlation
activities arranged by Sig. (2-tailed) .000 the company
N 50 50
10) Iam satisfied with Pearson .801
** 1 welfare facilites Correlation
conducted by company Sig. (2-tailed) .000
N 50 50 **. Correlation is significant at the 0.01 level (2-tailed).
21
Interpretation:
Employees are satisfied with recreation facilities and welfare facilities conducted by the
company with the significant level 0.00 which is less than 0.01. the result is significant. This
means company is providing all the recreational facilities and required welfare facilities to all the
employees.
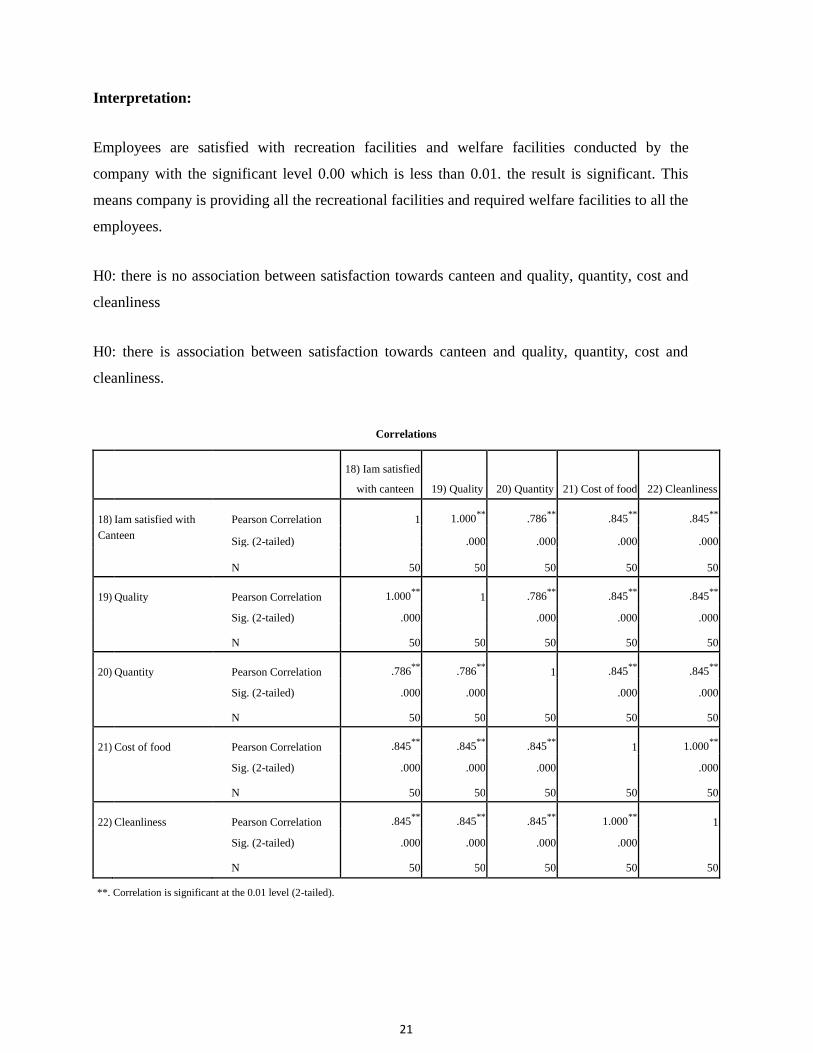
H0: there is no association between satisfaction towards canteen and quality, quantity, cost and
cleanliness
H0: there is association between satisfaction towards canteen and quality, quantity, cost and
cleanliness.
Correlations
18) Iam satisfied
with canteen 19) Quality 20) Quantity 21) Cost of food 22) Cleanliness
18) Iam satisfied with Pearson Correlation 1 1.000**
.786**
.845**
.845**
Canteen Sig. (2-tailed)
.000 .000 .000 .000
N 50 50 50 50 50
19) Quality Pearson Correlation 1.000**
1 .786**
.845**
.845**
Sig. (2-tailed) .000 .000 .000 .000
N 50 50 50 50 50
20) Quantity Pearson Correlation .786**
.786**
1 .845**
.845**
Sig. (2-tailed) .000 .000 .000 .000
N 50 50 50 50 50
21) Cost of food Pearson Correlation .845**
.845**
.845**
1 1.000**
Sig. (2-tailed) .000 .000 .000 .000
N 50 50 50 50 50
22) Cleanliness Pearson Correlation .845**
.845**
.845**
1.000**
1
Sig. (2-tailed) .000 .000 .000 .000
N 50 50 50 50 50
**. Correlation is significant at the 0.01 level (2-tailed).

22
Interpretation:
The above table shows that there is positive significant relationship between satisfaction level
towards canteen and quality, quantity, cost and cleanliness with the significant level 0.00 which
is less than 0.01. Canteen is also one of the components of employee welfare. This shows that
employees are satisfied with the canteen facility.
3.7.LIMITATIONS OF THE STUDY:
• Study is applicable only for KAPL employees, Bangalore area
• Analysis of the information is formulated based on the responses received assuming that the
data provided is accurate
• Some of the respondents were reluctant to respond to certain questions.
23
CHAPTER-4
DATA ANALYSIS AND INTERPRETATION

24
1. Specify the level of satisfaction towards the work environment
Table 4.1 Specify the level of satisfaction towards the work environment
PARTICAULARS RESPONDENTS PERCENTAGE
Extremely satisfied 30 60
Satisfied 10 20
Average 7 14
Dissatisfied 3 6
Extremely dissatisfied 0 0
Chart 4.1. Satisfaction towards the work environment
Work Environment
70
60
50
40
30
20
10
0
Extremely Satisfied Average Dissatisfied Extremely
satisfied dissatisfied
Interpretation:
As per the graph it inferred, majority of the respondents are extremely satisfied with their
work environment.

25
2. Specify the level of satisfaction towards the drinking water facility provided at
workplace Table 4.2. Drinking water facility
PARTICAULARS RESPONDENTS PERCENTAGE
Extremely satisfied 40 80
Satisfied 7 14
Average 3 6
Dissatisfied 0 0
Extremely dissatisfied 0 0
Graph 4.2.Drinking water facility
Drinking water
90
80
70
60
50
40
30
20
10
0
Extremely satisfied Satisfied
Average
Dissatisfie
d
Extremely dissatisfied
Interpretation:
As per the graph, majority of the respondents are extremely satisfied with drinking water
service provided at work place.
26
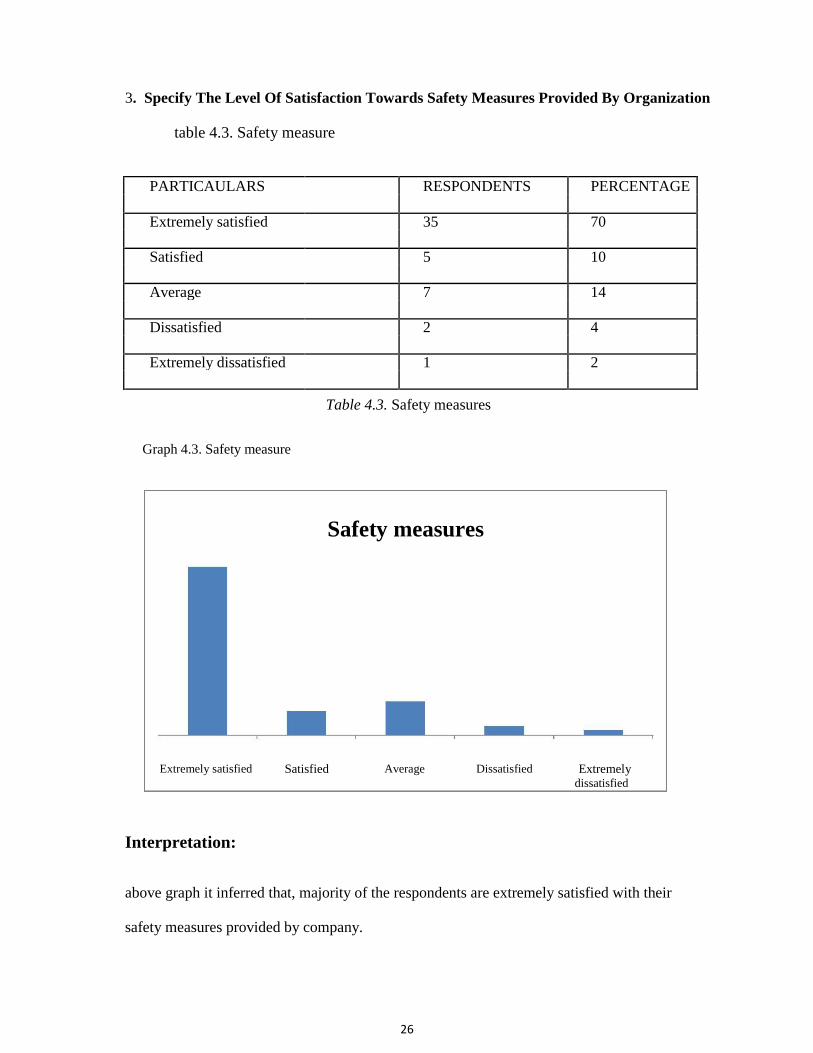
3. Specify The Level Of Satisfaction Towards Safety Measures Provided By Organization
table 4.3. Safety measure
PARTICAULARS RESPONDENTS PERCENTAGE
Extremely satisfied 35 70
Satisfied 5 10
Average 7 14
Dissatisfied 2 4
Extremely dissatisfied 1 2
Table 4.3. Safety measures
Graph 4.3. Safety measure
Safety measures
Extremely satisfied
Satisfied
Average
Dissatisfied
Extremely dissatisfied
Interpretation:
above graph it inferred that, majority of the respondents are extremely satisfied with their
safety measures provided by company.

27
4. Specify the level of satisfaction towards the medical and first aid facilities at workplace.
Table 4.4.Medical and first aid facilities
PARTICAULARS RESPONDENTS PERCENTAGE
Extremely satisfied 50 100
Satisfied 0 0
Average 0 0
Dissatisfied 0 0
Extremely dissatisfied 0 0
Graph 4.4.Medical and first aid facilities
First aid facilities
120
100
80
60
40
20
0
Extremely Satisfied Average Dissatisfied Extremely
satisfied dissatisfied
Interpretation
From the above graph it inferred that, majority of the respondents are extremely satisfied
with their Medical and first aid facilities.
28
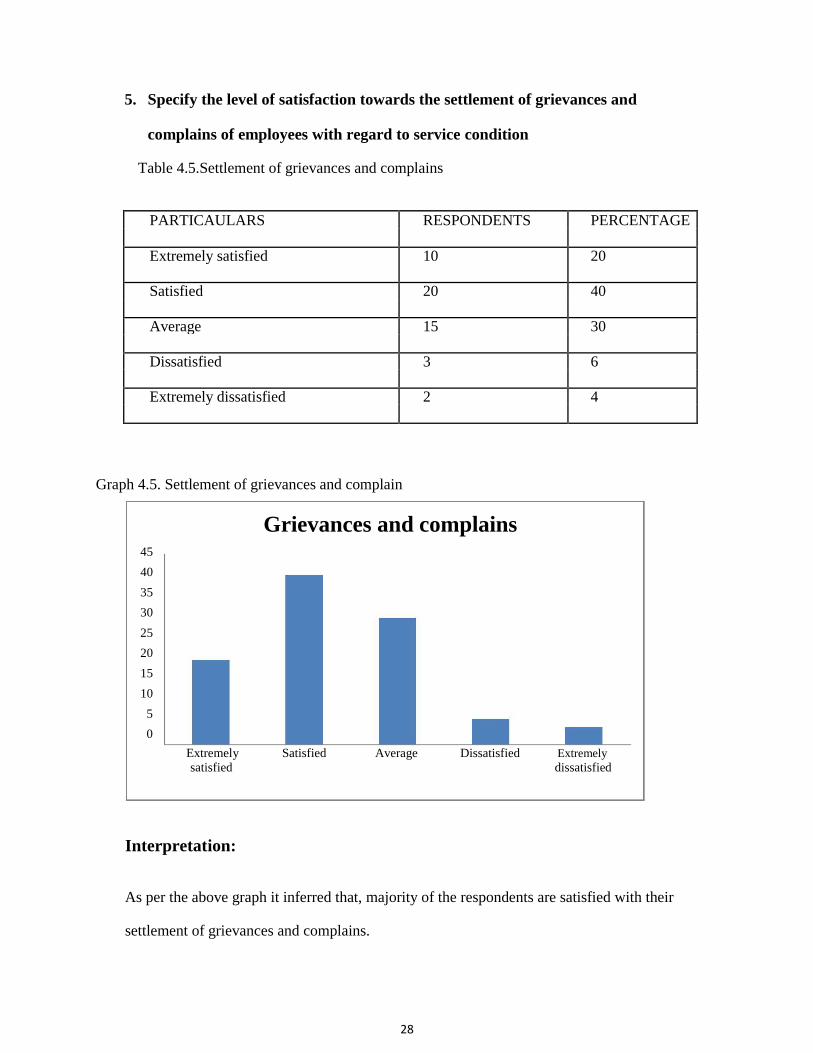
5. Specify the level of satisfaction towards the settlement of grievances and
complains of employees with regard to service condition
Table 4.5.Settlement of grievances and complains
PARTICAULARS RESPONDENTS PERCENTAGE
Extremely satisfied 10 20
Satisfied 20 40
Average 15 30
Dissatisfied 3 6
Extremely dissatisfied 2 4
Graph 4.5. Settlement of grievances and complain
Grievances and complains
45
40
35
30
25
20
15
10
5
0
Extremely Satisfied Average Dissatisfied Extremely
satisfied dissatisfied
Interpretation:
As per the above graph it inferred that, majority of the respondents are satisfied with their
settlement of grievances and complains.
29
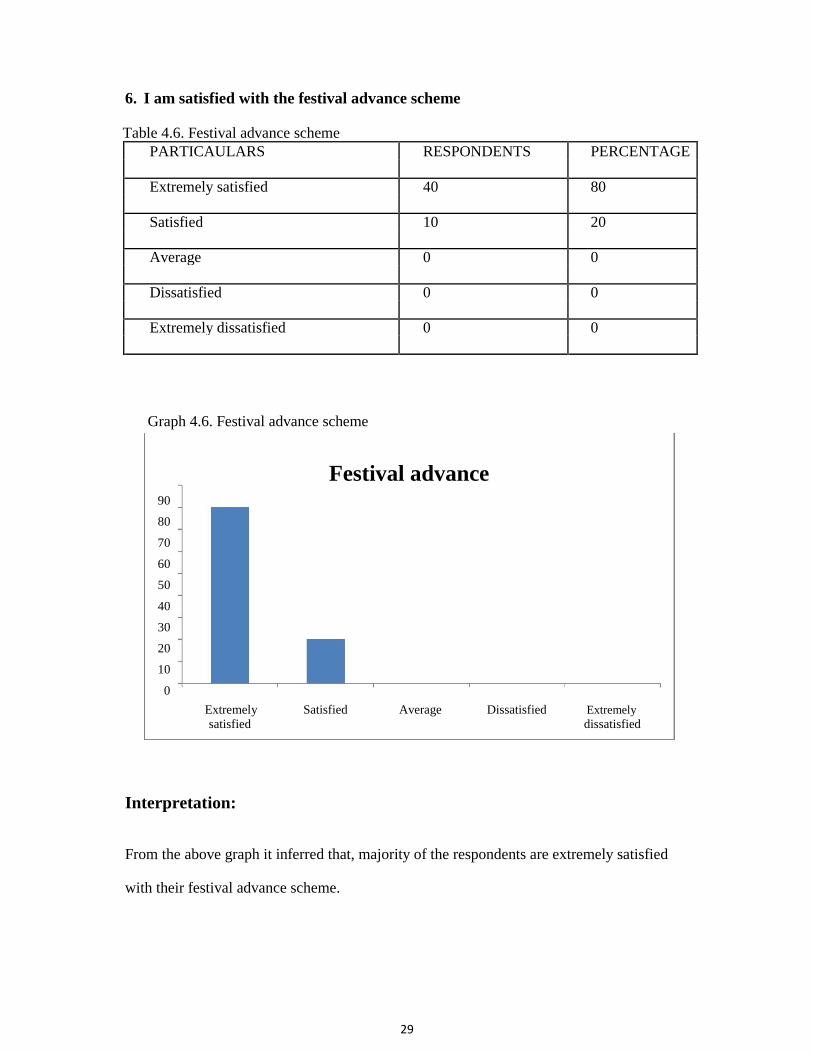
6. I am satisfied with the festival advance scheme Table 4.6. Festival advance scheme
PARTICAULARS RESPONDENTS PERCENTAGE
Extremely satisfied 40 80
Satisfied 10 20
Average 0 0
Dissatisfied 0 0
Extremely dissatisfied 0 0
Graph 4.6. Festival advance scheme
Festival advance
90
80
70
60
50
40
30
20
10
0
Extremely Satisfied Average Dissatisfied Extremely
satisfied dissatisfied
Interpretation:
From the above graph it inferred that, majority of the respondents are extremely satisfied
with their festival advance scheme.

30
7. I am satisfied with the extent of participation in decision making
Table 4.7. Extent of participation in decision making
PARTICAULARS RESPONDENTS PERCENTAGE
Extremely satisfied 30 60
Satisfied 10 20
Average 7 14
Dissatisfied 3 6
Extremely dissatisfied 0 0
Graph 4.7. Extent of participation in decision making
Decision making
70
60
50
40
30
20
10
0
Extremely Satisfied Average Dissatisfied Extremely
satisfied dissatisfied
Interpretation:
As per the above graph it inferred that, majority of the respondents are extremely satisfied
with theirextent of participation in decision making.

31
8. I am satisfied with the canteen services provided by the company
Table 4.8.Canteen services
PARTICAULARS RESPONDENTS PERCENTAGE
Extremely satisfied 10 20
Satisfied 10 20
Average 25 50
Dissatisfied 0 0
Extremely dissatisfied 5 10
Graph 4.8.Canteen services
Canteen services
60
50
40
30
20
10
0
Extremely satisfied
Satisfied
Average
Dissatisfied
Extremely dissatisfied
Interpretation:
From the above graph it inferred that, majority of the respondents said averageabout the
canteen services.

32
9. I am Satisfied with remuneration provided by the company Table 4.9.Remuneration
PARTICAULARS RESPONDENTS PERCENTAGE
Extremely satisfied 30 60
Satisfied 20 40
Average 0 0
Dissatisfied 0 0
Extremely dissatisfied 0 0
Graph 4.9.Remuneration
Remuneration
70
60
50
40
30
20
10
0
Extremely satisfied
Satisfied
Average
Dissatisfied
Extremely dissatisfied
Interpretation:
From the above graph it inferred that, majority of the respondents are extremely satisfied with
theirremuneration provided by the company.
33
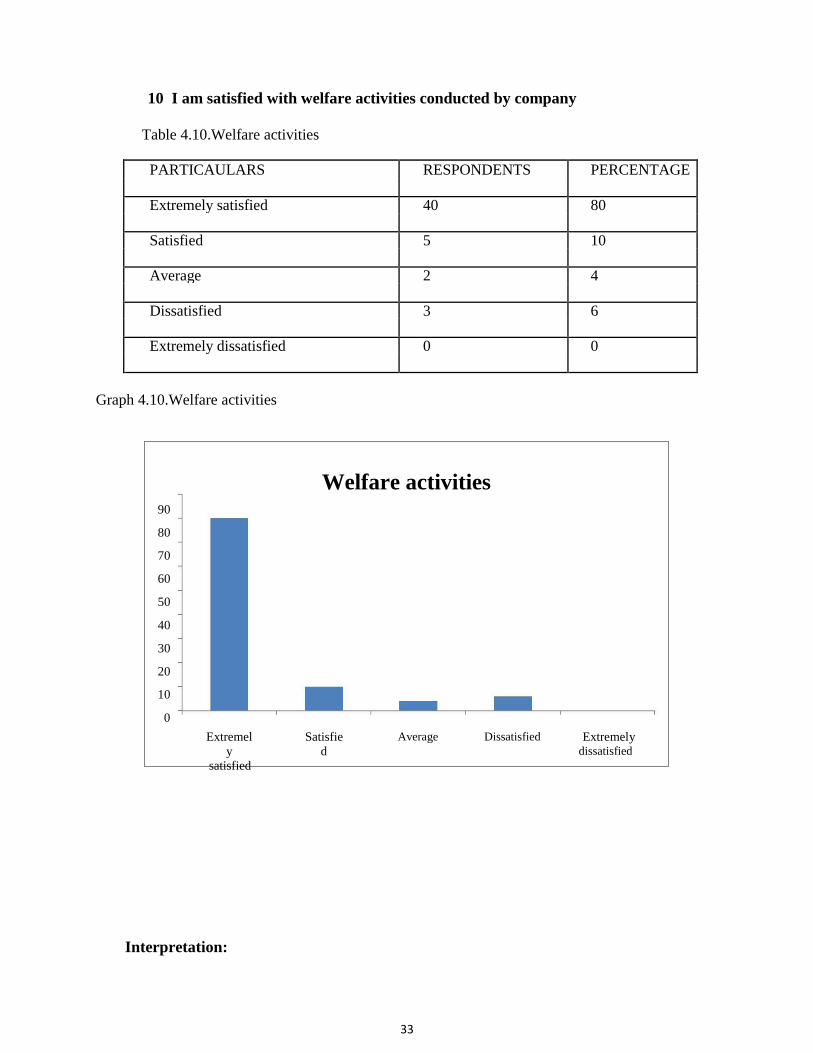
10 I am satisfied with welfare activities conducted by company
Table 4.10.Welfare activities
PARTICAULARS RESPONDENTS PERCENTAGE
Extremely satisfied 40 80
Satisfied 5 10
Average 2 4
Dissatisfied 3 6
Extremely dissatisfied 0 0
Graph 4.10.Welfare activities
Welfare activities
90
80
70
60
50
40
30
20
10
0
Extremel
y
satisfied
Satisfie
d
Average
Dissatisfied
Extremely
dissatisfied
Interpretation:

34
From the above graph it inferred that, majority of the respondents are extremely satisfied with their
welfare activities conducted by company
35
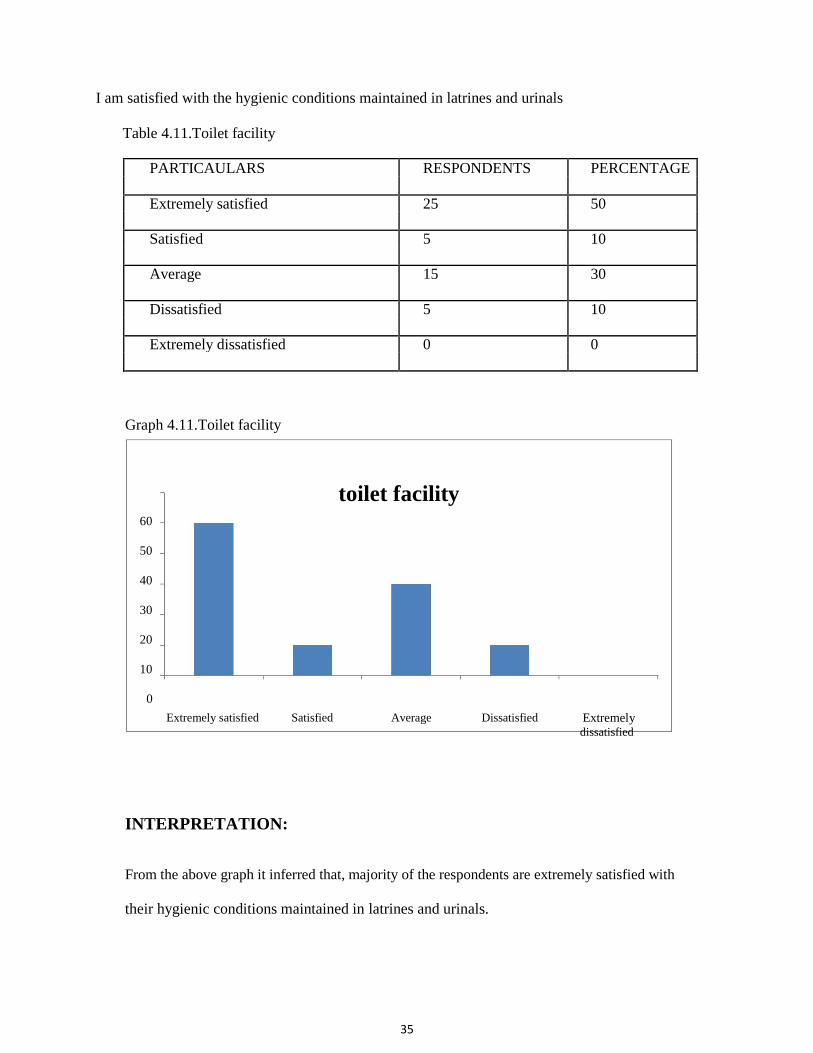
I am satisfied with the hygienic conditions maintained in latrines and urinals
Table 4.11.Toilet facility
PARTICAULARS RESPONDENTS PERCENTAGE
Extremely satisfied 25 50
Satisfied 5 10
Average 15 30
Dissatisfied 5 10
Extremely dissatisfied 0 0
Graph 4.11.Toilet facility
toilet facility
60
50
40
30
20
10
0
Extremely satisfied
Satisfied
Average
Dissatisfied
Extremely dissatisfied
INTERPRETATION:
From the above graph it inferred that, majority of the respondents are extremely satisfied with
their hygienic conditions maintained in latrines and urinals.

36
10. I am satisfied with the recreational activities arranged by the company
Table 4.12.Recreational activities
PARTICAULARS RESPONDENTS PERCENTAGE
Extremely satisfied 30 60
Satisfied 15 30
Average 5 10
Dissatisfied 0 0
Extremely dissatisfied 0 0
Graph 4.12.Recreational activities
recreational activites
70
60
50
40
30
20
10
0
Extremely satisfied Satisfied Average Dissatisfied Extremely
dissatisfied
INTERPRETATION:
From the above graph it inferred that, majority of the respondents are extremely satisfied
with their recreational activities.
37
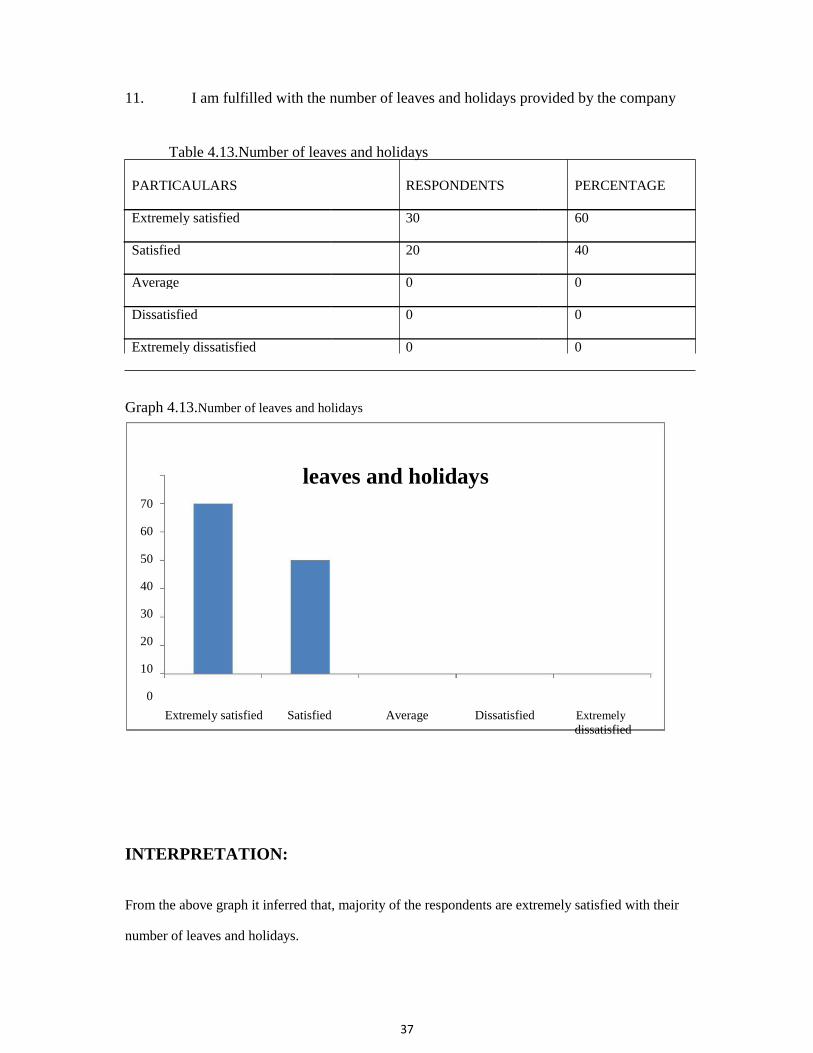
11. I am fulfilled with the number of leaves and holidays provided by the company
Table 4.13.Number of leaves and holidays
PARTICAULARS RESPONDENTS PERCENTAGE
Extremely satisfied 30 60
Satisfied 20 40
Average 0 0
Dissatisfied 0 0
Extremely dissatisfied 0 0
Graph 4.13.Number of leaves and holidays
leaves and holidays
70
60
50
40
30
20
10
0
Extremely satisfied Satisfied Average Dissatisfied Extremely
dissatisfied
INTERPRETATION:
From the above graph it inferred that, majority of the respondents are extremely satisfied with their
number of leaves and holidays.

38
12. Table showing satisfied with the rest breaks and lunch breaks provided by the
company
Table 4.14.Rest breaks and lunch breaks
PARTICAULARS RESPONDENTS PERCENTAGE
Extremely satisfied 40 80
Satisfied 10 20
Average 0 0
Dissatisfied 0 0
Extremely dissatisfied 0 0
Graph 4.14.Rest breaks and lunch breaks
rest breaks and lunch breaks
90
80
70
60
50
40
30
20
10
0
Extremely satisfied
Satisfied
Average
Dissatisfied
Extremely dissatisfied
INTERPRETATION:
From the above graph it inferred that, majority of the respondents are extremely satisfied with their
rest breaks and lunch breaks
39
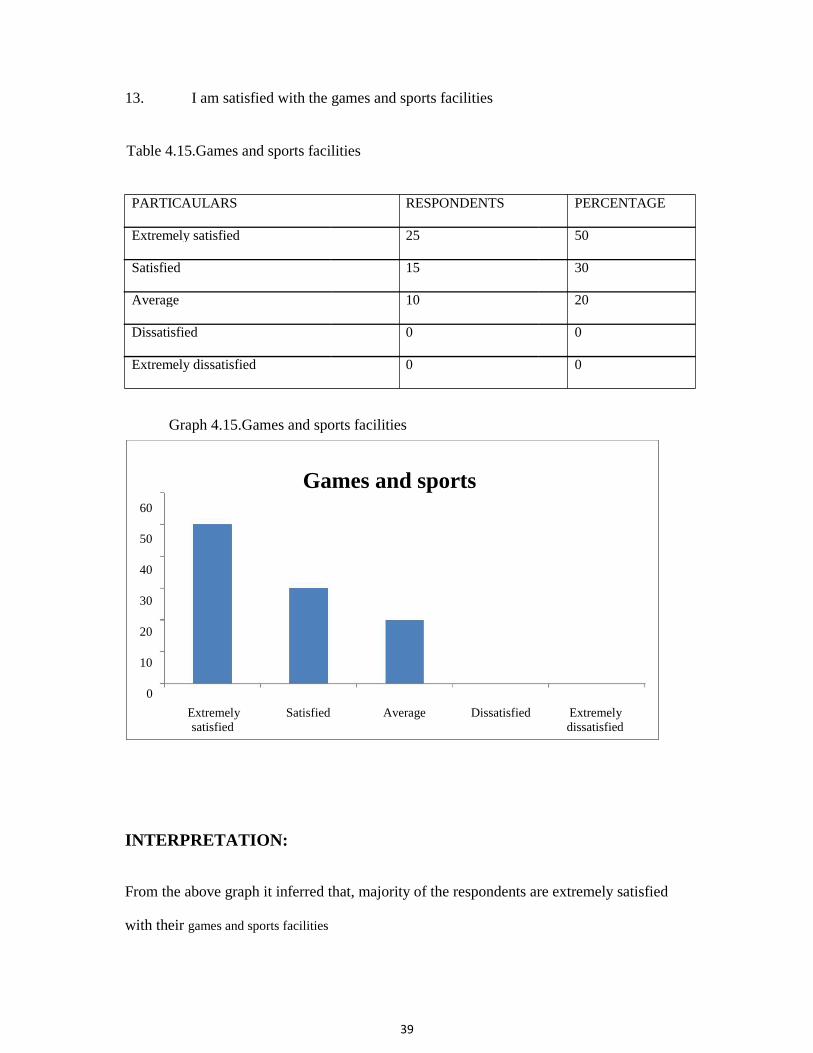
13. I am satisfied with the games and sports facilities
Table 4.15.Games and sports facilities
PARTICAULARS RESPONDENTS PERCENTAGE
Extremely satisfied 25 50
Satisfied 15 30
Average 10 20
Dissatisfied 0 0
Extremely dissatisfied 0 0
Graph 4.15.Games and sports facilities
Games and sports
60
50
40
30
20
10
0
Extremely Satisfied Average Dissatisfied Extremely
satisfied dissatisfied
INTERPRETATION:
From the above graph it inferred that, majority of the respondents are extremely satisfied
with their games and sports facilities
40
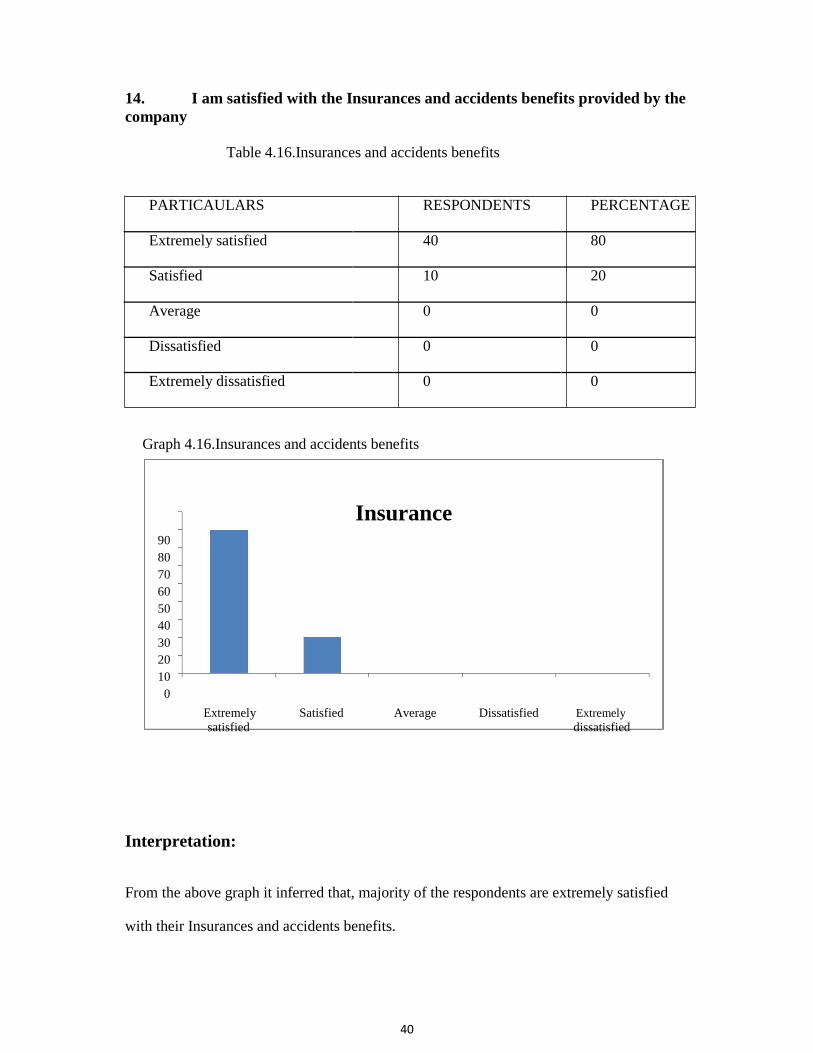
14. I am satisfied with the Insurances and accidents benefits provided by the
company
Table 4.16.Insurances and accidents benefits
PARTICAULARS RESPONDENTS PERCENTAGE
Extremely satisfied 40 80
Satisfied 10 20
Average 0 0
Dissatisfied 0 0
Extremely dissatisfied 0 0
Graph 4.16.Insurances and accidents benefits
Insurance
90 80 70 60 50 40 30 20 10 0
Extremely Satisfied Average Dissatisfied Extremely
satisfied dissatisfied
Interpretation:
From the above graph it inferred that, majority of the respondents are extremely satisfied
with their Insurances and accidents benefits.
41
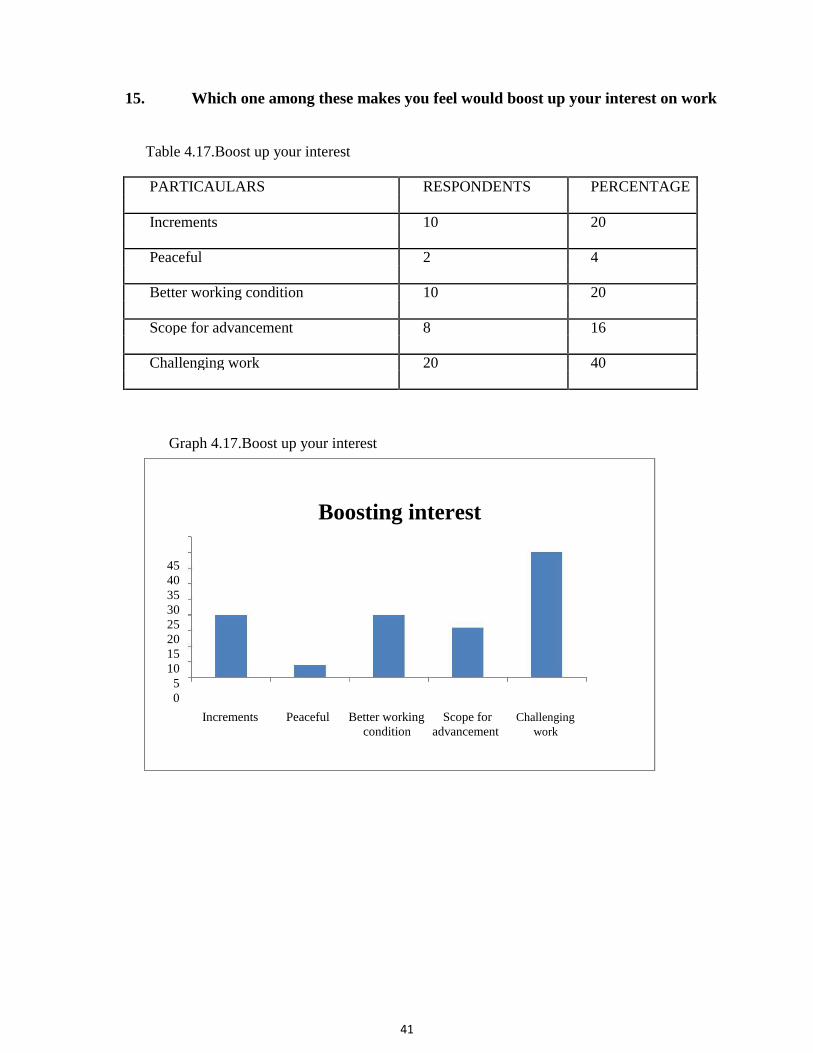
15. Which one among these makes you feel would boost up your interest on work
Table 4.17.Boost up your interest
PARTICAULARS RESPONDENTS PERCENTAGE
Increments 10 20
Peaceful 2 4
Better working condition 10 20
Scope for advancement 8 16
Challenging work 20 40
Graph 4.17.Boost up your interest
Boosting interest
45 40 35 30 25 20 15 10 5 0
Increments Peaceful Better working Scope for Challenging
condition advancement work

42
Interpretation:
From the above graph it inferred that, majority of the respondents are boosting up there
interest through challenging work.
43
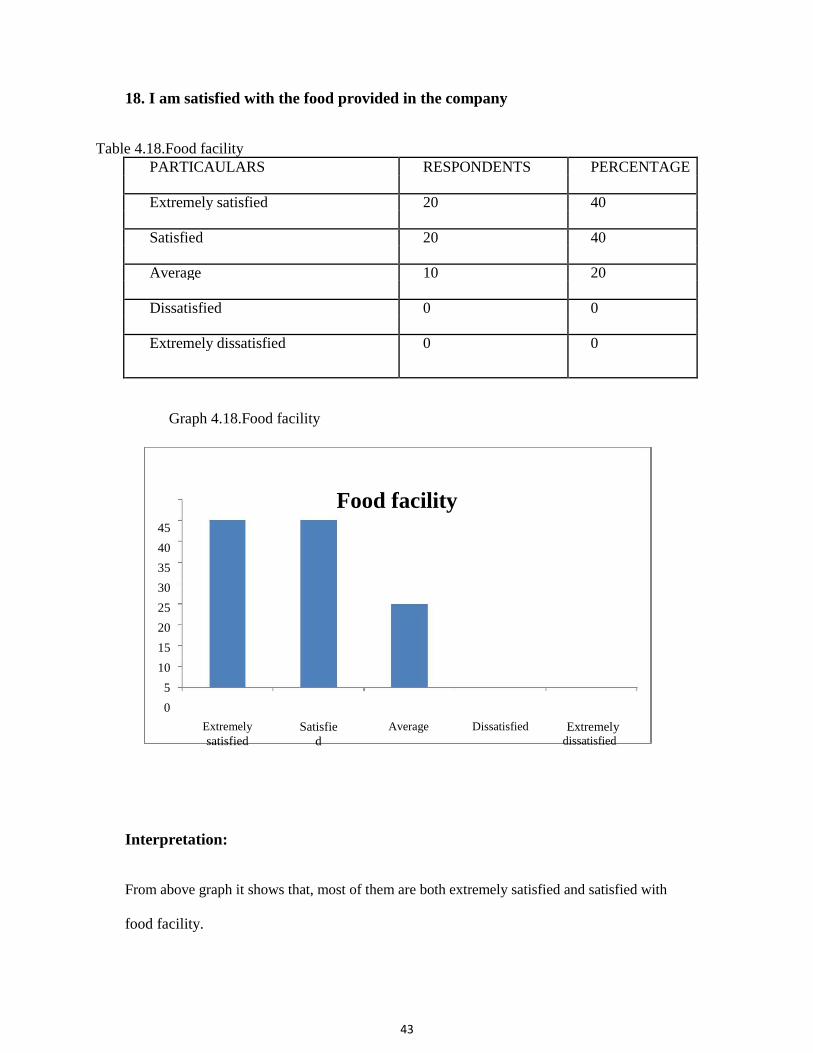
18. I am satisfied with the food provided in the company
Table 4.18.Food facility
PARTICAULARS RESPONDENTS PERCENTAGE
Extremely satisfied 20 40
Satisfied 20 40
Average 10 20
Dissatisfied 0 0
Extremely dissatisfied 0 0
Graph 4.18.Food facility
Food facility
45
40
35
30
25
20
15
10
5
0
Extremely satisfied
Satisfie
d
Average
Dissatisfied
Extremely
dissatisfied
Interpretation:
From above graph it shows that, most of them are both extremely satisfied and satisfied with
food facility.
44
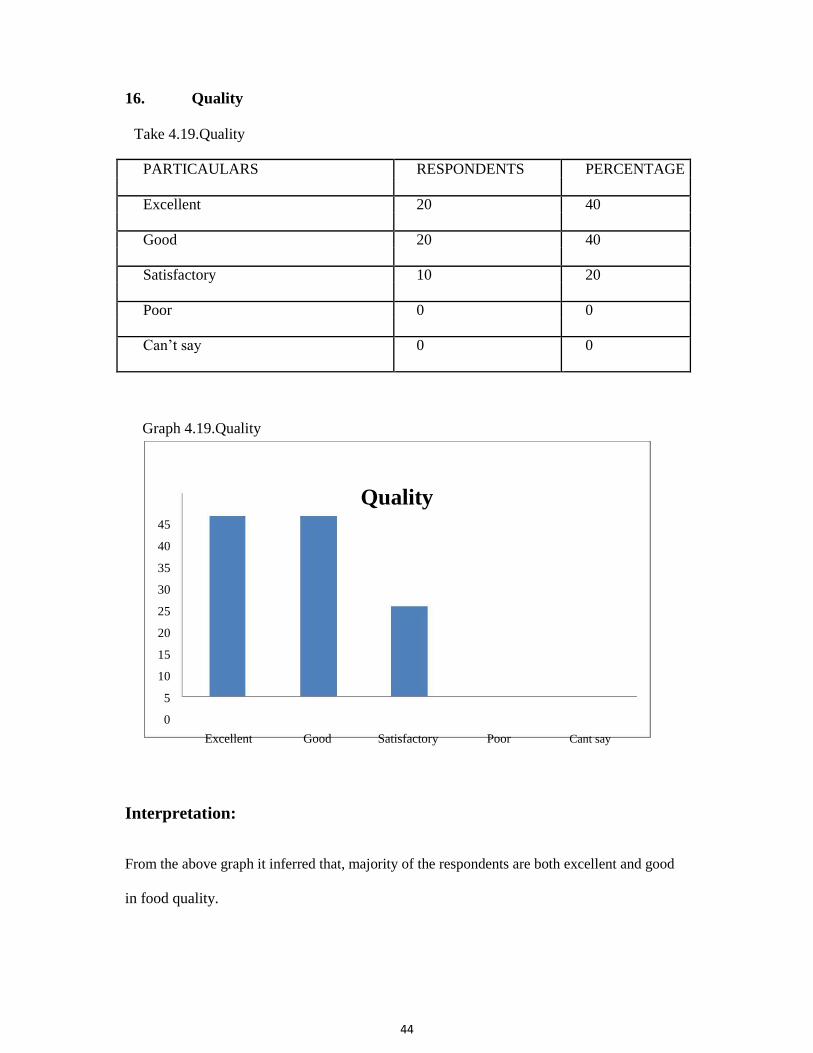
16. Quality
Take 4.19.Quality
PARTICAULARS RESPONDENTS PERCENTAGE
Excellent 20 40
Good 20 40
Satisfactory 10 20
Poor 0 0
Can’t say 0 0
Graph 4.19.Quality
Quality
45
40
35
30
25
20
15
10
5
0
Excellent Good Satisfactory Poor Cant say
Interpretation:
From the above graph it inferred that, majority of the respondents are both excellent and good
in food quality.

45
17. Quantity
Table 4.20.Quantity
PARTICAULARS RESPONDENTS PERCENTAGE
Excellent 10 20
Good 20 40
Satisfactory 20 40
Poor 0 0
Can’t say 0 0
Graph 4.20.Quantity
Quantity
45
40
35
30
25
20
15
10
5
0
Excellent Good Satisfactory Poor Cant say

46
Interpretation:
From the above graph it inferred that, majority of the respondents are for both satisfactory
and good about food quantity.

47
21. Cost of food
Table 4.21.Cost of food
PARTICAULARS RESPONDENTS PERCENTAGE
Excellent 10 20
Good 30 60
Satisfactory 10 20
Poor 0 0
Can’t say 0 0
Graph 4.21.Cost of food
Cost of food
70
60
50
40
30
20
10
0
Excellent Good Satisfactory Poor Cant say
Interpretation:
From the above graph it inferred that, majority of the respondents are good with their cost of
food.
48
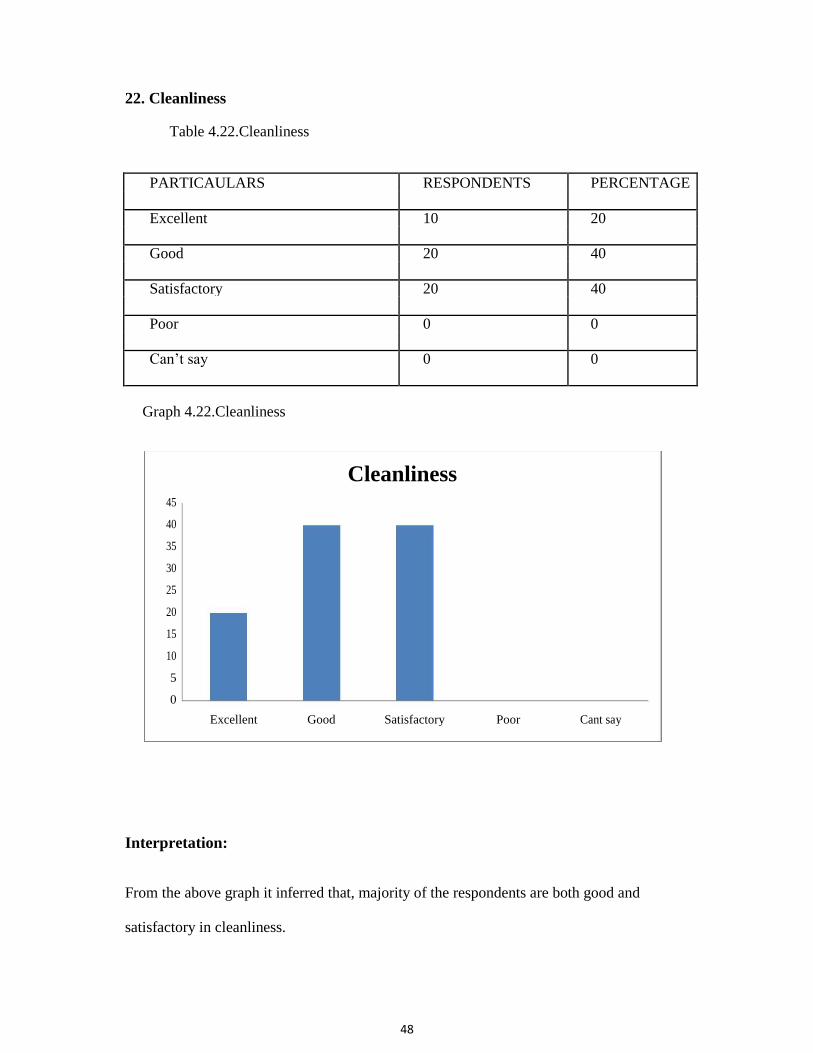
22. Cleanliness
Table 4.22.Cleanliness
PARTICAULARS RESPONDENTS PERCENTAGE
Excellent 10 20
Good 20 40
Satisfactory 20 40
Poor 0 0
Can’t say 0 0
Graph 4.22.Cleanliness
Cleanliness
45
40
35
30
25
20
15
10
5
0
Excellent Good Satisfactory Poor Cant say
Interpretation:
From the above graph it inferred that, majority of the respondents are both good and
satisfactory in cleanliness.
49
CHAPTER-5
SUMMARY OF FINDINGS, SUGGESTIONS AND
CONCLUSION

50
5.1. FINDINGS:
1) Workenvironment at KAPL is comfortable for workers.
2) Most of them are extremely satisfied with their drinking water facility provided at
work place.
3) Employees are extremely satisfied with their safety measures.
4) All employees are extremely satisfied with medical and first aid facility.
5) Most of them are satisfied with settlement of grievances.
6) Employees are extremely satisfied with their festival advance scheme.
7) Most of employees are extremely satisfied with the extent of participation in
decision making.
8) Few of them are in between average with the canteen facility provided at work place.
9) Remuneration provided to employees is extremely satisfied from KAPL.
10) All most all are extremely satisfied with welfare activity under taken at KAPL.
11) KAPL has provided hygienic toilet facility.
12) KAPL has better recreational activities for their employees and they are extremely
satisfied.
13) Workers are extremely satisfied with leaves and holidays provided.
14) All employees are happy with their breaks given at work place.
15) All most all the workers are satisfied with games and sports activity.
16) The company has provided insurances and accident benefits to their employee.
17) Employees say that challenging work will boost up their interest on work more.
18) Employees are satisfied with their food provided at canteen.
19) Quality of food is good for employee’s food.
20) Quantity is more and employees are satisfied.
21) Cost of food is manageable.

51
5.2. SUGGESTIONS:
i. Good relationship should be maintained by the organization in respect to meeting
the trade union demands.
ii. Improvement in washroom facility and providing suppurate rest room are women
employees.
iii. Organization should conduct more training programs to the employees.
iv. Communication with level of employees should improve.
v. Providing of education loan and housing loan should be increased by KAPL
vi. Women employees are less when compare to men.
5.3. CONCLUSION:
HENCE, by the report the staff are totally fulfilled with facility provided of the KAPL and
both are working for the betterment of organization as well as them self.
Through the survey it seems employee and employer are benefited with the welfare facility
provided in the organization which boost the energy in work and by that they are earning
good profit and the performance of the employee has be recognized by their employer and
has been supported .
On other hand I can see that employees are fulfilled with their welfare facility provide by
the company and this build relationship of employee and employer stronger and it will help
in growth of company too.
Therefore welfare facility should be there in the organizatio

52

Bibliography:
I. ANDREAS BALDSCHUN (Dec2014), the Six Dimensions Of Child Welfare
Employee, Occupational Well-Being. Nordic Journal Of Working Life Studies. 4(4).
p 69-87.
II. BAKER. C RICHARD, HAYES, RICK STEPHAN(1995), The Negative Effect Of
An Accounting Standard On Employee Welfare. The Case Of McDonnell Doughlas
Corporation And Fasb 106. Accounting, Auditing And Accountability. 8(3). p 12.
III. BINGQUIN LI AND HUAMIN PENG (November 2006), The Social Protection of
Rural Workers in the Construction Industry in Urban China. Journal of management
perspective. 33. p 567.
IV. DEBORAH WALKER, STEPHEN LA GARDEN, MARK NEILIO (Dec 2009),
Current Development In Employee Benefits And Pensions. Than Tax Advisor. 39(3).
p 816-825.
V. DEBORAH WALKER, OH HYUCK, STEPHEN LA GARDEN (Dec 2011),
Current Development In Employee Benefits And Pensions. The Tax Advisor. 42(12).
p 842-848.
VI. DYLAN, MICHELLE LYNN (2002), When Work Is Not Enough: North Carolina
Welfare And Labour Market Conditions. Duke University. 3(3). p 187.
VII. IRWIN B. HORWITZ, BRIAN P. MCCALL, (1990), Disabling and Fatal
Occupational Accidents Rates. Journal of Risks and Cost in the Oregon Construction
Industry., 34(3). p 476.
VIII. JAMES W. YEATES (2010), Death Is a Welfare Issue. 44. p 544.
IX. JAVIER IRIZARRY GEORGE WASHINGTON CARVER DOCTORAL FELLOW,
DULCY M. ABRAHAM , REINL.D, WIRAHADIKUSUMAH, CARLOS
ARBOLEDA(1997), A study on welfare of employee. Journal of employee welfare.
2(3) p 33.
X. JOAQUIN VALLEY OF CALIFORNIA, California State University. p 137
XI. JOEL C. , A Study Of Employee Commitment In Public Child Welfare Odimba ,
Capella University, Bh. VenkateshwaraRao, J. Durga Prasad(2013). Employment
Welfare InSingareni Collieries Company Limited. 33.(0). p 141.
XII. LAURA LEETE, NEIL BANIA (1999), The Impact Of Welfare Reform On Local.
Labour Market. Journal Of Policy Analysis And Management. 18(1). p 50-76.
XIII. PAUL OSTERMAN (Jan 2000), Work Organization in an Era of Restricting: Trends
In Diffusion And Effects On Employee Welfare. Journal Industrial And Labour
Related Review. 53(4). p 179-196.
XIV. PG MD SALLEH, AK MD HASNOL ALWEE(2015), A Comprise On Financial
Literacy Between Welfare Recipients And Non Welfare Recipients In Brunei,
International Journal Of Social Economics. 42(7). p 598-613.
XV. PRASAD. Y RAMAKRISHNA (Jul/Sept 2014), A Study on Various Welfare
Measures and Their Impact on Employee Satisfaction W.R.T. Sugar Industry in
India, International Journal Of Organization Behaviour And Management
Perspective. 3(3). P 1055-1066.
XVI. PRATIBHA JOSHI, PROMMILA SHARMA, and T.C THAKUR AND AMIT
KHETTAR (April-June 2012), Safety in Construction Line: Important Issue for Risk
Identification and Prevention. 4(5). p 33.
XVII. PROTIK BASU, SHOVAN CHOWDHURY, PAEVEEN AHMED ALAM(Sep
2015). A Model- Based Approach Of Flexibility And Its Impact On Organization
And Employee Welfare In Lean Environment. Decision. 42(3). p 269-277
XVIII. SHRI SARBESWARA SAHOO, (2000). National Workshop on Study. Journal
Health and Welfare Measures for Construction Workers. 3(3). p 322.
XIX. TRACEY DICKSON, JEREMY HUYTON (2008), Customer Service. Employee
Welfare and Snow sports Tourism In Australia. International Journal Of
Contemporary Hospitality Management. 202. p 199-214.
XX. VALERIE K. KEPNER (2009). Welfare Reform. Child Care Considerations And
Migration Decisions. Colorado State University. 2(9). p 130.
XXI. VATER, A JOSEPH (May/Jun 2002). Traps For the Unwary In Administration Of
Employee Benefit Plans. Journal Compensation And Benefits Review. 34(3). p 40-46.
XXII. VIBHA PANDEY, KANAK WADHWANI (2014). Study On Employee Welfare
Practices At Raymond Limited. International Journal Of Organizational Behaviour
And Management Perspective. 3(1). p 788-790.1
XXIII. W.SUSAN HICKS (Dec 1992). Accounting And Reporting By Health And Welfare
Benefits Plans. Journal Of Accountancy. 3. p 107.
XXIV. WEIKEL-MORRISON, DAVID ALEXANDER (2002). Employee Job Satisfaction.
Journal Retention and Turnover in There Public Child Welfare Programs in the
Central San. 23(4). p 334-346.

XXV. WILSON, BUDDYE SERNICE (1998). Welfare Reform: Employer’s Perception of
Factors Associated with Virginia’s Initiative For Employment Not Welfare. Journal
Virginia Polytechnic Institute And State University. 2(2). p 81.
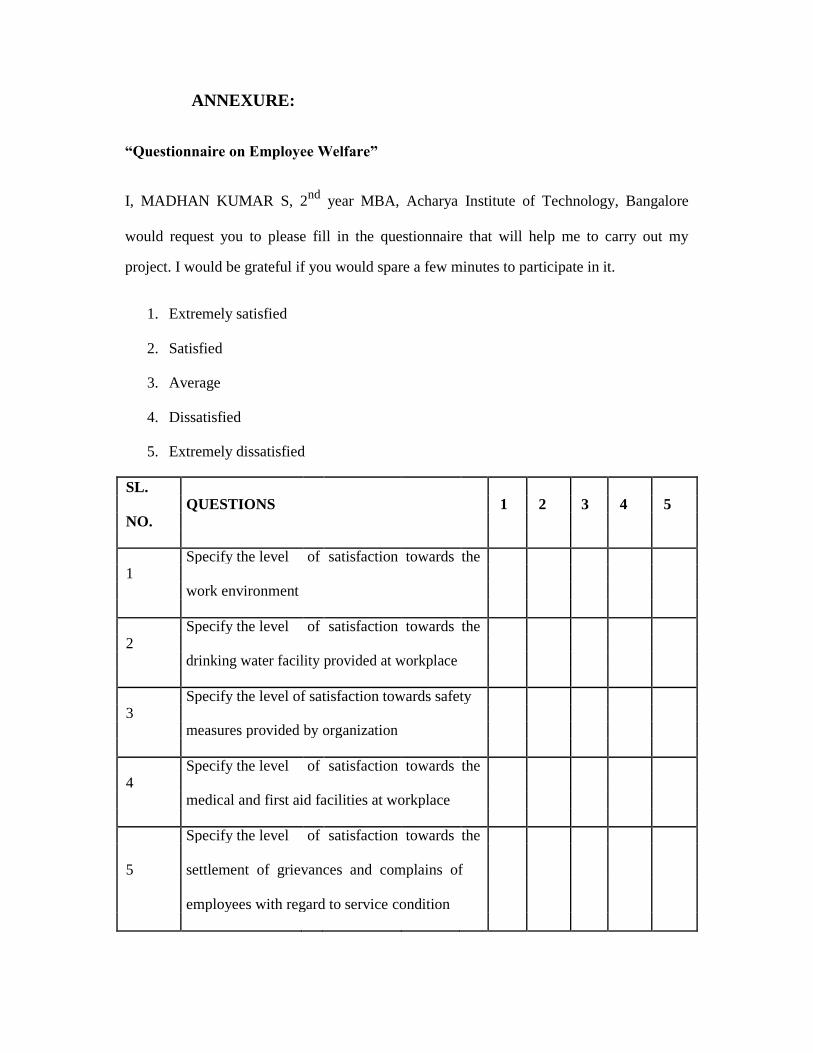
ANNEXURE:
“Questionnaire on Employee Welfare”
I, MADHAN KUMAR S, 2nd
year MBA, Acharya Institute of Technology, Bangalore
would request you to please fill in the questionnaire that will help me to carry out my
project. I would be grateful if you would spare a few minutes to participate in it.
1. Extremely satisfied
2. Satisfied
3. Average
4. Dissatisfied
5. Extremely dissatisfied
SL.
QUESTIONS 1 2 3 4 5
NO.
Specify the level of satisfaction towards the
1
work environment
Specify the level of satisfaction towards the
2
drinking water facility provided at workplace
Specify the level of satisfaction towards safety
3
measures provided by organization
Specify the level of satisfaction towards the
4
medical and first aid facilities at workplace
Specify the level of satisfaction towards the
5 settlement of grievances and complains of
employees with regard to service condition

6 I am satisfied with the festival advance scheme
I am satisfied with the extent of participation in
7
decision making
I am satisfied with the canteen services provided
8
by the company
I am Satisfied with remuneration provided by
9
the company
I am satisfied with welfare activities conducted
10
by company
I am satisfied with the hygienic conditions
11
maintained in latrines and urinals
I am satisfied with the recreational activities
12
arranged by the company
I am satisfied with the number of leaves and
13
holidays provided by the company
I am satisfied with the rest breaks and lunch
14
breaks provided by the company
I am satisfied with the games and sports
15
facilities
I am satisfied with the Insurances and accidents
16
benefits provided by the company
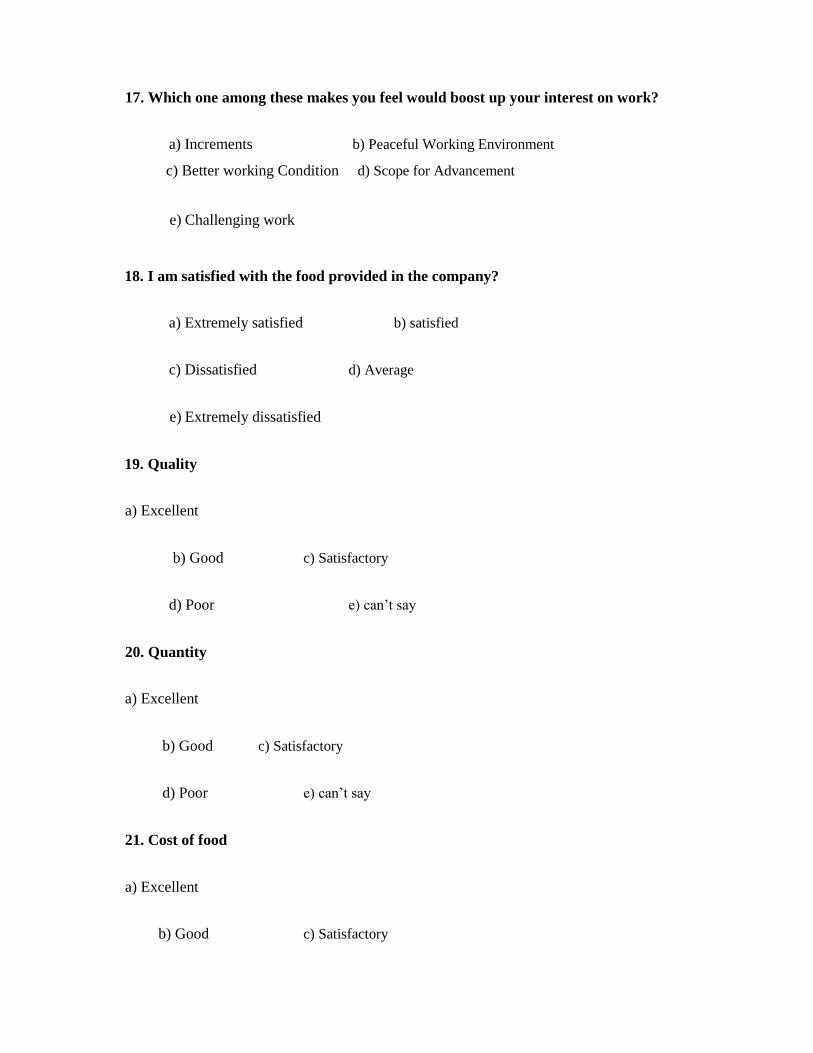
17. Which one among these makes you feel would boost up your interest on work?
a) Increments b) Peaceful Working Environment
c) Better working Condition d) Scope for Advancement
e) Challenging work
18. I am satisfied with the food provided in the company?
a) Extremely satisfied b) satisfied
c) Dissatisfied d) Average
e) Extremely dissatisfied
19. Quality
a) Excellent
b) Good c) Satisfactory
d) Poor e) can’t say
20. Quantity
a) Excellent
b) Good c) Satisfactory
d) Poor e) can’t say
21. Cost of food
a) Excellent
b) Good c) Satisfactory

d) Poor e) can’t say
22. Cleanliness
a) Excellent
b) Good c) Satisfactory
d) Poor e) can’t say
Demographic Questions:
23. Age :
16 – 20 20 – 25
25 – 30 30 – 35
35 – 40 above 40
24. Gender :
Female Male
25. Tenure :
0 – 5 5 – 10
10 – 15
15 –
20
20 – 30 above 31
…Thank you…


Name Name of the Project Internal guide
l•, ACHARYA I NST l'l'UTF.S
ACHARYA INSTITUTE OF TECHNOLOGY
DEPARTMENT OF MBA
INTERNSHIP WEEKLY REPORT(IAZl6MBA32)
: MADHAN KUMAR S : EMPLOYEE WELFARE : Prof. REENA MAHESI-I : IZl6MBA32 : Finance & Human Resource
USN No Specialization Company name : KARNATAKA ANTIBIOTICS &PHARMACEUTICALS LTD
External Internal
Week Work Undertaken Guide Guide
Signature Signature
15-1-2018 Understanding Structure, culture and functioning of
~ to
20-1 -2018 the Organization.
22-1-20 I 8 Understand products/services and the problems of the
to
27-1-2018 organization
29-1-2018
~ to Industry profile and company profile e~~-3-2-2018
5-2-2018
to Competitors analysis
10-2-2018
12-2-2018
~ to Questionnaire design and distribution
17-2-2018
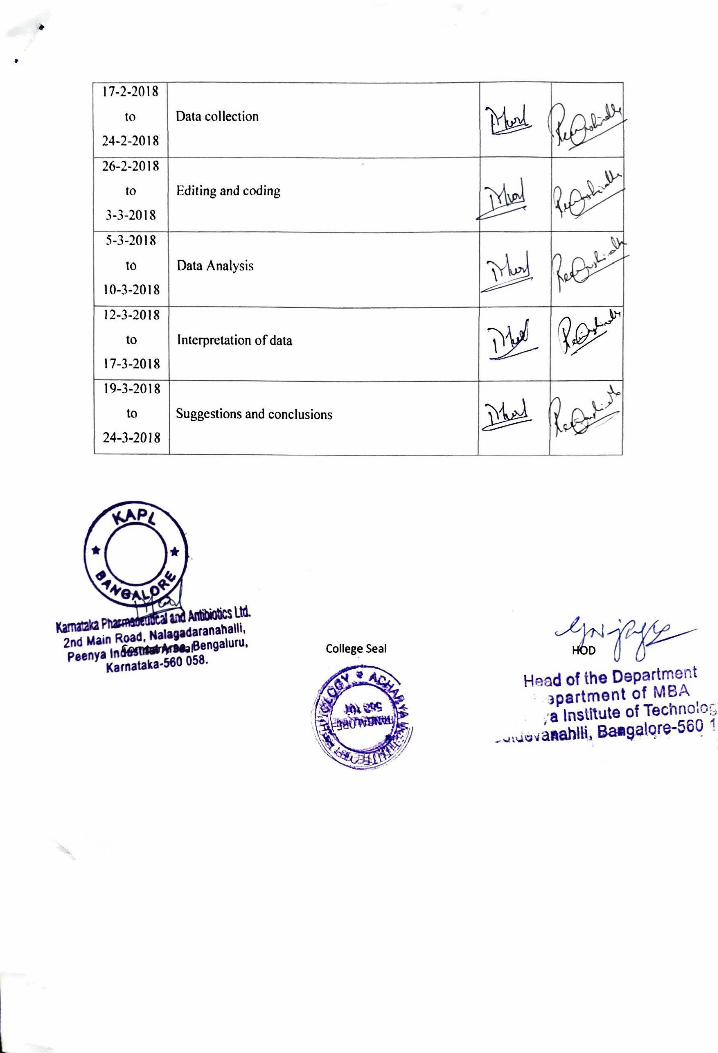
•
17-2-2018
to
24-2-2018
26-2-2018
to
3-3-2018
5-3-2018
to
10-3-2018
12-3-2018
to
17-3-2018
19-3-2018
to
24-3-2018
Data collection
Editing and coding
Data Analysis
Interpretation of data
Suggestions and conclusions
College Seal
~
~ qp ~ ~
~~ Heed of the Department
: 3partment of MBA . / & lnst\tute of Technolof.1
_ -..11J \:J-.Jaftahll-i1 Baa9.alqre-56Q !
Recommended


![Antibiotics from Saline Aquaculture Effluents · to fish will appear unused in the environment, through feces, because fish do not metabolize them effectively [4,5]. Pharmaceuticals](https://img.pdfslide.net/doc/110x75/5ecdc37d58192a2b4b69a49b/antibiotics-from-saline-aquaculture-efiuents-to-ish-will-appear-unused-in-the.jpg)