
OECD Blue Sky III
Policy and program assessment leveraging administrative data: the case of venture capital in Canada
September 2016
Ryan KellyHankook Kim
The views and opinions expressed in this paper are those of the authors alone and do not represent, in any way, the views or opinions of the Department of Innovation, Science and Economic Development or of the Government of Canada
2
Venture Capital (VC) is a financing instrument for potentially high-growth innovative firms.
– Finances early-stage companies through concentrated equity stakes.– Uses highly specialized knowledge of markets and technologies– Relies on strict governance and due diligence– Actively mentors portfolio firms to improve outcomes
VC is often thought to play a critical role in financing innovation and commercialization.
– Financing innovation is subject to capital market failures (e.g., information asymmetry)
– VCs use their expertise to mitigate information asymmetry and invest in innovative firms that would be deemed too risky by traditional lenders
As part of its support for innovation, the Canadian government has implemented a number of programs supporting VC.
– Forms of support vary: tax credits, government run funds, and fund-of-fund investments.
– Opportunity to assess efficacy of different policy
Venture Capital and Gov’t support for Innovation

3
1) VC-backed vs. Non-VC-backed comparison– Uses matching estimator to compare VC-backed to otherwise similar non-
VC-backed– Positive results associated with VC across several performance metrics
2) Private VC Funds vs. Government supported VC Funds– Given positive results from step 1, we focus on only VC-backed firms– Uses multivariate regression to compare firm outcomes by type of VC fund– Finds that some government supported VC funds perform on par with
domestic private VC funds
Research Strategy: two streams of separate, but complementary analyses
Results are not causal. However, still relevant for policy as the results identify if VC supports innovative firms with good commercial prospects
4
Official tax and administrative data sets compiled by Statistics Canada.– Business Register; corporate tax files; personal tax files– The data contain a wide variety of firm-level information including sales,
revenues, employment, payrolls, and R&D expenditures– Includes firms operating in Canada over 1999-2009
Thomson Financial data on VC fund investments linked to tax data through business names and addresses:– Data includes firms that received VC funding, the date of the first VC
financing, and the size of VC investment– Following initial linkage, screens were applied to net out potential
erroneous linkages and make the data suitable for our analysis.– 1,044 VC-backed firms 1999-2009 (1,545 in full 1990-2009 sample)
Data longitudinalized using a process called labor-tracking– Methodology tracks individual employees (through Social Insurance
Number in tax filings) to identify firm relationships
Data

5
1) VC-backed vs non-VC-backed

6
Methodology: Propensity Score Matching
First: fit a logit model and calculate the probability of receiving a first round of VC financing
where VCit is a dummy variable indicating whether a firm received its first round of financing in time t, Xit is the full set of the desired covariates, αc is a constant, αt and αind are time and industry-specific intercepts, and εit is the standard econometric error term
Second: define a set of potential matches for each treatment observation based on its predicted probability of receiving VC, industry, and province.
Third: for each treatment observation, we select the firm among the potential matches with the closest linear propensity score.
– Nearest neighbour without replacement– More explicitly, Let p be the linear propensity score and I0 the set of non VC-backed
firms, the match for firm i, Mi, is defined as:
where
Pr( 1)it c t ind it itVC X
0min [ ] , | [ ]i i j i jjM abs p p j I abs p p
0.25( )p

7
Treatment and Control Groups are similar across all relevant covariates
Comparison between Matched Pairs—Propensity Score Matching
Covariate Mean VC Mean Control group
P-value of Difference
Standardized difference in
means
Ln Total Assets 14.485 14.453 0.735 0.020
Asinh Sales 11.618 11.835 0.539 -0.037Ln Employment 2.717 2.765 0.544 -0.036Ln Wages 10.683 10.674 0.787 0.016Asinh Retained Earnings -8.089 -7.835 0.727 -0.021Asinh Revenue 13.507 13.454 0.850 0.012Asinh Net Income -7.572 -7.305 0.707 -0.023Age 4.952 5.042 0.796 -0.016Asinh R&D Expenditures 8.228 8.456 0.566 -0.035Asinh Gross Profits 9.617 9.201 0.410 0.052
Linear Propensity Score -4.729 -4.754 0.860 0.011
Treatment and control groups have no statistically significant differences among any of the matching covariates
Standardized Difference in Means = .. VC obs = 544; Control group obs = 544.
Comparison between Matched Pairs— IRAP Count VC Control GroupIRAP recipient in year of match 91 88IRAP recipient during sample period 152 156
Treatment and control groups have similar propensity to use a government R&D support program (i.e., IRAP)

8
VC-backed firms outperform non-VC-backed across a variety of firm performance metrics
, ,1ln lnn
i t y i tiX X
y Yr Growthn
Mean VC
Mean Control Group
Difference P-value of Difference
SalesGrowth after 1 year 48.7% 27.2% 21.6% 0.022Growth after 3 years 100.1% 47.2% 53.0% 0.001Growth after 5 years 137.4% 56.0% 81.4% 0.001EmploymentGrowth after 1 year 34.4% 6.6% 27.7% 0.000Growth after 3 years 41.5% -3.5% 45.0% 0.000Growth after 5 years 50.6% 3.6% 47.0% 0.000Gross Profit / EmploymentGrowth after 1 year 14.3% 26.7% -12.5% 0.183Growth after 3 years 54.6% 48.1% 6.4% 0.668Growth after 5 years 70.2% 71.3% -1.1% 0.958WagesGrowth after 1 year 8.2% 4.6% 3.6% 0.061Growth after 3 years 16.7% 11.8% 4.9% 0.106Growth after 5 years 29.4% 19.3% 10.1% 0.029R&D ExpendituresGrowth after 1 year 25.3% 9.2% 16.1% 0.012Growth after 3 years 24.9% 8.9% 16.0% 0.230Growth after 5 years 48.9% 29.4% 19.5% 0.230
VC-backed firms grow faster than non-VC-backed
No difference in profitability
Wage growth suggests higher value-added employment
VC-backed firms increase R&D following investment. But, short-lived. Consistent with an acceleration of the commercialization of innovation by the firm.

9
2) Private VC vs Government supported VC

10
VC fund types in Canada
– Foreign VC funds:
• Predominately high-performing US based VC funds
– Private Independent Funds:
• Domestic VC funds without any formal association with larger financial institutions such as banks or pension funds
– Business Development Bank of Canada (BDC):
• The BDC is a crown corporation that invests federal funds directly in firms as well as other VC funds.
– Labour Sponsored Venture Capital Corporations (LSVCCs) based in Quebec:
• LSVCCs are retail VC funds supported through tax credits to investors; they often have non-profit goals within their mandates (e.g., regional development).
– LSVCCs based in the rest of Canada:
• Treated as separate category; industry observers suggest these funds maintain portfolios more closely resembling VC investment than Quebec-based LSVCC funds
– Other Government Funds:
• Predominately provincial government programs
Priv
ate
Fund
Typ
esG
over
nmen
t sup
port
ed
Fund
Typ
es

11
VC often co-invests with other VC.– Better performance – Brander, Amit,
and Antweiler (2002).
BDC is the most likely to make joint investments.
– More than 90% of BDC’s investments are joint with other types of VC.
– Mandate to act as complementary lender
LSVCCs in Quebec co-invest very little with other VC.
– LSVCCs in Quebec tend to invest in different industries and tends to invest in later stages of the firm growth life cycle than other VC
High degree of joint-investment complicates straight comparisons
– Need to control in a multivariate setting
Joint Investment by VC Types
– *Note: Based on 2,847 firms in the Thomson data that have information on VC investor types. Joint investment in this figure are not mutually exclusive. For example, the investment made jointly by BDC and foreign funds could have other participants.
LSVCC Quebec
LSVCC Rest of Canada
Other Gov't
Private Independent
Foreign
BDC
0% 10%
20%
30%
40%
50%
60%
70%
80%
90%
100%
Joint-Investment with Other VC Fund Types

12
y is a performance measure.– R&D expenditures, employment, wages, and gross profits.
VCF is a vector of identification variables for VC types– BDC, LSVCCs based in Quebec, LSVCCs based in the rest of Canada, Other
Government, Foreign, Private Independent, Corporate and Institutional, and Other– Minor VC types accounting for less than 10% of VC investments in Canada (i.e.,
Corporate and Institutional, and Other) are controlled for but the results are not discussed.
Z is a vector of firm-level control variables. – Years since the first VC financing, age and their squares.– Growth stage dummies (seed, early, expansion and later) and a control for syndication.– VC investment amount – a cumulative amount increasing with each successive round of
VC financing. Not distinguishable between different types of VC.– Number of employees as measured by individual labour units (ILUs).
IND x TIME are cross-products of industry (NAICS 3-digit) and year.– Control for industry-time-specific shocks.– A lack of industry-specific deflators.
Empirical Model
𝑌 𝑖𝑡=𝛼+∑𝑗=1
𝑚
𝛽𝑚𝑉𝐶𝐹 𝑖𝑡+𝛾 𝑍 𝑖𝑡+𝛿𝐼𝑁𝐷∗𝑇𝐼𝑀𝐸 𝑖𝑡+𝜀𝑖𝑡 .

13
BDC and LSVCCs in the rest of Canada perform on par with domestic private VC fundsOther government supported fund types perform relatively worse; could reflect non-profit objectives
Differences in firm performance across VC fund types
Ln R&D Expenditures
Ln Employment Ln Wages Ln Gross
ProfitsForeign 0.4544*** 0.5026*** 0.1633*** 0.4519**
(5.06) (5.04) (5.31) (2.37)
Private Independent 0.2897*** 0.0018 0.0873*** -0.2656
(3.65) (0.02) (3.08) (-1.56)
BDC 0.2209** -0.0594 0.0145 -0.3379*
(2.49) (-0.56) (0.46) (-1.68)
LSVCC Rest of Canada 0.1537 0.1381 0.0618** -0.0082
(1.64) (1.37) (2.18) (-0.05)
LSVCC Quebec -0.1807* 0.0605 -0.1283*** -0.246
(-1.68) (0.57) (-3.72) (-1.31)
Other Government 0.1343 -0.2145** -0.1027*** -0.8517***
(1.38) (-2.00) (-3.09) (-4.02)
Note: all specifications include control s for the amount invested, age, years since financing, stage of investment, whether there has been joint investment, investment from other VC fund types, and industry year cross-products. The t-statistics are in brackets. Standard errors are clustered at the firm level and are robust to heteroskedasticity and autocorrelation. ***, ** and * indicate two-sided statistical significance at 1%, 5% and 10% levels, respectively.
Similar performance
Relatively poor performance
Superior performance
14
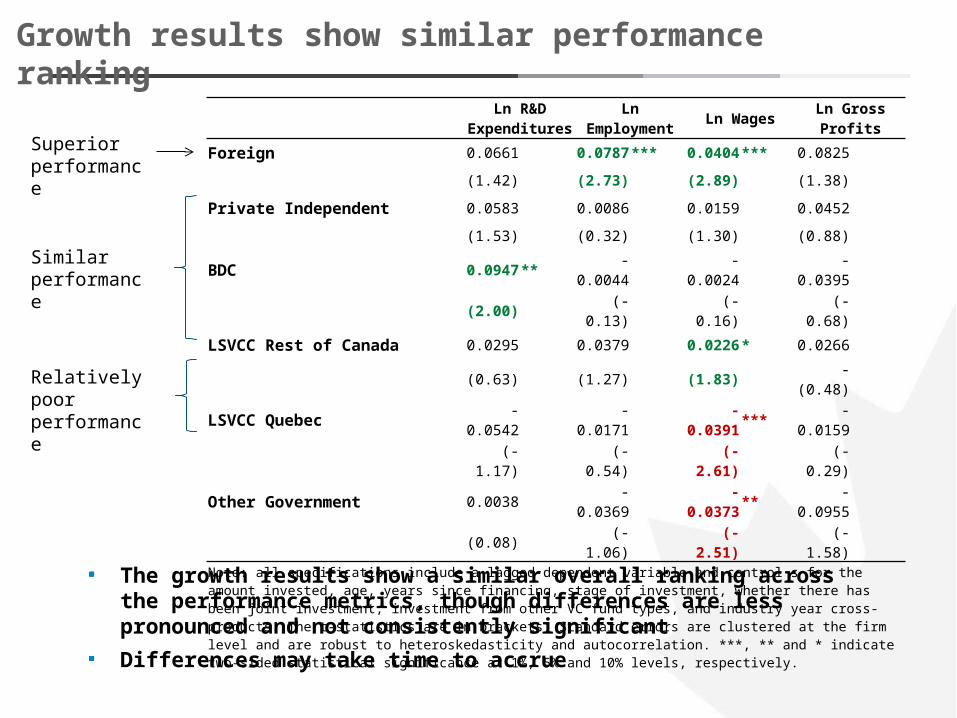
Growth results show similar performance ranking
The growth results show a similar overall ranking across the performance metrics, though differences are less pronounced and not consistently significantDifferences may take time to accrue
Ln R&D Expenditures
Ln Employment Ln Wages Ln Gross
ProfitsForeign 0.0661 0.0787*** 0.0404*** 0.0825
(1.42) (2.73) (2.89) (1.38)
Private Independent 0.0583 0.0086 0.0159 0.0452
(1.53) (0.32) (1.30) (0.88)
BDC 0.0947** -0.0044 -0.0024 -0.0395
(2.00) (-0.13) (-0.16) (-0.68)
LSVCC Rest of Canada 0.0295 0.0379 0.0226* 0.0266
(0.63) (1.27) (1.83) -(0.48)
LSVCC Quebec -0.0542 -0.0171 -0.0391*** -0.0159
(-1.17) (-0.54) (-2.61) (-0.29)
Other Government 0.0038 -0.0369 -0.0373** -0.0955
(0.08) (-1.06) (-2.51) (-1.58) Note: all specifications include a lagged dependent variable and control s for the amount invested, age, years since financing, stage of investment, whether there has been joint investment, investment from other VC fund types, and industry year cross-products. The t-statistics are in brackets. Standard errors are clustered at the firm level and are robust to heteroskedasticity and autocorrelation. ***, ** and * indicate two-sided statistical significance at 1%, 5% and 10% levels, respectively.
Similar performance
Relatively poor performance
Superior performance
15
VC-backed firms outperform non-VC-backed firms– Outperform in terms of growth, even after controlling for initial innovativeness– Higher wage growth over the long run (after 5 years)– Initial surge in R&D expenditures consistent with acceleration of commercialization
Statistically significant differences in performance among firms backed by different types of VC in Canada
– Foreign VC is associated with the best performance across all measures examined (i.e., R&D, employment, wages, and gross profits).
– Private VC performs on par with BDC and LSVCCs outside of Quebec.– Quebec based LSVCCs and other government VC – mostly provincial programs – are
generally associated with relatively poor performance.
Importance of design of government support– The literature highlights how non-profit mandates, e.g., regional development, may hinder
VC’s performance.
Interesting results but not a complete performance evaluation– Only measures relative performance– Does not capture indirect impacts of public support (e.g., BDC’s high intensity of
syndication with foreign and other VC)– Cannot conclude regarding “good” or “bad” policy
Summary of Results
Recommended