Science Journal of Applied Mathematics and Statistics 2016; 4(2): 81-87
http://www.sciencepublishinggroup.com/j/sjams
doi: 10.11648/j.sjams.20160402.20
ISSN: 2376-9491 (Print); ISSN: 2376-9513 (Online)
Key Performance Indicators for Electricity Conservation in Open Pit Mining
Qinglin Yu1, *
, Long Wen1, Craig Haight
2, Alex Russell-Jones
2
1Centre for Optimization and Decision Science (CODS), Thompson Rivers University, Kamloops, BC, Canada 2Energy Management Group, Teck Highland Valley Copper Partnership, Logan Lake, BC, Canada
Email address: [email protected] (Qinglin Yu) *Corresponding author
To cite this article: Qinglin Yu, Long Wen, Craig Haight, Alex Russell-Jones. Key Performance Indicators for Electricity Conservation in Open Pit Mining.
Science Journal of Applied Mathematics and Statistics. Vol. 4, No. 2, 2016, pp. 81-87. doi: 10.11648/j.sjams.20160402.20
Received: March 12, 2016; Accepted: March 19, 2016; Published: April 13, 2016
Abstract: In mining operation, blasts are used to fracture the in-situ rock mass and prepare it for excavation, crushing and
grinding. The High-energy blasting, which uses increased amount of explosive material per tonne of rock, is considered to be one
of most effective ways to reduce the consumption of energy in the milling process, resulting production saving as well as
reduction in dust (PM5) and tailing. In this article, the main focus is to investigate the electrical intensity of the five grinding
lines in the mill, as they accounted for the majority of site electricity consumption, in relations to other operational procedures,
in particular the high-energy blasting. Several regression models were established, the data points were fitted within 10% of the
actual values, and the majority within 5%. The models provide management better ways to predict and target electrical
consumption and environmental impact.
Keywords: Key Performance Indicator (KPI), Energy Conservation, Electricity Intensity, Open-Pit Mining,
High-Energy Blasting, Powder Factor
1. Introduction
In the open-pit mining industry, blasts are used to fracture
the in-situ rock mass and prepare it for excavation, crushing
and grinding. High-energy blasting uses increased amount of
explosive material per tonne of rock to increase fragmentation
and reduce particle size. Reduced particle sizes require less
time in the grinding process to be reduced to the necessary size
for processing resulting in an increased rate of throughput and
a decrease in the energy consumption of production. The
High-energy blasting is considered to be one of most effective
ways to reduce the consumption of energy in the milling
process, resulting production saving as well as reduction in
dust (PM5) and tailing. Highland Valley Copper (HVC) is an
operation within the Teck Copper Business Unit that
produces copper and molybdenum concentrates. To better
understand its energy performance, the investigation focuses
on developing a set of Key Performance Indicators (KPIs)
suitable to the needs and priorities of HVC in supporting
decision making of efficient operations, and providing
benchmarks and monitor tools for energy conservation.
Key Performance Indicator (KPI) is a crucial tool to
measure one’s progress towards pre-defined objectives. KPIs
have been widely used by organizations to measure financial
or operational performance, as well as sustainability,
conservation, environment, and health or safety issues from
times to times [1, 2, 4, 5, 6, 8, 9, 12].
The primary focus of the study was on the electrical
intensity of the five grinding lines in the mill as they
accounted for the majority of site electricity consumption. A
relationship between electrical intensity and mill throughput
was initially established. It was then determined that the
previous throughput model used in planning was inadequate
to accurately account for recent adoption of blasting
technique, high energy blasting.
In order to produce a more accurate model of mill
throughput, several key variables were used: the rock
hardness, the powder factor used in blasting, the percentage
of high energy, and trim & buffer (wall control) blasting. A
series of models focus on the viability of using powder factor,

82 Qinglin Yu et al.: Key Performance Indicators for Electricity Conservation in Open Pit Mining
hardness, blasting rates as independent variables with weekly
or daily data. A polynomial model for throughput using
weekly data for the hardness, high energy blasting rate, and
trim & buffer blasting rate was found to perform best. In this
model, all data points from the model were within 10% of the
actual values, and the majority within 5%. The model
performed considerably better than the previous prediction
and has also been shown to work with relative accuracy for
2012 data where no high energy blasting was carried out.
While the use of the model in the prediction and targeting
of electrical consumption are clear, it will also be of use in
many other areas. The more understanding of throughput
provided by the model has many uses such as more accurate
planning, the identification of energy savings through
blasting practices, and as a performance indicator in itself.
This work can be taken further and used as the basis for
developing more comprehensive models such as one
including recovery rate of mill operation.
Blasting as an important mine-to-mill strategy was
investigated in relation with other processes by several
researchers. For example, Rorke [10] considered the blasting
to improve the free flow to loader and to increase loading rate.
Burger et al. [3] considered the correlation of blasting and
mill throughput. Valery, Jankovic and Sonmez [11] used
Process Integration and Optimization methodology to
increase mine efficiency and mill throughput by considering
rock characterization and blasting patterns.
2. Model Development
HVC is committed to the efficient use of energy and the
reduction of greenhouse gas emissions. Central to the HVC
Energy Policy is the inclusion of energy efficiency and GHG
considerations into its process designs and operating
decisions. Currently, HVC uses a collection of complex
spreadsheets to monitor the site’s energy consumption and
produce energy-specific targets. The fundamental challenge
behind this study was to determine how to extract
energy-related information that is informative, concise, and
useful to a wide range of users at the mine.
Operations at HVC follow a standard process of drilling,
blasting, excavation, hauling, crushing, conveying, grinding,
flotation, and molybdenum leaching. The Mill itself is
comprised of 5 grinding lines, with three Semi-Autogenous
(SAG) mills (A, B and C) and two Autogenous (AG) mills (D
and E). Just over half of all energy consumed on site is
electrical, with much of the remainder being diesel; however,
electrical consumption is tracked at a much higher resolution.
As more than half of all electrical consumption is in the
grinding process, the study primarily focuses on the effect of
different blasting techniques to the throughput of the five
grinding lines in the mill.
Key Variables
In order to understand the electrical performance of the
grinding process, several key variables were identified. An
important factor in selecting these variables was that data
related to the variables was tracked and recorded on a regular
basis and are therefore readily available.
� Electrical Intensity: The electrical intensity refers to the
electrical consumption in the grinding lines per dry
metric tonne of ore milled (kWh/DMT).
� Hardness: When blast holes are drilled, the drills record
a ‘drilling resistance’ indicator (the “Aquilla” or “Leica”
number) which reflects relative variations in rock
strength, and is consequently used as an indicator of the
hardness of the material to be blasted.
� Mill Throughput Rate: Throughput rate is measured by
tonnes of ore processed in mill per operating hour
(often referred as mill TPOH). For individual lines,
such as A-line throughput, this is simply the total tonnes
through A-line in a given time period divided by the
total operating hours within that same period.
� Powder Factor: The powder factor is simply the
kilograms of explosive used per tonne of rock blasted.
There are three categories of rock hardness, and three
different blast designs alongside a standard production
blast design, there is also one for high energy blasting
and trim and buffer blasting (T&B), corresponding to
higher and lower powder factors. The principal behind
high energy blasting is that using a greater powder
factor results in greater fragmentation of the rock,
reducing the amount of work that the mill has to do, and
thus increasing throughput. T&B blasting is used for
wall control where a lower powder factor is necessary
to avoid destabilizing or damaging the pit walls.
� Blasting Rates: Blasting rates are used to quantify the
amount of high energy and T&B blasting performed.
The blasting rate is a percentage of the total rock
blasted that was done using each of the blast patterns.
Only high energy and T&B blasting rates are used as
the production blasting rate is naturally included as the
remainder.
3. Data Analysis
The electricity intensity is affected by mill throughput rate.
Higher throughput usually means softer ore and the ore
requires less electricity to be ground, and results a lower
electricity intensity. At first, we build a model to determine
whether A-line is suitable to be a representative of other four
lines. The model reveals that all five lines are significantly
related and each line can be represented by A-line
equivalence with an appropriate weight.
At HVC, the ore from different pits gets mixed before they
reach the stockpile. The ore are intentionally blended so that
it is roughly uniformly mixed going into different lines,
which justifies the strong correlation between different lines.
3.1. Model for Electricity Intensity
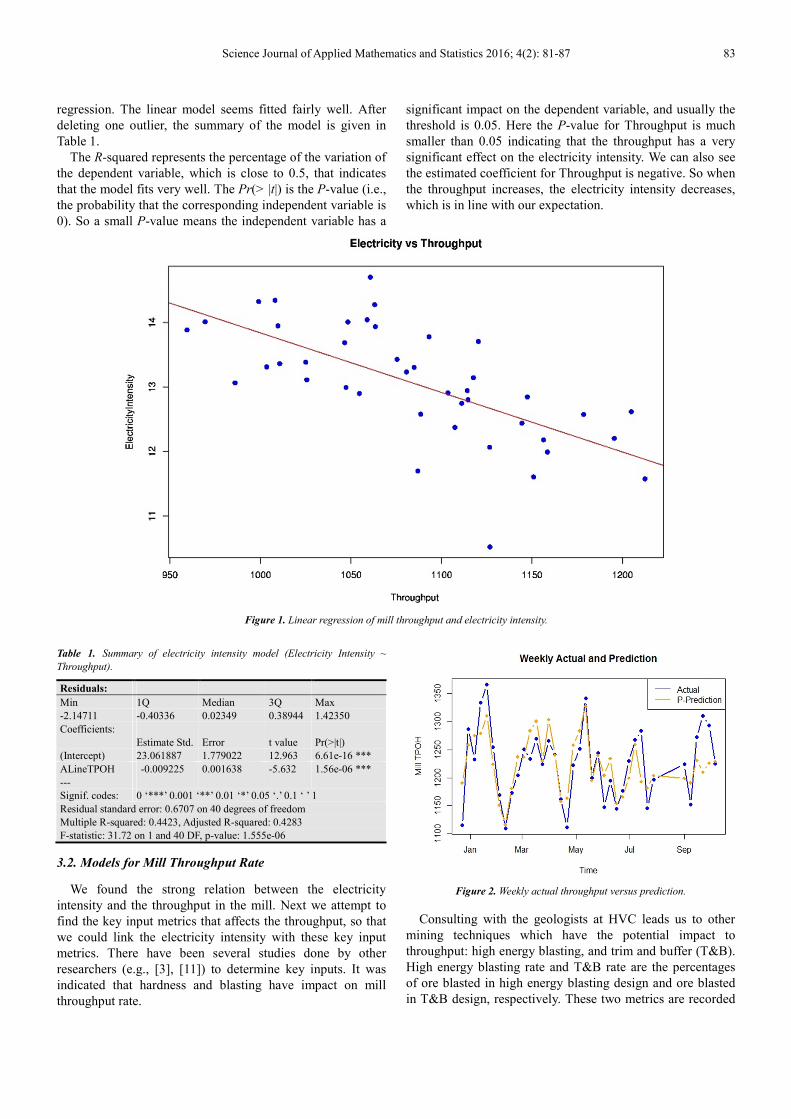
Monthly data for A-line electricity intensity (kWh/DMT)
and A-line throughput is available. So in this model, we use
the A-line electricity intensity as the dependent variable and
A-line throughput as the independent variable. The plot of the
data is given in Figure 1, where the line is the fitted linear
Science Journal of Applied Mathematics and Statistics 2016; 4(2): 81-87 83
regression. The linear model seems fitted fairly well. After
deleting one outlier, the summary of the model is given in
Table 1.
The R-squared represents the percentage of the variation of
the dependent variable, which is close to 0.5, that indicates
that the model fits very well. The Pr(> |t|) is the P-value (i.e.,
the probability that the corresponding independent variable is
0). So a small P-value means the independent variable has a
significant impact on the dependent variable, and usually the
threshold is 0.05. Here the P-value for Throughput is much
smaller than 0.05 indicating that the throughput has a very
significant effect on the electricity intensity. We can also see
the estimated coefficient for Throughput is negative. So when
the throughput increases, the electricity intensity decreases,
which is in line with our expectation.
Figure 1. Linear regression of mill throughput and electricity intensity.
Table 1. Summary of electricity intensity model (Electricity Intensity ~
Throughput).
Residuals:
Min 1Q Median 3Q Max
-2.14711 -0.40336 0.02349 0.38944 1.42350
Coefficients:
Estimate Std. Error t value Pr(>|t|)
(Intercept) 23.061887 1.779022 12.963 6.61e-16 ***
ALineTPOH -0.009225 0.001638 -5.632 1.56e-06 ***
---
Signif. codes: 0 ‘***’ 0.001 ‘**’ 0.01 ‘*’ 0.05 ‘.’ 0.1 ‘ ’ 1
Residual standard error: 0.6707 on 40 degrees of freedom
Multiple R-squared: 0.4423, Adjusted R-squared: 0.4283
F-statistic: 31.72 on 1 and 40 DF, p-value: 1.555e-06
3.2. Models for Mill Throughput Rate
We found the strong relation between the electricity
intensity and the throughput in the mill. Next we attempt to
find the key input metrics that affects the throughput, so that
we could link the electricity intensity with these key input
metrics. There have been several studies done by other
researchers (e.g., [3], [11]) to determine key inputs. It was
indicated that hardness and blasting have impact on mill
throughput rate.
Figure 2. Weekly actual throughput versus prediction.
Consulting with the geologists at HVC leads us to other
mining techniques which have the potential impact to
throughput: high energy blasting, and trim and buffer (T&B).
High energy blasting rate and T&B rate are the percentages
of ore blasted in high energy blasting design and ore blasted
in T&B design, respectively. These two metrics are recorded

84 Qinglin Yu et al.: Key Performance Indicators for Electricity Conservation in Open Pit Mining
when the ore get removed from the ground. It has less time
delay before the ore reaches the mill, generally less than 12
hours. Meanwhile, these two rates link to powder factor
because of different powder factor are used in each blasting
design. The high energy blasting, which results greater
fragmentation of the rock and therefore reduce the energy in
grinding, is a new practice introduced recently. We build a
model by choosing the calculated throughput as the
dependent variable, hardness, high energy blasting rate and
T&B rate as the independent variables. The testing shows
that the model has a much better R-square value, and all
independent variables are significant. The estimated
coefficient for high energy blasting rate is positive, which is
what we expected. But the estimated coefficient for T&B rate
is also positive, which is a surprise. We expect that the
coefficient is negative because it uses less explosives and
reduces the mill throughput rate due to less fragmentation.
The explanation is that there is a fault line that runs parallel
to the main wall being mined in a pit. This may cause an
increased grindability of the ore blasted in T&B design and
thus yield a positive coefficient for T&B. Additionally, with
finer material entering the mills as a result of high energy
blasting, the larger chunks of ore from the trim and buffer
section may actually serve the function of crushing ball to
improve the grinding rate– particularly in the two AG mills
where the process is reliant on the ore breaking itself up.
To reduce the impact of 12-hour delay from crushers to
stockpiles and to consider the stability of data sets, the data
with finer resolution (e.g., daily data) may not be the most
appropriate and so we choose to build a weekly model of
throughput.
Table 2. Summary of linear weekly model (Throughput ~ TandB + High
Energy +Hardness).
Residuals:
Min 1Q Median 3Q Max
-101.883 -31.613 -7.516 27.981 122.576
Coefficients:
Estimate Std. Error t value Pr(>|t|)
(Intercept) 351.1834 230.8155 1.521 0.137384
TandB 160.8893 61.4587 2.618 * 0.013116
High Energy 216.9825 55.1700 3.933 0.000392 ***
MineTPOH 0.6657 0.1949 3.415 0.001666 **
---
Signif. codes: 0 ‘***’ 0.001 ‘**’ 0.01 ‘*’ 0.05 ‘.’ 0.1 ‘ ’ 1
Residual standard error: 50.65 on 34 degrees of freedom
Multiple R-squared: 0.4263, Adjusted R-squared: 0.3757
F-statistic: 8.422 on 3 and 34 DF, p-value: 0.0002539
In this model, the R-square is 0.4263 and the estimated
coefficient for T&B is 160.8893. Figure 2 shows the actual
mill throughput and the prediction generated by the weekly
model.
Figure 3 shows the performance of the weekly model.
Here, closer to the central line the data points are, the better
the model is. The two parallel dotted lines are ±10% range,
i.e., the data points inside this range are within 10%
difference to the prediction. We can see that only one data
point lies outside this range.
Figure 3. Accuracy of the prediction.
3.3. Polynomial Models for Mill Throughput Rate
We confirm that hardness, T&B rate, high energy blasting
rate are strongly related to the throughput and built a linear
model for them. To improve the accuracy of the model, we
introduce the polynomial terms (including interaction terms)
into the weekly model.
At below, we present the relative importance of the
independent variables, hardness, high energy blasting rate,
T&B rate, in the weekly linear model.

Science Journal of Applied Mathematics and Statistics 2016; 4(2): 81-87 85
Figure 4. Four methods to test the importance of independent variables.
Figure 4 shows the importance of test results by four
different methods, and all of them indicate that high energy
blasting rate (High) and hardness (Hard) are relatively more
important than T&B rate (TandB). It means high energy
blasting rate and hardness can explain more about the
variation of the dependent variable (i.e., mill throughput rate).
So in the polynomial model, we add the following terms:
HM = High · Hard
H1M2 = High · Hard^2
H2M1 = High^2 · Hard
H1M3 = High · Hard^3
H2M2 = High^2 · Hard^2
H3M1 = High^3 · Hard
H1M4 = High · Hard^4
H2M3 = High^2 · Hard^3
H3M2 = High^3 · Hard^2
H4M1 = High^4 · Hard
H2 = High^2
M2 = Hard^2
H3 = High^3
M3 = Hard^3
H4 = High^4
M4 = Hard^4
H5 = High^5
M5 = Hard^5
At first, we use stepwise method to select the model based
on Akaike Information Criterion (AIC). The stepwise method
first includes all the independent variables in the model. Then
it calculates all the AIC values for each model without one of
the independent variables and choose the model with the
smallest AIC value. Iteratively, we do the same for this
chosen model, and pick up the model with the smallest AIC
by adding or deleting another independent variable. Table 3
shows the summary of the model after selection.
Table 3. Summary of polynomial model after AIC selection (Throughput ~
TandB +High + Hard + other interaction terms).
Residuals:
Min 1Q Median 3Q Max
-60.546 -16.620 -1.089 11.588 63.088
Coefficients:
Estimate Std. Error t value Pr(>|t|)
(Intercept) -1.259e+08 9.049e+07 -1.391 0.1822
High Energy -6.643e+07 5.156e+07 -1.288 0.2149
MineTPOH 5.683e+05 3.908e+05 1.454 0.1640
HM 2.312e+05 1.783e+05 1.297 0.2121
M2 -1.024e+03 6.756e+02 -1.516 0.1478
H3 -3.844e+06 2.419e+06 -1.589 0.1305
M3 9.214e-01 5.846e-01 1.576 0.1334
H4 -1.486e+06 7.344e+05 -2.023 0.0591.
M4 -4.137e-04 2.532e-04 -1.634 0.1207
H5 2.099e+05 9.353e+04 2.244 0.0384 *
M5 7.417e-08 4.390e-08 1.689 0.1094
H1M2 -3.022e+02 2.310e+02 -1.308 0.2082
H2M1 2.806e+03 1.874e+03 1.497 0.1527
H2M2 -5.411e+00 3.203e+00 -1.689 0.1094
H1M3 1.759e-01 1.328e-01 1.324 0.2030
H3M1 8.262e+03 4.141e+03 1.995 0.0623.
H1M4 -3.847e-05 2.863e-05 -1.344 0.1967
H2M3 2.533e-03 1.377e-03 1.839 0.0835.
H3M2 -4.085e+00 1.826e+00 -2.238 0.0389 *
H4M1 9.613e+02 5.768e+02 1.667 0.1139
TandB 6.466e+01 6.595e+01 0.980 0.3406
---
Signif. codes: 0 ‘***’ 0.001 ‘**’ 0.01 ‘*’ 0.05 ‘.’ 0.1 ‘ ’ 1
Residual standard error: 41.65 on 17 degrees of freedom
Multiple R-squared: 0.8061, Adjusted R-squared: 0.5779
F-statistic: 3.533 on 20 and 17 DF, p-value: 0.005593

86 Qinglin Yu et al.: Key Performance Indicators for Electricity Conservation in Open Pit Mining
The R-square 0.8061 is good. But there are too many terms
in the model, and it usually performs badly outside the range
of independent variables and results in relatively large
deviations.
Next, we experiment another criterion, BIC, which is a
similar criterion to AIC. It usually chooses a model with
fewer independent variables because it penalizes more when
there are more independent variables in the model. We still
use the stepwise selection method to choose the model. The
chosen model by BIC ends up being the same as the one
selected by AIC.
Thirdly, we turn to Cp criterion. This is a well-known
selection criterion, which suggests the appropriate number of
independent variables to be included in the model:
/ ( 2 )p p allC SSE M SE n p= − −
where MSEall is the mean squared error for the model
including all the available independent variables, and SSEp is
the sum of squared error of the model with p independent
variables.
We use the forward method to select the model. It adds
parameters to the model and choose the best one for each
model with different number of parameters. For each best
model we can calculate Cp and choose the one that has the
smallest difference between Cp and the number of parameters
which is p. The model with eight parameters including the
intercept turned out to be the best one. Table 4 shows the
summary of this model.
Table 4. Summary of polynomial model after Cp selection (Throughput ~
Hard + TandB + HM + H2 + H4 + H5 + H1M2).
Residuals:
Min 1Q Median 3Q Max
-75.98 -35.23 -1.90 23.27 100.06
Coefficients:
Estimate Std. Error t value Pr(>|t|)
(Intercept) 2.929e+02 4.475e+02 0.655 0.5177
MineTPOH 7.331e-01 3.953e-01 1.854 0.0735.
HM -9.320e-01 1.251e+00 -0.745 0.4622
H2 4.900e+03 2.527e+03 1.939 0.0619.
H4 -2.808e+04 1.164e+04 -2.413 0.0221 *
H5 3.031e+04 1.219e+04 2.487 0.0187 *
H1M2 2.756e-04 9.954e-04 0.277 0.7838
TandB 1.450e+02 5.650e+01 2.567 0.0155 *
---
Signif. codes: 0 ‘***’ 0.001 ‘**’ 0.01 ‘*’ 0.05 ‘.’ 0.1 ‘ ’ 1
Residual standard error: 45.15 on 30 degrees of freedom
Multiple R-squared: 0.5977, Adjusted R-squared: 0.5039
F-statistic: 6.368 on 7 and 30 DF, p-value: 0.0001237
We see that the R-square is smaller now but the adjusted
R-square doesn’t drop too much. The adjusted R-square is
another indicator that balances the number of independent
variables and the fit of the model. Figure 5 is the plot of
comparison among the prediction currently used in HVC,
actual throughput and the prediction by the new polynomial
model.
The current model used at HVC for predicting throughput
consistently undervalue the actual throughput, partly because
the high energy blasting stared in 2013 was not accounted for.
The new polynomial model includes both the high energy
blasting rate and T&B rate, and results a much better fitting,
and all the data points fall within the 10% error range (see
Figure 6).
Figure 5. Model performance comparison.
Figure 6. 10% error range.
4. Conclusions
In this project, we attempt to determine the key
performance indicators in the mining process which have
significant impact on mill throughput. Taking advantage of
the high-resolution data collected at HVC, we use statistical
techniques to analyze the relation among mill throughput,
energy consumption and key operational factors. Linear
regression models and polynomial models are deployed for
the purposes. Based on the statistical analysis of the models
given in the Section 3, we obtain the following findings:
� There is strong correlation between mill throughput and
electricity intensity. By improving the performance of
mill throughput, it will significantly reduce the
electricity consumption in the mill.
� High energy blasting, hardness and T&B are confirmed
to have a significant impact on mill throughput.
� The polynomial model presented in Section 3 provides a
better prediction of the mill throughput than the model
currently in use.

Science Journal of Applied Mathematics and Statistics 2016; 4(2): 81-87 87
The more accurate prediction from the new model will be
helpful to the management to improve production efficiency
by controlling the high energy blasting and useful in its
operation management and production planning. In the
investigation, we determined the key performance indicators
in relation to mill production and proposed several regression
models for mill throughput. For the further investigation, we
suggest the following refinements and directions:
� Develop a model to link electrical consumption and mill
production directly, and use the model to monitor
energy consumption targets.
� The polynomial model fits the current data set well.
However, it is necessary to conduct the sensitivity
analysis to determine how the model reacts to the high
energy blasting rate beyond the range of current
practice so that the model is suitable for spectrum of all
possible blasting design and avoid the over-fitting and
dependency to the current data set. In the meantime,
conduct cross-validation to verify the fitness of the
polynomial model to other deviations, which is an
important step to take in order to replace the existing
prediction model and to implement the new model in
strategic planning at HVC.
� Identify energy savings contributed to high energy
blasting using polynomial model to quantify the impact
of blasting designs on mill throughput.
Acknowledgements
The authors would like to thank Thompson Rivers
University, Highland Valley Copper Partnership, and Natural
Sciences and Engineering Research Council of Canada for
their generous supports in this research. We would also like
to thank Richard Brewster, Carl Diederichs, James Gu, Chris
LeClair, Donald Noakes, Lincoln Smith, for their
involvements and contribution.
References
[1] N. H. Afgan, M. G. Carvalho, and N. V. Hovanov, Energy system assessment with sustainability indicators, Energy Policy, 2000, 603–612.
[2] W. J. Braun, and D. J. Murdoch, A First Course in Statistical Programming with R, Cambridge University Press, 2007.
[3] B. Burger, K. McCaffery, I. McGaffin, A. Jankovic, W. Valery and D. La Rosa, Batu Hijau model for throughput forecast, mining and milling optimisation, and expansion studies, Advances in Comminution, edited by S. Komar Kawatra, SME publication, March 2006, 461–479.
[4] A. Ebrahimi, The importance of dilution factor for open pit mining projects, SRK Consulting, 2012.
[5] Energy Efficiency Opportunities, Analyses of diesel use for mine haul and transport operations, Department of Resources, Energy and Tourism, Australia, 2010.
[6] Energy Efficiency Opportunities, The downer energy and emissions measure, Department of Resources, Energy and Tourism, Australia, 2011.
[7] C. J. Geyer, Model Selection in R (unpublished manuscript), 2003.
[8] F. Joseph, Toward a sustainable cement industry substudy 5: Key Performance Indicators, World Business Council for Sustainable Development, 2002.
[9] S. R. Khandker, G. B. Koolwal and H. A. Samad, Using key performance indicators to manage energy costs, World Bank Publications, 2010.
[10] T. Rorke, Blasting process improved, African Mining, 2012, 47–50.
[11] W. Valery, A. Jankovic, and B. Sonmez, New methodology to improve productivity of mining operations, Balkan Congress, Turkey, 2011.
[12] J. C. Van Gorp, Using key performance indicators to manage energy costs, Proceedings of the Twenty-Seventh Industrial Energy Technology Conference, New Orleans, LA, May 10-13, 2005, 9–25.
Recommended