Physics Laboratory Manual • Loyd L A B O R A T O R Y 19
The Pendulum— Approximate Simple Harmonic Motion
O B J E C T I V E S • Investigate the dependence of the per iod T of a p e n d u l u m on the length L and the mass M of
the bob. • Demonstrate that the period T of a p e n d u l u m depends sl ightly on the angular ampl i tude of the
oscillation for large angles, b u t that the dependence is negligible for small angular ampl i tude of oscillation.
• Determine an experimental value of the acceleration due to gravity g by comparing the measured per iod of a p e n d u l u m w i t h the theoretical predict ion.
E Q U I P M E N T L I S T • Pendulum clamp, string, and calibrated hooked masses, laboratory t imer
• Protractor and meter stick
T H E O R Y A mass M m o v i n g i n one dimension is said to exhibit simple harmonic motion i f its displacement x f r o m some equi l ibr ium posit ion is described by a single sine or cosine funct ion. This happens w h e n the particle is subjected to a force F directly proport ional to the magnitude of the displacement and directed t o w a r d the e q u i l i b r i u m posit ion. I n equation f o r m this is
F = -kx (Eq. 1)
The period T of the mot ion is the t ime for one complete oscillation, and i t is determined by the mass M and the constant k. The equation that describes the dependence of T on M and k is
(Eq. 2)
T H O M S O N ©2008 Thomson Brooks/Cole, a part ol The Thomson Corporation Jhomsonjre Star l o ^ |fr covered by the copyright hereon may be reproduced or used in any farm or by any means—graphic, electronic, or mechanical, including photocopying recording taping webdistributioa information
BROOKS/COLE storage and retrieval systems, or in any other manner—without the written permission of the publisher.
197
198 Physics Laboratory Manual • Loyd
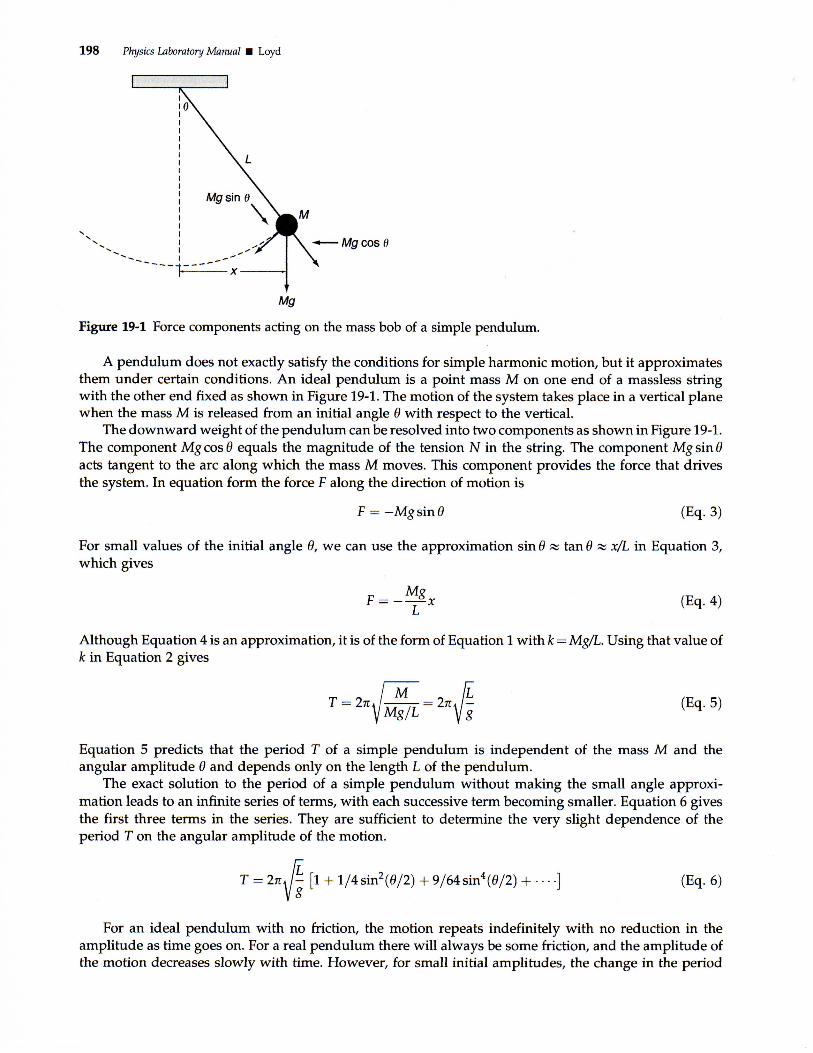
Figure 19-1 Force components acting on the mass bob of a simple pendulum.
A p e n d u l u m does not exactly satisfy the conditions for s imple harmonic mot ion , but i t approximates them under certain conditions. A n ideal p e n d u l u m is a point mass M on one end of a massless string w i t h the other end f ixed as shown i n Figure 19-1. The mot ion of the system takes place i n a vertical plane w h e n the mass M is released f r o m an in i t ia l angle 8 w i t h respect to the vertical.
The d o w n w a r d weight of the p e n d u l u m can be resolved into t w o components as shown i n Figure 19-1. The component Mg cos 9 equals the magnitude of the tension N i n the string. The component Mg sin 6 acts tangent to the arc along w h i c h the mass M moves. This component provides the force that drives the system. I n equation f o r m the force F along the direction of mot ion is
F = -Mg sin 9 (Eq. 3)
For small values of the in i t ia l angle 9, w e can use the approximation sin 9 « tan 9 % x/L i n Equation 3, w h i c h gives
A l t h o u g h Equation 4 is an approximation, i t is of the f o r m of Equation 1 w i t h k = Mg/L. Using that value of k i n Equation 2 gives
T = 2K i / = 2n YMg/L
Equation 5 predicts that the period T of a simple p e n d u l u m is independent of the mass M and the angular ampl i tude 9 and depends only on the length L of the p e n d u l u m .
The exact solution to the per iod of a simple p e n d u l u m w i t h o u t making the small angle approxi mat ion leads to an inf ini te series of terms, w i t h each successive term becoming smaller. Equation 6 gives the first three terms i n the series. They are sufficient to determine the very slight dependence of the period T on the angular ampl i tude of the mot ion .
T = In J - [1 + l/4sin 2(f9/2) + 9/64sin 4(0/2) + ••••] (Eq. 6)
For an ideal p e n d u l u m w i t h no fr ict ion, the mot ion repeats indefinitely w i t h no reduction i n the ampl i tude as t ime goes on. For a real p e n d u l u m there w i l l always be some fr ict ion, and the ampl i tude of the mot ion decreases s lowly w i t h time. However , for small in i t ia l amplitudes, the change i n the per iod
Laboratory 19 • The Pendulum—Approximate Simple Harmonic Motion 199
as the ampl i tude decreases is negligible. This fact is the basis for the p e n d u l u m clock. Pendulum clocks, i n one f o r m or another, have been used for more than 300 years. For more than 100 years, clockmakers have b u i l t extremely accurate clocks by successfully employing devices to compensate for small changes i n the length of the p e n d u l u m caused by temperature variations.
E X P E R I M E N T A L P R O C E D U R E Length
1. The dependence of T on the length of the p e n d u l u m w i l l be determined w i t h a f ixed mass and f ixed angular ampli tude. Place a 0.2000 k g hooked calibrated mass on a str ing w i t h a loop i n one end. Adjust the position at w h i c h the other end of the str ing is c lamped i n the p e n d u l u m clamp u n t i l the distance f r o m the point of support to the center of mass of the hooked mass is 1.0000 m . The length L of each p e n d u l u m is f r o m the point of support to the center of mass of the bob. The center of mass of the hooked masses w i l l usually not be i n the center because the hooked masses are not solid at the bot tom. Estimate h o w m u c h this tends to raise the posit ion of the center of mass and mark the estimated center of mass on each hooked mass.
2. Displace the p e n d u l u m 5.0° f r o m the vertical and release i t . Measure the t ime At for 10 complete periods of mot ion and record that value i n Data Table 1 . I t is best to set the p e n d u l u m i n mot ion, and then begin the t imer as i t reaches the m a x i m u m displacement, counting 10 r o u n d trips back to that position. Repeat this process t w o more times for a total of three trials w i t h this same length. The p e n d u l u m should move i n a plane as i t swings. I f the mass moves i n an elliptical path, i t w i l l lead to error.
3. Repeat the procedure of Step 2, using the same mass and an angle of 5.0° for p e n d u l u m lengths of 0.8000,0.6000,0.5000,0.3000,0.2000, and 0.1000 meters. D o three trials at each length. The length of the p e n d u l u m is f r o m the point of support to the center of mass of the hooked mass.
Mass
1. The dependence of T on M w i l l be determined w i t h the length L and ampl i tude 6 held constant. Place a 0.0500 k g mass on the end of the string and adjust the po int of support of the string u n t i l the p e n d u l u m length is 1.0000 m . Displace the mass 5.0° and release i t . Measure the t ime At for 10 complete periods of the mot ion and record i t i n Data Table 2. Repeat the procedure t w o more times for a total of three trials.
2. Keep the length constant at L= 1.0000 m and repeat the procedure above for M of 0.1000, 0.2000, and 0.5000 kg . Because L is f r o m the point of support to the center of mass, y o u w i l l need to make slight adjustments i n the string length to keep L constant for the different masses.
Amplitude
1. The dependence of T on ampl i tude of the mot ion w i l l be determined w i t h L and M constant. Construct a p e n d u l u m w i t h L = 1.000 m and M = 0.200 kg . Measure the t ime At for 10 complete periods w i t h ampl i tude 5.0°. Repeat t w o more times for a total of three trials at this ampli tude. Record all results i n Data Table 3.
2. Repeat the procedure above for amplitudes of 10.0°, 20.0°, 30.0°, and 45.0°. D o three trials for each ampl i tude and record the results i n Data Table 3.
C A L C U L A T I O N S Length
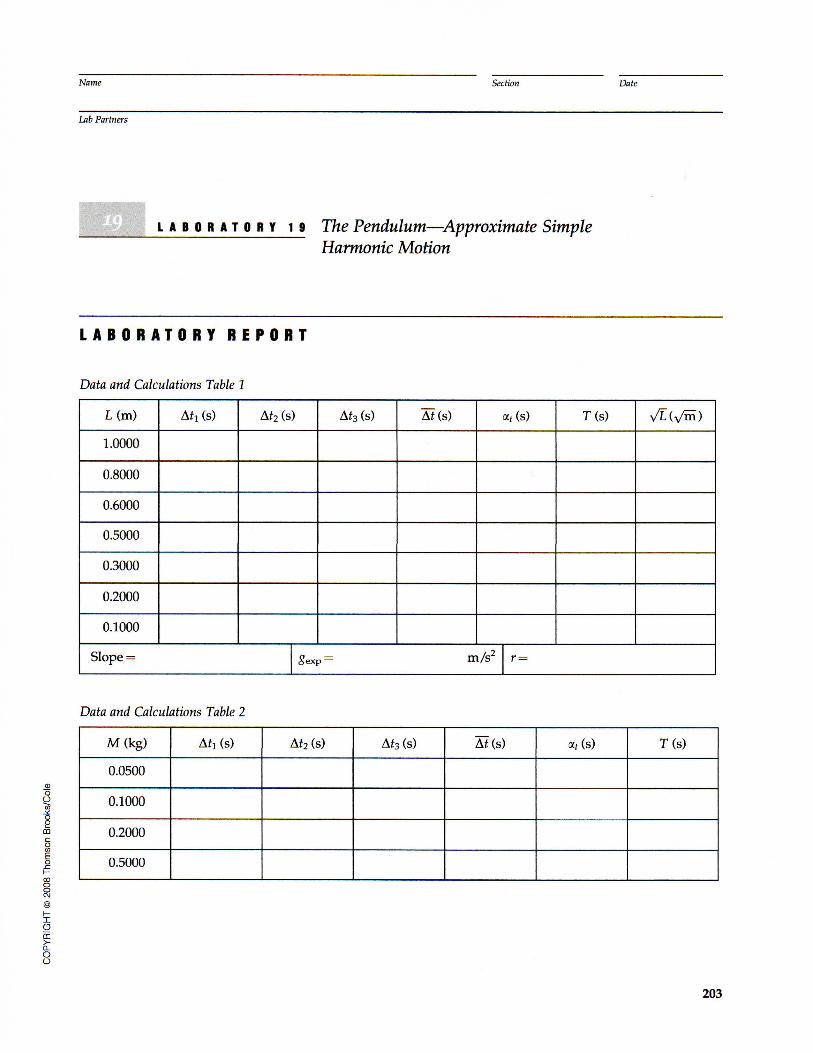
1. Calculate the mean At and standard error at of the three trials for each of the lengths. Record those results i n Calculations Table 1 .
200 Physics Laboratory Manual • Loyd
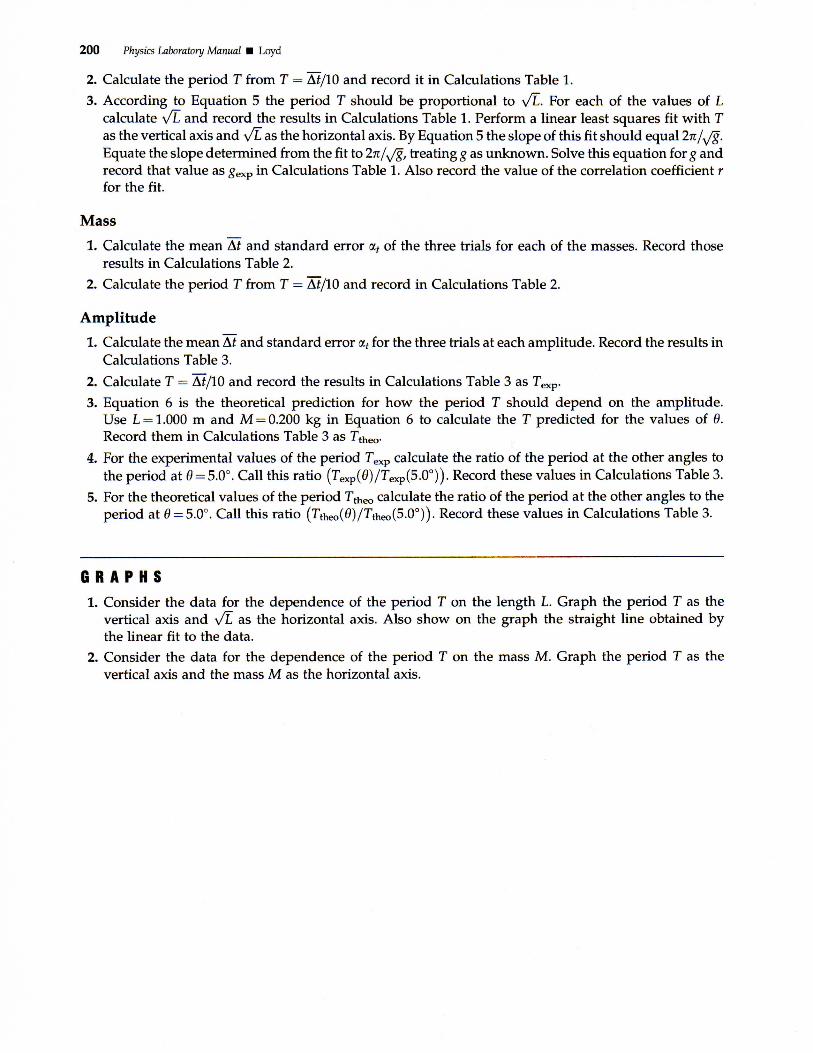
2. Calculate the per iod T f r o m T = At/10 and record i t i n Calculations Table 1 .
3. According to Equation 5 the per iod T should be proport ional to y/L. For each of the values of L calculate vT and record the results i n Calculations Table 1 . Perform a linear least squares f i t w i t h T as the vertical axis and y/L as the horizontal axis. By Equation 5 the slope of this f i t should equal 2n/^/g. Equate the slope determined f r o m the f i t to 2%/^/g, treating g as u n k n o w n . Solve this equation for g and record that value as g e x p i n Calculations Table 1 . Also record the value of the correlation coefficient r for the f i t .
Mass
1 . Calculate the mean At and standard error <xt of the three trials for each of the masses. Record those results i n Calculations Table 2.
2. Calculate the per iod T f r o m T = At/10 and record i n Calculations Table 2.
Amplitude
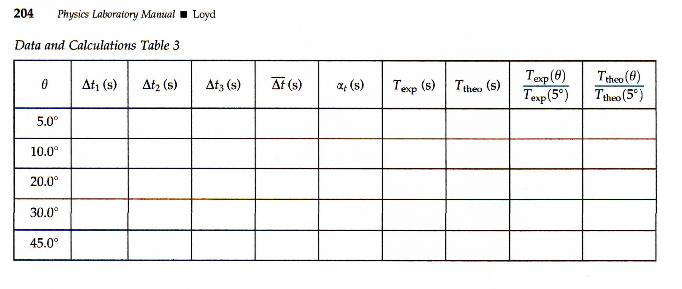
1 . Calculate the mean At and standard error at for the three trials at each ampli tude. Record the results i n Calculations Table 3.
2. Calculate T = Af/10 and record the results i n Calculations Table 3 as T e x p .
3. Equation 6 is the theoretical predict ion for h o w the period T should depend on the ampli tude. Use L —1.000 m and M — 0.200 k g i n Equation 6 to calculate the T predicted for the values of 6. Record them i n Calculations Table 3 as T t h e o .
4. For the experimental values of the per iod T e x p calculate the ratio of the per iod at the other angles to the per iod at 9 = 5.0°. Cal l this ratio (Texp(0)/T e Xp(5.O o)). Record these values i n Calculations Table 3.
5. For the theoretical values of the per iod T t h e o calculate the ratio of the per iod at the other angles to the period at 9 = 5.0°. Cal l this ratio (T theo(#)/Ttheo(5.0°)). Record these values i n Calculations Table 3.
G R A P H S 1. Consider the data for the dependence of the per iod T on the length L. Graph the period T as the
vertical axis and \fL as the horizontal axis. Also show on the graph the straight l ine obtained by the linear f i t to the data.
2. Consider the data for the dependence of the per iod T on the mass M . Graph the per iod T as the vertical axis and the mass M as the horizontal axis.
Name Section Date
Lab Partners
L A B O R A T O R Y 19 The Pendulum—Approximate Simple Harmonic Motion
L A B O R A T O R Y R E P O R T
Data and Calculations Table 1
M m ) Ah (s) Af 2 ( s ) At3 (s) At (s) a.t (s) T(s)
1.0000
0.8000
0.6000
0.5000
0.3000
0.2000
0.1000
Slope = g e x p = m/s2 r =
Data and Calculations Table 2
M ( k g ) Ah (s) Af 2 ( s ) At3 (s) At (s) «f (s) r ( s )
0.0500
0.1000
0.2000
0.5000
204 Physics Laboratory Manual • Loyd
Data and Calculations Table 3
6 Ah (s) At2 (s) At3(s) At(s) at (s) TeXp (s) Ttheo (s) Texp(8) Texp(5 )
Ttheo (#) Ttheo (5°)
5.0°
10.0°
20.0°
30.0°
45.0°
Recommended