LAKE TRASIMENO
BETWEEN PAST AND FUTURE
UNIVERSITA’ DEGLI STUDI DI PERUGIA
DIPARTIMENTO DI CHIMICA, BIOLOGIA E BIOTECNOLOGIE
Alessandro Ludovisi
e-mail : [email protected]

Lake Trasimeno

The past
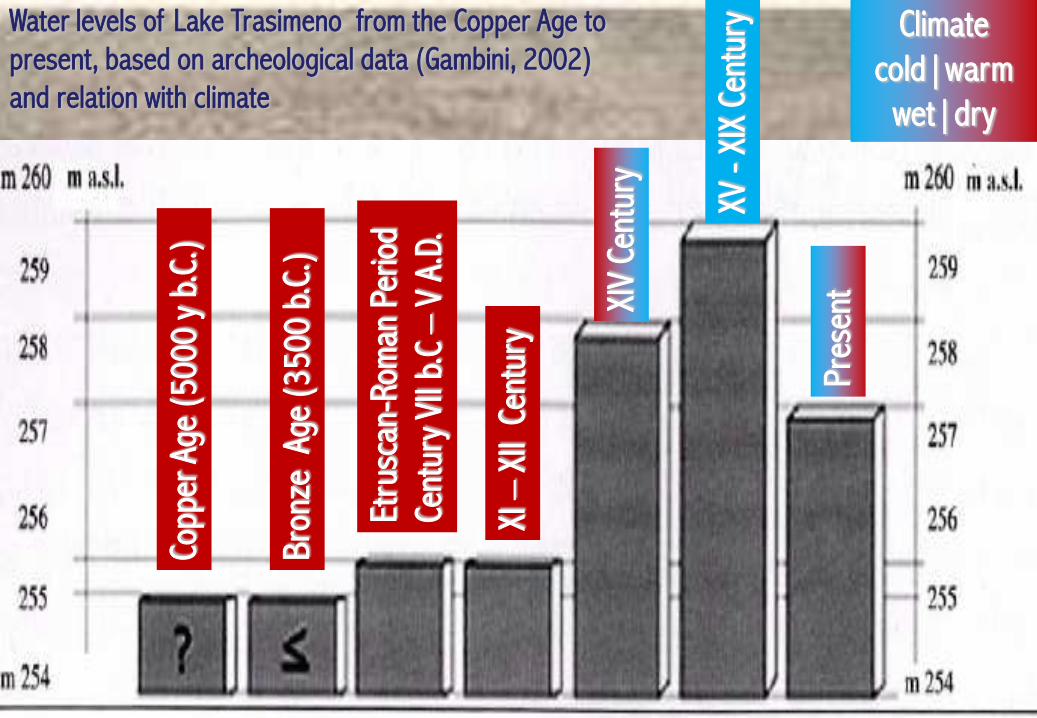
Water levels of Lake Trasimeno from the Copper Age to
present, based on archeological data (Gambini, 2002)
and relation with climate
Bro
nze
Age
(3
50
0 b
.C.)
Etru
scan
-Rom
an P
erio
d
Cent
ury
VII b
.C –
V A
.D.
XI –
XII
Cen
tury
XIV
Cent
ury
XV -
XIX
Cen
tury
Pre
sent
Copp
er A
ge (
50
00
y b
.C.)
Climate
cold|warm
wet|dry
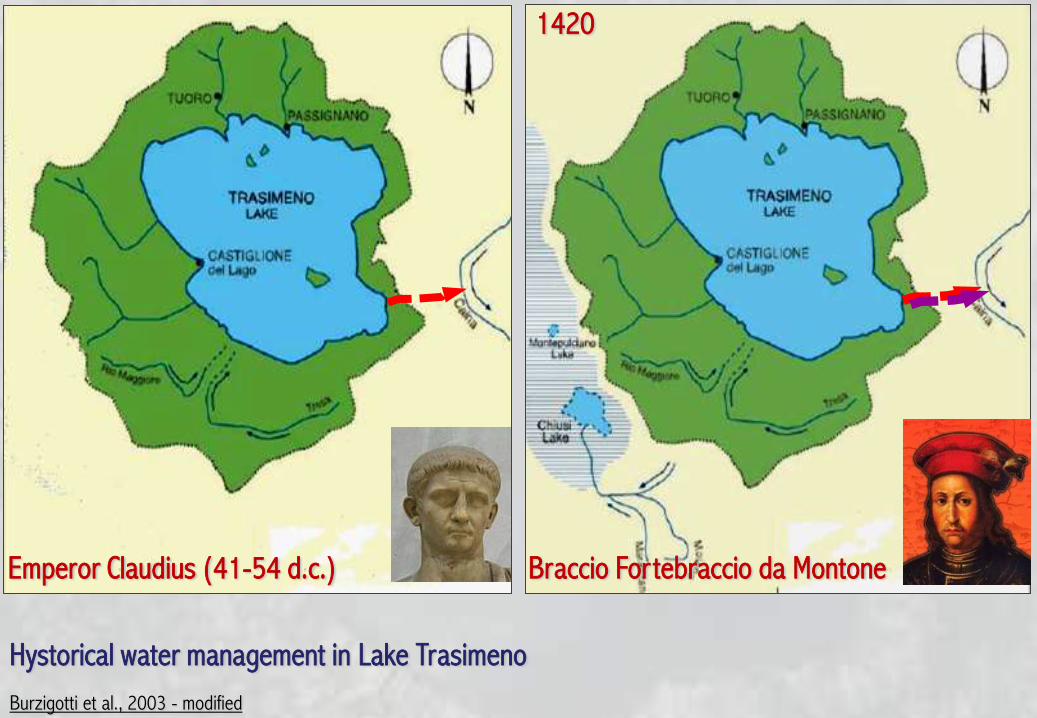
Emperor Claudius (41-54 d.c.)
1420
Braccio Fortebraccio da Montone
Hystorical water management in Lake Trasimeno
Burzigotti et al., 2003 - modified
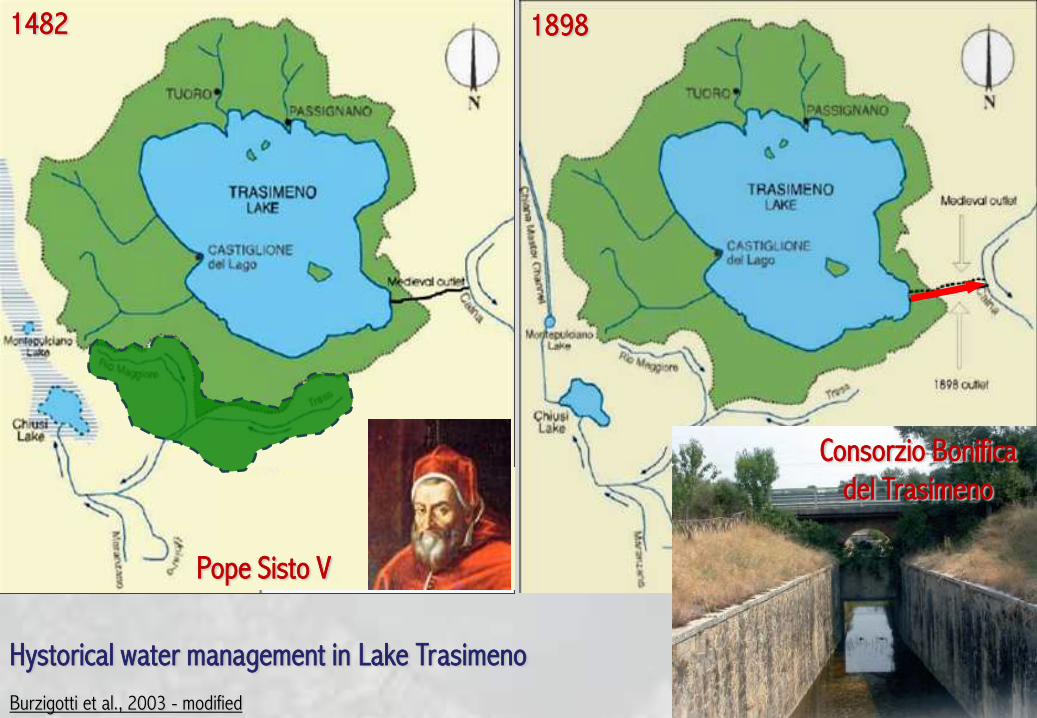
1482
Pope Sisto V
1898
Consorzio Bonifica
del Trasimeno
Hystorical water management in Lake Trasimeno
Burzigotti et al., 2003 - modified

1880 1890 1900 1910 1920 1930 1940 1950 1960 1970 1980 1990 2000
254
255
256
257
258
259
260
261
Alti
tude (
m a
.s.l.
)
Year
2
3
4
5
6
7
Ave
rag
e la
ke d
epth
(m
)
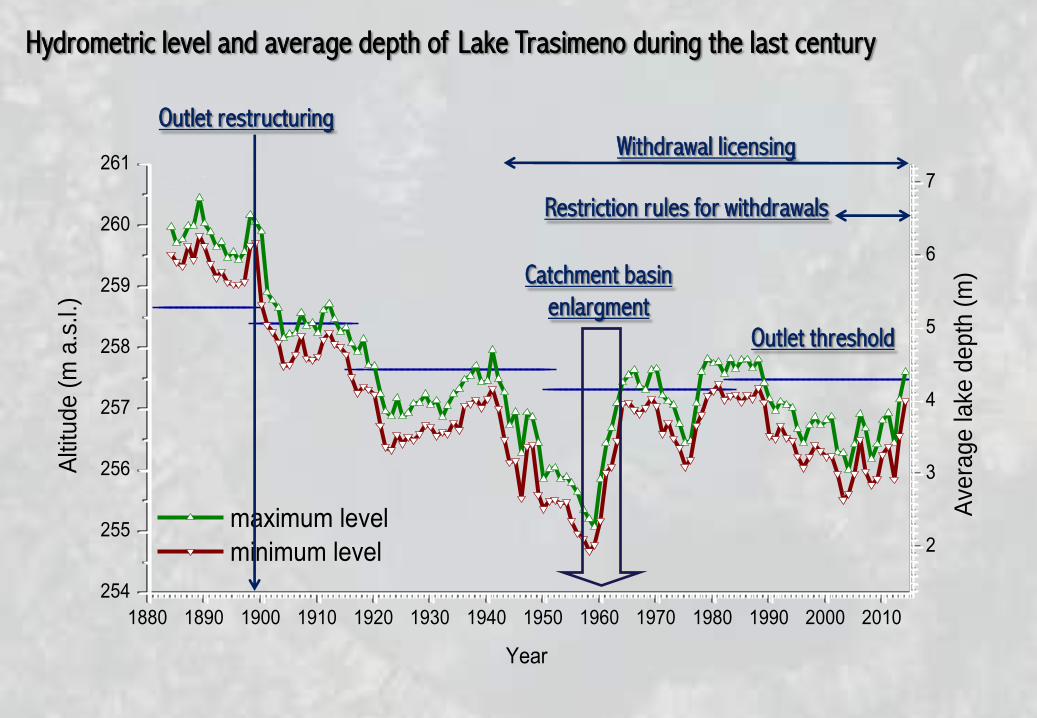
Hydrometric level and average depth of Lake Trasimeno during the last century
Outlet restructuring
Outlet threshold
Withdrawal licensing
8
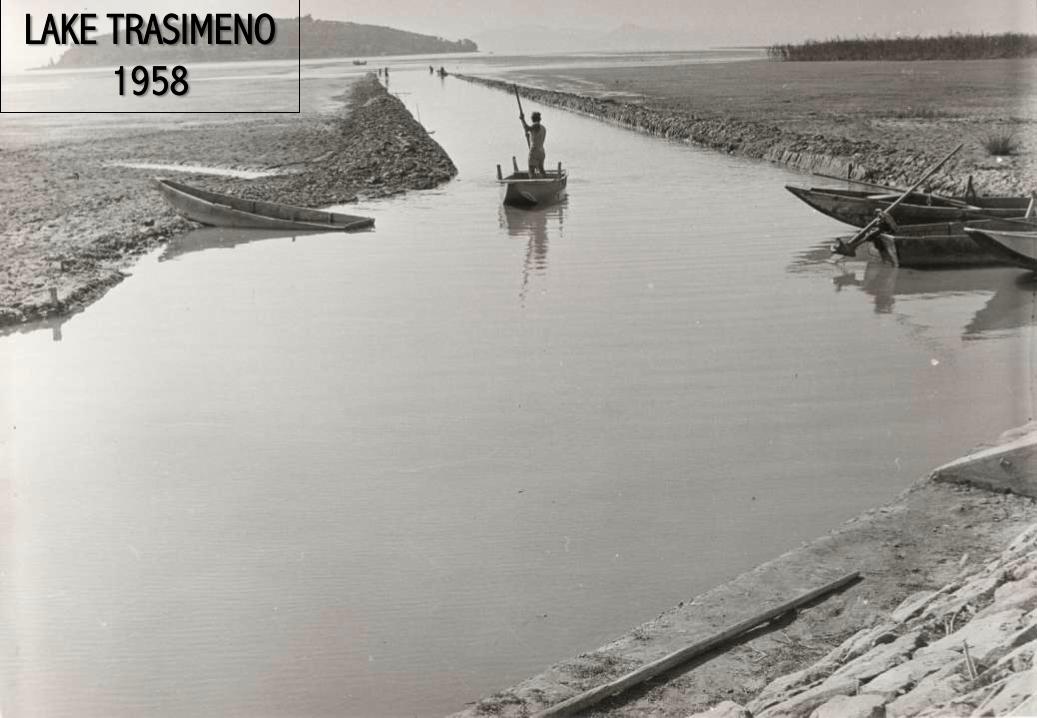
La crisi del 1958 LAKE TRASIMENO
1958

… affecting, in particular:
•Water column stratification and mixing, and thus:
•Water transparency and colour
•Amount of suspended solids in the water column
•Bottom oxygenation
•Nutrients cycling
•Trophic state
•Sedimentation rates
•Salt accumulation
•Macrophyte coverage
•….
….and thus, the whole lake biocoenosys!
THE ARTIFICIAL LOWERING OF LAKE WATERS IN THE FIRST HALF OF THE 20th CENTURY
CAUSED A PROGRESSIVE (AND “IRREVERSIBLE”) SHIFT TOWARDS A CONDITION OF
SHALLOW LAKE!

SEDIMENT RESUSPENSION IN
SHALLOW WATERS
a=surface lake fraction subjected to
resuspension
(Carper & Bachman, 1984)
a=f(D, W, A)
D=average depth
W=wind speed (10 Km h-1)
A= winf fetch
1890 1900 1910 1920 1930 1940 1950 19601.0
0.8
0.6
0.4
0.2
0.0
a
Year
3
4
5
6
7
Av
era
ge
la
ke
de
pth
(m
)
Gaino et al. (2012) Hydrobiologia
Shallow lakes
1890 1900 1910 1920 1930 1940 1950 196010
15
20
25
Year
TS
S (m
g l
-1 )
Estimated historical trends of the theoretical fraction of the lake surface
subject to resuspension and Total Suspended Solids (TSS ) in a central
site exposed to a wind of 3 m s-1
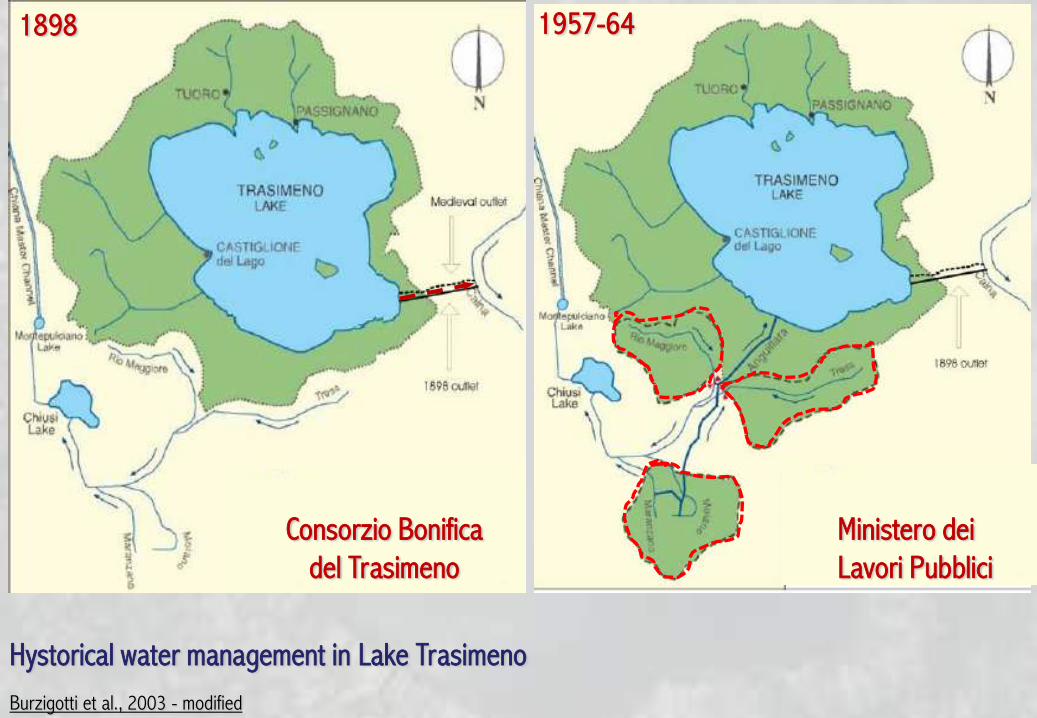
1957-64
Ministero dei
Lavori Pubblici
1898
Consorzio Bonifica
del Trasimeno
Hystorical water management in Lake Trasimeno
Burzigotti et al., 2003 - modified
1880 1890 1900 1910 1920 1930 1940 1950 1960 1970 1980 1990 2000 2010
254
255
256
257
258
259
260
261
Alti
tud
e (
m a
.s.l.
)
Year
2
3
4
5
6
7
Ave
rag
e la
ke d
ep
th (
m)
maximum level
minimum level
Hydrometric level and average depth of Lake Trasimeno during the last century
Outlet restructuring Withdrawal licensing
Restriction rules for withdrawals
Outlet threshold
Catchment basin
enlargment
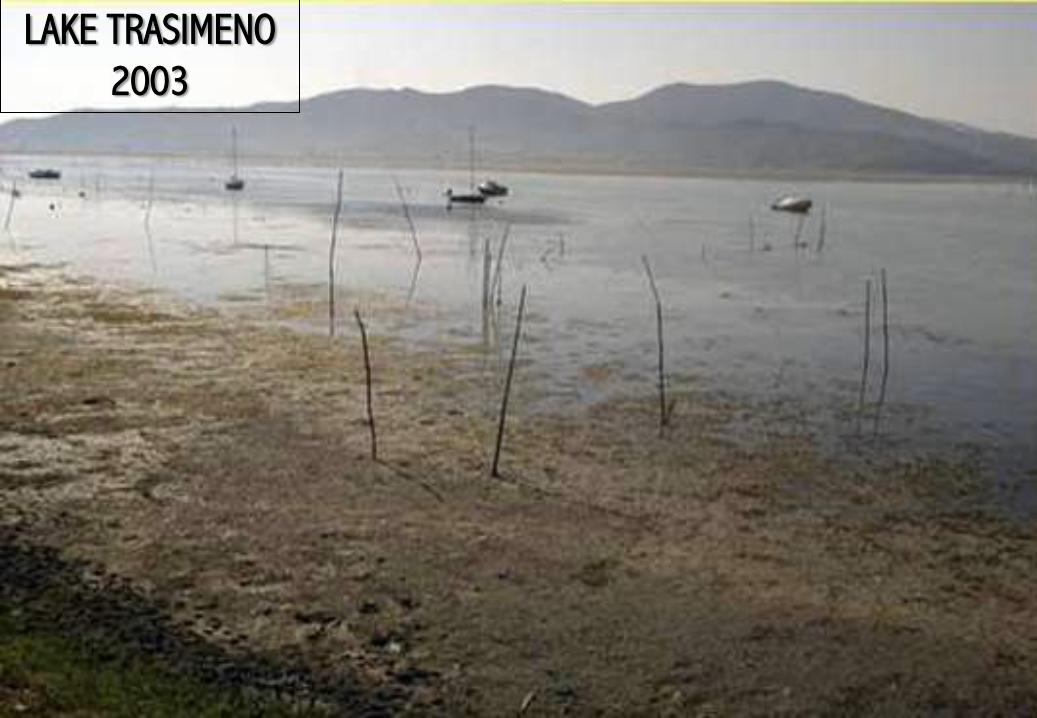
LAKE TRASIMENO
2003
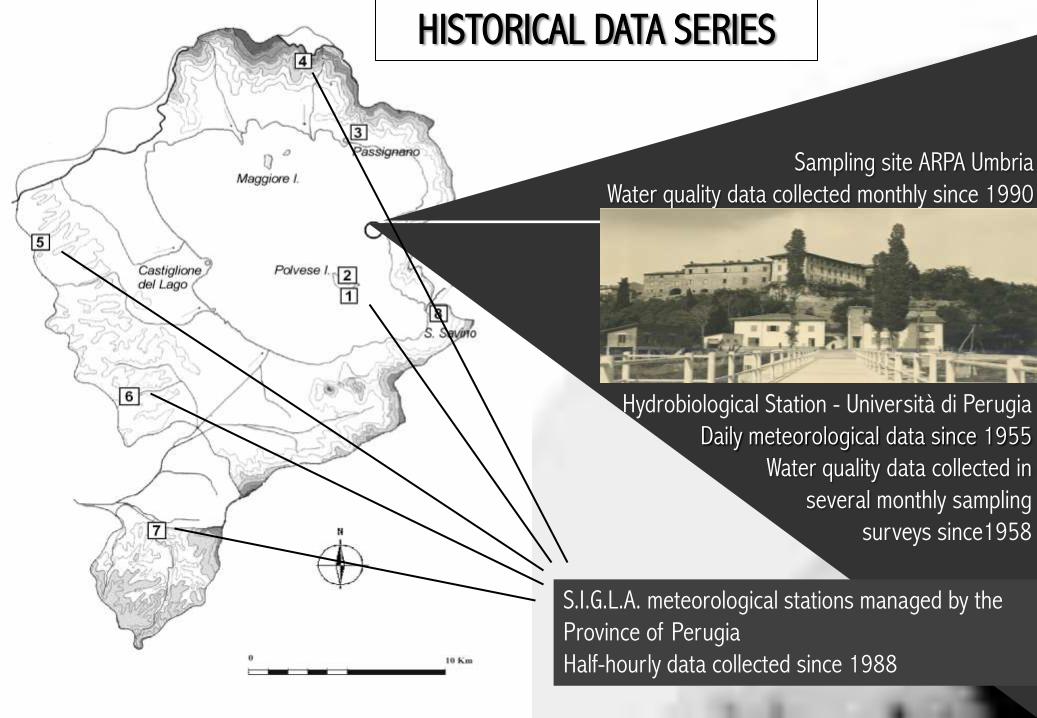
Sampling site ARPA Umbria
Water quality data collected monthly since 1990
Hydrobiological Station - Università di Perugia
Daily meteorological data since 1955
Water quality data collected in
several monthly sampling
surveys since1958
HISTORICAL DATA SERIES
S.I.G.L.A. meteorological stations managed by the
Province of Perugia
Half-hourly data collected since 1988
1955 1960 1965 1970 1975 1980 1985 1990 1995 2000 2005 2010
300
400
500
600
700
800
900
1000
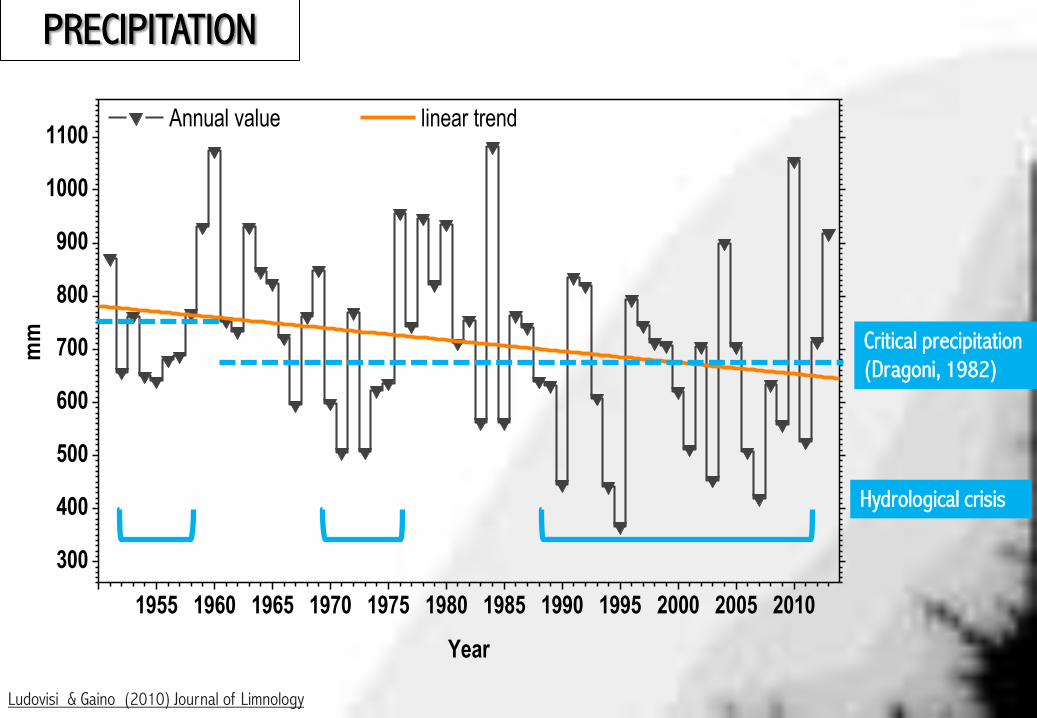
1100 Annual value linear trend
mm
Year
Hydrological crisis
Critical precipitation
(Dragoni, 1982)
PRECIPITATION
Ludovisi & Gaino (2010) Journal of Limnology
1965 1970 1975 1980 1985 1990 1995 2000 2005 201012
13
14
15
16
°C
Year
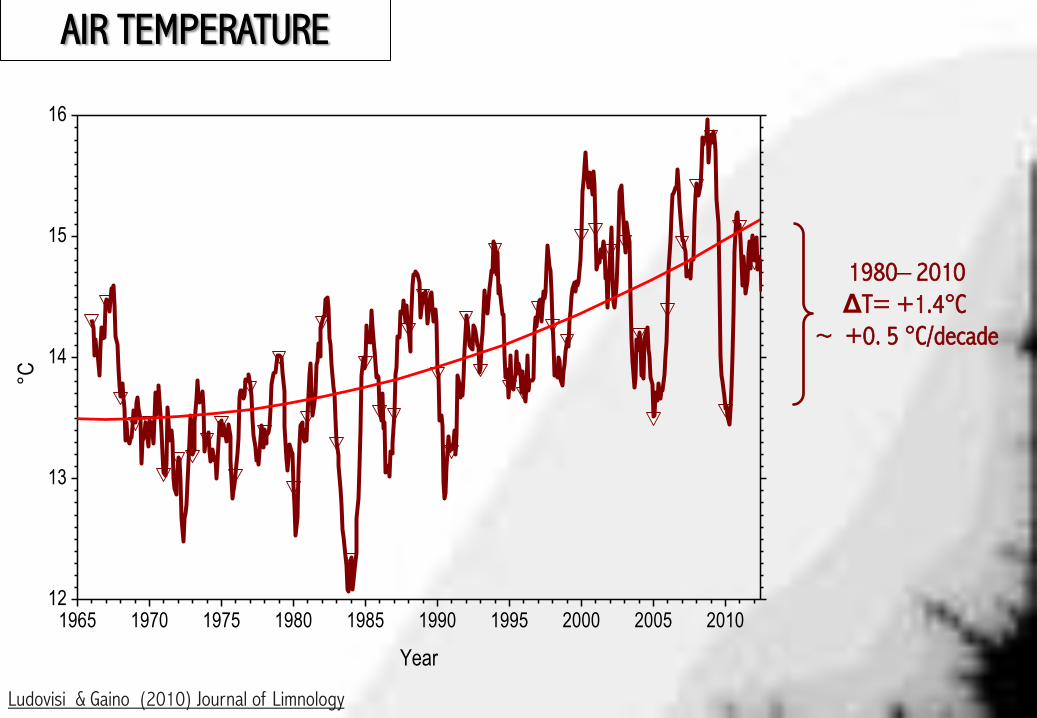
1980– 2010
ΔT= +1.4°C
~ +0. 5 °C/decade
AIR TEMPERATURE
Ludovisi & Gaino (2010) Journal of Limnology
1970 1980 1990 2000 2010
400
600
800
1000
1200
1400
1600
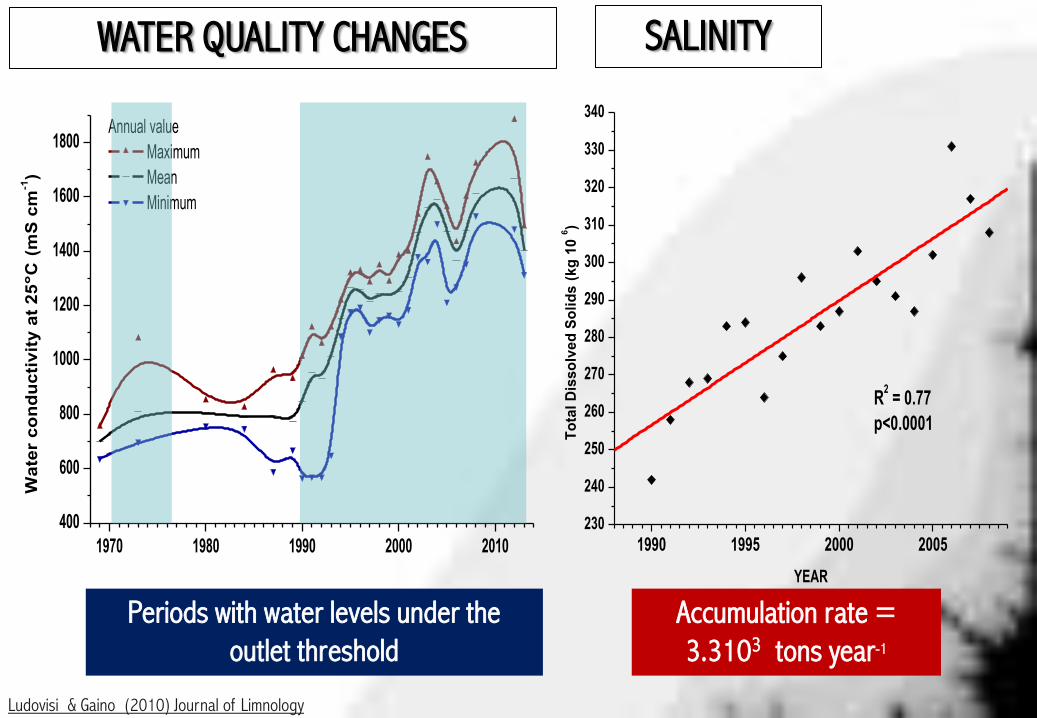
1800Annual value
Maximum
Mean
Minimum
Wa
ter
co
nd
uc
tiv
ity
at
25
°C
(m
S c
m-1)
Year
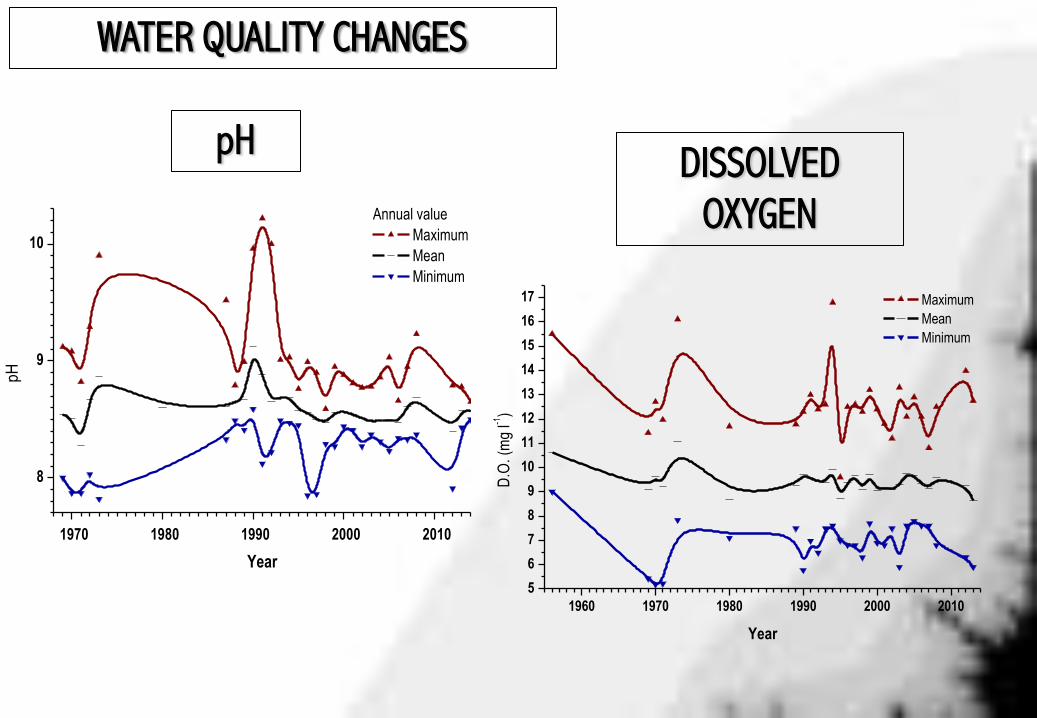
WATER QUALITY CHANGES
1990 1995 2000 2005230
240
250
260
270
280
290
300
310
320
330
340
To
tal
Dis
so
lve
d S
oli
ds
(k
g 1
0 6
)YEAR
R2 = 0.77
p<0.0001
SALINITY
Accumulation rate =
3.3103 tons year-1
Periods with water levels under the
outlet threshold
Ludovisi & Gaino (2010) Journal of Limnology
ALKALINITY
1970 1980 1990 2000 2010
120
140
160
180
200
Polynomial Regression for Data1_Alcmax:
Y = A + B1 * X
Parameter Value Error
------------------------------------------------------------
A -232.07957 540.60124
B1 0.21162 0.271
------------------------------------------------------------
R-Square(COD)SD N P
------------------------------------------------------------
0.03277 11.35775 20 0.44501
------------------------------------------------------------
Polynomial Regression for Data1_Alcmed:
Y = A + B1 * X
Parameter Value Error
------------------------------------------------------------
A -1583.80976 385.69726
B1 0.88023 0.19334
------------------------------------------------------------
R-Square(COD)SD N P
------------------------------------------------------------
0.53521 8.1033 20 2.4664E-4
------------------------------------------------------------
Polynomial Regression for Data1_Alcmin:
Y = A + B1 * X
Parameter Value Error
------------------------------------------------------------
A -2395.33953 455.34856
B1 1.27839 0.22826
------------------------------------------------------------
R-Square(COD)SD N P
------------------------------------------------------------
0.63538 9.56663 20 <0.0001
------------------------------------------------------------
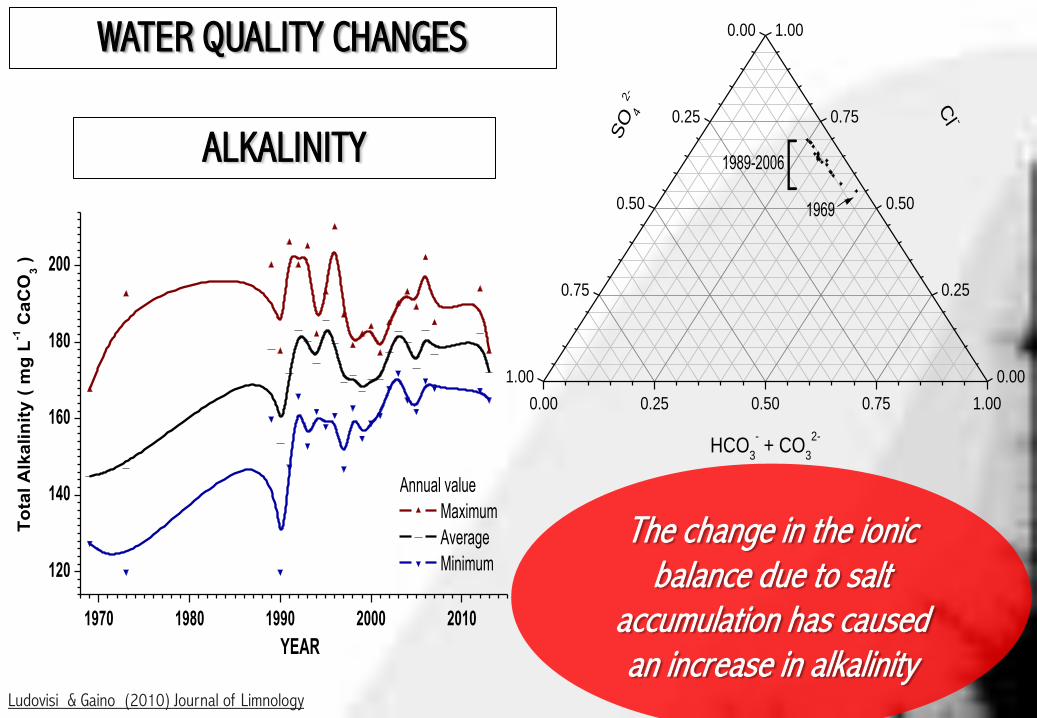
Annual value
Maximum
Average
Minimum
To
tal
Alk
alin
ity (
mg
L-1 C
aC
O3 )
YEAR
WATER QUALITY CHANGES
Ludovisi & Gaino (2010) Journal of Limnology
0.00 0.25 0.50 0.75 1.00
0.00
0.25
0.50
0.75
1.00 0.00
0.25
0.50
0.75
1.00
[1989-2006
1969
SO
42-
Cl -
HCO3
- + CO
3
2-
The change in the ionic balance due to salt
accumulation has caused an increase in alkalinity
1970 1980 1990 2000 2010
8
9
10
Polynomial Regression for Data1_pHmin:
Y = A + B1 * X
Parameter Value Error
------------------------------------------------------------
A -13.83996 7.05535
B1 0.01108 0.00354
------------------------------------------------------------
R-Square(COD)SD N P
------------------------------------------------------------
0.29851 0.20278 25 0.00472
------------------------------------------------------------
Polynomial Regression for Data1_pHmax:
Y = A + B1 * X
Parameter Value Error
------------------------------------------------------------
A 36.05187 15.05388
B1 -0.01353 0.00756
------------------------------------------------------------
R-Square(COD)SD N P
------------------------------------------------------------
0.12225 0.43267 25 0.08666
------------------------------------------------------------
Polynomial Regression for Data1_pHmed:
Y = A + B1 * X
Weight given by Data1_pHerr error bars.
Parameter Value Error
------------------------------------------------------------
A 21.19367 3.54945
B1 -0.00633 0.00178
------------------------------------------------------------
R-Square(COD)SD N P
------------------------------------------------------------
0.35531 6.35695 25 0.00166
------------------------------------------------------------
Annual value
Maximum
Mean
Minimum
pH
Year
pH
1960 1970 1980 1990 2000 2010
5
6
7
8
9
10
11
12
13
14
15
16
17 Maximum
Mean
Minimum
D.O
. (m
g l-1
)
Year
WATER QUALITY CHANGES
DISSOLVED
OXYGEN

1960 1970 1980 1990 2000 2010
0.00
0.02
0.04
0.06
0.08
0.10Annual value
Maximum
Average
Minimum
SR
P (
mg
L-1)
Year
1960 1970 1980 1990 2000 2010
0.00
0.02
0.04
0.06
0.08
0.10
0.12
0.14
0.16
0.18
0.20Annual value
Maximum
Mean
Minimum
To
tal P
ho
spo
rou
s (m
g l-1
)
Year
1960 1970 1980 1990 2000 2010
0
10
20
30
40
50
60
Annual Value
Maximum
Mean
Minimum
Chl
orop
hyll a
(
g l-1
)
Year
1960 1970 1980 1990 2000 2010
0
1
2
3
4Annual value
Maximum
Mean
Minimum
Sec
chi d
epth
(m
)
Year
WATER QUALITY CHANGES TROPHIC STATE AND TRANSPARENCY
Eutrophy
Mesotrophy
Eutrophy
Mesotrophy
Eutrofphy
Mesotrophy
Ludovisi & Gaino (2010) Journal of Limnology
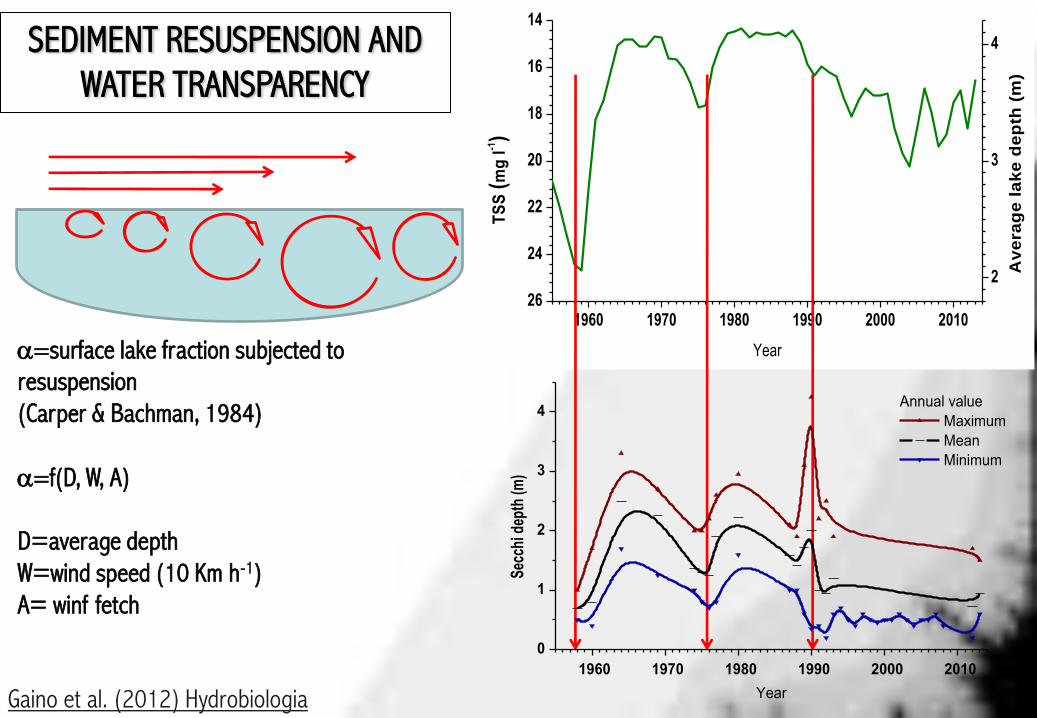
SEDIMENT RESUSPENSION AND
WATER TRANSPARENCY
a=surface lake fraction subjected to
resuspension
(Carper & Bachman, 1984)
a=f(D, W, A)
D=average depth
W=wind speed (10 Km h-1)
A= winf fetch
1960 1970 1980 1990 2000 201026
24
22
20
18
16
14
TS
S (
mg
l-1)
Year
2
3
4
Av
era
ge
la
ke
de
pth
(m
)
Gaino et al. (2012) Hydrobiologia
1960 1970 1980 1990 2000 2010
0
1
2
3
4Annual value
Maximum
Mean
Minimum
Sec
chi d
epth
(m)
Year

THE FUTURE SCENARIOS
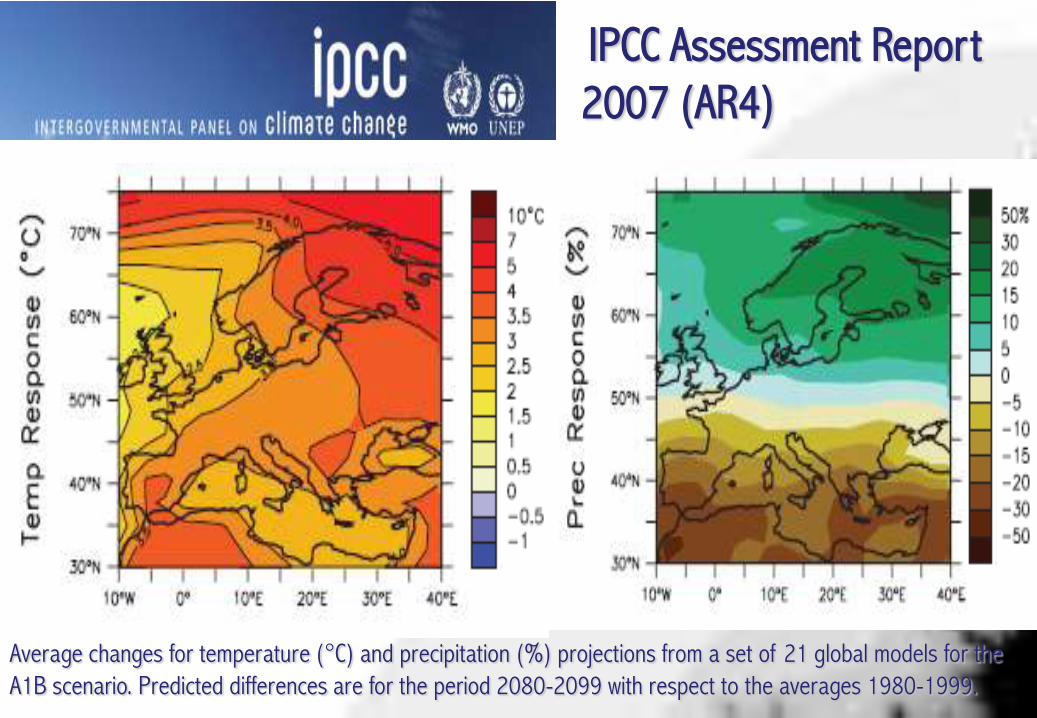
Average changes for temperature (°C) and precipitation (%) projections from a set of 21 global models for the
A1B scenario. Predicted differences are for the period 2080-2099 with respect to the averages 1980-1999.
IPCC Assessment Report
2007 (AR4)

SOUTHERN EUROPE / MEDITERRANEAN
IPCC Report 2007: Regional averages of changes for temperature (°C) and precipitation
(%) projections from a set of 21 global models for the A1B scenario. Predicted differences
are for the period 2080-2099 with respect to the averages 1980-1999. The signal is
assumed to increase linearly with time.
IPCC Assessment Report
2007 (AR4)
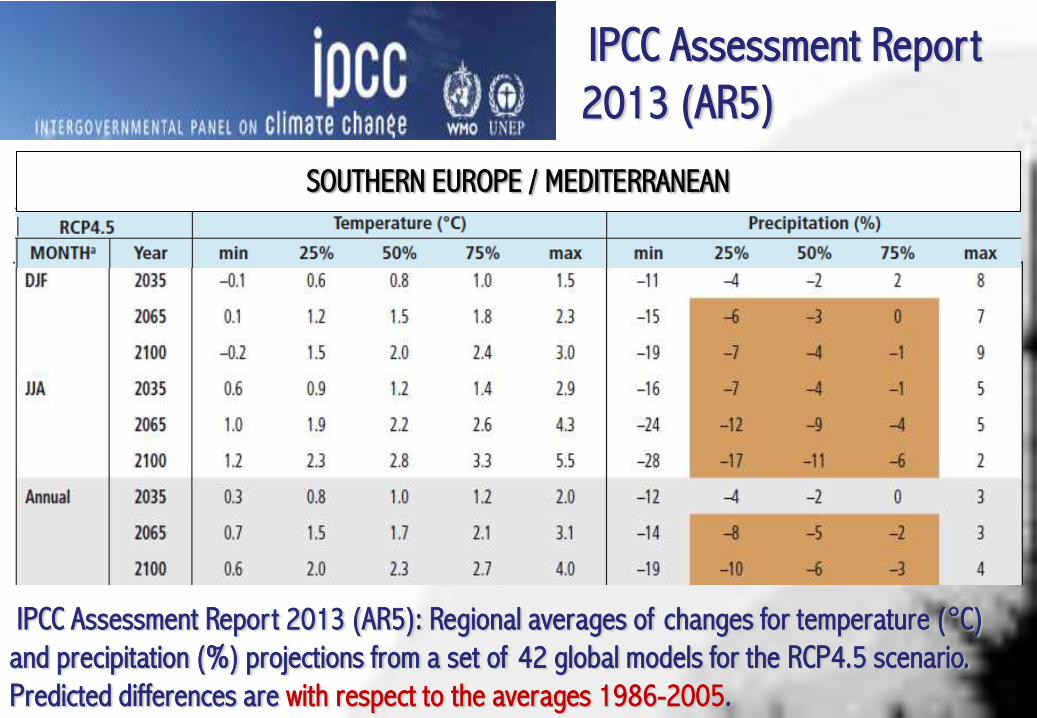
IPCC Assessment Report 2013 (AR5): Regional averages of changes for temperature (°C)
and precipitation (%) projections from a set of 42 global models for the RCP4.5 scenario.
Predicted differences are with respect to the averages 1986-2005.
SOUTHERN EUROPE / MEDITERRANEAN
IPCC Assessment Report
2013 (AR5)
1980
1990
2000
2010
2020
2030
2040
2050
2060
2070
2080
2090
2100
13
14
15
16
17
18
19
20 T_observed
T_IPCC_50
T_IPCC_min
T_IPCC_max
Tem
per
atu
re (
°C)
Year
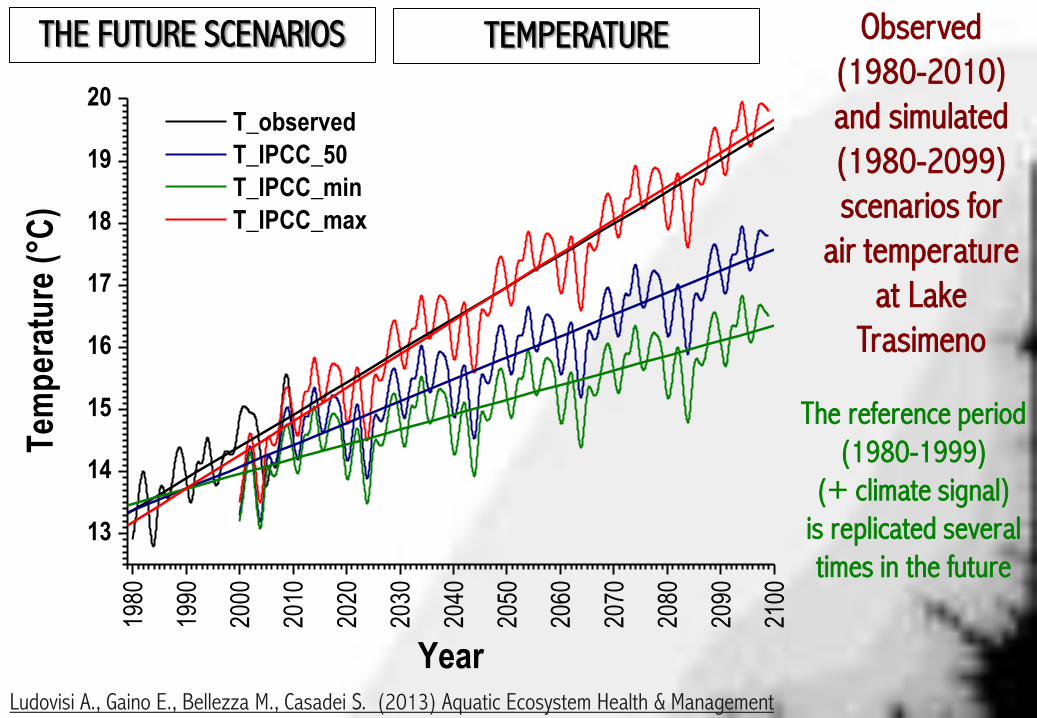
Observed
(1980-2010)
and simulated
(1980-2099)
scenarios for
air temperature
at Lake
Trasimeno
The reference period
(1980-1999)
(+ climate signal)
is replicated several
times in the future
THE FUTURE SCENARIOS TEMPERATURE
Ludovisi A., Gaino E., Bellezza M., Casadei S. (2013) Aquatic Ecosystem Health & Management

19
80
19
90
20
00
20
10
20
20
20
30
20
40
20
50
20
60
20
70
20
80
20
90
21
00
100
200
300
400
500
600
700
800
900
1000
P_observed
P_IPCC_50
P_IPCC_min
P_IPCC_max
Pre
cip
ita
tio
n (
mm
ye
ar-1
)
Year
Observed
(1980-2010)
and simulated
(1980-2099)
scenarios for
precipitation
at Lake
Trasimeno
The reference period
(1980-1999)
(+ climate signal)
is replicated several
times in the future
THE FUTURE SCENARIOS PRECIPITATION
Ludovisi A., Gaino E., Bellezza M., Casadei S. (2013) Aquatic Ecosystem Health & Management
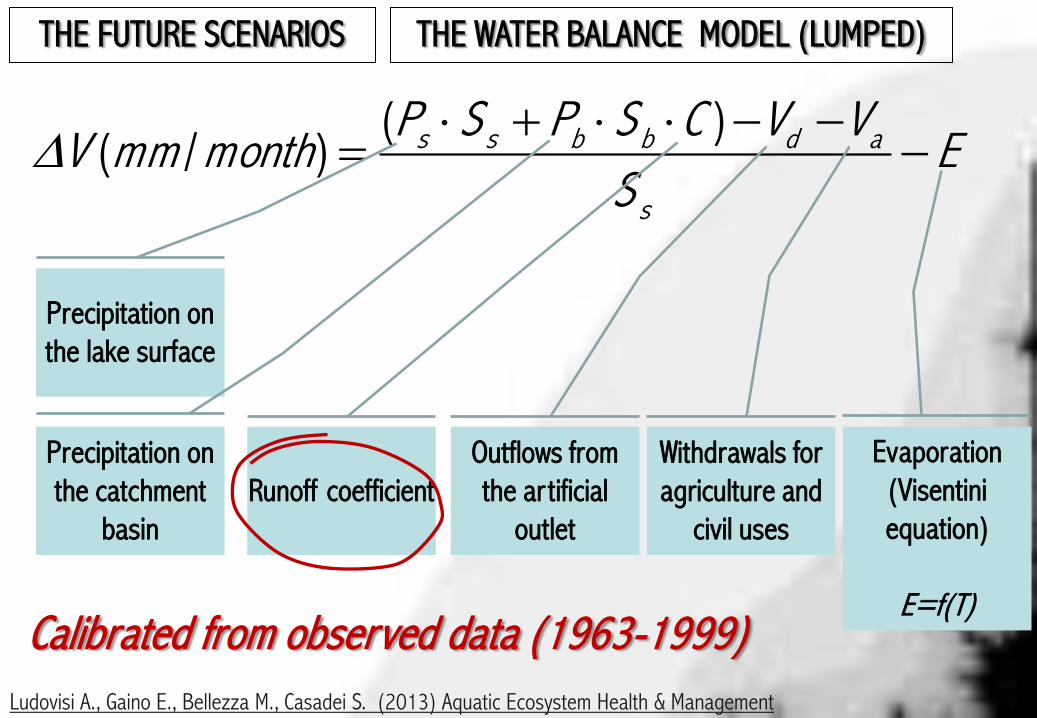
THE WATER BALANCE MODEL (LUMPED)
ES
VVCSPSPmonthmmV
s
adbbss
=)(
)/(
Precipitation on
the lake surface
Precipitation on
the catchment
basin
Runoff coefficient
Outflows from
the artificial
outlet
Withdrawals for
agriculture and
civil uses
Evaporation
(Visentini
equation)
E=f(T) Calibrated from observed data (1963-1999)
THE FUTURE SCENARIOS
Ludovisi A., Gaino E., Bellezza M., Casadei S. (2013) Aquatic Ecosystem Health & Management

Jan Feb Mar Apr May Jun Jul Aug Sep Oct Nov Dec0.0
0.1
0.2
0.3
0.4
0.5
C
Month
MODEL CALIBRATION
Average monthly runoff coefficient in the calibration
period (1963- 1999 )
0.32
(annual average)
19
60
19
65
19
70
19
75
19
80
19
85
19
90
19
95
20
00
20
05
20
10
20
15
20
20
20
25
20
30
20
35
20
40
20
45
20
50
20
55
20
60
20
65
20
70
20
75
20
80
20
85
252.0
252.5
253.0
253.5
254.0
254.5
255.0
255.5
256.0
256.5
257.0
257.5
258.0
Wa
ter
lev
el
( m
a.
s.
l. )
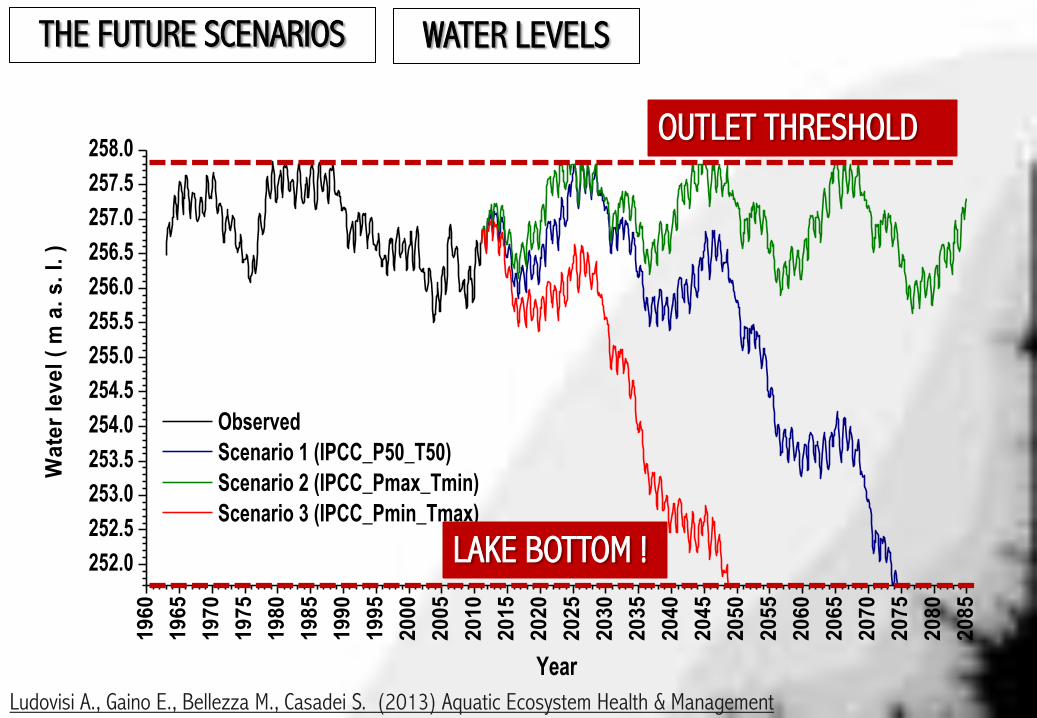
Year
Observed
Scenario 1 (IPCC_P50_T50)
Scenario 2 (IPCC_Pmax_Tmin)
Scenario 3 (IPCC_Pmin_Tmax)
THE FUTURE SCENARIOS
OUTLET THRESHOLD
LAKE BOTTOM !
WATER LEVELS
Ludovisi A., Gaino E., Bellezza M., Casadei S. (2013) Aquatic Ecosystem Health & Management

WATER FROM MONTEDOGLIO
Since 2012 :
1-2 Mm3 year−1 to agriculture
DIRECT INPUT TO THE LAKE ??

19
60
19
65
19
70
19
75
19
80
19
85
19
90
19
95
20
00
20
05
20
10
20
15
20
20
20
25
20
30
20
35
20
40
20
45
20
50
20
55
20
60
20
65
20
70
20
75
20
80
20
85
252.0
252.5
253.0
253.5
254.0
254.5
255.0
255.5
256.0
256.5
257.0
257.5
258.0
Wa
ter
lev
el
( m
a.
s.
l. )
Year
Observed
Scenario 1 (IPCC_P50_T50) + 10 Mm-3/year
Scenario 3 (IPCC_Pmin_Tmax) + 10 Mm-3/year
THE FUTURE SCENARIOS
(with strong mitigation) OUTLET THRESHOLD
LAKE BOTTOM !
Abolition of abstraction licensing +10 Mm3 year−1 of
water input from external basins.
Ludovisi A., Gaino E., Bellezza M., Casadei S. (2013) Aquatic Ecosystem Health & Management

LAKE TRASIMENO
May 2014
…the water level exceeds
the outlet threshold after
25 years!
Recommended