2/18/2015
1
LDL and the Benefits
of Statin Therapy
Allan Sniderman
McGill University
ACC/AHA did not recommend a
target-based approach. Right?
P 2899 “The Expert Panel was unable to find any RCTs
that evaluated titration of all individuals in a treatment
group to specific LDL-C targets <100 mg/dl or <70
mg/dl, nor were any RCTs comparing 2 LDL-C treatment
targets identified. No statin RCTs reporting on-
treatment non-HDL-C levels were identified.”
P 2901 “ The Expert Panel did not find evidence to
support titrating cholesterol-lowering drug therapy to
achieve optimal LDL-C or non-HDL-C levels because the
clinical trials were essentially fixed-dose trials.”

2/18/2015
2
Table 4 Recommendations for Treatment of Blood
Cholesterol to Reduce Atherosclerotic Cardiovascular
Risk in Adults p 2900
“Recommendations: Treatment Targets
1. The Expert Panel makes no recommendation
for or against specific LDL-C or non-HDL-C
targets for the primary or secondary
prevention of ASCVD.
ACC/AHA LOE –”
What did ACC/AHA actually recommend re Targets?
Summary of Key Recommendations for the Treatment
of Blood Cholesterol to reduce ASCVD risk in Adults
Table 3 Recommendations
• 2 c Achieve at least a 50% decrease in LDL-C
• C 1 Assess adherence, response to therapy, and adverse clinical effects within 4-12 weeks following statin initiation or changes in therapy. – Anticipated therapeutic response ≥ 50% reduction in
baseline LDL-C for high intensity statins and 30% to 50% for moderate intensity statins …
• E. Less than anticipated response iii) Increase statin intensity, or if on maximally-tolerated statin intensity, consider addition of nonstatin therapy in selected high-risk individuals.’
But is that what ACC/AHA recommended?
2/18/2015
3
The Two Core Papers
• The Risk-Benefit Paradigm vs the Causal Exposure Paradigm: LDL as a primary cause of vascular disease.
J Clin Lipidology 2014; 8:594-605.
• The Causal Exposure Paradigm vs the Risk Factor Paradigm
BMJ. 2014;348:g3047
The Risk Benefit Guidelines Model
• All Guidelines state that the decision to lower
LDL should primarily be based on risk.
• Based on the HPS and the CTT meta-analysis,
all Guidelines state that the benefit of statins
is related to risk not to the level of LDL.
• The maximal dose of statins is the preferred
dose as more has been shown to better than
less.
2/18/2015
4
The Evidence Pillars of the Risk Model
I. The Heart Protection Study
• Benefit of statin therapy are constant and
independent of the level of LDL and related to
the baseline risk.
• Benefits the same above and below LDL C 80
mg/dl
II. Cholesterol Treatment Trialists
• The relative benefit of statins is constant.
Lowering LDL C by 1 mmol/L (40 mg/dl) reduces
risk by 20%.
HPS: details about
the 80 mg/dl finding
• HPS reported that the reduction in clinical events was the ‘same order of magnitude’ in those with an initial LDL-C <80 mg/dl as in those with an LDL-C above this level. (data was not shown)
• However, in HPS, LDL-C was determined by direct measurement and the values obtained by the method that was used are approximately 20 mg/dl lower than the average values calculated by the Friedewald equation.
• Therefore, HPS direct 80 mg/dl= Friedewald 100 mg/dl.
How much Gold is there in the
Golden Rule of the CTT?
• CTT reported that reduction of LDL-C by 1
mmol/L (38.5 mg/dl) resulted in an
approximately 20% reduction in the event
rate and this rate of reduction was the same
as any given baseline level of LDL-C.
• This has been interpreted as the benefit of
statin therapy is determined by the baseline
risk and not by the baseline level of LDL-C
2/18/2015
5
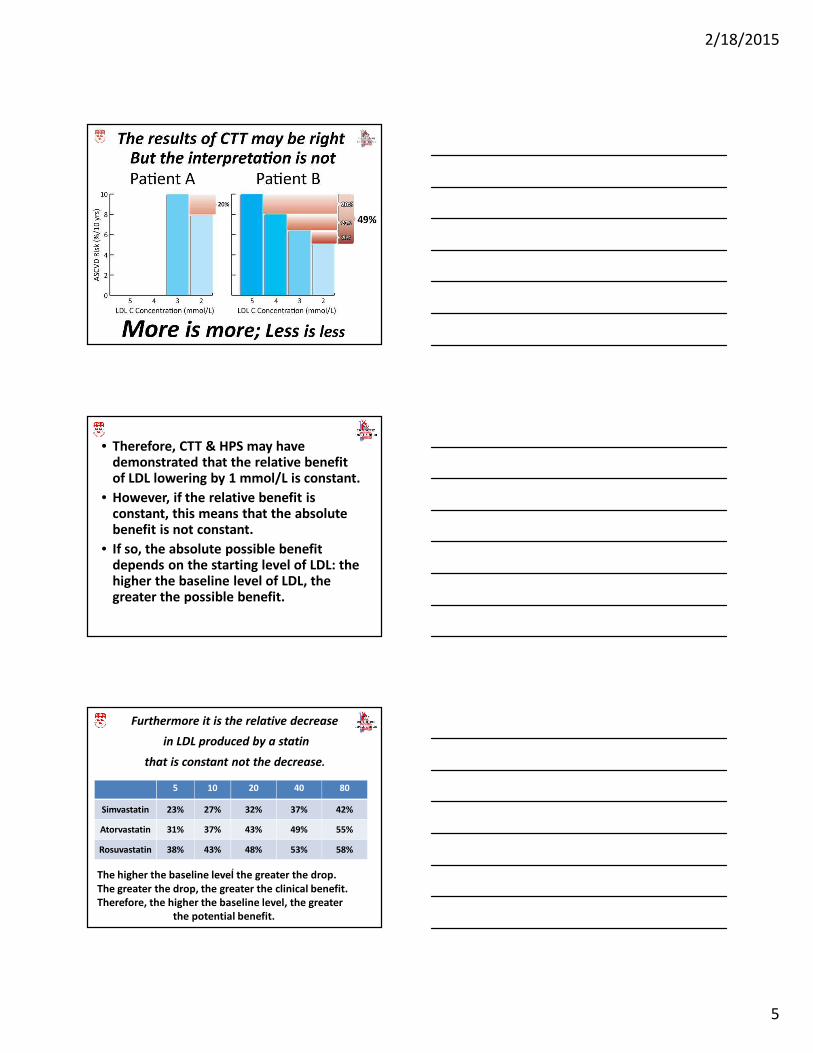
• Therefore, CTT & HPS may have demonstrated that the relative benefit of LDL lowering by 1 mmol/L is constant.
• However, if the relative benefit is constant, this means that the absolute benefit is not constant.
• If so, the absolute possible benefit depends on the starting level of LDL: the higher the baseline level of LDL, the greater the possible benefit.
Furthermore it is the relative decrease
in LDL produced by a statin
that is constant not the decrease.
5 10 20 40 80
Simvastatin 23% 27% 32% 37% 42%
Atorvastatin 31% 37% 43% 49% 55%
Rosuvastatin 38% 43% 48% 53% 58%
.The higher the baseline level the greater the drop.
The greater the drop, the greater the clinical benefit.
Therefore, the higher the baseline level, the greater
the potential benefit.
2/18/2015
6
Yet another limitation to the
ACC/AHA Regimen-Based Approach
• There is no RCT evidence that A80>A40 or
even >A20. That is, there is no RCT evidence
that high dose statin > moderate dose statin
• Side effects of statins: myalgia, diabetes,
renal failure are related to dose.
• Adherence related to side effects.
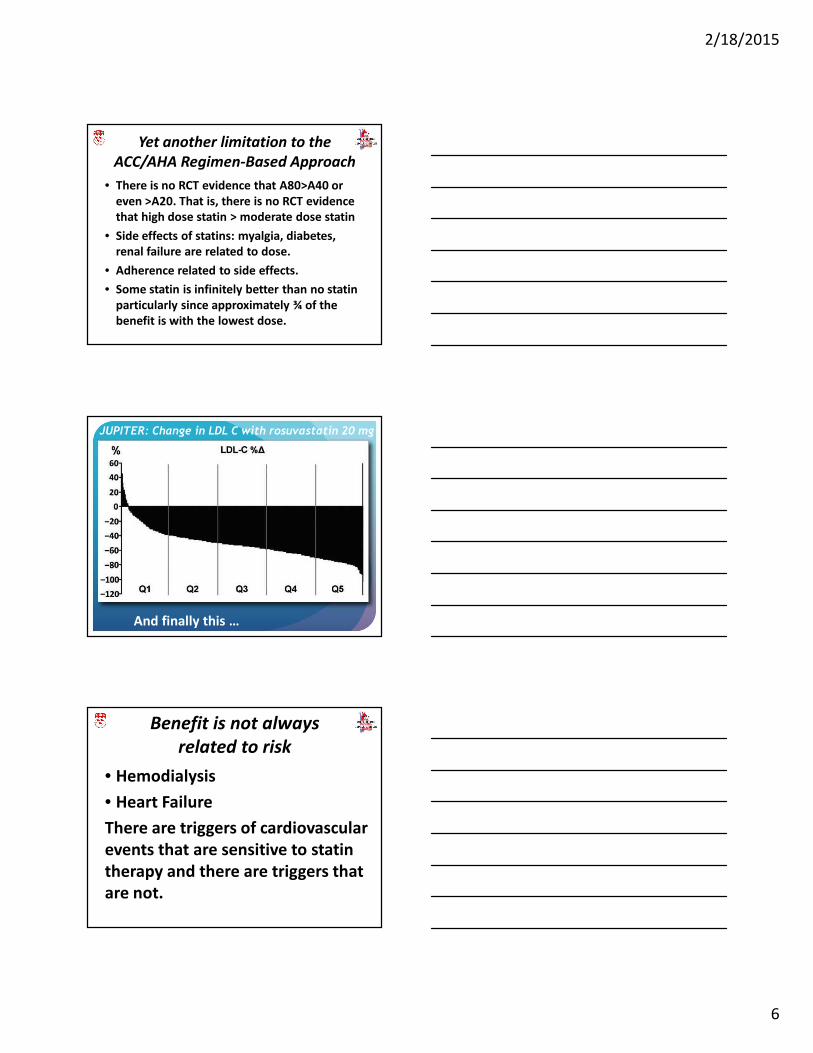
• Some statin is infinitely better than no statin
particularly since approximately ¾ of the
benefit is with the lowest dose.
JUPITER: Change in LDL C with rosuvastatin 20 mg
And finally this …
Benefit is not always
related to risk
• Hemodialysis
• Heart Failure
There are triggers of cardiovascular
events that are sensitive to statin
therapy and there are triggers that
are not.
2/18/2015
7
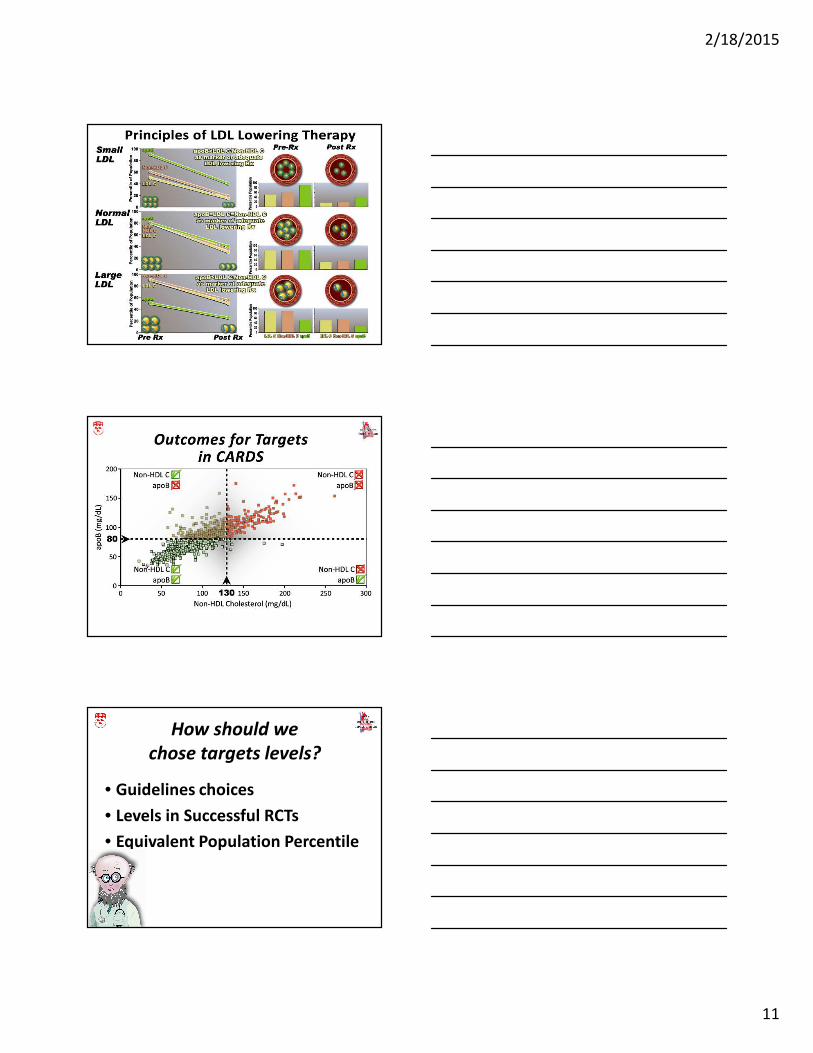
The LDL Benefit Model
• Risk is the consequence of the
intramural arterial disease produced by
LDL and the other causal factors of
atherosclerosis.
• LDL injures the wall over time.
• Benefit from LDL lowering therapy
relates to the absolute level of LDL and
the absolute lowering of LDL.
• ApoB is the best marker of LDL.
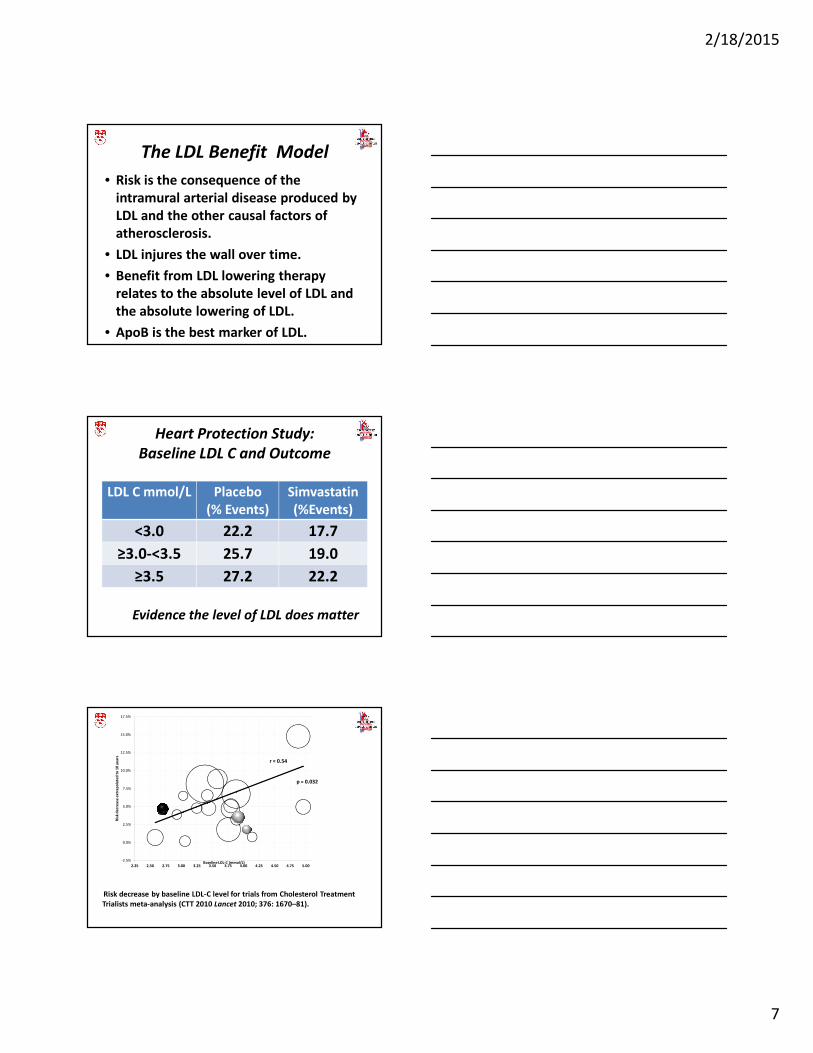
Heart Protection Study:
Baseline LDL C and Outcome
LDL C mmol/L Placebo
(% Events)
Simvastatin
(%Events)
<3.0 22.2 17.7
≥3.0-<3.5 25.7 19.0
≥3.5 27.2 22.2
Evidence the level of LDL does matter
-2.5%
0.0%
2.5%
5.0%
7.5%
10.0%
12.5%
15.0%
17.5%
2.25 2.50 2.75 3.00 3.25 3.50 3.75 4.00 4.25 4.50 4.75 5.00
Ris
k d
ecr
ea
se e
xtr
ap
ola
ted
to
10
ye
ars
Baseline LDL-C (mmol/L)
Risk decrease by baseline LDL-C level for trials from Cholesterol Treatment
Trialists meta-analysis (CTT 2010 Lancet 2010; 376: 1670–81).
r = 0.54
p = 0.032
2/18/2015
8
RCT evidence statin benefit
relates to LDL
• JUPITER on-Rx risk substantially less once on-Rx LDL-C <70 mg/dl (Mora et al JACC 2012; 307: 1302)
• TNT once pre-Rx factors taken into account, post-Rx LDL-C not predictive of future events
(Mora et al Circulation 2012;125:1979)
• CARE & LIPID: the higher the baseline LDL-C, the higher the event rate (Sacks et al Circulation 2000;102:1893)
IMPROVE-IT demonstrates that if
there is not much LDL to begin with,
there is not much benefit to
further lowering of LDL.
“In IMPROVE-IT, at seven years, 32.7 percent of patients taking
ezetimibe experienced a primary endpoint event compared to
34.7 percent of patients taking simvastatin alone (hazard ratio of
0.936, p=0.016). Based on the LDL-C range compared in the
study’s treatment arms (at one year, a mean LDL-C of 53 mg/dL
versus 70 mg/dL, respectively), the 6.4 percent relative risk
reduction observed in the ezetimibe arm in IMPROVE-IT was
consistent with the treatment effect that had been projected
based on prior studies of statins.”

2/18/2015
9
Where there really no Target
Trials as ACC-AHA state?
Actually, 6 trials (AFCAPS/TexCAPS,
MEGA, TNT, PROVE-IT, GREACE, Post-
CABG) state they were target trials-
that is, regimens were selected to
produce a prespecified level of LDL-C.
0.5
1.0
1.5
2.0
2.5
3.0
3.5
4.0
- - -
HR
re
lati
ve t
o 2
SD
s b
elo
w m
ea
n
ApoB level (standard deviations above mean)
Risk Pre Rx
Risk Post
Rx
0 1 2ApoB (mg/dl) 85 112 139
Risk vs Benefit
Benefit
2/18/2015
10
Benefit as HR per SD
decrease in marker
Marker Benefit
LDL C 1.24 (1.18-1.31)
Non-HDL C 1.24 (1.18-1.31)
apoB 1.31 (1.22-1.40)
Relations of change in plasma levels of LDL-C, non-HDL-C and apoB with risk
reduction from statin therapy: a meta-analysis of randomized trials.
Thanassoulis G, Williams K, et al J Am Heart Assoc. 2014 ;3(2):e000759
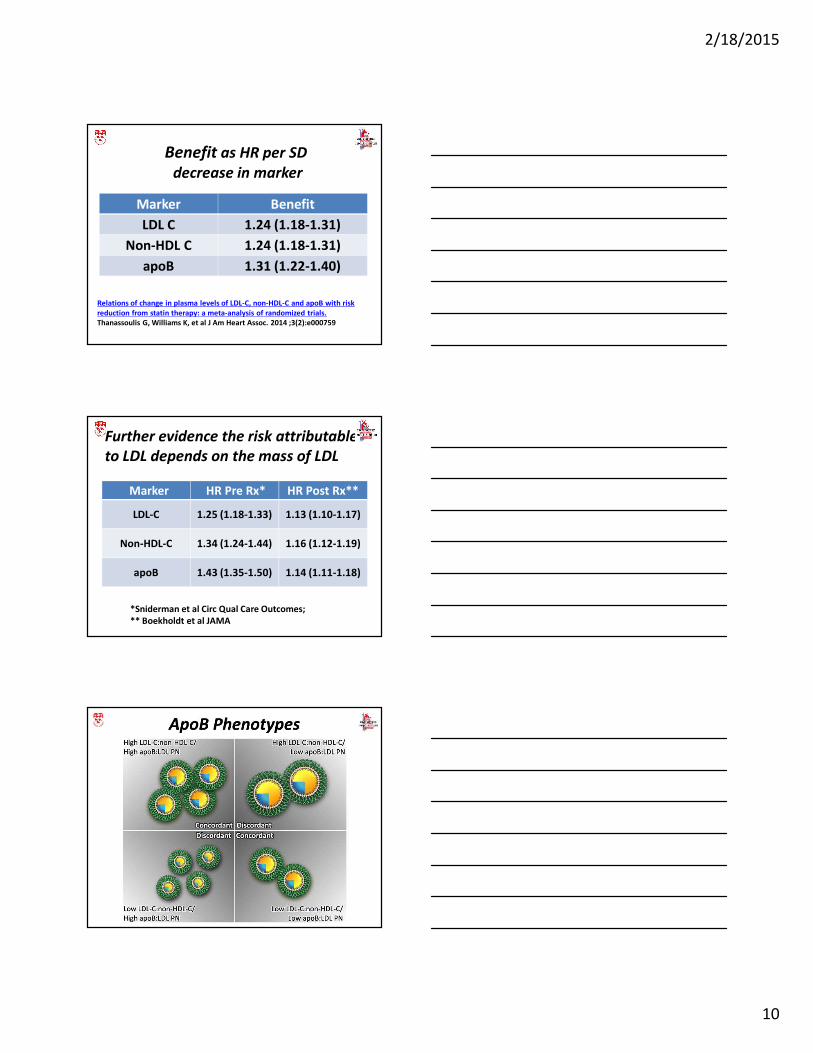
Further evidence the risk attributable
to LDL depends on the mass of LDL
Marker HR Pre Rx* HR Post Rx**
LDL-C 1.25 (1.18-1.33) 1.13 (1.10-1.17)
Non-HDL-C 1.34 (1.24-1.44) 1.16 (1.12-1.19)
apoB 1.43 (1.35-1.50) 1.14 (1.11-1.18)
*Sniderman et al Circ Qual Care Outcomes;
** Boekholdt et al JAMA
2/18/2015
11
How should we
chose targets levels?
• Guidelines choices
• Levels in Successful RCTs
• Equivalent Population Percentile
2/18/2015
12
On Rx Population Percentiles in the 6 statin RCTs
with LDL C<80 mg/dl
LDL C Non-HDL C apoB
TNT 12 14 66
IDEAL 15 15 41
JUPITER 3 3 15
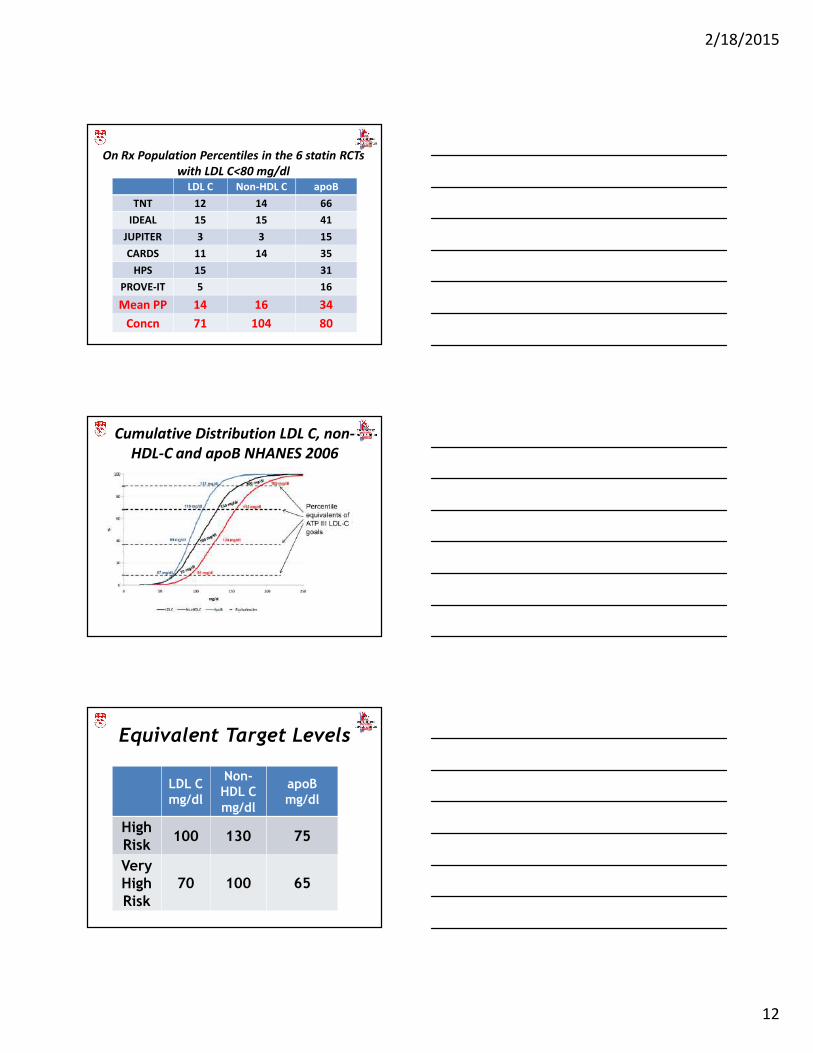
CARDS 11 14 35
HPS 15 31
PROVE-IT 5 16
Mean PP 14 16 34
Concn 71 104 80
Cumulative Distribution LDL C, non-
HDL-C and apoB NHANES 2006
Equivalent Target Levels
LDL C
mg/dl
Non-
HDL C
mg/dl
apoB
mg/dl
High
Risk100 130 75
Very
High
Risk
70 100 65

2/18/2015
13
Recommended


![Statin-Associated Muscle Disease: Advances in …...statin therapy because of side effects [12], making SAMS a serious public health problem. Patients stopping [13]oralter-ing their](https://img.pdfslide.net/doc/110x75/5f3496e8b771331bb838384a/statin-associated-muscle-disease-advances-in-statin-therapy-because-of-side.jpg)