Leading engineering and expertise service company in industrial equipment segment
Etteplan Oyj

Contents
Etteplan as an investment object Financial development Outlook 2010 Detailed financial information

Leading expert in industrial technology
Vision: ”The number one partner for each customer” The aim is to grow organically at least 10% annually Market value approximately € 55 million, listed since 2000 Revenue in 2009 almost € 100 million, personnel over 1 500 Three complementing service areas
expertise services operational services global key customers
Operations in China from year 2004, operating permit in Russia from year 2009

Strong competitive position
Leading position No. 1 in Finland Among 15 biggest in Europe
Long-term customers global leading machinery and
equipment manufacturers as customers 75% of revenue comes from 30 largest
customers Cost effective solutions
China Leading edge competence
broad technical competence profound knowledge of customer’s
product lines and products effective design processes

Profitable growth
Listing to stock exchange in 2000
Company acquisitions in Finland and Sweden from year 2000
From year 2003, significant industrial customers transfer assignments to Etteplan
Project operations commence in Russia in 2000
Strong growth in China from year 2004
Market share among clientele grows 2008-2009 – framework agreements
Boosting operations with divestments and operations adjustments in 2009
Operating permit for Russia in 2009
Productized service solutions in 2010
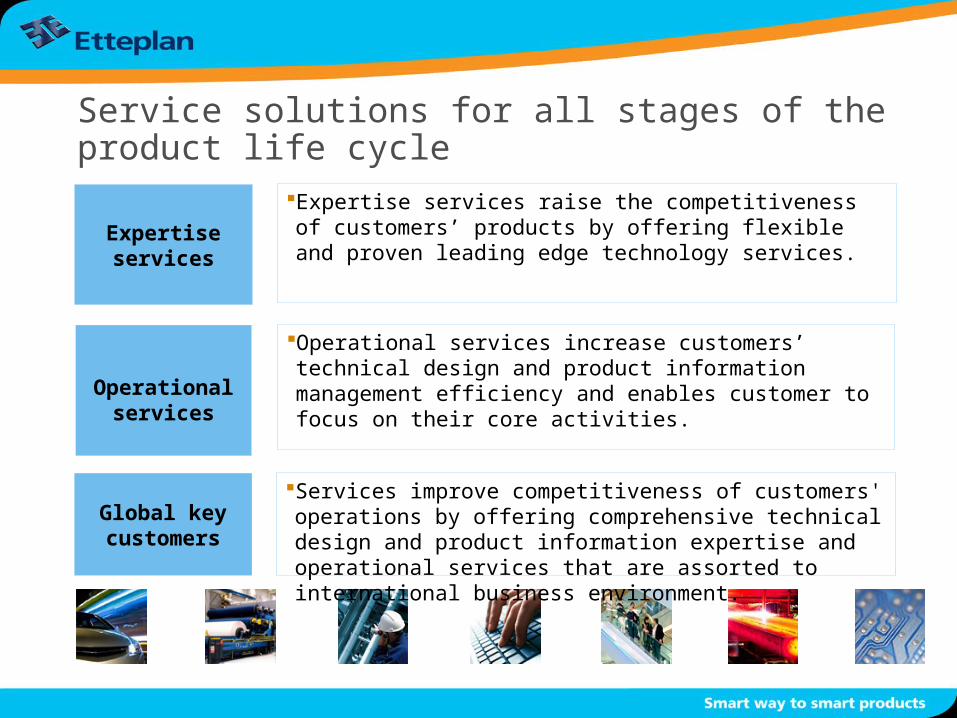
Service solutions for all stages of the product life cycle
Operational services
Operational services increase customers’ technical design and product information management efficiency and enables customer to focus on their core activities.
Expertise services
Expertise services raise the competitiveness of customers’ products by offering flexible and proven leading edge technology services.
Global key customers
Services improve competitiveness of customers' operations by offering comprehensive technical design and product information expertise and operational services that are assorted to international business environment.

References
Customers are global companies that are leading in their fields
energy and power transmission industry aerospace and defence equipment industry manufacturers of elevators, escalators,
hoists, and conveyors, as well as forest industry equipment manufacturers
equipment manufacturers in medical industry steel and forest industries
Customer industries Sales
framework agreements with central key customers
75% of revenue comes from 30 largest customers
none of the customers represents over 10% of the revenue

Professional personnel
Etteplan is Finland’s biggest technical design and product information employer
High level of education (B.Eng, M.Sc (Eng.)) and broad competence in different technical fields
Low employee turnover compared to the branch
37% of the personnel works in Sweden and China
Average number of personnel 2005-2009
1501
1230
1895
1763 1765
0
200
400
600
800
1000
1200
1400
1600
1800
2000
2005 2006 2007 2008* 2009*
* continuing operations

Engineering service market segments
Infrastructure
Industrial processes
Power generation facilities
Non-residential buildings
Etteplan’s segment
Industrial equipment (IE)
•Global market for industrial equipment segment is appr. EUR 30 billion•The demand for field’s services exceeds the pace of global GDP

Trends guiding industrial technology demand
Shortened life cycles of products Growing need for data management
in machinery and equipment Increase in eco-efficiency Increase of technical health care Increasing requirements for cost
efficiency Cyclical fluctuation of demand
increases New markets, new demand

Development of business environment
Customers focus their procurements
Customers transfer to developing markets
Engineering independent of time and place - digitalization
Customers expect flexibility and cost efficiency
Total solutions
China operations
Customer operates globally
Adequate and flexible engineering resources
Risk management
Etteplan’s risk management concentrates especially to:
Anticipating the development of customers’ order books
Availability of competent personnel
Elimination of engineering mistakes
Supervision of company acquisition success
Supervision of the need to goodwill write-down

Strategy 2010-2012
Good clientele, sound market position, new product solutions and functioning service and group structure create good operating prospects for the company.
During the strategy period concentration will be on thedevelopment of the following areas:
Customer focus offering Etteplan’s entire competence to customers
New service solutions from resource delivery to solution sales
One Etteplan harmonization of internal operating models

(EUR 1 000) 4-6/2010 4-6/2009 1-6/2010 1-6/2009 1-12/2009
Revenue 26 782 25 255 51 635 54 766 98 700 Operating profit/ loss 1 859 -4 367 2 984 -3 184 -3 587 Operating profit/ loss % 6,9 -17,3 5,8 -5,8 -3,6 Profit/ loss for the period 1 211 -3 344 1 903 -2 578 -3 287 Profit/ loss for the period % 4,5 -13,2 3,7 -4,7 -3,3 Equity ratio % 42,6 28,8 42,6 28,8 38,5 Net gearing % 30,4 99,8 30,4 99,8 20,8 Total assets 61 775 74 001 61 775 74 001 61 704
*) continuing operations
Key figures*

Outlook 2010
The revenue in 2010 is estimated to be approximately on the same level as in year 2009.
Adjustments done in year 2009 improve company's profitability and operating profit’s positive development is estimated to continue.
The revenue and operating profit estimates are based on Etteplan’s current market outlook.
Potential acquisitions in year 2010 are not included in the estimate.

Detailed financial information
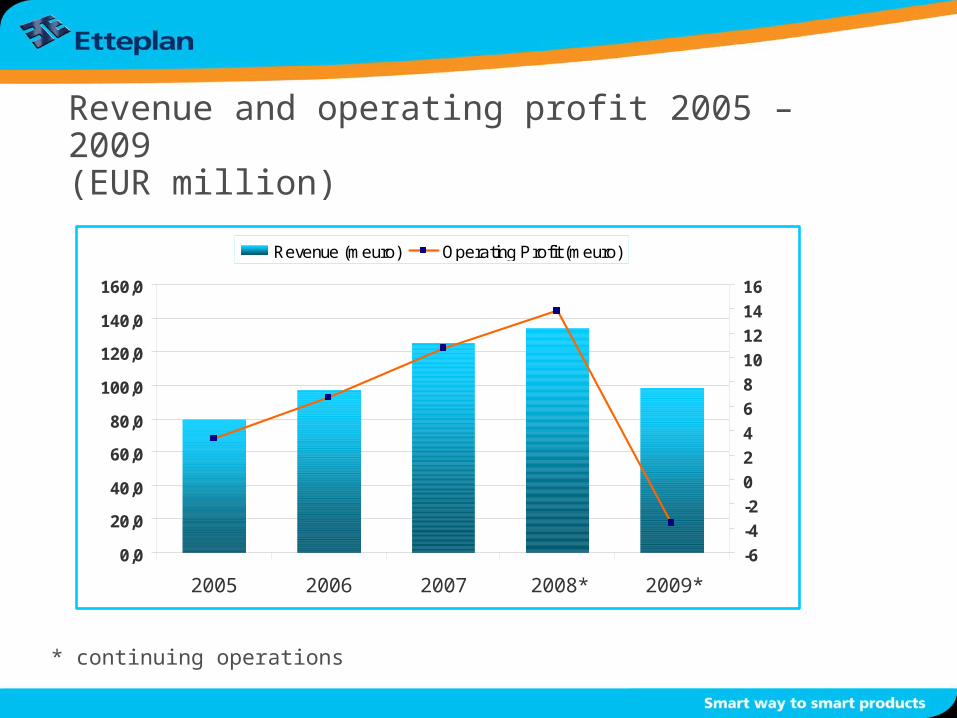
Revenue and operating profit 2005 – 2009(EUR million)
* continuing operations
0,0
20,0
40,0
60,0
80,0
100,0
120,0
140,0
160,0
2005 2006 2007 2008* 2009*
-6
-4
-2
0
2
4
6
8
10
12
14
16
Revenue (meuro) Operating Profit (meuro)

Earnings per Share 2005 – 2009(EUR)
-0,17
0,450,40
0,210,16
-0,30
-0,20
-0,10
0,00
0,10
0,20
0,30
0,40
0,50
2005 2006 2007 2008* 2009*
* continuing operations

Dividends 2005 – 2009(EUR/share)
0,10
0,13
0,21
0,08
0,04
0
0,05
0,1
0,15
0,2
0,25
2005 2006 2007 2008 2009

(EUR 1 000) 4-6/2010 4-6/2009 1-6/2010 1-6/2009 1-12/2009
Revenue 26 782 25 255 51 635 54 766 98 700 Other operating income 442 172 519 339 392 Materials and services -2 670 -2 456 -4 549 -5 090 -8 077 Staff costs -18 646 -22 954 -36 876 -44 017 -75 851 Other operating expenses -3 689 -3 979 -7 024 -8 364 -17 155 Depreciation and amortisation -360 -405 -721 -818 -1 596 Operating profit/ loss 1 859 -4 367 2 984 -3 184 -3 587 Financial income 107 -25 318 177 341 Financial expenses -127 -200 -327 -454 -925 Share of the result of associates -157 100 -308 -49 -134 Profit/ loss before taxes 1 682 -4 491 2 667 -3 511 -4 304 Income taxes -471 1 147 -764 933 1 017 Profit/ loss for the financial year, continuing operations 1 211 -3 344 1 903 -2 578 -3 287
Income statement

(EUR 1 000) 30.6.2010 30.6.2009 31.12.2009
Goodwill 32 730 33 695 31 184 Investments available for sales 690 411 691 Non-current assets, total 36 552 38 303 35 329 Trade and other receivables 21 812 29 538 18 645 Current tax assets 21 3 816 1 079 Cash and cash equivalents 3 389 2 345 6 650 Current assets, total 25 223 35 698 26 375 TOTAL ASSETS 61 775 74 001 61 704 Equity, total 26 289 21 222 23 689 Non-current liabilities, total 6 861 12 506 7 776 Current liabilities, total 28 624 40 274 30 239 TOTAL EQUITY AND LIABILITIES 61 775 74 001 61 704
Balance Sheet
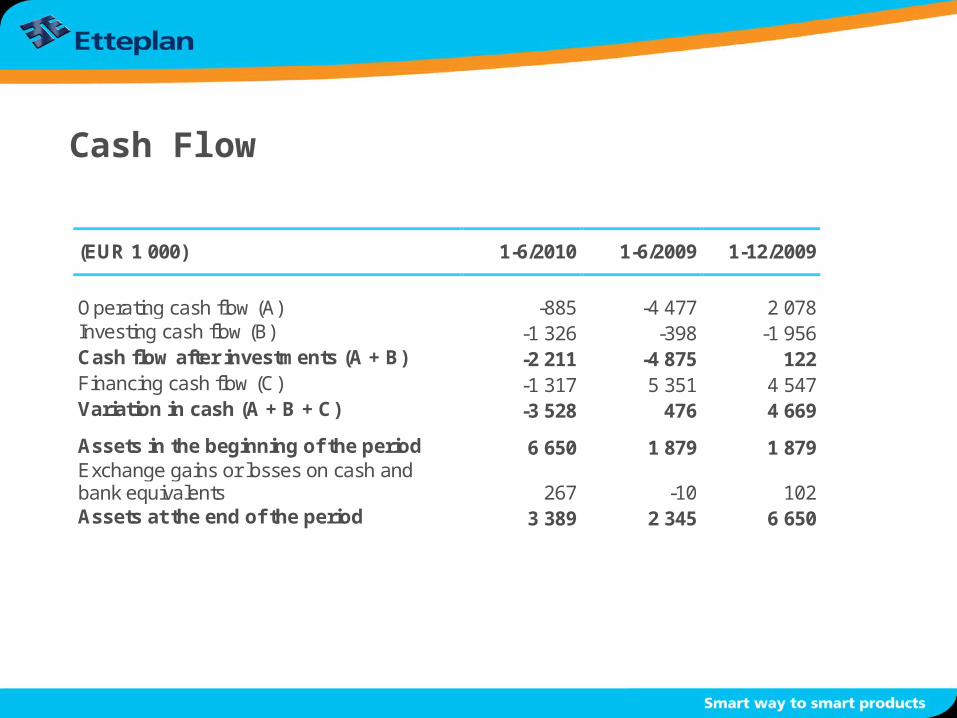
(EUR 1 000) 1-6/2010 1-6/2009 1-12/2009
Operating cash flow (A) -885 -4 477 2 078 Investing cash flow (B) -1 326 -398 -1 956 Cash flow after investments (A + B) -2 211 -4 875 122 Financing cash flow (C) -1 317 5 351 4 547 Variation in cash (A + B + C) -3 528 476 4 669 Assets in the beginning of the period 6 650 1 879 1 879 Exchange gains or losses on cash and bank equivalents 267 -10 102 Assets at the end of the period 3 389 2 345 6 650
Cash Flow

Investor information contact persons
President and CEO Matti Hyytiäinen,
tel. +358 (0)10 307 3200, [email protected]
Vice President, HR & Communications
Outi-Maria Liedes,
tel. +358 (0)10 307 3251,

Recommended