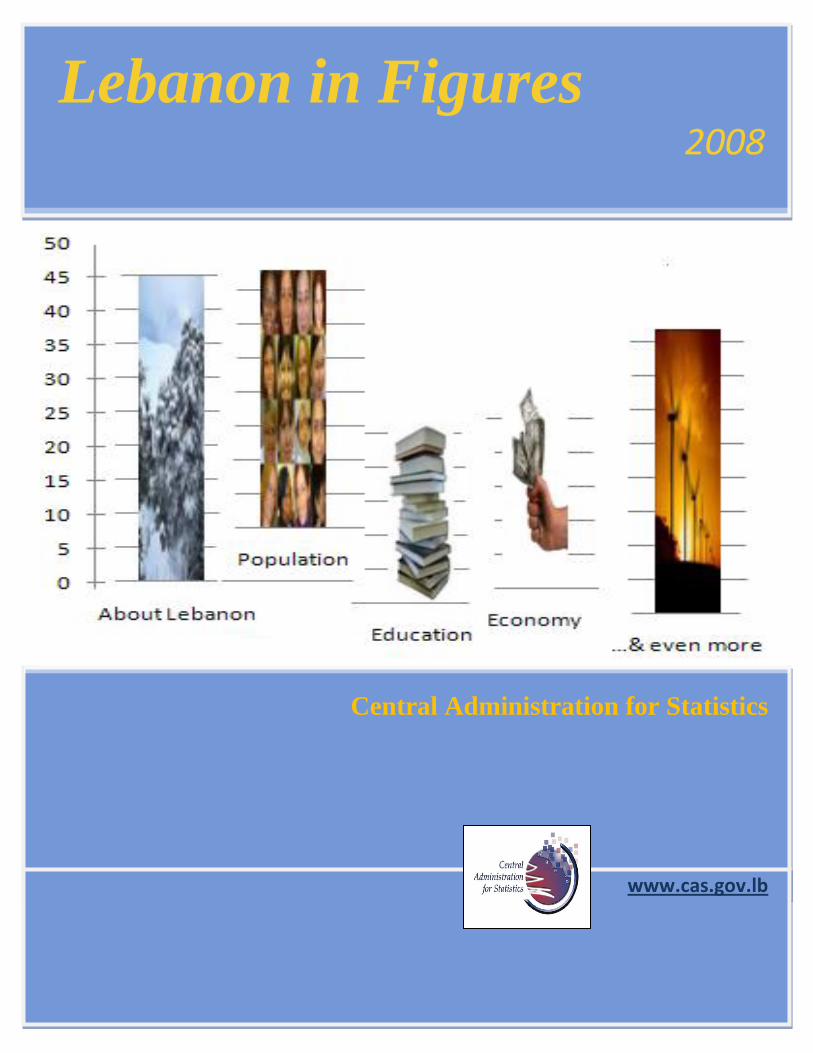
Lebanon in Figures-2008
Central Administration for Statistics
Pag
e1
The Central Administration for Statistics (CAS) proudly presents the publication entitled “Lebanon
in Figures – 2008” which is the result of various sample surveys and data collection done recently in
numerous fields and pertaining to numerous indicators.
It can be downloaded for free from the CAS official website (www.cas.gov.lb) or can be ordered from
CAS by calling +961 1 37 31 61 or email at [email protected]
On this occasion, CAS wishes to thank all who have contributed in the preparation of the present
publication, especially:
Ms. Ghalia HAMAMY
Ms. Lara BADRE
Mr. Vicken ASHKARIAN
We highly hope that the present publication will meet all our users‟ needs and provide them with a
practical and scientific valuable tool thanks to its authoritative and updated facts and information.
Maral TUTELIAN GUIDANIAN, PhD
Director General
Central Administration for Statistics
Lebanon in Figures-2008
Central Administration for Statistics
Pag
e2
About Lebanon 3
Population 4
Education & Health 5
Labor 6
Environment 7
Economic sectors 8
Tourism 9
Finance 10
Transport 11
Consumer Price Index 12
National Accounts 13
More statistics 14
Over years 15
Lebanon in Figures-2008
Central Administration for Statistics
Pag
e3
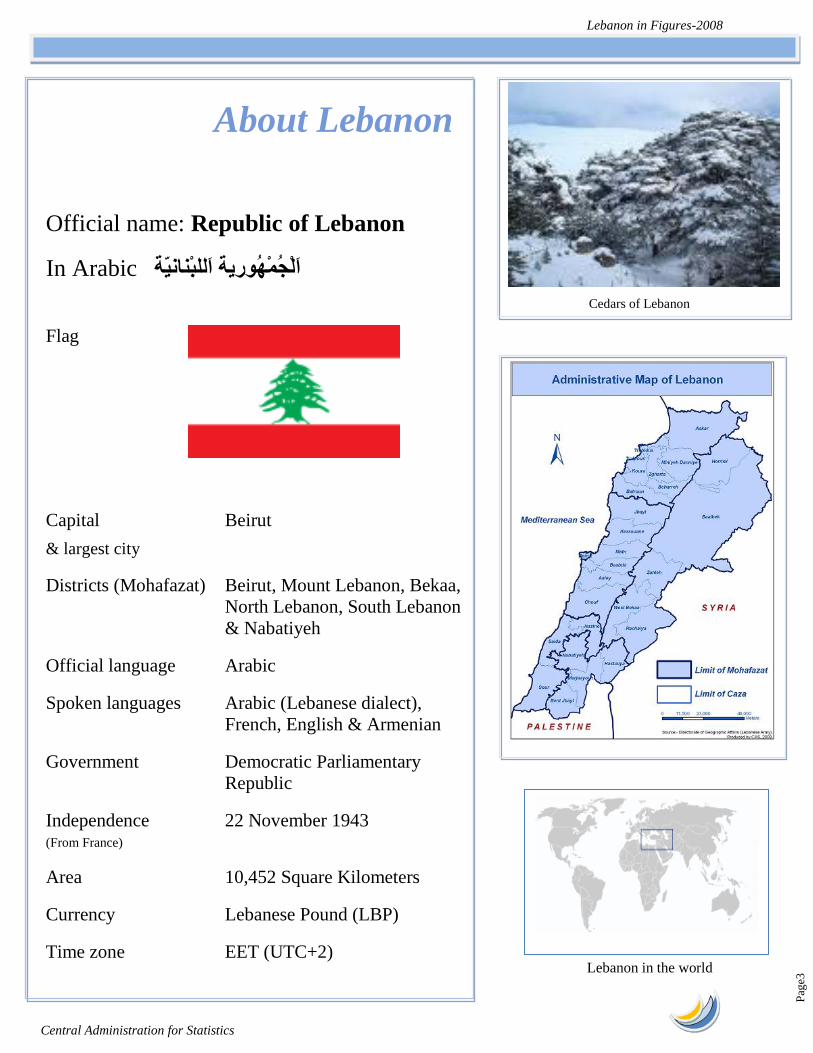
Lebanon in the world
About Lebanon
Official name: Republic of Lebanon
In Arabic ْلُجْمُهورية َاللْبنانّيةَا
Flag
Capital
& largest city
Beirut
Districts (Mohafazat) Beirut, Mount Lebanon, Bekaa,
North Lebanon, South Lebanon
& Nabatiyeh
Official language Arabic
Spoken languages Arabic (Lebanese dialect),
French, English & Armenian
Government Democratic Parliamentary
Republic
Independence (From France)
22 November 1943
Area 10,452 Square Kilometers
Currency Lebanese Pound (LBP)
Time zone EET (UTC+2)
Internet TLD .lb
Cedars of Lebanon
Lebanon in Figures-2008
Central Administration for Statistics
Pag
e4
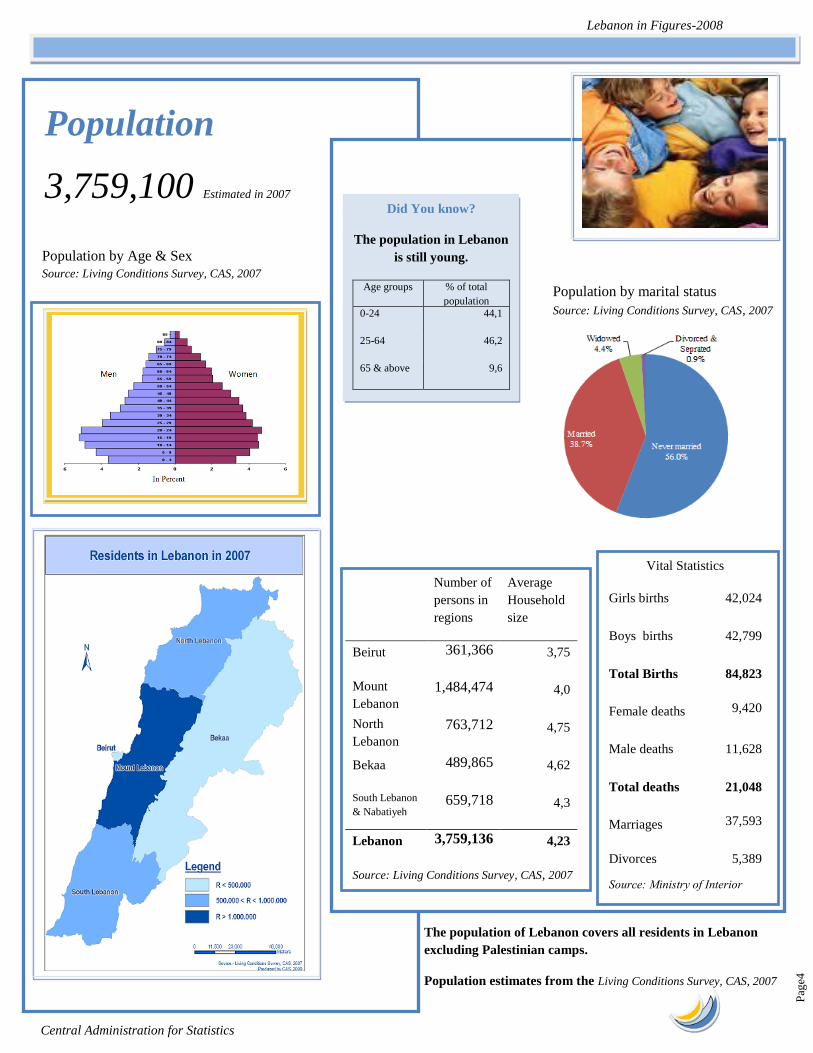
Population
3,759,100 Estimated in 2007
Vital Statistics
Girls births 42,024
Boys births 42,799
Total Births 84,823
Female deaths 9,420
Male deaths 11,628
Total deaths 21,048
Marriages 37,593
Divorces 5,389
Source: Ministry of Interior
Number of
persons in
regions
Average
Household
size
Beirut 361,366
3,75
Mount
Lebanon
1,484,474
4,0
North
Lebanon
763,712
4,75
Bekaa 489,865
4,62
South Lebanon
& Nabatiyeh 659,718
4,3
Lebanon 3,759,136
4,23
Source: Living Conditions Survey, CAS, 2007
Population by Age & Sex
Source: Living Conditions Survey, CAS, 2007
The population of Lebanon covers all residents in Lebanon
excluding Palestinian camps.
Population estimates from the Living Conditions Survey, CAS, 2007
Did You know?
The population in Lebanon
is still young.
Age groups % of total
population
0-24 44,1
25-64 46,2
65 & above 9,6
Population by marital status
Source: Living Conditions Survey, CAS, 2007
Lebanon in Figures-2008
Central Administration for Statistics
Pag
e5
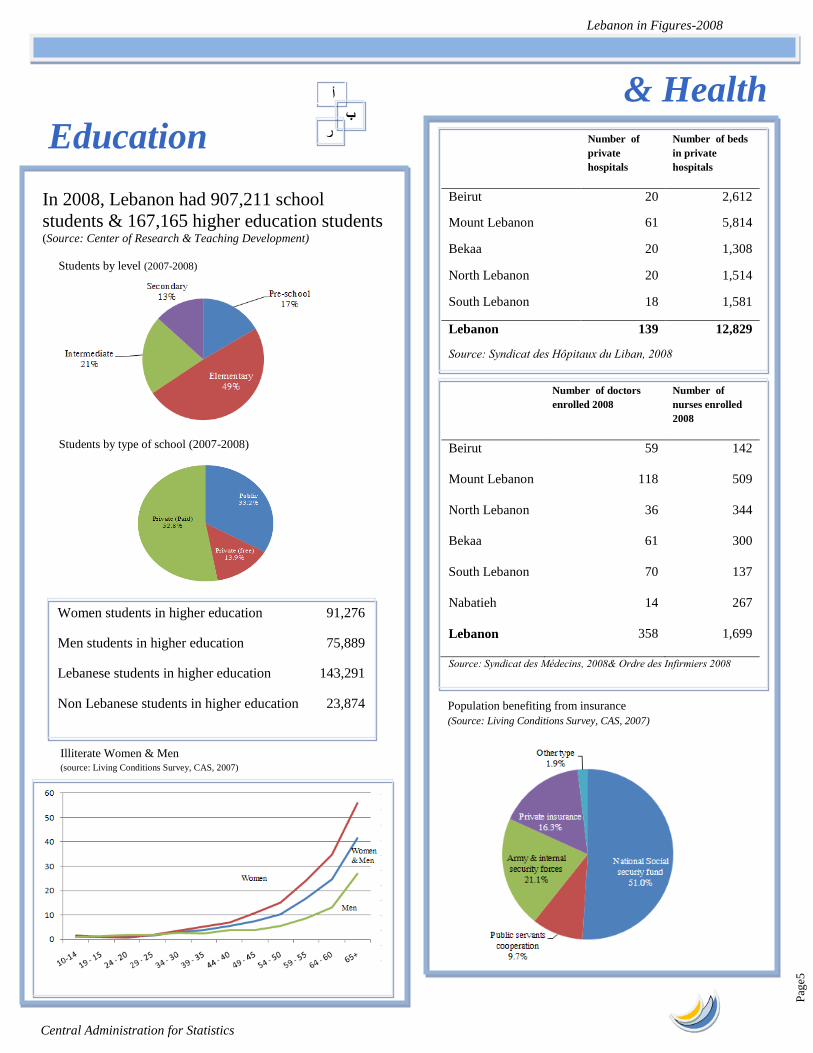
Illiterate Women & Men (source: Living Conditions Survey, CAS, 2007)
Education
In 2008, Lebanon had 907,211 school
students & 167,165 higher education students (Source: Center of Research & Teaching Development)
Students by level (2007-2008)
& Health
Number of
private
hospitals
Number of beds
in private
hospitals
Beirut 20 2,612
Mount Lebanon 61 5,814
Bekaa 20 1,308
North Lebanon 20 1,514
South Lebanon 18 1,581
Lebanon 139 12,829
Source: Syndicat des Hôpitaux du Liban, 2008
Number of doctors
enrolled 2008
Number of
nurses enrolled
2008
Beirut 59 142
Mount Lebanon 118 509
North Lebanon 36 344
Bekaa 61 300
South Lebanon 70 137
Nabatieh 14 267
Lebanon 358 1,699
Source: Syndicat des Médecins, 2008& Ordre des Infirmiers 2008
Students by type of school (2007-2008)
Population benefiting from insurance
(Source: Living Conditions Survey, CAS, 2007)
Women students in higher education
91,276
Men students in higher education
75,889
Lebanese students in higher education 143,291
Non Lebanese students in higher education 23,874
أ
ب ر
Lebanon in Figures-2008
Central Administration for Statistics
Pag
e6
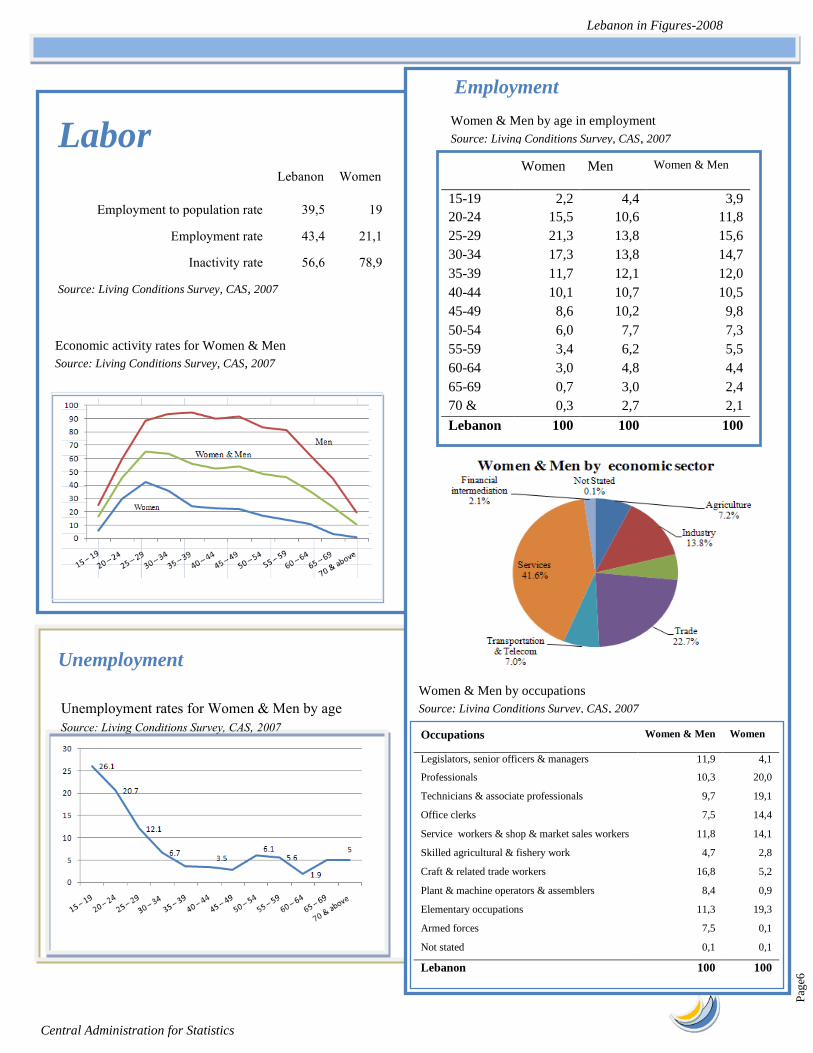
Unemployment
Labor
Lebanon Women
Employment to population rate 39,5 19
Employment rate 43,4 21,1
Inactivity rate 56,6 78,9
Source: Living Conditions Survey, CAS, 2007
Women Men Women & Men
15-19 2,2 4,4 3,9
20-24 15,5 10,6 11,8
25-29 21,3 13,8 15,6
30-34 17,3 13,8 14,7
35-39 11,7 12,1 12,0
40-44 10,1 10,7 10,5
45-49 8,6 10,2 9,8
50-54 6,0 7,7 7,3
55-59 3,4 6,2 5,5
60-64 3,0 4,8 4,4
65-69 0,7 3,0 2,4
70 &
above
0,3 2,7 2,1
Lebanon 100 100 100
Occupations Women & Men Women
Legislators, senior officers & managers 11,9 4,1
Professionals 10,3 20,0
Technicians & associate professionals 9,7 19,1
Office clerks 7,5 14,4
Service workers & shop & market sales workers 11,8 14,1
Skilled agricultural & fishery work 4,7 2,8
Craft & related trade workers 16,8 5,2
Plant & machine operators & assemblers 8,4 0,9
Elementary occupations 11,3 19,3
Armed forces 7,5 0,1
Not stated 0,1 0,1
Lebanon 100 100
Unemployment rates for Women & Men by age
Source: Living Conditions Survey, CAS, 2007
Economic activity rates for Women & Men
Source: Living Conditions Survey, CAS, 2007
Women & Men by age in employment
Source: Living Conditions Survey, CAS, 2007
Women & Men by occupations
Source: Living Conditions Survey, CAS, 2007
Employment
Lebanon in Figures-2008
Central Administration for Statistics
Pag
e7
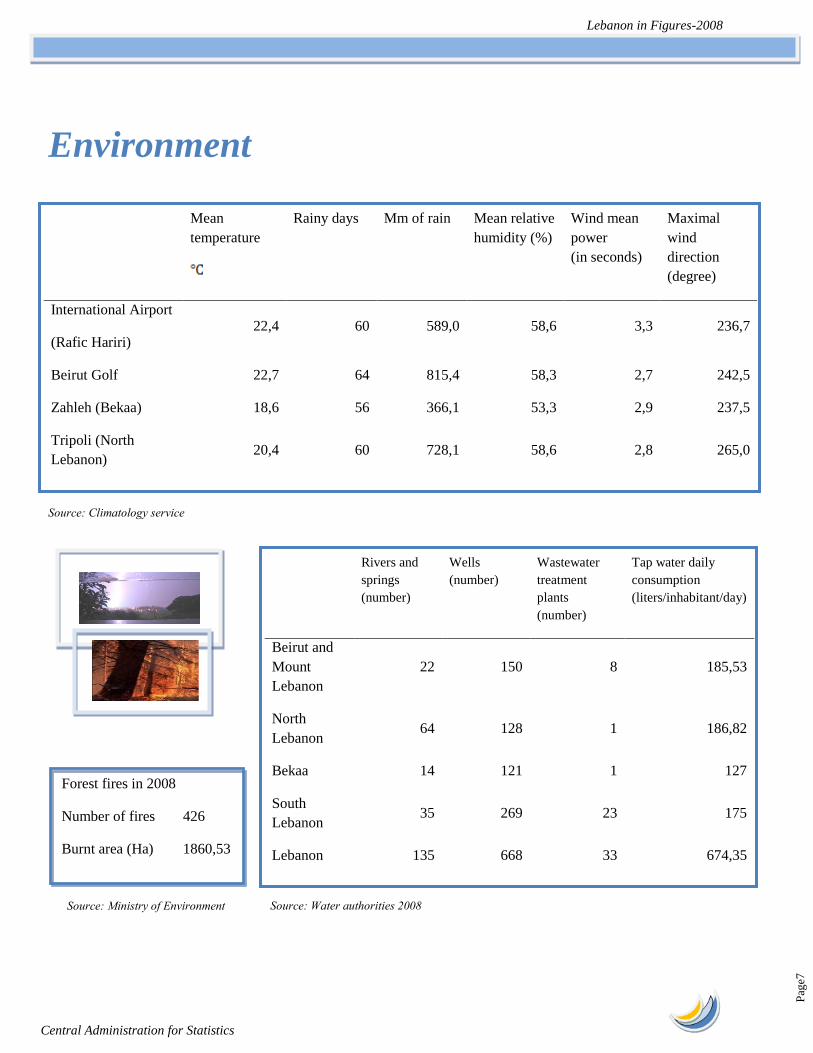
Environment
Mean
temperature
Rainy days Mm of rain Mean relative
humidity (%)
Wind mean
power
(in seconds)
Maximal
wind
direction
(degree)
International Airport
(Rafic Hariri) 22,4 60 589,0 58,6 3,3 236,7
Beirut Golf 22,7 64 815,4 58,3 2,7 242,5
Zahleh (Bekaa) 18,6 56 366,1 53,3 2,9 237,5
Tripoli (North
Lebanon) 20,4 60 728,1 58,6 2,8 265,0
Rivers and
springs
(number)
Wells
(number)
Wastewater
treatment
plants
(number)
Tap water daily
consumption
(liters/inhabitant/day)
Beirut and
Mount
Lebanon
22 150 8 185,53
North
Lebanon 64 128 1 186,82
Bekaa 14 121 1 127
South
Lebanon 35 269 23 175
Lebanon 135 668 33 674,35
Source: Ministry of Environment
Forest fires in 2008
Number of fires 426
Burnt area (Ha) 1860,53
Source: Climatology service
Source: Water authorities 2008
Lebanon in Figures-2008
Central Administration for Statistics
Pag
e8
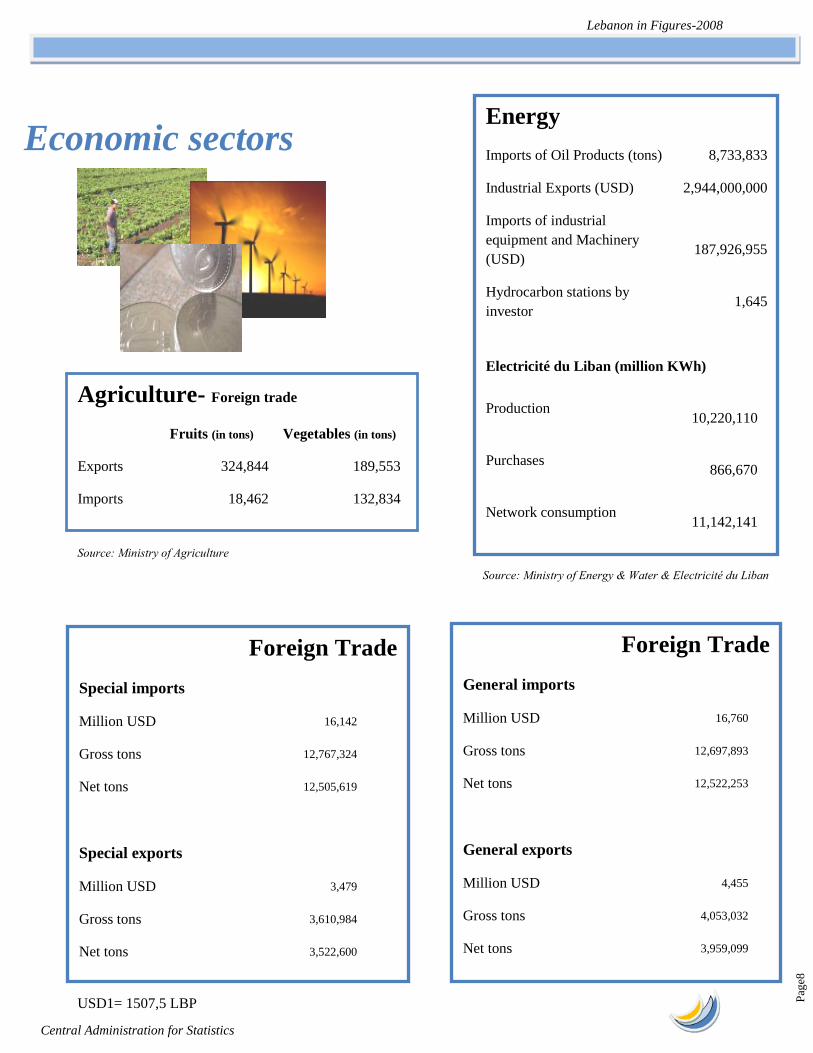
Economic sectors
Agriculture- Foreign trade
Fruits (in tons) Vegetables (in tons)
Exports 324,844 189,553
Imports 18,462 132,834
Energy
Imports of Oil Products (tons) 8,733,833
Industrial Exports (USD) 2,944,000,000
Imports of industrial
equipment and Machinery
(USD)
187,926,955
Hydrocarbon stations by
investor 1,645
Electricité du Liban (million KWh)
Production
10,220,110
Purchases
866,670
Network consumption
11,142,141
Foreign Trade
Special imports
Million USD 16,142
Gross tons 12,767,324
Net tons 12,505,619
Special exports
Million USD 3,479
Gross tons 3,610,984
Net tons 3,522,600
Foreign Trade
General imports
Million USD 16,760
Gross tons 12,697,893
Net tons 12,522,253
General exports
Million USD 4,455
Gross tons 4,053,032
Net tons 3,959,099
USD1= 1507,5 LBP
Source: Ministry of Agriculture
Source: Ministry of Energy & Water & Electricité du Liban
Lebanon in Figures-2008
Central Administration for Statistics
Pag
e9
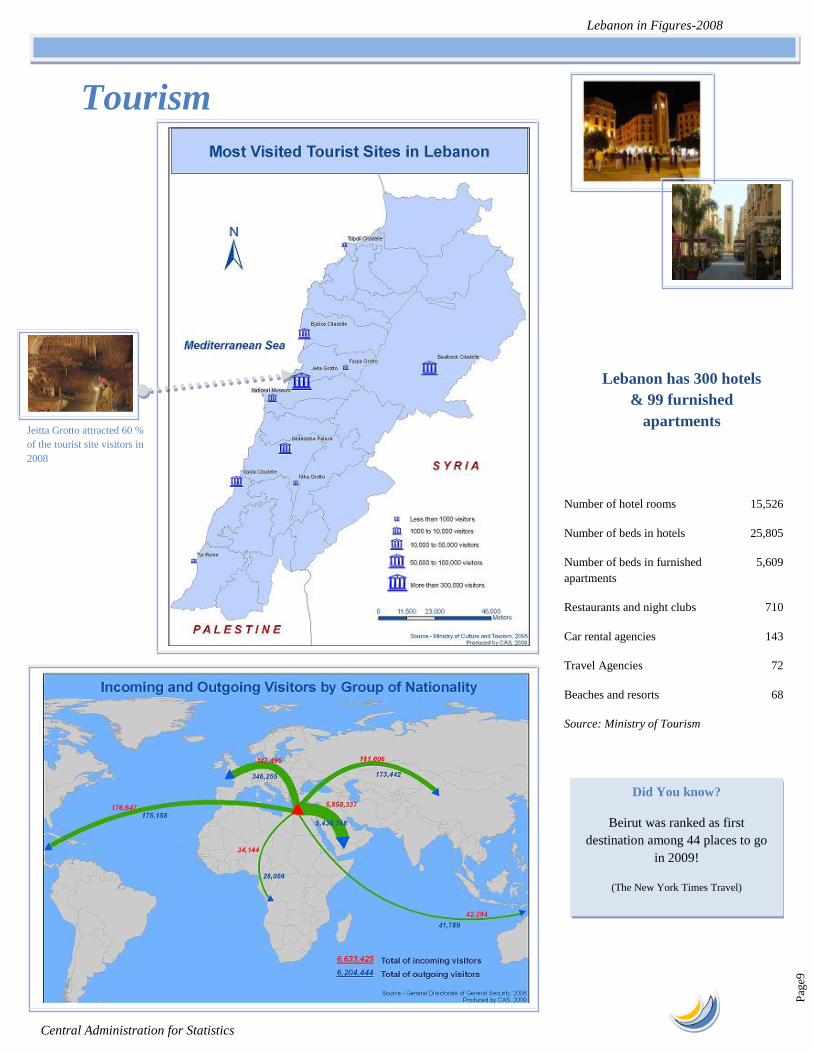
Tourism
Lebanon has 300 hotels
& 99 furnished
apartments
Did You know?
Beirut was ranked as first
destination among 44 places to go
in 2009!
(The New York Times Travel)
Jeitta Grotto attracted 60 %
of the tourist site visitors in
2008
Number of hotel rooms 15,526
Number of beds in hotels 25,805
Number of beds in furnished
apartments
5,609
Restaurants and night clubs 710
Car rental agencies 143
Travel Agencies 72
Beaches and resorts 68
Source: Ministry of Tourism
Lebanon in Figures-2008
Central Administration for Statistics
Pag
e10
Finance
Balance sheet 31-12-2008
Assets (billion LBP) 60,420
Foreign assets 37,829
, Claims on private sector 305
Loans to banks 1,543
Loans to public sector 362
Securities portfolio 13,933
Fixed assets 409
Unclassified assets 6,038
Liabilities (billion LBP) 60,420
Currency in circulation outside BDL 2,498
Commercial banks deposits 36,193
Deposits of financial corporation 1,314
Liabilities to the private sector 28
Liabilities to the public sector 6,995
Valuation adjustment 3,602
Securities other than shares 3,015
Foreign liabilities 671
Special long term liabilities 2,682
Capital accounts 2,411
Unclassified liabilities 1,011
Consolidated balance sheet of commercial banks
31-12-2008 Assets (billion LBP) 142,090
Reserves 39,113
Claims on private sector 31,750
Claims on public sector 38,314
Foreign assets 28,834
Fixed assets 3,695
Unclassified assets 383
Liabilities (billion LBP) 142,090
Resident private sector deposits 99,908
Public sector deposits 1,331
Foreign liabilities 23,834
Bonds 93
Capital Accounts 10,705
Unclassified Liabilities 6,218
Budget transactions
Revenues (million LBP) 9,794,988
Expenditures (million LBP) 10,983,537
Budget Total Deficit/Surplus
(million LBP) -1,188,549
In % of total expenditure -10,82%
Budget Primary
Deficit/Surplus (million
LBP)
4,115,881
In % of total expenditure 37,47%
Public finance
Treasury transactions
Resources (million LBP) 757,813
Withdrawals (million LBP) 3,973,259
Total Treasury Deficit/Surplus
(million LBP) -3,215,446
Total Cash In (million LBP) 10,552,801
Total Cash Out (million LBP) 14,956,796
Total Cash Deficit/Surplus
(million LBP) -4,403,995
Total Primary Deficit / Surplus 900,435
Beirut Stock Exchange
Total exchanged shares 105,517,848
Value of monthly
transactions
(USD 1000)
1,710,411
Market capitalization- 31-
12-2008
(USD 1,00,000)
9,609
Source: Banque du Liban (BDL)
Source: Banque du Liban (BDL)
USD1= 1507,5 LBP
Source: Beirut Stock Exchange
Source: Ministry of Finance
Source: Ministry of Finance
Lebanon in Figures-2008
Central Administration for Statistics
Pag
e11
Sea
Port of Beirut Port of Tripoli Port of Tyr Port of Saida
Ports of Jieh
& Zahrani
Total
Incoming ships capacity
(tons) 272,516 654,279 31,491 90,311 104,392 1,152,989
Imported Cargo (tons) 4,905,554 669,489 4,300 78,959 208,828 5,867,130
Exported Cargo (tons) 840,646 258,178 0 48,845 46,622 1,194,291
Incoming Oil Tanks
capacity (tons) 18,114 704,962 9,976 0 1,083,259 1,816,311
Imported cars 95,242 8,963 0 6,040 0 110,245
Aircrafts landing 22,658
Aircrafts take-off 22,620
Passengers arrivals 2,025,547
Passengers Departures 2,014,013
Passengers Transit 45,774
Cargo & mail unloaded
(Tons)
36,790,289
Cargo & mail loaded
(Tons)
31,805,216
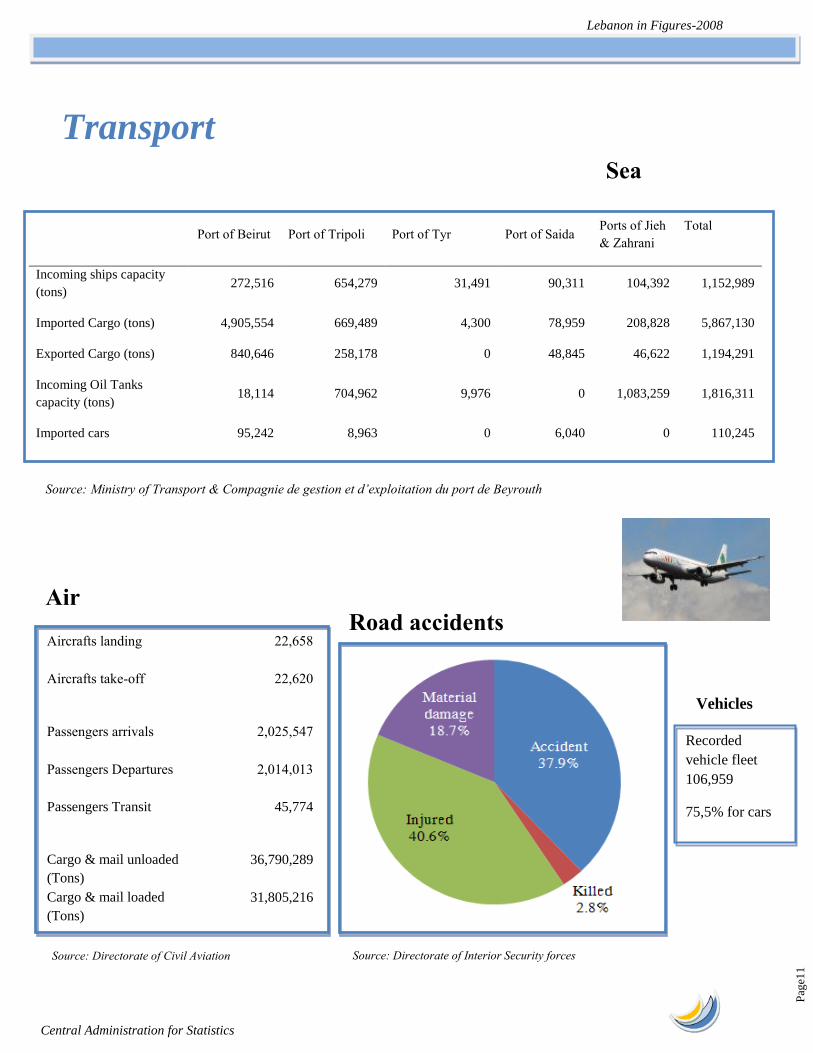
Air Road accidents
Source: Directorate of Interior Security forces
Recorded
vehicle fleet
106,959
75,5% for cars
Vehicles
Transport
Source: Ministry of Transport & Compagnie de gestion et d’exploitation du port de Beyrouth
Source: Directorate of Civil Aviation
Lebanon in Figures-2008
Central Administration for Statistics
Pag
e12
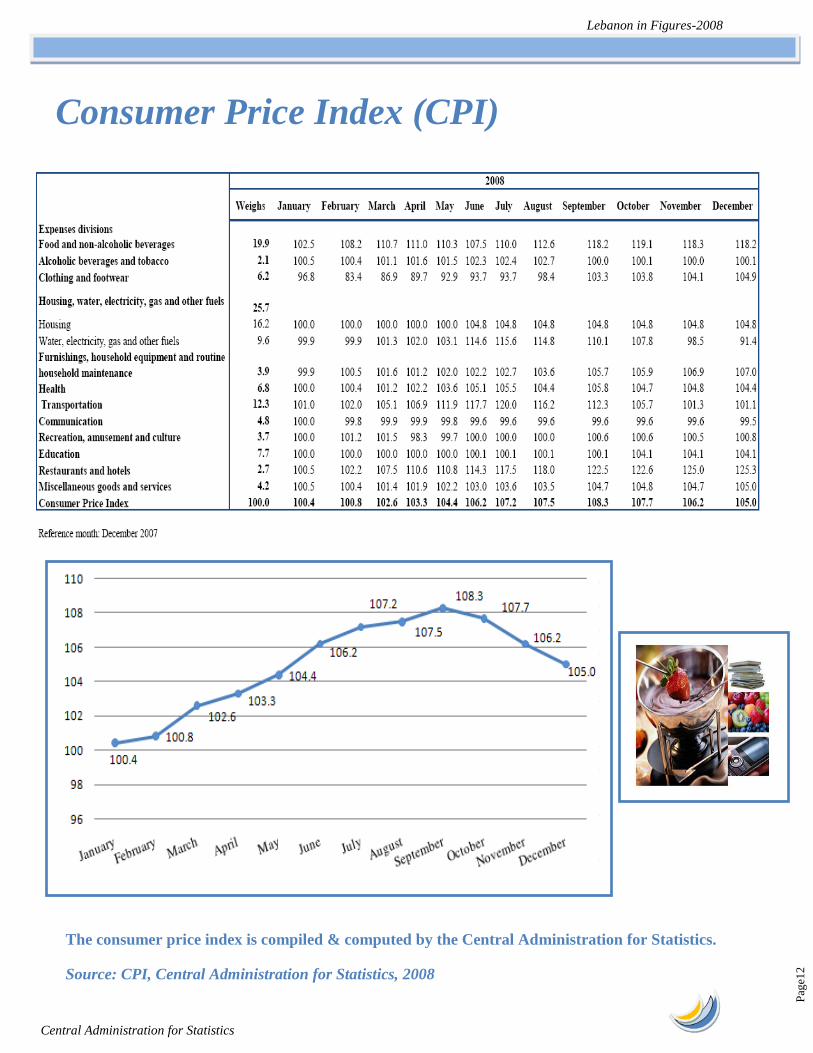
Consumer Price Index (CPI)
The consumer price index is compiled & computed by the Central Administration for Statistics.
Source: CPI, Central Administration for Statistics, 2008
Lebanon in Figures-2008
Central Administration for Statistics
Pag
e13
National Accounts Source : Prime Minister Office
Lebanon in Figures-2008
Central Administration for Statistics
Pag
e14
More statistics….
Work permits
New
work
permits
Renewed work
permits
Arab countries 2,467 18,366
Africa 15,087 32,041
America 76 209
Asia excluding Arab
countries 18,950 43,197
Europe 133 578
Oceania 2 5
Total 36,715 94,396
Liban Post Enrolled in 2008
Incoming mail & parcels 403,847
Outgoing mail & parcels 407,131
Engineers 1,712
Lawyers 7,809
Artists 562
Photographers 250
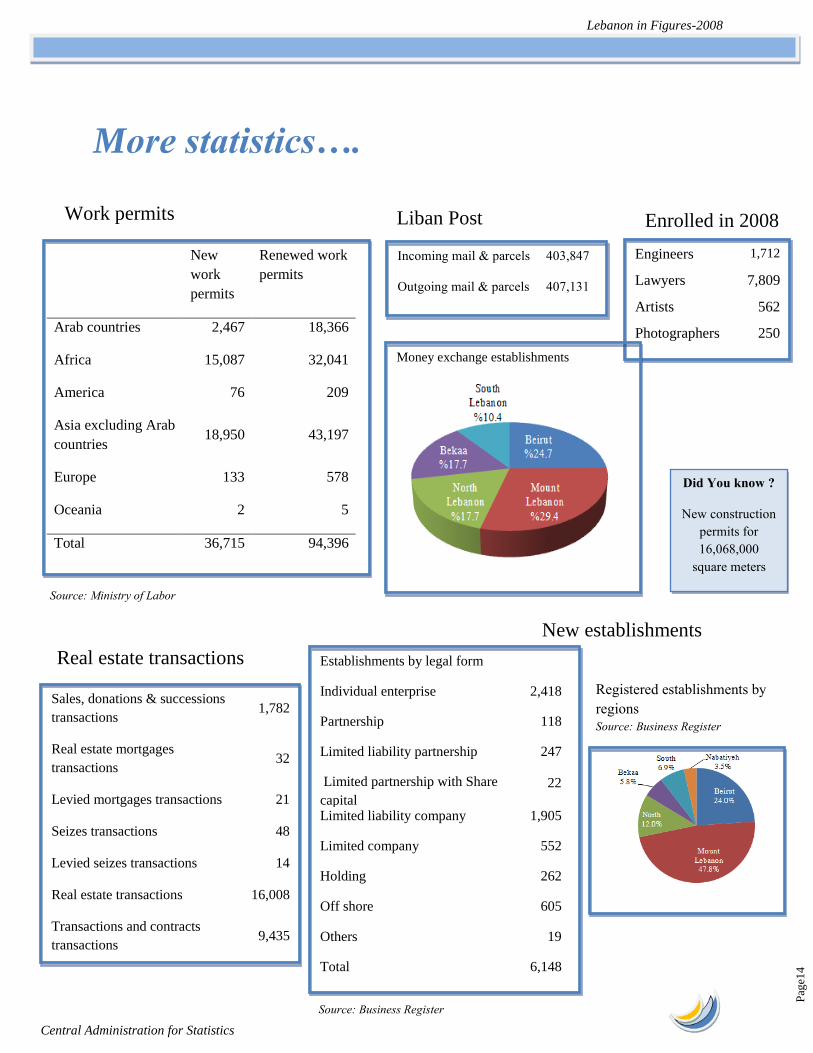
Money exchange establishments
Did You know ?
New construction
permits for
16,068,000
square meters
Real estate transactions
Sales, donations & successions
transactions 1,782
Real estate mortgages
transactions 32
Levied mortgages transactions 21
Seizes transactions 48
Levied seizes transactions 14
Real estate transactions 16,008
Transactions and contracts
transactions 9,435
Source: Real Estate Register
New establishments
Establishments by legal form
Individual enterprise 2,418
Partnership 118
Limited liability partnership 247
Limited partnership with Share
capital
22
Limited liability company 1,905
Limited company 552
Holding 262
Off shore 605
Others 19
Total 6,148
Registered establishments by
regions
Source: Business Register
Source: Ministry of Labor
Source: Business Register
Lebanon in Figures-2008
Central Administration for Statistics
Pag
e15
Years Roads
1999 37
2000 22
2001 14
2002 23
2003 13
2004 31
2005 38
Over years…
Did You know?
Since 1949, there are
3,849 practicing dentists
Years Employees
2003 15,563
2004 15,493
2005 15,993
2006 16,538
2007 17,664
2008 18,632
Bank employees in numbers Years Doctors
2000 8,313
2001 8,965
2002 8,913
2003 8,984
2004 9,171
2005 9,400
2006 9,586
2007 9,876
2008 10,234
Doctors in numbers
Years VAT
2002 728,7
2003 893,8
2004 1249,1
2005 1175,5
2006 1,154
2007 1,450
2008 1,910
VAT in Billion LBP
Years Deficit
2000 8314,5
2001 9654,0
2002 8152,5
2003 8511,7
2004 11536,6
2005 11249,9
2006 10,730
2007 13,569
2008 19,089
Trade deficit in Billion LBP
Constructed roads in Km
by Green Project
Years Nurses
2004 4,524
2005 5,622
2006 6,244
2007 6,953
2008 8,652
Nurses in numbers
Lebanon in Figures-2008
Central Administration for Statistics
Pag
e16
Need more statistics?
Multiple Indicator Cluster Survey (MICSII) 2000
Households Living Conditions Survey 2004
Household Budget survey 2004
PAPFAM (Family health) 2004
Households Living Conditions Survey 2007
Consumer Price Index
Census of Buildings & Dwellings & Establishments 2004
Compendium des statistiques de l’environnement 2006
Statistical YearBook 2000-2005
Statistical YearBook 2006
Statistical YearBook 2007
Statistical Monthly Bulletin 2008
Circonscriptions foncières 2005
Lebanese Economic Activity Classification 2008
www.cas.gov.lb
Important notice
All indicators and data
used in this publication
are collected by the
Central Administration
for Statistics (CAS),
either from surveys
conducted by CAS or
by data from
administrative sources
produced by line
ministries.
All figures in this
publication are from
administrative sources
for 2008 unless stated
otherwise.
When using indicators
or information from
this publication please
quote
„Lebanon in Figures
2008’
Central
Administration for
Statistics, Lebanon.
Lebanon in Figures-2008
Central Administration for Statistics
Pag
e17
Central Administration for Statistics
Kantary, Army Street, Finance & Trade building, 5th floor
Beirut
Lebanon
Phone +961-1-373 160
Fax +961-1-373 161
www.cas.gov.lb.
Recommended