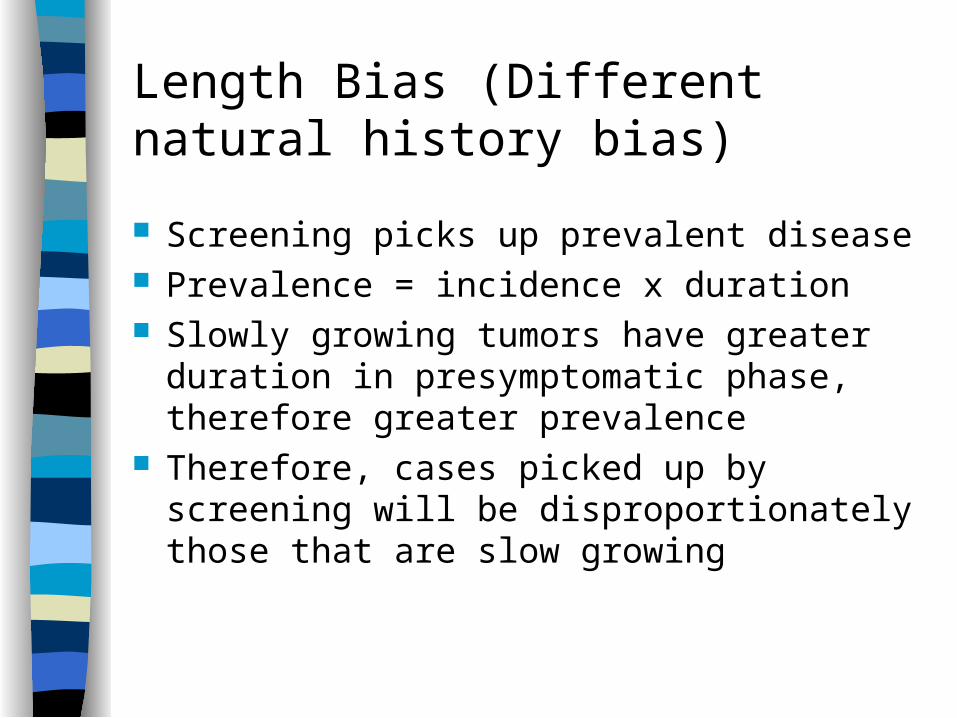
Length Bias (Different natural history bias)
Screening picks up prevalent disease Prevalence = incidence x duration Slowly growing tumors have greater duration
in presymptomatic phase, therefore greater prevalence
Therefore, cases picked up by screening will be disproportionately those that are slow growing
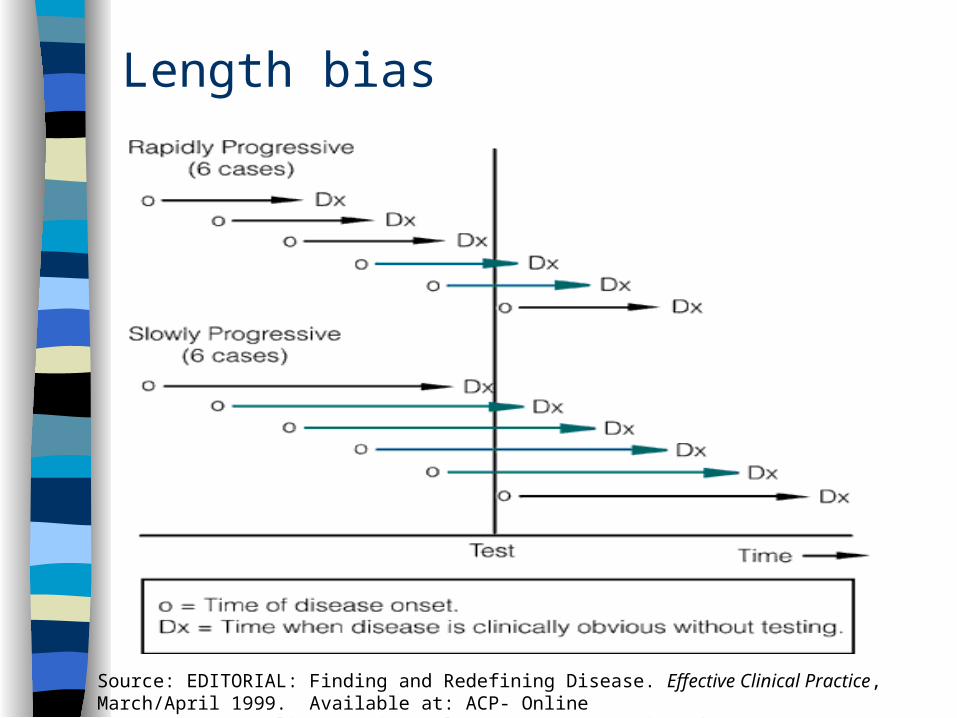
Length bias
Source: EDITORIAL: Finding and Redefining Disease. Effective Clinical Practice, March/April 1999. Available at: ACP- Online http://www.acponline.org/journals/ecp/marapr99/primer.htm
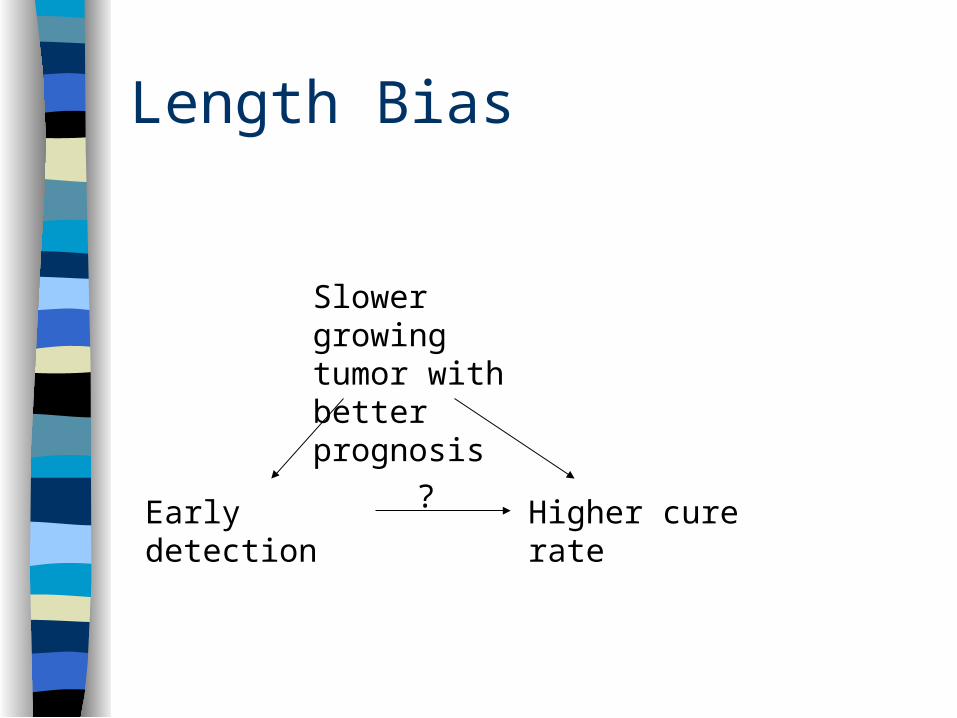
Length Bias
Early detection Higher cure rate
Slower growing tumor with better prognosis
?
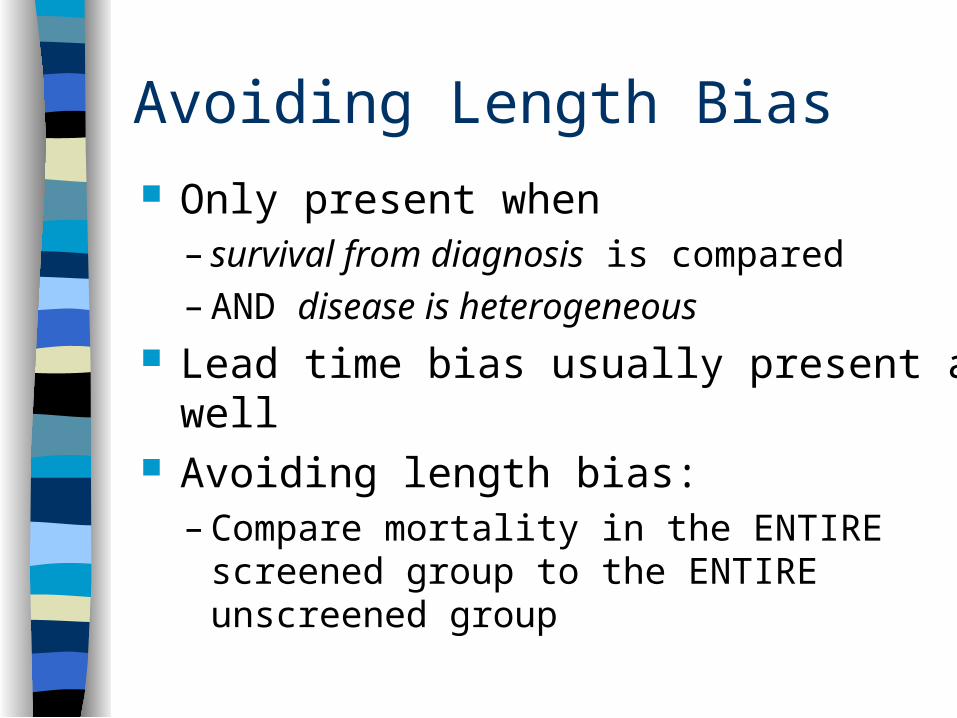
Avoiding Length Bias
Only present when – survival from diagnosis is compared– AND disease is heterogeneous
Lead time bias usually present as well Avoiding length bias:
– Compare mortality in the ENTIRE screened group to the ENTIRE unscreened group
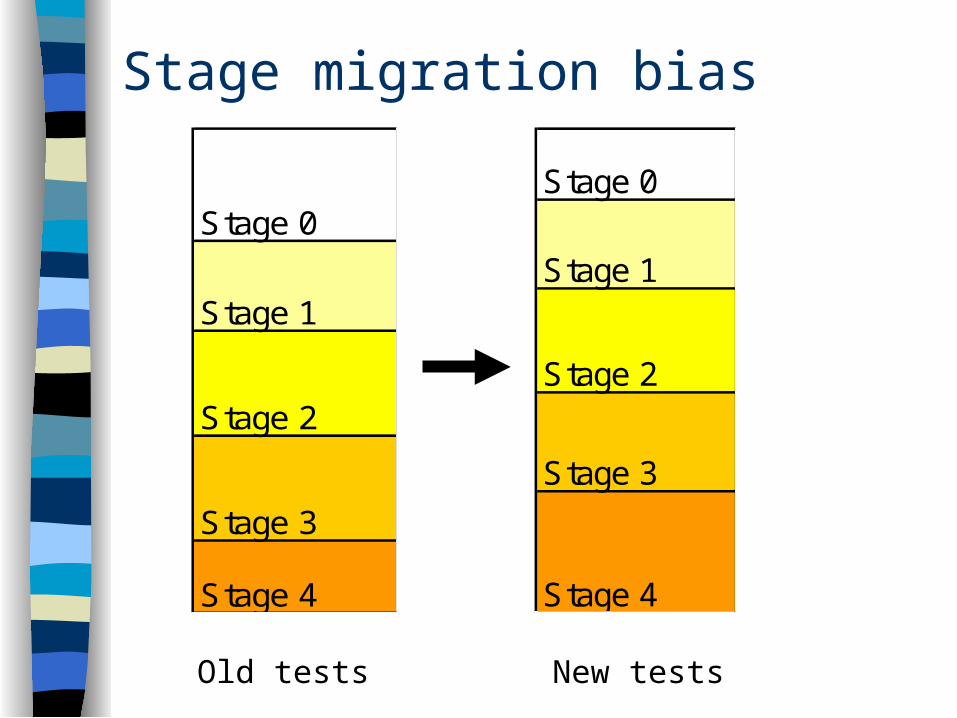
Stage migration bias
Stage 0
Stage 1
Stage 2
Stage 3
Stage 4
Stage 0
Stage 1
Stage 2
Stage 3
Stage 4
Old tests New tests
Stage migration bias Also called the "Will Rogers
Phenomenon"– "When the Okies left Oklahoma and moved
to California, they raised the average intelligence level in both states."
-- Will Rogers
Documented with colon cancer at Yale Other examples abound – the more you
look for disease, the higher the prevalence and the better the prognosis
Best reference on this topic: Black WC and Welch HG. Advances in diagnostic imaging and overestimation of disease prevalence and the benefits of therapy. NEJM 1993;328:1237-43.
A more general example of Stage Migration Bias
VLBW (< 1500 g), LBW (1500-2499 g) and NBW (> 2500 g) newborns exposed to Factor X in utero have decreased mortality compared with those not exposed
Is factor X good? Maybe not! Factor X could be cigarette
smoking! – Smoking moves babies to lower birthweight strata– Compared with other causes of LBW (i.e.,
prematurity) it is not as bad
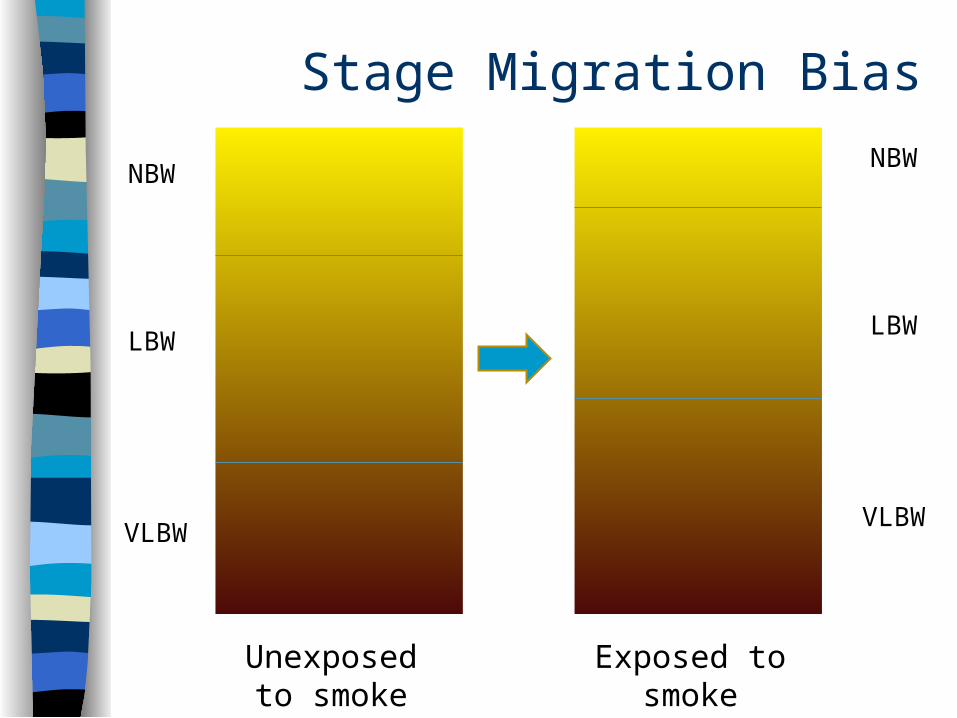
Stage Migration Bias
LBW
VLBW
NBWNBW
LBW
VLBW
Unexposed to smoke
Exposed to smoke
Avoiding Stage Migration Bias The harder you look for disease, and the
more advanced the technology– the higher the prevalence, the higher the stage,
and the better the (apparent) outcome for the stage
Beware of stage migration in any stratified analysis– Check OVERALL survival in screened vs.
unscreened group More generally, do not stratify on factors
distal in a causal pathway to the factor you wish to evaluate!
Pseudodisease A condition that looks just like the disease,
but never would have bothered the patient– Type I: Disease which would never cause
symptoms– Type II: Preclinical disease in people who will die
from another cause before disease presents In an individual treated patient it is impossible
to distinguish pseudodisease from successfully treated asymptomatic disease
The Problem:– Treating pseudodisease will always be successful– Treating pseudodisease can only cause harm
Example: Mayo Lung Project
RCT of lung cancer screening Enrollment 1971-76 9,211 male smokers randomized to two
study arms– Intervention: chest x-ray and sputum
cytology every 4 months for 6 years (75% compliance)
– Usual care (control): at trial entry, then a recommendation to receive the same tests annually
*Marcus et al., JNCI 2000;92:1308-16
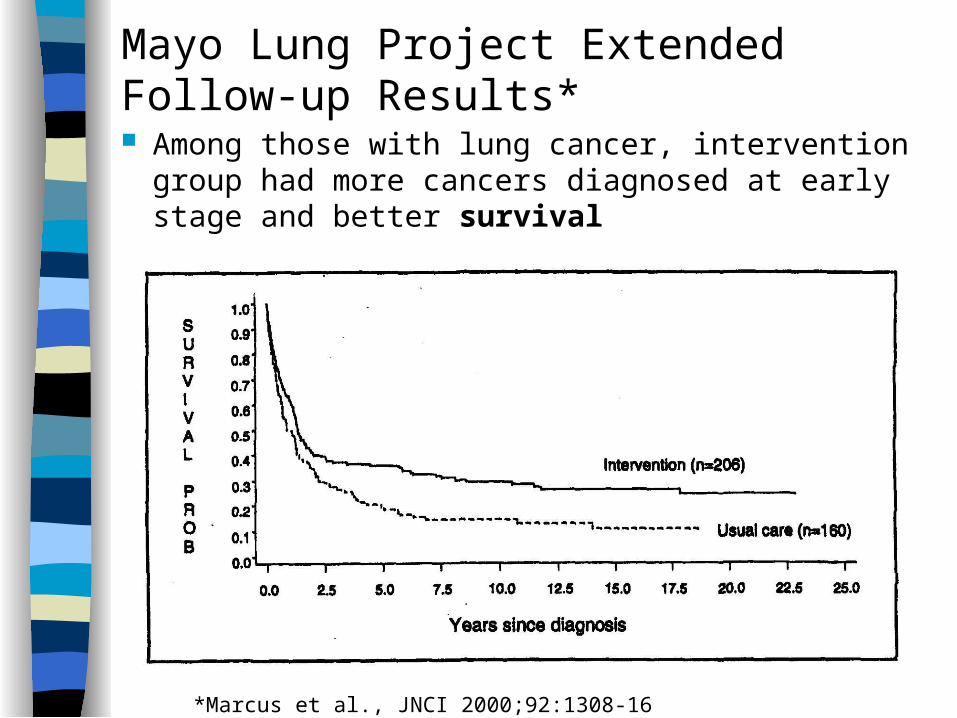
Mayo Lung Project Extended Follow-up Results* Among those with lung cancer, intervention group
had more cancers diagnosed at early stage and better survival
*Marcus et al., JNCI 2000;92:1308-16
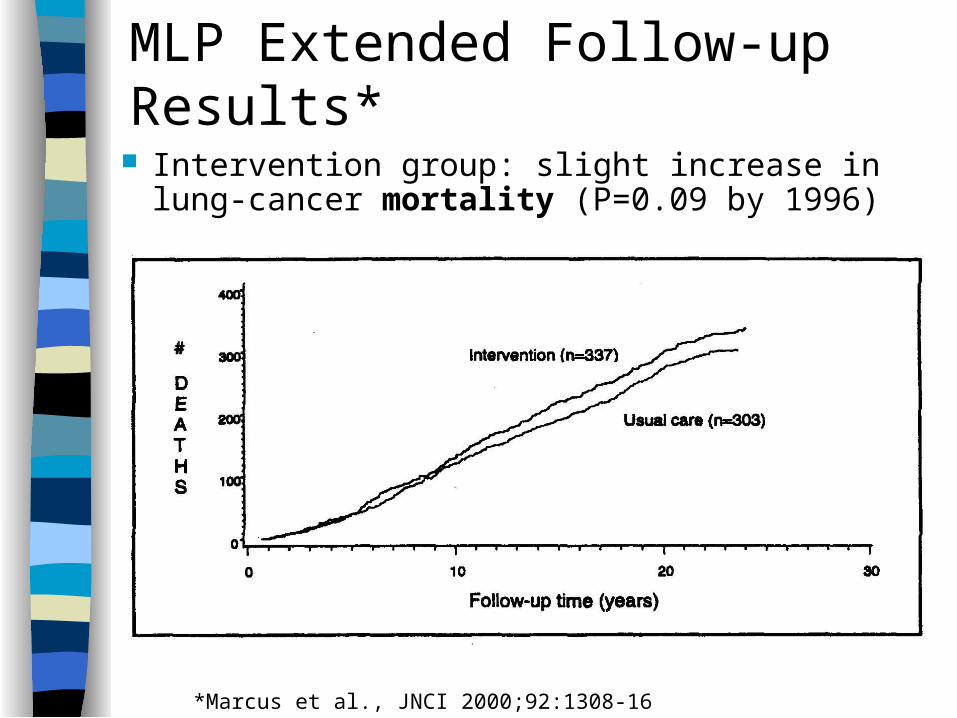
MLP Extended Follow-up Results*
Intervention group: slight increase in lung-cancer mortality (P=0.09 by 1996)
*Marcus et al., JNCI 2000;92:1308-16
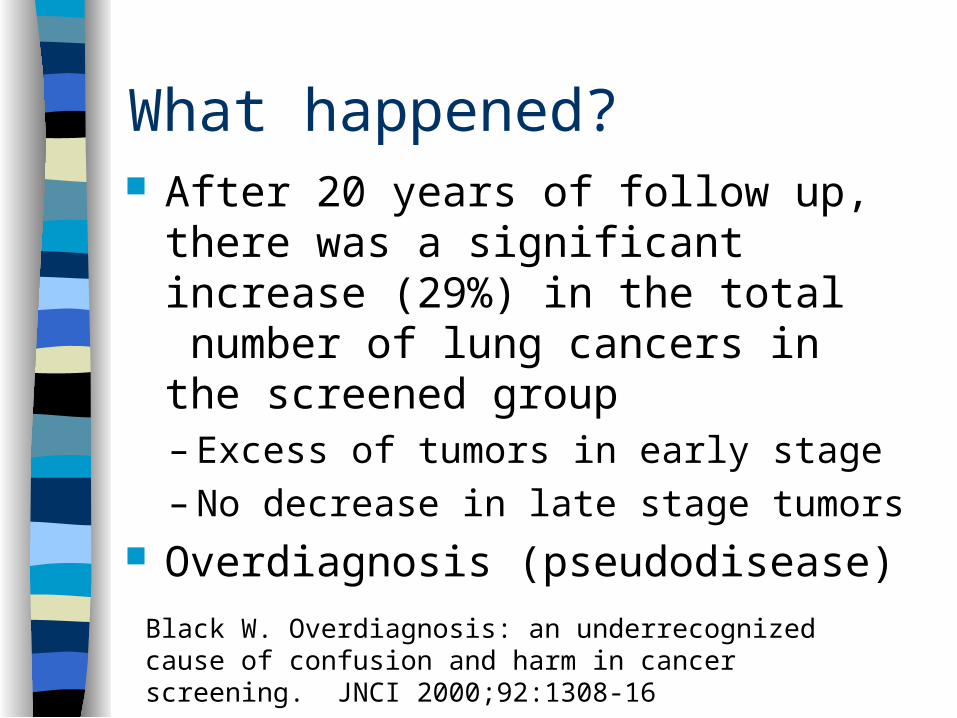
What happened? After 20 years of follow up, there was a
significant increase (29%) in the total number of lung cancers in the screened group– Excess of tumors in early stage– No decrease in late stage tumors
Overdiagnosis (pseudodisease)
Black W. Overdiagnosis: an underrecognized cause of confusion and harm in cancer screening. JNCI 2000;92:1308-16
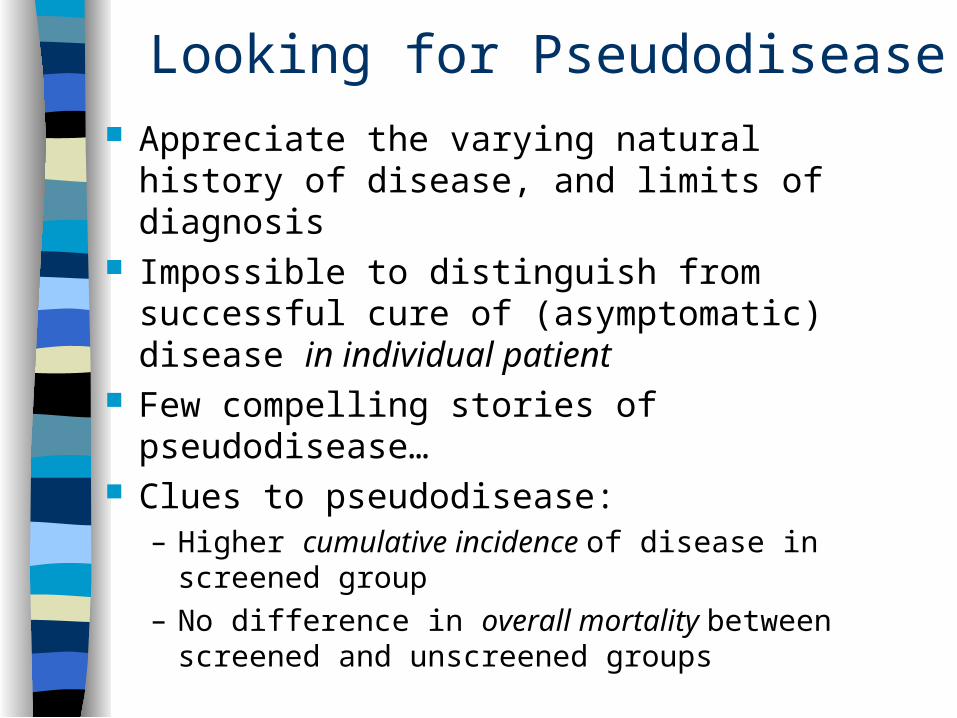
Looking for Pseudodisease Appreciate the varying natural history of
disease, and limits of diagnosis Impossible to distinguish from successful cure
of (asymptomatic) disease in individual patient
Few compelling stories of pseudodisease… Clues to pseudodisease:
– Higher cumulative incidence of disease in screened group
– No difference in overall mortality between screened and unscreened groups
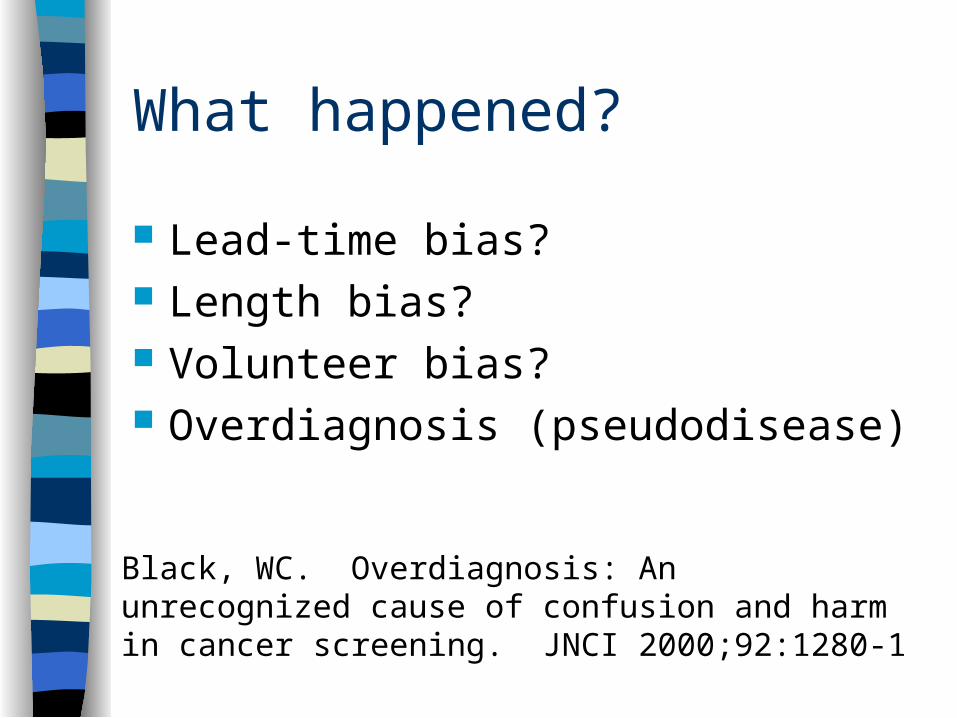
What happened?
Lead-time bias? Length bias? Volunteer bias? Overdiagnosis (pseudodisease)
Black, WC. Overdiagnosis: An unrecognized cause of confusion and harm in cancer screening. JNCI 2000;92:1280-1
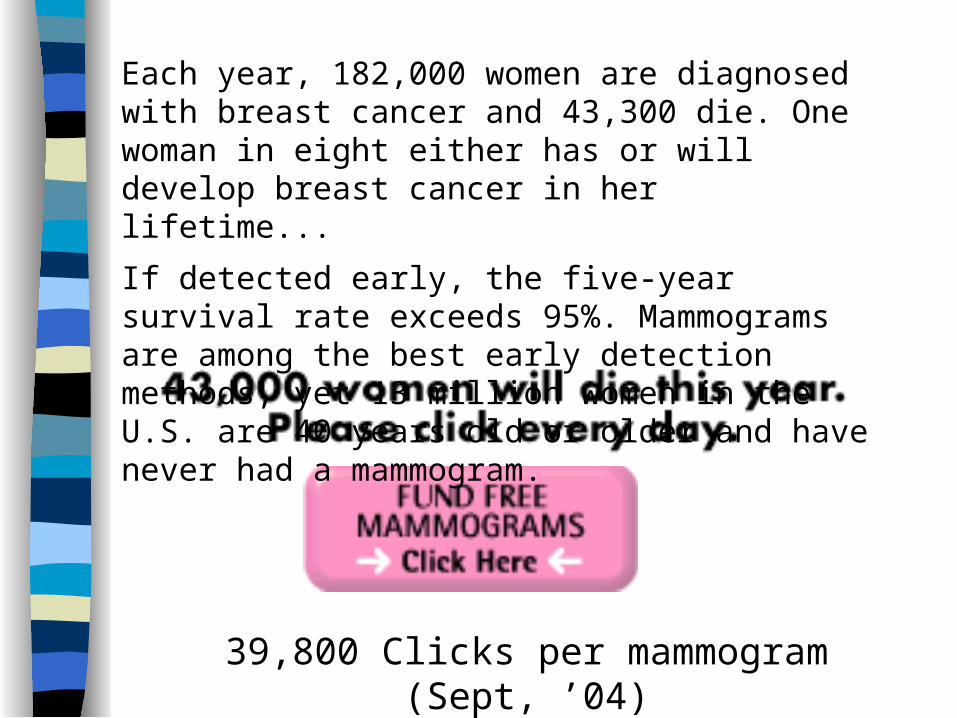
Each year, 182,000 women are diagnosed with breast cancer and 43,300 die. One woman in eight either has or will develop breast cancer in her lifetime...
If detected early, the five-year survival rate exceeds 95%. Mammograms are among the best early detection methods, yet 13 million women in the U.S. are 40 years old or older and have never had a mammogram.
39,800 Clicks per mammogram (Sept, ’04)
Why is this misleading
Each year 43,000 die, 182,000 new cases suggests mortality is ~24%
5-year survival > 95% with early detection suggests < 5% mortality, suggesting about 80% of these deaths preventable
Actual efficacy is closer < 20% for breast cancer mortality (lower for total mortality)
Issues with RCTs of cancer screening Quality of randomization Choice of outcome variable: cause-
specific vs. total mortality
Poor Quality Randomization. Example: Edinburgh trial Randomization by practice (N=87?), not
by woman 7 practices changed allocation status Highest SES
– 26% of women in control group– 53% of women in screening group
26% reduction in cardiovascular mortality in mammography group
Br J Cancer. 1994 September; 70(3): 542–548.
Problems with cause-specific mortality as an endpoint Assignment of cause of death is
subjective– Sticky diagnosis bias: deaths of unclear
cause attributed to cancer if previously diagnosed
– Slippery linkage bias: late deaths due to complications of screening or treatment will not be counted in cause specific mortality
Treatment may have effects on other causes of death
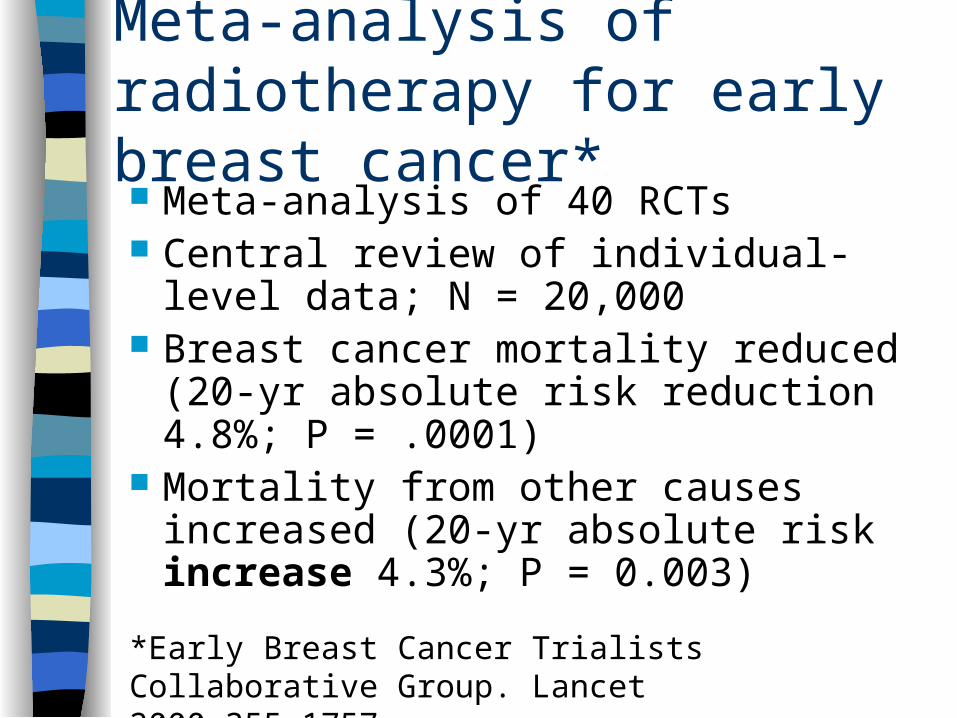
Meta-analysis of radiotherapy for early breast cancer* Meta-analysis of 40 RCTs Central review of individual-level data; N
= 20,000 Breast cancer mortality reduced (20-yr
absolute risk reduction 4.8%; P = .0001) Mortality from other causes increased
(20-yr absolute risk increase 4.3%; P = 0.003)
*Early Breast Cancer Trialists Collaborative Group. Lancet 2000;355:1757
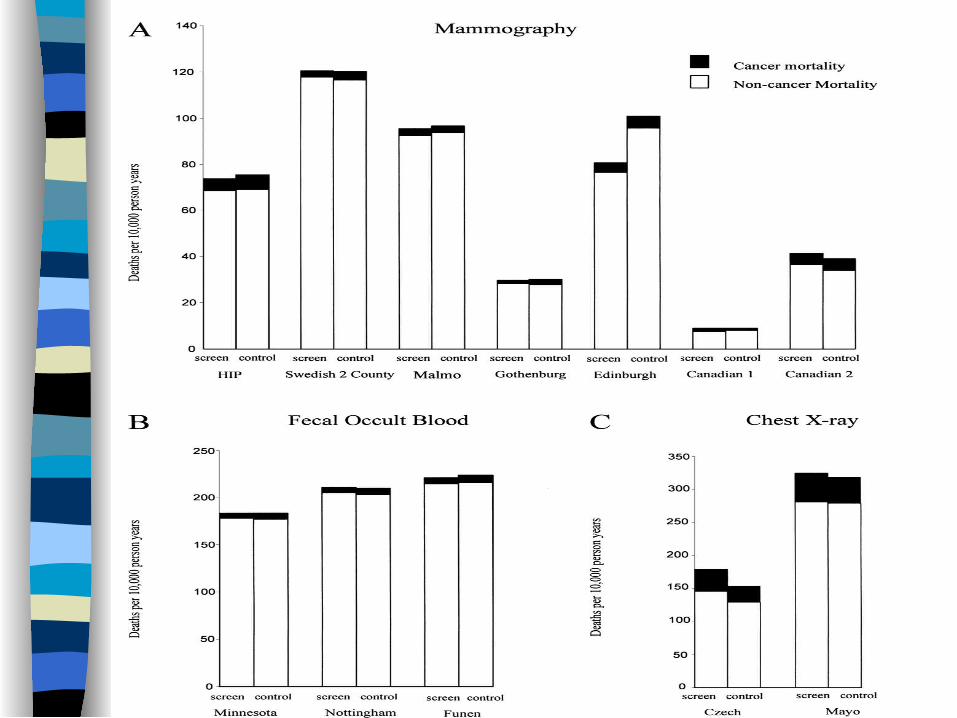
Cancer mortality vs. Total mortality in RCTs
TN Conclusions on Screening Promotion of screening by entities with a
vested interest and public enthusiasm for screening are challenges to EBM
High quality RCTs are needed Cause-specific mortality is problematic,
but total mortality usually not feasible Effect size is relevant: decision to
screen should not be based only on a P < 0.05 from a meta-analysis of RCTs
Cost per QALY Mammography, age 40-50: $105,000* Mammography, age 50-69: $21,400* Smoking cessation counseling: $2000** HIV prevention in Africa: $1-20***
*Salzman P et al. Ann Int Med 1997;127:955-65 (Based on optimistic assumptions about mammography.)
**Cromwell J et al. JAMA 1997;278:1759-66
***Marseille E et al. Lancet 2002; 359: 1851-56
Return to George Annas*
Need to begin to think differently about health. Two dysfunctional metaphors:– Military metaphor – battle disease, no
cost too high for victory, no room for uncertainty
– Market metaphor -- medicine as a business; health care as a product; success measured economically
*Annas G. Reframing the debate on health care reform by replacing our metaphors. NEJM 1995;332:744-7
Ecology metaphor
Sustainability Limited resources Interconnectedness More critical of technology Move away from domination, buying,
selling, exploiting Focus on the big picture
–Populations rather than individuals–Causes rather than symptoms
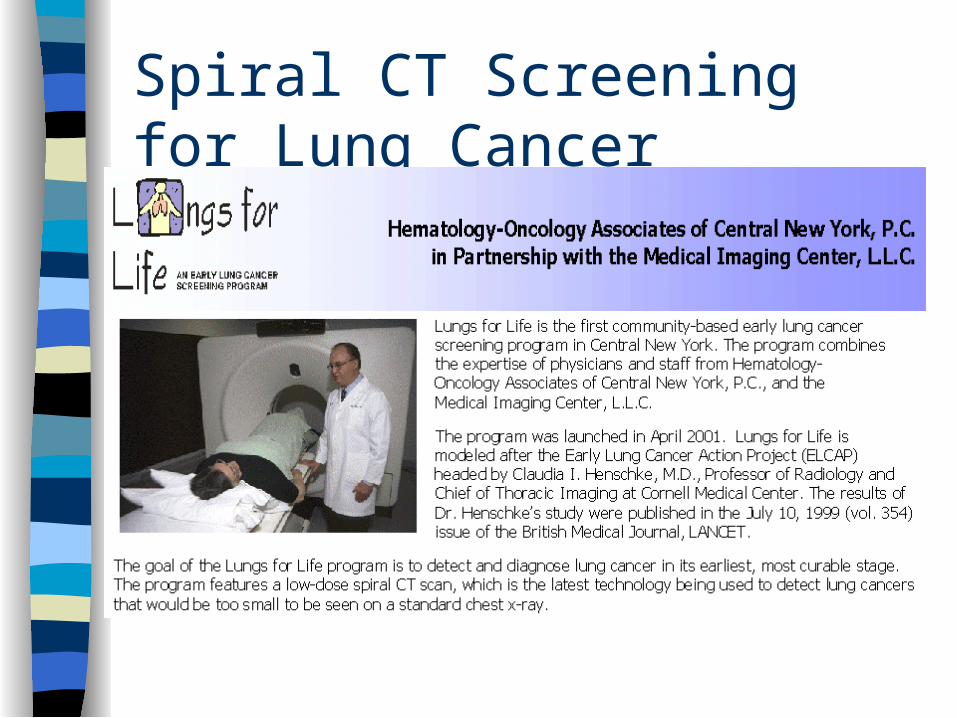
Spiral CT Screening for Lung Cancer

Source: http://www.lbl.gov/Education/ELSI/pollution-main.html

Questions?

Extra slides
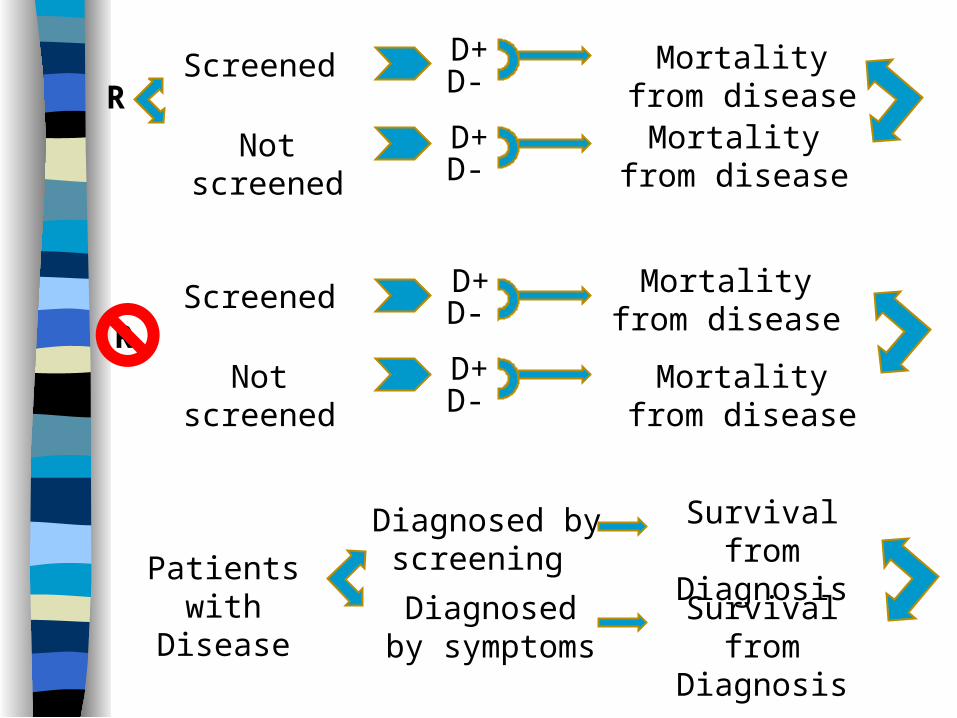
Screened
Not screened
Mortality from disease
R
Diagnosed by symptoms
Diagnosed by screening
Not screened
Screened
Survival from Diagnosis
D+
D-
D-
D-
D-D+
Patients with Disease
D+
D+
R
Survival from Diagnosis
Mortality from disease
Mortality from disease
Mortality from disease
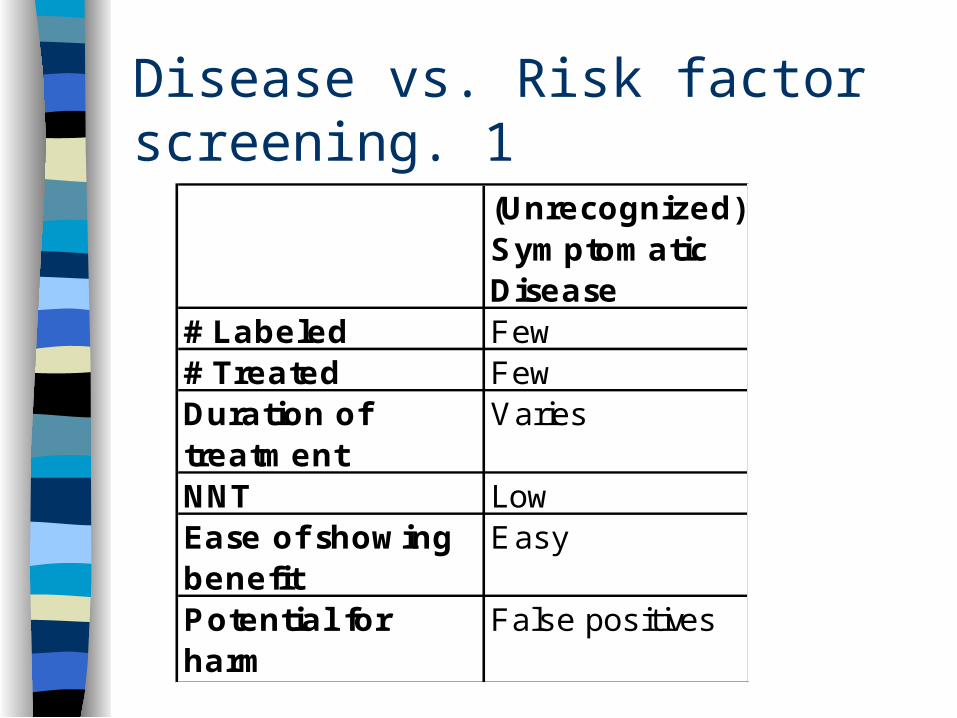
Disease vs. Risk factor screening. 1
(Unrecognized) Symptomatic Disease
# Labeled Few# Treated FewDuration of treatment
Varies
NNT LowEase of showing benefit
Easy
Potential for harm
False positives
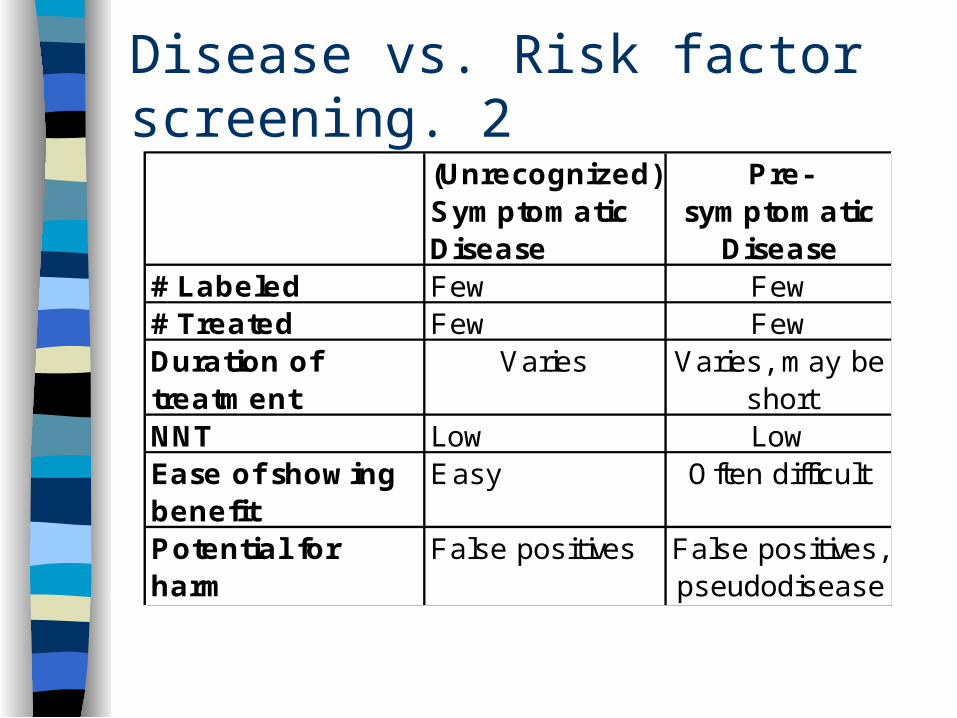
Disease vs. Risk factor screening. 2
(Unrecognized) Symptomatic Disease
Pre-symptomatic
Disease # Labeled Few Few# Treated Few FewDuration of treatment
Varies Varies, may be short
NNT Low LowEase of showing benefit
Easy Often difficult
Potential for harm
False positives False positives, pseudodisease
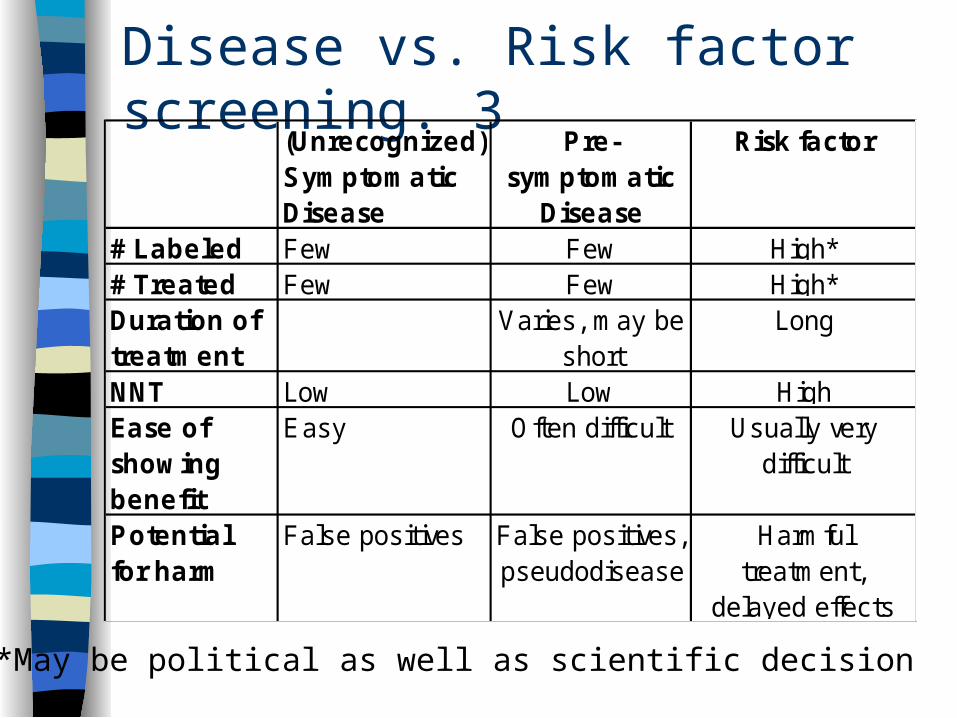
Disease vs. Risk factor screening. 3
*May be political as well as scientific decision
(Unrecognized) Symptomatic Disease
Pre-symptomatic
Disease
Risk factor
# Labeled Few Few High*# Treated Few Few High*Duration of treatment
Varies, may be short
Long
NNT Low Low HighEase of showing benefit
Easy Often difficult Usually very difficult
Potential for harm
False positives False positives, pseudodisease
Harmful treatment,
delayed effects
NHLBI National Lung Screening Trial
46,000 participants randomized in 2 years
Equal randomization Three annual screens Spiral CT versus chest x-ray!
Problem: psuedodisease doesn’t make a good story Hard to understand Can’t identify any victims
Recommended