LETTER
Reply to Garcia et al.: Common mistakes inmeasuring frequency-dependentword characteristicsThe concerns expressed by Garcia et al. (1)are misplaced due to a range of misconcept-ions about word usage frequency, word rank,and expert-constructed word lists such asLIWC (Linguist Inquiry and Word Count)(2). We provide a complete response in ourpaper’s online appendices (3). Garcia et al.(1) suggest that the set of function wordsin the LIWC dataset (2) show a wide spec-trum of average happiness with positiveskew (figure 1A in ref. 1) when, accordingto their interpretation, these words shouldexhibit a Dirac δ function located at neu-tral (havg = 5 on a 1–9 scale). However,many words tagged as function words inthe LIWC dataset readily elicit an emo-tional response in raters as exemplifiedby “greatest” (havg = 7.26), “best” (havg =7.26), “negative” (havg = 2.42), and “worst”(havg = 2.10). In our study (3), basic func-tion words that are expected to be neutral,such as “the” (havg = 4.98) and “to” (havg =4.98), were appropriately scored as such.Moreover, no meaningful statement aboutbiases can be made for sets of words cho-sen without frequency of use properlyincorporated.Garcia et al. (1) compare our work on
English with a similar sized survey byWarriner et al. (4). Warriner et al. generateda merged list of 13,915 English words, thebulk of which are a list of lemmas taken frommovie subtitles, a mismatch with the corporawe used in creating our English word listlabMT (language assessment by MechancicalTurk). In figure 1B of ref. 1, Garcia et al. makea flawed comparison between the two wordlists because the words behind each histogramare not the same. For shared words, the minordifference in median havg of 0.07—much lessthan the observed positivity bias—cannot be be-cause of our use of cartoon faces (emoticons).
The earlier Affective Norms for EnglishWords (ANEW) study upon which wemodeled our work (5) also uses cartoonsand yet found a lower median for wordsshared with Warriner et al. (5.29 versus5.44) (4). All three datasets agree well inmore general statistical comparisons (4).In attempting to say anything about a given
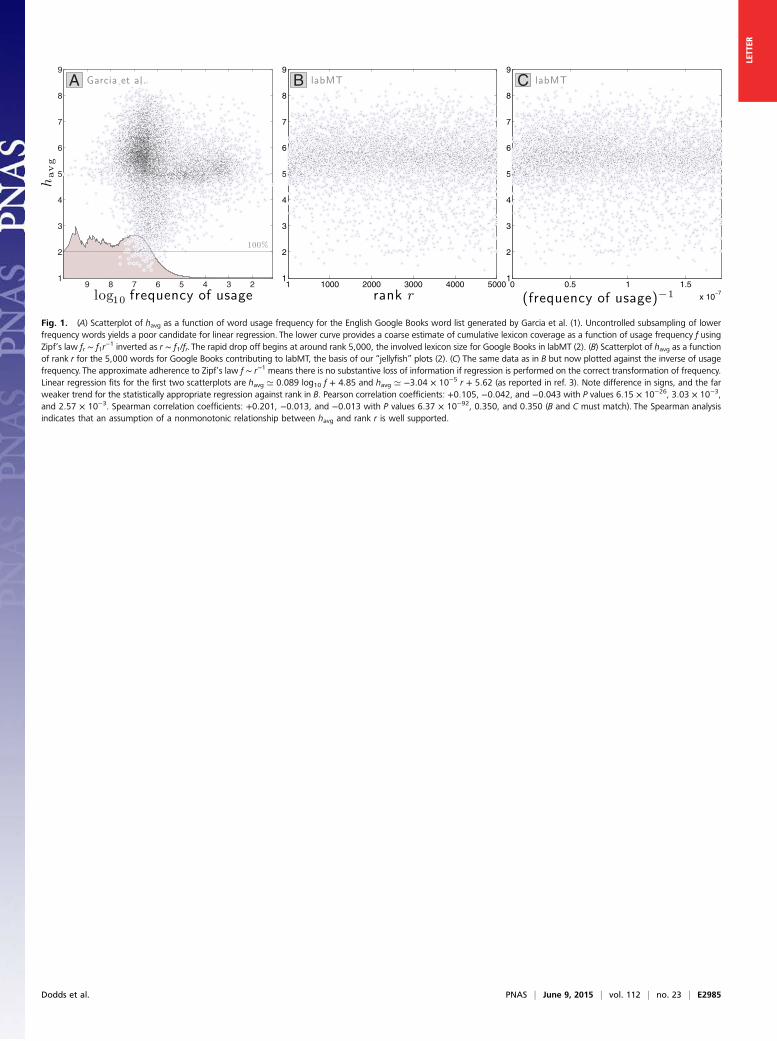
quality of words as it relates to use frequencywithin a specific corpora, a complete census ofwords by frequency must be on hand, other-wise uncontrolled sampling issues arise. InFig. 1A, we plot average happiness as afunction of frequency of use for the wordlist Garcia et al. (1) created from GoogleBooks. The scatter plot is clearly unsuitablefor linear regression. We show an estimate ofcumulative coverage at the bottom, whichcrashes soon after reaching 5,000 words.Sampling issues aside, Garcia et al. (1) state
that regression against frequency f is a betterchoice than using rank r because informationis lost in moving from f to r. However, thegeneral adherence of natural language to Zipf’slaw, f ∼ r−1, provides an immediate counter-argument, even acknowledging the possibility ofa scaling break (6). Fig. 1B shows how use rankis well suited for regression, and is the basis forthe “jellyfish” plots we presented in our work(3). In Fig. 1C, we present how havg behaves as afunction of 1/f, illustrating both the error inchoosing log10 f and that our results will beessentially unchanged if we regress against 1/f.
ACKNOWLEDGMENTS. This work was supported in partby National Science Foundation Grant DMS-0940271(to C.M.D.) and National Science Foundation CAREERAward 0846668 (to P.S.D.).
Peter Sheridan Doddsa,b,1, Eric M. Clarka,b,Suma Desuc, Morgan R. Frankc, Andrew J.Reagana,b, Jake Ryland Williamsa,b,Lewis Mitchelld, Kameron Decker Harrise,
Isabel M. Kloumannf, James P. Bagrowa,b,Karine Megerdoomiang, Matthew T.McMahong, Brian F. Tivnanb,g, andChristopher M. Danfortha,baComputational Story Lab, VermontAdvanced Computing Core, Department ofMathematics and Statistics, and bVermontComplex Systems Center, University ofVermont, Burlington, VT 05401; cCenter forComputational Engineering, MassachusettsInstitute of Technology, Cambridge, MA02139; dSchool of Mathematical Sciences,North Terrace Campus, The University ofAdelaide, Adelaide, SA 5005, Australia;eApplied Mathematics, University ofWashington, Seattle, WA 98195; fCenter forApplied Mathematics, Cornell University,Ithaca, NY 14853; and gThe MITRECorporation, McLean, VA 22102
1 Garcia D, Garas A, Schweitzer F (2015) The language-dependentrelationship between word happiness and frequency. Proc Natl AcadSci USA 112:E2983.2 Pennebaker JW, Booth RJ, Francis ME (2007) Linguistic Inquiryand Word Count: LIWC 2007. Available at homepage.psy.utexas.edu/HomePage/Faculty/Pennebaker/Reprints/LIWC2007_OperatorManual.pdf.Accessed May 15, 2014.3 Dodds PS, et al. (2015) Human language reveals a universalpositivity bias. Proc Natl Acad Sci USA 112(8):2389–2394.4 Warriner AB, Kuperman V, Brysbaert M (2013) Norms of valence,arousal, and dominance for 13,915 English lemmas. Behav ResMethods 45(4):1191–1207.5 Bradley MM, Lang PJ (1999) Affective Norms for English Words(anew): Stimuli, Instruction Manual and Affective Ratings. Technical
report c-1 (Univ of Florida, Gainesville, FL).6 Williams JR, Bagrow JP, Danforth CM, Dodds PS (2015) Text mixingshapes the anatomy of rank-frequency distributions: A modernZipfian mechanics for natural language. arXiv:1409.3870.
Author contributions: P.S.D., E.M.C., S.D., M.R.F., A.J.R., J.R.W., L.M.,
K.D.H., I.M.K., J.P.B., K.M., M.T.M., B.F.T., and C.M.D. analyzed data;
and P.S.D. and C.M.D. wrote the paper.
The authors declare no conflict of interest.
1To whom correspondence should be addressed. Email: pdodds@
uvm.edu.
E2984–E2985 | PNAS | June 9, 2015 | vol. 112 | no. 23 www.pnas.org/cgi/doi/10.1073/pnas.1505647112
A B C
Fig. 1. (A) Scatterplot of havg as a function of word usage frequency for the English Google Books word list generated by Garcia et al. (1). Uncontrolled subsampling of lowerfrequency words yields a poor candidate for linear regression. The lower curve provides a coarse estimate of cumulative lexicon coverage as a function of usage frequency f usingZipf’s law fr ∼ f1r
−1 inverted as r ∼ f1/fr. The rapid drop off begins at around rank 5,000, the involved lexicon size for Google Books in labMT (2). (B) Scatterplot of havg as a functionof rank r for the 5,000 words for Google Books contributing to labMT, the basis of our “jellyfish” plots (2). (C) The same data as in B but now plotted against the inverse of usagefrequency. The approximate adherence to Zipf’s law f ∼ r−1 means there is no substantive loss of information if regression is performed on the correct transformation of frequency.Linear regression fits for the first two scatterplots are havg ’ 0.089 log10 f + 4.85 and havg ’ −3.04 × 10⁻⁵ r + 5.62 (as reported in ref. 3). Note difference in signs, and the farweaker trend for the statistically appropriate regression against rank in B. Pearson correlation coefficients: +0.105, −0.042, and −0.043 with P values 6.15 × 10⁻²⁶, 3.03 × 10⁻³,and 2.57 × 10⁻³. Spearman correlation coefficients: +0.201, −0.013, and −0.013 with P values 6.37 × 10−92, 0.350, and 0.350 (B and C must match). The Spearman analysisindicates that an assumption of a nonmonotonic relationship between havg and rank r is well supported.
Dodds et al. PNAS | June 9, 2015 | vol. 112 | no. 23 | E2985
LETT
ER
Recommended


![Burning the house of Fatima binte Mohammad[saww] · page 3 of 47 7.5 reply two 31 7.6 defence three 32 7.7 reply one 32 7.8 reply two 32 7.9 reply three 32 7.10 reply four 33 7.11](https://img.pdfslide.net/doc/110x75/6008f7ca6342d553a45420f3/burning-the-house-of-fatima-binte-mohammadsaww-page-3-of-47-75-reply-two-31-76.jpg)