"
1 I
/ ),
.. I I
j
11/111111111111111111/1111/ III/ 1111 11111111111111111/11111111111 3 1176 00154 6226
DOE/NASA/1044-79/3 NASA TM-79215
NASA-TM-7921519790020557
EFFECT OF POSITIVE PULSE
CHARGE WAVEFORMS ON CYCLE
LIFE OF NICKEL-ZINC CELLS
John J. Smithrick National Aeronautics and Space Administration Lewis Research Center
LIBRARY COpy July 1979
~GLEY RESEARCH CENTEH
LIBRARY, NASA:
" Jj~eI.O~ YJRGI.tlI8'
Prepared for U.S. DEPABTMENT OF ENERGY' Conservation and Solar Applications Office of Transportation Programs
111111111111111111111111111111111111111111111 NF00513
https://ntrs.nasa.gov/search.jsp?R=19790020557 2018-08-17T19:24:25+00:00Z

NOTICE
This report was prepared to document work sponsored by
the United States Government. Neither the United States
nor its agent, the United States Department of Energy,
nor any Federal employees, nor any of their contractors,
subcontractors or their employees, makes any warranty,
express or implied, or assumes any legal liability or
responsibility for the accuracy, completeness, or useful
ness of any information, apparatus, product or process
disclosed, or represents that its use would not infringe
privately owned rights.

EFFECT OF POSITIVE PULSE
CHARGE WAVEFORMS ON CYCLE
LIFE OF NICKEL-ZINC CELLS
John J. Smith rick
DOEINASA/1044-7913 NASA TM-79215
National Aeronautics and Space Administration Lewis Research Center Cleveland, Oh io 44135
July 1979
Work performed for U. S. DEPARTMENT OF ENERGY Conservation and Solar Applications Office of Transportation Programs Washington, D. C. 20545 Under Interagency Agreement EC-77-A-31-1044

2
5 amp-hour nickel-zinc cells were selected, rather than traction cells, because
the available chargers were limited to modest currents. Three of the charge
methods were different positive pulse waveforms (no negative pulses during
charge); 120 Hz full wave rectified sinusoidal (FWRS) , 120 Hz silicon controlled
rectified (SCR) , and 1 kHz square wave (SW). The fourth, was a standard con
stant current method used as a baseline of comparison.
In this paper, the results of positive pulse charge waveforms on the cycle
life of 5 amp-hour nickel-zinc cells are presented and discussed.
EXPERIMENT AL
Cell Chargers
The positive pulse chargers and their specifications were (1) 120 Hz full
wave rectified sinusoidal (FWRS); voltage range 0 to 10 V, current range 0 to 10 amps and adjustable ratio of peak to average current, (2) 120 Hz silicon
controlled rectified (SCR), voltage range 0 to 10 V, current range 0 to 10 amps, adjustable ratio of peak to average current and, adjustable firing angle, (3) 1 kHz
square waveform (SW), voltage range of 0 to 25 volts, current range 0 to 10 amps,
adjustable ratio of peak to average current, and adjustable duty cycle and, (4) the
constant current charger, a commercial unit, voltage range 0 to 50 V, and a cur
rent range 0 to 8 amps. Representative charge current waveforms, calculated
from oscilloscope voltage traces measured across a shunt during charge, are
displayed in figures 1 to 4. Zero charge current occurs when the power supply
voltage equals cell voltage.
The FWRS charger was selected on the basis of low cost potential. Relative to a constant voltage charger which requires close voltage regulation (ref. 4), and
Similarly inexpensive compared to a constant current charger. Simple circuitry
should also result in greater reliability, and lighter weight which could be a factor
in selecting a charger for on-board electric vehicle use. SCR and constant cur
rent chargers were selected as representative of present charge methods. The
SW charger was selected because the cirCuitry was similar to existing electric vehicle chopper controller circuitry, which could be utilized for an on-board charger. The positive pulse chargers were designed and fabricated at the Lewis
Research Center from commercially available state-of-the-art components. The constant current charger was a commercially available unit.
3
Measurements and Procedures
For these experiments, the quantities measured and their accuracies were:
average charge current (±O. 3%), peak charge current (±3%), peak to average
charge current ratio (±3%), discharge current (±o. 3%), amp-hours into cell
during charge (±O. 5%), amp-hours out of cell during discharge (±O. 5%), individual cell voltage during charge and discharge (±O. 3%).
The average charge current was calculated from the average voltage meas
ured with an integrating digital voltmeter across a shunt. The peak charge cur
rent was calculated from peak voltage measured across a shunt with an oscillo
scope. From these values, the peak to average current ratio was calculated. The
discharge current was also calculated from the voltage measured across a shunt.
Conventional amp-hour meters were used to measure the amp-hours into a cell
during charge and out of a cell during discharge.
The 5 amp-hour nickel-zinc cells, used in these experiments, were built at
the Lewis Research Center and were similar to those used for separator evalu
ation (ref. 6). They contained the" Astropower" inorganic-organic separator
with 35% KOH. A total of 12 cells were randomly selected and divided into four
groups of three. The three cells in each group were electrically connected in
series, and charge/discharge cycled using each of the previously described meth
ods. The cells were cycled in the sealed state and were not vented at any time
during the tests.
A charge/discharge cycle consisted of charging the cells by each method, at
the average c/20 rate (0.25 A). A 5% overcharge was used for each cycle to
compensate for self-discharge of the nickel electrode. Charge currents peak to
average charge current ratio, and duty cycle of each representative charge wave
form (figs. 1 to 4) used during the life cycle experiments are summarized in
table I. The firing angle for the SCR was set at 700•
During the discharge portion of a cycle, a constant c/2. 5 (2 A) rate was used.
Voltage and amp-hours removed from each cell were monitored and the discharge was terminated when either cell voltage was 1 volt or capacity removed was 3.75 amp-hour (15% depth of discharge). When a cell reached one of the two termin
ation criteria above, it was removed from the series string and discharge was
continued on the remaining cells until the next cell met the discharge criteria.
Each cell in the series string was cycled to failure. The failure cycle was de
fined as the cycle in which the output capacity at termination fell below 50% (l. 9
A-hr) of the capacity obtained in the first discharge cycle (3. 7 5 A-hr). After

4
failure, a cell was charged, removed from the test, and its open circuit voltage
was monitored as a function of storage time to determine whether or not the cell
had an internal short,
RESULTS AND DISCUSSION
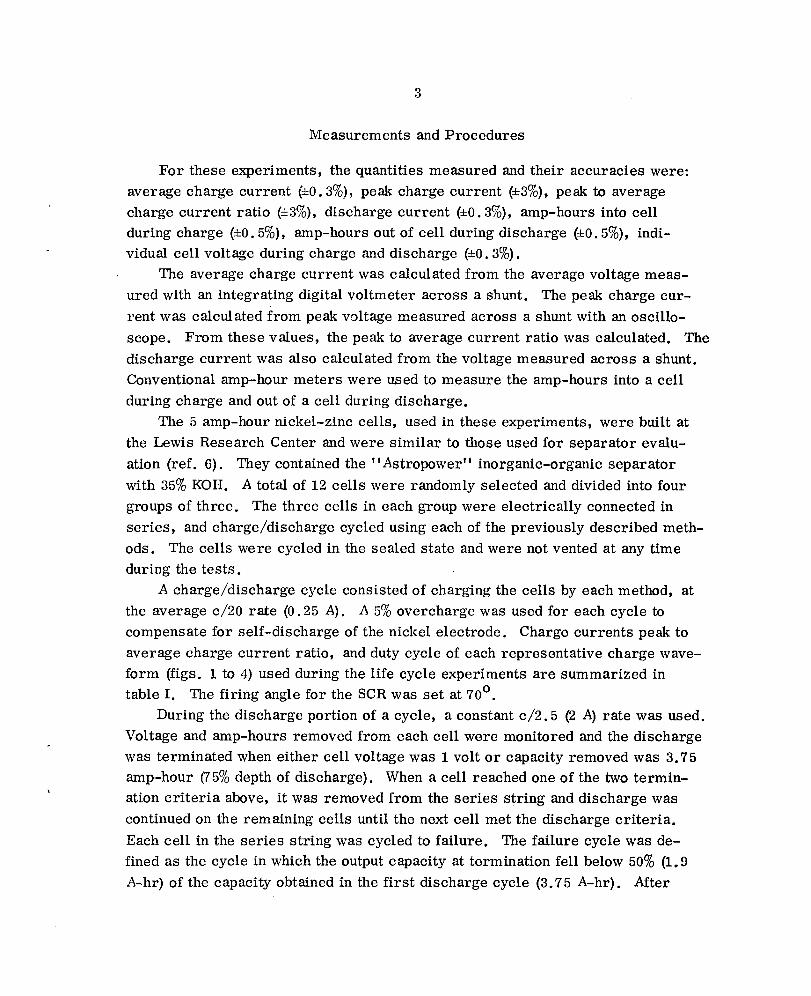
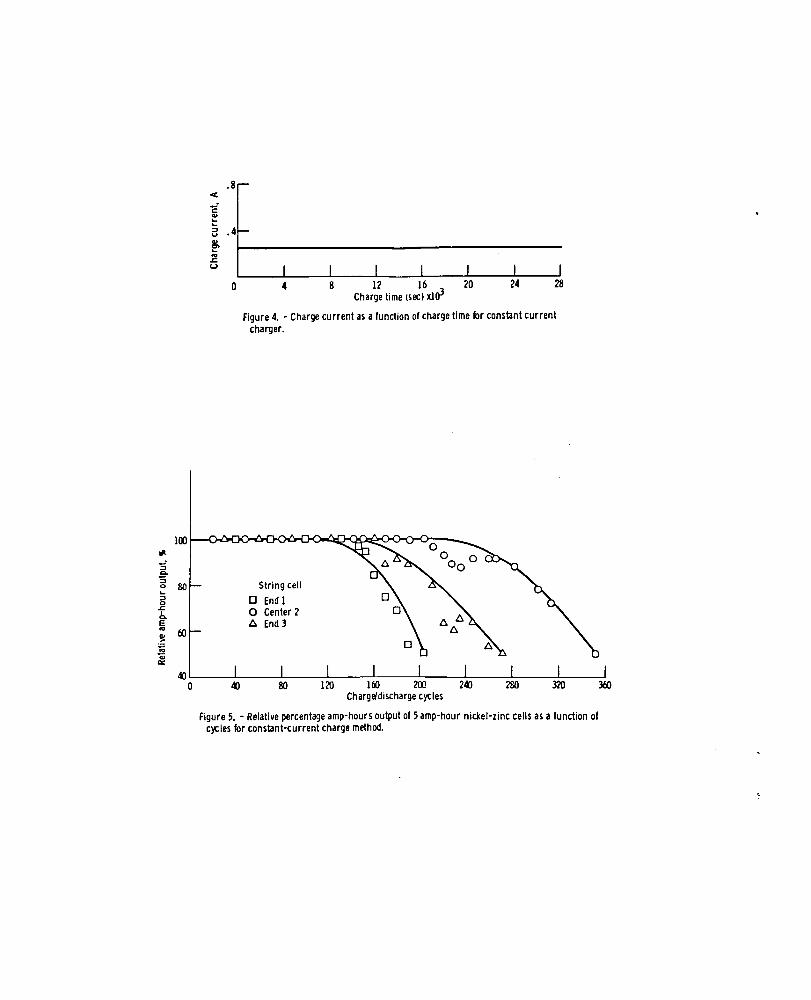
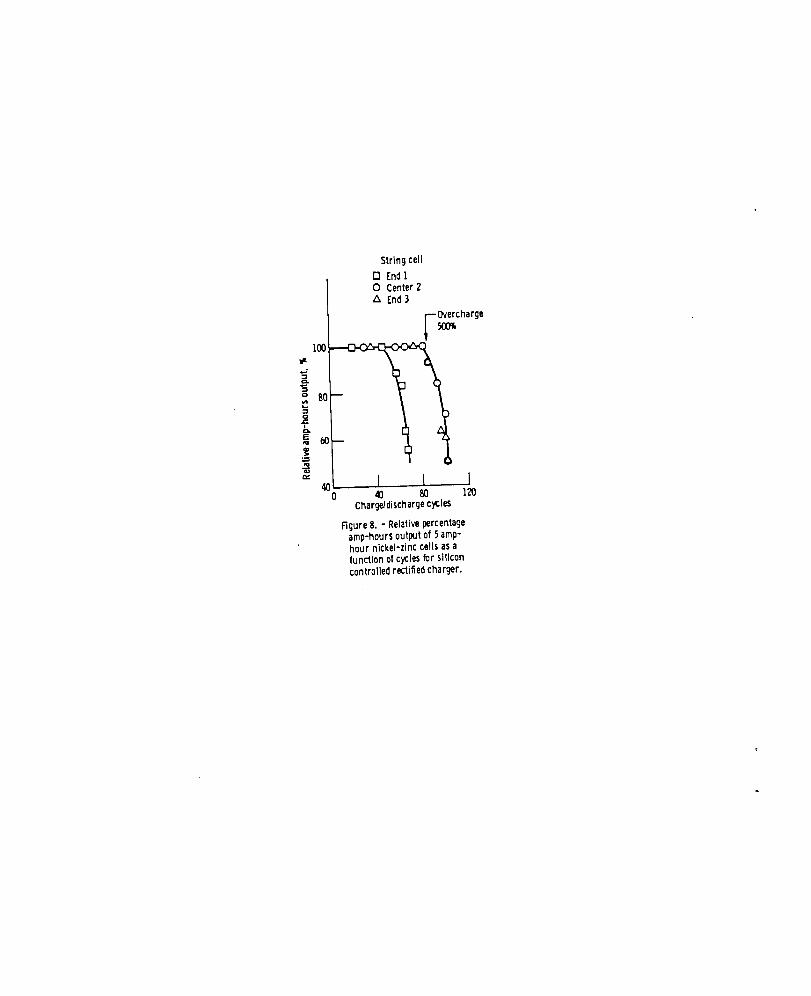
Figures 5 to 8 summarize the relative percentage amp-hours output (rela
tive to cycle 1 = 100%) for the 5 amp-hour nickel-zinc cells as a function of
cycles completed for the four different charge waveforms. In these figures the
location of each cell in the series string is designated by the legend, i. e., 1 and
3 were end cells and 2 was in the center. The best and worst cells I cycles to failure are summarized in table II.
The data spread noted is probably due to variability among the randomly
selected test cells. This is unavoidable with nonproduction cells.
A statistical analysis of the cycle data was performed. Confidence intervals
were calculated based on a T-test at the 95% confidence level using a pooled
standard deviation (ref. 7).
Figure 9 summarizes the average cycle life at failure, and confidence inter
vals for cells exercised under each of the charge methods . The spread in the
data indicates no significant difference in average cycle life using the 120 Hz
FWRS, 1 kHz SW, or constant current charge method. There was an apparent difference using the SCR charge method. Unfortunately, this may have been due
to an inadvertent severe overcharge of 500% which occurred at cycle number 82.
This would be expected to severely shorten the cycle life of a cycle. It should be
noted that one cell failed prior to the severe overcharge. Therefore, the analysis
of the results on the SCR charge method is ambiguous.
Results of this work suggest that a relatively inexpensive full wave rectifier
charger could be used to charge nickel-zinc cells with no Significant loss in aver
age cycle life comp,ared to more expensive charge methods. A 1 kHz square
wave charger could also be used with no loss in average cell cycle life suggesting the possibility of utilizing existing electric vehicle chopper controller circuitry
for on-board charger. Pulse charging of the types investigated did not lead to any
increase in cycle life' over that for constant current charging.
The failure mechanism was determined from open circuit voltage stand. The
voltage of a charged cell was monitored as a function of stand time. Results of
a representative cell is shown in figure 10. The steady drop in open circuit volt
age indicates that self-discharge due t9 internal shorting contributed to cell de
gradation.

5
CONCLUDING REMARKS
A relatively inexpensive full wave rectified sinusoidal charger appears
feasible for charging 5 amp-hour nickel-zinc cells. This charging method
showed no significant loss in average cycle life when compared to the constant
current charger. A 1 kHz square wave charger co'uld also be used with no Significant loss in average cycle life; and suggests the possibility of utilizing
existing electric vehicle chopper controller circuitry for an on-board charger. Pulse charging of the types investigated did not improve cell cycle life over
that for constant current in the 5 amp-hour nickel-zinc cells.
REFERENCES
1. Weininger, J. L.; and Siwek, E. G.: A System Evaluation of Lead-Acid Bat
tery Chargers: Part 1. Cells With Antimonial Positive Grids. J. Power
Sources, vol. 2, no. 4, 1978, pp. 301-316.
2. Fader, B.; and Van Handle, H.: Life Cycle Test of a 6-Volt Calcium-Lead
Standby Battery Using a Mas Gas-Controlled Charger. Report No. 4454,
American Smelting and Refining Company, 1971.
3. Behrin, E. P.; et. al.: Energy Storage Systems for Automotive Propulsion,
Vol. 2 - Detailed Report. UCRL-5230 3 Vol. -2, Lawrence Livermore Labs.,
Univ. of California, 1977.
4. Mueller, G. A.: The Gould Battery Handbook. Gould, Inc., Mendota Heights,
Minn., 1973.
5. Mas, Joseph A.: The Charging Process. Second International Electric Vehicles
Symposium, Electric Vehicle Council, 1971, pp. 228-246.
6. Sheibley, D. W.: New Separators for Nickel-Zinc Batteries. NASA TM X-3465,
1976. 7. Dixon, W. J.; and Massey, F. J., Jr.: Introduction for Statistical Analysis.
Third ed., McGraw Hill Book Co., Inc. 1969.

6
TABLE I. - CHARGE CURRENT AND DUTY CYCLE OF
EACH REPRESENTATIVE CHARGE WAVEFORM
Charger Peak Average Peak current Duty
waveform current, current, average current cycle, A A %
120 Hz FWRS 0.5 0.25 2.0 68
120 Hz SCR .6 .24 2.5 57
1 kHz SW .7 .25 2.8 36
CC .25 .25 1.0 100
TABLE II. - CYCLES TO FAILURE FOR
BEST AND WORST CELLS USING THE
FOUR DIFFERENT CHARGE WAVEFORMS
Charger waveform Cycles to failure
Best cell Worst cell
Constant current 352 203
120 Hz FWRS 328 219
1 kHz SW 343 133
120 Hz SCR 100 67

'E .. ... ...
.B
a . 8. ... '" s= u
c "E .. t :> u
8. ... '" s= u
. B
Figure 1. - Charge current as a function of charge lime tlr 120 Hz full wave rectified sinusoidal charger .
Figure 2. - Charge current as a function of charge time for a 120 Hz silicon controlled rectified charger .
. Br-<
o 1 2 3 Charge time (secl xl03
I 4
Figure 3. - Charge current as a function of charge lime tlr 1 kHz square wave charger.
100 "#
"5 Q.
:; 80 0 ..
:l 0
.J::.
to. E
'" 60 ~ ~ ... a::
40 0
.8 < -E t .. :l .4 u
8. .. ... .J::. <.J
0
40
4 8 12 16 Charge time (secl xl03
20 24 28
Figure 4. - Charge current as a function of charge time br constant current charger.
String cell o End 1 o Center 2 l::. End 3
80 120 160 200 240 280 320 Charge/discharge cycles
Figure 5. - Relative percentage amp-hours output of 5 amp-hour nickel-zinc celis as a function of cycles for constant-current charge method.
360
I#-.J
~ ~ '" ... => 0 ~
b. e .. ~ ~ .. co:
l#-
S S-o
'" ... => 0 ~
I 0. e ... ~ .!!! II>
0::
100
80
60
40 0
100
80
60
40 0
String cell o End 1 o Center 2 A End 3
Figure 6. - Relative percentage amp-hours output of 5 amp-hour nickel-zinc cilis is I function of c)Cles br 120 Hz full wave rectified sinusoidal charger.
String cell A End 1 o Center 2 0 End 3
Figure 7. - Relative percentage amp-hours output of 5 amp-hour nickel-zinc cells is I function of cycles for 1 kHz square wave charger.
"#
"5 S-o VI ... :::I 0
.J: I co. e "' '" ~ "' a; 0<:
String cell o End 1 o Center 2 t:. End 3
r~Charge
100 t--o-cx.-o-oc..c.o
80
60
~~--~----~----~ o «l 80 120 Charge/discharge c~les
Figure 8. - Relative percentage amp-hours output of 5 amphour nickel-zinc cells as a function of c)tles for silicon controlled rectified charger.

"-8. .l!!
~ -:; u ... U
I c:
~ ~ '" Qi a::
Charge method:
Pooled standard deviation 95ft confidence interwl
100
80
60
40
20
o
Con stant cu rrent • 120 Hz full wave rectified • 1 kHz SQuare wave -120 Hz silicon controlled rectified II---___ ---C
-100 o 100 200 :m Charge/discharge c)eles
Figure 9. - Average cycle life at failure and confidence intervals for charge mlthods.
Storage time, hr
Figure 10. - Relative open-circuit voltage as a lunction of storage time for a represenutiv. failed cell.

1. Report No. I 2. Government Accession No. 3. Recipient's Catalog No.
NASA TM-79215 4. Title and Subtitle 5. Report Date
EFFECT OF POSITIVE PULSE CHARGE WAVEFORMS ON July 1979
CYCLE LIFE OF NICKEL-ZINC CELLS 6. Performing Organization Code
7. Author(sl 8. Performing Organization Report No.
John J. Smithrick E-100 10. Work Unit No.
9. Performing Organization Name and Address
National Aeronautics and Space Administration 11. Contract or Grant No.
Lewis Research Center
Cleveland, Ohio 44135 13. Type of Report and Period Covered
12. Sponsoring Agency Name and Address Technical Memorandum U. S. Department of Energy Office of Transportation Programs
14. Sponsoring Agency €ode-ReportNo.
Washington, D. C. 20545 DOE/NASA/1044-79/3
15. Supplementary Notes
Final report. Prepared under Interagency Agreement EC-77-A-31-1044.
16. Abstract
Five amp-hour nickel-zinc cells were life cycled to evaluate four different charge methods.
Three of the four waveforms investigated were 120 Hz full wave rectified sinusoidal (FWRS),
120 Hz silicon controlled rectified (SCR), and 1 kHz square wave (SW). The fourth, a con-
stant current method, was used as a baseline of comparison. Three sealed Ni-Zn cells Con-
nected in series were cycled. Each series string was charged at an average c/20 rate, and
discharged at a c/2. 5 rate to a 75% rated depth. Results indicate that the relatively inex-pensive 120 Hz FWRS charger appears feasible for charging 5 amp-hour nickel-zinc cells with no significant loss in average cycle life when compared to constant current charging. The
I-kHz SW charger could also be used with no significant loss in average cycle life, and sug-gests the possibility of utilizing the existing electric vehicle chopper controller CirCuitry for
an on-board charger. There was an apparent difference using the 120 Hz SCR charger com-
pared to the others, however, this difference could be due to an inadvertent severe overcharge, which occurred prior to cell failure. The remaining two positive pulse charging waveforms,
FWRS and 1 kHz, did not improve the cycle life of 5 amp-hour nickel-zinc cells over that of
constant current charging.
17. Key Words (Suggested by Author(sll 18. Distribution Statement
Unclassified - unlimited STAR Category 44
DOE Category UC-94c
19. Security Classif. (of this report) [20
Security Classi/' (of this page) [21. No. of Pages /22. Price'
Unclassified Unclassified
• For sale by the NationJI TechnlcJI InforrnJtion Service. SDrlngfield. VirglnlJ 22161

End of Document
Recommended


![Food Hygiene.ppt [Rectified] Rev 3](https://img.pdfslide.net/doc/110x75/552ecfdc4a7959c6598b4a0d/food-hygieneppt-rectified-rev-3.jpg)