AVERTISSEMENT
Ce document est le fruit d'un long travail approuvé par le jury de soutenance et mis à disposition de l'ensemble de la communauté universitaire élargie. Il est soumis à la propriété intellectuelle de l'auteur. Ceci implique une obligation de citation et de référencement lors de l’utilisation de ce document. D'autre part, toute contrefaçon, plagiat, reproduction illicite encourt une poursuite pénale. Contact : [email protected]
LIENS Code de la Propriété Intellectuelle. articles L 122. 4 Code de la Propriété Intellectuelle. articles L 335.2- L 335.10 http://www.cfcopies.com/V2/leg/leg_droi.php http://www.culture.gouv.fr/culture/infos-pratiques/droits/protection.htm

en co-tutelle avec l’East-China University
of Science and Technology
Ecole Nationale Supérieure des
Industries Chimiques
(ENSIC)
Ecole Doctorale : Ressources Procédés
Produits Environnement (RP2E)
Laboratoire Réactions et Génie des
Procédés (LRGP-CNRS UPR 3349)
Elaboration de polypropylène ou de polystyrène à l'aide du dioxyde de
carbone supercritique : procédé – microstructure – propriétés mécaniques
Supercritical carbon dioxide assisted toughening of polypropylene or
polystyrene: process, microstructure and mechanical properties
THESE
présentée en vue de l’obtention du
DOCTORAT DE L’INSTITUT NATIONAL POLYTECHNIQUE DE LORRAINE
Spécialité : Génie des Procédés et des Produits
par
Jin-Biao BAO
Soutenance prévue le 16 décembre 2011 à 15:30
Composition du jury :
Rapporteurs : Jacques FAGES Professeur à l’ Ecole des Mines d'Albi
Lian-fang FENG Professeur à l’Université de Zhejiang, Chine
Examinateurs : Guo-Hua HU Professeur à l’INPL et membre de l’IUF
Ling ZHAO
Professeur à l’East-China University of Science
and Technology
II
Abstract
In a conventional supercritical carbon dioxide (scCO2) batch foaming process, CO2 is
dissolved in a polymer matrix, which increases the free volume between molecular chains
and chain mobility, and consequently affects its crystallization behavior. After the saturation
process, CO2 is depressurized quickly to induce foaming in the polymer matrix. This type
of process normally produces microcellular foams with an average cell size of about 10 µm
and a cell density of more than 109 cells/cm3. Properties and applications of polymer foams
depend very much on cell morphologies. As a widely used general-purpose polymer due to
its excellent performance-to-price ratio, polypropylene (PP) and polystyrene (PS) have been
widely studied and their foaming has also been subjected to intense studies. In this work,
scCO2 induced foaming of PP or PS is systematically studied with emphasis on the
relationship between process, microstructure and mechanical properties.
The first part of the thesis deals with the toughening of iPP by scCO2 induced
crystallization for the fine separation of rigid crystalline domains and soft amorphous ones
in the polymer matrix. The results indicate that the toughness of injection molded iPP
specimens can be significantly improved without loss of strength by controlled shearing,
CO2 induced re-crystallization and adequate cooling. Under shear, a high degree of
orientation can be obtained with “shish-kebab” crystals formed in the shear zone. During
the subsequent CO2 treatment, a crystal network morphology may be formed as a result of
an increase in the number of the primary lamellae and that of crosshatched subsidiary
lamellae, which leads to an increase in the toughness. In addition, quenching in ice-water of
scCO2 treated iPP promotes the formation of nano-sized mesomorphic phase domains in the
shear zone, which further toughens the iPP. The impact strength of the best toughened iPP is
more than 12 times that of the original one while retaining the tensile strength and modulus.
Moreover, the highly oriented iPP with “shish-kebab” and “spherulite” are used for CO2
foaming to investigate the effect of crystalline structure on the formation of cell nucleation
and growth. The impact property is also studied. A nanocellular foam is achieved by CO2
foaming of shish-kebab crystalline structure in the solid state. The underlying principle is
localized cell nucleation and growth in amorphous domains confined by the shish-kebab
crystalline domains. Therefore, nano-cells are generated in amorphous domains confined by
shish-kebab crystalline domains which cannot foam. At a chosen CO2 pressure, the cell
morphology depends very much on the foaming temperature, as the crystal morphology
depends on the temperature when the CO2 pressure is constant. Moreover, the impact tests
III
indicate that the nanocellular bubbles among the network crystals structure can further
toughen the scCO2 treated iPP.
In addition, the effect of the foaming conditions and the cell structural parameters of PS
foams on the mechanical properties are studied systematically. PS foams with isotropic cell
morphology and oriented cell one are prepared. For the isotropic cell morphologies, the
mechanical properties of the PS foams increase with increasing relative density. When the
relative density is constant, the cell size does not affect the tensile strength and modulus but
has a slight effect on the impact strength. The relative impact strength increases with
decreasing cell size. The results indicate that the solid area fraction on the fracture surface
(fs) and the cell walls are the key parameters for toughening PS foams. For oriented foams,
the cell morphologies oriented perpendicular to the impact direction could significantly
enhance the impact properties of PS foams. Moreover, the oriented cells along the tensile
direction and the oriented molecular chains sheared by the bubbles may both lead to the
improvement of strength in the oriented direction. On the other hand, the cells oriented in
the other two directions result in the poor impact properties, because their larger fs and
worse dispersion of cell walls compared with those of isotropic foams.
Finally, a two-step depressurization batch process is developed to produce bi-modal cell
structure PS foams by using scCO2 as the blowing agent. This unique cell structure with
both small and large cells homogenously distributed throughout the entire volume of the
foam sample might have particular properties which include both advantages of small cells
and large cells. The results indicate that the bi-modal cell structure foams can be achieved
by depressurization in two distinct steps and can be significantly affected by the process
parameters. For both bi-modal foams and uniform foams, the relative impact strength
increases with increasing relative density. When the relative density is constant, the impact
strength of bi-modal foams increases with increasing fs. Moreover, when fs is 80%, the
relative impact strengths of bi-modal foams are always higher than those of the uniform one,
with relative density ranging from 0.2 to 0.5. It indicates that the bi-modal cell structure
could have stronger absorption of impact energy than the uniform one.
Keywords: polypropylene, polystyrene, scCO2, crystallization, foam, mechanical
property
IV
RESUME
Dans un procédé de moussage discontinu classique par le dioxyde de carbone
supercritique (scCO2), le CO2 est dissout dans une matrice polymère, ce qui augmente le
volume libre entre les chaînes et leur mobilité et par voie de conséquence influe sur son
comportement de cristallisation. Après une phase de saturation, le CO2 est rapidement
dépressurisé afin d’amorcer le moussage au sein de la matrice polymère. Normalement ce
type de procédé produit des mousses micro-cellulaires avec une taille moyenne de cellules
de l’ordre de 10 µm et une densité de cellules supérieure à 109 cellules/cm3. Les propriétés
et les applications de mousses en polymères dépendent beaucoup de la morphologie des
cellules. En tant que polymères de grande diffusion dûs à leur excellent rapport
performance – prix, le polypropylène (PP) et le polystyrène (PS) ont été largement étudiés
et leur comportement de moussage a aussi fait l’objet d’études intenses. Dans ce travail, le
moussage du PP et du PS par le scCO2 est étudié de manière systématique avec l’accent sur
la relation entre le procédé, la microstructure et les propriétés mécaniques.
La première partie de cette thèse porte sur l’amélioration de la résistance au choc du PP
par cristallisation induite par le scCO2 qui vise à obtenir une séparation fine des domaines
cristallins rigides et amorphes mous dans la matrice polymère. Les résultats obtenus
montrent que la résistance au choc des échantillons du PP injectés est fortement améliorée
sans perte de module grâce au contrôle adéquat de la re-cristallisation et du refroidissement.
Lors de l’injection, des cristaux à structure « shish-kebab » sont formés dans la zone de fort
cisaillement et sont hautement orientés. Le traitement au CO2 conduit à la formation d’une
morphologie de cristaux en réseaux due à l’augmentation du nombre de lamelles primaires
et de celui des lamelles subsidiaires hachurés de manière latérale, ce qui contribue à une
amélioration de la résistance au choc du PP. Notons que la résistance au choc la plus élevée
est plus que 12 fois celle du PP vierge alors que la force de traction et le module demeurent
inchangés.
Dans un deuxième temps, le PP fortement orienté avec des structures shish-kebab et
sphérolite est utilisé pour étudier l’influence de la structure cristalline sur la nucléation et la
croissance des cellules pendant le procédé de moussage sous le scCO2. Une mousse
nano-cellulaire est obtenue avec une structure shish-kebab à l’état solide sous scCO2. Le
principe est que la nucléation et la croissance de cellules se font dans les domaines
amorphes qui sont confinés par ceux à structure shish-kebab crystalline qui ne peuvent pas
mousser. Pour une pressure CO2 donnée, la morphologie de cellules dépend fortement de la

V
température de moussage car à pressure CO2 constante, la morphologie cristalline dépend
de la température. Par ailleurs, il a été démontré que la présence de cellules nanométriques
dans une structure crystalline en réseaux améliore davantage la résistance au choc du PP
traité au préalable par le scCO2.
Ensuite, les influences des conditions de moussage ainsi que celles des paramètres
structuraux de la mousse de PS ont été étudiées. Les mousses de PS à cellules isotropes ont
été comparées avec celles de PS à cellules orientées. Dans le premier cas, les propriétés
mécaniques augmentent avec la densité relative de la mousse. A densité relative constante,
la taille des cellules n’influe pas sur la force de traction et le module mais un peu sur la
résistance au choc relative. La résistance au choc relative augmente avec la taille des
cellules. Il a été démontré que la fraction de l’aire solide sur la surface de fracture (fs) ainsi
que les parois de cellules sont les paramètres structuraux clés qui régissent la résistance au
choc de la mousse de PS. Dans le cas des cellules orientées, les mousses dont les celles sont
orientées de manière perpendiculaire à la direction ont une résistance au choc plus élevée
que celles dont les cellules sont réparties de manière isotrope. De plus, l’orientation des
cellules suivant la direction de la traction et celle des chaînes polymères par les cellules
contribuent toutes les deux à l’amélioration de la force de traction dans la direction de
l’orientation.
Enfin, un procédé de moussage discontinu en deux étapes est développé afin de produire
des mousses de PS à cellules bi-modales en utilisant le scCO2 en tant qu’agent de moussage.
Cette structure unique de petites et grandes cellules réparties de manière homogène au
travers de l’ensemble du volume de la mousse confère à cette dernière des propriétés
particulières. Il a été démontré qu’une telle structure peut être obtenue par dépressurisation
en deux étapes distinctes et qu’elle peut être fortement influencée par les paramètres du
procédé. Pour les mousses bi-modales et uniformes, la résistance au choc relative augmente
avec la densité relative. A densité relative constante, la résistance au choc relative des
mousses bi-modales augmente avec fs. De plus, quand fs est de 80% et lorsque la densité
relative varie entre 0,2 et 0,5, la résistance au choc relative des mousses bi-modales est que
celles des mousses uniformes, ce qui signifie qu’une mousse bi-modale peut absorber plus
d’énergie au choc qu’une mousse uniforme.
Mots-Clés : polypropylène, polystyrène, scCO2, cristallisation, mousse, propriétés
mécaniques.
VI
Table of content Abstract .................................................................................................................................................. II
Table of content ..................................................................................................................................... VI
Chapter 1 Introduction ............................................................................................................................. 1
1.1 Motivation and objectives ............................................................................................................. 1
1.2 overview of thesis .......................................................................................................................... 3
Chapter 2 Experimental ........................................................................................................................... 5
2.1 Materials ........................................................................................................................................ 5
2.2 Sample preparation ........................................................................................................................ 5
2.2.1 Preparation of polypropylene specimen by injection molding ........................................... 5
2.2.2 Preparation of polystyrene specimen .................................................................................. 5
2.2.3 CO2 swelling of samples .................................................................................................... 6
2.2.4 Foaming process ................................................................................................................. 6
2.3 Characterization ............................................................................................................................ 8
2.3.1 Mechanical properties ........................................................................................................ 8
2.3.2 PLM analysis ...................................................................................................................... 8
2.3.3 DSC analysis ...................................................................................................................... 8
2.3.4 WAXD analysis .................................................................................................................. 9
2.3.5 SAXS analysis .................................................................................................................... 9
2.3.6 FTIR analysis ................................................................................................................... 10
2.3.7 SEM analysis .................................................................................................................... 10
2.3.8 Foam characterization ...................................................................................................... 10
2.3.9 Solubility measurement .................................................................................................... 12
Chapter 3 Carbon Dioxide Induced Crystallization for Toughening Polypropylene ............................. 13
3.1 Introduction ................................................................................................................................. 13
3.2 Effect of CO2 treatment on the mechanical properties of iPP ..................................................... 14
3.3 Distribution of molecular orientation .......................................................................................... 16
3.3.1 Thermal properties ............................................................................................................ 18
3.3.2 Crystalline phase morphology in the Skin layer ............................................................... 20
3.3.3 Impact-fractured surface morphologies ............................................................................ 22
3.4 Effect of quench on the crystal structure ..................................................................................... 25
3.4.1 Effect of the instability of nano-size mesomorphic phase ................................................ 26
3.5 Effect of CO2 pressure and temperature ...................................................................................... 27
3.6 Conclusion ................................................................................................................................... 31
Chapter 4 Carbon Dioxide Induced Foaming of Highly Oriented Isotactic Polypropylene .................. 32
4.1 Introduction ................................................................................................................................. 32
4.2 Crystalline structure of injection molded iPP .............................................................................. 33
4.3 Thermal behavior of the injection-molded iPP under CO2 .......................................................... 36
4.4 Foaming of highly oriented iPP with scCO2 ............................................................................... 37
4.4.1 Cell morphologies with foaming temperature increase .................................................... 37
4.4.2 Impact strength of foamed PP2 ........................................................................................ 43
4.5 Thermal properties of the iPP before and after foaming ............................................................. 43
4.6 Conclusion ................................................................................................................................... 45
Chapter 5 Oriented Foaming of Polystyrene for Toughening ................................................................ 46
VII
5.1 Introduction ................................................................................................................................. 46
5.2 The isotropic cell structure and mechanical properties ............................................................... 47
5.2.1 The effect of cell size on the mechanical properties ......................................................... 52
5.3 The oriented cell structure and mechanical properties ................................................................ 56
5.3.1 C-oriented cell morphologies and the mechanical properties ........................................... 57
5.3.2 A-axis and b-axis oriented cell morphologies and the mechanical properties .................. 63
5.4 Conclusion ................................................................................................................................... 65
Chapter 6 Preparation of bi-modal cell structure polystyrene foams .................................................... 67
6.1 Introduction ................................................................................................................................. 67
6.2 Formation of bi-modal cell structure ........................................................................................... 67
6.3 Development of cell morphology in the two-step depressurization process ............................... 69
6.4 Development of cell morphology during the holding stage ........................................................ 71
6.4.1 Effect of gas super-saturation on cell growth during the holding stage ........................... 73
6.4.2 Interaction between small and large cells during the holding stage ................................. 74
6.5 Controlling variables for the bi-modal cell structure ................................................................... 76
6.5.1 Holding time during the holding stage ............................................................................. 76
6.5.2 Degree of depressurization in the first step ...................................................................... 78
6.5.3 Depressurization rate ........................................................................................................ 79
6.5.4 Temperature ...................................................................................................................... 80
6.6 The relationship between cell structure and impact strength ....................................................... 81
6.7 Conclusion ................................................................................................................................... 84
Chapter 7 Conclusion ............................................................................................................................ 85
Acknowledgements ............................................................................................................................... 88
References ............................................................................................................................................. 89
1
Chapter 1 Introduction
1.1 Motivation and objectives
Recently carbon dioxide (CO2) has been increasingly explored for polymer preparation
and processing including polymer functionalization, crystallization and foaming [1-5]. The
effect of CO2 on the crystallization behavior of polymers has been widely studied. The
dissolution of CO2 in the polymer increases the free volume between molecular chains and
chain mobility, and consequently affects its crystallization behavior [6-12]. Moreover,
microcellular foams with average cell sizes of less than 10 microns and cell densities
greater than 109cells/cm3 are generated [13,14]. Foams with such structures were proposed by
Suh et al. [15, 16] in the early 1980s as a means to reduce materials consumption and to
increase the toughness of such cellular materials. The initial idea of the toughening
mechanism is using microbubbles to substitute rubber parties in polymer matrices for
toughening.
As a widely used general-purpose polymer due to its excellent performance-to-price ratio,
polypropylene (PP) and polystyrene (PS) have been widely studied, including their foaming [17-21]. However, both of them exhibit low impact toughness which greatly limits their
application potential. Toughening of polymers has been a subject of intense studies [22-32].
Toughening methods include copolymerization of polymer with other types of olefin
monomers, blending of polymer with particles or a phase separated second polymer, and
addition of a nucleating agent. In one word, the basic concept of toughening is to make the
finely separated phases in the polymer matrix for impact energy absorption. Unfortunately,
the enhancement of toughness is often at the expense of other properties such as strength
and heat resistance [33]. There are extremely few successful examples for simultaneously
efficiently reinforcing and toughening PP and PS [34-36]. Thus, it is a great challenge to
enhance the performance of PP and PS for both strength and toughness.
For semi-crystalline polymers such as isotactic polypropylene (iPP), their final properties
are dictated by their crystallinity and crystalline morphology, which in turn are affected by
the thermomechanical history (flow and temperature) they have experienced during
processing [37-41]. It has been well established that for iPP oriented crystals (i.e.,
shish-kebabs) can bring out notable reinforcement on iPP. However, the improvement in
performances of polymers seems to be available only in the oriented direction [35, 36, 40]. In
the perpendicular direction, the performances such as impact strength are often more or less
reduced. To a certain extent, the crystals in the semi-crystalline polymer matrix can be
2
considered as fillers in a multiphase system, in which the crystal is one phase and the
amorphous is another phase. Especially for the iPP sample with the shish-kebab crystalline
structure, the oriented crystals can be considered as the rigid phase in nano size. In this way,
the theories established for other multiphase systems can be applied to the iPP sample with
shish-kebab crystalline structure. Naturally, an idea arises that the increase of the oriented
crystals in the perpendicular direction could improve the impact strength of the iPP samples.
Therefore, the highly oriented iPP are subjected to re-crystallization in the solid state under
scCO2. With the additional fine lamellae generated, a network crystalline structure is
formed and the toughness of the highly oriented iPP will be improved while retaining the
high tensile strength.
Furthermore, in the case of a solid-state foaming process, the crystal structure of the iPP
may have a great effect on the cell formation and cell morphology, as cell nucleation and
growth only occur in amorphous regions where CO2 is dissolved [17, 42]. On the other hand,
it is well-known that the so-called shish-kebab structure consists of a long central fiber core
(shish) surrounded by lamellar crystalline structure (kebab) periodically attached along the
shish [43-45]. In other words, the amorphous domains among the crystal domains are
confined in nanometer scale by the shish-kebab crystalline structure. Therefore, it is
expected that the use of a highly oriented iPP with a shish-kebab crystalline structure as a
template may lead to nanocellular morphology by CO2 foaming. With the formation of the
nano-bubbles among the network crystalline structure, the mechanical properties of iPP
samples are expected to be further increased.
For the amorphous polymer, PS, it is a brittle material. The aim of this work is to toughen
the PS foams by introducing the micron bubbles as the particles into the PS matrix while
reducing materials consumption. It is well-known that the properties and applications of
polymeric foams depend very much on cell morphologies [46-50]. In the past decade, efforts
have been made to investigate the influence of processing conditions and the nature of
polymers on the final cell morphologies of polymer foams [51-54]. Moreover, the effect of
cell morphologies on impact strength of microcellular foams has also been studied in
several polymer systems and the results have been mixed [55-66]. In this study, a systematic
study of the effect of the foaming conditions and the cell structural parameters of PS foams
on the mechanical properties was first presented. Thereafter, the oriented, anisotropic cell
morphologies were prepared to investigate the relationship between the directions of cell
oriented and the corresponding tensile and impact strength. Finally, a two-step
depressurization process of CO2 foaming was studied for producing bimodal cell structure
3
PS foams. The relationship between the processing parameters, the final bimodal cell
structure and the corresponding mechanical properties were investigated.
The objective of the work presented in this thesis is as follows: (a) study the
crystallization behavior of iPP with CO2 to tune and control the crystalline structure of iPP
for toughening; (b) CO2 foaming of highly oriented iPP with various crystal morphologies
to investigate the effect of crystalline structure on the formation of cell nucleation and
growth; (c) systematically study the effect of the foaming conditions and the cell structural
parameters of PS foams on the mechanical properties; (d) study a two-step depressurization
process for producing bimodal cell structure PS foams by using scCO2 as blowing agent
with emphasis on the relationship between the processing parameters, the final bimodal cell
structure and the corresponding mechanical properties.
1.2 overview of thesis
A brief overview of this thesis is as follows.
Chapter 2 describes the main experiments in this study.
Chapter 3 proposes a novel process for significantly toughening isotactic polypropylene
(iPP) by finely tuning and controlling the structure and morphology of iPP. The toughness
of injection molded iPP specimens can be significantly improved by controlled shearing,
CO2 induced recrystallization and adequate cooling without loss of strength. Under shear, a
high degree of orientation can be obtained with “shish-kebab” crystals formed in the shear
zone. During the subsequent CO2 treatment, a crystal network morphology may be formed
as a result of an increase in the number of the primary lamellae and that of crosshatched
subsidiary lamellae, which leads to an increase in the toughness. Wide-angle X-ray
diffraction patterns indicate that quenching in ice-water of scCO2 treated iPP promotes the
formation of nano-sized mesomorphic phase domains in the shear zone, which further
toughens the iPP. The impact strength of the best toughened iPP is over 12 times that of the
original one without loss in tensile strength and modulus.
In chapter 4, the injection molded iPP samples with “shish-kebab” and spherulite were
used for CO2 foaming to investigate the effect of crystalline structure on the formation of
cell nucleation and growth. A nanocellular foam was achieved by CO2 foaming of
shish-kebab crystalline structure in the solid state. Nano-cells are generated in amorphous
domains confined by shish-kebab crystalline domains which cannot foam. At a chosen CO2
pressure, the cell morphology depends very much on the foaming temperature. Moreover,
the relationship between the cell structure and the mechanical properties are studied.
4
In chapter 5, a systematic study of the effect of the foaming conditions and the cell
structural parameters of PS foams on the mechanical properties is first presented. After that,
the oriented, anisotropic cell morphologies are prepared to investigate the relationship
between the directions of cell oriented and the corresponding tensile and impact strength.
The results indicate that the oriented cells perpendicular to the impact direction could
significantly improve the toughness of PS foams, compared with those of isotropy foams.
In chapter 6, the method of two-step depressurization batch process is developed to
produce bi-modal cell structure PS foams by using scCO2 as the blowing agent. Bi-modal
cell structure foams could be achieved by depressurization in two distinct steps and could
be significantly affected by the process parameters. The process conditions at the holding
stage between the two steps are the key to controlling the bi-modal cell structure. In
addition, the relationship between the cell structure and the mechanical properties are
studied.
5
Chapter 2 Experimental
2.1 Materials
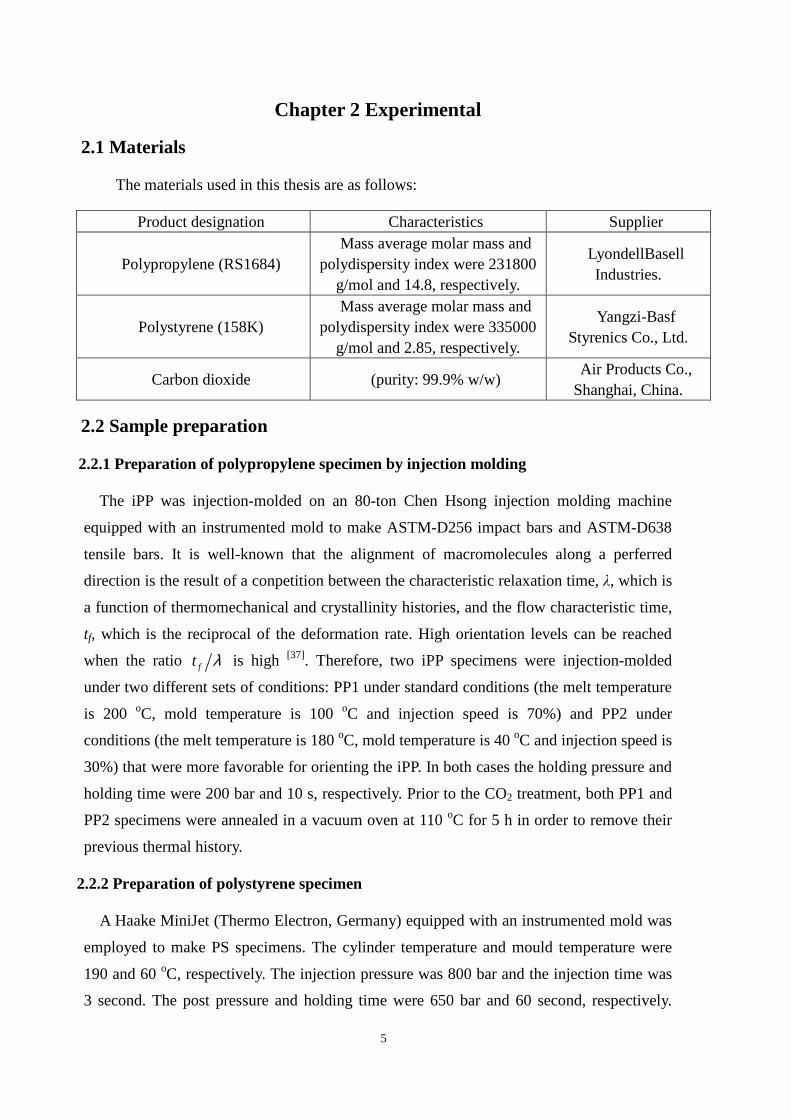
The materials used in this thesis are as follows:
Product designation Characteristics Supplier
Polypropylene (RS1684) Mass average molar mass and
polydispersity index were 231800 g/mol and 14.8, respectively.
LyondellBasell Industries.
Polystyrene (158K) Mass average molar mass and
polydispersity index were 335000 g/mol and 2.85, respectively.
Yangzi-Basf Styrenics Co., Ltd.
Carbon dioxide (purity: 99.9% w/w) Air Products Co.,
Shanghai, China.
2.2 Sample preparation
2.2.1 Preparation of polypropylene specimen by injection molding
The iPP was injection-molded on an 80-ton Chen Hsong injection molding machine
equipped with an instrumented mold to make ASTM-D256 impact bars and ASTM-D638
tensile bars. It is well-known that the alignment of macromolecules along a perferred
direction is the result of a conpetition between the characteristic relaxation time, λ, which is
a function of thermomechanical and crystallinity histories, and the flow characteristic time,
tf, which is the reciprocal of the deformation rate. High orientation levels can be reached
when the ratio ft λ is high [37]. Therefore, two iPP specimens were injection-molded
under two different sets of conditions: PP1 under standard conditions (the melt temperature
is 200 oC, mold temperature is 100 oC and injection speed is 70%) and PP2 under
conditions (the melt temperature is 180 oC, mold temperature is 40 oC and injection speed is
30%) that were more favorable for orienting the iPP. In both cases the holding pressure and
holding time were 200 bar and 10 s, respectively. Prior to the CO2 treatment, both PP1 and
PP2 specimens were annealed in a vacuum oven at 110 oC for 5 h in order to remove their
previous thermal history.
2.2.2 Preparation of polystyrene specimen
A Haake MiniJet (Thermo Electron, Germany) equipped with an instrumented mold was
employed to make PS specimens. The cylinder temperature and mould temperature were
190 and 60 oC, respectively. The injection pressure was 800 bar and the injection time was
3 second. The post pressure and holding time were 650 bar and 60 second, respectively.
6
Prior to the CO2 treatment, the PS specimens were annealed in a vacuum oven at 100 oC for
5 h in order to remove their previous thermal history.
2.2.3 CO2 swelling of samples
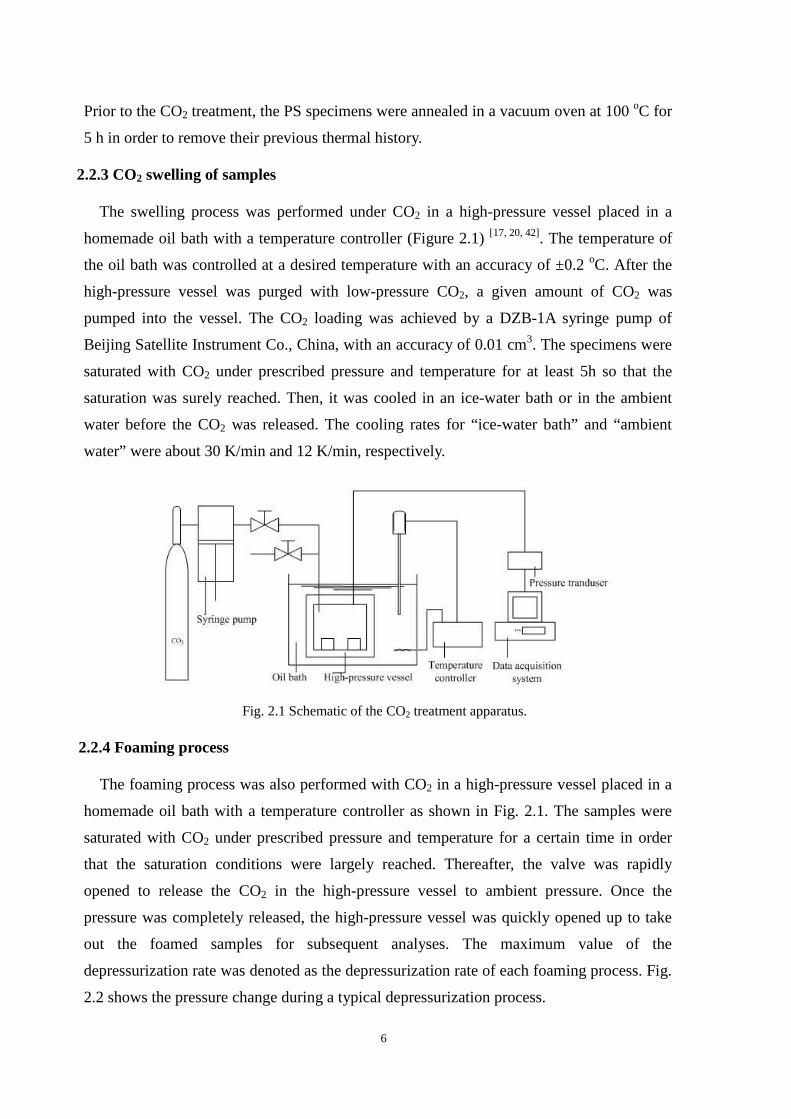
The swelling process was performed under CO2 in a high-pressure vessel placed in a
homemade oil bath with a temperature controller (Figure 2.1) [17, 20, 42]. The temperature of
the oil bath was controlled at a desired temperature with an accuracy of ±0.2 oC. After the
high-pressure vessel was purged with low-pressure CO2, a given amount of CO2 was
pumped into the vessel. The CO2 loading was achieved by a DZB-1A syringe pump of
Beijing Satellite Instrument Co., China, with an accuracy of 0.01 cm3. The specimens were
saturated with CO2 under prescribed pressure and temperature for at least 5h so that the
saturation was surely reached. Then, it was cooled in an ice-water bath or in the ambient
water before the CO2 was released. The cooling rates for “ice-water bath” and “ambient
water” were about 30 K/min and 12 K/min, respectively.
Fig. 2.1 Schematic of the CO2 treatment apparatus.
2.2.4 Foaming process
The foaming process was also performed with CO2 in a high-pressure vessel placed in a
homemade oil bath with a temperature controller as shown in Fig. 2.1. The samples were
saturated with CO2 under prescribed pressure and temperature for a certain time in order
that the saturation conditions were largely reached. Thereafter, the valve was rapidly
opened to release the CO2 in the high-pressure vessel to ambient pressure. Once the
pressure was completely released, the high-pressure vessel was quickly opened up to take
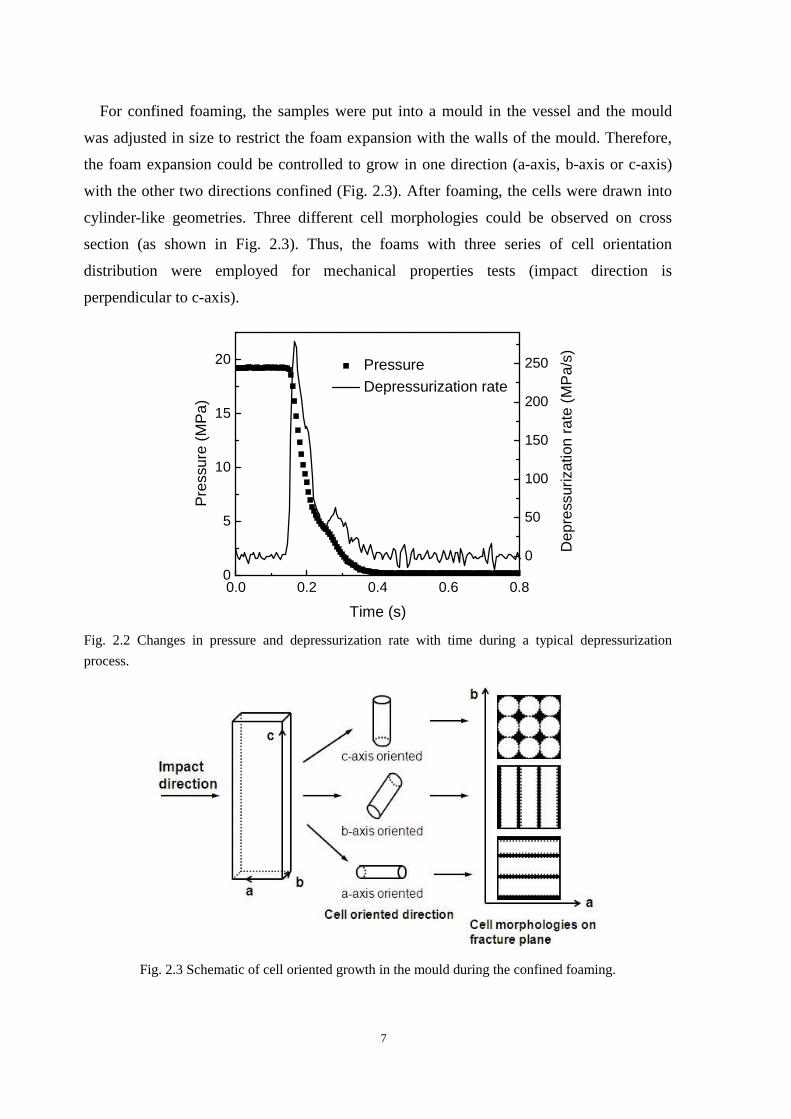
out the foamed samples for subsequent analyses. The maximum value of the
depressurization rate was denoted as the depressurization rate of each foaming process. Fig.
2.2 shows the pressure change during a typical depressurization process.
7
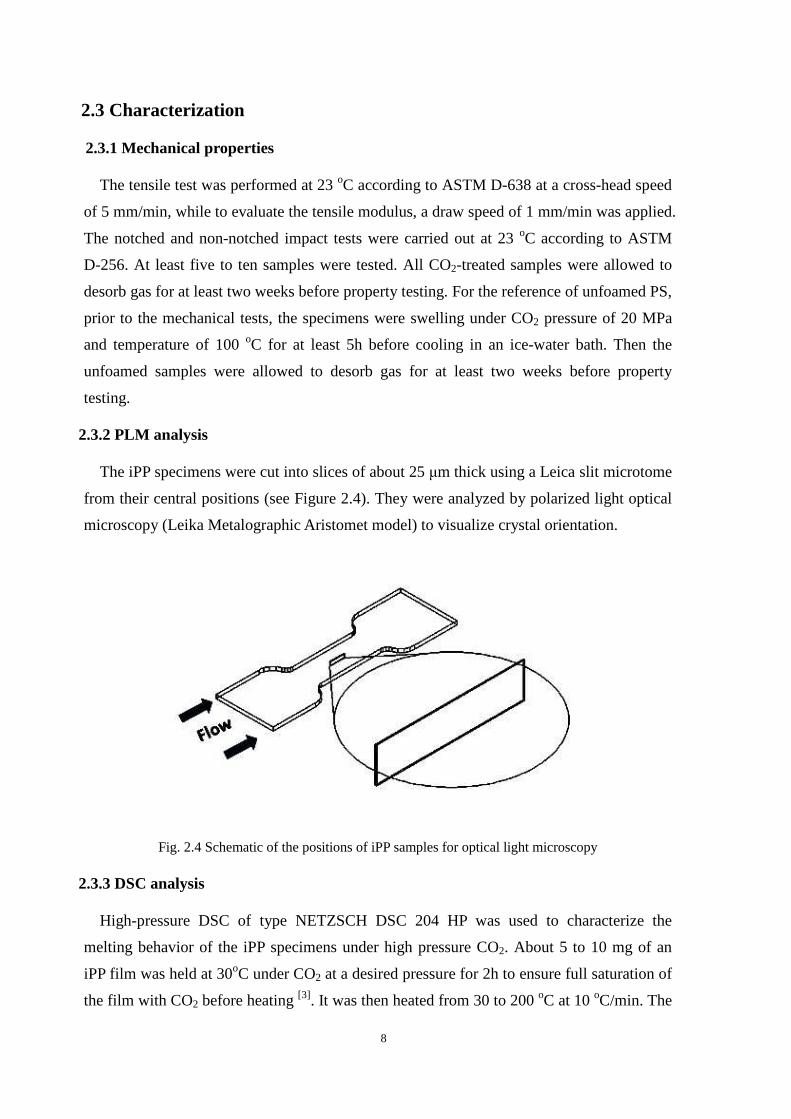
For confined foaming, the samples were put into a mould in the vessel and the mould
was adjusted in size to restrict the foam expansion with the walls of the mould. Therefore,
the foam expansion could be controlled to grow in one direction (a-axis, b-axis or c-axis)
with the other two directions confined (Fig. 2.3). After foaming, the cells were drawn into
cylinder-like geometries. Three different cell morphologies could be observed on cross
section (as shown in Fig. 2.3). Thus, the foams with three series of cell orientation
distribution were employed for mechanical properties tests (impact direction is
perpendicular to c-axis).
0.0 0.2 0.4 0.6 0.80
5
10
15
20
0
50
100
150
200
250 Pressure
Dep
ress
uriz
atio
n ra
te (
MP
a/s)
Pre
ssur
e (M
Pa)
Time (s)
Depressurization rate
Fig. 2.2 Changes in pressure and depressurization rate with time during a typical depressurization
process.
Fig. 2.3 Schematic of cell oriented growth in the mould during the confined foaming.
8
2.3 Characterization
2.3.1 Mechanical properties
The tensile test was performed at 23 oC according to ASTM D-638 at a cross-head speed
of 5 mm/min, while to evaluate the tensile modulus, a draw speed of 1 mm/min was applied.
The notched and non-notched impact tests were carried out at 23 oC according to ASTM
D-256. At least five to ten samples were tested. All CO2-treated samples were allowed to
desorb gas for at least two weeks before property testing. For the reference of unfoamed PS,
prior to the mechanical tests, the specimens were swelling under CO2 pressure of 20 MPa
and temperature of 100 oC for at least 5h before cooling in an ice-water bath. Then the
unfoamed samples were allowed to desorb gas for at least two weeks before property
testing.
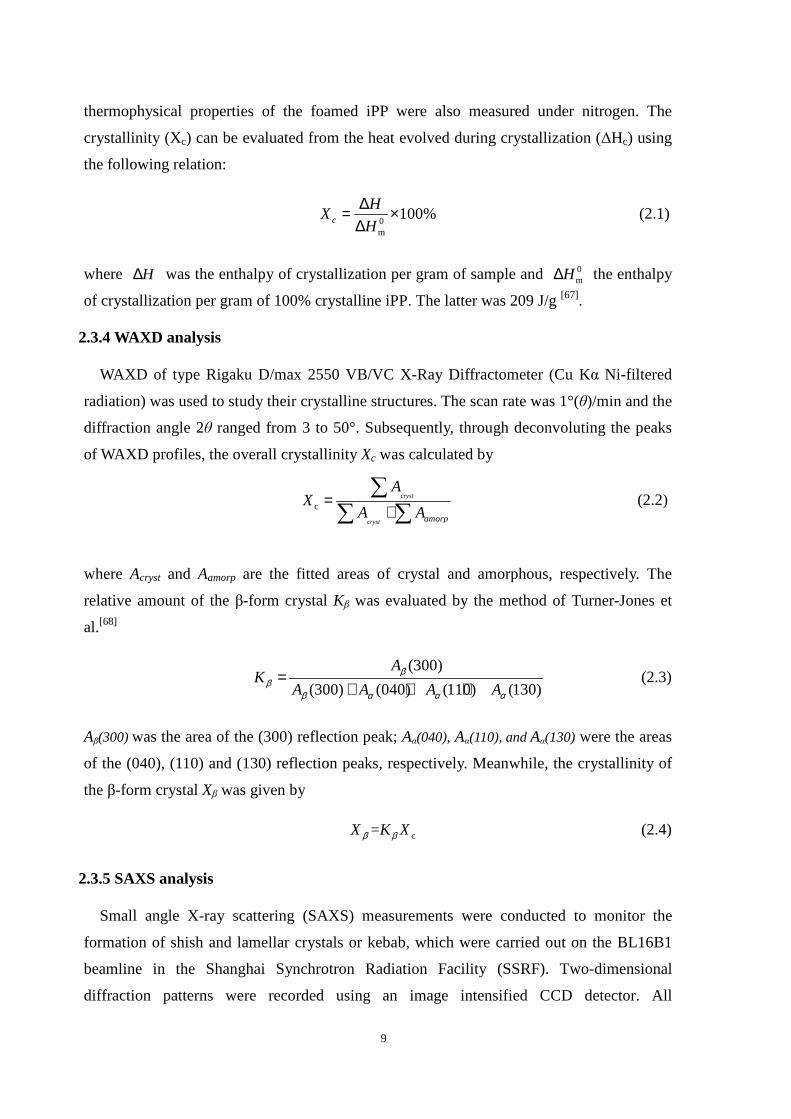
2.3.2 PLM analysis
The iPP specimens were cut into slices of about 25 µm thick using a Leica slit microtome
from their central positions (see Figure 2.4). They were analyzed by polarized light optical
microscopy (Leika Metalographic Aristomet model) to visualize crystal orientation.
Fig. 2.4 Schematic of the positions of iPP samples for optical light microscopy
2.3.3 DSC analysis
High-pressure DSC of type NETZSCH DSC 204 HP was used to characterize the
melting behavior of the iPP specimens under high pressure CO2. About 5 to 10 mg of an
iPP film was held at 30oC under CO2 at a desired pressure for 2h to ensure full saturation of
the film with CO2 before heating [3]. It was then heated from 30 to 200 oC at 10 oC/min. The
9
thermophysical properties of the foamed iPP were also measured under nitrogen. The
crystallinity (Xc) can be evaluated from the heat evolved during crystallization (∆Hc) using
the following relation:
0m
100%c
HX
H
∆= ×∆
(2.1)
where H∆ was the enthalpy of crystallization per gram of sample and 0mH∆ the enthalpy
of crystallization per gram of 100% crystalline iPP. The latter was 209 J/g [67].
2.3.4 WAXD analysis
WAXD of type Rigaku D/max 2550 VB/VC X-Ray Diffractometer (Cu Kα Ni-filtered
radiation) was used to study their crystalline structures. The scan rate was 1°(θ)/min and the
diffraction angle 2θ ranged from 3 to 50°. Subsequently, through deconvoluting the peaks
of WAXD profiles, the overall crystallinity Xc was calculated by
ccryst
cryst amorp
AX
A A=
+∑
∑ ∑ (2.2)
where Acryst and Aamorp are the fitted areas of crystal and amorphous, respectively. The
relative amount of the β-form crystal Kβ was evaluated by the method of Turner-Jones et
al.[68]
(300)
(300) (040) (110) (130)
AK
A A A Aβ
ββ α α α
=+ + +
(2.3)
Aβ(300) was the area of the (300) reflection peak; Aα(040), Aα(110), and Aα(130) were the areas
of the (040), (110) and (130) reflection peaks, respectively. Meanwhile, the crystallinity of
the β-form crystal Xβ was given by
c=X K Xβ β (2.4)
2.3.5 SAXS analysis
Small angle X-ray scattering (SAXS) measurements were conducted to monitor the
formation of shish and lamellar crystals or kebab, which were carried out on the BL16B1
beamline in the Shanghai Synchrotron Radiation Facility (SSRF). Two-dimensional
diffraction patterns were recorded using an image intensified CCD detector. All

10
experiments were carried out at room temperature with the radiation wavelength λ = 0.154
nm. The scattering intensities were corrected for absorption, background scattering, and
incident X-ray fluctuations of the samples.
2.3.6 FTIR analysis
The orientation of the amorphous and crystalline phases of the iPP samples from the skin
to the core was measured by Fourier transform infrared spectroscopy (FTIR). The
orientation function was calculated as:
1
+2
Df
D
− =
(2.5)
where D was the dichroic ratio, namely the ratio between the absorbance of the infrared
radiations polarized along the directions parallel and perpendicular to the orientation one.
For the orientation function of the crystal phase, fc, the band 998 cm-1 was considered. D
was then the ratio between the absorbance in the parallel direction A= at 998 cm-1 and the
corresponding one in the perpendicular direction A⊥. As for the amorphous phase bands, the
peak at 973 cm-1 was the most commonly adopted [37].
2.3.7 SEM analysis
To observe the crystalline morphology, iPP sample surfaces were etched by permanganic
acid. Then, the surfaces of all the samples were gold-sputtered to enhance conductivity.
Their morphologies were observed with scanning electron microscopy (SEM) of type
NOVA NanoSEM 230 with an operating voltage of 500 Kv. To observe the cell
morphologies, the foamed samples were immersed in liquid nitrogen for 10 min and then
fractured. After that, the surfaces of all the foamed samples were gold-sputtered and
characterized by a JSM-6360LV scanning electron microscopy (SEM).
2.3.8 Foam characterization
The mass densities of foamed samples were determined using a balance equipped with
the density measurement kit provided by Mettler Toledo. This method involved weighing
specimen in air and water, respectively. When weighing a specimen in water, a net-like
metal cover was used to immerse the specimen in water. According to ASTM 792-00, the
mass densities of foamed PP, ρf, was calculated by:
11
waterf bwa
a ρρ−+
= (2.6)
where a is the apparent mass of specimen in air, w is the apparent mass of the totally
immersed net-like metal cover in water and b is the apparent mass of specimen and cover
completely immersed in water. The volume expansion ratio of the foamed sample, Rv, was
defined as the ratio of the bulk density of the unfoamed sample (ρp) to that of the foamed
one (ρf):
fpvR ρρ /= (2.7)
The relative density of the foamed sample, Rρ, was defined as the ratio of the foamed
sample (ρf) to that of the unfoamed one (ρp):
= f
pRρ
ρρ (2.8)
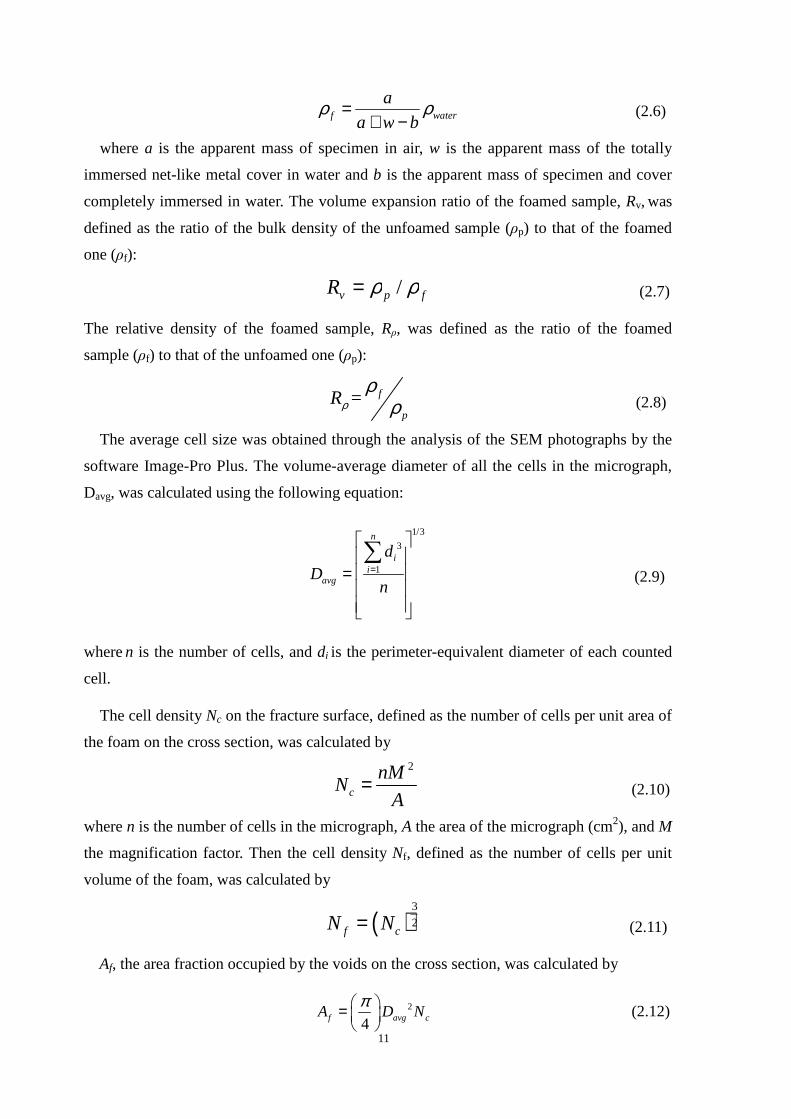
The average cell size was obtained through the analysis of the SEM photographs by the
software Image-Pro Plus. The volume-average diameter of all the cells in the micrograph,
Davg, was calculated using the following equation:
1/3
3
1
n
ii
avg
dD
n=
=
∑ (2.9)
where n is the number of cells, and di is the perimeter-equivalent diameter of each counted
cell.
The cell density Nc on the fracture surface, defined as the number of cells per unit area of
the foam on the cross section, was calculated by
2
c
nMN
A= (2.10)
where n is the number of cells in the micrograph, A the area of the micrograph (cm2), and M
the magnification factor. Then the cell density Nf, defined as the number of cells per unit
volume of the foam, was calculated by
( )3
2f cN N= (2.11)
Af, the area fraction occupied by the voids on the cross section, was calculated by
2
4f avg cA D Nπ =
(2.12)

12
Then, As, the area fraction of solid area on the cross section, was calculated by
s
1=
f
AA
(2.13)
Vf, the volume fraction occupied by the voids, was calculated by
3
6f avg fV D Nπ =
( (2.14)
The cell density N0, defined as the number of cells per unit volume of the original
(unfoamed) polymer, was calculated according to the following expression:
0 f vN N R= × (2.15)
2.3.9 Solubility measurement
The apparent solubility of CO2 in the iPP melts was measured directly using MSB as
shown in Fig. 2.5 (Rubotherm Prazisionsmesstechnik GmbH, Germany). The MSB has an
electronically controlled magnetic suspension coupling that transmits the weight of the
sample in a pressure vessel to a microbalance outside of the cell. The MSB can be used at
pressures up to 35 MPa and temperatures up to 523 K. Resolution and accuracy of the
microbalance (Mettler AT261, Switzerland) are 0.01 mg and 0.002%, respectively. The
system temperature and pressure can be controlled at the accuracy of ±0.2 oC and ±0.05
MPa, respectively. Details of the apparatus and experimental procedure used in this work
have been described in previous publications [101, 102].
Fig. 2.5 The schematic diagram for sorption measurement by using magnetic suspension balance
13
Chapter 3 Carbon Dioxide Induced Crystallization for Toughening Polypropylene
3.1 Introduction
Isotactic polypropylene (iPP) has good comprehensive properties, such as easy
processing, high heat resistance, and good stiffness, etc., and in turn is widely used as a
commodity plastic [34]. However, under conventional processing conditions, iPP crystallizes
into sizable spherulites with few tie molecules between spherulites. With such a crystalline
texture, iPP exhibits very low impact toughness, especially at lower temperature, which
restricts its more extensive application. Therefore, toughening of iPP has always been an
open research.
Injection molding is one of the most widely employed processes for manufacturing
polymer products and consists of three main steps: filling, packing/holding and cooling.
Typically, multiple layers or a skin-core structure of iPP samples are formed during
injection molding [35, 36, 38]. A shear zone with a high level of orientation is mainly
responsible for shear-induced properties [35, 36]. Oriented crystals (i.e., shish-kebabs) can
lead to significant improvement in tensile strength [69], modulus and stiffness [70]. However,
the improvement in performances of polymers seems to be available only in the oriented
direction [34-36]. In the perpendicular direction, the performances such as impact strength are
often more or less reduced.
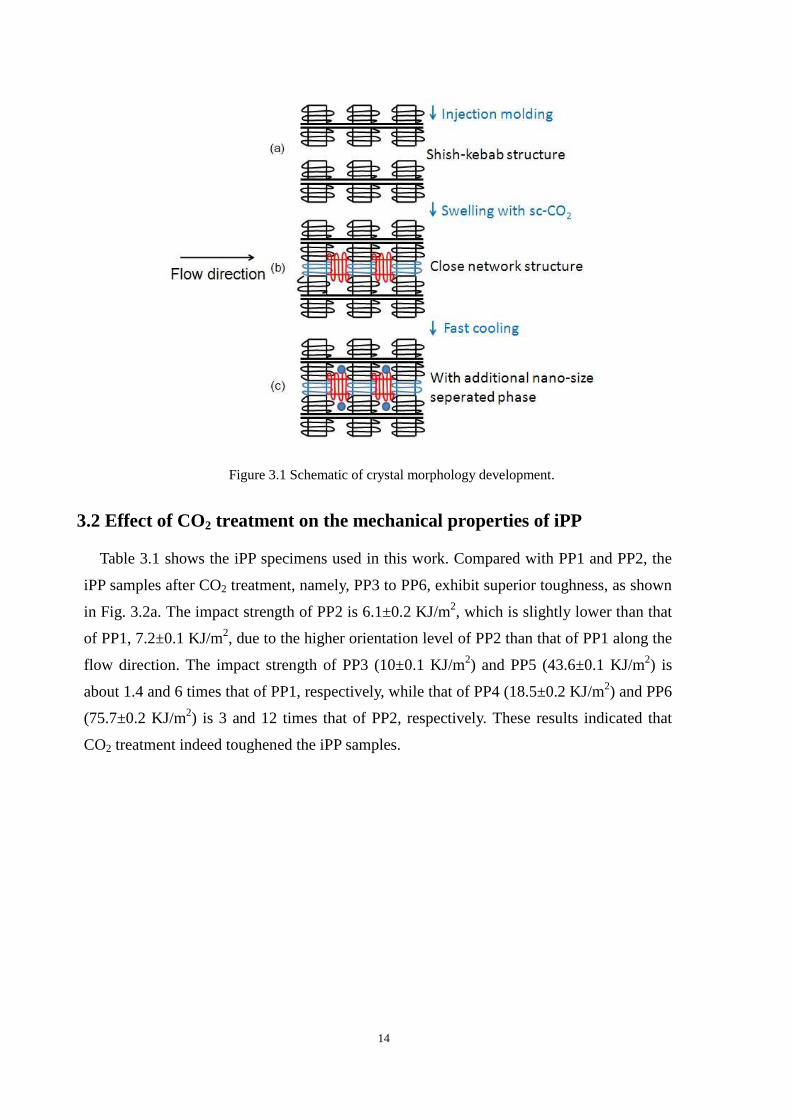
This work aims at improving the toughness of injection molded iPP specimens by
controlling their crystal structure. This is done by three successive steps as depicted in
Figure 3.1. The first step consists in controlling the degree of orientation of the crystal
structure in the shear zone by tuning injection molding conditions (Figure 3.1a). Highly
oriented crystals can significantly improve the tensile strength of the iPP samples. In the
second step, the injection molded iPP specimens are subjected to re-crystallization in the
solid state under sc-CO2 (Figure 3.1b). Additional fine lamellae can be formed in the shear
zone (see Figure 3.1b). They can improve the toughness of iPP samples while retaining the
high tensile strength. The third step is to further tune the crystal structure by controlling the
cooling rate of the sc-CO2 treated injection molded iPP specimens. Non-isothermal
crystallization of iPP at a fast cooling rate may yield nodular mesomorphic crystals in
nano-size (see Figure 3.1c) [71]. These nano-size mesomorphic crystals in the shear zone
would further improve the toughness of the sc-CO2 treated injection molded iPP specimens.
The originality of this work lies on these two last steps.
14
Figure 3.1 Schematic of crystal morphology development.
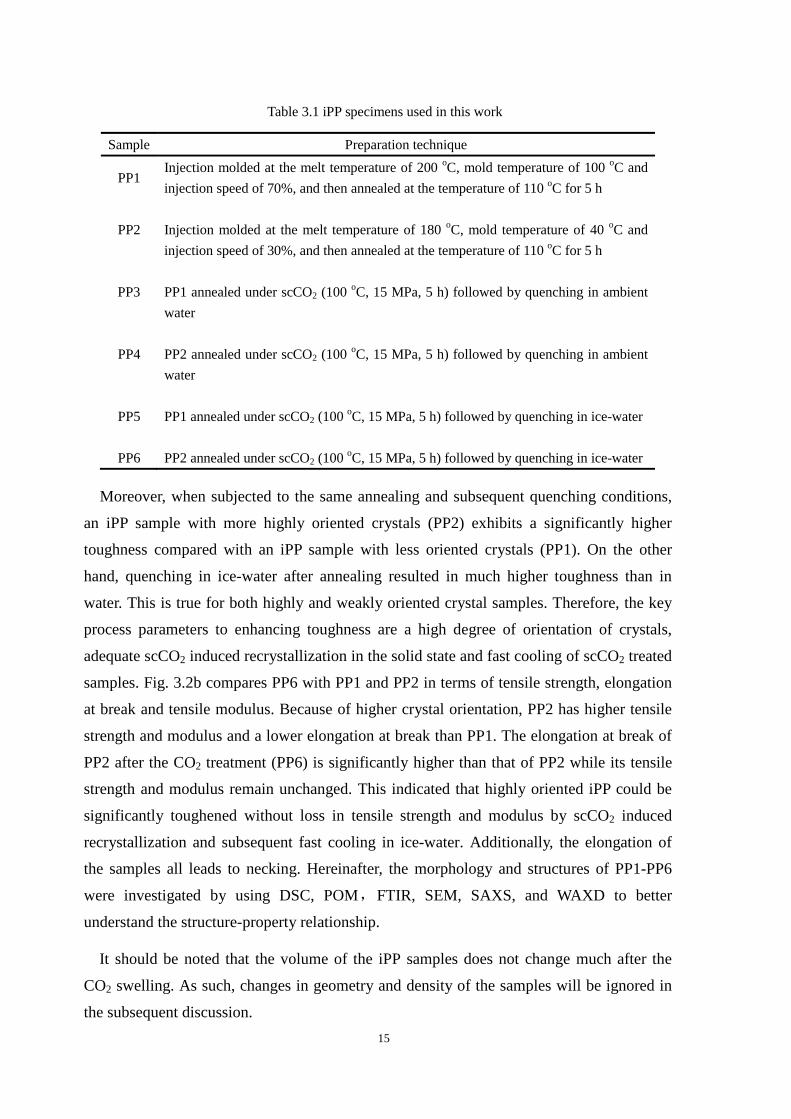
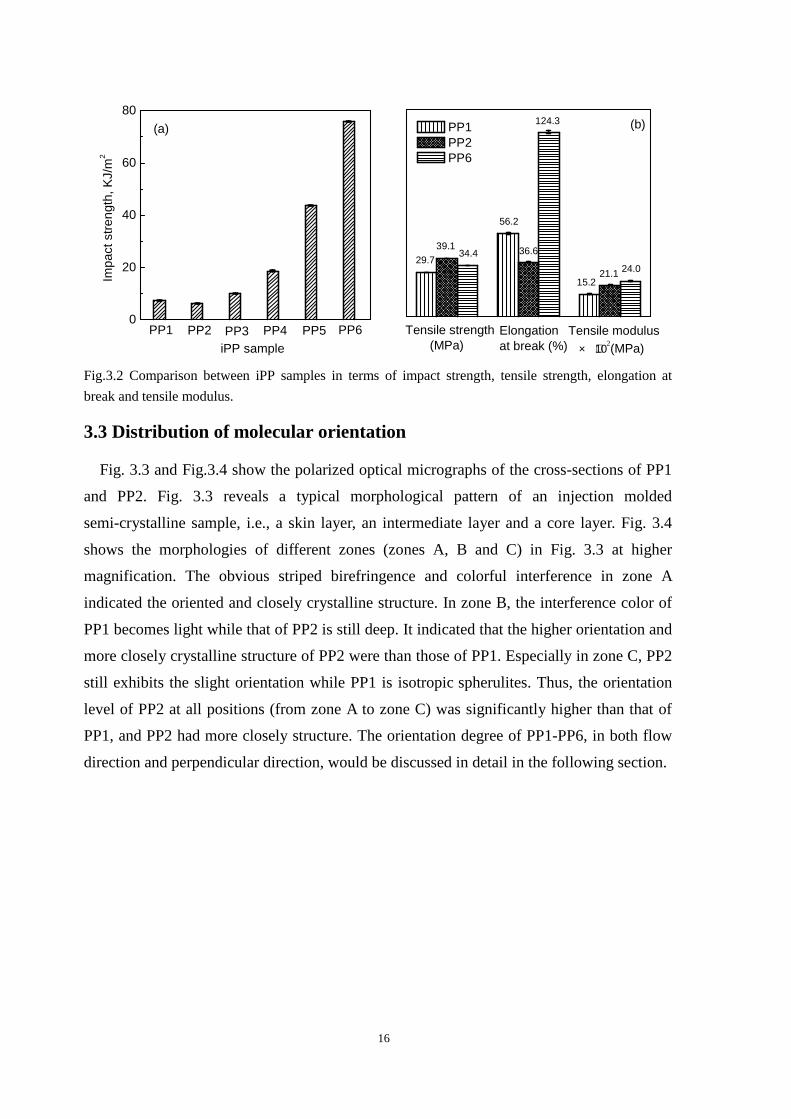
3.2 Effect of CO2 treatment on the mechanical properties of iPP
Table 3.1 shows the iPP specimens used in this work. Compared with PP1 and PP2, the
iPP samples after CO2 treatment, namely, PP3 to PP6, exhibit superior toughness, as shown
in Fig. 3.2a. The impact strength of PP2 is 6.1±0.2 KJ/m2, which is slightly lower than that
of PP1, 7.2±0.1 KJ/m2, due to the higher orientation level of PP2 than that of PP1 along the
flow direction. The impact strength of PP3 (10±0.1 KJ/m2) and PP5 (43.6±0.1 KJ/m2) is
about 1.4 and 6 times that of PP1, respectively, while that of PP4 (18.5±0.2 KJ/m2) and PP6
(75.7±0.2 KJ/m2) is 3 and 12 times that of PP2, respectively. These results indicated that
CO2 treatment indeed toughened the iPP samples.
15
Table 3.1 iPP specimens used in this work
Sample Preparation technique
PP1 Injection molded at the melt temperature of 200 oC, mold temperature of 100 oC and
injection speed of 70%, and then annealed at the temperature of 110 oC for 5 h
PP2
Injection molded at the melt temperature of 180 oC, mold temperature of 40 oC and
injection speed of 30%, and then annealed at the temperature of 110 oC for 5 h
PP3
PP1 annealed under scCO2 (100 oC, 15 MPa, 5 h) followed by quenching in ambient
water
PP4
PP2 annealed under scCO2 (100 oC, 15 MPa, 5 h) followed by quenching in ambient
water
PP5
PP1 annealed under scCO2 (100 oC, 15 MPa, 5 h) followed by quenching in ice-water
PP6
PP2 annealed under scCO2 (100 oC, 15 MPa, 5 h) followed by quenching in ice-water
Moreover, when subjected to the same annealing and subsequent quenching conditions,
an iPP sample with more highly oriented crystals (PP2) exhibits a significantly higher
toughness compared with an iPP sample with less oriented crystals (PP1). On the other
hand, quenching in ice-water after annealing resulted in much higher toughness than in
water. This is true for both highly and weakly oriented crystal samples. Therefore, the key
process parameters to enhancing toughness are a high degree of orientation of crystals,
adequate scCO2 induced recrystallization in the solid state and fast cooling of scCO2 treated
samples. Fig. 3.2b compares PP6 with PP1 and PP2 in terms of tensile strength, elongation
at break and tensile modulus. Because of higher crystal orientation, PP2 has higher tensile
strength and modulus and a lower elongation at break than PP1. The elongation at break of
PP2 after the CO2 treatment (PP6) is significantly higher than that of PP2 while its tensile
strength and modulus remain unchanged. This indicated that highly oriented iPP could be
significantly toughened without loss in tensile strength and modulus by scCO2 induced
recrystallization and subsequent fast cooling in ice-water. Additionally, the elongation of
the samples all leads to necking. Hereinafter, the morphology and structures of PP1-PP6
were investigated by using DSC, POM,FTIR, SEM, SAXS, and WAXD to better
understand the structure-property relationship.
It should be noted that the volume of the iPP samples does not change much after the
CO2 swelling. As such, changes in geometry and density of the samples will be ignored in
the subsequent discussion.
16
0
20
40
60
80
PP6PP5PP4PP3PP2
Im
pact
str
engt
h, K
J/m
2
iPP sample
PP1
(a)
29.739.1
34.4
56.2
36.6
124.3
24.021.115.2
(b) PP1 PP2 PP6
Tensile modulus × ∴102(MPa)
Elongationat break (%)
Tensile strength (MPa)
Fig.3.2 Comparison between iPP samples in terms of impact strength, tensile strength, elongation at
break and tensile modulus.
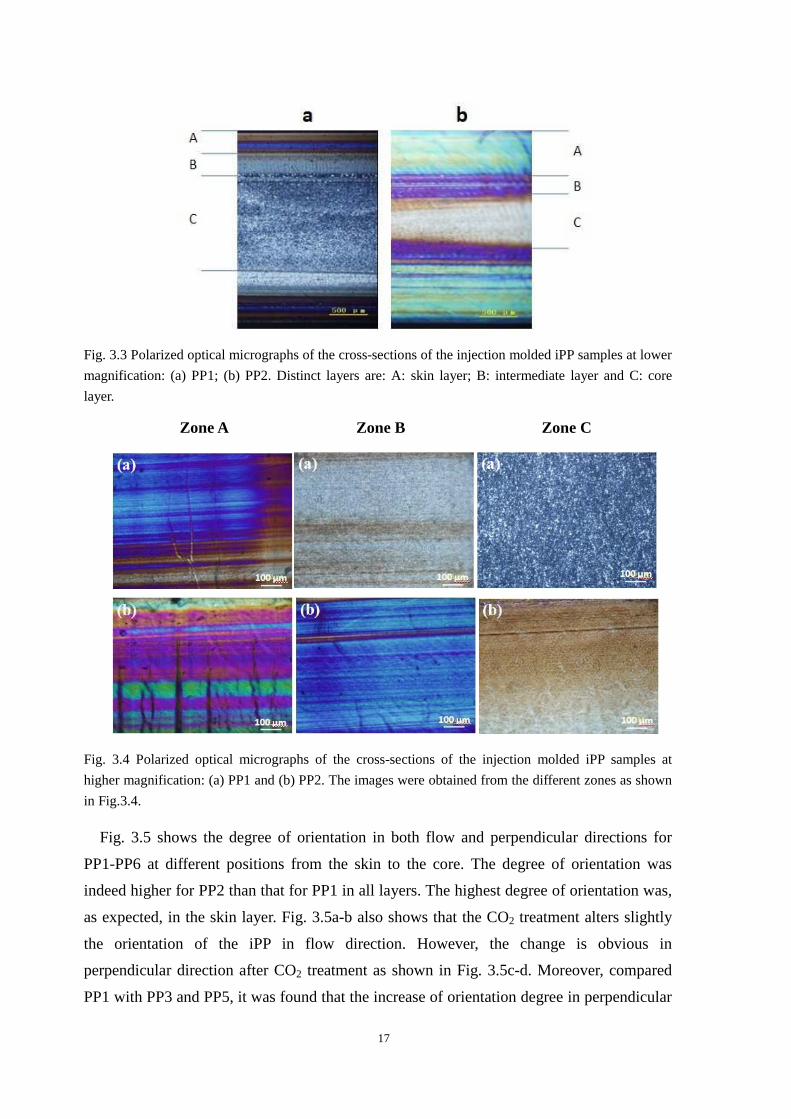
3.3 Distribution of molecular orientation
Fig. 3.3 and Fig.3.4 show the polarized optical micrographs of the cross-sections of PP1
and PP2. Fig. 3.3 reveals a typical morphological pattern of an injection molded
semi-crystalline sample, i.e., a skin layer, an intermediate layer and a core layer. Fig. 3.4
shows the morphologies of different zones (zones A, B and C) in Fig. 3.3 at higher
magnification. The obvious striped birefringence and colorful interference in zone A
indicated the oriented and closely crystalline structure. In zone B, the interference color of
PP1 becomes light while that of PP2 is still deep. It indicated that the higher orientation and
more closely crystalline structure of PP2 were than those of PP1. Especially in zone C, PP2
still exhibits the slight orientation while PP1 is isotropic spherulites. Thus, the orientation
level of PP2 at all positions (from zone A to zone C) was significantly higher than that of
PP1, and PP2 had more closely structure. The orientation degree of PP1-PP6, in both flow
direction and perpendicular direction, would be discussed in detail in the following section.
17
Fig. 3.3 Polarized optical micrographs of the cross-sections of the injection molded iPP samples at lower
magnification: (a) PP1; (b) PP2. Distinct layers are: A: skin layer; B: intermediate layer and C: core
layer.
Zone A Zone B Zone C
Fig. 3.4 Polarized optical micrographs of the cross-sections of the injection molded iPP samples at
higher magnification: (a) PP1 and (b) PP2. The images were obtained from the different zones as shown
in Fig.3.4.
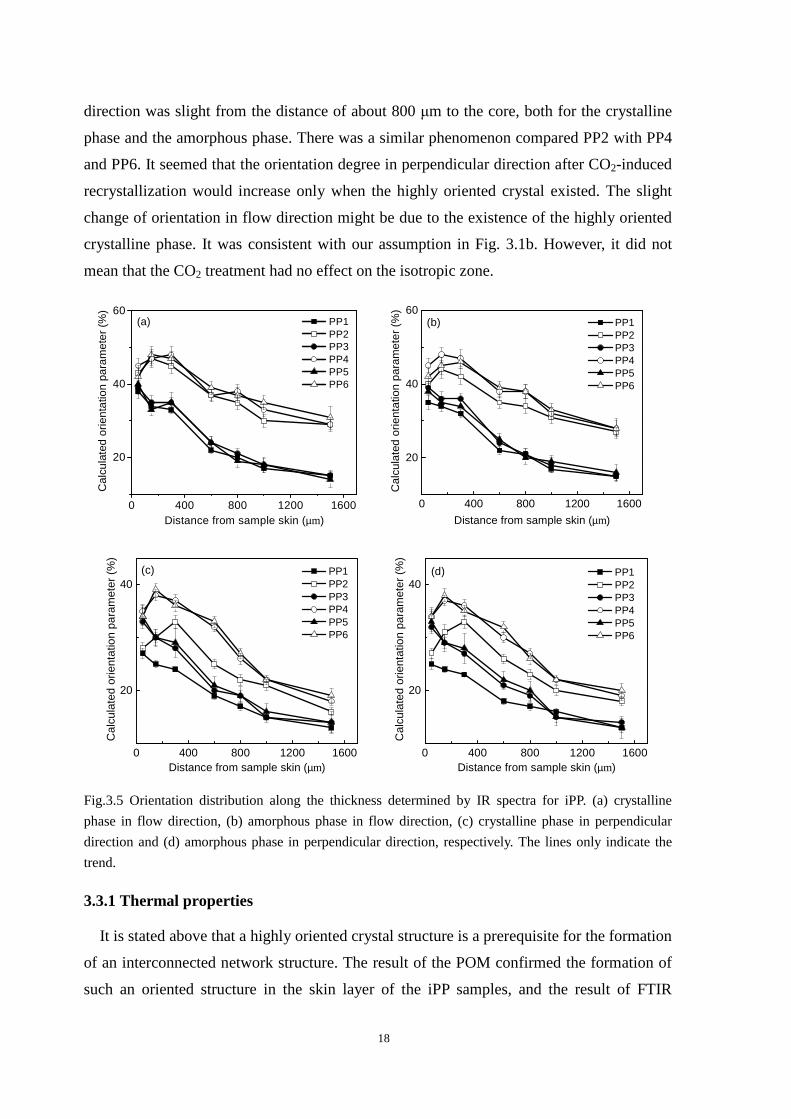
Fig. 3.5 shows the degree of orientation in both flow and perpendicular directions for
PP1-PP6 at different positions from the skin to the core. The degree of orientation was
indeed higher for PP2 than that for PP1 in all layers. The highest degree of orientation was,
as expected, in the skin layer. Fig. 3.5a-b also shows that the CO2 treatment alters slightly
the orientation of the iPP in flow direction. However, the change is obvious in
perpendicular direction after CO2 treatment as shown in Fig. 3.5c-d. Moreover, compared
PP1 with PP3 and PP5, it was found that the increase of orientation degree in perpendicular
18
direction was slight from the distance of about 800 µm to the core, both for the crystalline
phase and the amorphous phase. There was a similar phenomenon compared PP2 with PP4
and PP6. It seemed that the orientation degree in perpendicular direction after CO2-induced
recrystallization would increase only when the highly oriented crystal existed. The slight
change of orientation in flow direction might be due to the existence of the highly oriented
crystalline phase. It was consistent with our assumption in Fig. 3.1b. However, it did not
mean that the CO2 treatment had no effect on the isotropic zone.
0 400 800 1200 1600
20
40
60
Cal
cula
ted
orie
ntat
ion
para
met
er (
%)
Distance from sample skin (µm)
PP1 PP2 PP3 PP4 PP5 PP6
(a)
0 400 800 1200 1600
20
40
60
Cal
cula
ted
orie
ntat
ion
para
met
er (
%)
Distance from sample skin (µm)
PP1 PP2 PP3 PP4 PP5 PP6
(b)
0 400 800 1200 1600
20
40
Cal
cula
ted
orie
ntat
ion
para
met
er (
%)
Distance from sample skin (µm)
PP1 PP2 PP3 PP4 PP5 PP6
(c)
0 400 800 1200 1600
20
40
Cal
cula
ted
orie
ntat
ion
para
met
er (
%)
Distance from sample skin (µm)
PP1 PP2 PP3 PP4 PP5 PP6
(d)
Fig.3.5 Orientation distribution along the thickness determined by IR spectra for iPP. (a) crystalline
phase in flow direction, (b) amorphous phase in flow direction, (c) crystalline phase in perpendicular
direction and (d) amorphous phase in perpendicular direction, respectively. The lines only indicate the
trend.
3.3.1 Thermal properties
It is stated above that a highly oriented crystal structure is a prerequisite for the formation
of an interconnected network structure. The result of the POM confirmed the formation of
such an oriented structure in the skin layer of the iPP samples, and the result of FTIR
19
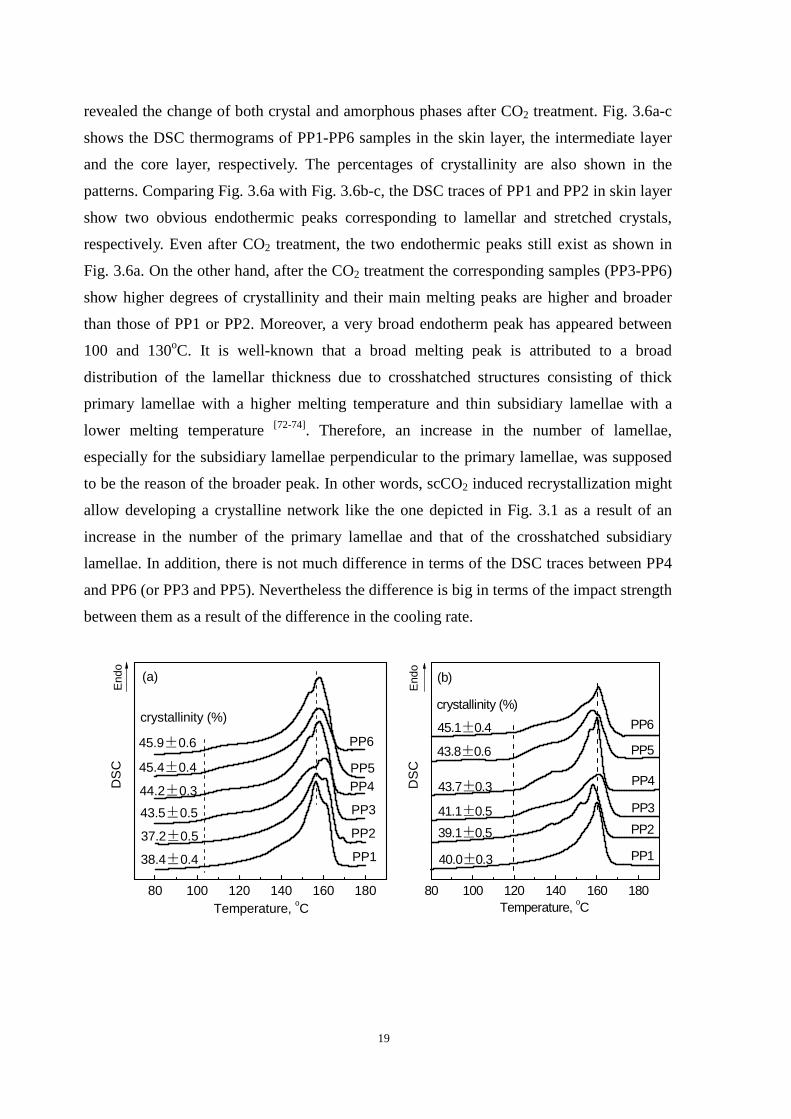
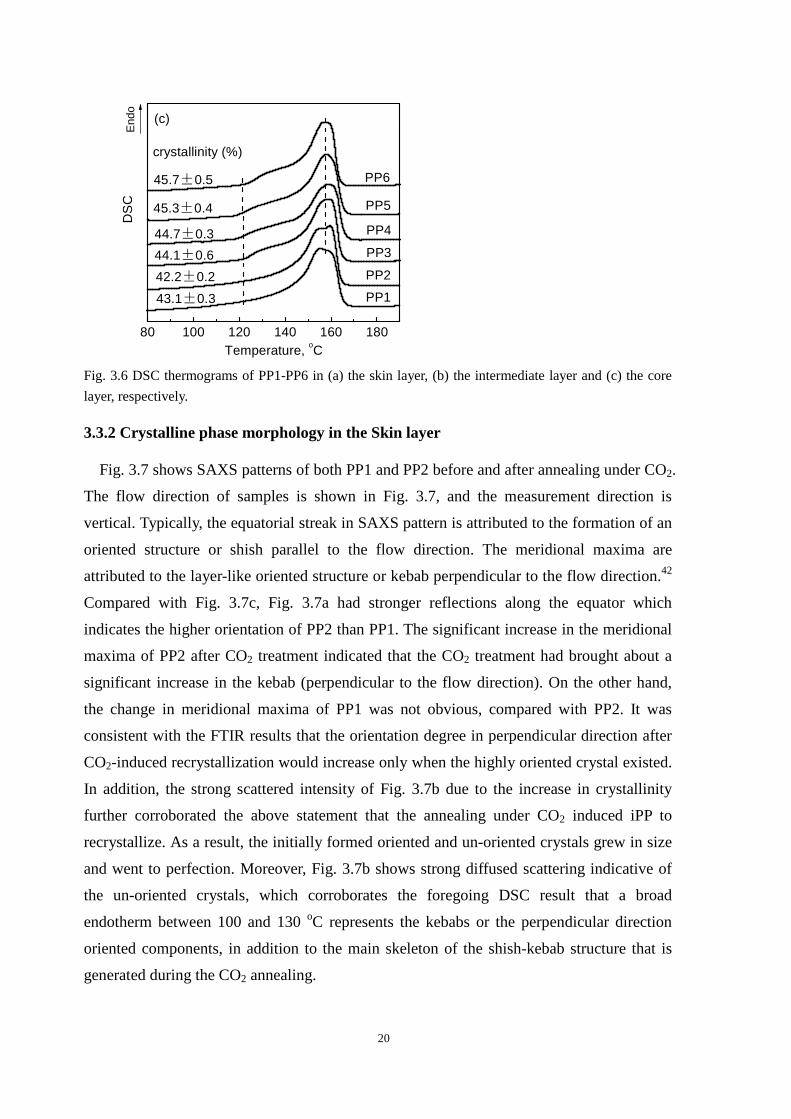
revealed the change of both crystal and amorphous phases after CO2 treatment. Fig. 3.6a-c
shows the DSC thermograms of PP1-PP6 samples in the skin layer, the intermediate layer
and the core layer, respectively. The percentages of crystallinity are also shown in the
patterns. Comparing Fig. 3.6a with Fig. 3.6b-c, the DSC traces of PP1 and PP2 in skin layer
show two obvious endothermic peaks corresponding to lamellar and stretched crystals,
respectively. Even after CO2 treatment, the two endothermic peaks still exist as shown in
Fig. 3.6a. On the other hand, after the CO2 treatment the corresponding samples (PP3-PP6)
show higher degrees of crystallinity and their main melting peaks are higher and broader
than those of PP1 or PP2. Moreover, a very broad endotherm peak has appeared between
100 and 130oC. It is well-known that a broad melting peak is attributed to a broad
distribution of the lamellar thickness due to crosshatched structures consisting of thick
primary lamellae with a higher melting temperature and thin subsidiary lamellae with a
lower melting temperature [72-74]. Therefore, an increase in the number of lamellae,
especially for the subsidiary lamellae perpendicular to the primary lamellae, was supposed
to be the reason of the broader peak. In other words, scCO2 induced recrystallization might
allow developing a crystalline network like the one depicted in Fig. 3.1 as a result of an
increase in the number of the primary lamellae and that of the crosshatched subsidiary
lamellae. In addition, there is not much difference in terms of the DSC traces between PP4
and PP6 (or PP3 and PP5). Nevertheless the difference is big in terms of the impact strength
between them as a result of the difference in the cooling rate.
80 100 120 140 160 180
Temperature, oC
DS
C
crystallinity (%)
45.9±0.6
45.4±0.4
44.2±0.3
43.5±0.5
37.2±0.5
38.4±0.4
PP6
PP5PP4
PP3
PP2
PP1
End
o
(a)
80 100 120 140 160 180
43.8±0.6
41.1±0.5
40.0±0.3
43.7±0.3
39.1±0.5
45.1±0.4
crystallinity (%)
(b)
Temperature, oC
PP1
PP2
PP3
PP4
PP5
PP6
D
SC
End
o
20
80 100 120 140 160 180
(c)
Temperature, oC
DS
CE
ndo
45.3±0.4
44.1±0.6
43.1±0.3
44.7±0.3
42.2±0.2
45.7±0.5
crystallinity (%)
PP1
PP2
PP3
PP4
PP5
PP6
Fig. 3.6 DSC thermograms of PP1-PP6 in (a) the skin layer, (b) the intermediate layer and (c) the core
layer, respectively.
3.3.2 Crystalline phase morphology in the Skin layer
Fig. 3.7 shows SAXS patterns of both PP1 and PP2 before and after annealing under CO2.
The flow direction of samples is shown in Fig. 3.7, and the measurement direction is
vertical. Typically, the equatorial streak in SAXS pattern is attributed to the formation of an
oriented structure or shish parallel to the flow direction. The meridional maxima are
attributed to the layer-like oriented structure or kebab perpendicular to the flow direction.42
Compared with Fig. 3.7c, Fig. 3.7a had stronger reflections along the equator which
indicates the higher orientation of PP2 than PP1. The significant increase in the meridional
maxima of PP2 after CO2 treatment indicated that the CO2 treatment had brought about a
significant increase in the kebab (perpendicular to the flow direction). On the other hand,
the change in meridional maxima of PP1 was not obvious, compared with PP2. It was
consistent with the FTIR results that the orientation degree in perpendicular direction after
CO2-induced recrystallization would increase only when the highly oriented crystal existed.
In addition, the strong scattered intensity of Fig. 3.7b due to the increase in crystallinity
further corroborated the above statement that the annealing under CO2 induced iPP to
recrystallize. As a result, the initially formed oriented and un-oriented crystals grew in size
and went to perfection. Moreover, Fig. 3.7b shows strong diffused scattering indicative of
the un-oriented crystals, which corroborates the foregoing DSC result that a broad
endotherm between 100 and 130 oC represents the kebabs or the perpendicular direction
oriented components, in addition to the main skeleton of the shish-kebab structure that is
generated during the CO2 annealing.

21
Fig. 3.7 2D SAXS images of (a) PP2 before CO2 treatment, (b) PP2 after CO2 treatment, (c) PP1 before
CO2 treatment and (d) PP1 after CO2 treatment.
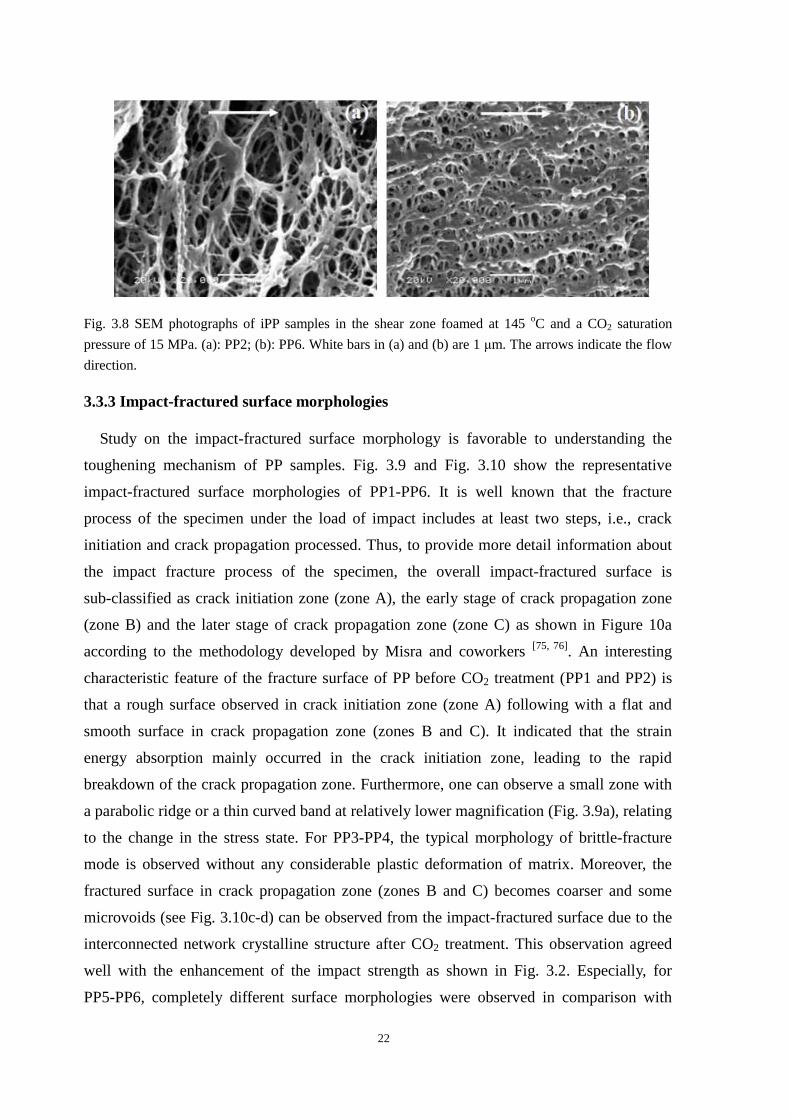
It is common practice to observe crystal structures of polyolefins such as iPP by etching
or pigmentation. However it is not always easy to obtain distinct images. A previous work
showed that foaming in the solid state could be a good alternative to observe the crystal
structure of a semi-crystalline polymer in an indirect manner. The amorphous regions
would foam while the crystalline ones would remain intact [42]. To observe the crystal
morphology of PP2 and PP6, the samples were foamed at 145oC and a CO2 saturation
pressure of 15 MPa. A certain proportion of crystals can be molten under these conditions.
Fig. 3.8 shows the SEM photographs of PP2 and PP6 foams in the skin layer. It confirmed
the formation of the crystal network structure as a result of the CO2 induced crystallization
in which the ‘shishes’ and ‘kebabs’ were connected with each other. The closely connected
shish-kebab lamellar crystals improved the strength perpendicular to the orientation
direction. Moreover, the existence of crosshatched subsidiary crystals among the primary
lamellae led to more uniform distribution of the rigid crystalline phase domains in the soft
amorphous phase ones. These unique nano-size structures could promote the absorption of
the impact energy perpendicular to the orientation direction and hence enhance the
toughness of the samples.
22
Fig. 3.8 SEM photographs of iPP samples in the shear zone foamed at 145 oC and a CO2 saturation
pressure of 15 MPa. (a): PP2; (b): PP6. White bars in (a) and (b) are 1 µm. The arrows indicate the flow
direction.
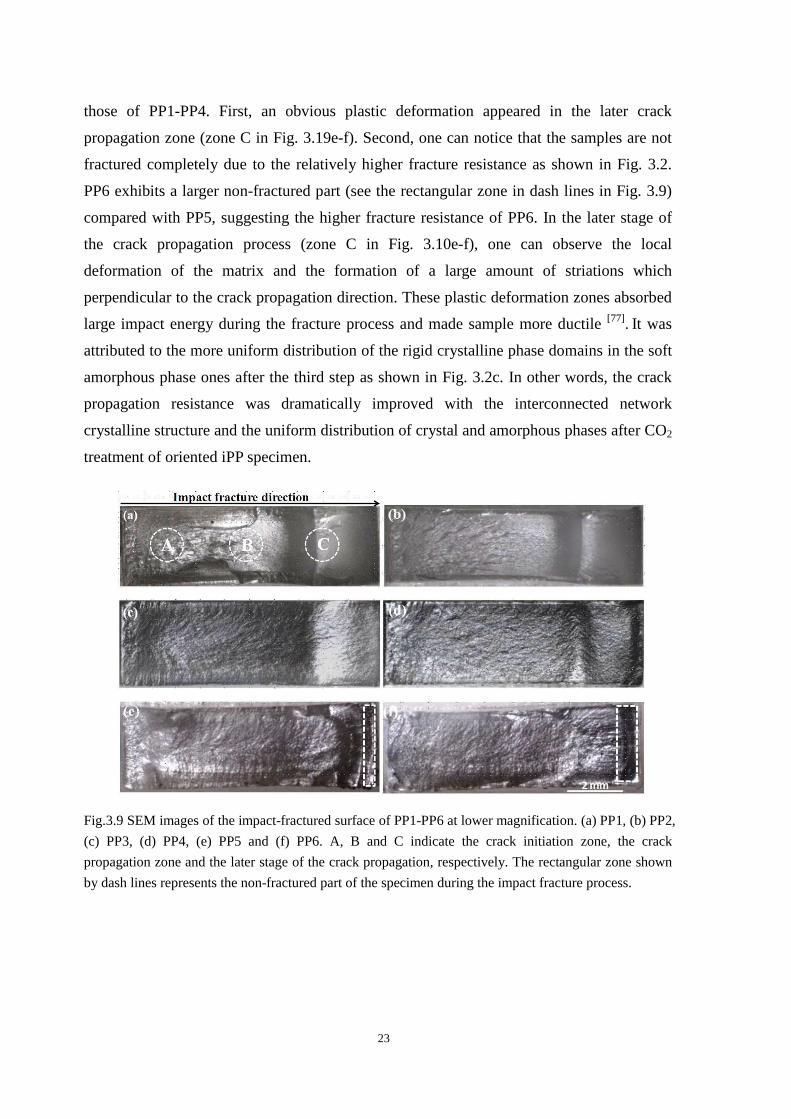
3.3.3 Impact-fractured surface morphologies
Study on the impact-fractured surface morphology is favorable to understanding the
toughening mechanism of PP samples. Fig. 3.9 and Fig. 3.10 show the representative
impact-fractured surface morphologies of PP1-PP6. It is well known that the fracture
process of the specimen under the load of impact includes at least two steps, i.e., crack
initiation and crack propagation processed. Thus, to provide more detail information about
the impact fracture process of the specimen, the overall impact-fractured surface is
sub-classified as crack initiation zone (zone A), the early stage of crack propagation zone
(zone B) and the later stage of crack propagation zone (zone C) as shown in Figure 10a
according to the methodology developed by Misra and coworkers [75, 76]. An interesting
characteristic feature of the fracture surface of PP before CO2 treatment (PP1 and PP2) is
that a rough surface observed in crack initiation zone (zone A) following with a flat and
smooth surface in crack propagation zone (zones B and C). It indicated that the strain
energy absorption mainly occurred in the crack initiation zone, leading to the rapid
breakdown of the crack propagation zone. Furthermore, one can observe a small zone with
a parabolic ridge or a thin curved band at relatively lower magnification (Fig. 3.9a), relating
to the change in the stress state. For PP3-PP4, the typical morphology of brittle-fracture
mode is observed without any considerable plastic deformation of matrix. Moreover, the
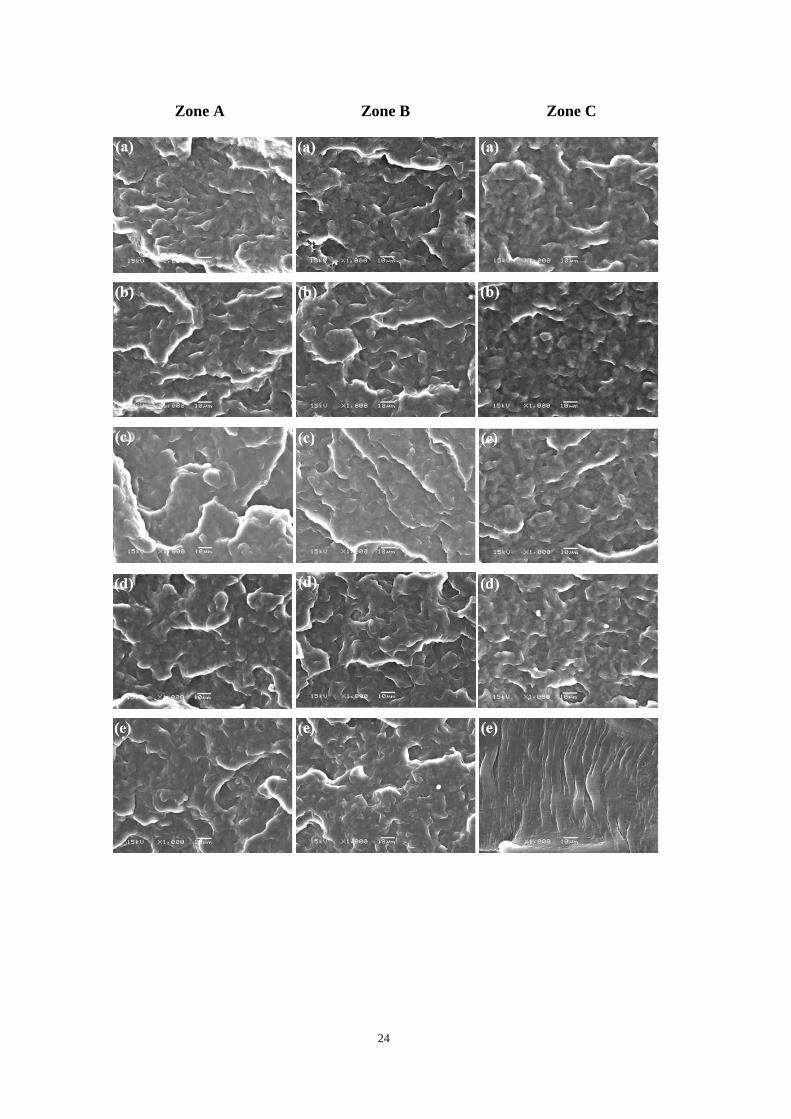
fractured surface in crack propagation zone (zones B and C) becomes coarser and some
microvoids (see Fig. 3.10c-d) can be observed from the impact-fractured surface due to the
interconnected network crystalline structure after CO2 treatment. This observation agreed
well with the enhancement of the impact strength as shown in Fig. 3.2. Especially, for
PP5-PP6, completely different surface morphologies were observed in comparison with
23
those of PP1-PP4. First, an obvious plastic deformation appeared in the later crack
propagation zone (zone C in Fig. 3.19e-f). Second, one can notice that the samples are not
fractured completely due to the relatively higher fracture resistance as shown in Fig. 3.2.
PP6 exhibits a larger non-fractured part (see the rectangular zone in dash lines in Fig. 3.9)
compared with PP5, suggesting the higher fracture resistance of PP6. In the later stage of
the crack propagation process (zone C in Fig. 3.10e-f), one can observe the local
deformation of the matrix and the formation of a large amount of striations which
perpendicular to the crack propagation direction. These plastic deformation zones absorbed
large impact energy during the fracture process and made sample more ductile [77]. It was
attributed to the more uniform distribution of the rigid crystalline phase domains in the soft
amorphous phase ones after the third step as shown in Fig. 3.2c. In other words, the crack
propagation resistance was dramatically improved with the interconnected network
crystalline structure and the uniform distribution of crystal and amorphous phases after CO2
treatment of oriented iPP specimen.
Fig.3.9 SEM images of the impact-fractured surface of PP1-PP6 at lower magnification. (a) PP1, (b) PP2,
(c) PP3, (d) PP4, (e) PP5 and (f) PP6. A, B and C indicate the crack initiation zone, the crack
propagation zone and the later stage of the crack propagation, respectively. The rectangular zone shown
by dash lines represents the non-fractured part of the specimen during the impact fracture process.
24
Zone A Zone B Zone C

25
Fig.3.10 SEM images of the impact-fractured surface of PP1-PP6 at higher magnification. The images
were obtained from the different zones as shown in Figure 10. (a) PP1, (b) PP2, (c) PP3, (d) PP4, (e) PP5
and (f) PP6.
3.4 Effect of quench on the crystal structure
It was stated above that the increased number of lamellar crystals as a result of scCO2
induced recrystallization was a reason for improved toughness of the iPP samples (PP2
versus PP4). The cooling stage that follows the scCO2 treatment is another important reason
for the improvement in toughness (PP4 versus PP6). What structural changes have occurred
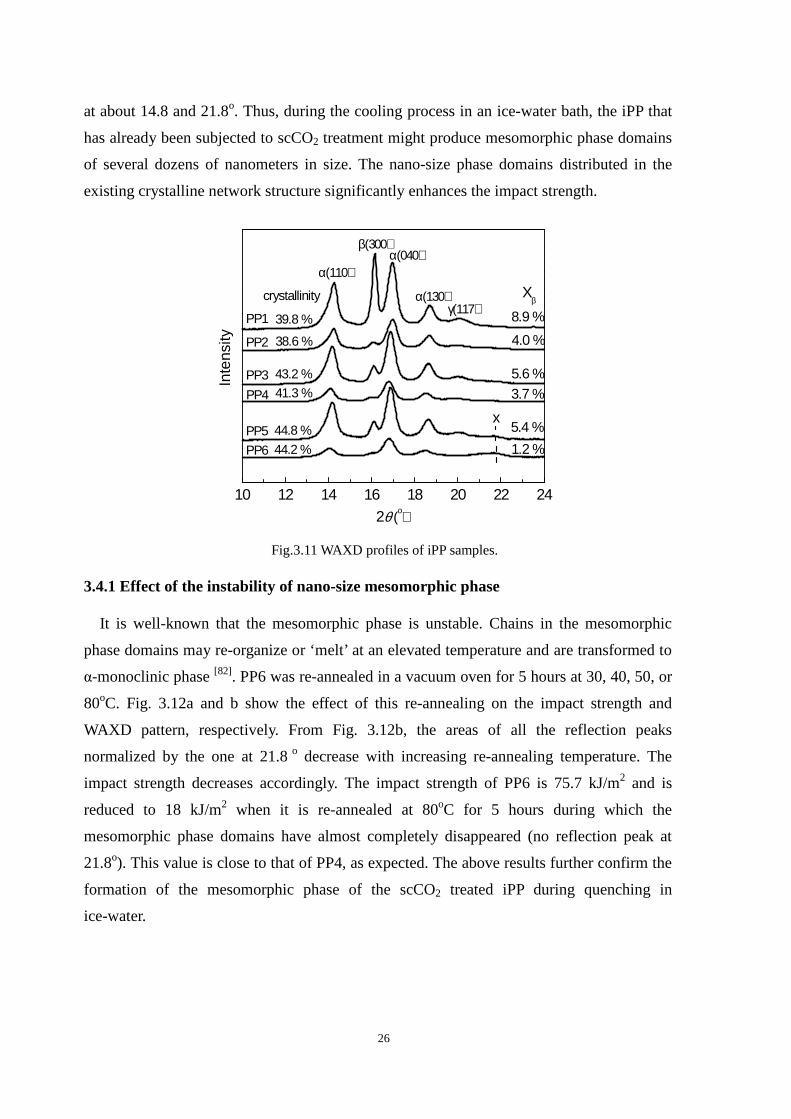
during the cooling stage? Fig. 3.11 depicts the WAXD patterns of PP1- PP6 in skin layer as
shown in fig. 3.3. The WAXD patterns of PP1 and PP2 exhibit five major peaks. They are
located at 14.1, 16.1, 16.9, 18.6 and 20.3o, corresponding to the diffraction of crystal
reflections from planes α(110), β(300), α(040), α(130) and γ(117), respectively. The
percentages of crystallinity are shown in the patterns. For PP1 and PP2, there is no obvious
peak at the region from 20 to 22o, due possibly to the high degree of orientation in the skin
layer. It is interesting that the amounts of β-crystals and γ-crystals in PP1 are significantly
higher than those in PP2. Normally, shear can induce crystallization leading to β and γ
crystals [78, 79]. However, very high shear may prevent β and γ crystals from forming [34].
This is because shear accelerates the nucleation and growth of α-row nuclei which tend to
induce the formation of α-crystals rather than β and γ crystals. In other words, the shear rate
for PP1 in the injection molding process would be able to promote the formation of β and γ
crystals whereas it would be too high in the case of PP2.
On the other hand, the WAXD pattern of PP3 or PP4 is not different from that of PP1 or
PP2. That of PP6 shows that the crystallinity of the β-form crystal has decreased, the γ-form
peak has disappeared and a new peak at 21.8o has appeared. This indicated that under the
scCO2 then quenching in ice-water, β and γ-form crystals were transformed to α-form ones
while a new type of crystal might be formed. It has been reported that when iPP is
quenched from melt to low temperature, an intermediate phase named mesomorphic phase
can be formed [80-82]. The WAXD pattern of the mesomorphic phase exhibits only two peaks
26
at about 14.8 and 21.8o. Thus, during the cooling process in an ice-water bath, the iPP that
has already been subjected to scCO2 treatment might produce mesomorphic phase domains
of several dozens of nanometers in size. The nano-size phase domains distributed in the
existing crystalline network structure significantly enhances the impact strength.
10 12 14 16 18 20 22 24
44.2 %
44.8 %
41.3 %
43.2 %
38.6 %
39.8 %
5.4 %
5.6 %
PP5
PP3
x
γ(117)α(130)
α(040)β(300)
2θ (ο)
Inte
nsity
α(110)
1.2 %
3.7 %
4.0 %
Xβ
8.9 %PP1
PP6
PP4
PP2
crystallinity
Fig.3.11 WAXD profiles of iPP samples.
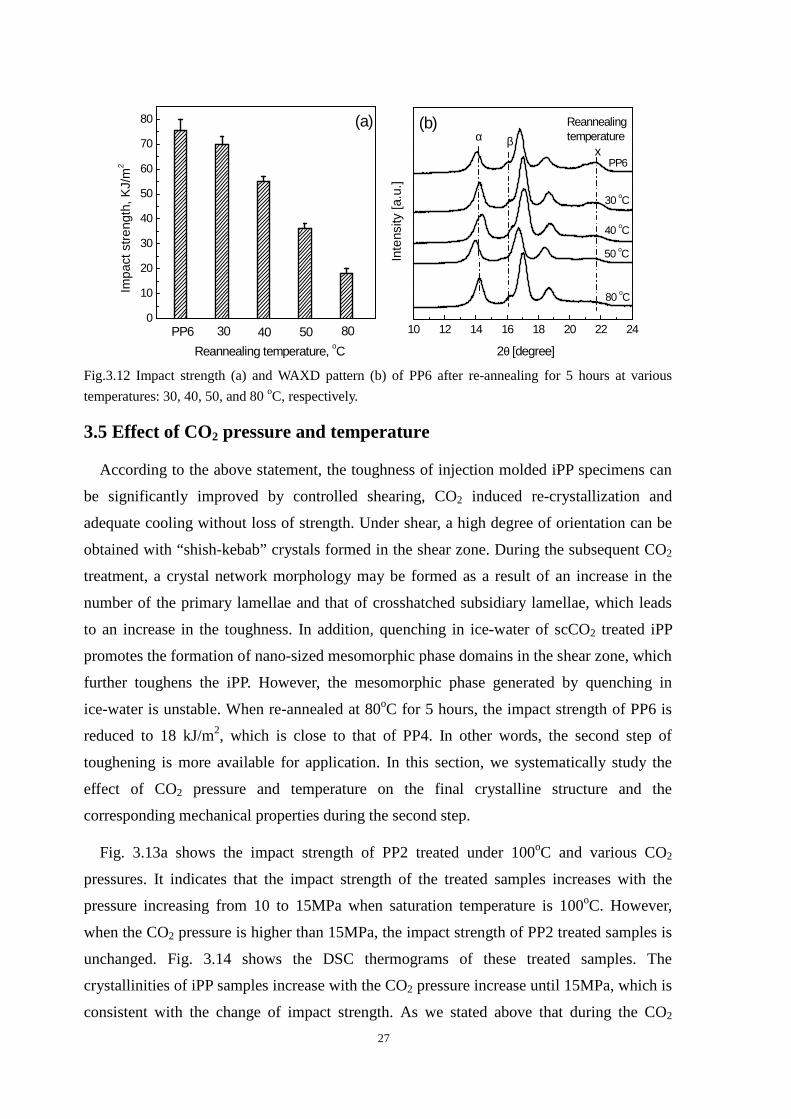
3.4.1 Effect of the instability of nano-size mesomorphic phase
It is well-known that the mesomorphic phase is unstable. Chains in the mesomorphic
phase domains may re-organize or ‘melt’ at an elevated temperature and are transformed to
α-monoclinic phase [82]. PP6 was re-annealed in a vacuum oven for 5 hours at 30, 40, 50, or
80oC. Fig. 3.12a and b show the effect of this re-annealing on the impact strength and
WAXD pattern, respectively. From Fig. 3.12b, the areas of all the reflection peaks
normalized by the one at 21.8 o decrease with increasing re-annealing temperature. The
impact strength decreases accordingly. The impact strength of PP6 is 75.7 kJ/m2 and is
reduced to 18 kJ/m2 when it is re-annealed at 80oC for 5 hours during which the
mesomorphic phase domains have almost completely disappeared (no reflection peak at
21.8o). This value is close to that of PP4, as expected. The above results further confirm the
formation of the mesomorphic phase of the scCO2 treated iPP during quenching in
ice-water.
27
0
10
20
30
40
50
60
70
80
PP6 805040
Reannealing temperature, oC
30
Impa
ct s
tren
gth,
KJ/
m2
(a)
10 12 14 16 18 20 22 24
(b)
PP6
Reannealing temperature
x β α
2θ [degree]
Inte
nsity
[a.u
.]
80 oC
50 oC
40 oC
30 oC
Fig.3.12 Impact strength (a) and WAXD pattern (b) of PP6 after re-annealing for 5 hours at various
temperatures: 30, 40, 50, and 80 oC, respectively.
3.5 Effect of CO2 pressure and temperature
According to the above statement, the toughness of injection molded iPP specimens can
be significantly improved by controlled shearing, CO2 induced re-crystallization and
adequate cooling without loss of strength. Under shear, a high degree of orientation can be
obtained with “shish-kebab” crystals formed in the shear zone. During the subsequent CO2
treatment, a crystal network morphology may be formed as a result of an increase in the
number of the primary lamellae and that of crosshatched subsidiary lamellae, which leads
to an increase in the toughness. In addition, quenching in ice-water of scCO2 treated iPP
promotes the formation of nano-sized mesomorphic phase domains in the shear zone, which
further toughens the iPP. However, the mesomorphic phase generated by quenching in
ice-water is unstable. When re-annealed at 80oC for 5 hours, the impact strength of PP6 is
reduced to 18 kJ/m2, which is close to that of PP4. In other words, the second step of
toughening is more available for application. In this section, we systematically study the
effect of CO2 pressure and temperature on the final crystalline structure and the
corresponding mechanical properties during the second step.
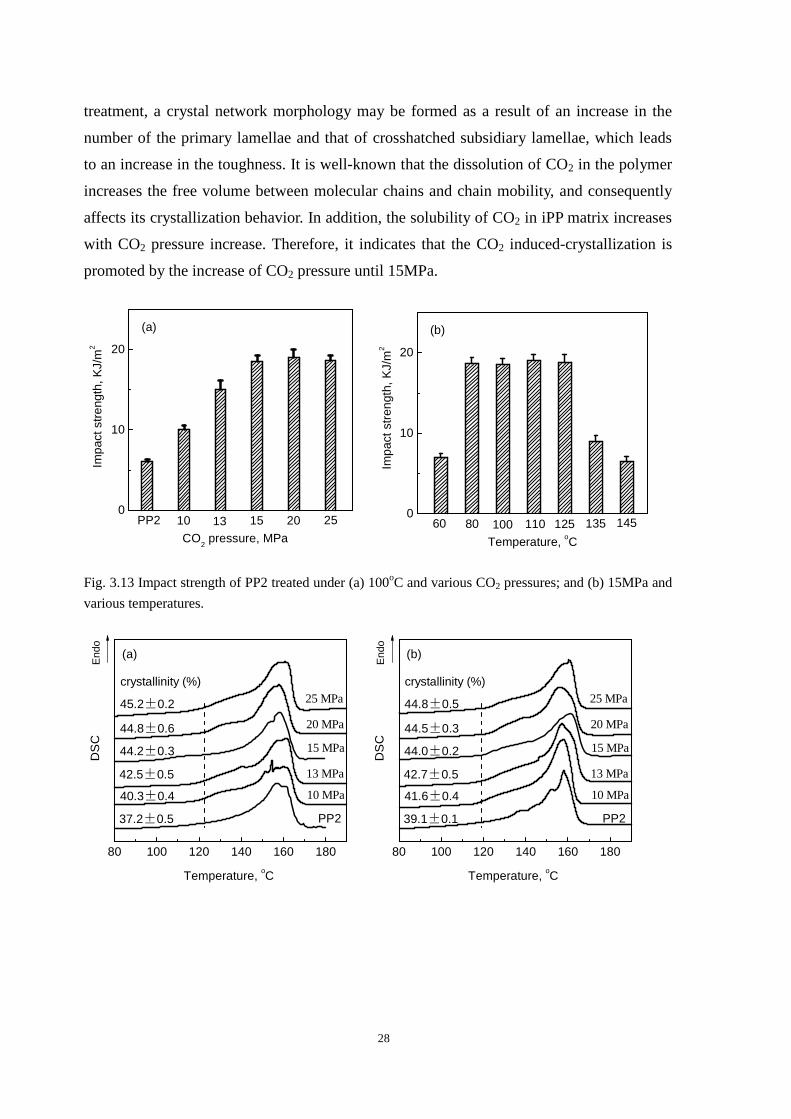
Fig. 3.13a shows the impact strength of PP2 treated under 100oC and various CO2
pressures. It indicates that the impact strength of the treated samples increases with the
pressure increasing from 10 to 15MPa when saturation temperature is 100oC. However,
when the CO2 pressure is higher than 15MPa, the impact strength of PP2 treated samples is
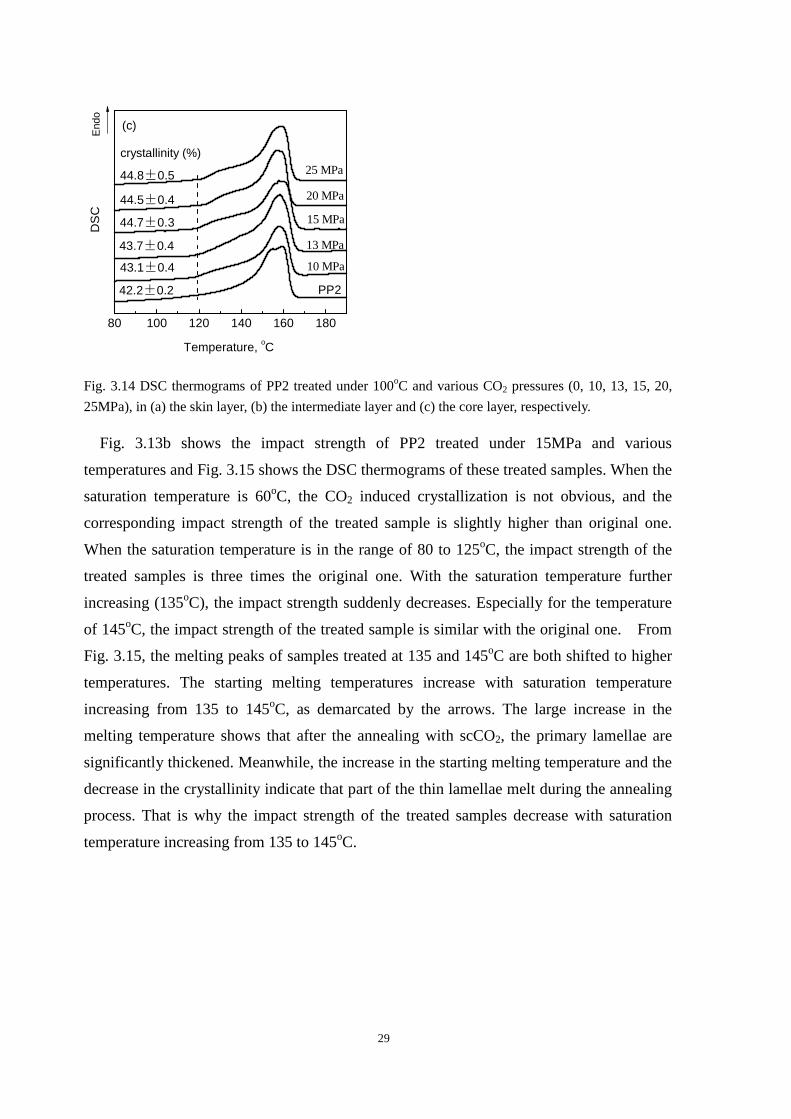
unchanged. Fig. 3.14 shows the DSC thermograms of these treated samples. The
crystallinities of iPP samples increase with the CO2 pressure increase until 15MPa, which is
consistent with the change of impact strength. As we stated above that during the CO2
28
treatment, a crystal network morphology may be formed as a result of an increase in the
number of the primary lamellae and that of crosshatched subsidiary lamellae, which leads
to an increase in the toughness. It is well-known that the dissolution of CO2 in the polymer
increases the free volume between molecular chains and chain mobility, and consequently
affects its crystallization behavior. In addition, the solubility of CO2 in iPP matrix increases
with CO2 pressure increase. Therefore, it indicates that the CO2 induced-crystallization is
promoted by the increase of CO2 pressure until 15MPa.
0
10
20
2520151310
Impa
ct s
tren
gth,
KJ/
m2
CO2 pressure, MPa
PP2
(a)
0
10
20
145
Impa
ct s
tren
gth,
KJ/
m2
(b)
Temperature, oC
1351251101008060
Fig. 3.13 Impact strength of PP2 treated under (a) 100oC and various CO2 pressures; and (b) 15MPa and
various temperatures.
80 100 120 140 160 180
(a)
Temperature, oC
44.8±0.6
45.2±0.2
42.5±0.5
40.3±0.4
44.2±0.3
37.2±0.5
25 MPa
20 MPa
15 MPa
13 MPa
10 MPa
PP2
D
SC
End
o
crystallinity (%)
80 100 120 140 160 180
(b)
Temperature, oC
44.5±0.3
44.8±0.5
42.7±0.5
41.6±0.4
44.0±0.2
39.1±0.1
25 MPa
20 MPa
15 MPa
13 MPa
10 MPa
PP2
D
SC
End
o
crystallinity (%)
29
80 100 120 140 160 180
(c)
Temperature, oC
44.5±0.4
44.8±0.5
43.7±0.4
43.1±0.4
44.7±0.3
42.2±0.2
25 MPa
20 MPa
15 MPa
13 MPa
10 MPa
PP2
D
SC
End
o
crystallinity (%)
Fig. 3.14 DSC thermograms of PP2 treated under 100oC and various CO2 pressures (0, 10, 13, 15, 20,
25MPa), in (a) the skin layer, (b) the intermediate layer and (c) the core layer, respectively.
Fig. 3.13b shows the impact strength of PP2 treated under 15MPa and various
temperatures and Fig. 3.15 shows the DSC thermograms of these treated samples. When the
saturation temperature is 60oC, the CO2 induced crystallization is not obvious, and the
corresponding impact strength of the treated sample is slightly higher than original one.
When the saturation temperature is in the range of 80 to 125oC, the impact strength of the
treated samples is three times the original one. With the saturation temperature further
increasing (135oC), the impact strength suddenly decreases. Especially for the temperature
of 145oC, the impact strength of the treated sample is similar with the original one. From
Fig. 3.15, the melting peaks of samples treated at 135 and 145oC are both shifted to higher
temperatures. The starting melting temperatures increase with saturation temperature
increasing from 135 to 145oC, as demarcated by the arrows. The large increase in the
melting temperature shows that after the annealing with scCO2, the primary lamellae are
significantly thickened. Meanwhile, the increase in the starting melting temperature and the
decrease in the crystallinity indicate that part of the thin lamellae melt during the annealing
process. That is why the impact strength of the treated samples decrease with saturation
temperature increasing from 135 to 145oC.
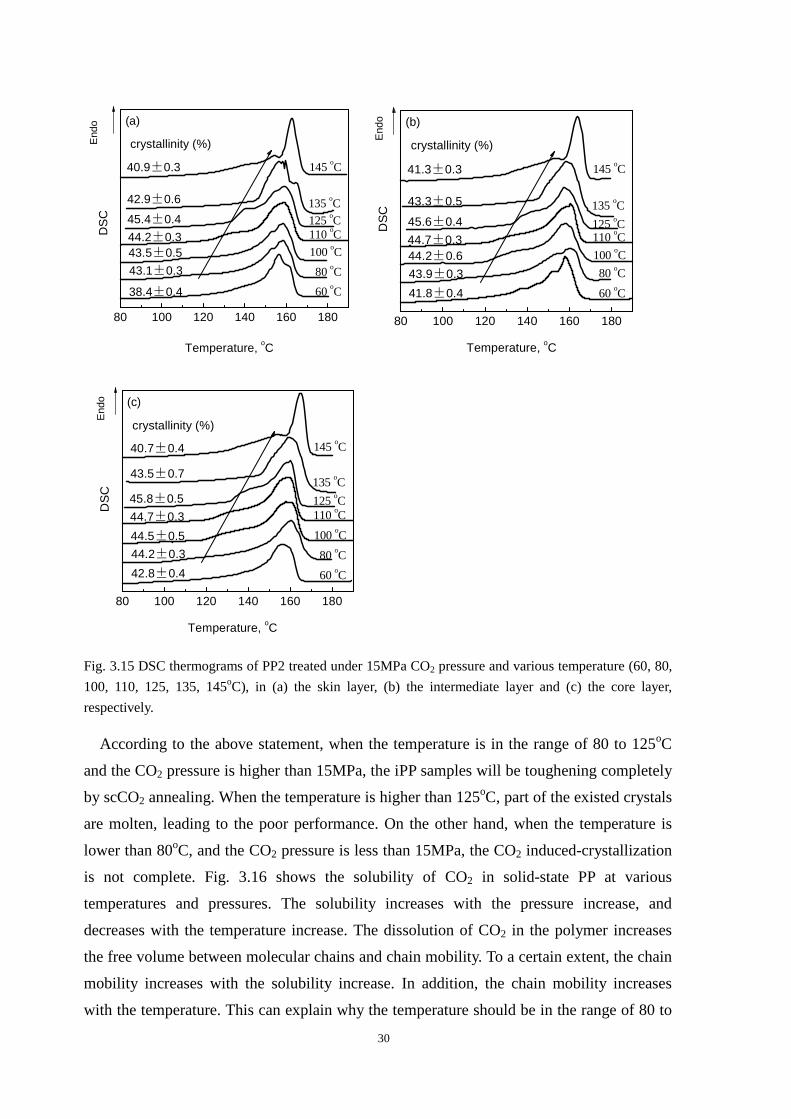
30
80 100 120 140 160 180
40.9±0.3
Temperature, oC
145 oC
135 oC
125 oC110 oC
100 oC
80 oC
60 oC
D
SC
End
o
crystallinity (%)
42.9±0.6
45.4±0.4
44.2±0.3 43.5±0.5
43.1±0.3
38.4±0.4
(a)
80 100 120 140 160 180
41.3±0.3
Temperature, oC
145 oC
135 oC
125 oC110 oC
100 oC
80 oC
60 oC
D
SC
End
o
crystallinity (%)
43.3±0.5
45.6±0.4
44.7±0.3 44.2±0.6
43.9±0.3
41.8±0.4
(b)
80 100 120 140 160 180
40.7±0.4
Temperature, oC
145 oC
135 oC
125 oC110 oC
100 oC
80 oC
60 oC
D
SC
End
o
crystallinity (%)
43.5±0.7
45.8±0.5
44.7±0.3
44.5±0.5
44.2±0.3
42.8±0.4
(c)
Fig. 3.15 DSC thermograms of PP2 treated under 15MPa CO2 pressure and various temperature (60, 80,
100, 110, 125, 135, 145oC), in (a) the skin layer, (b) the intermediate layer and (c) the core layer,
respectively.
According to the above statement, when the temperature is in the range of 80 to 125oC
and the CO2 pressure is higher than 15MPa, the iPP samples will be toughening completely
by scCO2 annealing. When the temperature is higher than 125oC, part of the existed crystals
are molten, leading to the poor performance. On the other hand, when the temperature is
lower than 80oC, and the CO2 pressure is less than 15MPa, the CO2 induced-crystallization
is not complete. Fig. 3.16 shows the solubility of CO2 in solid-state PP at various
temperatures and pressures. The solubility increases with the pressure increase, and
decreases with the temperature increase. The dissolution of CO2 in the polymer increases
the free volume between molecular chains and chain mobility. To a certain extent, the chain
mobility increases with the solubility increase. In addition, the chain mobility increases
with the temperature. This can explain why the temperature should be in the range of 80 to
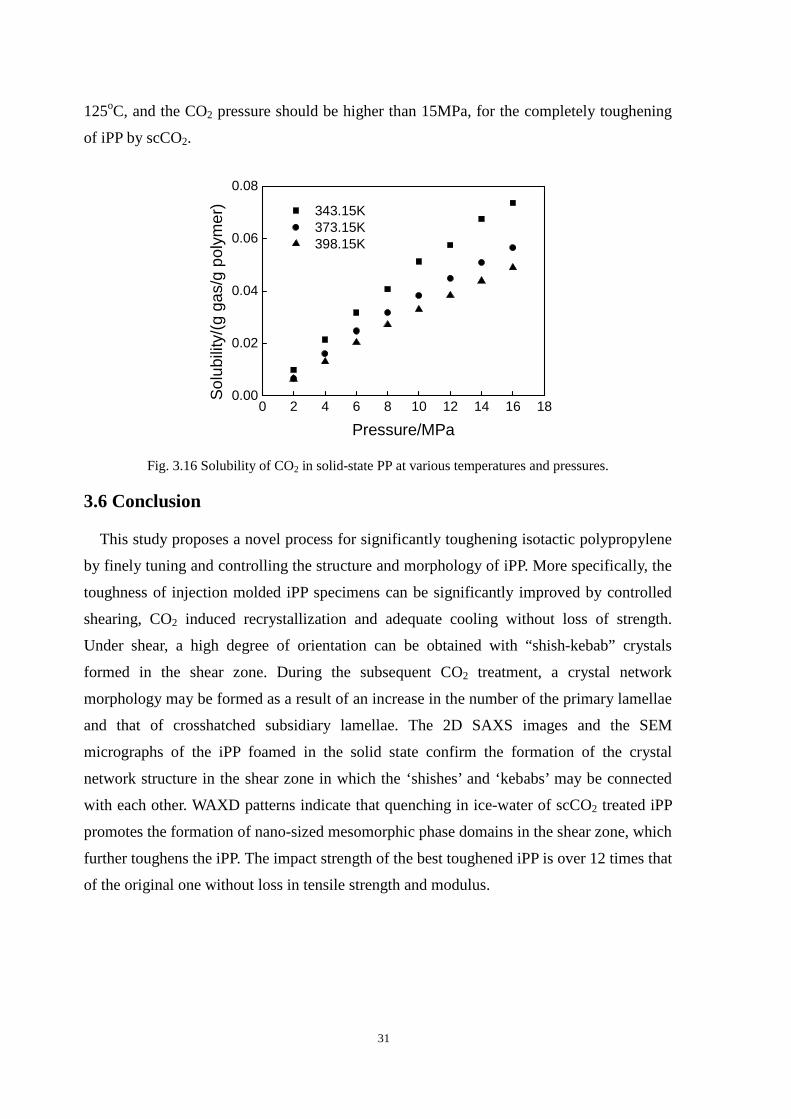
31
125oC, and the CO2 pressure should be higher than 15MPa, for the completely toughening
of iPP by scCO2.
0 2 4 6 8 10 12 14 16 180.00
0.02
0.04
0.06
0.08
343.15K 373.15K 398.15K
Sol
ubili
ty/(
g ga
s/g
poly
mer
)
Pressure/MPa
Fig. 3.16 Solubility of CO2 in solid-state PP at various temperatures and pressures.
3.6 Conclusion
This study proposes a novel process for significantly toughening isotactic polypropylene
by finely tuning and controlling the structure and morphology of iPP. More specifically, the
toughness of injection molded iPP specimens can be significantly improved by controlled
shearing, CO2 induced recrystallization and adequate cooling without loss of strength.
Under shear, a high degree of orientation can be obtained with “shish-kebab” crystals
formed in the shear zone. During the subsequent CO2 treatment, a crystal network
morphology may be formed as a result of an increase in the number of the primary lamellae
and that of crosshatched subsidiary lamellae. The 2D SAXS images and the SEM
micrographs of the iPP foamed in the solid state confirm the formation of the crystal
network structure in the shear zone in which the ‘shishes’ and ‘kebabs’ may be connected
with each other. WAXD patterns indicate that quenching in ice-water of scCO2 treated iPP
promotes the formation of nano-sized mesomorphic phase domains in the shear zone, which
further toughens the iPP. The impact strength of the best toughened iPP is over 12 times that
of the original one without loss in tensile strength and modulus.
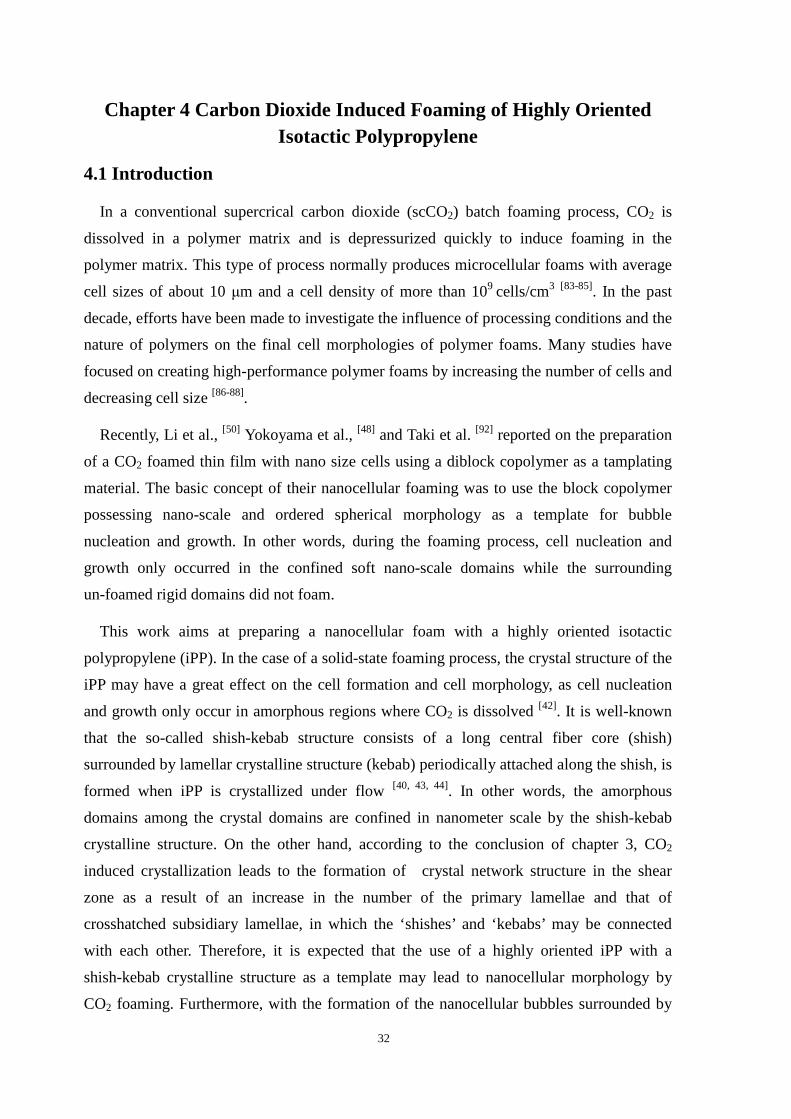
32
Chapter 4 Carbon Dioxide Induced Foaming of Highly Oriented Isotactic Polypropylene
4.1 Introduction
In a conventional supercrical carbon dioxide (scCO2) batch foaming process, CO2 is
dissolved in a polymer matrix and is depressurized quickly to induce foaming in the
polymer matrix. This type of process normally produces microcellular foams with average
cell sizes of about 10 µm and a cell density of more than 109 cells/cm3 [83-85]. In the past
decade, efforts have been made to investigate the influence of processing conditions and the
nature of polymers on the final cell morphologies of polymer foams. Many studies have
focused on creating high-performance polymer foams by increasing the number of cells and
decreasing cell size [86-88].
Recently, Li et al., [50] Yokoyama et al., [48] and Taki et al. [92] reported on the preparation
of a CO2 foamed thin film with nano size cells using a diblock copolymer as a tamplating
material. The basic concept of their nanocellular foaming was to use the block copolymer
possessing nano-scale and ordered spherical morphology as a template for bubble
nucleation and growth. In other words, during the foaming process, cell nucleation and
growth only occurred in the confined soft nano-scale domains while the surrounding
un-foamed rigid domains did not foam.
This work aims at preparing a nanocellular foam with a highly oriented isotactic
polypropylene (iPP). In the case of a solid-state foaming process, the crystal structure of the
iPP may have a great effect on the cell formation and cell morphology, as cell nucleation
and growth only occur in amorphous regions where CO2 is dissolved [42]. It is well-known
that the so-called shish-kebab structure consists of a long central fiber core (shish)
surrounded by lamellar crystalline structure (kebab) periodically attached along the shish, is
formed when iPP is crystallized under flow [40, 43, 44]. In other words, the amorphous
domains among the crystal domains are confined in nanometer scale by the shish-kebab
crystalline structure. On the other hand, according to the conclusion of chapter 3, CO2
induced crystallization leads to the formation of crystal network structure in the shear
zone as a result of an increase in the number of the primary lamellae and that of
crosshatched subsidiary lamellae, in which the ‘shishes’ and ‘kebabs’ may be connected
with each other. Therefore, it is expected that the use of a highly oriented iPP with a
shish-kebab crystalline structure as a template may lead to nanocellular morphology by
CO2 foaming. Furthermore, with the formation of the nanocellular bubbles surrounded by
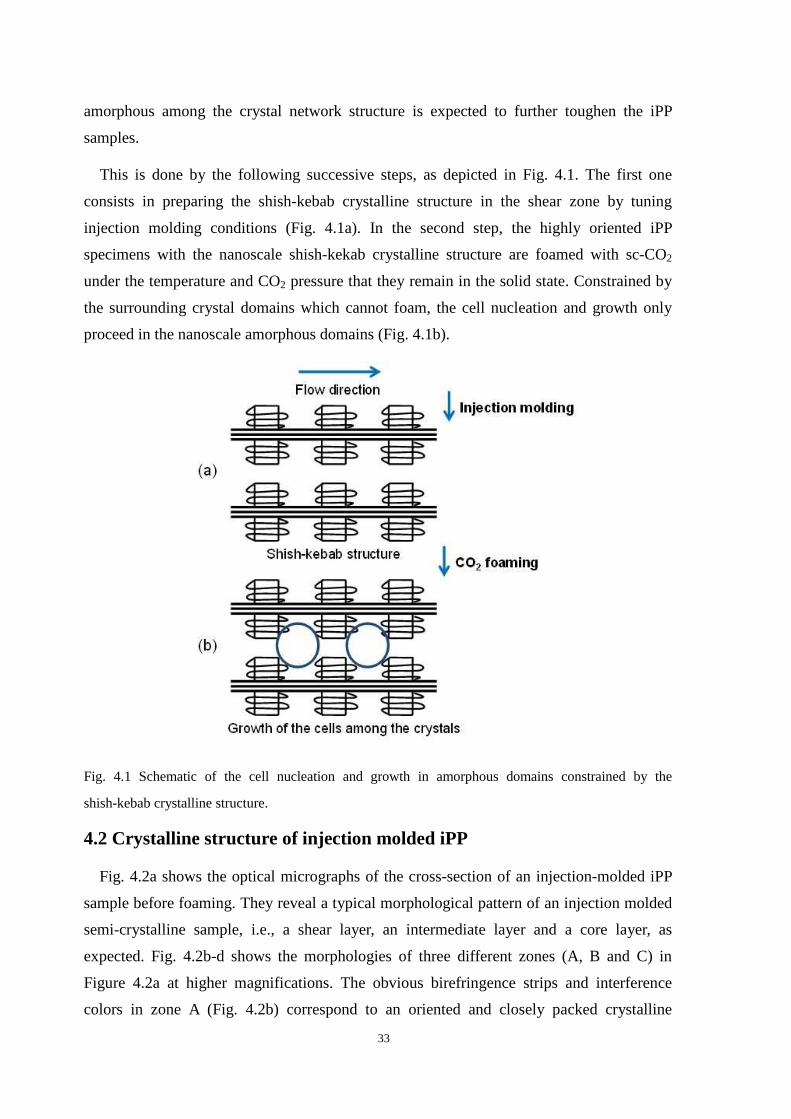
33
amorphous among the crystal network structure is expected to further toughen the iPP
samples.
This is done by the following successive steps, as depicted in Fig. 4.1. The first one
consists in preparing the shish-kebab crystalline structure in the shear zone by tuning
injection molding conditions (Fig. 4.1a). In the second step, the highly oriented iPP
specimens with the nanoscale shish-kekab crystalline structure are foamed with sc-CO2
under the temperature and CO2 pressure that they remain in the solid state. Constrained by
the surrounding crystal domains which cannot foam, the cell nucleation and growth only
proceed in the nanoscale amorphous domains (Fig. 4.1b).
Fig. 4.1 Schematic of the cell nucleation and growth in amorphous domains constrained by the
shish-kebab crystalline structure.
4.2 Crystalline structure of injection molded iPP
Fig. 4.2a shows the optical micrographs of the cross-section of an injection-molded iPP
sample before foaming. They reveal a typical morphological pattern of an injection molded
semi-crystalline sample, i.e., a shear layer, an intermediate layer and a core layer, as
expected. Fig. 4.2b-d shows the morphologies of three different zones (A, B and C) in
Figure 4.2a at higher magnifications. The obvious birefringence strips and interference
colors in zone A (Fig. 4.2b) correspond to an oriented and closely packed crystalline
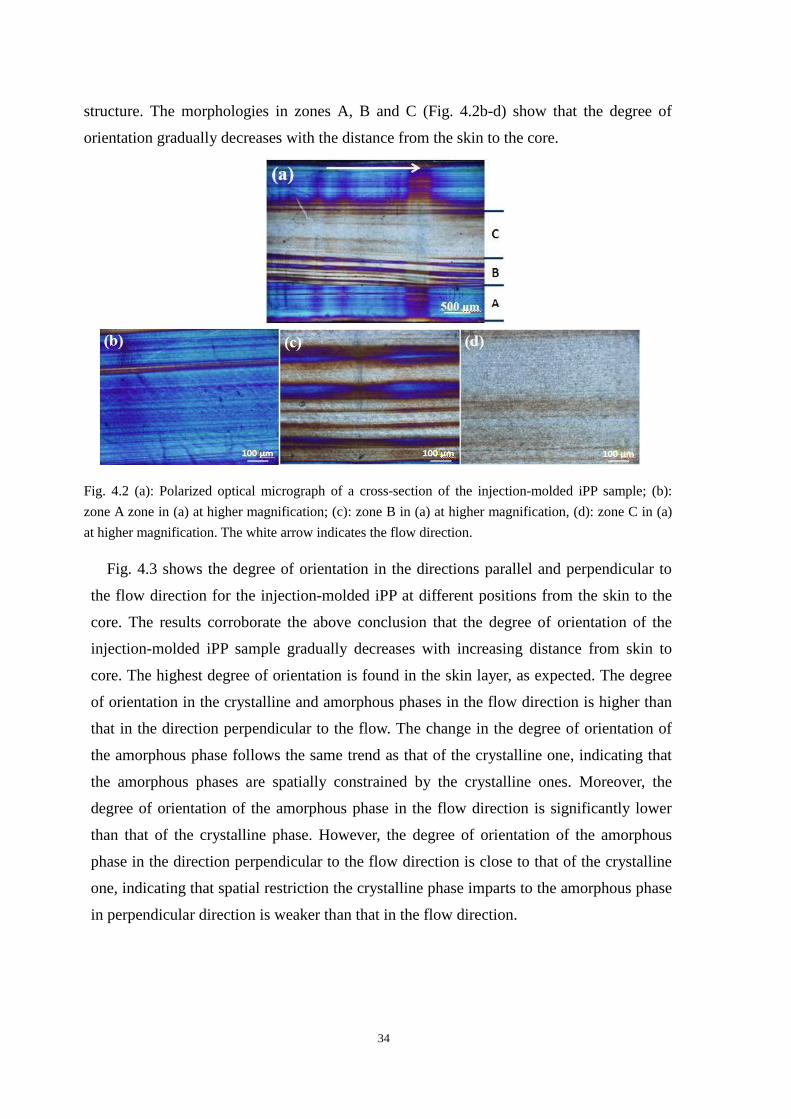
34
structure. The morphologies in zones A, B and C (Fig. 4.2b-d) show that the degree of
orientation gradually decreases with the distance from the skin to the core.
Fig. 4.2 (a): Polarized optical micrograph of a cross-section of the injection-molded iPP sample; (b):
zone A zone in (a) at higher magnification; (c): zone B in (a) at higher magnification, (d): zone C in (a)
at higher magnification. The white arrow indicates the flow direction.
Fig. 4.3 shows the degree of orientation in the directions parallel and perpendicular to
the flow direction for the injection-molded iPP at different positions from the skin to the
core. The results corroborate the above conclusion that the degree of orientation of the
injection-molded iPP sample gradually decreases with increasing distance from skin to
core. The highest degree of orientation is found in the skin layer, as expected. The degree
of orientation in the crystalline and amorphous phases in the flow direction is higher than
that in the direction perpendicular to the flow. The change in the degree of orientation of
the amorphous phase follows the same trend as that of the crystalline one, indicating that
the amorphous phases are spatially constrained by the crystalline ones. Moreover, the
degree of orientation of the amorphous phase in the flow direction is significantly lower
than that of the crystalline phase. However, the degree of orientation of the amorphous
phase in the direction perpendicular to the flow direction is close to that of the crystalline
one, indicating that spatial restriction the crystalline phase imparts to the amorphous phase
in perpendicular direction is weaker than that in the flow direction.
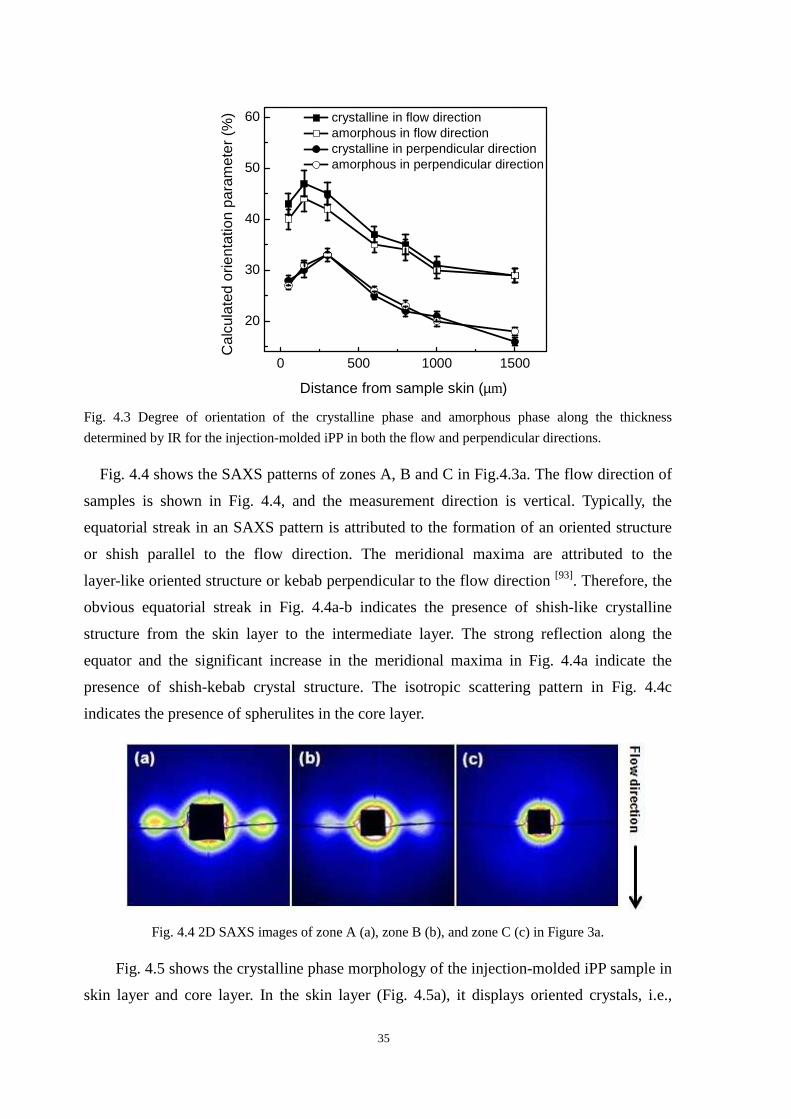
35
0 500 1000 1500
20
30
40
50
60
Cal
cula
ted
orie
ntat
ion
para
met
er (
%)
Distance from sample skin (µm)
crystalline in flow direction amorphous in flow direction crystalline in perpendicular direction amorphous in perpendicular direction
Fig. 4.3 Degree of orientation of the crystalline phase and amorphous phase along the thickness
determined by IR for the injection-molded iPP in both the flow and perpendicular directions.
Fig. 4.4 shows the SAXS patterns of zones A, B and C in Fig.4.3a. The flow direction of
samples is shown in Fig. 4.4, and the measurement direction is vertical. Typically, the
equatorial streak in an SAXS pattern is attributed to the formation of an oriented structure
or shish parallel to the flow direction. The meridional maxima are attributed to the
layer-like oriented structure or kebab perpendicular to the flow direction [93]. Therefore, the
obvious equatorial streak in Fig. 4.4a-b indicates the presence of shish-like crystalline
structure from the skin layer to the intermediate layer. The strong reflection along the
equator and the significant increase in the meridional maxima in Fig. 4.4a indicate the
presence of shish-kebab crystal structure. The isotropic scattering pattern in Fig. 4.4c
indicates the presence of spherulites in the core layer.
Fig. 4.4 2D SAXS images of zone A (a), zone B (b), and zone C (c) in Figure 3a.
Fig. 4.5 shows the crystalline phase morphology of the injection-molded iPP sample in
skin layer and core layer. In the skin layer (Fig. 4.5a), it displays oriented crystals, i.e.,
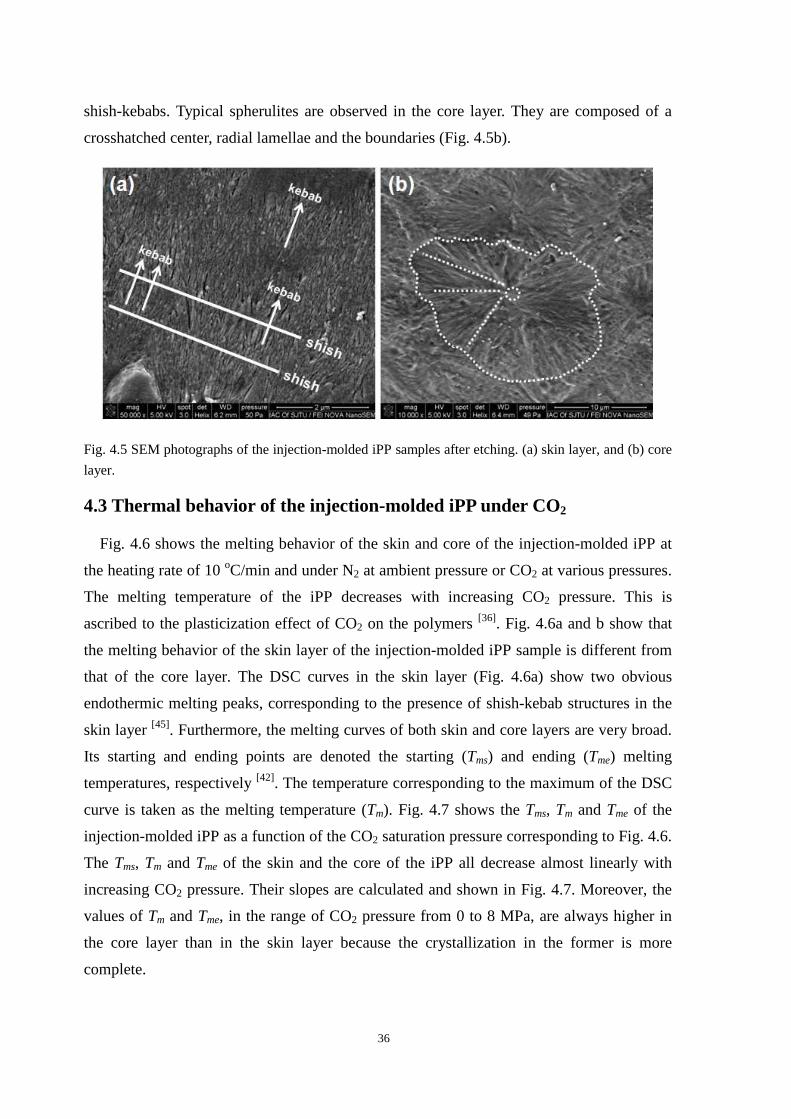
36
shish-kebabs. Typical spherulites are observed in the core layer. They are composed of a
crosshatched center, radial lamellae and the boundaries (Fig. 4.5b).
Fig. 4.5 SEM photographs of the injection-molded iPP samples after etching. (a) skin layer, and (b) core
layer.
4.3 Thermal behavior of the injection-molded iPP under CO2
Fig. 4.6 shows the melting behavior of the skin and core of the injection-molded iPP at
the heating rate of 10 oC/min and under N2 at ambient pressure or CO2 at various pressures.
The melting temperature of the iPP decreases with increasing CO2 pressure. This is
ascribed to the plasticization effect of CO2 on the polymers [36]. Fig. 4.6a and b show that
the melting behavior of the skin layer of the injection-molded iPP sample is different from
that of the core layer. The DSC curves in the skin layer (Fig. 4.6a) show two obvious
endothermic melting peaks, corresponding to the presence of shish-kebab structures in the
skin layer [45]. Furthermore, the melting curves of both skin and core layers are very broad.
Its starting and ending points are denoted the starting (Tms) and ending (Tme) melting
temperatures, respectively [42]. The temperature corresponding to the maximum of the DSC
curve is taken as the melting temperature (Tm). Fig. 4.7 shows the Tms, Tm and Tme of the
injection-molded iPP as a function of the CO2 saturation pressure corresponding to Fig. 4.6.
The Tms, Tm and Tme of the skin and the core of the iPP all decrease almost linearly with
increasing CO2 pressure. Their slopes are calculated and shown in Fig. 4.7. Moreover, the
values of Tm and Tme, in the range of CO2 pressure from 0 to 8 MPa, are always higher in
the core layer than in the skin layer because the crystallization in the former is more
complete.
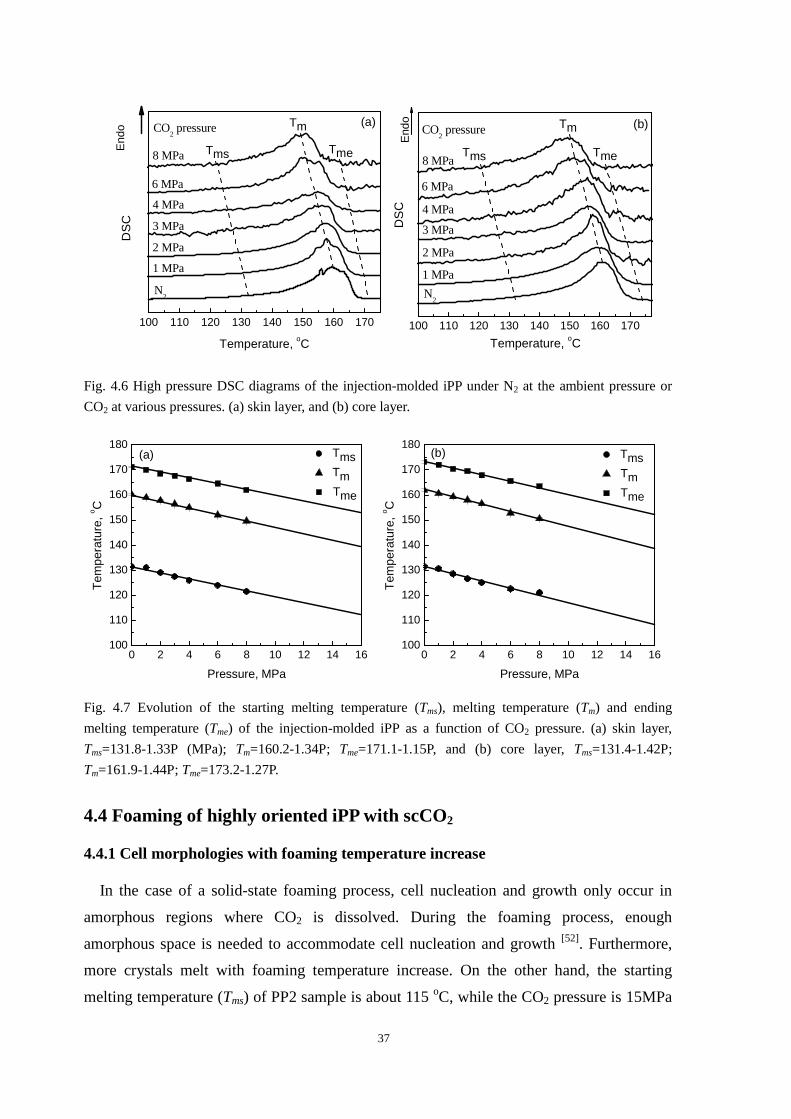
37
100 110 120 130 140 150 160 170
Tme
Tm
Tms
CO2 pressure
8 MPa
6 MPa
3 MPa
4 MPa
2 MPa
1 MPa
N2
End
oD
SC
Temperature, oC
(a)
100 110 120 130 140 150 160 170
Tme
Tm
Tms
(b)
Temperature, oC
CO2 pressure
8 MPa
6 MPa
3 MPa
4 MPa
2 MPa
1 MPa
N2
End
oD
SC
Fig. 4.6 High pressure DSC diagrams of the injection-molded iPP under N2 at the ambient pressure or
CO2 at various pressures. (a) skin layer, and (b) core layer.
0 2 4 6 8 10 12 14 16100
110
120
130
140
150
160
170
180
Tms Tm Tme
Tem
pera
ture
, o C
Pressure, MPa
(a)
0 2 4 6 8 10 12 14 16100
110
120
130
140
150
160
170
180 Tms Tm Tme
Tem
pera
ture
, o C
Pressure, MPa
(b)
Fig. 4.7 Evolution of the starting melting temperature (Tms), melting temperature (Tm) and ending
melting temperature (Tme) of the injection-molded iPP as a function of CO2 pressure. (a) skin layer,
Tms=131.8-1.33P (MPa); Tm=160.2-1.34P; Tme=171.1-1.15P, and (b) core layer, Tms=131.4-1.42P;
Tm=161.9-1.44P; Tme=173.2-1.27P.
4.4 Foaming of highly oriented iPP with scCO2
4.4.1 Cell morphologies with foaming temperature increase
In the case of a solid-state foaming process, cell nucleation and growth only occur in
amorphous regions where CO2 is dissolved. During the foaming process, enough
amorphous space is needed to accommodate cell nucleation and growth [52]. Furthermore,
more crystals melt with foaming temperature increase. On the other hand, the starting
melting temperature (Tms) of PP2 sample is about 115 oC, while the CO2 pressure is 15MPa
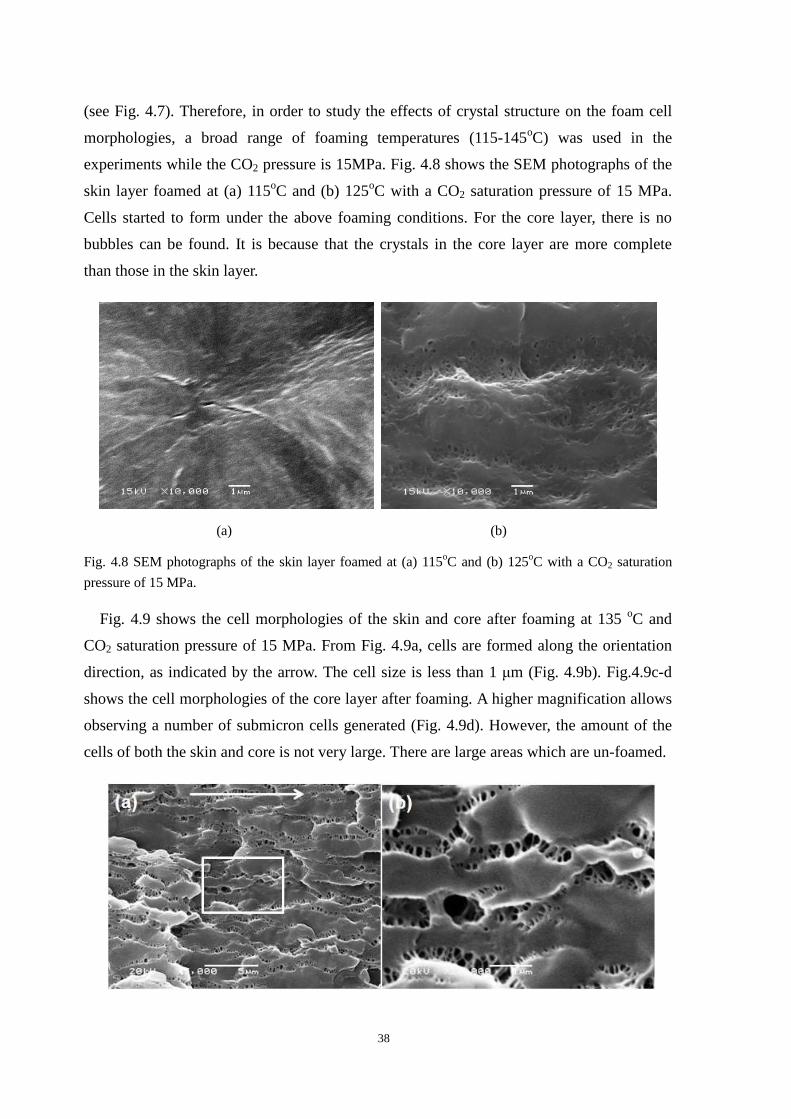
38
(see Fig. 4.7). Therefore, in order to study the effects of crystal structure on the foam cell
morphologies, a broad range of foaming temperatures (115-145oC) was used in the
experiments while the CO2 pressure is 15MPa. Fig. 4.8 shows the SEM photographs of the
skin layer foamed at (a) 115oC and (b) 125oC with a CO2 saturation pressure of 15 MPa.
Cells started to form under the above foaming conditions. For the core layer, there is no
bubbles can be found. It is because that the crystals in the core layer are more complete
than those in the skin layer.
(a) (b)
Fig. 4.8 SEM photographs of the skin layer foamed at (a) 115oC and (b) 125oC with a CO2 saturation
pressure of 15 MPa.
Fig. 4.9 shows the cell morphologies of the skin and core after foaming at 135 oC and
CO2 saturation pressure of 15 MPa. From Fig. 4.9a, cells are formed along the orientation
direction, as indicated by the arrow. The cell size is less than 1 µm (Fig. 4.9b). Fig.4.9c-d
shows the cell morphologies of the core layer after foaming. A higher magnification allows
observing a number of submicron cells generated (Fig. 4.9d). However, the amount of the
cells of both the skin and core is not very large. There are large areas which are un-foamed.
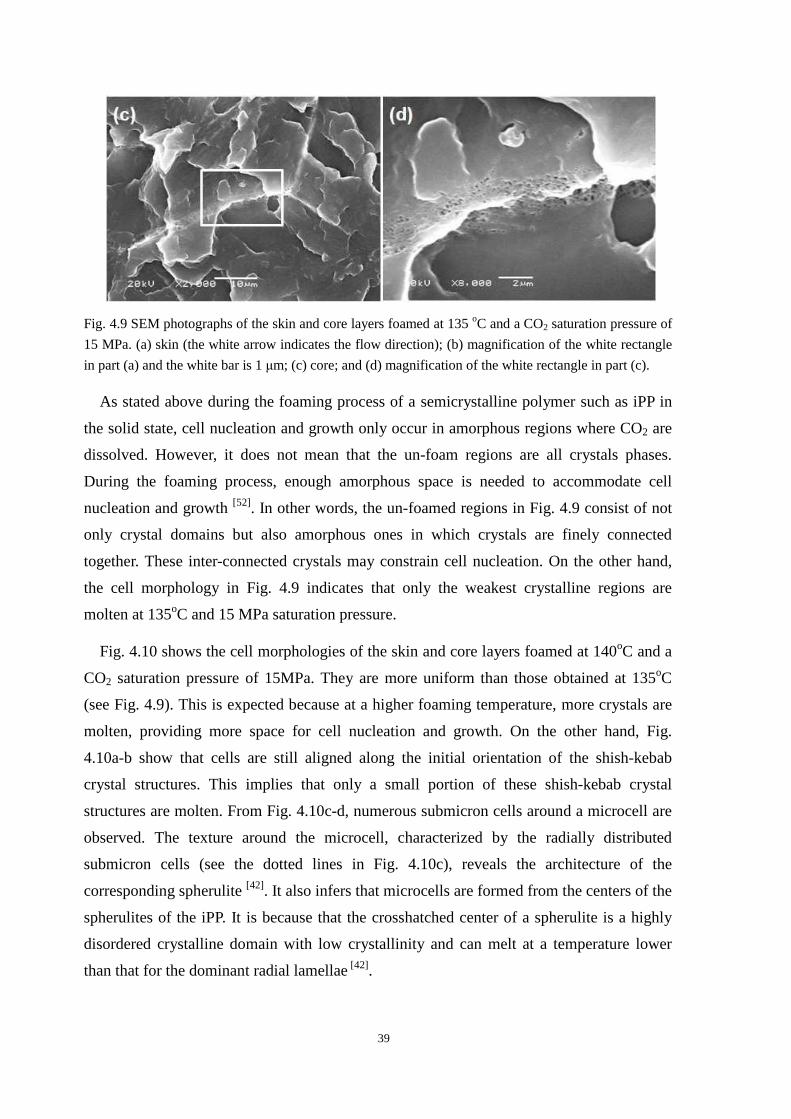
39
Fig. 4.9 SEM photographs of the skin and core layers foamed at 135 oC and a CO2 saturation pressure of
15 MPa. (a) skin (the white arrow indicates the flow direction); (b) magnification of the white rectangle
in part (a) and the white bar is 1 µm; (c) core; and (d) magnification of the white rectangle in part (c).
As stated above during the foaming process of a semicrystalline polymer such as iPP in
the solid state, cell nucleation and growth only occur in amorphous regions where CO2 are
dissolved. However, it does not mean that the un-foam regions are all crystals phases.
During the foaming process, enough amorphous space is needed to accommodate cell
nucleation and growth [52]. In other words, the un-foamed regions in Fig. 4.9 consist of not
only crystal domains but also amorphous ones in which crystals are finely connected
together. These inter-connected crystals may constrain cell nucleation. On the other hand,
the cell morphology in Fig. 4.9 indicates that only the weakest crystalline regions are
molten at 135oC and 15 MPa saturation pressure.
Fig. 4.10 shows the cell morphologies of the skin and core layers foamed at 140oC and a
CO2 saturation pressure of 15MPa. They are more uniform than those obtained at 135oC
(see Fig. 4.9). This is expected because at a higher foaming temperature, more crystals are
molten, providing more space for cell nucleation and growth. On the other hand, Fig.
4.10a-b show that cells are still aligned along the initial orientation of the shish-kebab
crystal structures. This implies that only a small portion of these shish-kebab crystal
structures are molten. From Fig. 4.10c-d, numerous submicron cells around a microcell are
observed. The texture around the microcell, characterized by the radially distributed
submicron cells (see the dotted lines in Fig. 4.10c), reveals the architecture of the
corresponding spherulite [42]. It also infers that microcells are formed from the centers of the
spherulites of the iPP. It is because that the crosshatched center of a spherulite is a highly
disordered crystalline domain with low crystallinity and can melt at a temperature lower
than that for the dominant radial lamellae [42].
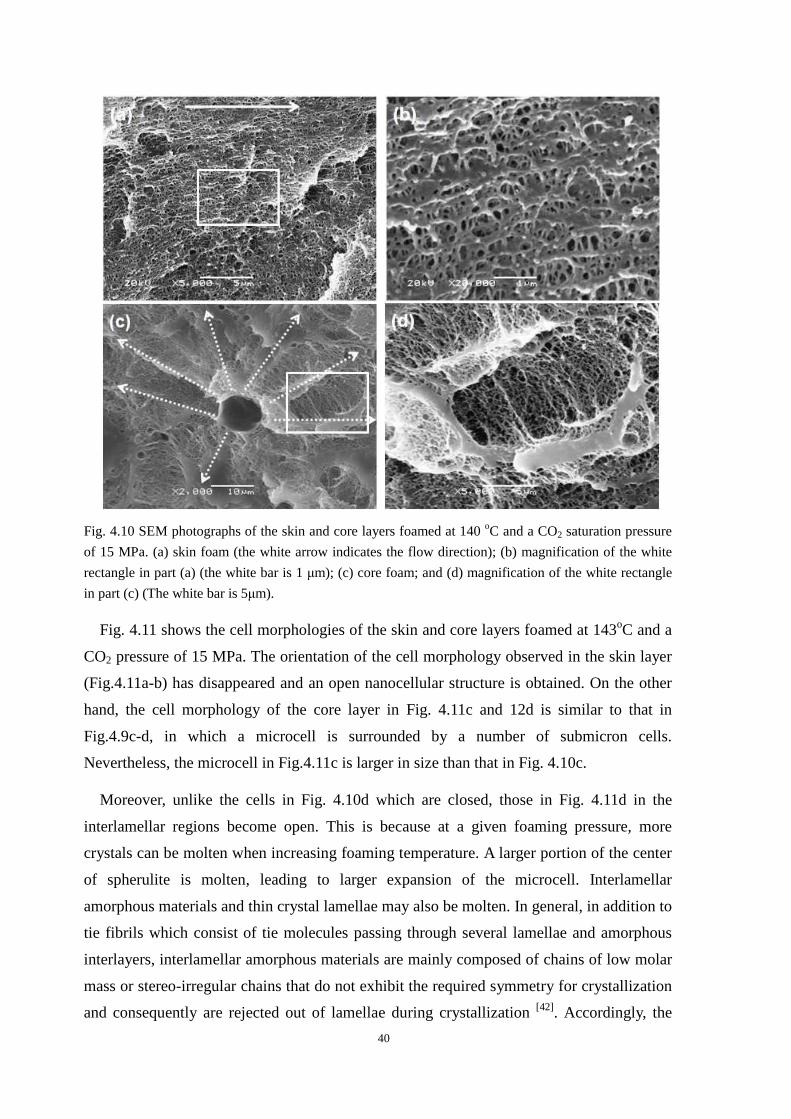
40
Fig. 4.10 SEM photographs of the skin and core layers foamed at 140 oC and a CO2 saturation pressure
of 15 MPa. (a) skin foam (the white arrow indicates the flow direction); (b) magnification of the white
rectangle in part (a) (the white bar is 1 µm); (c) core foam; and (d) magnification of the white rectangle
in part (c) (The white bar is 5µm).
Fig. 4.11 shows the cell morphologies of the skin and core layers foamed at 143oC and a
CO2 pressure of 15 MPa. The orientation of the cell morphology observed in the skin layer
(Fig.4.11a-b) has disappeared and an open nanocellular structure is obtained. On the other
hand, the cell morphology of the core layer in Fig. 4.11c and 12d is similar to that in
Fig.4.9c-d, in which a microcell is surrounded by a number of submicron cells.
Nevertheless, the microcell in Fig.4.11c is larger in size than that in Fig. 4.10c.
Moreover, unlike the cells in Fig. 4.10d which are closed, those in Fig. 4.11d in the
interlamellar regions become open. This is because at a given foaming pressure, more
crystals can be molten when increasing foaming temperature. A larger portion of the center
of spherulite is molten, leading to larger expansion of the microcell. Interlamellar
amorphous materials and thin crystal lamellae may also be molten. In general, in addition to
tie fibrils which consist of tie molecules passing through several lamellae and amorphous
interlayers, interlamellar amorphous materials are mainly composed of chains of low molar
mass or stereo-irregular chains that do not exhibit the required symmetry for crystallization
and consequently are rejected out of lamellae during crystallization [42]. Accordingly, the
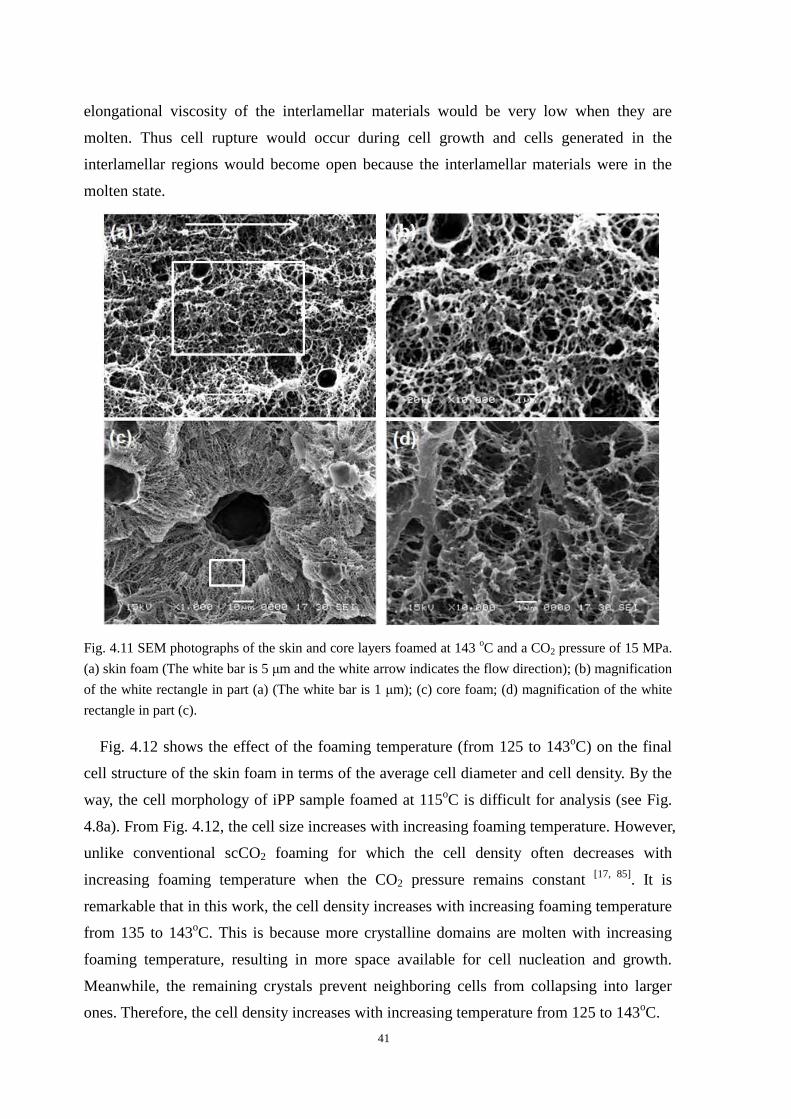
41
elongational viscosity of the interlamellar materials would be very low when they are
molten. Thus cell rupture would occur during cell growth and cells generated in the
interlamellar regions would become open because the interlamellar materials were in the
molten state.
Fig. 4.11 SEM photographs of the skin and core layers foamed at 143 oC and a CO2 pressure of 15 MPa.
(a) skin foam (The white bar is 5 µm and the white arrow indicates the flow direction); (b) magnification
of the white rectangle in part (a) (The white bar is 1 µm); (c) core foam; (d) magnification of the white
rectangle in part (c).
Fig. 4.12 shows the effect of the foaming temperature (from 125 to 143oC) on the final
cell structure of the skin foam in terms of the average cell diameter and cell density. By the
way, the cell morphology of iPP sample foamed at 115oC is difficult for analysis (see Fig.
4.8a). From Fig. 4.12, the cell size increases with increasing foaming temperature. However,
unlike conventional scCO2 foaming for which the cell density often decreases with
increasing foaming temperature when the CO2 pressure remains constant [17, 85]. It is
remarkable that in this work, the cell density increases with increasing foaming temperature
from 135 to 143oC. This is because more crystalline domains are molten with increasing
foaming temperature, resulting in more space available for cell nucleation and growth.
Meanwhile, the remaining crystals prevent neighboring cells from collapsing into larger
ones. Therefore, the cell density increases with increasing temperature from 125 to 143oC.
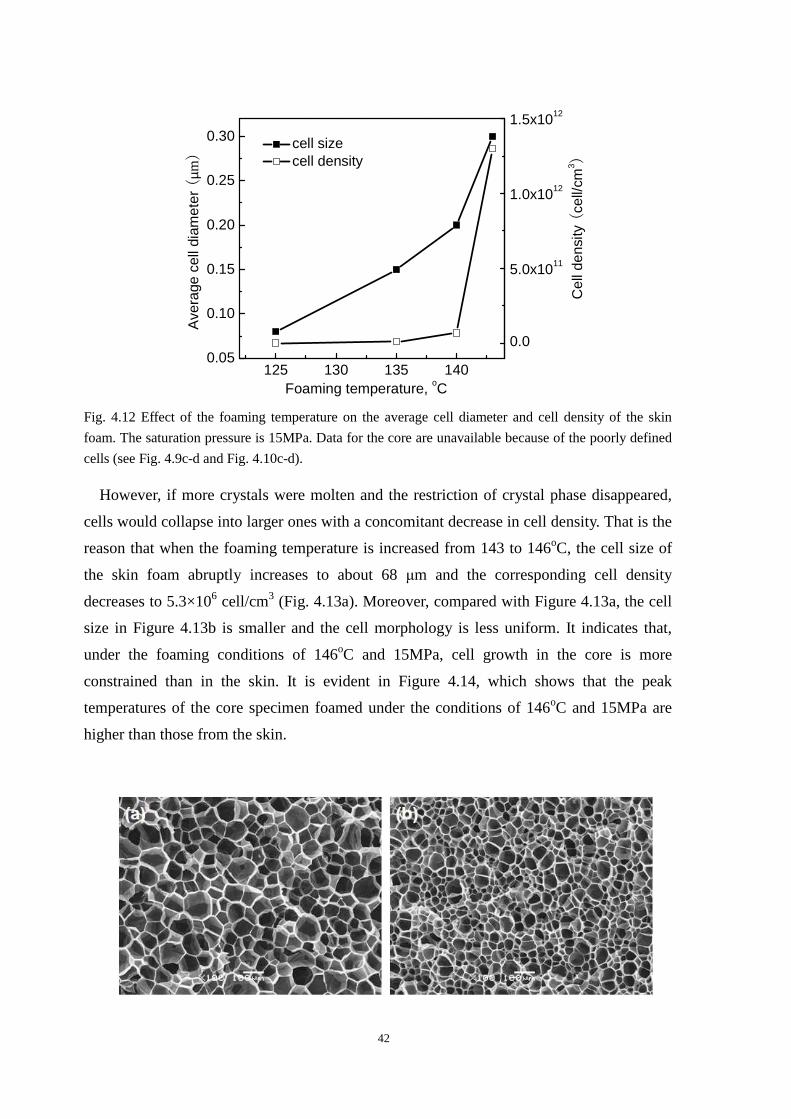
42
125 130 135 1400.05
0.10
0.15
0.20
0.25
0.30
cell size cell density
0.0
5.0x10¹¹
1.0x10¹²
1.5x10¹²
Ave
rage
cel
l dia
met
er (
µm)
Cel
l den
sity
(ce
ll/cm
3 )
Foaming temperature, oC
Fig. 4.12 Effect of the foaming temperature on the average cell diameter and cell density of the skin
foam. The saturation pressure is 15MPa. Data for the core are unavailable because of the poorly defined
cells (see Fig. 4.9c-d and Fig. 4.10c-d).
However, if more crystals were molten and the restriction of crystal phase disappeared,
cells would collapse into larger ones with a concomitant decrease in cell density. That is the
reason that when the foaming temperature is increased from 143 to 146oC, the cell size of
the skin foam abruptly increases to about 68 µm and the corresponding cell density
decreases to 5.3×10⁶ cell/cm3 (Fig. 4.13a). Moreover, compared with Figure 4.13a, the cell
size in Figure 4.13b is smaller and the cell morphology is less uniform. It indicates that,
under the foaming conditions of 146oC and 15MPa, cell growth in the core is more
constrained than in the skin. It is evident in Figure 4.14, which shows that the peak
temperatures of the core specimen foamed under the conditions of 146oC and 15MPa are
higher than those from the skin.

43
Fig. 4.13 SEM photographs of the skin and core layers foamed at 146 oC and a CO2 pressure of 15MPa.
(a) skin foam; and (b) core foam.
4.4.2 Impact strength of foamed PP2
According to the conclusion of chapter 3, the impact strengths of PP2 samples are constant, while
treated under 15MPa CO2 pressure and temperature from 80-125oC. Fig. 4.14 shows the impact strengths
of PP2 and PP4 compared with those of PP2 foamed under CO2 pressure of 15MPa and various
temperatures. When PP2 samples were foamed under 115 and 125oC, the impact strengths of PP2 foams
were higher than that of PP4. When the foaming temperature increased to 135, the impact strength of
PP2 foam suddenly decreased to about 9.2 KJ/m2 (lower than that of PP4). With the foaming temperature
further increase, the impact strength of PP2 foams decreased. As the foregoing statement, more crystals
melt with foaming temperature increase and the starting melting temperature (Tms) of PP2 sample is
about 115 oC, while the CO2 pressure is 15MPa (see Fig. 4.7). As the mechanical properties of iPP are
dictated by its crystallinity and crystalline morphology. It indicates that when the foaming temperature is
lower than 125oC, the crystals are barely molten. The nanocellular bubbles among the network crystals
structure can further toughening the PP2 foams. When the foaming temperature further increased, more
crystals melt which leads to the decrease of impact strength.
0
10
20
30
40
143
Impa
ct s
tren
gth,
KJ/
m2
Temperature, oC
140135125115PP4PP2
Fig. 4.14 Comparison of the impact strength of PP2 and PP4 with those of PP2 foamed under CO2
pressure of 15MPa and various temperatures.
4.5 Thermal properties of the iPP before and after foaming
Fig. 4.15 shows the DSC thermograms of skin and core layers and their foams obtained at 115, 125,
135, 140, 143 and 146oC, respectively. The saturation CO2 pressure is 15MPa. From Fig. 4.15, the
melting peaks of skin and core foams of 135, 140, 143, and 146oC are all shifted to higher temperatures
and a new shoulder peak is formed at lower temperatures, and the starting melting temperatures of skin
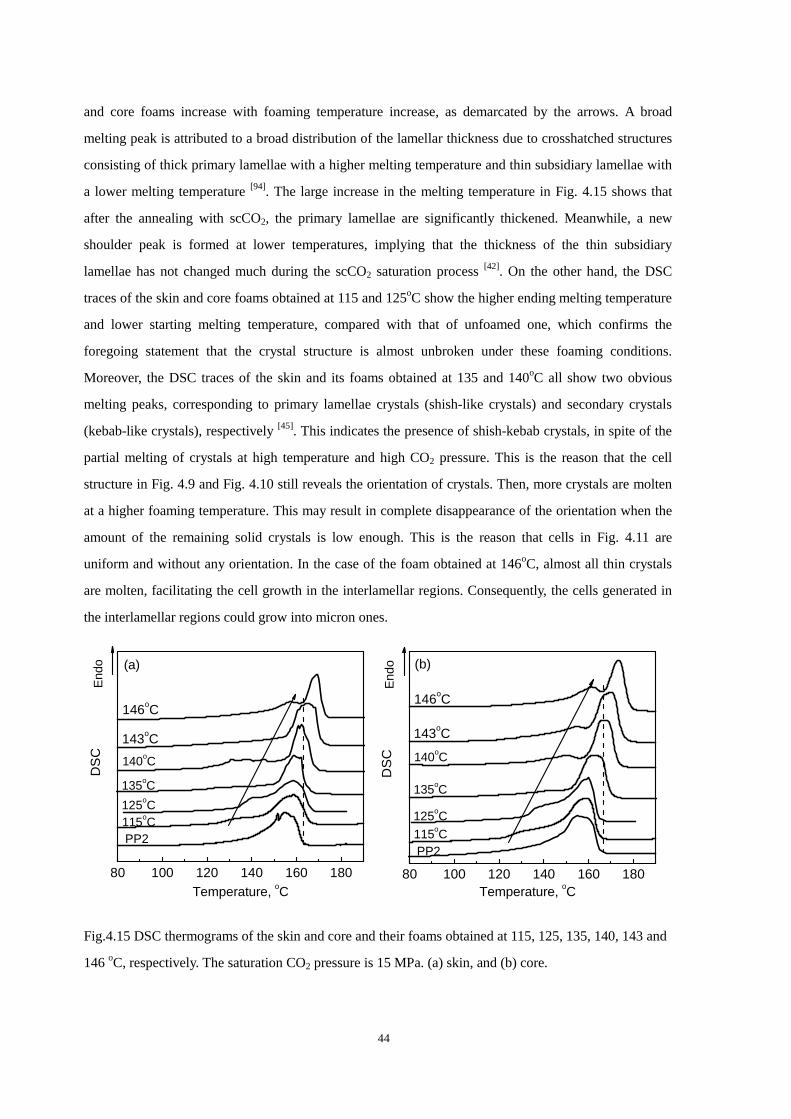
44
and core foams increase with foaming temperature increase, as demarcated by the arrows. A broad
melting peak is attributed to a broad distribution of the lamellar thickness due to crosshatched structures
consisting of thick primary lamellae with a higher melting temperature and thin subsidiary lamellae with
a lower melting temperature [94]. The large increase in the melting temperature in Fig. 4.15 shows that
after the annealing with scCO2, the primary lamellae are significantly thickened. Meanwhile, a new
shoulder peak is formed at lower temperatures, implying that the thickness of the thin subsidiary
lamellae has not changed much during the scCO2 saturation process [42]. On the other hand, the DSC
traces of the skin and core foams obtained at 115 and 125oC show the higher ending melting temperature
and lower starting melting temperature, compared with that of unfoamed one, which confirms the
foregoing statement that the crystal structure is almost unbroken under these foaming conditions.
Moreover, the DSC traces of the skin and its foams obtained at 135 and 140oC all show two obvious
melting peaks, corresponding to primary lamellae crystals (shish-like crystals) and secondary crystals
(kebab-like crystals), respectively [45]. This indicates the presence of shish-kebab crystals, in spite of the
partial melting of crystals at high temperature and high CO2 pressure. This is the reason that the cell
structure in Fig. 4.9 and Fig. 4.10 still reveals the orientation of crystals. Then, more crystals are molten
at a higher foaming temperature. This may result in complete disappearance of the orientation when the
amount of the remaining solid crystals is low enough. This is the reason that cells in Fig. 4.11 are
uniform and without any orientation. In the case of the foam obtained at 146oC, almost all thin crystals
are molten, facilitating the cell growth in the interlamellar regions. Consequently, the cells generated in
the interlamellar regions could grow into micron ones.
80 100 120 140 160 180
Temperature, oC
DS
CE
ndo
PP2115oC 125oC
143oC
146oC
140oC
135oC
(a)
80 100 120 140 160 180Temperature, oC
DS
CE
ndo
PP2115oC
125oC
143oC
146oC
140oC
135oC
(b)
Fig.4.15 DSC thermograms of the skin and core and their foams obtained at 115, 125, 135, 140, 143 and
146 oC, respectively. The saturation CO2 pressure is 15 MPa. (a) skin, and (b) core.
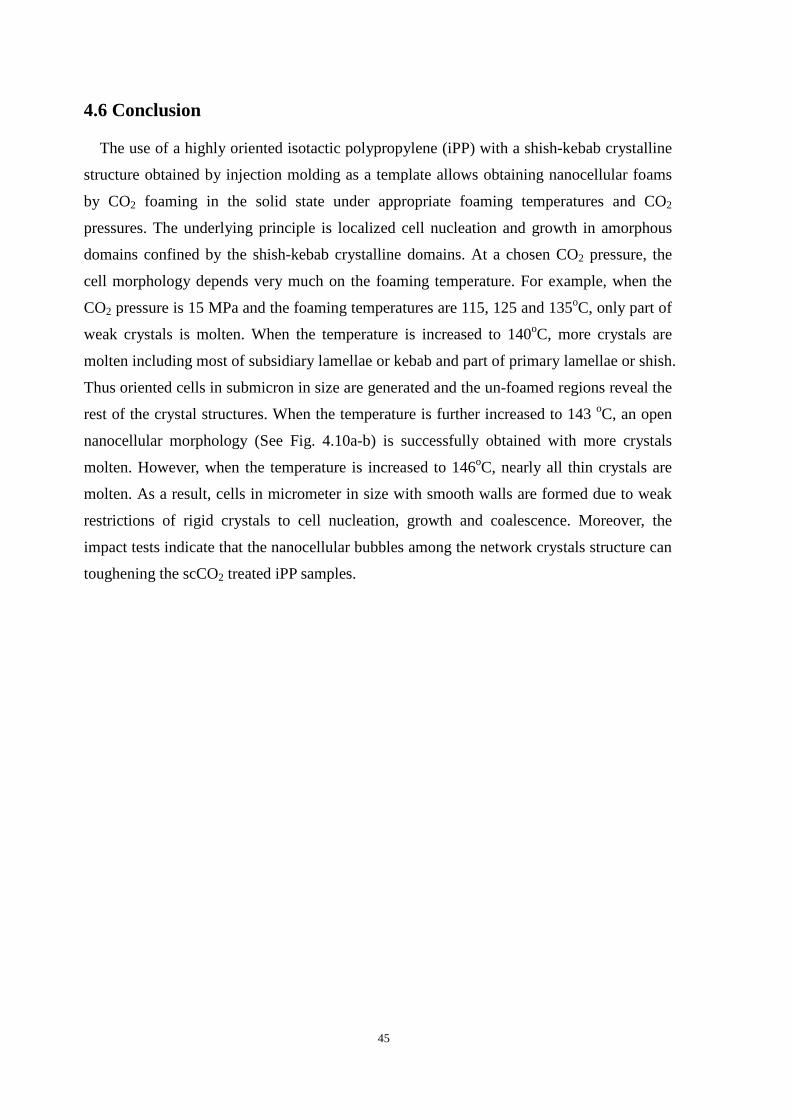
45
4.6 Conclusion
The use of a highly oriented isotactic polypropylene (iPP) with a shish-kebab crystalline
structure obtained by injection molding as a template allows obtaining nanocellular foams
by CO2 foaming in the solid state under appropriate foaming temperatures and CO2
pressures. The underlying principle is localized cell nucleation and growth in amorphous
domains confined by the shish-kebab crystalline domains. At a chosen CO2 pressure, the
cell morphology depends very much on the foaming temperature. For example, when the
CO2 pressure is 15 MPa and the foaming temperatures are 115, 125 and 135oC, only part of
weak crystals is molten. When the temperature is increased to 140oC, more crystals are
molten including most of subsidiary lamellae or kebab and part of primary lamellae or shish.
Thus oriented cells in submicron in size are generated and the un-foamed regions reveal the
rest of the crystal structures. When the temperature is further increased to 143 oC, an open
nanocellular morphology (See Fig. 4.10a-b) is successfully obtained with more crystals
molten. However, when the temperature is increased to 146oC, nearly all thin crystals are
molten. As a result, cells in micrometer in size with smooth walls are formed due to weak
restrictions of rigid crystals to cell nucleation, growth and coalescence. Moreover, the
impact tests indicate that the nanocellular bubbles among the network crystals structure can
toughening the scCO2 treated iPP samples.
46
Chapter 5 Oriented Foaming of Polystyrene for Toughening
5.1 Introduction
The use of substantial volume fraction of extremely small rubber particles blended in
polymer matrix is a well known technique for toughening of polymers. Since the
toughening mechanisms start with rubber particle cavitation in order to relieve the triaxial
stress state, the question has been raised many times of whether microbubbles could be
substituted for the rubber particles. This idea of using microbubbles in order to toughen
plastics was first implemented by Martini et. al.[15, 16] and the resulting structure was called
microcellular foam.
In the past decade, efforts have been made to investigate the influence of processing
conditions and the nature of polymers on the final cell morphologies of microcellular foams [51-54]. In addition, many researchers have investigated the relationship between the
mechanical properties and the cell structures [59-63]. Results have shown that unlike
conventional foams, with typically large variations in properties, microcellular foams
exhibit consistent and improved tensile properties in systems such as polycarbonate (PC),
polyethylene terephthalate (PET), and polyvinyl chloride (PVC) [60-62]. For instance, the
tensile properties of microcellular PC foams reduce proportionally with the relative density,
where relative density refers to the ratio of the density of the foam relative to that of the
unfoamed one. On the other hand, the effect of cell morphologies on impact strength of
microcellular foams has been studied in several polymer systems and the results have been
mixed. Waldman [63] studied the impact strength of microcellular PS foams and found a
greater impact strength for microcellular foams compared with that of unfoamed one.
Collias and Baird [64] investigated the impact behavior of microcellular PS foams, and
found no improvement in the impact strength of foamed samples compared to neat
polymers. Moreover, Barlow et al. [65] studied the PC foams and found that the impact
toughness of foams is improved within the microcellular range by increasing the average
cell size. Doroudiani et al. [66] studied the cell size effects in PS and fould no change in
impact strength by varying cell size with the microcellular range.
Besides, many unique cell structures were achieved for unique mechanical properties.
Kelyn et al. prepared PS foams with oriented, bimodal cell structures and investigated the
corresponding compressive behavior [95]. Miller and Kumar compared the tensile and
impact behaviors of microcellular and nanocellular polyetherimide (PEI) foams with
various relative densities, to that of unfoamed one, and found that nanofoams showed a
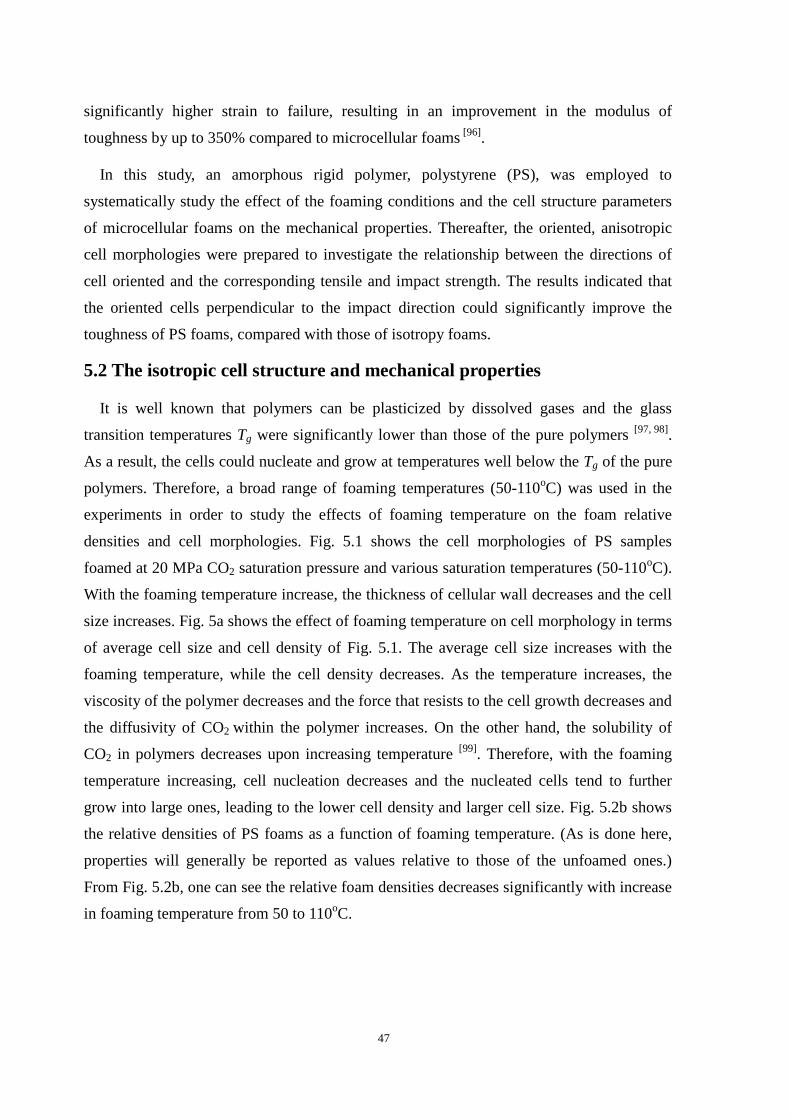
47
significantly higher strain to failure, resulting in an improvement in the modulus of
toughness by up to 350% compared to microcellular foams [96].
In this study, an amorphous rigid polymer, polystyrene (PS), was employed to
systematically study the effect of the foaming conditions and the cell structure parameters
of microcellular foams on the mechanical properties. Thereafter, the oriented, anisotropic
cell morphologies were prepared to investigate the relationship between the directions of
cell oriented and the corresponding tensile and impact strength. The results indicated that
the oriented cells perpendicular to the impact direction could significantly improve the
toughness of PS foams, compared with those of isotropy foams.
5.2 The isotropic cell structure and mechanical properties
It is well known that polymers can be plasticized by dissolved gases and the glass
transition temperatures Tg were significantly lower than those of the pure polymers [97, 98].
As a result, the cells could nucleate and grow at temperatures well below the Tg of the pure
polymers. Therefore, a broad range of foaming temperatures (50-110oC) was used in the
experiments in order to study the effects of foaming temperature on the foam relative
densities and cell morphologies. Fig. 5.1 shows the cell morphologies of PS samples
foamed at 20 MPa CO2 saturation pressure and various saturation temperatures (50-110oC).
With the foaming temperature increase, the thickness of cellular wall decreases and the cell
size increases. Fig. 5a shows the effect of foaming temperature on cell morphology in terms
of average cell size and cell density of Fig. 5.1. The average cell size increases with the
foaming temperature, while the cell density decreases. As the temperature increases, the
viscosity of the polymer decreases and the force that resists to the cell growth decreases and
the diffusivity of CO2 within the polymer increases. On the other hand, the solubility of
CO2 in polymers decreases upon increasing temperature [99]. Therefore, with the foaming
temperature increasing, cell nucleation decreases and the nucleated cells tend to further
grow into large ones, leading to the lower cell density and larger cell size. Fig. 5.2b shows
the relative densities of PS foams as a function of foaming temperature. (As is done here,
properties will generally be reported as values relative to those of the unfoamed ones.)
From Fig. 5.2b, one can see the relative foam densities decreases significantly with increase
in foaming temperature from 50 to 110oC.
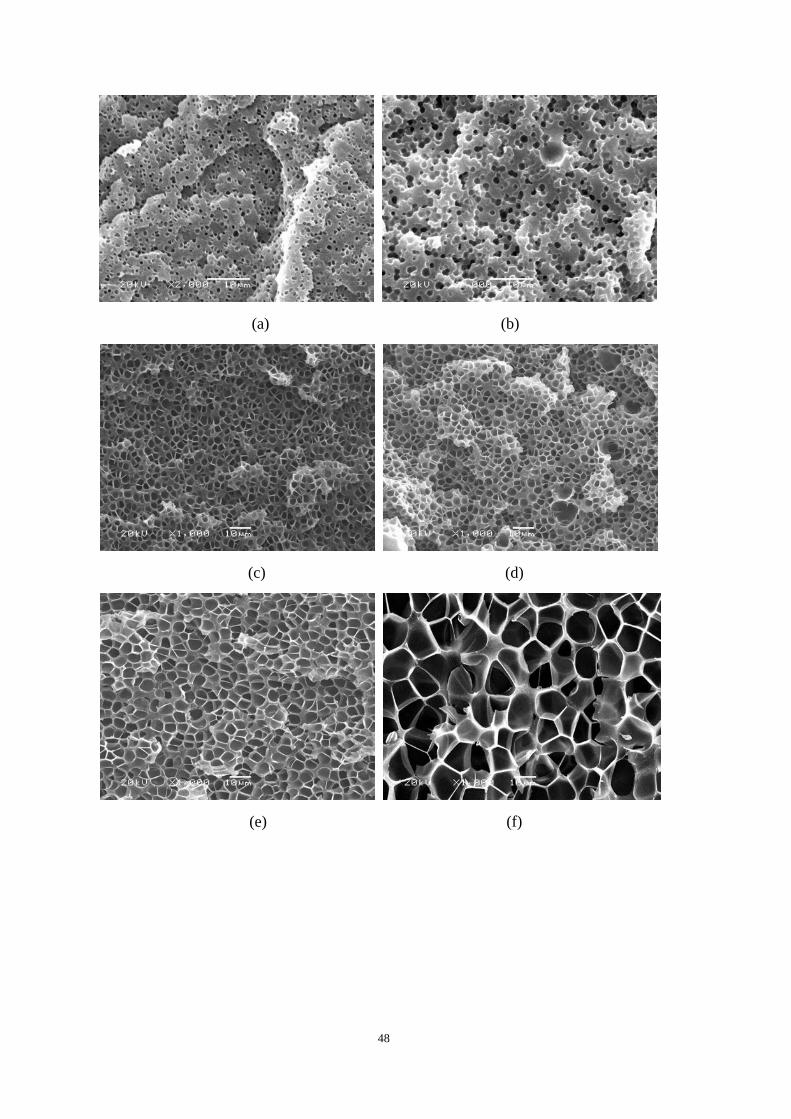
48
(a) (b)
(c) (d)
(e) (f)
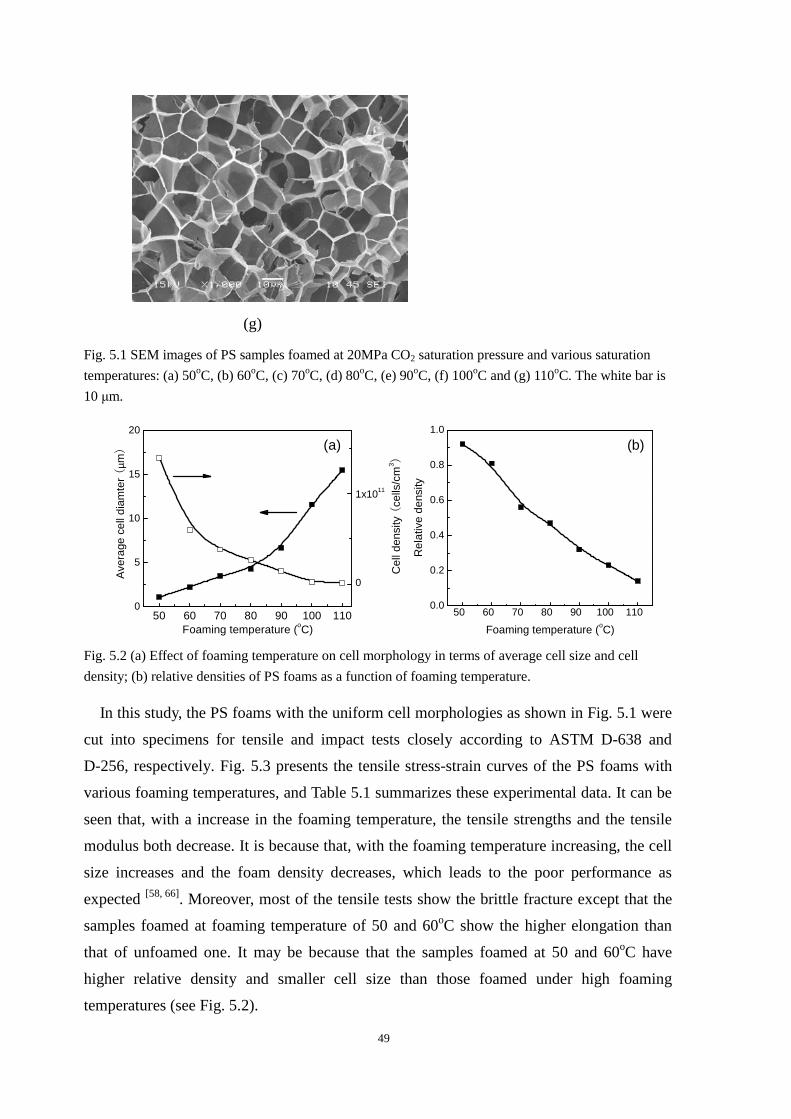
49
(g)
Fig. 5.1 SEM images of PS samples foamed at 20MPa CO2 saturation pressure and various saturation
temperatures: (a) 50oC, (b) 60oC, (c) 70oC, (d) 80oC, (e) 90oC, (f) 100oC and (g) 110oC. The white bar is
10 µm.
50 60 70 80 90 100 1100
5
10
15
20
Foaming temperature (oC)
Ave
rage
cel
l dia
mte
r (
µm)
0
1x10¹¹
Cel
l den
sity
(ce
lls/c
m3 )
(a)
50 60 70 80 90 100 1100.0
0.2
0.4
0.6
0.8
1.0
R
elat
ive
dens
ity
Foaming temperature (oC)
(b)
Fig. 5.2 (a) Effect of foaming temperature on cell morphology in terms of average cell size and cell
density; (b) relative densities of PS foams as a function of foaming temperature.
In this study, the PS foams with the uniform cell morphologies as shown in Fig. 5.1 were
cut into specimens for tensile and impact tests closely according to ASTM D-638 and
D-256, respectively. Fig. 5.3 presents the tensile stress-strain curves of the PS foams with
various foaming temperatures, and Table 5.1 summarizes these experimental data. It can be
seen that, with a increase in the foaming temperature, the tensile strengths and the tensile
modulus both decrease. It is because that, with the foaming temperature increasing, the cell
size increases and the foam density decreases, which leads to the poor performance as
expected [58, 66]. Moreover, most of the tensile tests show the brittle fracture except that the
samples foamed at foaming temperature of 50 and 60oC show the higher elongation than
that of unfoamed one. It may be because that the samples foamed at 50 and 60oC have
higher relative density and smaller cell size than those foamed under high foaming
temperatures (see Fig. 5.2).
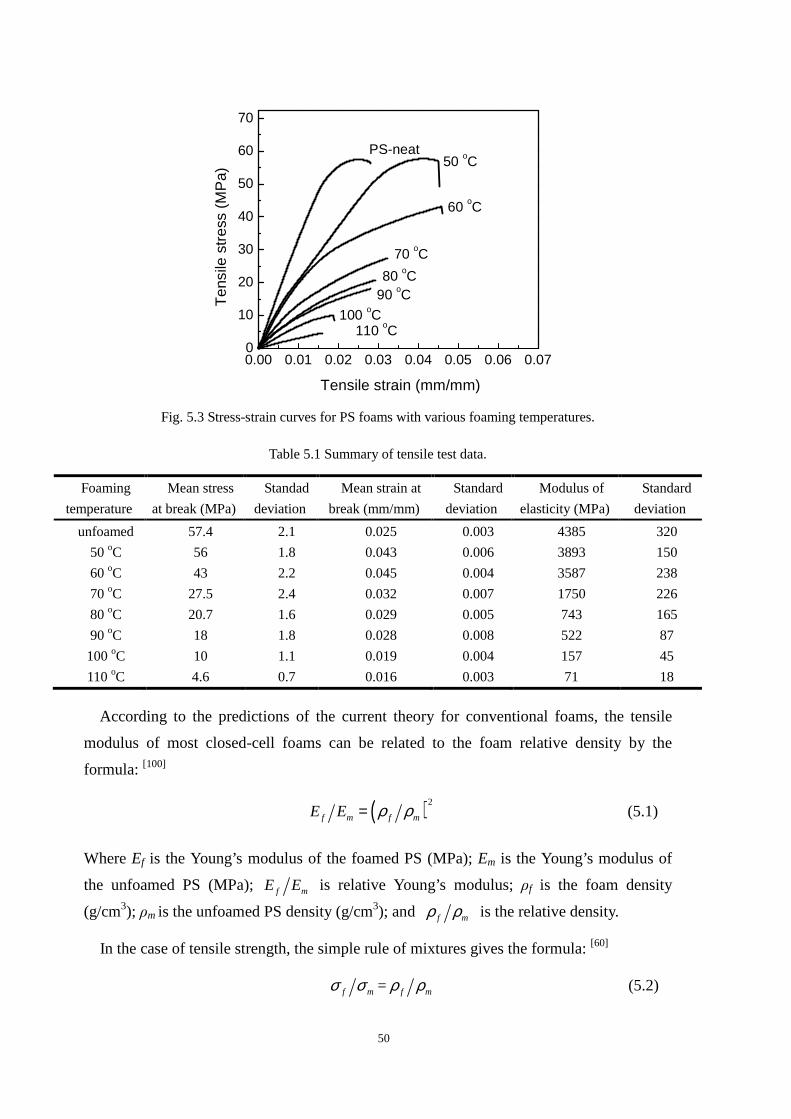
50
0.00 0.01 0.02 0.03 0.04 0.05 0.06 0.070
10
20
30
40
50
60
70
110 oC100 oC
90 oC80 oC
70 oC
60 oC
50 oCPS-neat
Ten
sile
str
ess
(MP
a)
Tensile strain (mm/mm)
Fig. 5.3 Stress-strain curves for PS foams with various foaming temperatures.
Table 5.1 Summary of tensile test data.
Foaming
temperature
Mean stress
at break (MPa)
Standad
deviation
Mean strain at
break (mm/mm)
Standard
deviation
Modulus of
elasticity (MPa)
Standard
deviation
unfoamed 57.4 2.1 0.025 0.003 4385 320
50 oC 56 1.8 0.043 0.006 3893 150
60 oC 43 2.2 0.045 0.004 3587 238
70 oC 27.5 2.4 0.032 0.007 1750 226
80 oC 20.7 1.6 0.029 0.005 743 165
90 oC 18 1.8 0.028 0.008 522 87
100 oC 10 1.1 0.019 0.004 157 45
110 oC 4.6 0.7 0.016 0.003 71 18
According to the predictions of the current theory for conventional foams, the tensile
modulus of most closed-cell foams can be related to the foam relative density by the
formula: [100]
( )2
f m f mE E ρ ρ= (5.1)
Where Ef is the Young’s modulus of the foamed PS (MPa); Em is the Young’s modulus of
the unfoamed PS (MPa); f mE E is relative Young’s modulus; ρf is the foam density
(g/cm3); ρm is the unfoamed PS density (g/cm3); and f mρ ρ is the relative density.
In the case of tensile strength, the simple rule of mixtures gives the formula: [60]
=f m f mσ σ ρ ρ (5.2)
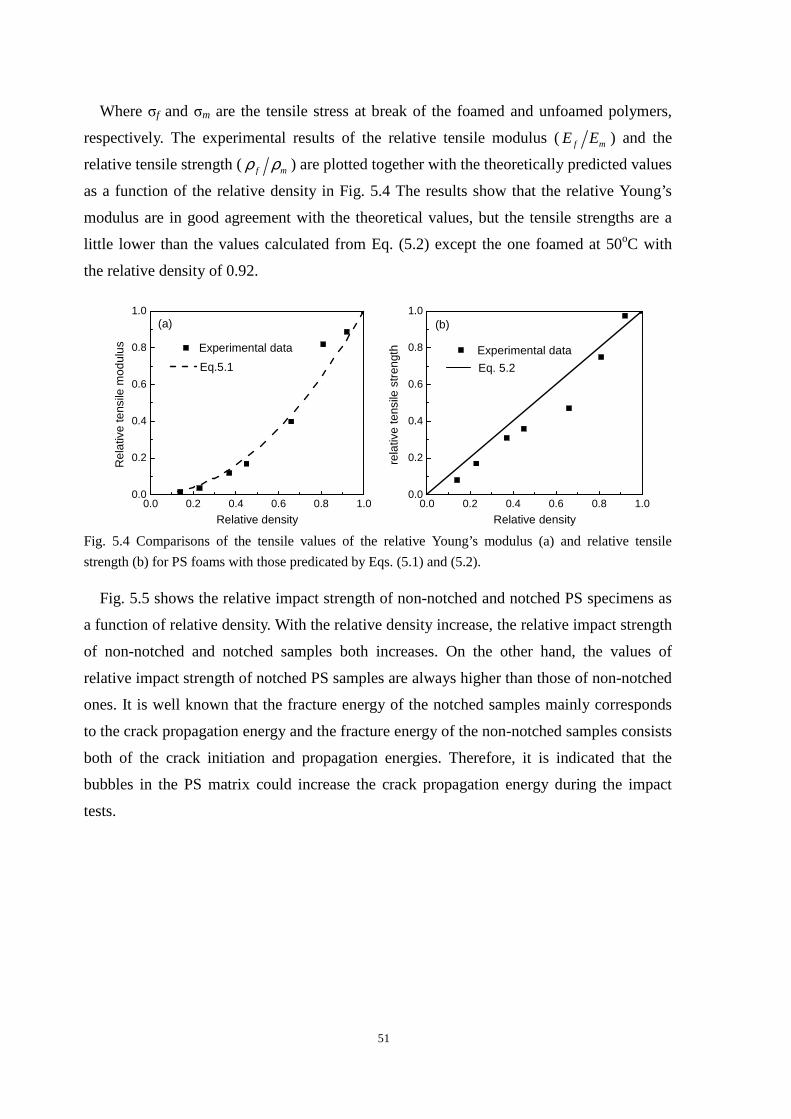
51
Where σf and σm are the tensile stress at break of the foamed and unfoamed polymers,
respectively. The experimental results of the relative tensile modulus (f mE E ) and the
relative tensile strength (f mρ ρ ) are plotted together with the theoretically predicted values
as a function of the relative density in Fig. 5.4 The results show that the relative Young’s
modulus are in good agreement with the theoretical values, but the tensile strengths are a
little lower than the values calculated from Eq. (5.2) except the one foamed at 50oC with
the relative density of 0.92.
0.0 0.2 0.4 0.6 0.8 1.00.0
0.2
0.4
0.6
0.8
1.0
Experimental data
Rel
ativ
e te
nsile
mod
ulus
Relative density
Eq.5.1
(a)
0.0 0.2 0.4 0.6 0.8 1.00.0
0.2
0.4
0.6
0.8
1.0
rela
tive
tens
ile s
tren
gth
Relative density
(b)
Experimental data
Eq. 5.2
Fig. 5.4 Comparisons of the tensile values of the relative Young’s modulus (a) and relative tensile
strength (b) for PS foams with those predicated by Eqs. (5.1) and (5.2).
Fig. 5.5 shows the relative impact strength of non-notched and notched PS specimens as
a function of relative density. With the relative density increase, the relative impact strength
of non-notched and notched samples both increases. On the other hand, the values of
relative impact strength of notched PS samples are always higher than those of non-notched
ones. It is well known that the fracture energy of the notched samples mainly corresponds
to the crack propagation energy and the fracture energy of the non-notched samples consists
both of the crack initiation and propagation energies. Therefore, it is indicated that the
bubbles in the PS matrix could increase the crack propagation energy during the impact
tests.
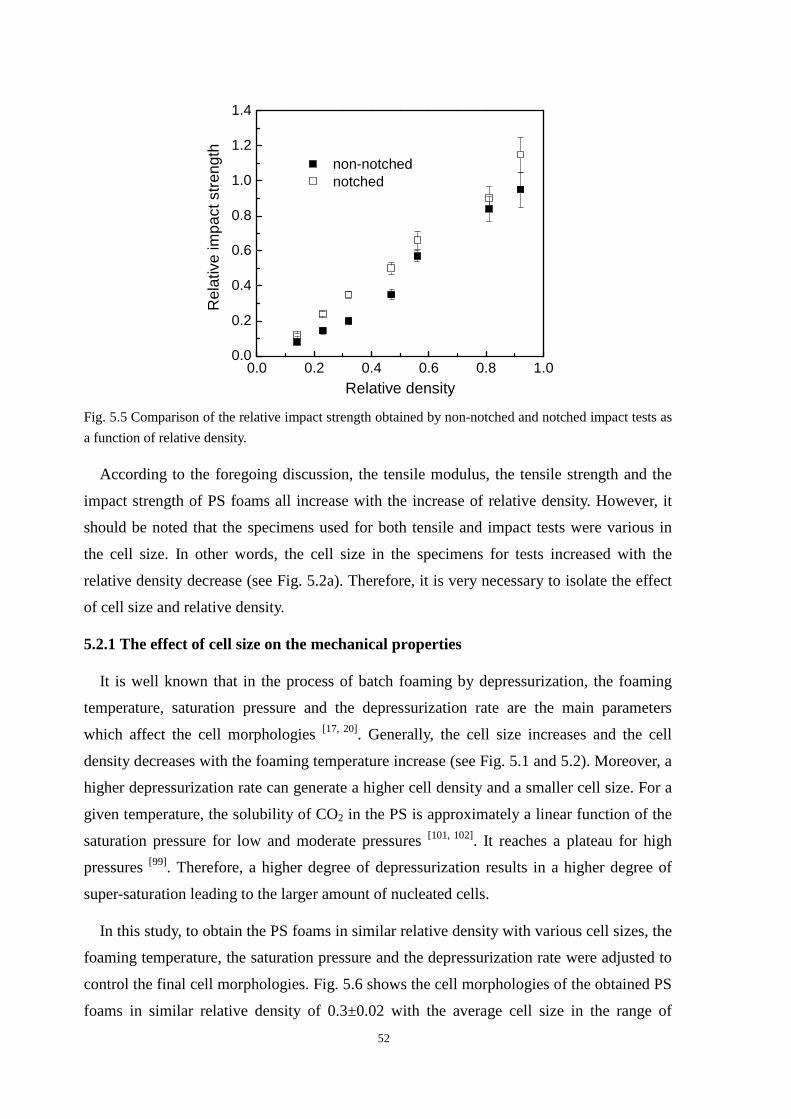
52
0.0 0.2 0.4 0.6 0.8 1.00.0
0.2
0.4
0.6
0.8
1.0
1.2
1.4
non-notched notched
Rel
ativ
e im
pact
str
engt
h
Relative density
Fig. 5.5 Comparison of the relative impact strength obtained by non-notched and notched impact tests as
a function of relative density.
According to the foregoing discussion, the tensile modulus, the tensile strength and the
impact strength of PS foams all increase with the increase of relative density. However, it
should be noted that the specimens used for both tensile and impact tests were various in
the cell size. In other words, the cell size in the specimens for tests increased with the
relative density decrease (see Fig. 5.2a). Therefore, it is very necessary to isolate the effect
of cell size and relative density.
5.2.1 The effect of cell size on the mechanical properties
It is well known that in the process of batch foaming by depressurization, the foaming
temperature, saturation pressure and the depressurization rate are the main parameters
which affect the cell morphologies [17, 20]. Generally, the cell size increases and the cell
density decreases with the foaming temperature increase (see Fig. 5.1 and 5.2). Moreover, a
higher depressurization rate can generate a higher cell density and a smaller cell size. For a
given temperature, the solubility of CO2 in the PS is approximately a linear function of the
saturation pressure for low and moderate pressures [101, 102]. It reaches a plateau for high
pressures [99]. Therefore, a higher degree of depressurization results in a higher degree of
super-saturation leading to the larger amount of nucleated cells.
In this study, to obtain the PS foams in similar relative density with various cell sizes, the
foaming temperature, the saturation pressure and the depressurization rate were adjusted to
control the final cell morphologies. Fig. 5.6 shows the cell morphologies of the obtained PS
foams in similar relative density of 0.3±0.02 with the average cell size in the range of
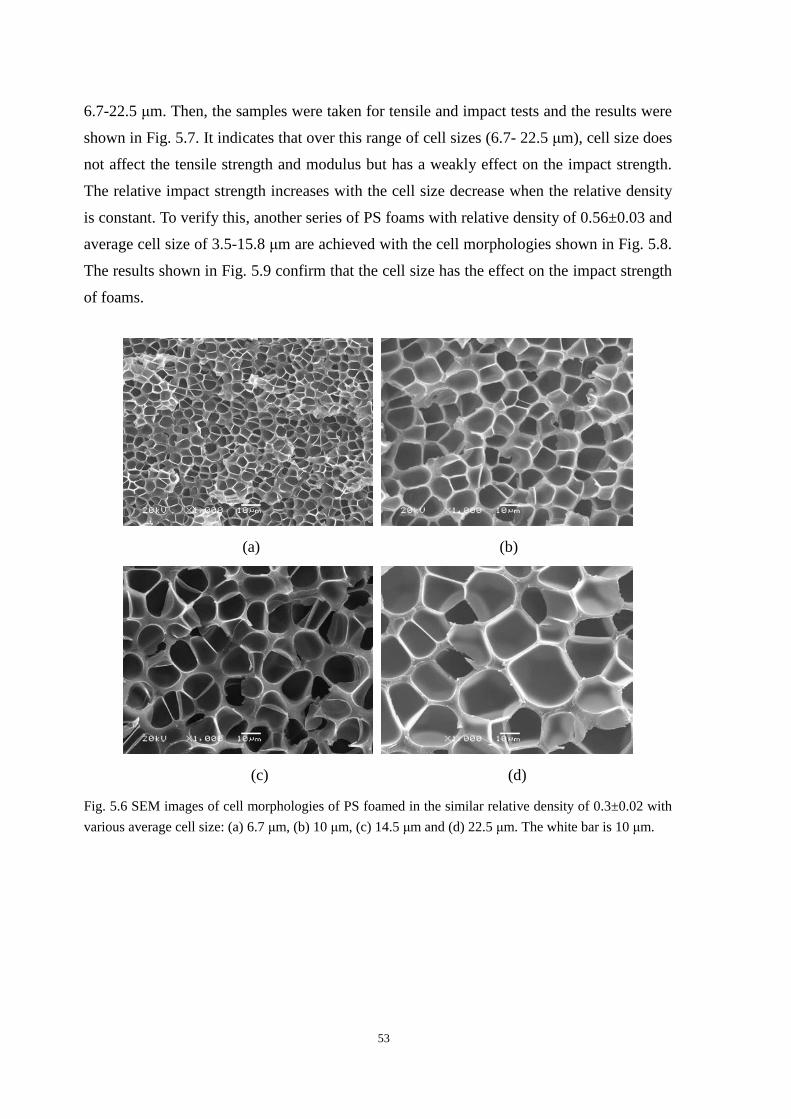
53
6.7-22.5 µm. Then, the samples were taken for tensile and impact tests and the results were
shown in Fig. 5.7. It indicates that over this range of cell sizes (6.7- 22.5 µm), cell size does
not affect the tensile strength and modulus but has a weakly effect on the impact strength.
The relative impact strength increases with the cell size decrease when the relative density
is constant. To verify this, another series of PS foams with relative density of 0.56±0.03 and
average cell size of 3.5-15.8 µm are achieved with the cell morphologies shown in Fig. 5.8.
The results shown in Fig. 5.9 confirm that the cell size has the effect on the impact strength
of foams.
(a) (b)
(c) (d)
Fig. 5.6 SEM images of cell morphologies of PS foamed in the similar relative density of 0.3±0.02 with
various average cell size: (a) 6.7 µm, (b) 10 µm, (c) 14.5 µm and (d) 22.5 µm. The white bar is 10 µm.
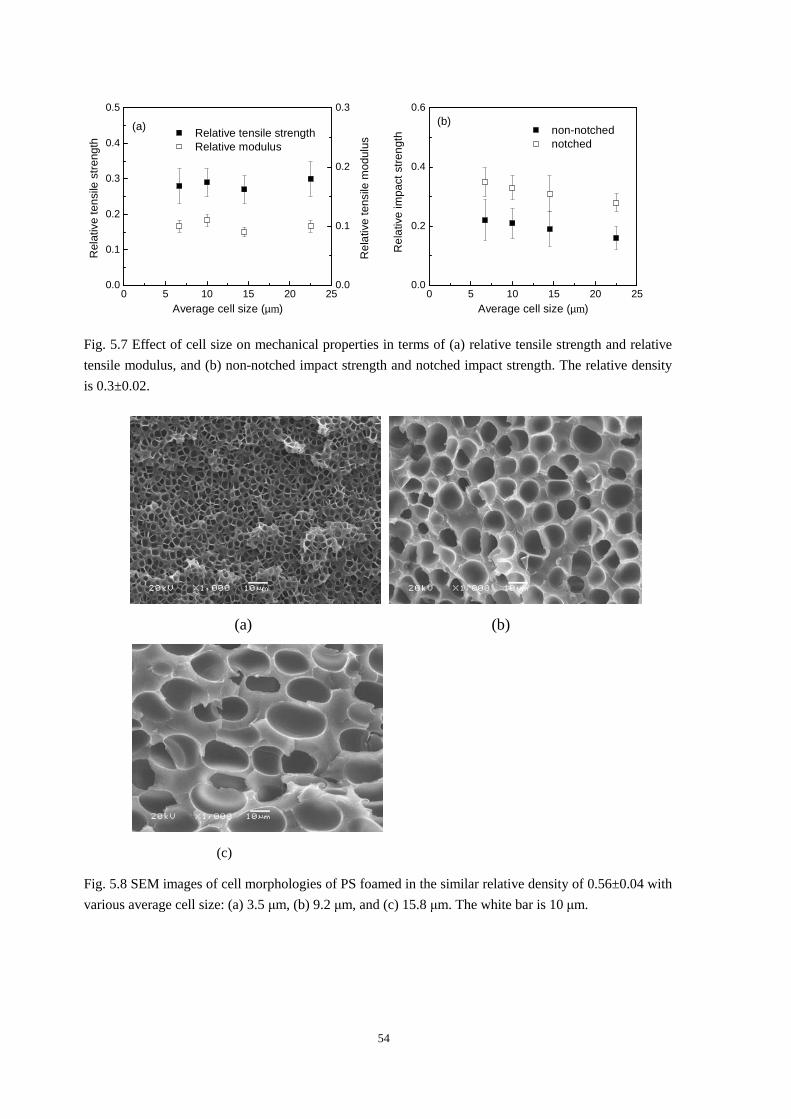
54
0 5 10 15 20 250.0
0.1
0.2
0.3
0.4
0.5
Relative tensile strength Relative modulus
Average cell size (µm)
Rel
ativ
e te
nsile
str
engt
h
(a)
0.0
0.1
0.2
0.3
Rel
ativ
e te
nsile
mod
ulus
0 5 10 15 20 250.0
0.2
0.4
0.6
non-notched notched
Rel
ativ
e im
pact
str
engt
h
Average cell size (µm)
(b)
Fig. 5.7 Effect of cell size on mechanical properties in terms of (a) relative tensile strength and relative
tensile modulus, and (b) non-notched impact strength and notched impact strength. The relative density
is 0.3±0.02.
(a) (b)
(c)
Fig. 5.8 SEM images of cell morphologies of PS foamed in the similar relative density of 0.56±0.04 with
various average cell size: (a) 3.5 µm, (b) 9.2 µm, and (c) 15.8 µm. The white bar is 10 µm.
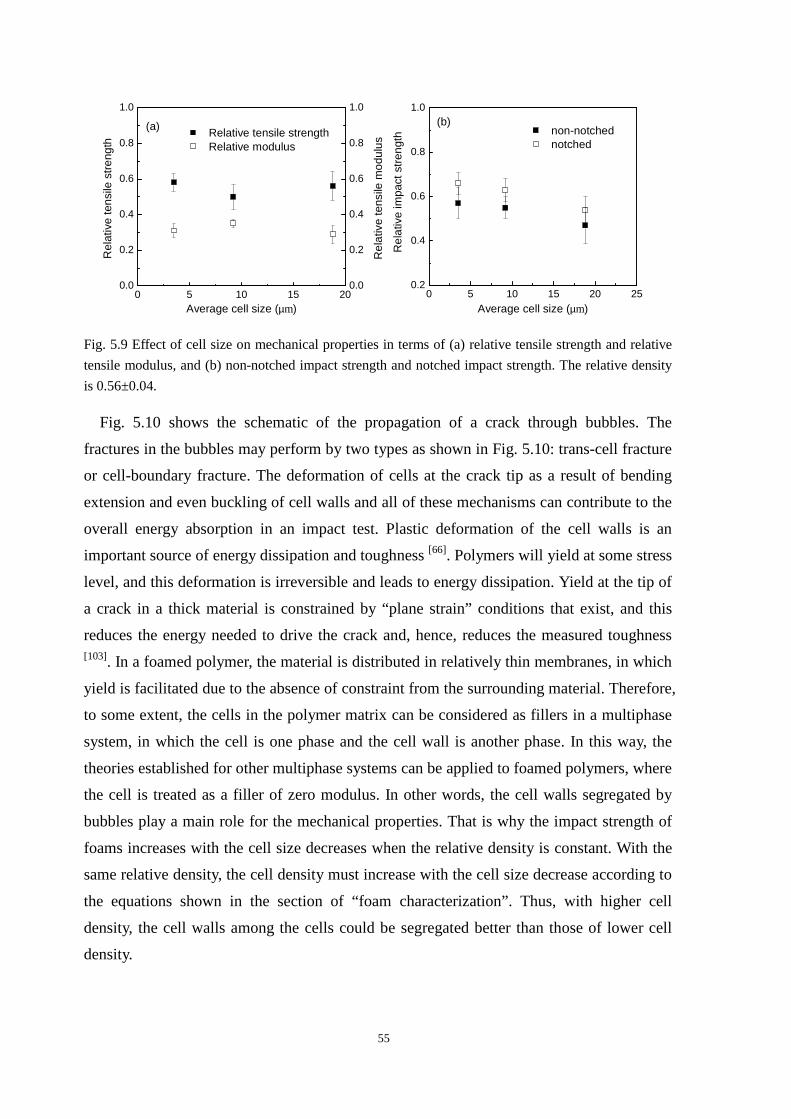
55
0 5 10 15 200.0
0.2
0.4
0.6
0.8
1.0
Relative tensile strength Relative modulus
Average cell size (µm)
Rel
ativ
e te
nsile
str
engt
h
(a)
0.0
0.2
0.4
0.6
0.8
1.0
Rel
ativ
e te
nsile
mod
ulus
0 5 10 15 20 250.2
0.4
0.6
0.8
1.0
non-notched notched
Rel
ativ
e im
pact
str
engt
h
Average cell size (µm)
(b)
Fig. 5.9 Effect of cell size on mechanical properties in terms of (a) relative tensile strength and relative
tensile modulus, and (b) non-notched impact strength and notched impact strength. The relative density
is 0.56±0.04.
Fig. 5.10 shows the schematic of the propagation of a crack through bubbles. The
fractures in the bubbles may perform by two types as shown in Fig. 5.10: trans-cell fracture
or cell-boundary fracture. The deformation of cells at the crack tip as a result of bending
extension and even buckling of cell walls and all of these mechanisms can contribute to the
overall energy absorption in an impact test. Plastic deformation of the cell walls is an
important source of energy dissipation and toughness [66]. Polymers will yield at some stress
level, and this deformation is irreversible and leads to energy dissipation. Yield at the tip of
a crack in a thick material is constrained by “plane strain” conditions that exist, and this
reduces the energy needed to drive the crack and, hence, reduces the measured toughness [103]. In a foamed polymer, the material is distributed in relatively thin membranes, in which
yield is facilitated due to the absence of constraint from the surrounding material. Therefore,
to some extent, the cells in the polymer matrix can be considered as fillers in a multiphase
system, in which the cell is one phase and the cell wall is another phase. In this way, the
theories established for other multiphase systems can be applied to foamed polymers, where
the cell is treated as a filler of zero modulus. In other words, the cell walls segregated by
bubbles play a main role for the mechanical properties. That is why the impact strength of
foams increases with the cell size decreases when the relative density is constant. With the
same relative density, the cell density must increase with the cell size decrease according to
the equations shown in the section of “foam characterization”. Thus, with higher cell
density, the cell walls among the cells could be segregated better than those of lower cell
density.
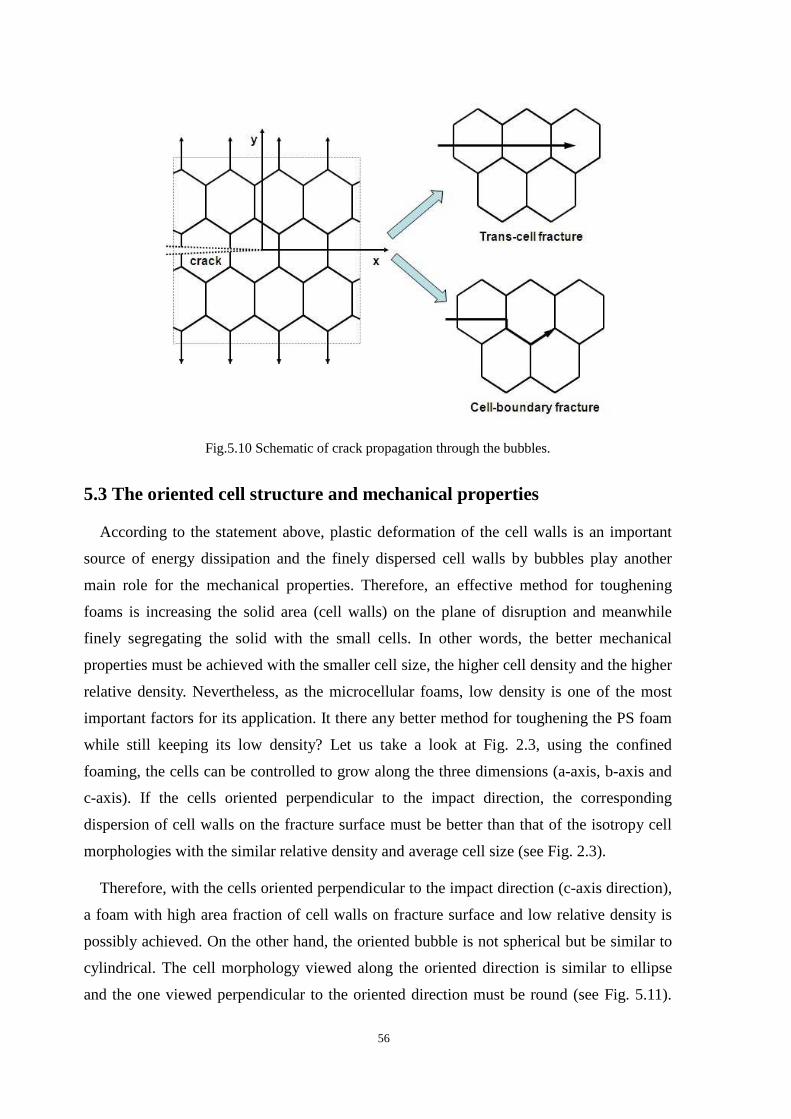
56
Fig.5.10 Schematic of crack propagation through the bubbles.
5.3 The oriented cell structure and mechanical properties
According to the statement above, plastic deformation of the cell walls is an important
source of energy dissipation and the finely dispersed cell walls by bubbles play another
main role for the mechanical properties. Therefore, an effective method for toughening
foams is increasing the solid area (cell walls) on the plane of disruption and meanwhile
finely segregating the solid with the small cells. In other words, the better mechanical
properties must be achieved with the smaller cell size, the higher cell density and the higher
relative density. Nevertheless, as the microcellular foams, low density is one of the most
important factors for its application. It there any better method for toughening the PS foam
while still keeping its low density? Let us take a look at Fig. 2.3, using the confined
foaming, the cells can be controlled to grow along the three dimensions (a-axis, b-axis and
c-axis). If the cells oriented perpendicular to the impact direction, the corresponding
dispersion of cell walls on the fracture surface must be better than that of the isotropy cell
morphologies with the similar relative density and average cell size (see Fig. 2.3).
Therefore, with the cells oriented perpendicular to the impact direction (c-axis direction),
a foam with high area fraction of cell walls on fracture surface and low relative density is
possibly achieved. On the other hand, the oriented bubble is not spherical but be similar to
cylindrical. The cell morphology viewed along the oriented direction is similar to ellipse
and the one viewed perpendicular to the oriented direction must be round (see Fig. 5.11).
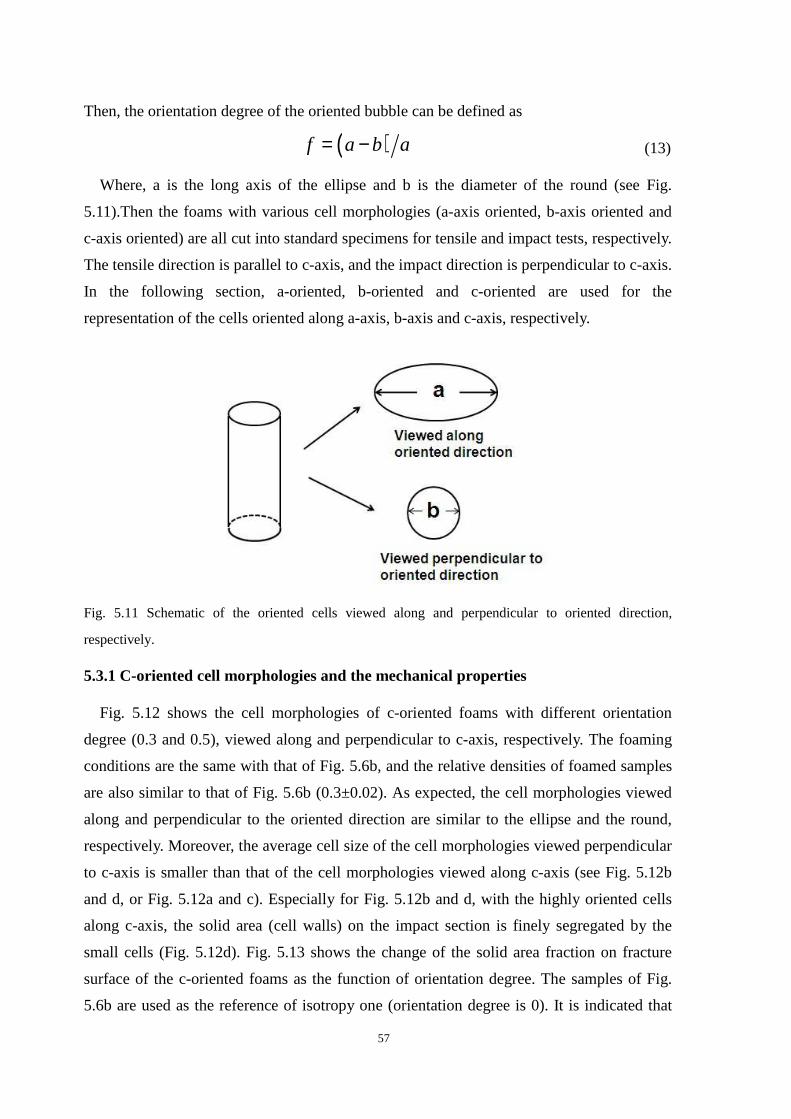
57
Then, the orientation degree of the oriented bubble can be defined as
( )f a b a= − (13)
Where, a is the long axis of the ellipse and b is the diameter of the round (see Fig.
5.11).Then the foams with various cell morphologies (a-axis oriented, b-axis oriented and
c-axis oriented) are all cut into standard specimens for tensile and impact tests, respectively.
The tensile direction is parallel to c-axis, and the impact direction is perpendicular to c-axis.
In the following section, a-oriented, b-oriented and c-oriented are used for the
representation of the cells oriented along a-axis, b-axis and c-axis, respectively.
Fig. 5.11 Schematic of the oriented cells viewed along and perpendicular to oriented direction,
respectively.
5.3.1 C-oriented cell morphologies and the mechanical properties
Fig. 5.12 shows the cell morphologies of c-oriented foams with different orientation
degree (0.3 and 0.5), viewed along and perpendicular to c-axis, respectively. The foaming
conditions are the same with that of Fig. 5.6b, and the relative densities of foamed samples
are also similar to that of Fig. 5.6b (0.3±0.02). As expected, the cell morphologies viewed
along and perpendicular to the oriented direction are similar to the ellipse and the round,
respectively. Moreover, the average cell size of the cell morphologies viewed perpendicular
to c-axis is smaller than that of the cell morphologies viewed along c-axis (see Fig. 5.12b
and d, or Fig. 5.12a and c). Especially for Fig. 5.12b and d, with the highly oriented cells
along c-axis, the solid area (cell walls) on the impact section is finely segregated by the
small cells (Fig. 5.12d). Fig. 5.13 shows the change of the solid area fraction on fracture
surface of the c-oriented foams as the function of orientation degree. The samples of Fig.
5.6b are used as the reference of isotropy one (orientation degree is 0). It is indicated that
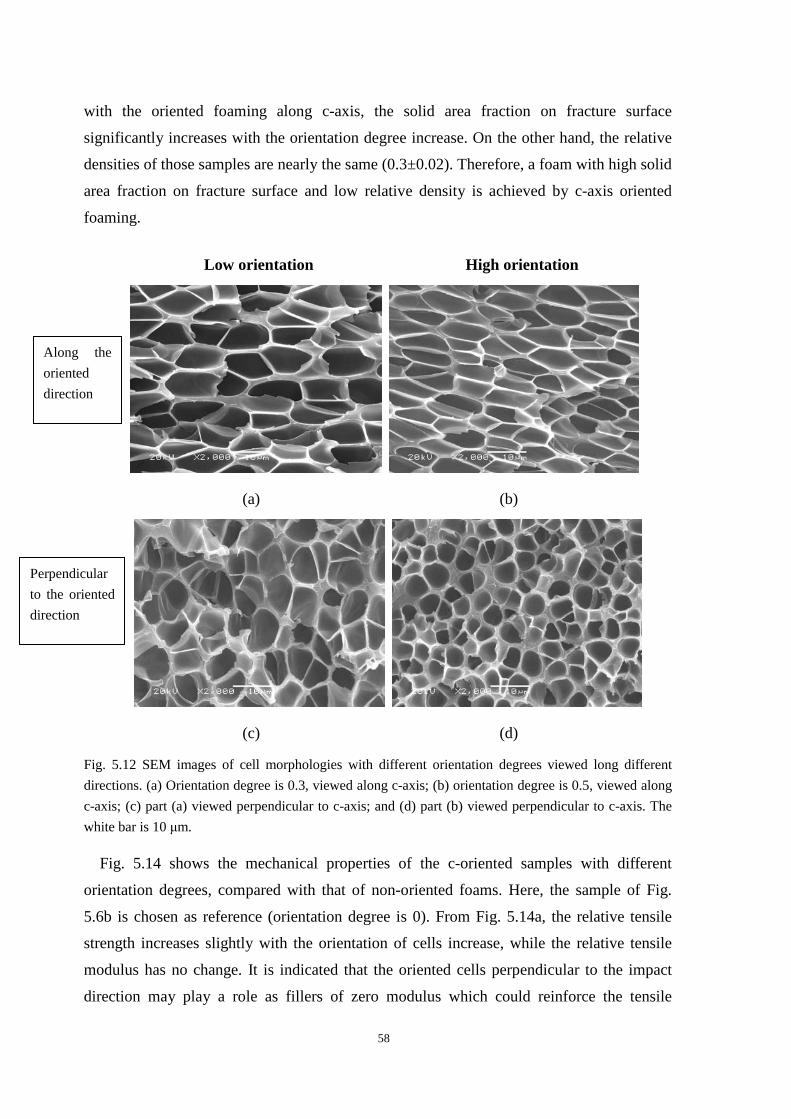
58
with the oriented foaming along c-axis, the solid area fraction on fracture surface
significantly increases with the orientation degree increase. On the other hand, the relative
densities of those samples are nearly the same (0.3±0.02). Therefore, a foam with high solid
area fraction on fracture surface and low relative density is achieved by c-axis oriented
foaming.
Low orientation High orientation
(a) (b)
(c) (d)
Fig. 5.12 SEM images of cell morphologies with different orientation degrees viewed long different
directions. (a) Orientation degree is 0.3, viewed along c-axis; (b) orientation degree is 0.5, viewed along
c-axis; (c) part (a) viewed perpendicular to c-axis; and (d) part (b) viewed perpendicular to c-axis. The
white bar is 10 µm.
Fig. 5.14 shows the mechanical properties of the c-oriented samples with different
orientation degrees, compared with that of non-oriented foams. Here, the sample of Fig.
5.6b is chosen as reference (orientation degree is 0). From Fig. 5.14a, the relative tensile
strength increases slightly with the orientation of cells increase, while the relative tensile
modulus has no change. It is indicated that the oriented cells perpendicular to the impact
direction may play a role as fillers of zero modulus which could reinforce the tensile
Along the
oriented
direction
Perpendicular
to the oriented
direction

59
strength more or less. On the other hand, from Fig. 5.14b, both the notched and
non-notched relative impact strengths significantly increase with the orientation of cells
increase. The results confirm the foregoing assumption that the oriented cell morphologies
perpendicular to the impact direction with high solid area fraction on fracture surface, could
successfully toughen the PS foam while still keeping its low density. Moreover, the notched
relative impact strengths are always higher than those of non-notched ones, which further
verifies the foregoing conclusion that the bubbles in the PS matrix could increase the crack
propagation energy during the impact process.
0.0 0.1 0.2 0.3 0.4 0.5
0.45
0.50
0.55
0.60
0.65
0.70
0.75
Sol
id a
rea
frac
tion
on fr
actu
re-s
urfa
ce
Orientation degree
Fig. 5.13 The change of solid area fraction on fracture-surface of the c-oriented foams as the function of
orientation degree. The sample of Fig. 5.9b is chosen as the reference of isotropy one (orientation degree
is 0).
0.0 0.2 0.4 0.60.0
0.1
0.2
0.3
0.4
0.5
0.6
Relative tensile strength Relative modulus
Orientation degree
Rel
ativ
e te
nsile
str
engt
h
(a)
0.0
0.1
0.2
0.3
0.4
Rel
ativ
e te
nsile
mod
ulus
0.0 0.2 0.4 0.60.0
0.5
1.0
1.5
2.0
non-notched notched
Rel
ativ
e im
pact
str
engt
h
Orientation degree
(b)
Fig. 5.14 Comparison of the mechanical properties of the c-oriented foams with different orientation
degrees. The relative densities of the samples are all about 0.3±0.02.
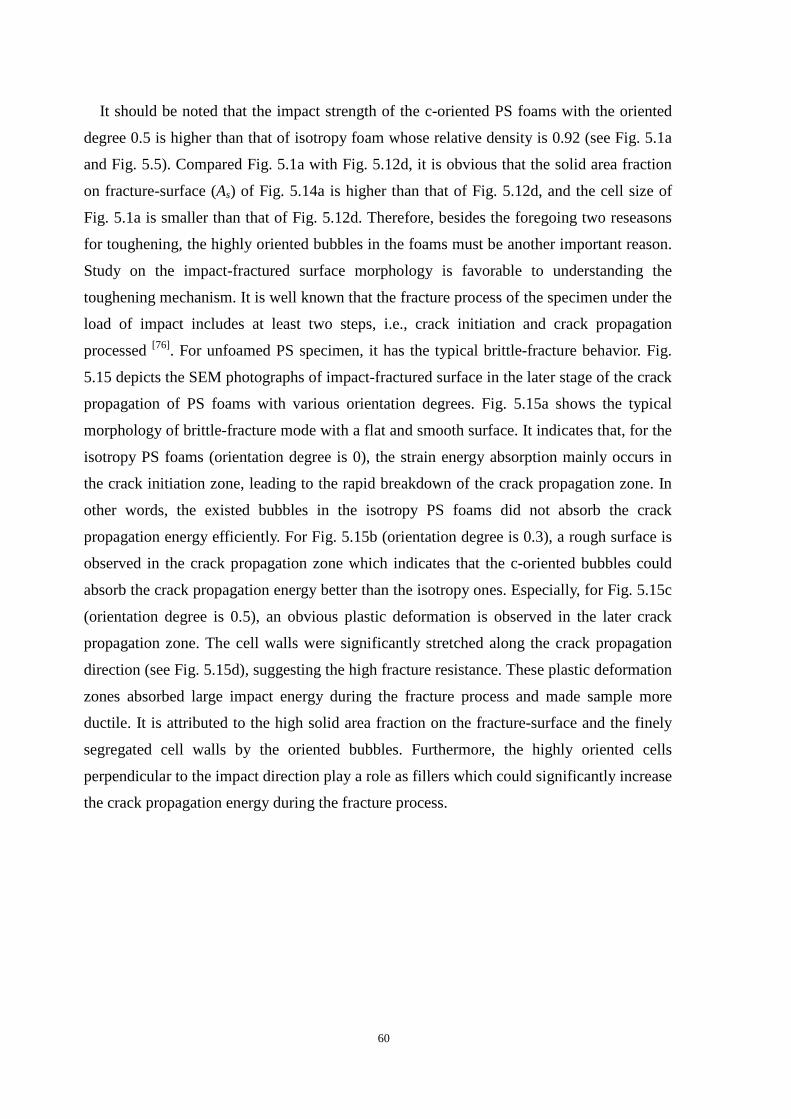
60
It should be noted that the impact strength of the c-oriented PS foams with the oriented
degree 0.5 is higher than that of isotropy foam whose relative density is 0.92 (see Fig. 5.1a
and Fig. 5.5). Compared Fig. 5.1a with Fig. 5.12d, it is obvious that the solid area fraction
on fracture-surface (As) of Fig. 5.14a is higher than that of Fig. 5.12d, and the cell size of
Fig. 5.1a is smaller than that of Fig. 5.12d. Therefore, besides the foregoing two reseasons
for toughening, the highly oriented bubbles in the foams must be another important reason.
Study on the impact-fractured surface morphology is favorable to understanding the
toughening mechanism. It is well known that the fracture process of the specimen under the
load of impact includes at least two steps, i.e., crack initiation and crack propagation
processed [76]. For unfoamed PS specimen, it has the typical brittle-fracture behavior. Fig.
5.15 depicts the SEM photographs of impact-fractured surface in the later stage of the crack
propagation of PS foams with various orientation degrees. Fig. 5.15a shows the typical
morphology of brittle-fracture mode with a flat and smooth surface. It indicates that, for the
isotropy PS foams (orientation degree is 0), the strain energy absorption mainly occurs in
the crack initiation zone, leading to the rapid breakdown of the crack propagation zone. In
other words, the existed bubbles in the isotropy PS foams did not absorb the crack
propagation energy efficiently. For Fig. 5.15b (orientation degree is 0.3), a rough surface is
observed in the crack propagation zone which indicates that the c-oriented bubbles could
absorb the crack propagation energy better than the isotropy ones. Especially, for Fig. 5.15c
(orientation degree is 0.5), an obvious plastic deformation is observed in the later crack
propagation zone. The cell walls were significantly stretched along the crack propagation
direction (see Fig. 5.15d), suggesting the high fracture resistance. These plastic deformation
zones absorbed large impact energy during the fracture process and made sample more
ductile. It is attributed to the high solid area fraction on the fracture-surface and the finely
segregated cell walls by the oriented bubbles. Furthermore, the highly oriented cells
perpendicular to the impact direction play a role as fillers which could significantly increase
the crack propagation energy during the fracture process.
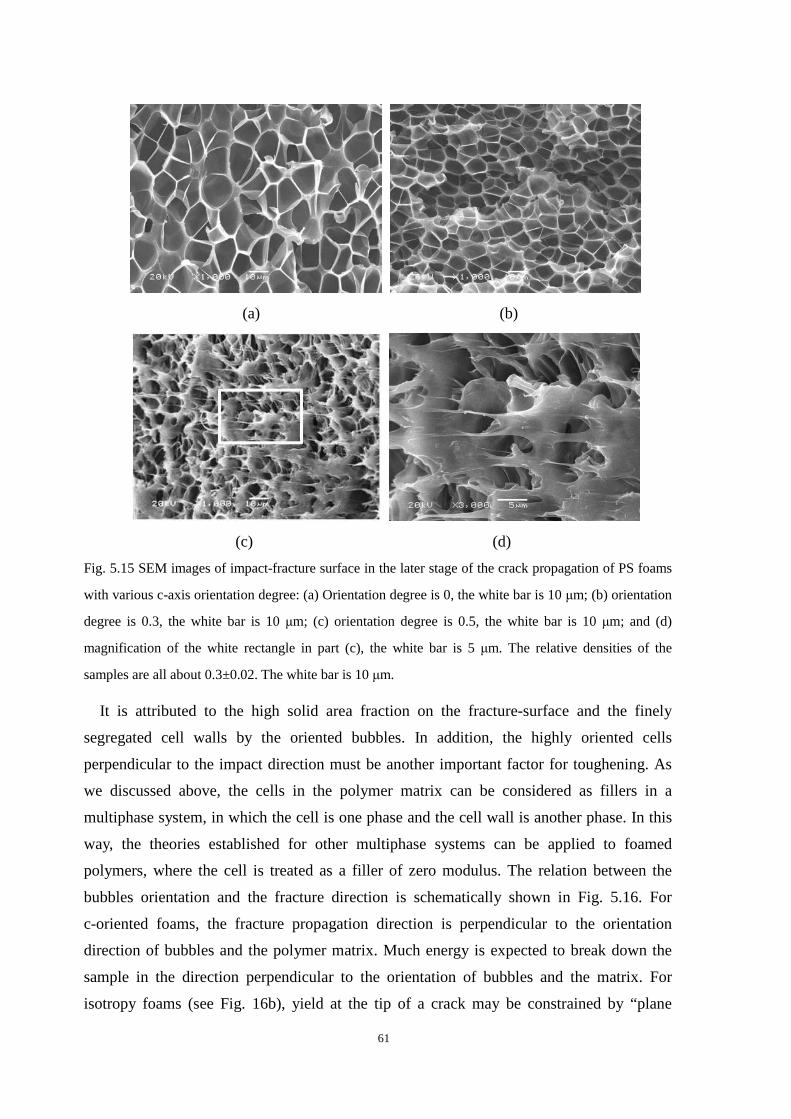
61
(a) (b)
(c) (d)
Fig. 5.15 SEM images of impact-fracture surface in the later stage of the crack propagation of PS foams
with various c-axis orientation degree: (a) Orientation degree is 0, the white bar is 10 µm; (b) orientation
degree is 0.3, the white bar is 10 µm; (c) orientation degree is 0.5, the white bar is 10 µm; and (d)
magnification of the white rectangle in part (c), the white bar is 5 µm. The relative densities of the
samples are all about 0.3±0.02. The white bar is 10 µm.
It is attributed to the high solid area fraction on the fracture-surface and the finely
segregated cell walls by the oriented bubbles. In addition, the highly oriented cells
perpendicular to the impact direction must be another important factor for toughening. As
we discussed above, the cells in the polymer matrix can be considered as fillers in a
multiphase system, in which the cell is one phase and the cell wall is another phase. In this
way, the theories established for other multiphase systems can be applied to foamed
polymers, where the cell is treated as a filler of zero modulus. The relation between the
bubbles orientation and the fracture direction is schematically shown in Fig. 5.16. For
c-oriented foams, the fracture propagation direction is perpendicular to the orientation
direction of bubbles and the polymer matrix. Much energy is expected to break down the
sample in the direction perpendicular to the orientation of bubbles and the matrix. For
isotropy foams (see Fig. 16b), yield at the tip of a crack may be constrained by “plane
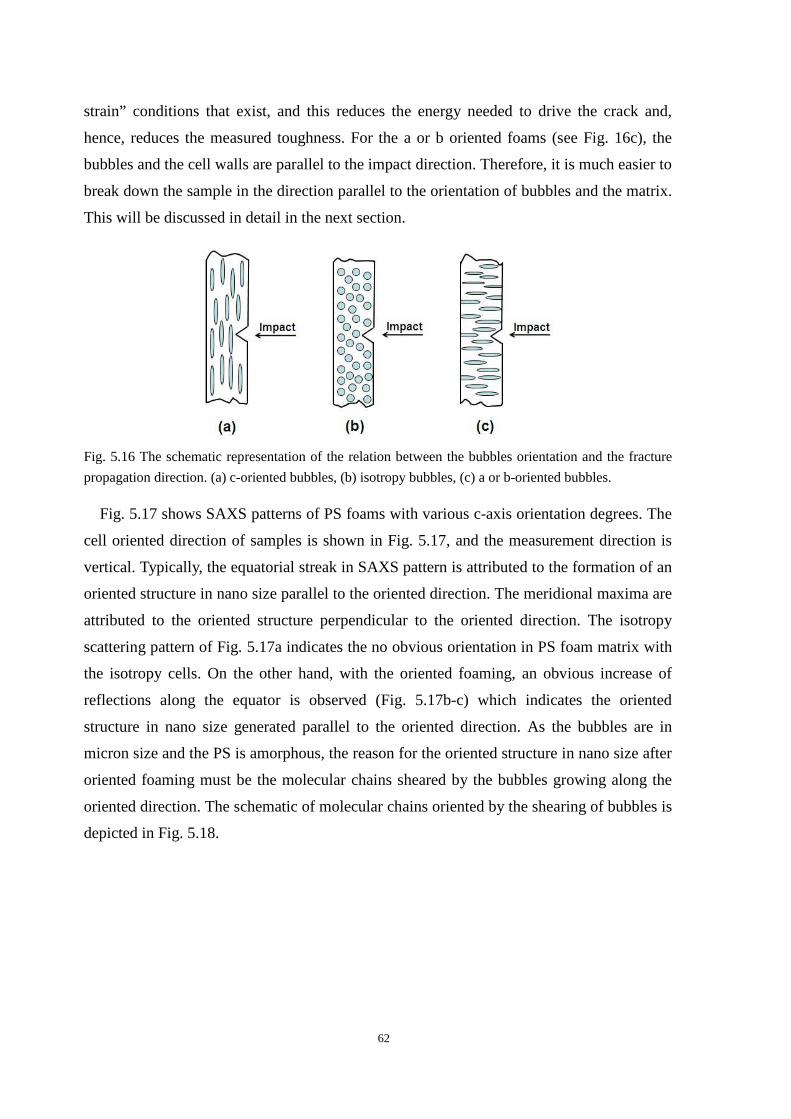
62
strain” conditions that exist, and this reduces the energy needed to drive the crack and,
hence, reduces the measured toughness. For the a or b oriented foams (see Fig. 16c), the
bubbles and the cell walls are parallel to the impact direction. Therefore, it is much easier to
break down the sample in the direction parallel to the orientation of bubbles and the matrix.
This will be discussed in detail in the next section.
Fig. 5.16 The schematic representation of the relation between the bubbles orientation and the fracture
propagation direction. (a) c-oriented bubbles, (b) isotropy bubbles, (c) a or b-oriented bubbles.
Fig. 5.17 shows SAXS patterns of PS foams with various c-axis orientation degrees. The
cell oriented direction of samples is shown in Fig. 5.17, and the measurement direction is
vertical. Typically, the equatorial streak in SAXS pattern is attributed to the formation of an
oriented structure in nano size parallel to the oriented direction. The meridional maxima are
attributed to the oriented structure perpendicular to the oriented direction. The isotropy
scattering pattern of Fig. 5.17a indicates the no obvious orientation in PS foam matrix with
the isotropy cells. On the other hand, with the oriented foaming, an obvious increase of
reflections along the equator is observed (Fig. 5.17b-c) which indicates the oriented
structure in nano size generated parallel to the oriented direction. As the bubbles are in
micron size and the PS is amorphous, the reason for the oriented structure in nano size after
oriented foaming must be the molecular chains sheared by the bubbles growing along the
oriented direction. The schematic of molecular chains oriented by the shearing of bubbles is
depicted in Fig. 5.18.
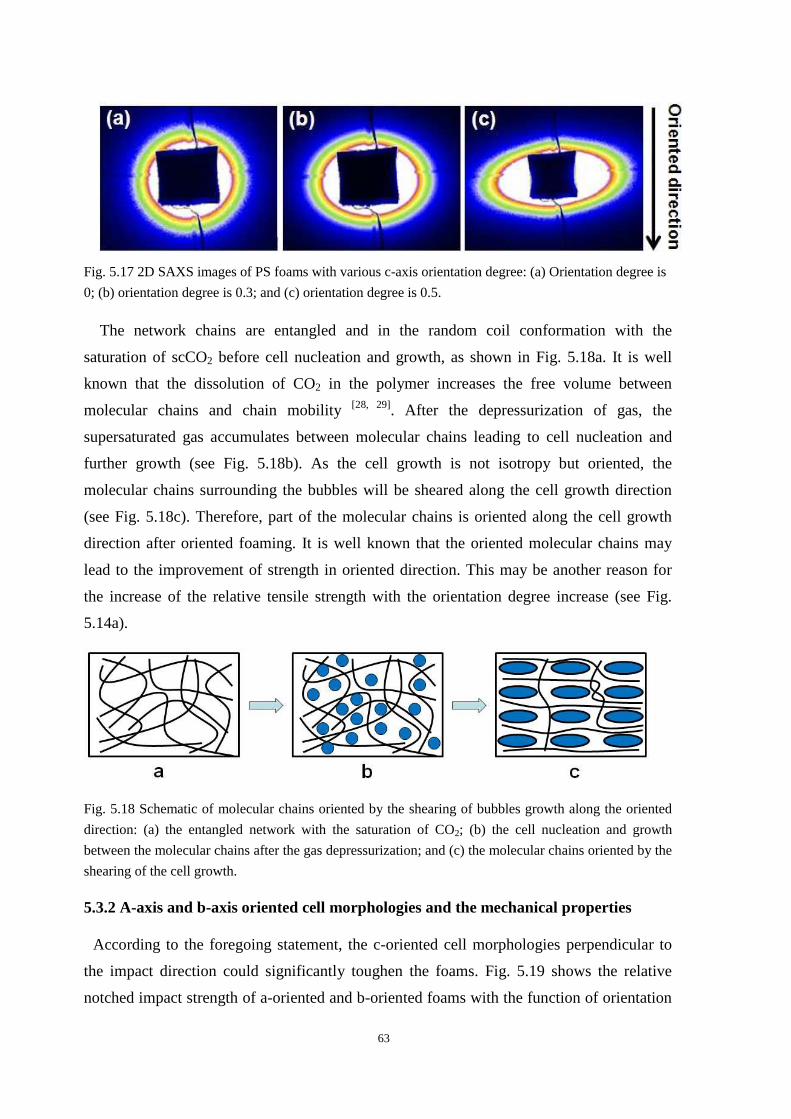
63
Fig. 5.17 2D SAXS images of PS foams with various c-axis orientation degree: (a) Orientation degree is
0; (b) orientation degree is 0.3; and (c) orientation degree is 0.5.
The network chains are entangled and in the random coil conformation with the
saturation of scCO2 before cell nucleation and growth, as shown in Fig. 5.18a. It is well
known that the dissolution of CO2 in the polymer increases the free volume between
molecular chains and chain mobility [28, 29]. After the depressurization of gas, the
supersaturated gas accumulates between molecular chains leading to cell nucleation and
further growth (see Fig. 5.18b). As the cell growth is not isotropy but oriented, the
molecular chains surrounding the bubbles will be sheared along the cell growth direction
(see Fig. 5.18c). Therefore, part of the molecular chains is oriented along the cell growth
direction after oriented foaming. It is well known that the oriented molecular chains may
lead to the improvement of strength in oriented direction. This may be another reason for
the increase of the relative tensile strength with the orientation degree increase (see Fig.
5.14a).
Fig. 5.18 Schematic of molecular chains oriented by the shearing of bubbles growth along the oriented
direction: (a) the entangled network with the saturation of CO2; (b) the cell nucleation and growth
between the molecular chains after the gas depressurization; and (c) the molecular chains oriented by the
shearing of the cell growth.
5.3.2 A-axis and b-axis oriented cell morphologies and the mechanical properties
According to the foregoing statement, the c-oriented cell morphologies perpendicular to
the impact direction could significantly toughen the foams. Fig. 5.19 shows the relative
notched impact strength of a-oriented and b-oriented foams with the function of orientation
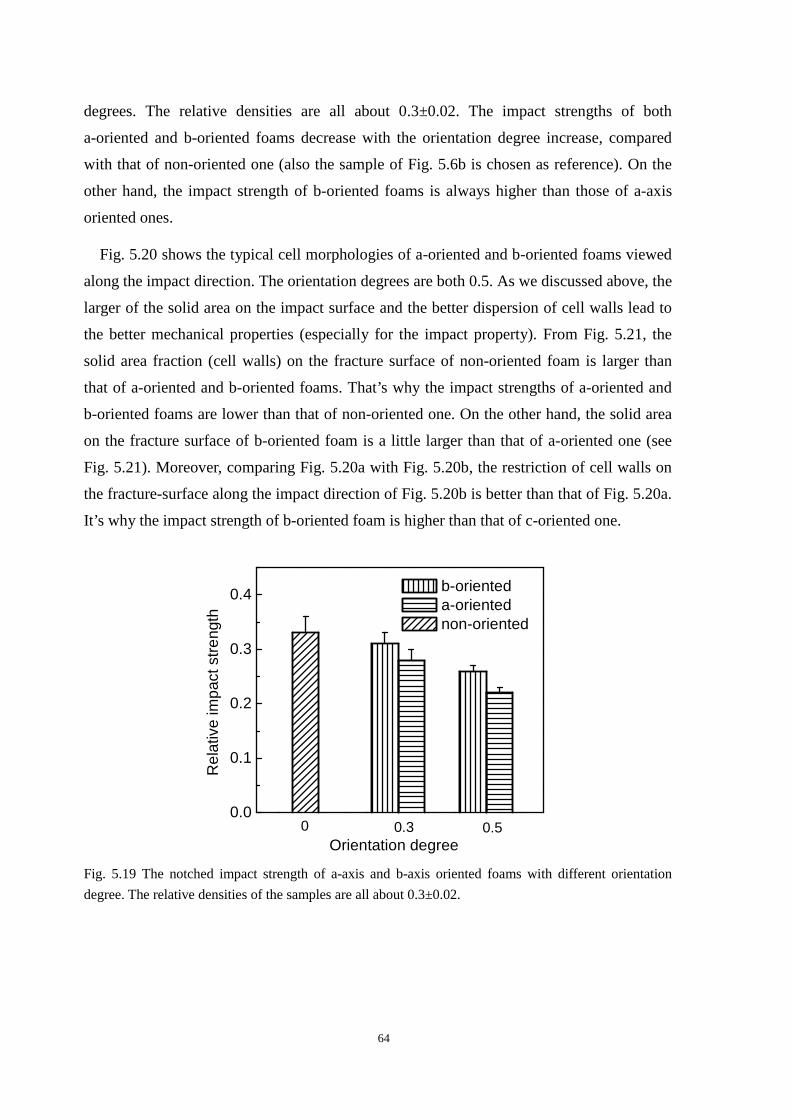
64
degrees. The relative densities are all about 0.3±0.02. The impact strengths of both
a-oriented and b-oriented foams decrease with the orientation degree increase, compared
with that of non-oriented one (also the sample of Fig. 5.6b is chosen as reference). On the
other hand, the impact strength of b-oriented foams is always higher than those of a-axis
oriented ones.
Fig. 5.20 shows the typical cell morphologies of a-oriented and b-oriented foams viewed
along the impact direction. The orientation degrees are both 0.5. As we discussed above, the
larger of the solid area on the impact surface and the better dispersion of cell walls lead to
the better mechanical properties (especially for the impact property). From Fig. 5.21, the
solid area fraction (cell walls) on the fracture surface of non-oriented foam is larger than
that of a-oriented and b-oriented foams. That’s why the impact strengths of a-oriented and
b-oriented foams are lower than that of non-oriented one. On the other hand, the solid area
on the fracture surface of b-oriented foam is a little larger than that of a-oriented one (see
Fig. 5.21). Moreover, comparing Fig. 5.20a with Fig. 5.20b, the restriction of cell walls on
the fracture-surface along the impact direction of Fig. 5.20b is better than that of Fig. 5.20a.
It’s why the impact strength of b-oriented foam is higher than that of c-oriented one.
0.0
0.1
0.2
0.3
0.4
Rel
ativ
e im
pact
str
engt
h
Orientation degree
b-oriented a-oriented non-oriented
0 0.3 0.5
Fig. 5.19 The notched impact strength of a-axis and b-axis oriented foams with different orientation
degree. The relative densities of the samples are all about 0.3±0.02.
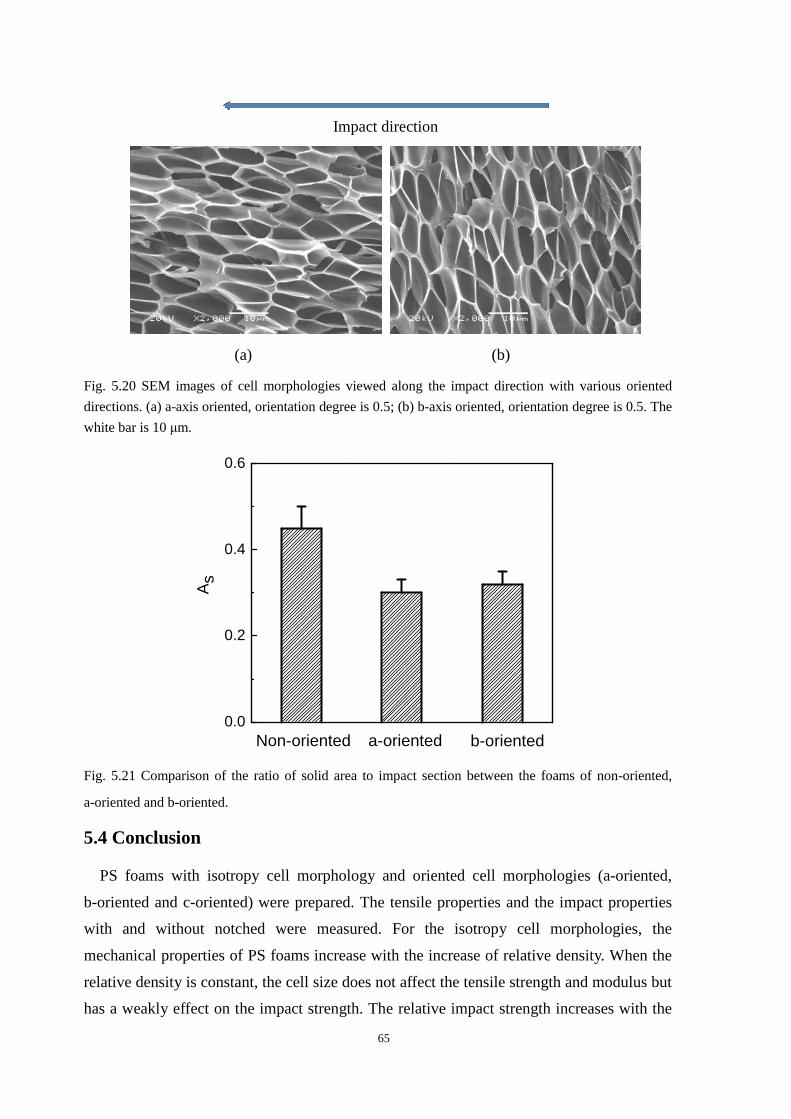
65
Impact direction
(a) (b)
Fig. 5.20 SEM images of cell morphologies viewed along the impact direction with various oriented
directions. (a) a-axis oriented, orientation degree is 0.5; (b) b-axis oriented, orientation degree is 0.5. The
white bar is 10 µm.
0.0
0.2
0.4
0.6
b-orienteda-orientedNon-oriented
As
Fig. 5.21 Comparison of the ratio of solid area to impact section between the foams of non-oriented,
a-oriented and b-oriented.
5.4 Conclusion
PS foams with isotropy cell morphology and oriented cell morphologies (a-oriented,
b-oriented and c-oriented) were prepared. The tensile properties and the impact properties
with and without notched were measured. For the isotropy cell morphologies, the
mechanical properties of PS foams increase with the increase of relative density. When the
relative density is constant, the cell size does not affect the tensile strength and modulus but
has a weakly effect on the impact strength. The relative impact strength increases with the
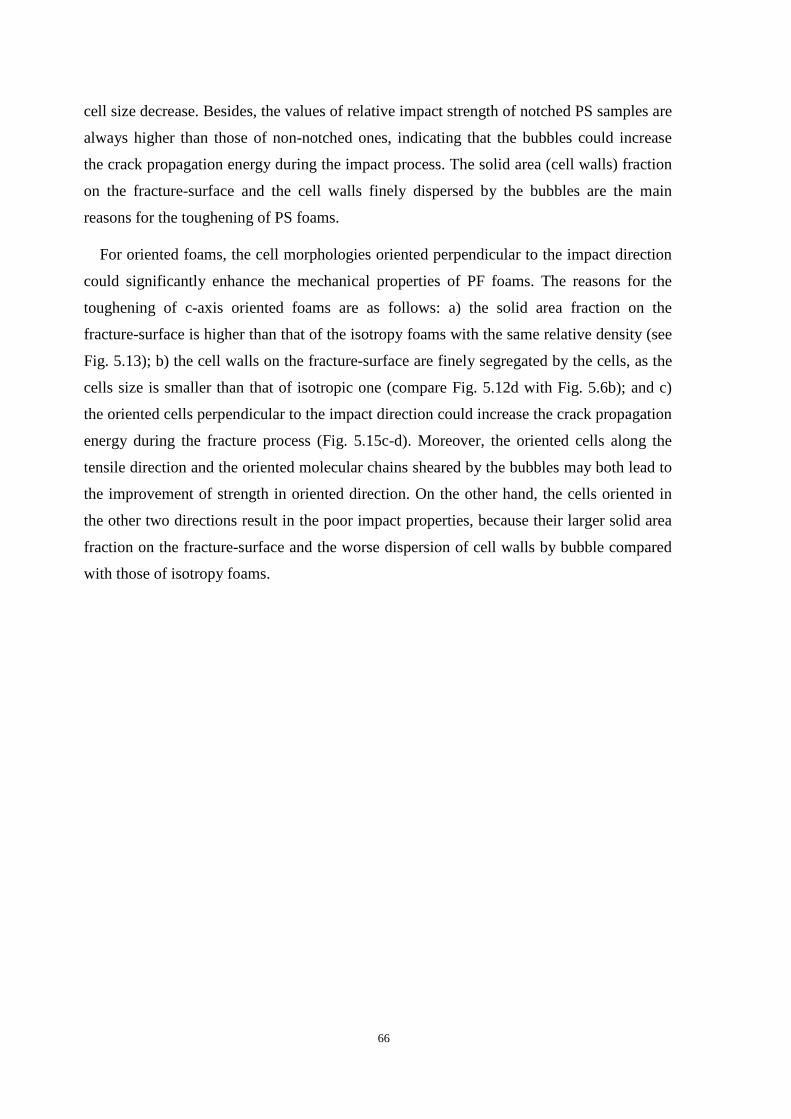
66
cell size decrease. Besides, the values of relative impact strength of notched PS samples are
always higher than those of non-notched ones, indicating that the bubbles could increase
the crack propagation energy during the impact process. The solid area (cell walls) fraction
on the fracture-surface and the cell walls finely dispersed by the bubbles are the main
reasons for the toughening of PS foams.
For oriented foams, the cell morphologies oriented perpendicular to the impact direction
could significantly enhance the mechanical properties of PF foams. The reasons for the
toughening of c-axis oriented foams are as follows: a) the solid area fraction on the
fracture-surface is higher than that of the isotropy foams with the same relative density (see
Fig. 5.13); b) the cell walls on the fracture-surface are finely segregated by the cells, as the
cells size is smaller than that of isotropic one (compare Fig. 5.12d with Fig. 5.6b); and c)
the oriented cells perpendicular to the impact direction could increase the crack propagation
energy during the fracture process (Fig. 5.15c-d). Moreover, the oriented cells along the
tensile direction and the oriented molecular chains sheared by the bubbles may both lead to
the improvement of strength in oriented direction. On the other hand, the cells oriented in
the other two directions result in the poor impact properties, because their larger solid area
fraction on the fracture-surface and the worse dispersion of cell walls by bubble compared
with those of isotropy foams.
67
Chapter 6 Preparation of bi-modal cell structure polystyrene foams
6.1 Introduction
According to the investigation of chapter 5, to some extent, the cells in the polymer
matrix can be considered as fillers of zero modulus in a multiphase system, in which the
cell is one phase and the cell wall is another phase. The bubbles in the PS matrix could
increase the crack propagation energy during the impact tests. The smaller bubbles could
get the better toughness of foams while the relative density is constant. In addition, the
finely segregated cell walls by bubbles play a important role for the mechanical properties.
Base on the above conclusion, the bimodal cell structure PS foams is raised as the
following assumption: the small closed cells could act as a role of improving the
mechanical properties of foam product, and on the other hand, large closed cells could be a
role of reducing bulk density and lowing thermal conductivity of materials. This unique cell
structure with both small and large cells homogenous distribution throughout the entire
volume of the foam sample, which makes the cell walls non-uniform separation, may
absorb the impact energy better than the uniform one. It is well-known that the mechanical
properties and applications of polymeric foams are to a large extent determined by their cell
morphologies [104-111]. For instance, polymer foams with big closed cells can be used in
packaging, thermal insulation, cushioning and construction of low cost housing [112, 113]. On
the other hand, polymer foams with open cells possess a wide range of applications in
separation membranes [114], acoustic insulation [115], battery separators [116] and biomedical
fields [117]. However, little research has been reported on preparing polymer foams with a
bimodal distribution of cell sizes [21]. It is reported that this bi-modal cell structure has
outstanding heat insulation property [118].
In this work, the bimodal cell structure was achieved by a two-step depressurization
foaming process using scCO2 as blowing agent. The influence of processing parameters and
the nature of polymers on the final bimodal cell structure was first studied. Thereafter, the
relationship between the cell structure and the impact property was investigated.
6.2 Formation of bi-modal cell structure
To create foams with a bi-modal distribution of cell sizes, the two-step depressurization
batch foaming process conditions were as follows: the PS was first soaked at 20MPa and
100oC till saturation and subsequently depressurized to an intermediate pressure (normally
15MPa in this work). The vessel was then maintained at that pressure for a certain period of
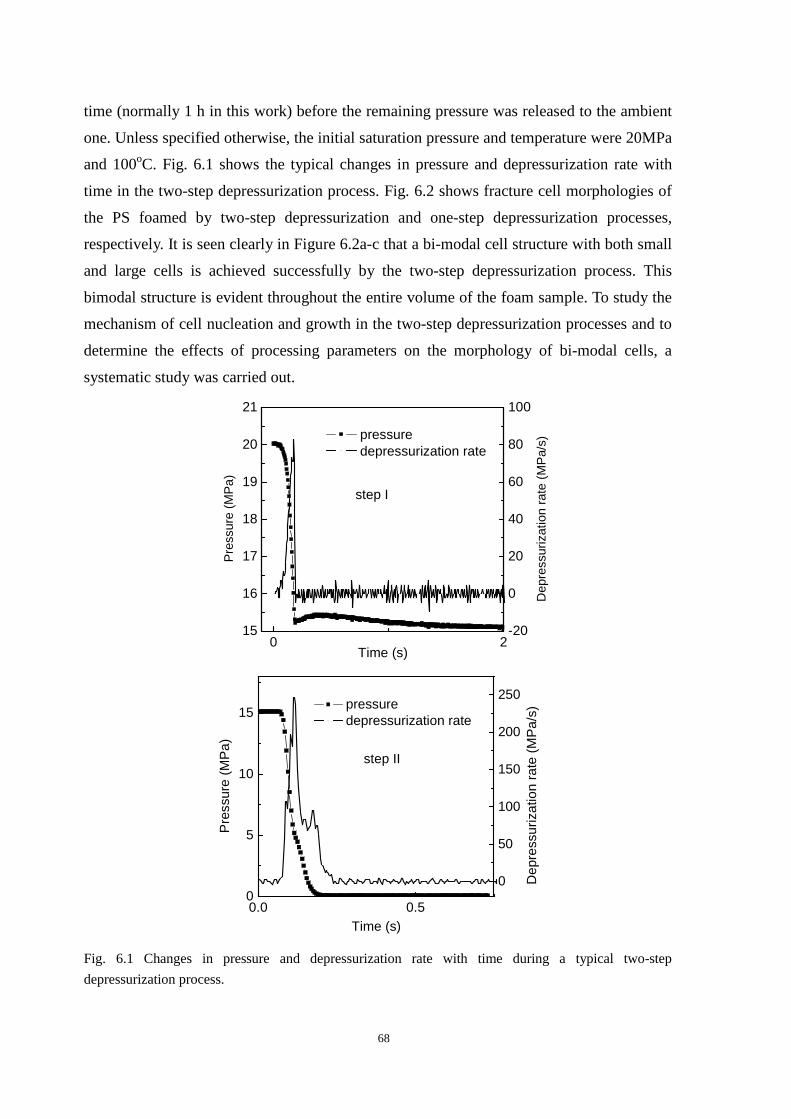
68
time (normally 1 h in this work) before the remaining pressure was released to the ambient
one. Unless specified otherwise, the initial saturation pressure and temperature were 20MPa
and 100oC. Fig. 6.1 shows the typical changes in pressure and depressurization rate with
time in the two-step depressurization process. Fig. 6.2 shows fracture cell morphologies of
the PS foamed by two-step depressurization and one-step depressurization processes,
respectively. It is seen clearly in Figure 6.2a-c that a bi-modal cell structure with both small
and large cells is achieved successfully by the two-step depressurization process. This
bimodal structure is evident throughout the entire volume of the foam sample. To study the
mechanism of cell nucleation and growth in the two-step depressurization processes and to
determine the effects of processing parameters on the morphology of bi-modal cells, a
systematic study was carried out.
0 215
16
17
18
19
20
21
pressure depressurization rate
Time (s)
Pre
ssur
e (M
Pa)
step I
-20
0
20
40
60
80
100
Dep
ress
uriz
atio
n ra
te (
MP
a/s)
0.0 0.50
5
10
15 pressure depressurization rate
Time (s)
Pre
ssur
e (M
Pa)
step II
0
50
100
150
200
250
Dep
ress
uriz
atio
n ra
te (
MP
a/s)
Fig. 6.1 Changes in pressure and depressurization rate with time during a typical two-step
depressurization process.
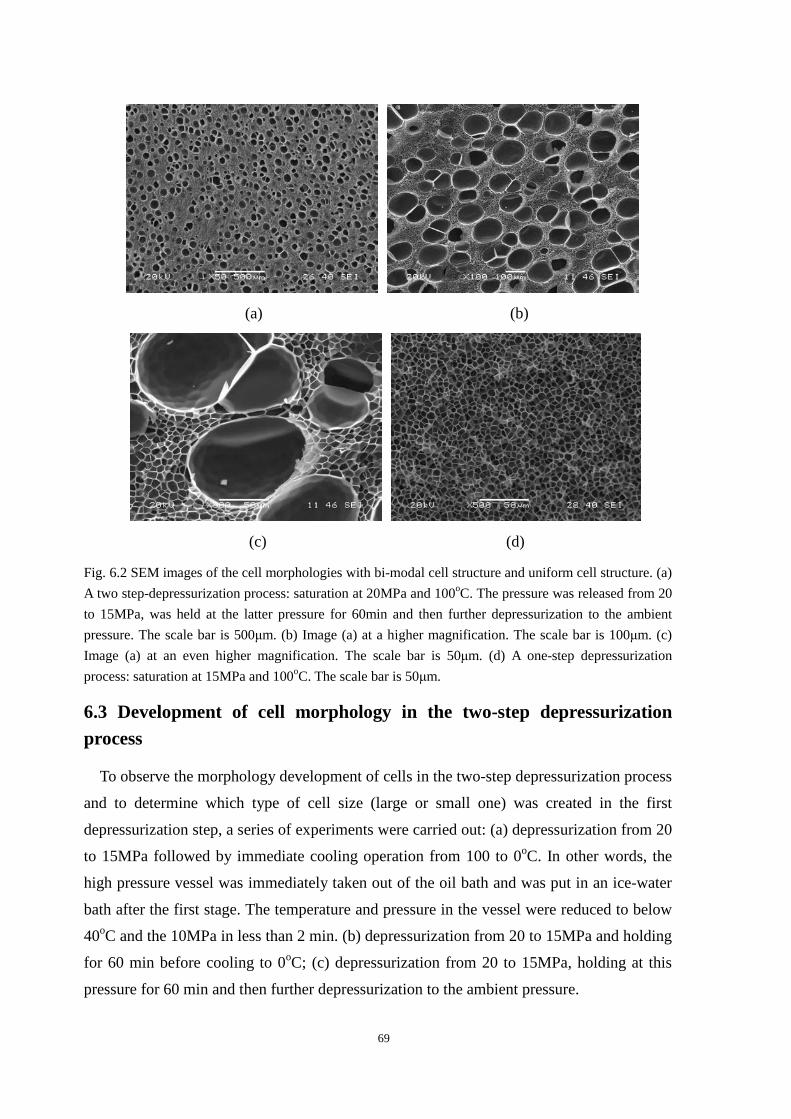
69
(a) (b)
(c) (d)
Fig. 6.2 SEM images of the cell morphologies with bi-modal cell structure and uniform cell structure. (a)
A two step-depressurization process: saturation at 20MPa and 100oC. The pressure was released from 20
to 15MPa, was held at the latter pressure for 60min and then further depressurization to the ambient
pressure. The scale bar is 500µm. (b) Image (a) at a higher magnification. The scale bar is 100µm. (c)
Image (a) at an even higher magnification. The scale bar is 50µm. (d) A one-step depressurization
process: saturation at 15MPa and 100oC. The scale bar is 50µm.
6.3 Development of cell morphology in the two-step depressurization process
To observe the morphology development of cells in the two-step depressurization process
and to determine which type of cell size (large or small one) was created in the first
depressurization step, a series of experiments were carried out: (a) depressurization from 20
to 15MPa followed by immediate cooling operation from 100 to 0oC. In other words, the
high pressure vessel was immediately taken out of the oil bath and was put in an ice-water
bath after the first stage. The temperature and pressure in the vessel were reduced to below
40oC and the 10MPa in less than 2 min. (b) depressurization from 20 to 15MPa and holding
for 60 min before cooling to 0oC; (c) depressurization from 20 to 15MPa, holding at this
pressure for 60 min and then further depressurization to the ambient pressure.
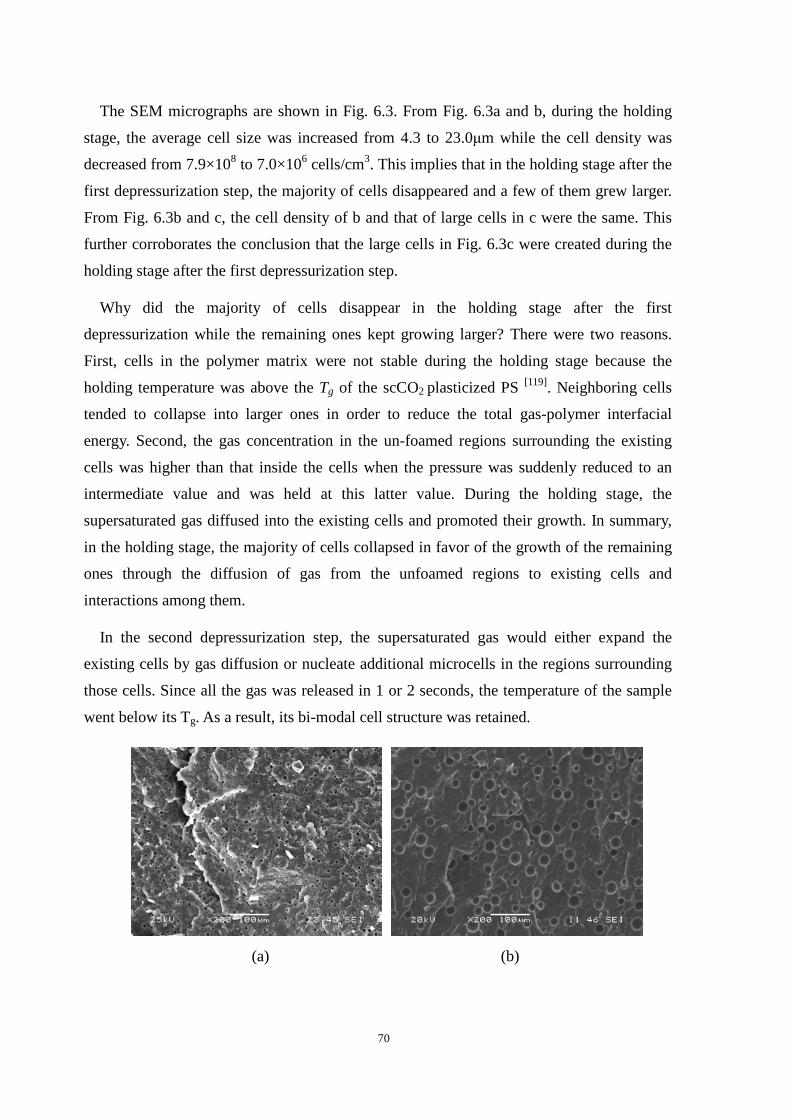
70
The SEM micrographs are shown in Fig. 6.3. From Fig. 6.3a and b, during the holding
stage, the average cell size was increased from 4.3 to 23.0µm while the cell density was
decreased from 7.9×10⁸ to 7.0×10⁶ cells/cm3. This implies that in the holding stage after the
first depressurization step, the majority of cells disappeared and a few of them grew larger.
From Fig. 6.3b and c, the cell density of b and that of large cells in c were the same. This
further corroborates the conclusion that the large cells in Fig. 6.3c were created during the
holding stage after the first depressurization step.
Why did the majority of cells disappear in the holding stage after the first
depressurization while the remaining ones kept growing larger? There were two reasons.
First, cells in the polymer matrix were not stable during the holding stage because the
holding temperature was above the Tg of the scCO2 plasticized PS [119]. Neighboring cells
tended to collapse into larger ones in order to reduce the total gas-polymer interfacial
energy. Second, the gas concentration in the un-foamed regions surrounding the existing
cells was higher than that inside the cells when the pressure was suddenly reduced to an
intermediate value and was held at this latter value. During the holding stage, the
supersaturated gas diffused into the existing cells and promoted their growth. In summary,
in the holding stage, the majority of cells collapsed in favor of the growth of the remaining
ones through the diffusion of gas from the unfoamed regions to existing cells and
interactions among them.
In the second depressurization step, the supersaturated gas would either expand the
existing cells by gas diffusion or nucleate additional microcells in the regions surrounding
those cells. Since all the gas was released in 1 or 2 seconds, the temperature of the sample
went below its Tg. As a result, its bi-modal cell structure was retained.
(a) (b)
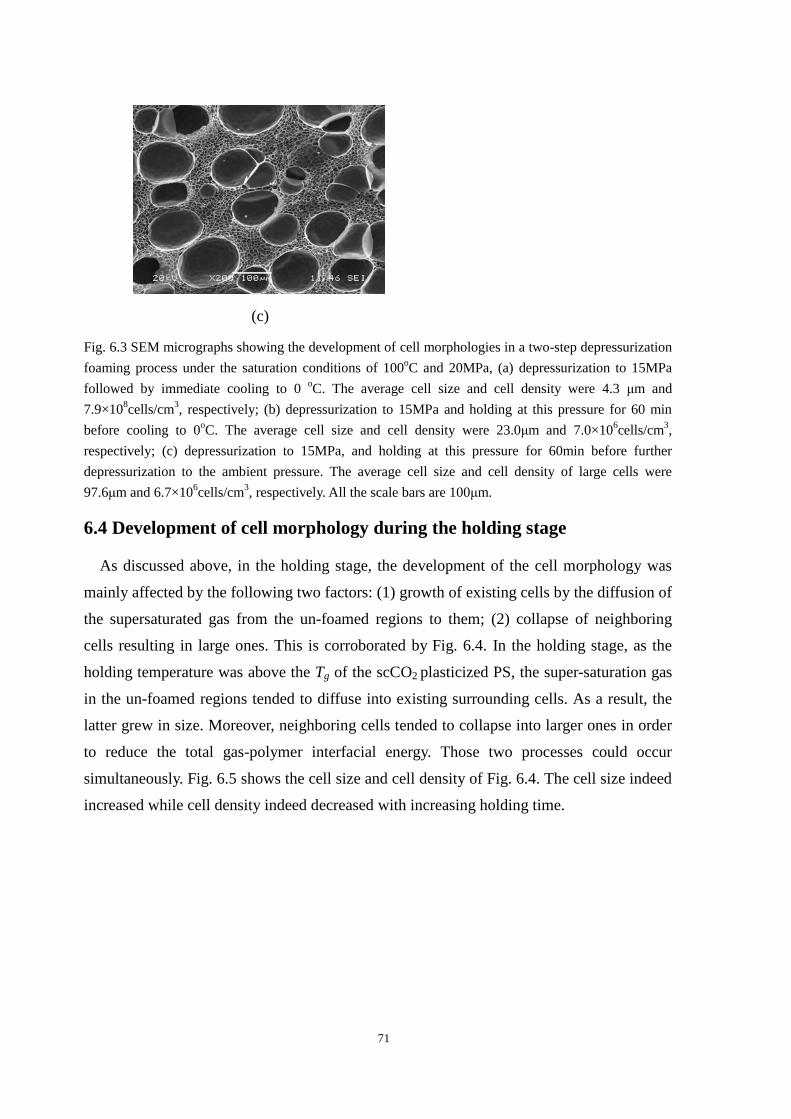
71
(c)
Fig. 6.3 SEM micrographs showing the development of cell morphologies in a two-step depressurization
foaming process under the saturation conditions of 100oC and 20MPa, (a) depressurization to 15MPa
followed by immediate cooling to 0 oC. The average cell size and cell density were 4.3 µm and
7.9×10⁸cells/cm3, respectively; (b) depressurization to 15MPa and holding at this pressure for 60 min
before cooling to 0oC. The average cell size and cell density were 23.0µm and 7.0×10⁶cells/cm3,
respectively; (c) depressurization to 15MPa, and holding at this pressure for 60min before further
depressurization to the ambient pressure. The average cell size and cell density of large cells were
97.6µm and 6.7×10⁶cells/cm3, respectively. All the scale bars are 100µm.
6.4 Development of cell morphology during the holding stage
As discussed above, in the holding stage, the development of the cell morphology was
mainly affected by the following two factors: (1) growth of existing cells by the diffusion of
the supersaturated gas from the un-foamed regions to them; (2) collapse of neighboring
cells resulting in large ones. This is corroborated by Fig. 6.4. In the holding stage, as the
holding temperature was above the Tg of the scCO2 plasticized PS, the super-saturation gas
in the un-foamed regions tended to diffuse into existing surrounding cells. As a result, the
latter grew in size. Moreover, neighboring cells tended to collapse into larger ones in order
to reduce the total gas-polymer interfacial energy. Those two processes could occur
simultaneously. Fig. 6.5 shows the cell size and cell density of Fig. 6.4. The cell size indeed
increased while cell density indeed decreased with increasing holding time.
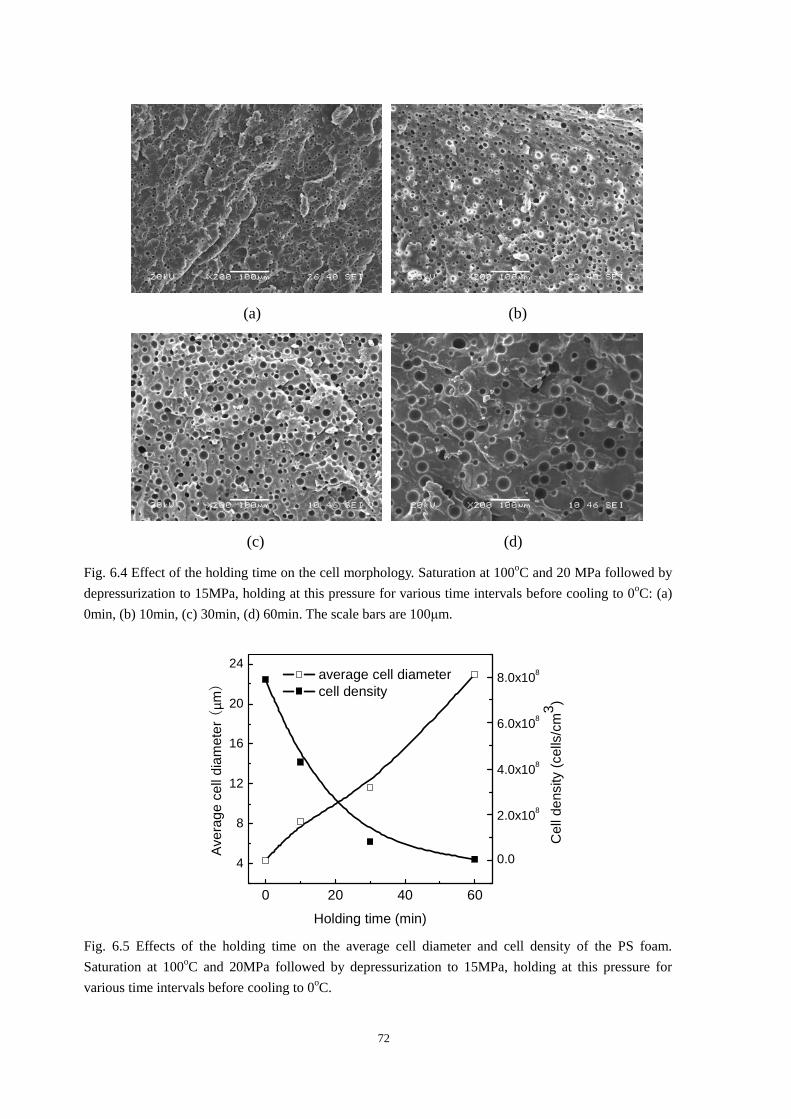
72
(a) (b)
(c) (d)
Fig. 6.4 Effect of the holding time on the cell morphology. Saturation at 100oC and 20 MPa followed by
depressurization to 15MPa, holding at this pressure for various time intervals before cooling to 0oC: (a)
0min, (b) 10min, (c) 30min, (d) 60min. The scale bars are 100µm.
0 20 40 60
4
8
12
16
20
24
average cell diameter cell density
Holding time (min)
Ave
rage
cel
l dia
met
er (
µm)
0.0
2.0x10⁸
4.0x10⁸
6.0x10⁸
8.0x10⁸
Cel
l den
sity
(ce
lls/c
m3 )
Fig. 6.5 Effects of the holding time on the average cell diameter and cell density of the PS foam.
Saturation at 100oC and 20MPa followed by depressurization to 15MPa, holding at this pressure for
various time intervals before cooling to 0oC.
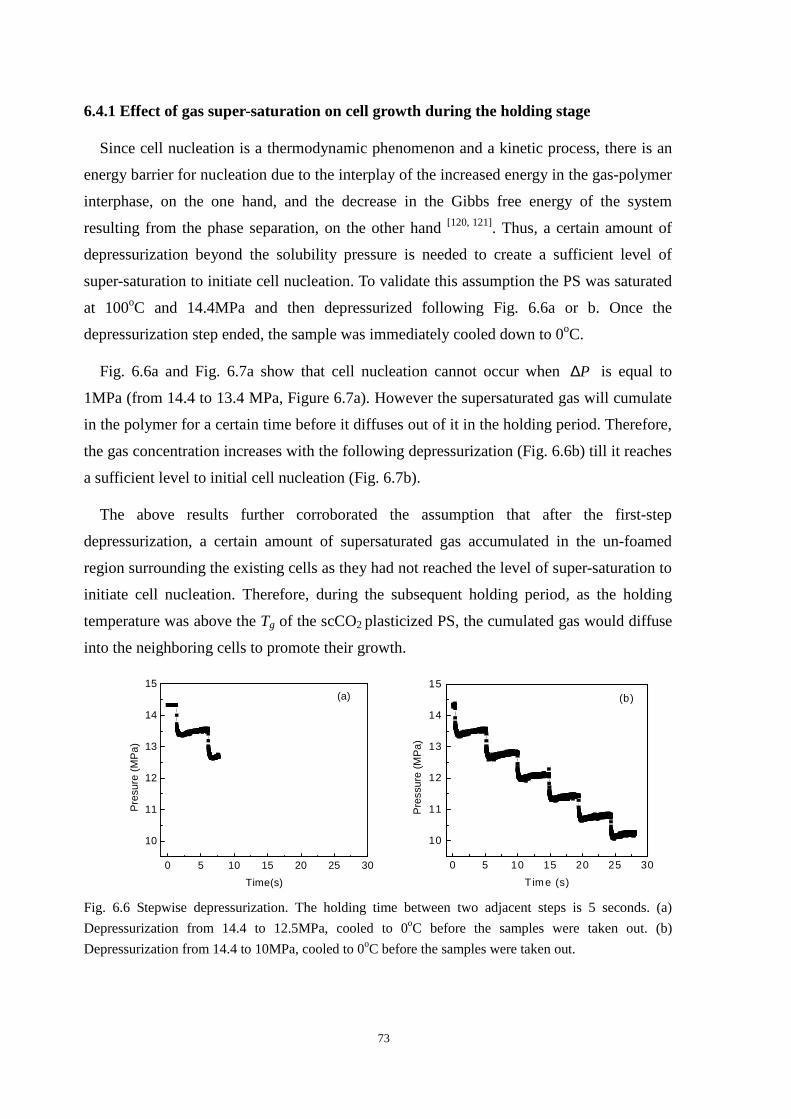
73
6.4.1 Effect of gas super-saturation on cell growth during the holding stage
Since cell nucleation is a thermodynamic phenomenon and a kinetic process, there is an
energy barrier for nucleation due to the interplay of the increased energy in the gas-polymer
interphase, on the one hand, and the decrease in the Gibbs free energy of the system
resulting from the phase separation, on the other hand [120, 121]. Thus, a certain amount of
depressurization beyond the solubility pressure is needed to create a sufficient level of
super-saturation to initiate cell nucleation. To validate this assumption the PS was saturated
at 100oC and 14.4MPa and then depressurized following Fig. 6.6a or b. Once the
depressurization step ended, the sample was immediately cooled down to 0oC.
Fig. 6.6a and Fig. 6.7a show that cell nucleation cannot occur when P∆ is equal to
1MPa (from 14.4 to 13.4 MPa, Figure 6.7a). However the supersaturated gas will cumulate
in the polymer for a certain time before it diffuses out of it in the holding period. Therefore,
the gas concentration increases with the following depressurization (Fig. 6.6b) till it reaches
a sufficient level to initial cell nucleation (Fig. 6.7b).
The above results further corroborated the assumption that after the first-step
depressurization, a certain amount of supersaturated gas accumulated in the un-foamed
region surrounding the existing cells as they had not reached the level of super-saturation to
initiate cell nucleation. Therefore, during the subsequent holding period, as the holding
temperature was above the Tg of the scCO2 plasticized PS, the cumulated gas would diffuse
into the neighboring cells to promote their growth.
0 5 10 15 20 25 30
10
11
12
13
14
15
Pre
sure
(M
Pa)
Time(s)
(a)
0 5 10 15 20 25 30
10
11
12
13
14
15
Pre
ssur
e (M
Pa)
T ime (s)
(b)
Fig. 6.6 Stepwise depressurization. The holding time between two adjacent steps is 5 seconds. (a)
Depressurization from 14.4 to 12.5MPa, cooled to 0oC before the samples were taken out. (b)
Depressurization from 14.4 to 10MPa, cooled to 0oC before the samples were taken out.

74
(a) (b)
(c)
Fig. 6.7 SEM images of the PS foamed by two different types of depressurization profiles (Figure 6.6a
and b, respectively). (a) No foaming; (b) image (a) at a much higher magnification confirming that there
was no foaming; (c) Foaming occurred.
6.4.2 Interaction between small and large cells during the holding stage
To study the interaction among cells during the holding stage, a series of experiments
was done. The sample of Fig. 6.3a was re-saturated at 15MPa and 100oC for 0, 10, 30, 45 or
60 min and then cooled to 0oC before it was taken out. From Fig. 6.8, the collapse and
growth of cells occurred simultaneously till all the cells disappeared as the holding time
increased. As discussed above, the existing cells in the polymer matrix were not stable
during the holding stage and some of them collapsed and others grew larger in size. When
the holding time was long enough, the gas inside the cells would tend to diffuse out of the
polymer matrix, which ultimately led to complete disappearance of the cells.
It is worth noting that the sample in Fig. 6.3b had large cells whereas the one in Fig. 6.8e
did not have any, even though they were held under the same saturation pressure and
temperature conditions and for the same period of time. This is because after the first
depressurization step, the sample of Fig. 6.3b was held at a fixed pressure. During that
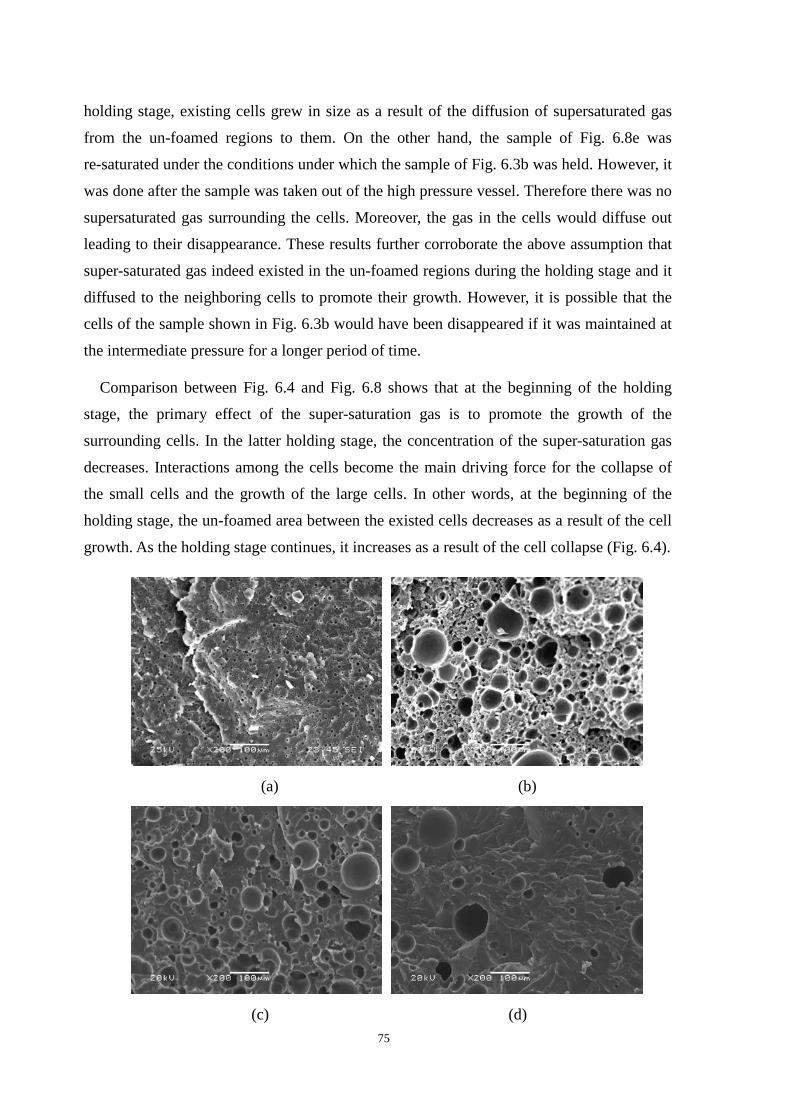
75
holding stage, existing cells grew in size as a result of the diffusion of supersaturated gas
from the un-foamed regions to them. On the other hand, the sample of Fig. 6.8e was
re-saturated under the conditions under which the sample of Fig. 6.3b was held. However, it
was done after the sample was taken out of the high pressure vessel. Therefore there was no
supersaturated gas surrounding the cells. Moreover, the gas in the cells would diffuse out
leading to their disappearance. These results further corroborate the above assumption that
super-saturated gas indeed existed in the un-foamed regions during the holding stage and it
diffused to the neighboring cells to promote their growth. However, it is possible that the
cells of the sample shown in Fig. 6.3b would have been disappeared if it was maintained at
the intermediate pressure for a longer period of time.
Comparison between Fig. 6.4 and Fig. 6.8 shows that at the beginning of the holding
stage, the primary effect of the super-saturation gas is to promote the growth of the
surrounding cells. In the latter holding stage, the concentration of the super-saturation gas
decreases. Interactions among the cells become the main driving force for the collapse of
the small cells and the growth of the large cells. In other words, at the beginning of the
holding stage, the un-foamed area between the existed cells decreases as a result of the cell
growth. As the holding stage continues, it increases as a result of the cell collapse (Fig. 6.4).
(a) (b)
(c) (d)
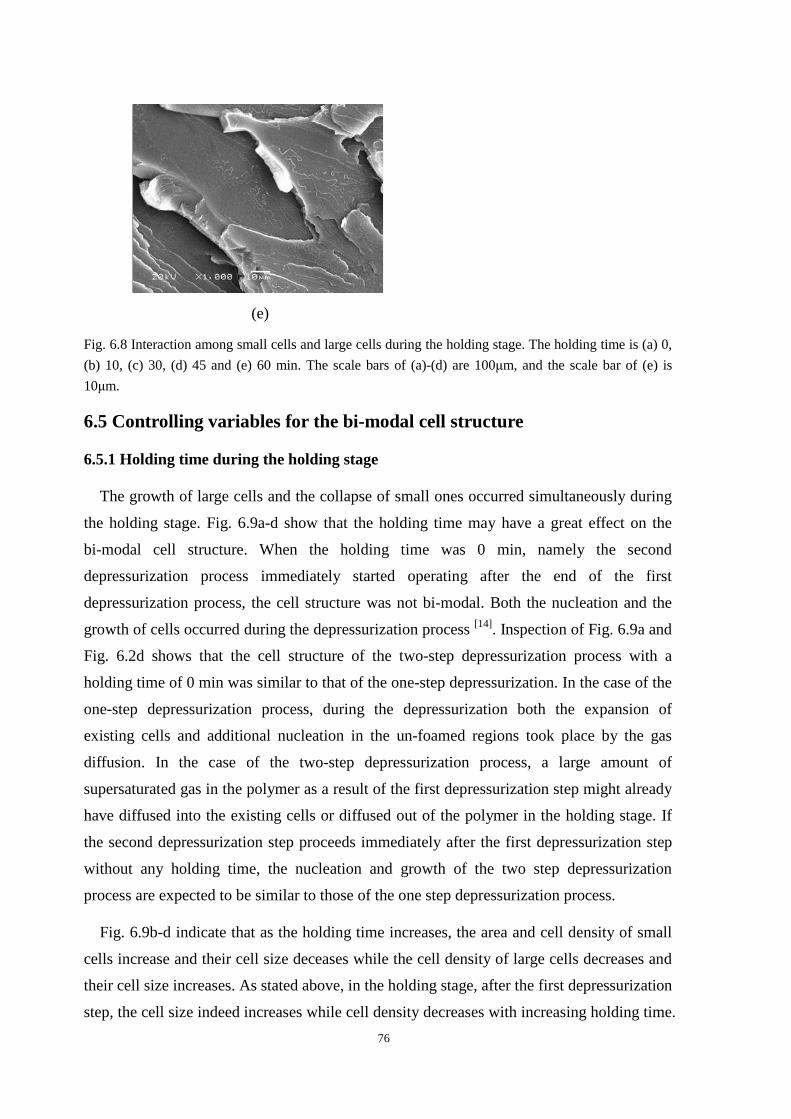
76
(e)
Fig. 6.8 Interaction among small cells and large cells during the holding stage. The holding time is (a) 0,
(b) 10, (c) 30, (d) 45 and (e) 60 min. The scale bars of (a)-(d) are 100µm, and the scale bar of (e) is
10µm.
6.5 Controlling variables for the bi-modal cell structure
6.5.1 Holding time during the holding stage
The growth of large cells and the collapse of small ones occurred simultaneously during
the holding stage. Fig. 6.9a-d show that the holding time may have a great effect on the
bi-modal cell structure. When the holding time was 0 min, namely the second
depressurization process immediately started operating after the end of the first
depressurization process, the cell structure was not bi-modal. Both the nucleation and the
growth of cells occurred during the depressurization process [14]. Inspection of Fig. 6.9a and
Fig. 6.2d shows that the cell structure of the two-step depressurization process with a
holding time of 0 min was similar to that of the one-step depressurization. In the case of the
one-step depressurization process, during the depressurization both the expansion of
existing cells and additional nucleation in the un-foamed regions took place by the gas
diffusion. In the case of the two-step depressurization process, a large amount of
supersaturated gas in the polymer as a result of the first depressurization step might already
have diffused into the existing cells or diffused out of the polymer in the holding stage. If
the second depressurization step proceeds immediately after the first depressurization step
without any holding time, the nucleation and growth of the two step depressurization
process are expected to be similar to those of the one step depressurization process.
Fig. 6.9b-d indicate that as the holding time increases, the area and cell density of small
cells increase and their cell size deceases while the cell density of large cells decreases and
their cell size increases. As stated above, in the holding stage, after the first depressurization
step, the cell size indeed increases while cell density decreases with increasing holding time.
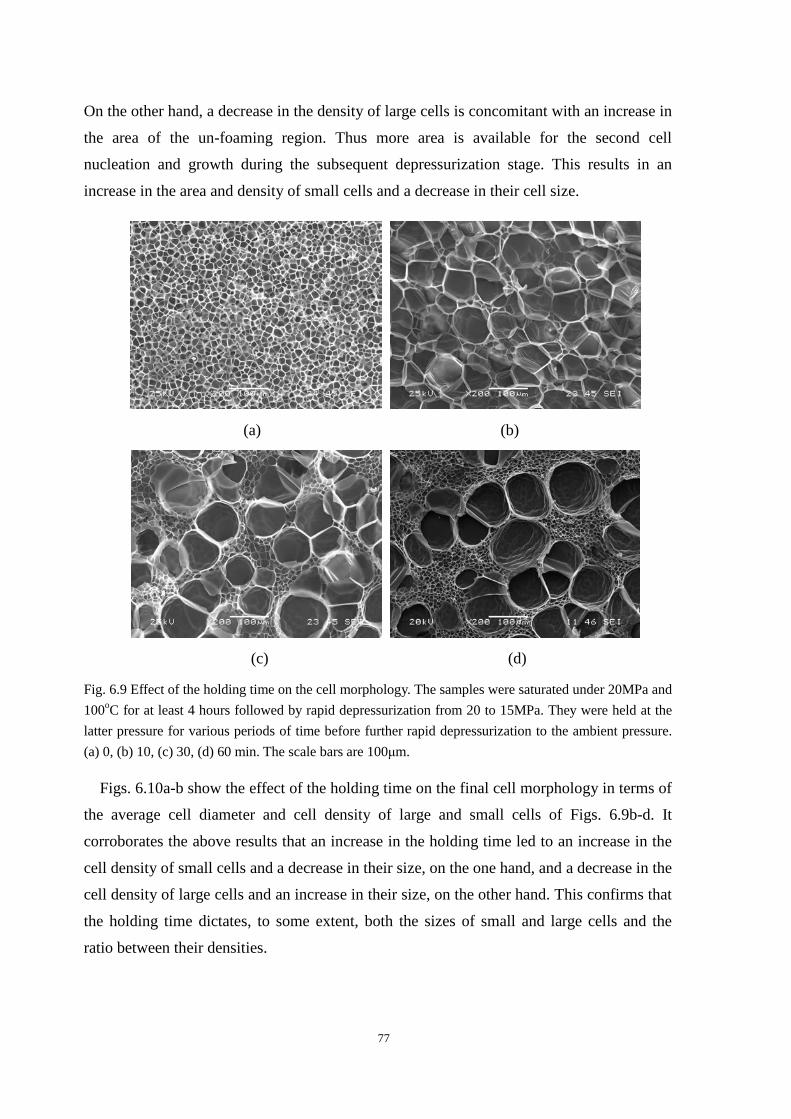
77
On the other hand, a decrease in the density of large cells is concomitant with an increase in
the area of the un-foaming region. Thus more area is available for the second cell
nucleation and growth during the subsequent depressurization stage. This results in an
increase in the area and density of small cells and a decrease in their cell size.
(a) (b)
(c) (d)
Fig. 6.9 Effect of the holding time on the cell morphology. The samples were saturated under 20MPa and
100oC for at least 4 hours followed by rapid depressurization from 20 to 15MPa. They were held at the
latter pressure for various periods of time before further rapid depressurization to the ambient pressure.
(a) 0, (b) 10, (c) 30, (d) 60 min. The scale bars are 100µm.
Figs. 6.10a-b show the effect of the holding time on the final cell morphology in terms of
the average cell diameter and cell density of large and small cells of Figs. 6.9b-d. It
corroborates the above results that an increase in the holding time led to an increase in the
cell density of small cells and a decrease in their size, on the one hand, and a decrease in the
cell density of large cells and an increase in their size, on the other hand. This confirms that
the holding time dictates, to some extent, both the sizes of small and large cells and the
ratio between their densities.
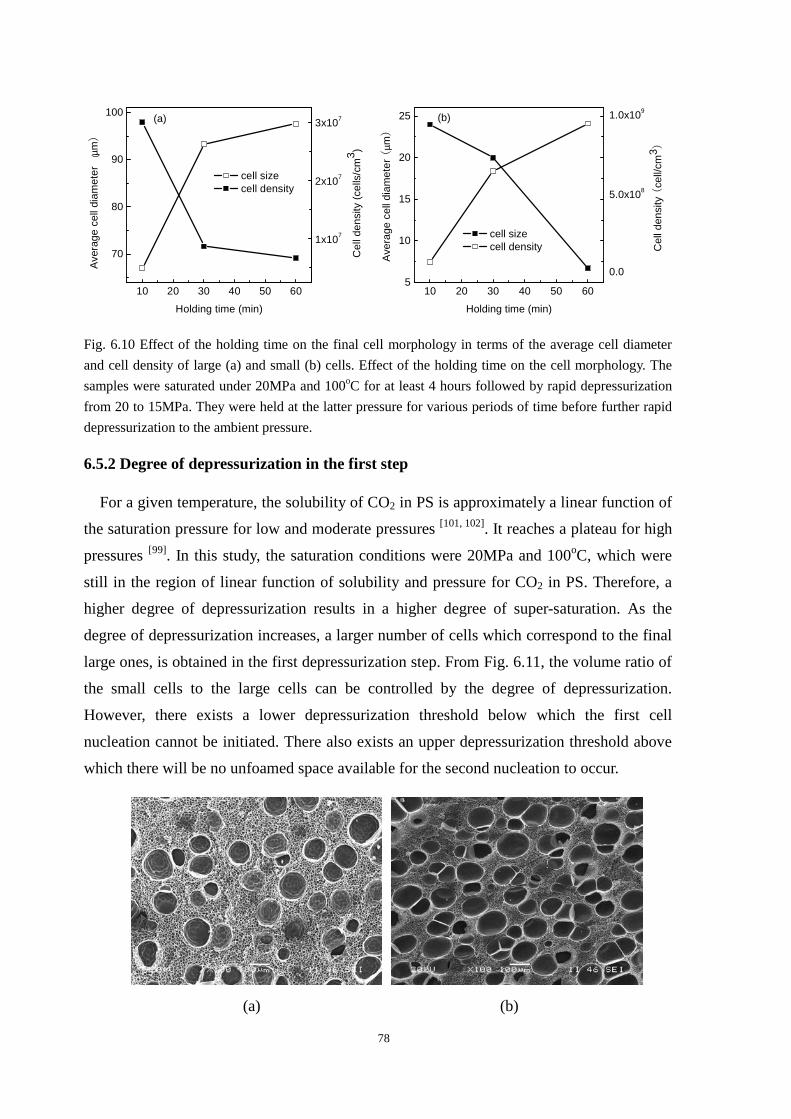
78
10 20 30 40 50 60
70
80
90
100
cell size cell density
Holding time (min)
Ave
rage
cel
l dia
met
er
(µm)
1x10⁷
2x10⁷
3x10⁷
Cel
l den
sity
(ce
lls/c
m3 )
(a)
10 20 30 40 50 605
10
15
20
25
Holding time (min)
Ave
rage
cel
l dia
met
er (
µm)
0.0
5.0x10⁸
1.0x10⁹
cell size cell density C
ell d
ensi
ty (
cell/
cm3 )
(b)
Fig. 6.10 Effect of the holding time on the final cell morphology in terms of the average cell diameter
and cell density of large (a) and small (b) cells. Effect of the holding time on the cell morphology. The
samples were saturated under 20MPa and 100oC for at least 4 hours followed by rapid depressurization
from 20 to 15MPa. They were held at the latter pressure for various periods of time before further rapid
depressurization to the ambient pressure.
6.5.2 Degree of depressurization in the first step
For a given temperature, the solubility of CO2 in PS is approximately a linear function of
the saturation pressure for low and moderate pressures [101, 102]. It reaches a plateau for high
pressures [99]. In this study, the saturation conditions were 20MPa and 100oC, which were
still in the region of linear function of solubility and pressure for CO2 in PS. Therefore, a
higher degree of depressurization results in a higher degree of super-saturation. As the
degree of depressurization increases, a larger number of cells which correspond to the final
large ones, is obtained in the first depressurization step. From Fig. 6.11, the volume ratio of
the small cells to the large cells can be controlled by the degree of depressurization.
However, there exists a lower depressurization threshold below which the first cell
nucleation cannot be initiated. There also exists an upper depressurization threshold above
which there will be no unfoamed space available for the second nucleation to occur.
(a) (b)
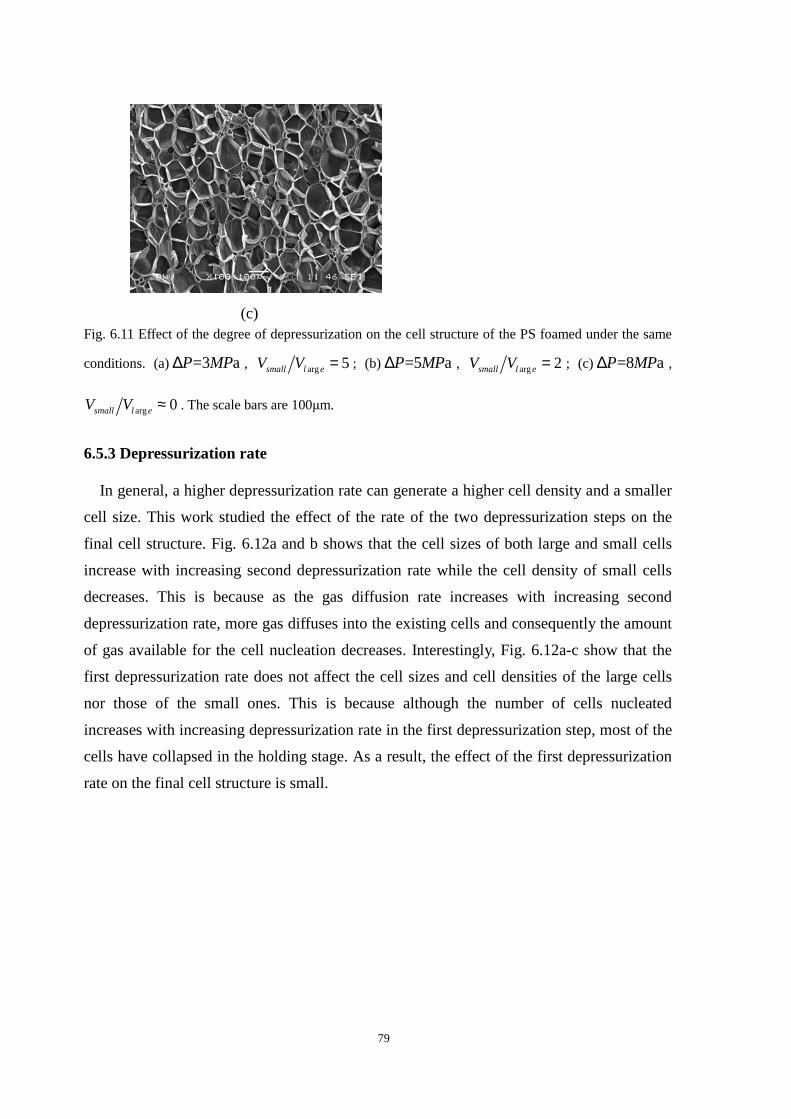
79
(c)
Fig. 6.11 Effect of the degree of depressurization on the cell structure of the PS foamed under the same
conditions. (a) =3 aP MP∆ , arg 5small l eV V = ; (b) =5 aP MP∆ , arg 2small l eV V = ; (c) =8 aP MP∆ ,
arg 0small l eV V ≈ . The scale bars are 100µm.
6.5.3 Depressurization rate
In general, a higher depressurization rate can generate a higher cell density and a smaller
cell size. This work studied the effect of the rate of the two depressurization steps on the
final cell structure. Fig. 6.12a and b shows that the cell sizes of both large and small cells
increase with increasing second depressurization rate while the cell density of small cells
decreases. This is because as the gas diffusion rate increases with increasing second
depressurization rate, more gas diffuses into the existing cells and consequently the amount
of gas available for the cell nucleation decreases. Interestingly, Fig. 6.12a-c show that the
first depressurization rate does not affect the cell sizes and cell densities of the large cells
nor those of the small ones. This is because although the number of cells nucleated
increases with increasing depressurization rate in the first depressurization step, most of the
cells have collapsed in the holding stage. As a result, the effect of the first depressurization
rate on the final cell structure is small.
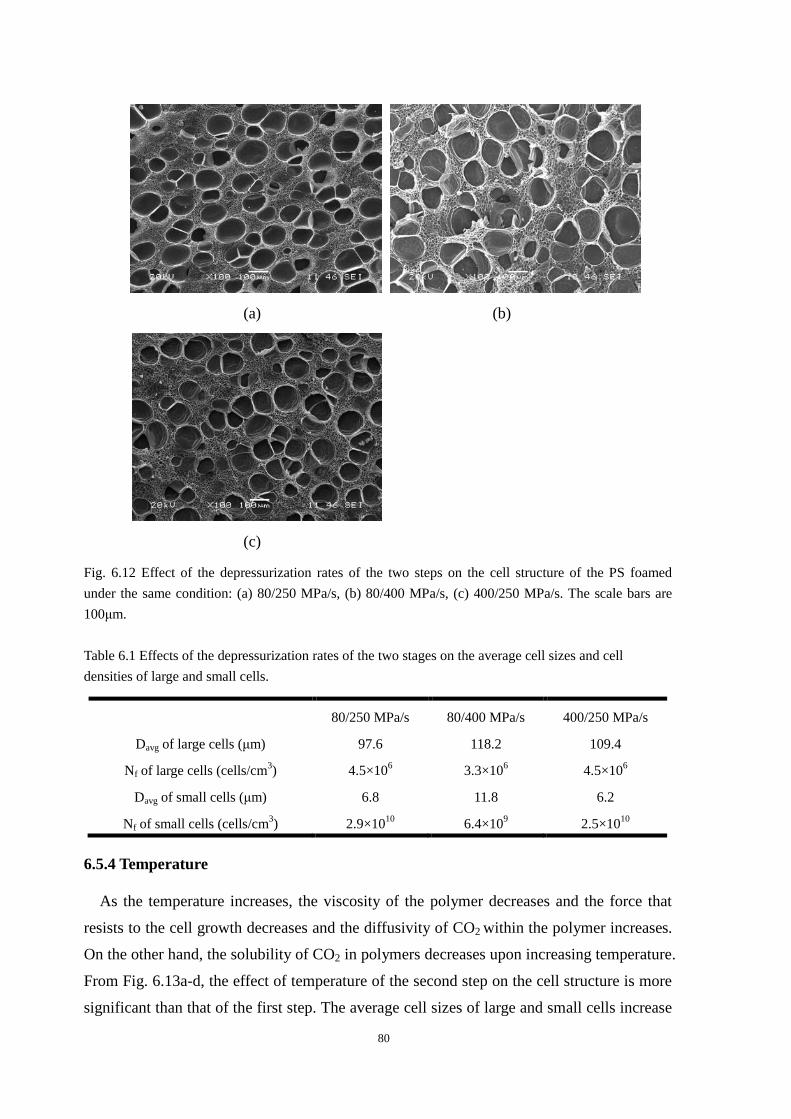
80
(a) (b)
(c)
Fig. 6.12 Effect of the depressurization rates of the two steps on the cell structure of the PS foamed
under the same condition: (a) 80/250 MPa/s, (b) 80/400 MPa/s, (c) 400/250 MPa/s. The scale bars are
100µm.
Table 6.1 Effects of the depressurization rates of the two stages on the average cell sizes and cell
densities of large and small cells.
80/250 MPa/s 80/400 MPa/s 400/250 MPa/s
Davg of large cells (µm) 97.6 118.2 109.4
Nf of large cells (cells/cm3) 4.5×10⁶ 3.3×10⁶ 4.5×10⁶
Davg of small cells (µm) 6.8 11.8 6.2
Nf of small cells (cells/cm3) 2.9×10¹⁰ 6.4×10⁹ 2.5×10¹⁰
6.5.4 Temperature
As the temperature increases, the viscosity of the polymer decreases and the force that
resists to the cell growth decreases and the diffusivity of CO2 within the polymer increases.
On the other hand, the solubility of CO2 in polymers decreases upon increasing temperature.
From Fig. 6.13a-d, the effect of temperature of the second step on the cell structure is more
significant than that of the first step. The average cell sizes of large and small cells increase
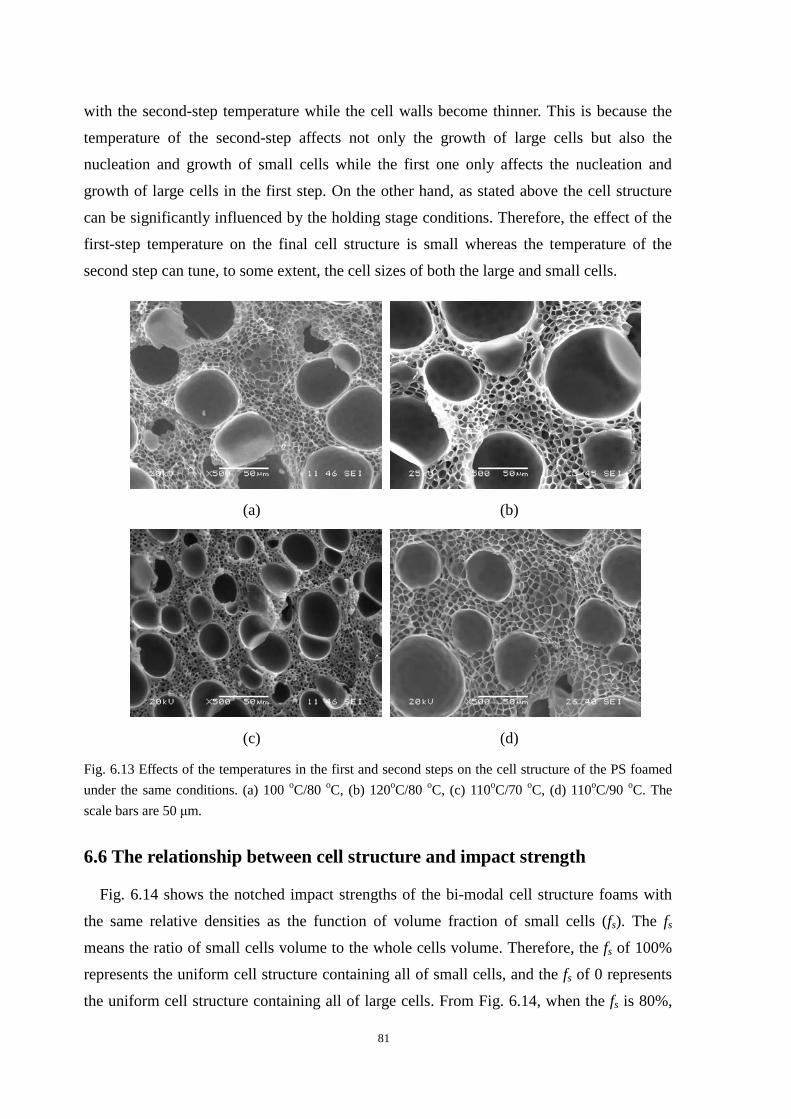
81
with the second-step temperature while the cell walls become thinner. This is because the
temperature of the second-step affects not only the growth of large cells but also the
nucleation and growth of small cells while the first one only affects the nucleation and
growth of large cells in the first step. On the other hand, as stated above the cell structure
can be significantly influenced by the holding stage conditions. Therefore, the effect of the
first-step temperature on the final cell structure is small whereas the temperature of the
second step can tune, to some extent, the cell sizes of both the large and small cells.
(a) (b)
(c) (d)
Fig. 6.13 Effects of the temperatures in the first and second steps on the cell structure of the PS foamed
under the same conditions. (a) 100 oC/80 oC, (b) 120oC/80 oC, (c) 110oC/70 oC, (d) 110oC/90 oC. The
scale bars are 50 µm.
6.6 The relationship between cell structure and impact strength
Fig. 6.14 shows the notched impact strengths of the bi-modal cell structure foams with
the same relative densities as the function of volume fraction of small cells (fs). The fs
means the ratio of small cells volume to the whole cells volume. Therefore, the fs of 100%
represents the uniform cell structure containing all of small cells, and the fs of 0 represents
the uniform cell structure containing all of large cells. From Fig. 6.14, when the fs is 80%,
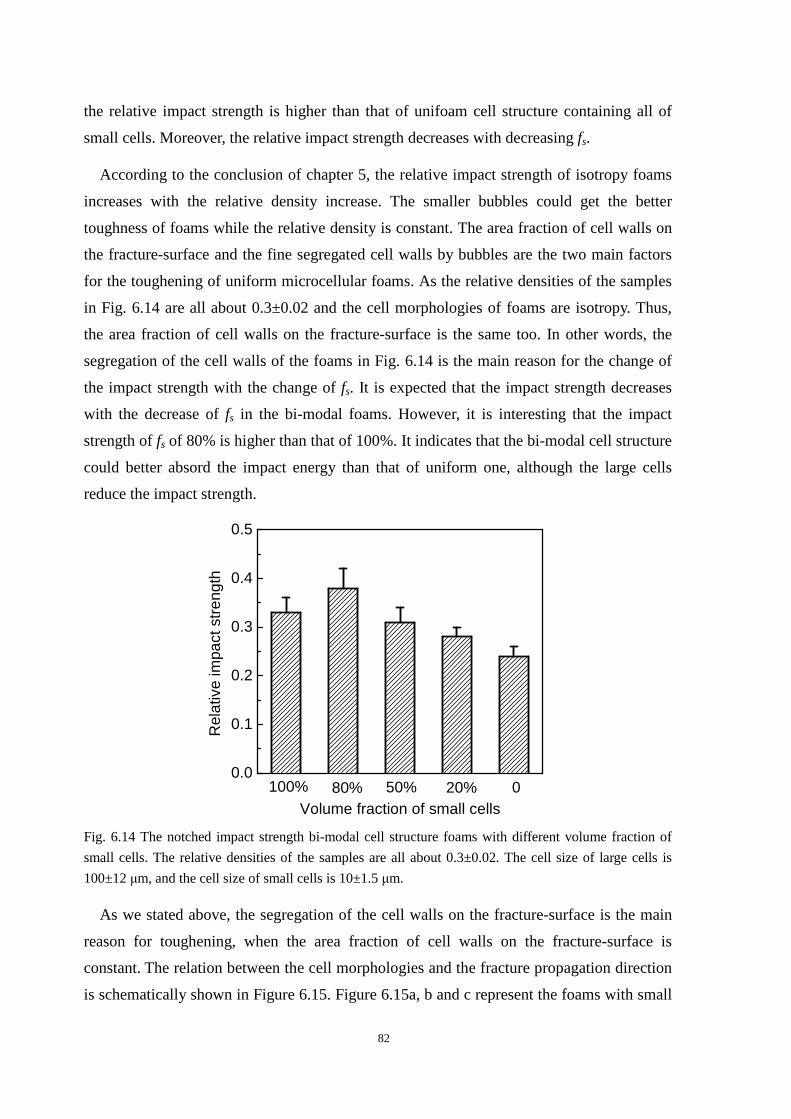
82
the relative impact strength is higher than that of unifoam cell structure containing all of
small cells. Moreover, the relative impact strength decreases with decreasing fs.
According to the conclusion of chapter 5, the relative impact strength of isotropy foams
increases with the relative density increase. The smaller bubbles could get the better
toughness of foams while the relative density is constant. The area fraction of cell walls on
the fracture-surface and the fine segregated cell walls by bubbles are the two main factors
for the toughening of uniform microcellular foams. As the relative densities of the samples
in Fig. 6.14 are all about 0.3±0.02 and the cell morphologies of foams are isotropy. Thus,
the area fraction of cell walls on the fracture-surface is the same too. In other words, the
segregation of the cell walls of the foams in Fig. 6.14 is the main reason for the change of
the impact strength with the change of fs. It is expected that the impact strength decreases
with the decrease of fs in the bi-modal foams. However, it is interesting that the impact
strength of fs of 80% is higher than that of 100%. It indicates that the bi-modal cell structure
could better absord the impact energy than that of uniform one, although the large cells
reduce the impact strength.
0.0
0.1
0.2
0.3
0.4
0.5
020%50%80%
Rel
ativ
e im
pact
str
engt
h
Volume fraction of small cells100%
Fig. 6.14 The notched impact strength bi-modal cell structure foams with different volume fraction of
small cells. The relative densities of the samples are all about 0.3±0.02. The cell size of large cells is
100±12 µm, and the cell size of small cells is 10±1.5 µm.
As we stated above, the segregation of the cell walls on the fracture-surface is the main
reason for toughening, when the area fraction of cell walls on the fracture-surface is
constant. The relation between the cell morphologies and the fracture propagation direction
is schematically shown in Figure 6.15. Figure 6.15a, b and c represent the foams with small
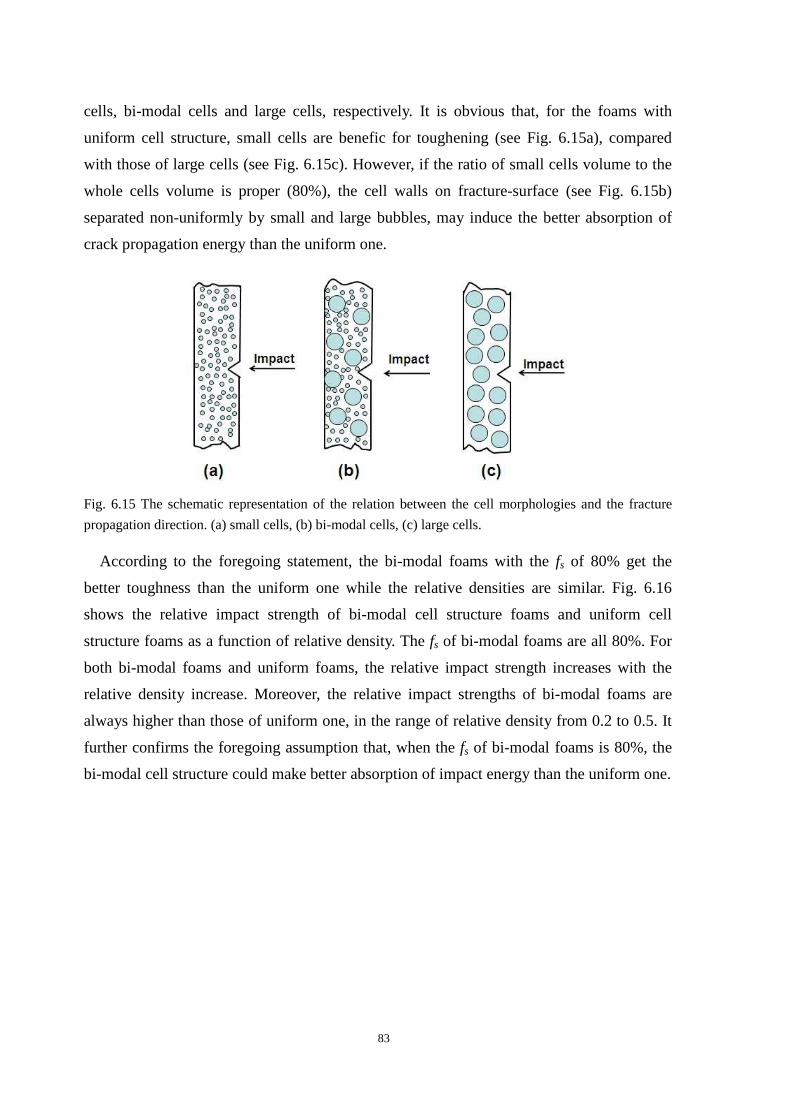
83
cells, bi-modal cells and large cells, respectively. It is obvious that, for the foams with
uniform cell structure, small cells are benefic for toughening (see Fig. 6.15a), compared
with those of large cells (see Fig. 6.15c). However, if the ratio of small cells volume to the
whole cells volume is proper (80%), the cell walls on fracture-surface (see Fig. 6.15b)
separated non-uniformly by small and large bubbles, may induce the better absorption of
crack propagation energy than the uniform one.
Fig. 6.15 The schematic representation of the relation between the cell morphologies and the fracture
propagation direction. (a) small cells, (b) bi-modal cells, (c) large cells.
According to the foregoing statement, the bi-modal foams with the fs of 80% get the
better toughness than the uniform one while the relative densities are similar. Fig. 6.16
shows the relative impact strength of bi-modal cell structure foams and uniform cell
structure foams as a function of relative density. The fs of bi-modal foams are all 80%. For
both bi-modal foams and uniform foams, the relative impact strength increases with the
relative density increase. Moreover, the relative impact strengths of bi-modal foams are
always higher than those of uniform one, in the range of relative density from 0.2 to 0.5. It
further confirms the foregoing assumption that, when the fs of bi-modal foams is 80%, the
bi-modal cell structure could make better absorption of impact energy than the uniform one.

84
0.0
0.2
0.4
0.6
0.50.40.3
Rel
ativ
e im
pact
str
engt
h
Relative density
uniform cell structure bi-modal cell structure
0.2
Fig. 6.16 The notched relative impact strength of bi-modal cell structure foams and uniform cell
structure foams as a function of relative density. The fs of bi-modal foams are all 80%. The average cell
size of foams with uniform cell structure is 10 µm. The average cell size of large cells in the bi-modal
foams is 100±12 µm, and the cell size of small cells in the bi-modal foams is 10±1.5 µm.
6.7 Conclusion
The bi-modal cell structure PS foams is successfully achieved by a two-step
depressurization process using scCO2 as the blowing agent. The holding stage between the
two depressurization steps is the key to the control of the bi-modal cell structure. During
the holding stage, larger cells further grow in size and smaller ones further decrease in size
till complete collapse, by gas diffusion from small cells to large ones. The volume ratio of
the large cells to the small ones can be tuned both by the holding time and the degree of
depressurization in the first step. The depressurization rate and the temperatures of the first
and second steps also influence the cell structure to a certain extent. On the other hand, the
relationship between cell morphologies and impact properties of the bi-modal foams is
investigated. When the relative density is constant, the impact strength of bi-modal foams
decreases with the decrease of fs. For both bi-modal foams and uniform foams, the relative
impact strength increases with the relative density increase. Moreover, with the fs of 80%,
the relative impact strengths of bi-modal foams are always higher than those of uniform one,
in the range of relative density from 0.2 to 0.5. It indicates that, when the fs of bi-modal
foams is 80%, the bi-modal cell structure could make better absorption of impact energy
than the uniform one.

85
Chapter 7 Conclusion
The scCO2 assisted toughening and foaming of PP and PS was studied in this work. The
toughening of iPP by scCO2 induced crystallization for the finely separation of rigid crystal
phase and the soft amorphous phase in polymer matrix was first studied. The results
indicates that the toughness of injection molded iPP specimens can be significantly
improved by controlled shearing, CO2 induced recrystallization and adequate cooling
without loss of strength. Under shear, a high degree of orientation can be obtained with
“shish-kebab” crystals formed in the shear zone. During the subsequent CO2 treatment, a
crystal network morphology may be formed as a result of an increase in the number of the
primary lamellae and that of crosshatched subsidiary lamellae, which leads to an increase in
the toughness. In addition, quenching in ice-water of scCO2 treated iPP promotes the
formation of nano-sized mesomorphic phase domains in the shear zone, which further
toughens the iPP. The impact strength of the best toughened iPP is over 12 times that of the
original one without loss in tensile strength and modulus.
Moreover, the highly oriented iPP samples with “shish-kebab” and “spherulite” were
used for CO2 foaming to investigate the effect of crystalline structure on the formation of
cell nucleation and growth. The use of a highly oriented isotactic polypropylene (iPP) with
a shish-kebab crystalline structure obtained by injection molding as a template allows
obtaining nanocellular foams by CO2 foaming in the solid state under appropriate foaming
temperatures and CO2 pressures. The underlying principle is localized cell nucleation and
growth in amorphous domains confined by the shish-kebab crystalline domains. Therefore,
nano-cells were generated in amorphous domains confined by shish-kebab crystalline
domains which cannot foam. Moreover, at a chosen CO2 pressure, the cell morphology
depends very much on the foaming temperature. For example, when the CO2 pressure is 15
MPa and the foaming temperature is 135oC, only part of weak crystals is molten. When the
temperature is increased to 140oC, more crystals are molten including most of subsidiary
lamellae or kebab and part of primary lamellae or shish. Thus oriented cells in submicron in
size are generated and the un-foamed regions reveal the rest of the crystal structures. When
the temperature is further increased to 143 oC, an open nanocellular morphology (See Fig.
4.10a-b) is successfully obtained with more crystals molten. However, when the
temperature is increased to 146oC, nearly all thin crystals are molten. As a result, cells in
micrometer in size with smooth walls are formed due to weak restrictions of rigid crystals
to cell nucleation, growth and coalescence. Moreover, the impact tests indicate that the
nanocellular bubbles among the network crystals structure can toughening the scCO2
86
treated iPP samples.
In addition, a systematic study of the effect of the foaming conditions and the cell
structural parameters of PS foams on the mechanical properties was studied. PS foams with
isotropy cell morphology and oriented cell morphologies were prepared. The tensile
properties and the impact properties with and without notched were measured. For the
isotropy cell morphologies, the mechanical properties of PS foams increase with the
increase of relative density. When the relative density is constant, the cell size does not
affect the tensile strength and modulus but has a weakly effect on the impact strength. The
relative impact strength increases with the cell size decrease. Besides, the values of relative
impact strength of notched PS samples are always higher than those of non-notched ones,
indicating that the bubbles could increase the crack propagation energy during the impact
process. The solid area (cell walls) fraction on the fracture-surface and the cell walls finely
dispersed by the bubbles are the main reasons for the toughening of PS foams. For oriented
foams, the cell morphologies oriented perpendicular to the impact direction could
significantly enhance the mechanical properties of PS foams. The reasons for the
toughening of c-axis oriented foams are as follows: a) the solid area fraction on the
fracture-surface is higher than that of the isotropy foams with the same relative density; b)
the cell walls on the fracture-surface are finely segregated by the cells, as the cells size is
smaller than that of isotropic one; and c) the oriented cells perpendicular to the impact
direction could increase the crack propagation energy during the fracture process. Moreover,
the oriented cells along the tensile direction and the oriented molecular chains sheared by
the bubbles may both lead to the improvement of strength in oriented direction. on the other
hand, the cells oriented in the other two directions result in the poor impact properties,
because their larger solid area fraction on the fracture-surface and the worse dispersion of
cell walls by bubble compared with those of isotropy foams.
Finally, a two-step depressurization batch process is developed to produce bi-modal cell
structure PS foams by using scCO2 as the blowing agent. This unique cell structure with
both small and large cells homogenous distribution throughout the entire volume of the
foam sample must have particular properties which include both advantages of small cells
and large cells. For instance, small closed cells could act as a role of improving the
mechanical properties of foam product, and on the other hand, large closed cells could be a
role of reducing bulk density. The results indicate that the bi-modal cell structure foams can
be achieved by depressurization in two distinct steps and can be significantly affected by
the process parameters. The process conditions at the holding stage between the two steps
87
are the key to controlling the bi-modal cell structure. When the relative density is constant,
the impact strength of bi-modal foams decreases with the decrease of fs. For both bi-modal
foams and uniform foams, the relative impact strength increases with the relative density
increase. Moreover, with the fs of 80%, the relative impact strengths of bi-modal foams are
always higher than those of uniform one, in the range of relative density from 0.2 to 0.5. It
indicates that, when the fs of bi-modal foams is 80%, the bi-modal cell structure could make
better absorption of impact energy than the uniform one.
88
Acknowledgements
First and foremost I would like to express my best gratitude to my supervisors Prof.
Guo-Hua HU, Prof. Ling Zhao, and Prof. Danielle BARTH. Their creative ideas of research,
patient guidance and consistent encouragement push and inspire me to finish my PhD study.
I also would like to express my great appreciation to associate Prof. Tao LIU and Prof.
Sandrine HOPPE for providing much help and suggestions during my PhD study.
I am greatly thankful to my mates both in Chinese and French groups, Xiu-lei JIANG,
Lei LI, Da-chao LI, Yan-tao LIU, Ming-fei DAI, Peng-jian GONG, Xiao-song LIAN, Jian
LI, Zhou-bo CUI, Fang-lin ZHANG, Zheng-hui LI, Yuan FANG, Shiwei WANG and Sara
RONASI, who kindly helped me a lot during my PhD study. Thanks are also due to my
friends Wu-shun ZHOU, Pei-heng NI, Fang-fang ZHANG, Chuang LIU, Minglei YANG,
Man LUO, Jin-bai ZHANG, Xiao-Bo SONG, Fei MAO, Yuan ZHOU, and Rong FAN, who
have great contributions to my wonderful life both in China and France.
This study could not have been finished without the generous financial support from the National Natural Science Foundation of China (Grants 20976045, 20976046), Shanghai Shuguang Project (08SG28), program for New Century ExcellentTalents In University (NCET-09-0348), 111 Project (B08021), and “the Fundamental Research Funds for the Central Universities”. Thank China Scholarship Council for supporting my studying in France. Finally, I would like to express my great appreciation to my parents for their understanding and encouragement which support me to finish my PhD study.
89
References
[1] Cooper, A. I. Adv. Mater. 2003, 15, (13), 1049-1059.
[2] Kumar, V.; Suh, N. P. Polym. Eng. Sci. 1990, 30 (20), 1323-1329.
[3] Liu, T.; Hu, G.-H.; Tong, G.-S.; Zhao, L.; Cao, G.-P.; Yuan, W.-K. Ind. Eng. Chem. Res. 2005, 44
(12), 4292-4299.
[4] Li, B.; Hu, G. H.; Cao, G. P.; Liu, T.; Zhao, L.; Yuan, W. K. J. Supercrit. Fluid. 2008, 44 (3),
446-456.
[5] Asai, S.; Shimada, Y.; Tominaga, Y.; Sumita, M. Macromolecules 2005, 38 (15), 6544-6550.
[6] Liu, T.; Hu, G. -H.; Tong, G. -S.; Zhao, L.; Cao, G. -P.; Yuan, W. -K. Ind. Eng. Chem. Res. 2005, 44
(12), 4292-4299.
[7] Tong, G. -H.; Liu, T.; Hu, G. -H.; Hoppe, S.; Zhao, L.; Yuan, W. -K. Chem. Eng. Sci. 2007, 62
(18-20), 5290-5294.
[8] Tong, G. -H.; Liu, T.; Hu, G. -H.; Zhao, L.; Yuan, W. -K. J. Supercrit. Fluid. 2007, 43 (1), 64-73.
[9] Li, B.; Hu, G. -H.; Cao, G. -P.; Liu, T.; Zhao, L.; Yuan, W. -K. J. Appl. Polym. Sci. 2006, 102 (4),
3212-3220.
[10] Li, B.; Zhu, X. Y.; Hu, G. H.; Liu, T.; Cao, G. P.; Zhao, L.; Yuan, W. K. Polym. Eng. Sci. 2008, 48
(8), 1608-1614.
[11] Koga, Y.; Saito, H. Polymer 2006, 47 (21), 7564-7571.
[12] Takada, M.; Tanigaki, M.; Ohshima, M. Polym. Eng. Sci. 2001, 41 (11), 1938-1946.
[13] Miller, D.; Kumar, V. Polymer 2009, 50 (23), 5576-5584.
[14] Chul B. Park, Daniel F. Baldwin, N.P. Suh, Polym. Eng. Sci. 1995, 35, 432-440.
[15] Martini, J.; Waldman, F. A.; Suh, N. P. SPE ANTEC:San Francisco, CA, 1982, 28, 674.
[16] Martini, J.; Suh, N. P.; Waldman, F. A. USA: Massachusetts Institute of Technology (1984), Pat.
#4473665.
[17] Xu, Z.-M.; Jiang, X.-L.; Liu, T.; Hu, G.-H.; Zhao, L.; Zhu, Z.-N.; Yuan, W.-K. J. Supercrit. Fluid.
2007, 41 (2), 299-310.
[18] Doroudiani, S.; Park, C. B.; Kortschot, M. T. Polym. Eng. Sci. 1998, 38 (7), 1205-1215.
[19] Park, C. B.; Cheung, L. K. Polym. Eng. Sci. 1997, 37 (1), 1-10.
[20] Bao, J.-B.; Liu, T.; Zhao, L.; Hu, G.-H. J. Supercrit. Fluid. 2011, 55 (3), 1104-1114.
[21] Kelyn A. A.; Alan J. L.; Thomas J. M. Macromolecules 1998, 31, 4614-4620.
[22] Galli, P.; Vecellio, G. Prog. Polym. Sci. 2001, 26 (8), 1287-1336.
[23] Tian, Z.; Gu, X. P.; Wu, G. L.; Feng, L. F.; Fan, Z. Q.; Hu, G. H. Ind. Eng. Chem. Res. 2011, 50 (10),
5992-5999.
[24] Ray, S. S.; Okamoto, M. Prog. Polym. Sci. 2003, 28, 1539-1641.
90
[25] Thio, Y. S.; Argon, A. S.; Cohen, R. E.; Weinberg, M. Polymer 2002, 43 (13), 3661-3674.
[26] Karnani, R.; Krishnan, M.; Narayan, R. Polym. Eng. Sci. 1997, 37, 476-487.
[27] Grein, C. Adv. Polym. Sci. 2005, 188, 43-104.
[28] Oda, T.; Saito, H. J. Polym. Sci., Part B: Polym. Phys. 2004, 42 (9), 1565-1572.
[29] Teramoto, G.; Oda, T.; Saito, H. Sano, H. Fujita, Y. J. Polym. Sci., Part B: Polym. Phys. 2004, 42
(14), 2738-2746.
[30] Meijer, H. E. H.; Govaert, L. E. Prog. Polym. Sci. 2005, 30 (8-9), 915-938.
[31] Chen, H. B.; Karger-Kocsis, J.; Wu, J. S.; Varga, J. Polymer 2002, 43 (24), 6505-6514.
[32] Varga, J. J. Macromol. Sci. Phys. 2002, 41, 1121-1171.
[33] Wang, Y.; Zhang, Q.; Na, B.; Du, R.; Fu, Q.; Shen, K. Polymer 2003, 44 (15), 4261-4271.
[34] Chen, Y.-H.; Zhong, G.-J.; Wang, Y.; Li, Z.-M.; Li, L. Macromolecules 2009, 42 (12), 4343-4348.
[35] Schrauwen, B. A. G.; Breemen, L. C. A. v.; Spoelstra, A. B.; Govaert, L. E.; Peters, G. W. M.;
Meijer, H. E. H. Macromolecules 2004, 37 (23), 8618-8633.
[36] Kalay, G.; Michael, J. B. J. Polym. Sci., Part B: Polym. Phys. 1997, 35, 241-263.
[37] Pantani, R.; Coccorullo, I.; Speranza, V.; Titomanlio, G. Prog. Polym. Sci. 2005, 30 (12),
1185-1222.
[38] Bruckner, S.; Meille, S. V.; Petraccone, V.; Pirozzi, B. Prog. Polym. Sci. 1991, 16 (2-3), 361-404.
[39] Meijer, H. E. H.; Govaert, L. E. Prog. Polym. Sci. 2005, 30 (8-9), 915-938.
[40] Wang, K.; Chen, F.; Zhang, Q.; Fu, Q. Polymer 2008, 49 (22), 4745-4755.
[41] Zhu, P.-W.; Tung, J.; Phillips, A.; Edward, G. Macromolecules 2006, 39 (5), 1821-1831.
[42] Jiang, X. -L.; Liu, T.; Xu, Z. -M.; Zhao, L.; Hu, G. -H.; Yuan, W. -K. J. Supercrit. Fluid. 2009, 48
(2), 167-175.
[43] Agarwal, P. K.; Somani, R. H.; Weng, W.; Mehta, A.; Yang, L.; Ran, S.; Liu, L.; Hsiao, B. S.
Macromolecules 2003, 36 (14), 5226-5235.
[44] Ogino, Y.; Fukushima, H.; Takahashi, N.; Matsuba, G.; Nishida, K.; Kanaya, T. Macromolecules
2006, 39 (22), 7617-7625.
[45] Bao, J.-B.; Tiu, T.; Zhao, L.; Hu, G.-H. Ind. Eng. Chem. Res. 2011, 50, 9632-9641.
[46] Siripurapu, S.; DeSimone, J. M.; Khan, S. A.; Spontak, R. J. Adv. Mater. 2004, 16 (12), 989-994.
[47] Krause, B.; Koops, G. H.; van der Vegt, N. F. A.; Wessling, M.; Wübbenhorst, M.; van Turnhout, J.
Adv. Mater. 2002, 14 (15), 1041-1046.
[48] Yokoyama, B. H.; Li, L.; Nemoto, T.; Sugiyama, K. Adv. Mater. 2004, 16 (17), 1542-1546.
[49] Xu, X.; Park, C. B.; Xu, D.; Pop-Iliev, R. Polym. Eng. Sci. 2003, 43 (7), 1378-1390.
[50] Li, L.; Yokoyama, H.; Nemoto, T.; Sugiyama, K. Adv. Mater. 2004, 16 (14), 1226-1229.
[51] Arora, K. A.; Lesser, A. J.; McCarthy, T. J. Macromolecules 1998, 31 (14), 4614-4620.

91
[52] Leung, S. N.; Park, C. B.; Xu, D.; Li, H.; Fenton, R. G. Ind. Eng. Chem. Res. 2006, 45 (23),
7823-7831.
[53] Nemoto, T.; Takagi, J.; Ohshima, M. Macromol. Mater. Eng. 2008, 293 (7), 574-580.
[54] Colton, J. S.; Suh, N. P. Polym. Eng. Sci. 1987, 27 (7), 485-492.
[55] Sun, H.; Sur, G. S.; Mark, J. E. Eur. Polym. J. 2002, 38 (12), 2373-2381.
[56] Collias, D. I.; Baird, D. G.; Borggreve, R. J. M. Polymer 1994, 35 (18), 3978-3983.
[57] Kabir, M. E.; Saha, M. C.; Jeehani, S. Mater. Sci. Eng.: A 2006, 429 (1,2), 225-235.
[58] Rachtanapun, P.; Selke, S. E. M.; Matuana, L. M. Polym. Eng. Sci. 2004, 44 (8), 1551-1560.
[59] Zeng, C.; Han, X.; Lee, L. J.; Koelling, K. W.; Tomasko, D. L. Adv. Mater. 2003, 15 (20),
1743-1747.
[60] Kumar, V.; VanderWel, M.; Weller, J.; Seeler, K. J. Eng. Mater. Technol. 1994, 116 (4), 439-445.
[61] Shimbo, M.; Higashitani, I.; Miyano, Y. J. Cell. Plast. 2007, 43, 157-167.
[62] Kumar, V.; Weller, J.; Ma, M.; Montecillo, R.; Kwapisz, R. Cell. Polym. 1998, 17 (5), 350-361.
[63] Waldman, F. M. S. Thesis, Massachusetts Institute of Technology, Cambridge, MA, 1982.
[64] Collias, D. I.; Baird, D. G. Polym. Eng. Sci. 1995, 35 (14), 1178-1183.
[65] Barlow, C.; Kumar, V.; Flinn, B.; Bordia, R.; Weller, J. J. Eng. Mater. Technol. 2001, 123 (2),
229-233.
[66] Doroudiani, S.; Kortschot, M. T. J. Appl. Polym. Sci. 2003, 90 (5), 1421-1426.
[67] Brandrup, S.; Immergut, E. M. Polymer Handbook, John Wiley & Sons: New York, 1975.
[68] Turner-Jones, A.; Cobbold, A. J. J. Polym. Sci.: Polym. Lett. 1968, 6, 539-546.
[69] Pornnimit, B.; Gottfried, W. E. Adv. Polym. Technol. 1991, 11 (2), 91-98.
[70] Na, B.; Wang, K.; Zhang, Q.; Du, R.; Fu, Q. Polymer 2005, 46 (9), 3190-3198.
[71] Varga, J.; Menyhard, A. Macromolecules 2007, 40 (7), 2422-2431.
[72] Androsch, R.; Wunderlich, B. Macromolecules 2001, 34 (23), 8384-8387.
[73] De Santis, F.; Adamovsky, S.; Titomanlio, G.; Schick, C. Macromolecules 2006, 39 (7), 2562-2567.
[74] Androsch, R.; Wunderlich, B. Macromolecules 2001, 34 (17), 5950-5960.
[75] Tanniru, M.; Yuan, Q.; Misra, R. D. K. Polymer 2006, 47 (6), 2133-2146.
[76] Yuan, Q.; Misra, R. D. K. Polymer 2006, 47 (12), 4421-4433.
[77] Yang, G.; Han, L.; Ding, H.; Wu, H.; Huang, T.; Li, X.; Wang, Y. Mater. Sci. Eng. A 2011, 528 (3),
1382-1390.
[78] Jacoby, P.; Bersted, B. H.; Kissel, W. J.; Smith, C. E. J. Polym. Sci., Part B: Polym. Phys. 1986, 24
(3), 461-491.
[79] Kalay, G.; Zhong, Z.P.; Allan, P.; Bevis, M.J. Polymer 1996, 37 (11), 2077-2085.
[80] Zia, Q.; Androsch, R.; Radusch, H.-J.; Piccarolo, S. Polymer 2006, 47 (24), 8163-8172.
92
[81] Wang, Z.-G.; Hsiao, B. S.; Srinivas, S.; Brown, G. M.; Tsou, A. H.; Cheng, S. Z. D.; Stein, R. S.
Polymer 2001, 42 (18), 7561-7566.
[82] Minami, S.; Tsurutani, N.; Miyaji, H.; Fukao, K.; Miyamoto, Y. Polymer 2004, 45 (5), 1429-1432.
[83] Goel, S. K.; Beckman, E. J. Polym. Eng. Sci. 1994, 34 (14), 1137-1147.
[84] Goel, S. K.; Beckman, E. J. Polym. Eng. Sci. 1994, 34 (14), 1148-1156.
[85] Baldwin, D. F.; Park, C. B.; Suh, N. P. Polym. Eng. Sci. 1996, 36 (11), 1437-1445.
[86] Naguib, H. E.; Park, C. B. J. Appl. Polym. Sci. 2008, 109 (6), 3571-3577.
[87] Li, D.-C.; Liu, T.; Zhao, L.; Yuan, W.-K. Ind. Eng. Chem. Res. 2009, 48 (15), 7117-7124.
[88] Tiu, L.; Zhao, L.; Zhu, X. Y. J. Macromol. Sci., Part B 2010, 49 (4), 821-832.
[89] Tomasko, D. L.; Li, H.; Liu, D.; Han, X.; Wingert, M. J.; Lee, L. J.; Koelling, K. W. Ind. Eng.
Chem. Res. 2003, 42 (25), 6431-6456.
[90] Leung, S. N.; Wong, A.; Guo, Q.; Park, C. B.; Zong, J. H. Chem. Eng. Sci. 2009, 64 (23),
4899-4907.
[91] Otsuka, T.; Taki, K.; Ohshima, M. Macromol. Mater. Eng. 2008, 293 (1), 78-82.
[92] Taki, K.; Waratani, Y.; Ohshima, M. Macromol. Mater. Eng. 2008, 293 (7), 589-597.
[93] Somani, R. H.; Yang, L.; Hsiao, B. S. Polymer 2006, 47 (15), 5657-5668.
[94] Zhang, Z.; Handa, Y. P. Macromolecules 1997, 30 (26), 8505-8507.
[95] Kelyn, A. A.; Alan, J. L.; Thomas, J. M. Polym. Eng. Sci. 1998, 38 (12), 2055-2062.
[96] Miller, D.; Kumar, V. Polymer 2011, 52 (13), 2910-2919.
[97] Chow, T. S. Macromolecules 1980, 13 (2), 362-364.
[98] Chow, T. S.; Barlow, J. W.; Paul, D. R. J. Appl. Polym. Sci. 1985, 30 (6), 2633-2642.
[99] Pantoula, M.; Panayiotou, C. J. Supercrit. Fluid. 2006, 37, 254-262.
[100] Gibson, L. G.; Ashby, M. F. Cellular Solids: Structure and Properties; Pergamon: New York,
1988.
[101] Sato, Y.; Takikawa, T.; Takishima, S.; Masuoka, H. J. Supercrit. Fluid. 2001, 19 (2), 187-198.
[102] Sato, Y.; Fujiwara, K.; Takikawa, T.; Sumarno, Takishima, S.; Masuoka, H. Fluid Phase Equil.
1999, 162 (1,2), 261-276.
[103] Knott, J. F. Fundamentals of fracture mechanics; Butterworth: London, 1973.
[104] Fu, J.; Jo, C.; Naguib, H. E. Cell. Polym. 2005, 24, 177-196.
[105] Matuana, L. M.; Park, C. B. Cell. Polym. 1998, 17, 1-16.
[106] Shimbo, M.; Baldwin, D. F.; Suh, N. P. Proceedings of the ACS Division of Polymeric Materials
Science and Engineering 1992, 67, 512-513.
[107] Seeler, K. A.; Kumar, V.; J. Reinforced Plastics and Composites 1993, 12, 359.
[108] Shimbo, M.; Baldwin, D. F.; Suh, N. P. Polym. Eng. Sci. 1995, 35, 1387-1393.

93
[109] Sun, H.; Mark, J. E. J. Appl. Polym. Sci. 2002, 86, 1692-1701.
[110] Tsivintzelis, I.; Angelopoulou, A. G.; Panayiotou, C. Polymer 2007, 48, 5928-5939.
[111] Gendron, R.; Huneault M.; Tatibouet, J. Cell. Polym. 2002, 21, 315–341.
[112] Kuhn, J.; Ebert, H. P.; Arduini-Schuster, M. C. J. Heat Mass Transfer 1992, 35, 1795–1801.
[113] Huang Q.; Seibig B.; Paul, D. J. Cell. Plast. 2000, 2, 112-125.
[114] Ahmed M. Y. S.; Park C. B.; Atalla N. Cell. Polym. 2006, 25, 277-292.
[115] Arora P.; Zhang Z. Chemical Reviews 2004, 104, 4419-4462.
[116] Hentze H. P.; Antonietti M. Reviews in Molecular Biothchnology 2002, 90, 27-53.
[117] Park C. B.; Behravesh A. H.; Venter R. D. ACS Symp. Ser. 1997, 669 (Polymeric Foams), 115-129.
[118] Lee, K. M.; Lee, E. K.; Kim, S. G.; Park, C. B.; Naguib, H. E. J. Cell. Plast. 2009, 45, 539-553.
[119] Zhang, Z. Y.; Handa, Y. P. J. Polym. Sci. Part B: Polym. Phys. 1998, 36, 977-982.
[120] Leung S. N.; Wong A.; Park C. B.; Guo Q. Ind. Eng. Chem. Res. 2009, 48, 1921-1927.
[121] Guo Q.; Wang J.; Park C. B.; Ohshima M. Ind. Eng. Chem. Res. 2006, 18, 6153-6161.
94
95
TITRE
Elaboration de polypropylène ou de polystyrène à l'aide du dioxyde de carbone supercritique : procédé –
microstructure – propriétés mécaniques
RESUME
Le moussage du polypropylène (PP) et du polystyrène (PS) par le scCO2 est étudié de manière
systématique avec l’accent sur la relation entre le procédé, la microstructure et les propriétés mécaniques.
La première partie de cette thèse porte sur l’amélioration de la résistance au choc du PP par
cristallisation induite par le scCO2. Dans un deuxième temps, le PP fortement orienté avec des structures
shish-kebab et sphérolite est utilisé pour étudier l’influence de la structure cristalline sur la nucléation et
la croissance des cellules pendant le procédé de moussage sous le scCO2. Ensuite, les influences des
conditions de moussage ainsi que celles des paramètres structuraux de la mousse de PS ont été étudiées.
Les mousses de PS à cellules isotropes ont été comparées avec celles de PS à cellules orientées. Enfin,
un procédé de moussage discontinu en deux étapes est développé afin de produire des mousses de PS à
cellules bi-modales en utilisant le scCO2 en tant qu’agent de moussage. Cette structure unique de petites
et grandes cellules réparties de manière homogène au travers de l’ensemble du volume de la mousse
confère à cette dernière des propriétés particulières.
MOTS-CLES
Polypropylène, polystyrène, scCO2, cristallisation, mousse, propriétés mécaniques.
TITLE
Supercritical carbon dioxide assisted toughening of polypropylene or polystyrene:
process, microstructure and mechanical properties
ABSTRACT
In this work, scCO2 induced foaming of PP or PS is systematically studied with emphasis on the
relationship between process, microstructure and mechanical properties. The first part of the thesis deals
with the toughening of iPP by scCO2 induced crystallization for the fine separation of rigid crystalline
domains and soft amorphous ones in the polymer matrix. The highly oriented iPP with “shish-kebab”
and “spherulite” are then used for CO2 foaming to investigate the effect of crystalline structure on the
formation of cell nucleation and growth. In addition, the effect of the foaming conditions and the cell
structural parameters of PS foams on the mechanical properties are studied systematically. PS foams
with isotropic cell morphology and oriented cell one are prepared. Finally, a two-step depressurization
batch process is developed to produce bi-modal cell structure PS foams by using scCO2 as the blowing
agent. This unique cell structure with both small and large cells homogenously distributed throughout the
entire volume of the foam sample might have particular properties.
KEY WORDS
Polypropylene, polystyrene, scCO2, crystallization, foam, mechanical property
Recommended