1
LIFE Project Number
LIFE09 ENV/GR/00289
FINAL Report Covering the project activities from 01/09/2010 to 31/08/2014
Reporting Date
12/05/2015
LIFE+ PROJECT NAME or Acronym
ACEPT-AIR
Project Data
Project location Athens, Thessaloniki, Volos (Greece)
Project start date: 01/09/2010
Project end date: 31/08/2014 Extension date:
Total Project duration
(in months) 48 months ( including Extension of 0 months)
Total budget € 1,750,040
Total eligible budget € 836,449
EU contribution: € 836,449
(%) of total costs 47.8 %
(%) of eligible costs 49 %
Coordinating Beneficiary Data
Name Beneficiary N.C.S.R. “Demokritos”
Contact person Mr. Konstantinos Eleftheriadis
Postal address Environmental Radioactivity Laboratory, Neapoleos & Patr. Gregoriou
E’, GR 15310, Agia Paraskevi, Attica, Greece
Visit address Environmental Radioactivity Laboratory, Neapoleos & Patr. Gregoriou
E’, GR15310, Agia Paraskevi, Attica, Greece
Telephone +30-210-650-3008
Fax: +30-210-650-3050
2
E-mail [email protected]
Project Website http://www.aceptair.prd.uth.gr
Associated Beneficiary Data
Name Beneficiary University of Thessaly
Contact person Mr. Athanasios Kungolos
Postal address Department of Planning and Regional Development, Pedion Areos, GR,
38334, Volos, Greece
Visit address Department of Planning and Regional Development, Pedion Areos, GR,
38334, Volos, Greece
Telephone +30-24210-74480
Fax: +30-24210-74276
E-mail [email protected]
Name Beneficiary Aristotle University of Thessaloniki
Contact person Mrs. Constantini Samara
Postal address Department of Chemistry, University Campus, GR, 54124,
Thessaloniki, Greece
Visit address Department of Chemistry, University Campus, GR, 54124,
Thessaloniki, Greece
Telephone +30-2310-997805
Fax: +30-2310-997747
E-mail [email protected]
Name Beneficiary Axon Envirogroup Ltd.
Contact person Mrs. Athena Progiou
Postal address 18, Troias Street, GR 11257, Athens, Greece
Visit address 18, Troias Street, GR 11257, Athens, Greece
Telephone +30-210-8223083
Fax: +30-210-8238604
E-mail [email protected]
Name Beneficiary Technical University of Crete
Contact person Mr. Michail Lazaridis
Postal address Environmental Engineering Department, Agiou Titou square, GR
73100, Chania, Crete, Greece
Visit address Environmental Engineering Department, Agiou Titou square, GR
73100, Chania, Crete, Greece
Telephone +30-28210-37813
E-mail [email protected]
3
1. List of contents
Table of contents
Page
1. List of contents ............................................................................................................. 3
2. Executive summary ......................................................................................................... 4
3. Introduction .................................................................................................................... 8
4. Administrative part - Action 1: Project management ..................................................... 9
4.1 Description of the management system .................................................................... 9
4.2 Evaluation of the management system ..................................................................... 9
5. Technical part ................................................................................................................. 13
5.1. Technical progress, per task .................................................................................... 13
5.1.1. Action 2. Construction of PM concentration databases ................................. 13
5.1.2. Action 3. Application of state of the art source apportionment techniques
based on the developed databases and receptor modelling ...................................... 22
5.1.3. Action 4. Construction of emission inventories ............................................. 27
5.1.4. Action 5. An operational platform for the Control PM concentrations
Policy Tool ............................................................................................................... 31
5.1.5. Action 6. Development and application of a two-way direct interaction
process with stakeholders ........................................................................................ 35
5.1.6. Action 7. Active application of the developed policy tool ............................ 39
5.1.7. Action 10. Monitoring of Project progress .................................................... 43
5.1.8. Action 11. Action plan formulation for PM reduction .................................. 45
5.2. Dissemination actions ........................................................................................... 48
5.2.1. Objectives ...................................................................................................... 48
5.2.2. Action 8. Organization of an Open Forum and an International Conference.. 48
5.2.3. Action 9. Dissemination and mobilization of society .................................... 50
5.2.4. Action 12. After-life communication & continuation plan ........................... 55
5.3 Evaluation of Project Implementation .................................................................... 57
5.3.1. Methodological approaches ........................................................................... 57
5.3.2. Achievement of objectives ............................................................................ 57
5.4 Analysis of long-term benefits ............................................................................... 61
6. Comments on the financial report ................................................................................ 63
6.1. Summary of Costs Incurred ................................................................................... 63
6.2. Accounting system ................................................................................................ 63
6.3. Partnership arrangements ...................................................................................... 64
6.4. Auditor's report/declaration ................................................................................... 64
6.5 Summary of costs per action ................................................................................... 65
7. Annexes ......................................................................................................................... 66
7.1 Administrative annexes ........................................................................................... 66
7.2 Technical annexes ................................................................................................... 66
7.3 Dissemination annexes ........................................................................................... 67
7.3.1 Layman's report .............................................................................................. 67
7.3.2 After-LIFE Communication plan ................................................................... 67
7.3.3 Other dissemination annexes .......................................................................... 67
7.4 Final table of indicators .......................................................................................... 67
8. Financial report and annexes ........................................................................................ 67

4
2. Executive Summary
ACEPT-AIR project aims to provide the National Authorities at Central, Regional and Local
level with the means to control PM2.5 and PM10 concentrations in the ambient atmosphere.
Airborne Particulate Matter (PM) is a complex mixture of microscopic particles derived from
both anthropogenic and natural sources. During the last decades toxicological and
epidemiological data have provided evidence on the significant detrimental effects of PM on
human health. Despite EU mitigation policies and air quality legislation setting limit values
for exposure to PM, pollution from particulate matter remains a major environmental problem
in several countries in the EU. Greece in particular is one of the EU countries where a great
deal of improvement with respect to emission control strategies can be made. The main
objectives of ACEPT-AIR project are (i) to unravel the relative contribution of the multiple
anthropogenic and natural sources to the observed PM air concentrations, (ii) to document the
relative contribution of secondary aerosol particles in relation to those from primary
emissions and (iii) to combine all available data on a versatile Environment Policy Tool that
may assist relevant authorities to develop cost-effective mitigation strategies for the control of
particulate pollution in Greece.
The project has been implemented in three urban areas in Greece: Athens, the capital of
Greece, Thessaloniki, the second larger city in the country and Volos, a medium sized city
characterized by intense anthropogenic activities (such as a harbour for commercial and
passenger vessels and industrial units in close vicinity to the city) and a topography that
inhibits dilution and diffusion or air pollutants. The key deliverables and output of ACEPT-
AIR project are:
A database of PM10 and PM2.5 concentrations and detailed chemical characterization
for three urban areas in Greece (Athens, Thessaloniki and Volos);
Identification of major PM emission sources and quantification of their contribution to
ambient concentrations of PM10 and PM2.5 at the three cities by receptor modelling;
Emission inventories for anthropogenic and natural sources for the years 2000-2013 at
the three cities and future projections;
ACEPT-AIR Policy Tool, a public software that relates source contribution (from
receptor modelling and emission inventories) with ambient PM concentrations and
estimates changes in PM levels due to increases or decreases in the emissions of
specific sources;
Characterization of current situation of ambient air quality in the three areas and
assessment of possible decreases in PM levels based on specific emission control
scenarios;
A set of guidelines for effective formulation of Action Plans for the three studied
areas, based on the data collected and the application of ACEPT-AIR Policy Tool;
Transfer of experience gained to national, regional and local authorities and training
on the use of ACEPT-AIR Policy Tool;
Organization of 1 International Conference and 1 Open Forum dedicated to policy
makers, NGOs and stakeholders from the public and private sector;
The ACEPT-AIR website, containing details on project objectives, actions and key
results and outcome;

5
Training of 110 secondary education teachers through the organization of seminars on
air pollution at the three cities;
1 Layman’s report on actions, tools, effects and long term benefits from the project;
Production of information material for the general public: Notice boards at the three
studied areas, 3 leaflets, 1 brochure and 1 DVD publicizing the project objectives and
results;
12 press releases and 14 articles in the national and local press
5 publications in international scientific journals and 19 presentations in national on
international conferences;
5 reports to the E.C., including Inception, Progress, Midterm and Final Reports.
The current report provides a summary of the work performed in the framework of the
project, including key outcome. The detailed results are provided in the Deliverables of each
Action, submitted together with this report (Deliverables D6-D32).
Chapter 3 provides an introduction on the environmental problem targeted, the project
major objectives, methods and approaches employed for achieving these objectives, as well as
the key results obtained. In addition, the environment benefits of the project outcome are
discussed in terms of tools and data provided to policy makers and relevant authorities, as
well as the implementation of EU regulation and future EU and global applicability of the
developed software.
Chapter 4 provides a description of the Project Management system, including: a
presentation of the coordinating and associated beneficiaries, a description of the management
committees and their responsibilities, the working methods employed, an organigramme of
ACEPT-AIR management team, a list of project implementation phases and planning /
executing of relevant tasks and a timetable of Actions indicating foreseen and actual times. In
addition, an evaluation of the management system is provided based on the management
processes implemented, collaboration between partners and effective communication with the
EC and Monitoring team.
Chapter 5 includes a description of the work performed in the framework of each project
Action. The beneficiaries involved, methods employed and obtained results are mentioned for
each Action. A list of Deliverables and Milestones are also provided and the foreseen and
actual dates of completion are indicated. Any major problems encountered during the
implementation of the Action are described. In addition, the perspectives of continuing the
work done in each Action after the end of project are analyzed. Any complementary activities
performed in the framework of each Action but outside the objectives and funding of LIFE+
are also mentioned. Section 5.1 includes the Actions related to the technical part of the project
(Actions 2-7 and 10-12) and Section 5.2 includes the Actions related to dissemination
activities (Actions 8 and 9).
Section 5.1.1 presents the work performed in the framework of Action 2 “Construction of
PM concentration databases”. The measurement campaigns conducted in Athens,
Thessaloniki and Volos are described, including instrumentation and analytical methods
employed. A short description of ACEPT-AIR Database is provided. Summary results are
presented on PM10 and PM2.5 levels at the three studied cities and concentrations of major
components: organic and elemental carbon, ions and major and trace elements.
6
Section 5.1.2 presents the work performed in the framework of Action 3 “Application of
state of the art source apportionment techniques based on the developed databases and
receptor modelling”. The two receptor models used (Positive Matrix Factorization, PMF and
Chemical Mass Balance, CMB) are described, as well as the input databases for each model.
Results on the major sources and their contributions to PM concentration levels are provided
for each city, including a comparison of the output of PMF and CMB models. Temporal
variation in source chemical composition and strength is also discussed, in terms of seasonal
variability as well as long-term variability in the course of the last decade.
Section 5.1.3 presents the work performed in the framework of Action 4 “Construction of
emission inventories”. The anthropogenic and natural sources considered are described.
Emission strengths for the three cities during the years 2000-2013 are presented, relevant
long-term trends in emissions are discussed and future projections are performed.
Section 5.1.4 presents the work performed in the framework of Action 5 “An operational
platform for the Control PM concentrations Policy Tool”. The design of the different
modules of the Operational Platform (OP) of the Policy Tool is discussed, based on the
project objectives and the feedback obtained by stakeholders. A description is provided on the
development of the distinct OP modules: (i) Input databases,; (ii) Calculation code, (iii)
Presentation interface, their testing through historical data and their final integration into the
ACEPT-AIR Policy Tool. The content of the Application guide and manual for the ACEPT-
AIR Policy Tool, compiled for the Tool’s end users, are also provided.
Section 5.1.5 presents the work performed in the framework of Action 6 “Development and
application of a two-way direct interaction process with stakeholders”. The key project
stakeholders are presented, as well as other interested parties involved during the project
implementation. Summary descriptions of the three Informative Events organized for
stakeholders are provided. In addition, aspects of active participation of stakeholders in the
project implementation are also presented.
Section 5.1.6 presents the work performed in the framework of Action 7 “Active application
of the developed policy tool”. Summary results from the initial application of the ACEPT-
AIR Policy Tool are presented. In particular, PM reductions in relation to the implementation
of specific emission control scenarios are provided. Based on these results, a set of mitigation
measures is proposed in order to decrease ambient PM concentrations and achieve attainment
of EU air quality standards.
Section 5.1.7 presents the work performed in the framework of Action 10 “Monitoring of
Project progress”. The amendment of the content of this Action, submitted with the
inception report, is discussed. The external evaluators’ committee who is responsible for the
monitoring of the project progress is presented. The interaction of external evaluators with
ACEPT-AIR project beneficiaries and the major feedback obtained are also presented.
Section 5.1.8 presents the work performed in the framework of Action 11 “Action plan
formulation for PM reduction”. A summary of the air quality assessment at the three
studied areas, with respect to PM levels and emission trends of natural and anthropogenic
sources, is provided. In addition, the major points included in the Guidelines for effective
Action Plan formulation for the three urban areas are presented. These Guidelines are based
on the trend analysis of PM levels and emissions, as well as the results on PM concentration
reductions obtained through the application of ACEPT-AIR Policy Tool.
Section 5.2.1 discusses the objectives of the dissemination plan developed in the framework
of ACEPT-AIR project, with respect to both stakeholders and the general public. Section
5.2.2 presents a summary description of the Open Forum and International Conference
7
organized in the framework of the project. Section 5.2.3 describes the dissemination
activities intended for the general public, such as the project website, erection of notice
boards, production of dissemination material and a Layman’s report, seminars for school
teachers and press articles. Section 5.2.3 presents the work performed in the framework of
Action 12 “After-life communication & continuation plan”. The main aspects of the After-
Life communication & continuation plan which aspires to ensure the sustainability of the
project outcome and further promote its objectives are discussed.
Section 5.3 presents an evaluation of the project implementation, in terms of success of the
applied methodologies and achievement of the specific objectives set for each Action.
Section 5.4 presents an analysis of the long-term benefits of the project. Among the issues
discussed are environmental benefits, long term sustainability of the developed technology,
visibility for the environmental problem targeted, economic and social benefits, continuation
of project actions and collaborations, replicability and demonstration of project outcome and
best practices used. The innovation and demonstration value of the project outcome is
described. In addition, long term indicators for a future assessment of the project success are
provided.
Chapter 6 presents a summary description of the financial report, including: summary of
costs incurred, details on the accounting system, partnership arrangements regarding financial
transactions and reporting and name and address of the external auditor.
Chapter 7 provides a list of all Annexes submitted together with the Final Report.

8
3. Introduction
Air pollution is a major environmental problem across the European Union (EU). Despite the
improvements in air quality with respect to certain pollutants, concentration levels of
airborne particulate matter (PM) are still presenting exceedences of the relevant air quality
limit values. At the same time toxicological and epidemiological evidence on the significant
detrimental effects of PM10 and PM2.5 (particles with aerodynamic diameters below 10 and 2.5
μm respectively) highlight the need for new efforts towards reducing ambient PM
concentration levels in order to protect both public health and the environment.
Urban areas and some industrial regions in Greece are among those in the EU with a high
number of limit values exceedances in PM10 ambient concentrations. ACEPT-AIR project
aims to provide the National Authorities at Central, Regional and Local level with the means
to control PM2.5 and PM10 concentrations in the ambient atmosphere. In particular, the
project main objectives are to unravel the relative contribution of the multiple anthropogenic
and natural sources to the observed PM air concentrations, including secondary aerosol
formation and to combine all available data on a versatile Environment Policy Tool that may
assist relevant authorities to develop cost-effective mitigation strategies for the control of
particulate pollution in Greece.
The project objectives have been achieved through a number of actions involving: (i) the
implementation of PM measurement campaigns at three urban areas in Greece (Athens,
Thessaloniki and Volos) for the assessment of PM10 and PM2.5 concentration levels and
detailed chemical characterization, (ii) the application of receptor models for the
identification of major PM sources and the quantification of their contribution to PM
concentrations, (iii) the compilation of emission inventories for natural and anthropogenic
sources and (iv) the development of a software which combines the above concentration and
emission data and provides estimates of PM concentration levels with respect to changes in
emissions of specific PM sources.
ACEPT-AIR project has provided detailed characterization of the air quality in three major
urban areas in Greece with respect to particulate matter concentration levels and main
emission sources. All the data collected have been incorporated into a versatile Policy Tool
that may assist relevant authorities to develop cost-effective mitigation strategies. In
addition, the experience gained through the project implementation has been transferred to
policy makers and stakeholders in the public and private sectors through a well designed
interaction process including both information activities as well as opportunities for dialogue
and feedback on stakeholders’ views and needs. A wide range of activities for the
mobilization of the local societies have been also implemented with the aim to increase
public awareness on air pollution and on detrimental to the environment practices and
lifestyle choices (such as the use of fireplaces for residential heating).
In the long-term, ACEPT-AIR project may improve the effectiveness of National, Regional
and Local policies regarding ambient air quality, in accordance with the requirements of
Directive 2008/50/EC for air quality plans formulation and reductions of ambient PM
concentrations, as well as WHO Guidelines for the protection of human health. ACEPT-AIR
Policy Tool provides the means to policy makers and relevant authorities to take informed
decisions on the implementation of specific emission control measures. The Tool design
allows for an easy update of its input databases. It may be therefore applied for other regions
as well, where there are available reliable emission strengths data.
9
4. Administrative part - Action 1: Project management
4.1 Description of the management system
ACEPT-AIR project was realized through the collaboration of N.C.S.R. “Demokritos”
(NCSR “D”), acting as the coordinating beneficiary, Univeristy of Thessaly (UTH), Aristotle
University of Thessaloniki (AUTH), AXON Envirogroup Ltd. (AXON) and Technical
University of Crete (TUC). The Partnership Agreement was signed on 02/02/2011 and was
submitted with the Inception report (Annex IV). All Actions, except Action 10 “Monitoring of
project progress”, were implemented according to the description provided in the Grant
Agreement. An amended description of Action 10 was submitted with Inception Report
(Annex X) and was accepted by the EC.
The working method was developed during the Plenary Meetings throughout the course of
the project implementation. Each beneficiary was appointed as Action leader in one or more
Actions. The implementation of the working scheme was further supported by three decision
making bodies: the Management Board Committee (MB), the Steering Committee (SC) and
the Technical Committee (TC). A schematic presentation of the Management System,
including the responsibilities of each Committee, and the management team organigramme
are provided in Figure 1. The working method followed during the different project phases
(planning and execution of activities and tasks in each phase) is shown in Table 1.
The Project Manager, in collaboration with the Scientific Secretary and the Financial
Manager, had the overall responsibility of the project management: Organize seven plenary
meetings throughout the course of the project; Coordinate the implementation of project
Actions in collaboration with the respective Action leader beneficiaries; Organize meetings
with stakeholders; Identify potential problems and critical decisions to be dealt in MB and SC
meetings; Monitor the progress of deliverables and milestones; Communicate with
ASTRALE Monitoring Team and the European Commission; Manage ACEPT-AIR cost
centre; Overall management of contractual, legal, financial and administrative issues.
4.2 Evaluation of the management system
The project management process was successfully implemented owing to the excellent
collaboration between ACEPT-AIR beneficiaries. Some problems of administrative nature
were encountered during the launch of the project, mostly due to the fact that the Finance
Department of NCSR “D” had no earlier experience with LIFE projects. These problems
caused small delays in the signing of the partnership agreement and the consequent transfer of
the first instalment to the associated beneficiaries but they were successfully overcome early
in the project implementation. The partnership agreement described the management rules
and the responsibilities of each beneficiary in a clear and consistent way, enabling the smooth
execution of the project. In addition, the frequent plenary meetings assisted towards the
identification and solution of problems The well defined distribution of tasks between
partners, set and supported by the Action Leaders, ensured the completion of all Actions, as
shown in Table 2. Some delays due to the heavy load of measurements and analysis did not
affect the overall successful implementation of the project.
All communication with the EC and ASTRALE Monitoring team was conducted by the
project manager, K. Eleftheriadis. In general this communication scheme was effective. There
was a crucial financial issue regarding the personnel cost reported by AUTH during the
Midterm Report. In that case AUTH Finance Department requested and was granted
permission to communicate directly with the EC LIFE unit in order to clarify the issue and
obtain approval for these costs.

10
Figure 1. Schematic presentation of the management system and organigramme of ACEPT-
AIR management team.
Project Manager: K. Eleftheriadis (NCSR “D”)
Scientific Secretary: E. Diapouli
Financial Manager: K. Daniil / S. Dalaina / V. Galifianakis
Representatives of each beneficiary: A. Kungolos (UTH); C. Samara (AUTH); A. Progiou
(AXON); M. Lazaridis (TUC)
Field experts:
V. Alexandropoulou
Th. Grigoratos
A. Argyropoulos
Th. Glytsos
K. Kavadias
S. Kipouros
A. Kouras
Th. Maggos
E. Manoli
D. Voutsa
S. Vratolis
Administrative staff:
Ch. Papatheodorou
A. Papaoikonomou
Representatives of
stakeholders:
N. Manalis (Ministry of
Environment, Energy &
Climate Change)
G. Kourasis (Municipalities
of Athens Metropolitan
area)
D. Alexopoulos (Region of
Thessaly)
K. Zervas (Municipality of
Thessaloniki)
D. Patsios (Association of
Motor Vehicle Importers)
External evaluators:
A. Chaloulakou
(NTUA)
X. Querol
(CSIC)
R. Harrison
(University of
Birmingham)
Technical Committee
Realization of
Implementation
Actions
Management Board
Committee
Organization of
dissemination events for
stakeholders and the
general public
Preparation of deliverables
and milestones
Compilation of progress
reports and contact with EC
Organization of project
meetings
EC / ASTRALE Monitoring Team
Steering
Committee
Setting of project
strategy
Monitoring of work
progress
Effective collaboration
between beneficiaries
Supervision of
Deliverables /
Milestones
11
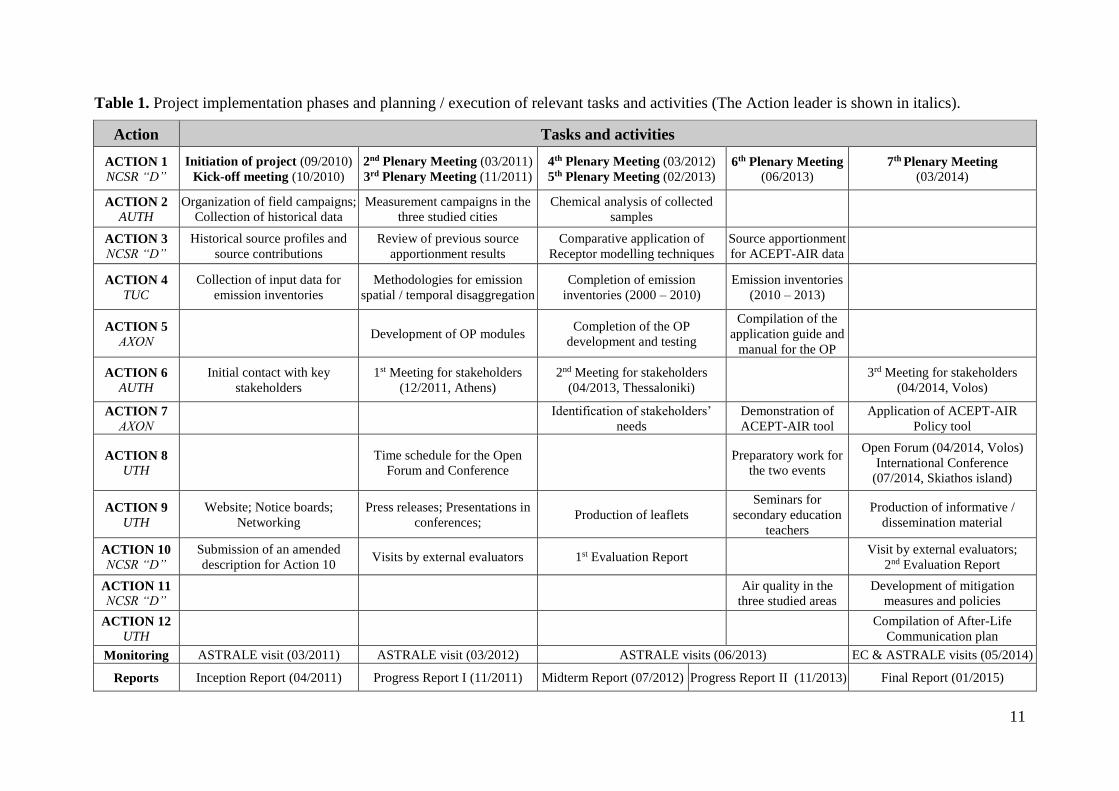
Table 1. Project implementation phases and planning / execution of relevant tasks and activities (The Action leader is shown in italics).
Action Tasks and activities
ACTION 1
NCSR “D”
Initiation of project (09/2010)
Kick-off meeting (10/2010)
2nd Plenary Meeting (03/2011)
3rd Plenary Meeting (11/2011)
4th Plenary Meeting (03/2012)
5th Plenary Meeting (02/2013) 6th Plenary Meeting
(06/2013) 7th Plenary Meeting
(03/2014)
ACTION 2
AUTH
Organization of field campaigns;
Collection of historical data
Measurement campaigns in the
three studied cities
Chemical analysis of collected
samples
ACTION 3
NCSR “D”
Historical source profiles and
source contributions
Review of previous source
apportionment results
Comparative application of
Receptor modelling techniques
Source apportionment
for ACEPT-AIR data
ACTION 4
TUC
Collection of input data for
emission inventories
Methodologies for emission
spatial / temporal disaggregation
Completion of emission
inventories (2000 – 2010)
Emission inventories
(2010 – 2013)
ACTION 5
ΑΧΟΝ Development of OP modules
Completion of the OP
development and testing
Compilation of the
application guide and
manual for the OP
ACTION 6
AUTH
Initial contact with key
stakeholders
1st Meeting for stakeholders
(12/2011, Athens)
2nd Meeting for stakeholders
(04/2013, Thessaloniki)
3rd Meeting for stakeholders
(04/2014, Volos)
ACTION 7
ΑΧΟΝ
Identification of stakeholders’
needs
Demonstration of
ACEPT-AIR tool
Application of ACEPT-AIR
Policy tool
ACTION 8
UTH
Time schedule for the Open
Forum and Conference
Preparatory work for
the two events
Open Forum (04/2014, Volos)
International Conference
(07/2014, Skiathos island)
ACTION 9
UTH
Website; Notice boards;
Networking
Press releases; Presentations in
conferences; Production of leaflets
Seminars for
secondary education
teachers
Production of informative /
dissemination material
ACTION 10
NCSR “D”
Submission of an amended
description for Action 10 Visits by external evaluators 1st Evaluation Report
Visit by external evaluators;
2nd Evaluation Report
ACTION 11
NCSR “D”
Air quality in the
three studied areas
Development of mitigation
measures and policies
ACTION 12
UTH
Compilation of After-Life
Communication plan
Monitoring ASTRALE visit (03/2011) ASTRALE visit (03/2012) ASTRALE visits (06/2013) EC & ASTRALE visits (05/2014)
Reports Inception Report (04/2011) Progress Report I (11/2011) Midterm Report (07/2012) Progress Report II (11/2013) Final Report (01/2015)
12
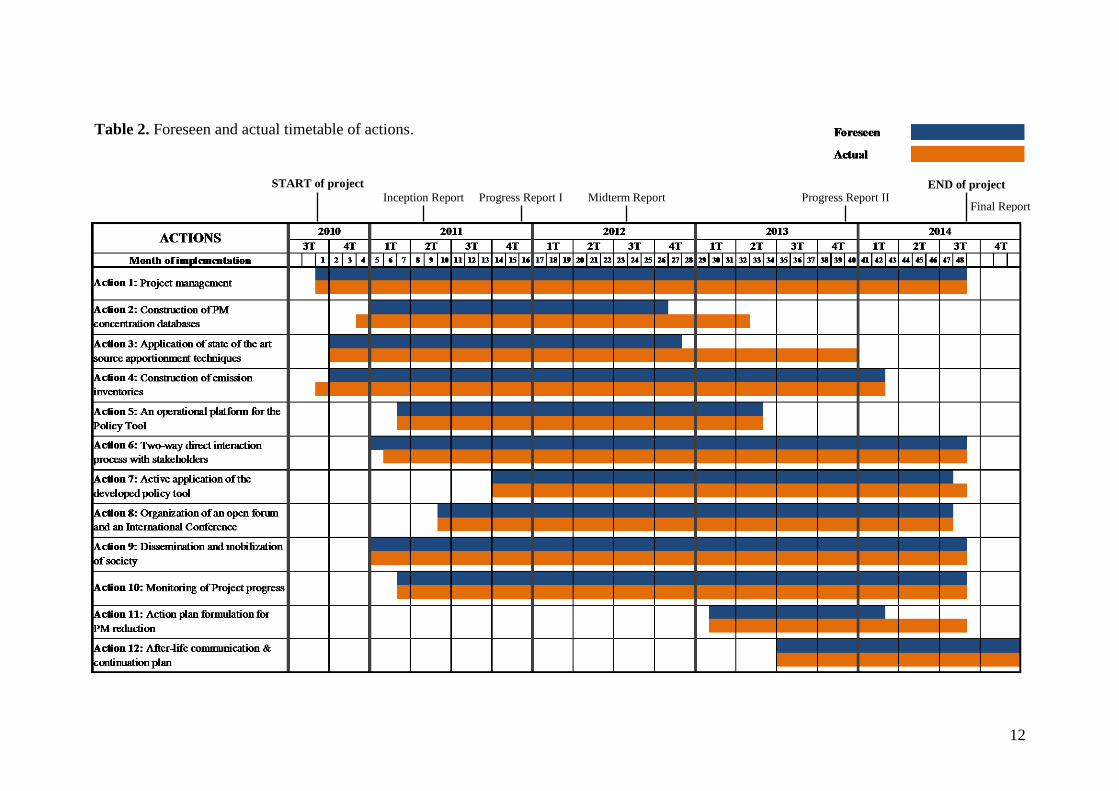
Table 2. Foreseen and actual timetable of actions.
END of project
Final Report
START of project
Progress Report II Midterm Report Progress Report I Inception Report

13
5. Technical part
5.1. Technical progress, per task
5.1.1. Action 2. Construction of PM concentration databases
Action 2 started on December 2010, one month earlier than foreseen in the initial planning
and was completed with a delay of six months, on April 2013 (Table 2). In the framework of
this Action a detailed database on PM10 and PM2.5 mass concentration and chemical
composition was constructed for the three studied areas: Athens Metropolitan Area (AMA),
Thessaloniki Metropolitan Area (TMA) and Volos Greater Area (VGA). The database
included historical data as well as data collected during ACEPT-AIR project. Action 2 was
performed by AUTH (Action leader), NCSR “D” and UTH.
Measurement campaigns in AMA, TMA and VGA
ACEPT-AIR measurement campaigns were carried out during warm season of 2011 (June –
September) and cold season of 2012 (January – April) at two sites in the Athens
Metropolitan Area, two sites in Thessaloniki Metropolitan Area and one site in Volos
Greater Area. Athens and Thessaloniki are the two largest cities in Greece, while Volos has
the third largest of Greece's major commercial ports as well as a number of industrial facilities
in the vicinity of the city. The monitoring sites were selected after consultation with the
project stakeholders (the Ministry for the Environment, Energy & Climate Change, the
Municipality of Thessaloniki and the Regional Union of Magnesia and N. Sporades) and three
of the sites were hosted in stakeholders’ stations. Specifically, the two sampling sites in AMA
were located: (i) at Agia Paraskevi (AP), at the urban background station GAW-DEM1 of the
National Centre for Scientific Research “Demokritos” and (ii) at Nea Smyrni (NS), at the
urban background station of the National Monitoring Network. The two sampling sites in
TMA were located: (i) at an urban traffic station (UT) in the commercial city centre (Ionos
Dragoumi) and (ii) at an urban background station (UB) in the upper part of the city
(Eptapyrgio), both stations belonging to the Municipality of Thessaloniki. The sampling site
in VGA was located on the roof of the University of Thessaly (UTH). The sampling sites in
AMA/TMA and in VGA are shown in Figures 2 and 3, respectively.
The sampling campaigns were implemented by NCSR “D” and AUTH in Athens and
Thessaloniki, respectively. In Volos, measurements were conducted by UTH in collaboration
with NCSR “D”. At all sites, PM10 and PM2.5 sampling was carried out concurrently, on a
24-hr basis, according to the reference methods ISO/IEC EN-12341 and ISO/IEC EN-14907,
by reference low volume samplers. Two typed of filters (Teflon and Quartz fiber) were
simultaneously collected in order to allow for a number of different analyses for chemical
speciation. The total number of valid samples collected at each site during warm and cold
season is shown in Table 3. A minimum of 30 samples per site was aimed at, in order to allow
for the subsequent application of source apportionment modeling in Action 3.
Due to the large size of AMA and TMA, the spatial distribution of PM concentrations was
further examined by the use of the mobile measurement platform (Mobilab) of the APTL,
CERTH which was subcontractor to the project. In both cities, Mobilab was employed for two
10-days periods, during warm and cold season field campaigns respectively. During the day
the vehicle was moving in preselected routes, while a GPS was continuously recording its
1 http://gaw.empa.ch/gawsis/reports.asp

14
position. Measurements were continued during night time, with the vehicle parked in areas of
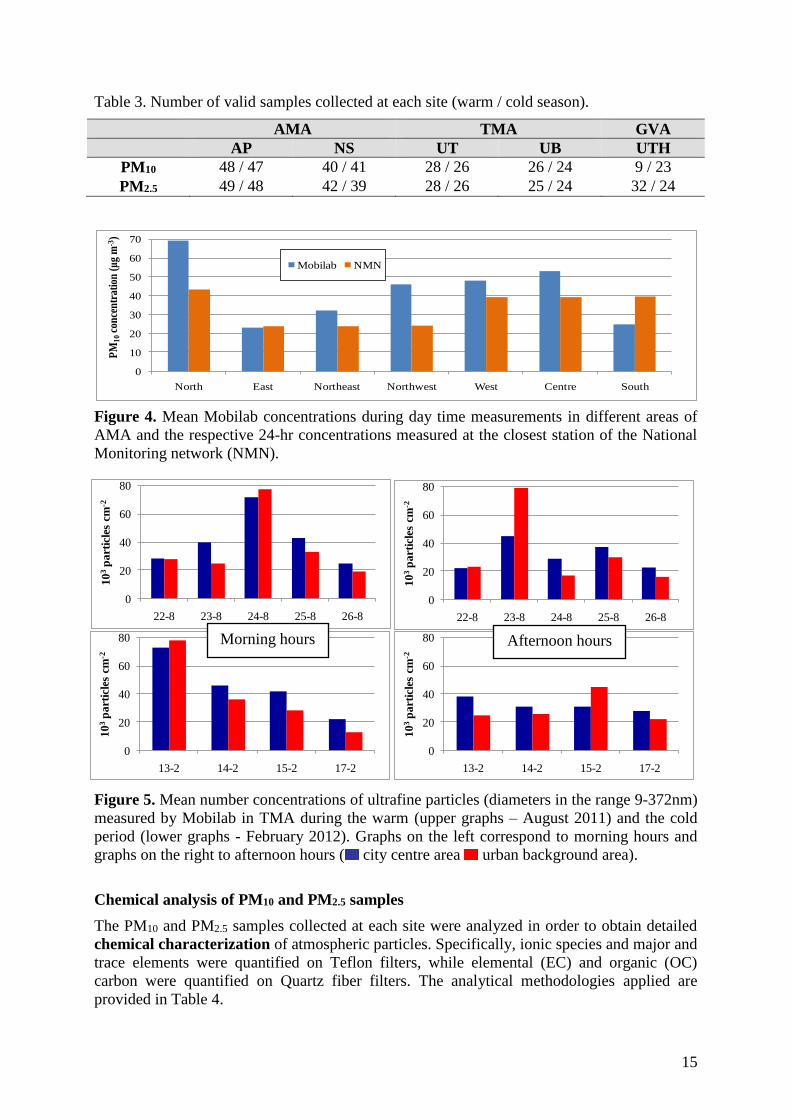
interest. The areas and routes monitored in the two cities are depicted in Figure 2. Mobilab
measurements indicated a large spatial variability of PM mass concentrations across the two
cities (Figure 4). PM number concentrations, which are mainly associated with particles of
diameters smaller than 1 μm, presented a lower spatial variability (Figure 5). The
measurements were also used in order to assess the selected sites for ACEPT-AIR field
campaigns with respect to the PM levels in these two large urban agglomerations. The results
supported the characterization of AP and NS as urban background stations, since these two
areas presented the lowest concentrations across AMA. Similarly, UT and UB stations in
TMA were found to be characteristic of traffic and urban background areas of the city as well.
Figure 2. Maps of AMA and TMA depicting the city centres (by yellow stars), the sampling
sites (AP and NS in AMA and UB and UT in TMA), the routes covered by Mobilab (shown
in blue) and areas (numbered in red circles) where Mobilab night time measurements took
place. A photo of Mobilab vehicle is also shown.
Figure 3. Map of VGA depicting
the city centre (by yellow star)
and the sampling site (UTH) (on
the left); Photo of PM samplers
measuring at UTH (on the right).
UTH
VGA
UT
UB
1
2
AP
NS
1
2 3
4
5 67
8
9
10
AMA TMA
15
0
10
20
30
40
50
60
70
North East Northeast Northwest West Centre South
PM
10
con
cen
trat
ion
(μ
g m
-3)
Mobilab NMN
Table 3. Number of valid samples collected at each site (warm / cold season).
AMA TMA GVA
AP NS UT UB UTH
PM10 48 / 47 40 / 41 28 / 26 26 / 24 9 / 23
PM2.5 49 / 48 42 / 39 28 / 26 25 / 24 32 / 24
Figure 4. Mean Mobilab concentrations during day time measurements in different areas of
AMA and the respective 24-hr concentrations measured at the closest station of the National
Monitoring network (NMN).
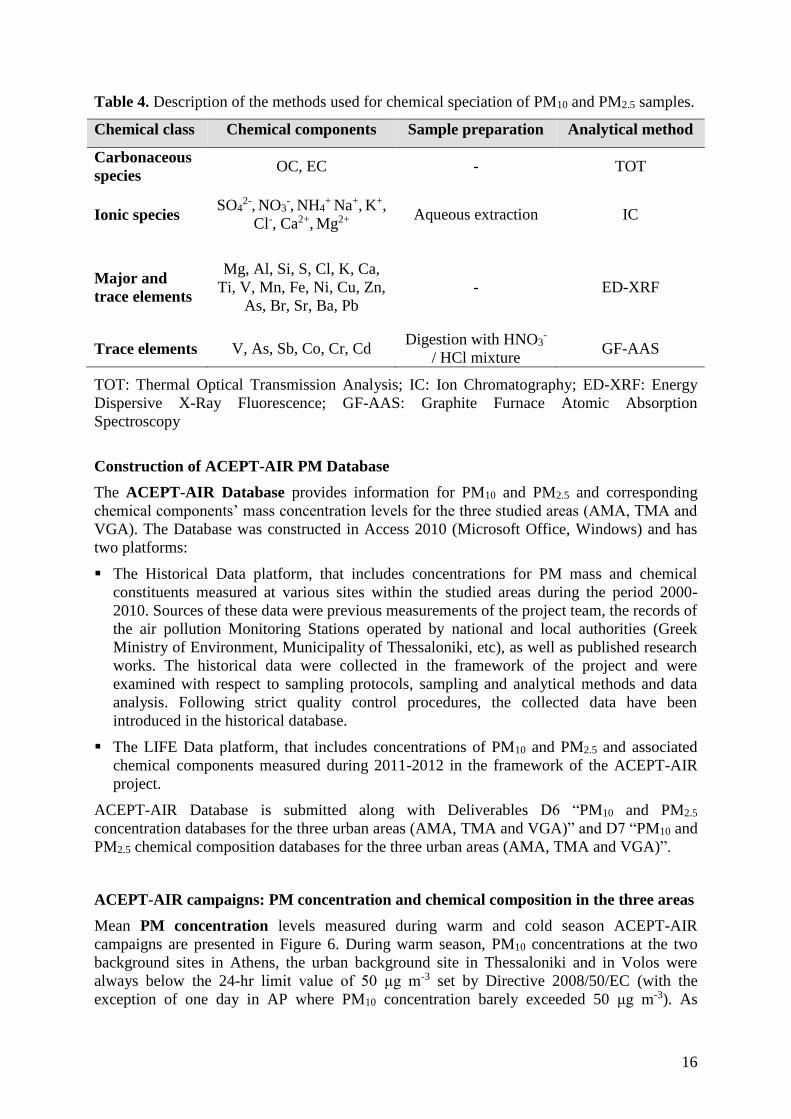
Figure 5. Mean number concentrations of ultrafine particles (diameters in the range 9-372nm)
measured by Mobilab in TMA during the warm (upper graphs – August 2011) and the cold
period (lower graphs - February 2012). Graphs on the left correspond to morning hours and
graphs on the right to afternoon hours ( city centre area urban background area).
Chemical analysis of PM10 and PM2.5 samples
The PM10 and PM2.5 samples collected at each site were analyzed in order to obtain detailed
chemical characterization of atmospheric particles. Specifically, ionic species and major and
trace elements were quantified on Teflon filters, while elemental (EC) and organic (OC)
carbon were quantified on Quartz fiber filters. The analytical methodologies applied are
provided in Table 4.
0
20
40
60
80
22-8 23-8 24-8 25-8 26-8
10
3p
art
icle
s cm
-2
0
20
40
60
80
13-2 14-2 15-2 17-2
10
3p
art
icle
s cm
-2
0
20
40
60
80
22-8 23-8 24-8 25-8 26-8
10
3p
art
icle
s cm
-2
0
20
40
60
80
13-2 14-2 15-2 17-2
10
3p
art
icle
s cm
-2
Morning hours Afternoon hours
16
Table 4. Description of the methods used for chemical speciation of PM10 and PM2.5 samples.
Chemical class Chemical components Sample preparation Analytical method
Carbonaceous
species OC, EC - TOT
Ionic species SO4
2-, NO3-, NH4
+ Na+, K+,
Cl-, Ca2+, Mg2+ Aqueous extraction IC
Major and
trace elements
Mg, Al, Si, S, Cl, K, Ca,
Ti, V, Mn, Fe, Ni, Cu, Zn,
As, Br, Sr, Ba, Pb
- ED-XRF
Trace elements V, As, Sb, Co, Cr, Cd Digestion with HNO3
-
/ HCl mixture GF-AAS
TOT: Thermal Optical Transmission Analysis; IC: Ion Chromatography; ED-XRF: Energy
Dispersive X-Ray Fluorescence; GF-AAS: Graphite Furnace Atomic Absorption
Spectroscopy
Construction of ACEPT-AIR PM Database
The ACEPT-AIR Database provides information for PM10 and PM2.5 and corresponding
chemical components’ mass concentration levels for the three studied areas (AMA, TMA and
VGA). The Database was constructed in Access 2010 (Microsoft Office, Windows) and has
two platforms:
The Historical Data platform, that includes concentrations for PM mass and chemical
constituents measured at various sites within the studied areas during the period 2000-
2010. Sources of these data were previous measurements of the project team, the records of
the air pollution Monitoring Stations operated by national and local authorities (Greek
Ministry of Environment, Municipality of Thessaloniki, etc), as well as published research
works. The historical data were collected in the framework of the project and were
examined with respect to sampling protocols, sampling and analytical methods and data
analysis. Following strict quality control procedures, the collected data have been
introduced in the historical database.
The LIFE Data platform, that includes concentrations of PM10 and PM2.5 and associated
chemical components measured during 2011-2012 in the framework of the ACEPT-AIR
project.
ACEPT-AIR Database is submitted along with Deliverables D6 “PM10 and PM2.5
concentration databases for the three urban areas (AMA, TMA and VGA)” and D7 “PM10 and
PM2.5 chemical composition databases for the three urban areas (AMA, TMA and VGA)”.
ACEPT-AIR campaigns: PM concentration and chemical composition in the three areas
Mean PM concentration levels measured during warm and cold season ACEPT-AIR
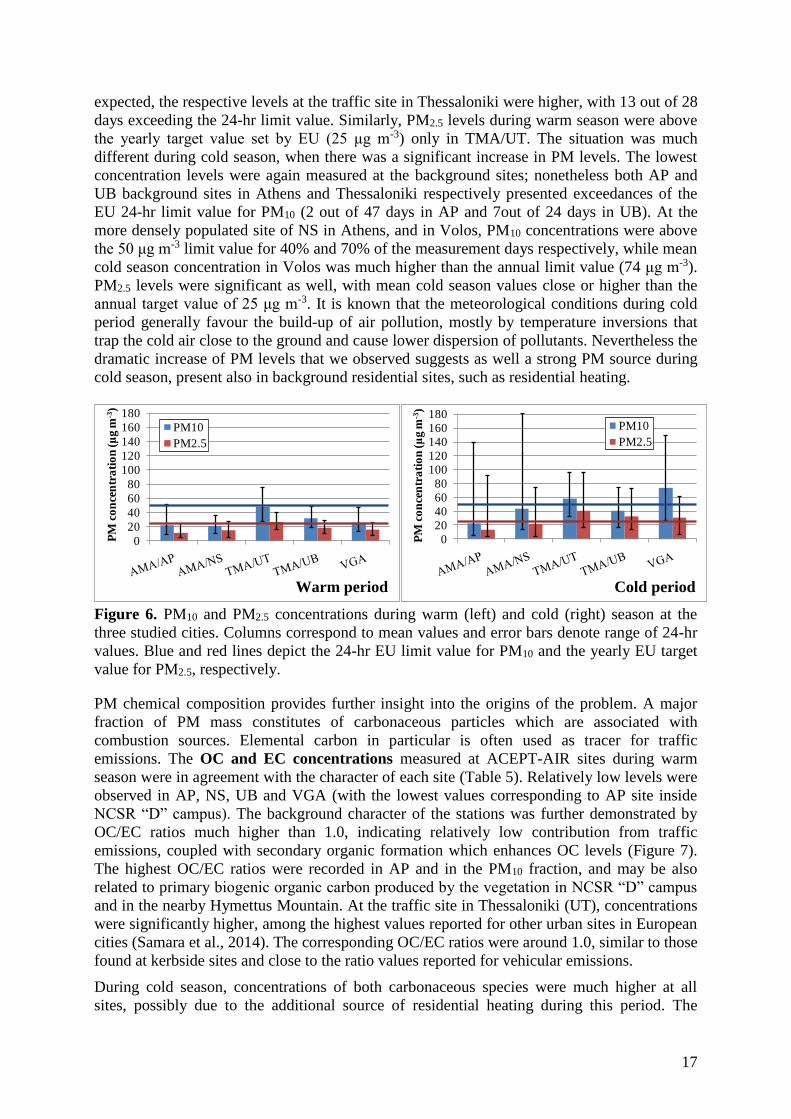
campaigns are presented in Figure 6. During warm season, PM10 concentrations at the two
background sites in Athens, the urban background site in Thessaloniki and in Volos were
always below the 24-hr limit value of 50 μg m-3 set by Directive 2008/50/EC (with the
exception of one day in AP where PM10 concentration barely exceeded 50 μg m-3). As
17
expected, the respective levels at the traffic site in Thessaloniki were higher, with 13 out of 28
days exceeding the 24-hr limit value. Similarly, PM2.5 levels during warm season were above
the yearly target value set by EU (25 μg m-3) only in TMA/UT. The situation was much
different during cold season, when there was a significant increase in PM levels. The lowest
concentration levels were again measured at the background sites; nonetheless both AP and
UB background sites in Athens and Thessaloniki respectively presented exceedances of the
EU 24-hr limit value for PM10 (2 out of 47 days in AP and 7out of 24 days in UB). At the
more densely populated site of NS in Athens, and in Volos, PM10 concentrations were above
the 50 μg m-3 limit value for 40% and 70% of the measurement days respectively, while mean
cold season concentration in Volos was much higher than the annual limit value (74 μg m-3).
PM2.5 levels were significant as well, with mean cold season values close or higher than the
annual target value of 25 μg m-3. It is known that the meteorological conditions during cold
period generally favour the build-up of air pollution, mostly by temperature inversions that
trap the cold air close to the ground and cause lower dispersion of pollutants. Nevertheless the
dramatic increase of PM levels that we observed suggests as well a strong PM source during
cold season, present also in background residential sites, such as residential heating.
Figure 6. PM10 and PM2.5 concentrations during warm (left) and cold (right) season at the
three studied cities. Columns correspond to mean values and error bars denote range of 24-hr
values. Blue and red lines depict the 24-hr EU limit value for PM10 and the yearly EU target
value for PM2.5, respectively.
PM chemical composition provides further insight into the origins of the problem. A major
fraction of PM mass constitutes of carbonaceous particles which are associated with
combustion sources. Elemental carbon in particular is often used as tracer for traffic
emissions. The OC and EC concentrations measured at ACEPT-AIR sites during warm
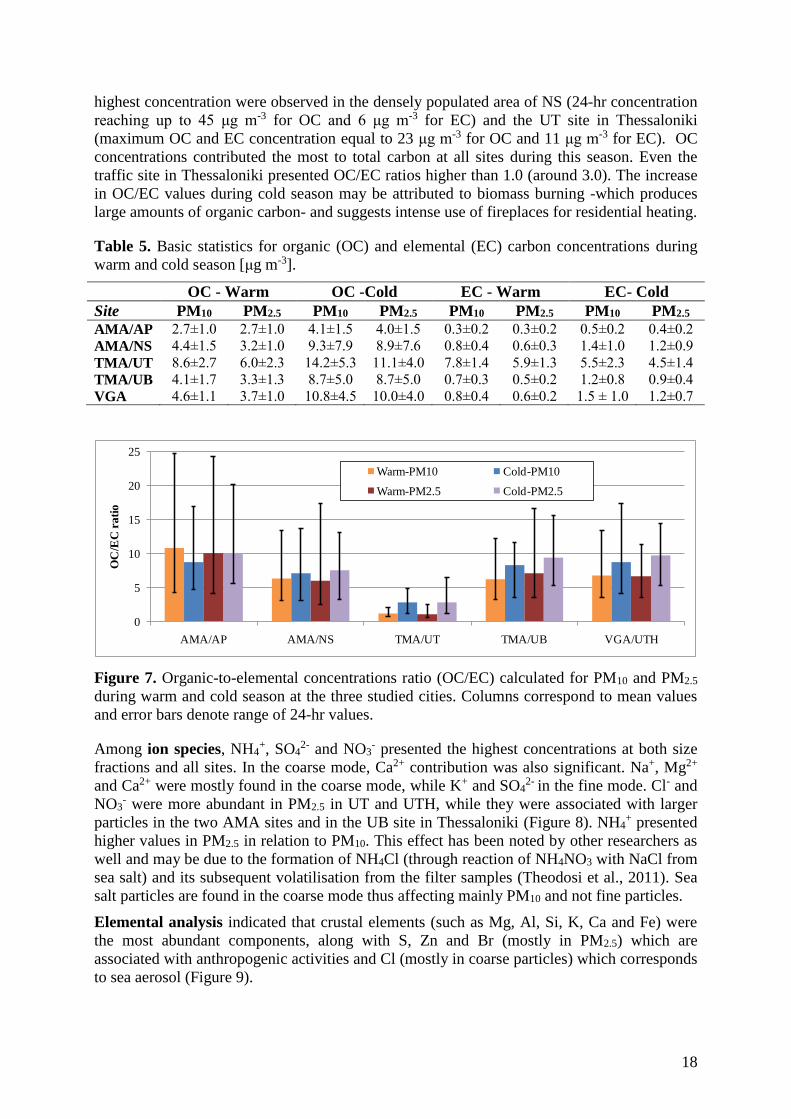
season were in agreement with the character of each site (Table 5). Relatively low levels were
observed in AP, NS, UB and VGA (with the lowest values corresponding to AP site inside
NCSR “D” campus). The background character of the stations was further demonstrated by
OC/EC ratios much higher than 1.0, indicating relatively low contribution from traffic
emissions, coupled with secondary organic formation which enhances OC levels (Figure 7).
The highest OC/EC ratios were recorded in AP and in the PM10 fraction, and may be also
related to primary biogenic organic carbon produced by the vegetation in NCSR “D” campus
and in the nearby Hymettus Mountain. At the traffic site in Thessaloniki (UT), concentrations
were significantly higher, among the highest values reported for other urban sites in European
cities (Samara et al., 2014). The corresponding OC/EC ratios were around 1.0, similar to those
found at kerbside sites and close to the ratio values reported for vehicular emissions.
During cold season, concentrations of both carbonaceous species were much higher at all
sites, possibly due to the additional source of residential heating during this period. The
0
20
40
60
80
100
120
140
160
180
PM
co
nce
ntr
ati
on
(μ
g m
-3)
PM10
PM2.5
0
20
40
60
80
100
120
140
160
180P
M c
on
cen
tra
tio
n (μ
g m
-3)
PM10
PM2.5
Warm period Cold period
18
0
5
10
15
20
25
AMA/AP AMA/NS TMA/UT TMA/UB VGA/UTH
OC
/EC
rati
o
Warm-PM10 Cold-PM10
Warm-PM2.5 Cold-PM2.5
highest concentration were observed in the densely populated area of NS (24-hr concentration
reaching up to 45 μg m-3 for OC and 6 μg m-3 for EC) and the UT site in Thessaloniki
(maximum OC and EC concentration equal to 23 μg m-3 for OC and 11 μg m-3 for EC). OC
concentrations contributed the most to total carbon at all sites during this season. Even the
traffic site in Thessaloniki presented OC/EC ratios higher than 1.0 (around 3.0). The increase
in OC/EC values during cold season may be attributed to biomass burning -which produces
large amounts of organic carbon- and suggests intense use of fireplaces for residential heating.
Table 5. Basic statistics for organic (OC) and elemental (EC) carbon concentrations during
warm and cold season [μg m-3].
OC - Warm OC -Cold EC - Warm EC- Cold
Site PM10 PM2.5 PM10 PM2.5 PM10 PM2.5 PM10 PM2.5
AMA/AP 2.7±1.0 2.7±1.0 4.1±1.5 4.0±1.5 0.3±0.2 0.3±0.2 0.5±0.2 0.4±0.2
AMA/NS 4.4±1.5 3.2±1.0 9.3±7.9 8.9±7.6 0.8±0.4 0.6±0.3 1.4±1.0 1.2±0.9
TMA/UT 8.6±2.7 6.0±2.3 14.2±5.3 11.1±4.0 7.8±1.4 5.9±1.3 5.5±2.3 4.5±1.4
TMA/UB 4.1±1.7 3.3±1.3 8.7±5.0 8.7±5.0 0.7±0.3 0.5±0.2 1.2±0.8 0.9±0.4
VGA 4.6±1.1 3.7±1.0 10.8±4.5 10.0±4.0 0.8±0.4 0.6±0.2 1.5 ± 1.0 1.2±0.7
Figure 7. Organic-to-elemental concentrations ratio (OC/EC) calculated for PM10 and PM2.5
during warm and cold season at the three studied cities. Columns correspond to mean values
and error bars denote range of 24-hr values.
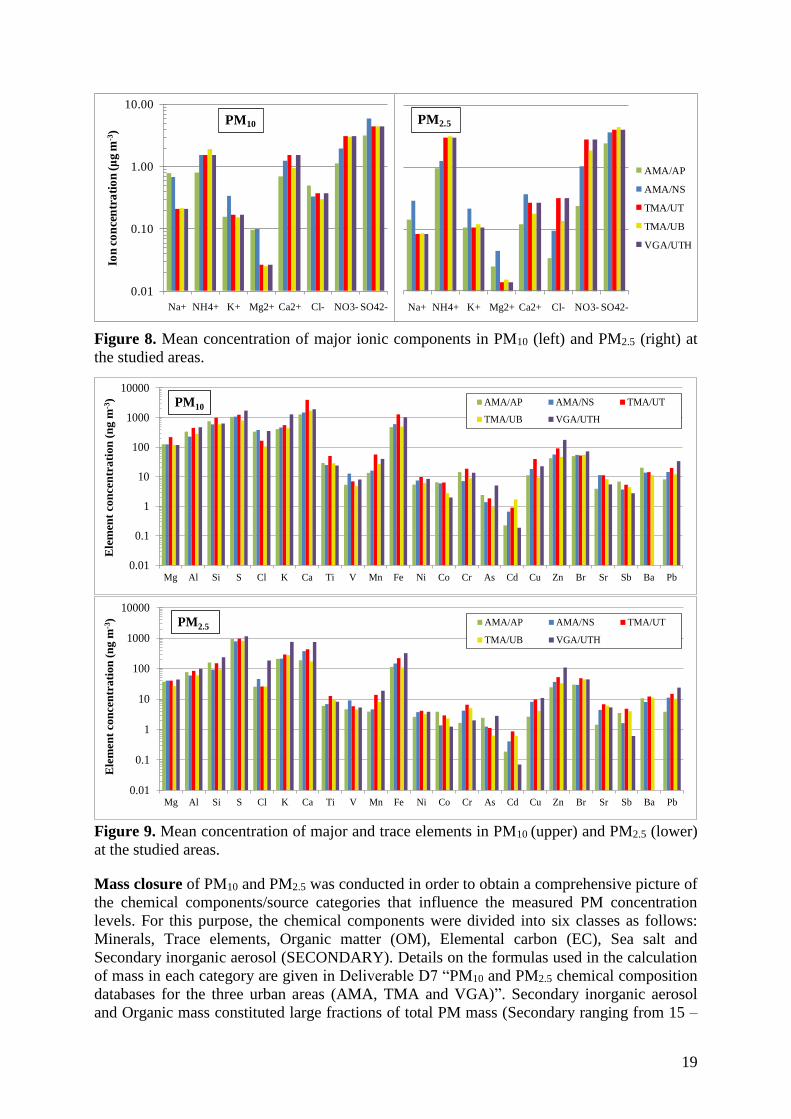
Among ion species, NH4+, SO4
2- and NO3- presented the highest concentrations at both size
fractions and all sites. In the coarse mode, Ca2+ contribution was also significant. Na+, Mg2+
and Ca2+ were mostly found in the coarse mode, while K+ and SO42- in the fine mode. Cl- and
NO3- were more abundant in PM2.5 in UT and UTH, while they were associated with larger
particles in the two AMA sites and in the UB site in Thessaloniki (Figure 8). NH4+ presented
higher values in PM2.5 in relation to PM10. This effect has been noted by other researchers as
well and may be due to the formation of NH4Cl (through reaction of NH4NO3 with NaCl from
sea salt) and its subsequent volatilisation from the filter samples (Theodosi et al., 2011). Sea
salt particles are found in the coarse mode thus affecting mainly PM10 and not fine particles.
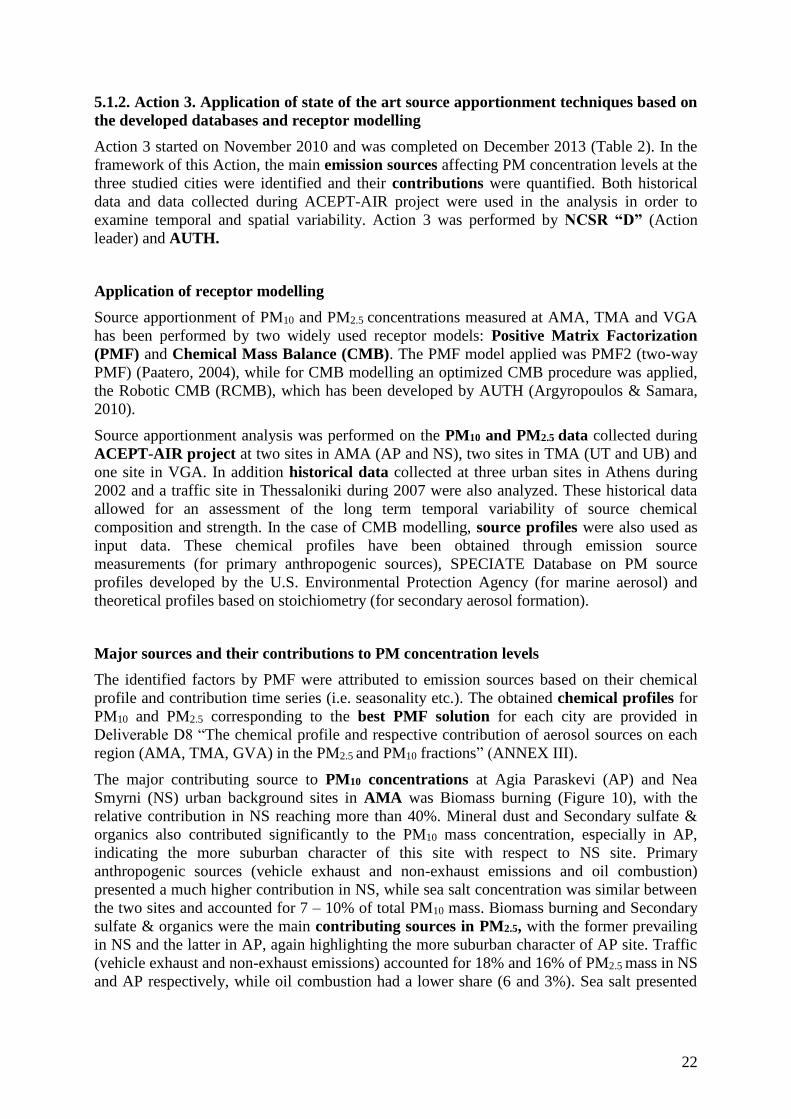
Elemental analysis indicated that crustal elements (such as Mg, Al, Si, K, Ca and Fe) were
the most abundant components, along with S, Zn and Br (mostly in PM2.5) which are
associated with anthropogenic activities and Cl (mostly in coarse particles) which corresponds
to sea aerosol (Figure 9).
19
0.01
0.10
1.00
10.00
Na+ NH4+ K+ Mg2+ Ca2+ Cl- NO3- SO42-
Ion
co
nce
ntr
ati
on
(μ
g m
-3)
PM10
Na+ NH4+ K+ Mg2+ Ca2+ Cl- NO3- SO42-
AMA/AP
AMA/NS
TMA/UT
TMA/UB
VGA/UTH
PM2.5
0.01
0.1
1
10
100
1000
10000
Mg Al Si S Cl K Ca Ti V Mn Fe Ni Co Cr As Cd Cu Zn Br Sr Sb Ba Pb
Ele
men
t co
ncen
tra
tio
n (
ng
m-3
) AMA/AP AMA/NS TMA/UT
TMA/UB VGA/UTH
PM10
0.01
0.1
1
10
100
1000
10000
Mg Al Si S Cl K Ca Ti V Mn Fe Ni Co Cr As Cd Cu Zn Br Sr Sb Ba Pb
Ele
men
t con
cen
tra
tion
(n
g m
-3) AMA/AP AMA/NS TMA/UT
TMA/UB VGA/UTH
PM2.5
Figure 8. Mean concentration of major ionic components in PM10 (left) and PM2.5 (right) at
the studied areas.
Figure 9. Mean concentration of major and trace elements in PM10 (upper) and PM2.5 (lower)
at the studied areas.
Mass closure of PM10 and PM2.5 was conducted in order to obtain a comprehensive picture of
the chemical components/source categories that influence the measured PM concentration
levels. For this purpose, the chemical components were divided into six classes as follows:
Minerals, Trace elements, Organic matter (OM), Elemental carbon (EC), Sea salt and
Secondary inorganic aerosol (SECONDARY). Details on the formulas used in the calculation
of mass in each category are given in Deliverable D7 “PM10 and PM2.5 chemical composition
databases for the three urban areas (AMA, TMA and VGA)”. Secondary inorganic aerosol
and Organic mass constituted large fractions of total PM mass (Secondary ranging from 15 –

20
32% in PM10 and 25 – 43 % in PM2.5; Organic mass ranging from 21 – 42% in PM10 and 23 –
54 % in PM2.5). Organic mass contribution was more pronounced during cold season pointing
towards biomass burning for residential heating. Elemental carbon (EC), which is a marker
for vehicular traffic emissions, presented low contribution (around 2 – 4%), except for the UT
site in TMA where it accounted for 14% and 18% of PM10 and PM2.5, respectively. Minerals
were another major contributor to PM10 (15 – 33% at the different sites and seasons) with
larger concentrations during warm season when the dry meteorological conditions favoured
soil dust resuspension.
References
EU, 2008/50/EC - Directive of the European Parliament and of the Council on ambient air
quality and cleaner air for Europe.
ISO/IEC EN-12341: “Ambient air. Standard gravimetric measurement method for the
determination of the PM10 or PM2.5 mass concentration of suspended particulate matter”.
ISO/IEC EN-14907: “Ambient air quality. Standard gravimetric measurement method for the
determination of the PM2.5 mass fraction of suspended particulate matter”.
Samara C., Voutsa D., Kouras A., Eleftheriadis K, Maggos Th., Saraga D., Petrakakis M.
(2014) Environ Sci Pollut Res, 21: 1769–1785.
Theodosi C., Grivas G., Zarmpas P., Chaloulakou A., Mihalopoulos N. (2011) Atmos Chem
Phys, 11: 11895-11911.
Deliverables & Milestones
Milestones M1 and M2 were achieved on time (Table 6). A number of technical problems
have been encountered during the field measurement campaigns (mainly instruments
malfunction and loss of electric power during sampling). Nevertheless, quality and sufficient
quantity of data was secured by extending the measurement period. The most significant loss
of data occurred during the VGA campaign, where one of the two PM10 samplers did not
function for 2/3 of the measurement period, resulting in limited data on PM10 mass
concentrations and filters available for ions and elements’ analysis. A longer measurement
period was implemented in the winter campaign, in order to achieve an adequate number of
samples for the consequent application of source apportionment models in Action 3. Despite
the drawbacks in the realization of the field sampling campaigns, they were completed one
month earlier to the initial planning. Deliverable D6 was completed without any problems
three months in advance, on April 2012.
Milestone M3, related to the analysis of the PM samples for chemical characterization, was
achieved with a delay of six months. The main reason for this delay, apart from the heavy
load of chemical analyses needed to be performed, was that XRF and AAS analysis for the
determination of major and trace elements in PM was conducted on the same filters. XRF,
which is a non-destructive technique, was performed by AUTH. Following AUTH analysis,
the filters were transported to NCSR “D”, where AAS analysis was conducted. These logistics
were necessary in order to avoid collecting duplicate Teflon filter samples for these analyses.
Similarly to Milestone M3, Deliverable D7 was completed with a delay of six months on
April 2013. Due to the delay in chemical characterization of PM samples, the application of
source apportionment techniques to the ACEPT-AIR datasets (Action 3) was postponed until
the input data were fully available. This caused a deviation from the foreseen time-schedule
for Action 3 as well (see section 5.1.2) but with no significant effect on the overall successful
completion of the project.
Deliverables D6 and D7 are attached to the present Report, along with ACEPT-AIR Database
(in Microsoft Office Access).

21
Continuation after the end of project: The developed Database contains unique information
on PM chemical speciation for three characteristic Greek urban environments. ACEPT-AIR
Database has been distributed to the project stakeholders and is already used by the
Ministry of Environment, Energy and Climate Change for Air Pollution Mapping, a major
project undertaken by the Ministry during the last years. PM monitoring is a major activity
for both NCSR “D” and AUTH. NCSR “D” maintains GAW-DEM station, where PM10 and
PM2.5 mass concentrations along with other particle parameters are measured on a continuous
basis throughout the year. In addition, UTH has obtained significant experience in PM
sampling through the implementation of ACEPT-AIR project. The Sequential PM sampler
purchased by UTH for the project is currently being used in the framework of doctorate and
master theses. It is thus expected that new data on chemical speciation will be available in
the course of the following decade through the project partners’ research and other activities.
Moreover, given that the partners have developed and maintain a very good collaboration
with key stakeholders in their respective regions, the national, regional and local authorities
will continue to take advantage of all new data obtained as well as of the expertise gained by
ACEPT-AIR partners.
Table 6. List of Deliverables and Milestones for Action 2. Foreseen and actual dates of
completion are also shown.
Completion of Deliverables Foreseen date Actual date
D6. PM10 and PM2.5 concentration databases for the
three urban areas (AMA,TMA and VGA) 31/07/2012 30/04/2012
D7. PM10 and PM2.5 chemical composition databases for
the three urban areas (AMA,TMA and VGA) 31/10/2012 30/04/2013
Achievement of Milestones Foreseen date Actual date
M1. Collection of historical data sets and quality control
assurance 02/2011 02/2011
M2. Completion of sampling campaign 05/2012 04/2012
M3. Completion of chemical analysis 08/2012 03/2013
Complementary actions outside LIFE: The high level of expertise of NCSR “D” in PM
measurements, documented as well by PM10 accreditation and related QA/QC procedures, has
been pivotal to the co-ordination of an Inter-comparison exercise for PM10 samplers,
organized under the auspices of IAEA and the Regional European project RER/2/005. The
Inter-comparison was followed by a workshop with the participation of 12 organizations from
9 European countries and resulted in the enhancement of QA/QC procedures among National
Environmental authorities in the Balkan Region, including some Greek organizations
(National Technical University of Athens, University of Patras) and project stakeholders
(Ministry of Environment, Energy and Climate Change).
In addition, NCSR “D” co-ordinated a Proficiency Test exercise for the analysis of PM
elemental content, again under the auspices of IAEA and the Regional European project
RER/1/008. NCSR “D” undertook the samples’ preparation (by the use of two Certified
Reference Materials) and analysis and reporting of results. In total 18 laboratories from 13
countries participated. Five analytical techniques (XRF/EDXRF, PIXE, ICP-MS, AAS and
INAA) were assessed with respect to the determination of particles elemental content.
22
5.1.2. Action 3. Application of state of the art source apportionment techniques based on
the developed databases and receptor modelling
Action 3 started on November 2010 and was completed on December 2013 (Table 2). In the
framework of this Action, the main emission sources affecting PM concentration levels at the
three studied cities were identified and their contributions were quantified. Both historical
data and data collected during ACEPT-AIR project were used in the analysis in order to
examine temporal and spatial variability. Action 3 was performed by NCSR “D” (Action
leader) and AUTH.
Application of receptor modelling
Source apportionment of PM10 and PM2.5 concentrations measured at AMA, TMA and VGA
has been performed by two widely used receptor models: Positive Matrix Factorization
(PMF) and Chemical Mass Balance (CMB). The PMF model applied was PMF2 (two-way
PMF) (Paatero, 2004), while for CMB modelling an optimized CMB procedure was applied,
the Robotic CMB (RCMB), which has been developed by AUTH (Argyropoulos & Samara,
2010).
Source apportionment analysis was performed on the PM10 and PM2.5 data collected during
ACEPT-AIR project at two sites in AMA (AP and NS), two sites in TMA (UT and UB) and
one site in VGA. In addition historical data collected at three urban sites in Athens during
2002 and a traffic site in Thessaloniki during 2007 were also analyzed. These historical data
allowed for an assessment of the long term temporal variability of source chemical
composition and strength. In the case of CMB modelling, source profiles were also used as
input data. These chemical profiles have been obtained through emission source
measurements (for primary anthropogenic sources), SPECIATE Database on PM source
profiles developed by the U.S. Environmental Protection Agency (for marine aerosol) and
theoretical profiles based on stoichiometry (for secondary aerosol formation).
Major sources and their contributions to PM concentration levels
The identified factors by PMF were attributed to emission sources based on their chemical
profile and contribution time series (i.e. seasonality etc.). The obtained chemical profiles for
PM10 and PM2.5 corresponding to the best PMF solution for each city are provided in
Deliverable D8 “The chemical profile and respective contribution of aerosol sources on each
region (AMA, TMA, GVA) in the PM2.5 and PM10 fractions” (ANNEX III).
The major contributing source to PM10 concentrations at Agia Paraskevi (AP) and Nea
Smyrni (NS) urban background sites in AMA was Biomass burning (Figure 10), with the
relative contribution in NS reaching more than 40%. Mineral dust and Secondary sulfate &
organics also contributed significantly to the PM10 mass concentration, especially in AP,
indicating the more suburban character of this site with respect to NS site. Primary
anthropogenic sources (vehicle exhaust and non-exhaust emissions and oil combustion)
presented a much higher contribution in NS, while sea salt concentration was similar between
the two sites and accounted for 7 – 10% of total PM10 mass. Biomass burning and Secondary
sulfate & organics were the main contributing sources in PM2.5, with the former prevailing
in NS and the latter in AP, again highlighting the more suburban character of AP site. Traffic
(vehicle exhaust and non-exhaust emissions) accounted for 18% and 16% of PM2.5 mass in NS
and AP respectively, while oil combustion had a lower share (6 and 3%). Sea salt presented

23
Vehicle
exhaust; 2.2; 8%
Road dust;
2.5; 10%
Secondary;
3.4; 13%
Biomass
burning; 9.1; 35%
Mineral
dust; 4.1; 16%
Oil
combustion; 2.5; 10%
Sea salt;
2.2; 8%
Vehicle
exhaust; 1.6; 5%
Road dust;
3.8; 11%
Sec.
sulfate; 8.4; 24%
Sec.
nitrate; 8.9; 25%
Biomass
burning; 8.2; 24%
Mineral
dust; 2.4; 7%
Sea Salt;
1.5; 4%
Traffic;
2.2; 5%
Sec.
sulfate; 8.2; 18%
Sec.
nitrate; 8.4; 18%
Biomass
burning; 9.0; 20%
Mineral
dust; 8.3; 18%
Oil
combustion; 5.4; 12%
Sea salt;
3.4; 7%
Industrial;
1.1; 2%
much lower concentration in relation to the PM10 size fraction indicating that this natural
source mainly affects coarse particles.
At the urban background site (UB) in TMA, the major contributing sources were Biomass
burning (24% and 36% for PM10 and PM2.5, respectively), Secondary sulfate & organics (24%
and 33%) and Secondary nitrate & organics (25% and 20%) (Figure 10). Traffic contribution
(exhaust and non-exhaust emissions) was similar to the concentrations estimated for the
Athens urban background sites. Natural contributions (Mineral dust and Sea salt) were found
lower in Thessaloniki, due to the topography and climate of the region (such as higher
humidity which does not promote soil dust resuspension). At the urban traffic site (UT) the
main contributing source was vehicle exhaust (29% and 34% for PM10 and PM2.5,
respectively), with mean contribution reaching more than 15 and 10 μg m-3 for PM10 and
PM2.5, respectively.
At Volos Greater Area (VGA) the major contributing sources to PM10 were Biomass
burning (20%), Mineral dust (18%), Secondary sulfate & organics (18%) and Secondary
nitrate & organics (18%). Oil combustion also contributed significantly to the PM10 mass
concentration (12%) (Figure 10). Traffic contribution was lower than in Athens and
Thessaloniki which are the two major urban centres in Greece and present much higher
urbanization and traffic density. Sea salt contributed mainly to PM10 and accounted for 2% of
its mass. Secondary nitrate and Mineral dust were also related to coarse particles. The main
contributing sources to PM2.5 were Oil combustion (33%), Biomass burning (23%) and
Secondary sulfate & organics (19%).
(c)
(b) (a)
Figure 10. Contribution of natural and
anthropogenic sources [μg m-3; %] to PM10
concentration levels in: (a) Athens urban
background sites; (b) Thessaloniki urban
background site; (c) Volos. In Athens only
sulfate was detected as a separate secondary
inorganic source while in Thessaloniki and
Volos both nitrate and sulfate profiles were
obtained. All secondary source profiles
included secondary organic carbon as well.
24
Comparison of PMF and CMB results provided useful additional information of PM
emission sources, as well as insight into the advantages and limitations of each model. The
contribution of traffic to PM concentrations was accounted for differently by the two models
mainly due to the absence of a Mineral dust profile in CMB modelling. Mineral dust was
probably attributed to Road dust in that case. In addition, the Vehicle exhaust profile used in
CMB is characteristic of fresh exhaust emissions, while the obtained PMF profiles correspond
to aged exhaust particles. Secondary sulphate & organics presented very similar results in
both models, highlighting the need to use theoretical secondary species chemical profiles in
CMB modelling. The Biomass burning profile obtained by PMF presented significant
contribution from ammonium and nitrate, which were negligible in the CMB profiles.
Ammonium nitrate was mostly measured during cold season when the low temperatures
favour its presence in the particle phase. Since biomass burning activity was more intense
during that period as well (probably for residential heating), the PMF Biomass burning profile
reflected the interaction inside the urban atmosphere of typical biomass burning species (such
as K+ and OC) with secondary aerosol related to other anthropogenic activities (such as
nitrate). These differences in CMB and PMF profiles highlight the changes in source profiles
from the emission point to the receptor. Sea salt contribution was generally higher in PMF
due to the presence of other non sea-salt species in its profile (such as EC, V, Ni or other
metals), which may be attributed to shipping emissions or harbour activities apportioned
together with sea salt aerosol. A characteristic example is the sea salt contribution calculated
by PMF in Volos which is equal to the sum of contributions from fresh and aged sea salt
along with emissions from scrap handling in Volos harbour. Low contributing sources (below
1%) were not identified by PMF, while when included in CMB source profiles, they were
quantified (e.g. tire and /or waste burning or oil combustion in the case of Thessaloniki).
Temporal variation in source chemical composition and strength
Temporal variation was assessed both in the short and the long term. With respect to seasonal
variability, Biomass burning presented the highest seasonal dependence (Figures 11 and 12).
Specifically, Biomass burning mostly contributed during cold season probably due to its use
for residential heating, reaching up to 22 μg m-3 in the densely populated NS and 20 μg m-3 in
Volos. In Thessaloniki Biomass burning contributions were slightly higher in warm season
and may be attributed to forest fires affecting the region. Traffic (exhaust and non-exhaust
emissions) seasonal pattern varied between cities and even for different sites in the same city.
The contribution of the non-exhaust component (road dust) was often larger in the warm
season when dry weather conditions promoted dust resuspension. Similarly the mineral dust
source was more intense during spring and summer months (Figures 11 and 12). Secondary
aerosol formation did not show significant seasonal variability, except for nitrate which was
mainly found during cold season. Nitrate formation is favored in winter due to low
temperature and higher humidity while in the summer it volatilizes easily due to higher
temperatures (Chow et al., 2005). Oil combustion was contributing more during cold season
which may be related to central residential heating emissions. Sea salt contribution exhibited
high seasonality with different patterns depending on the geography of each site and the
prevailing wind directions during each season. Higher sea salt concentrations were observed
during winter in Athens and Volos and during summer in Thessaloniki.
Analysis of long term variability in Athens indicated considerable change in emission source
strengths over the last decade (2002-2012). All anthropogenic sources (traffic, oil combustion,
secondary aerosol formation) exhibited significant decrease (in the range -55% to -90%
depending on the source) while natural source contributions remained relatively stable. The
only exception was Biomass burning which showed a much higher contribution in 2012 (1.6

25
0
10
20
30
40
50
60
7/7 14/7 21/7 28/7 4/8
Ma
ss c
on
trib
uti
on
(μg
m-3
)
12/9 17/9 22/9 27/9 2/10
Sea salt
Oil combustion
Mineral dust
Biomass burning
Secondary
Road dust
Vehicle exhaust
0
10
20
30
40
50
60
16/1 23/1 30/1 6/2
Ma
ss c
on
trib
uti
on
(μg
m-3
)
21/3 26/3 31/3 5/4 10/4
Sea salt
Oil combustion
Mineral dust
Biomass burning
Secondary
Road dust
Vehicle exhaust
and 3.0 times higher for PM2.5 and PM10, respectively) and was probably related to residential
heating as discussed above. An additional source profile corresponding to Industrial emissions
has been detected for the 2002 database. This source was absent in the ACEPT-AIR data
analysis, suggesting that industrial activity contributed less than1% during that period.
Comparison of source apportionment results for 2007 and 2012 in the UT site in Thessaloniki
demonstrated much lower variability in source strength during this 5-year period.
Nevertheless Biomass burning was significantly increased in 2012 again pointing towards
extensive use of biomass burning during the last years. The results clearly demonstrate the
effective reduction in emissions during the last decades due to control measures and
technological development allowing for cleaner energy and production processes. On the
other hand, they may also reflect the effects of the financial crisis in Greece during these
years.
Figure 11. Variability of daily contributions (μg m-3) of the different sources to PM10
concentrations during warm season in AP site (AMA).
Figure 12. Variability of daily contributions (μg m-3) of the different sources to PM10
concentrations during cold season in AP site (AMA).
References
Argyropoulos G., Samara C. (2010) Environ Modell Softw, 26: 469–481.
Chow J.C., Watson J.G., Lowenthal D.H., Magliano K.L. (2005) J Air Waste Manage, 55:
1158-1168.
Paatero P. (2004) User’s Guide for Positive Matrix Factorization Programs PMF2 andPMF3,
Part 1: Tutorial.
Deliverables & Milestones
Milestone M4 was achieved with a delay of one month (Table 7). Milestone M5 and
Deliverables D8 and D9 were completed with a significant delay of 1 year (Table 7). The
main cause for this deviation from the foreseen time-schedule was the delay observed in the
completion of Action 2, and in particular the chemical speciation data used as input in source
26
apportionment models. The final chemical composition database was available on April 2013
and application of source apportionment models on ACEPT-AIR data was concluded by the
end of 2013. Even though the problems presented in the realization of Action 2 (described
above in 5.1.1) caused a significant delay in the completion of Action3, they also provided the
opportunity to conduct a road dust collection campaign in Athens. No experimental data on
road dust chemical profile existed for this city and the initial planning was to use profiles
obtained from Thessaloniki. NCSR “D” decided to organize the road dust campaign in Athens
while waiting for the completion of chemical analysis of ACEPT-AIR samples. The observed
delay in completion of Deliverables and Milestones of Action 3 did not affect significantly the
overall successful completion of the project. Deliverables D8 and D9 are attached to the
present Report.
Table 7. List of Deliverables and Milestones for Action 3. Foreseen and actual dates of
completion are also shown.
Completion of Deliverables Foreseen date Actual date
D8. The chemical profile and respective contribution of
aerosol sources on each region (AMA, TMA, GVA) in
the PM2.5 and PM10 fractions
31/01/2013 31/12/2013
D9. The temporal variation in source chemical
composition and strength 31/01/2013 31/12/2013
Achievement of Milestones Foreseen date Actual date
M4. Completion of PMF and CMB application on
historical data sets 02/2012 03/2012
M5. Completion of PMF and CMB application on new
data sets 11/2012 11/2013
Continuation after the end of project: Source apportionment results provide an insight into
the major emission sources affecting air quality and may be a valuable tool in control
measures prioritization. ACEPT-AIR results have been already communicated to the
Ministry of Environment, Energy and Climate Change, as well as the regional
authorities which have been following the project as key stakeholders. In addition, the output
of Action 3 has been used in the development of ACEPT-AIR Policy Tool. NCSR “D” and
AUTH are expected to produce new source apportionment results every 5-10 years when
emission sources and relevant strengths are expected to show significant changes. The
updated results will be incorporated into the Tool database and will be available to all
interested parties.
Complementary actions outside LIFE: The capacity for source apportionment techniques to
serve as useful instruments for advancing Air Quality management in the EU has been
highlighted in the FAIRMODE (Forum for Air quality Modelling) initiative. NCSR “D” and
AUTH have been participating in FAIRMODE meetings since 2012, representing the
scientific community in Greece applying those techniques and using them in demonstration
projects like ACEPT-AIR. In addition, in the framework of FAIRMODE two inter-
comparison exercises on source apportionment models have been organized by the Joint
Research Centre (JRC), with the participation of both NCSR “D” and AUTH. The inter-
comparison results were presented during two FAIRMODE workshops (2013 and 2014) and
several receptor modelling issues have been extensively discussed.
27
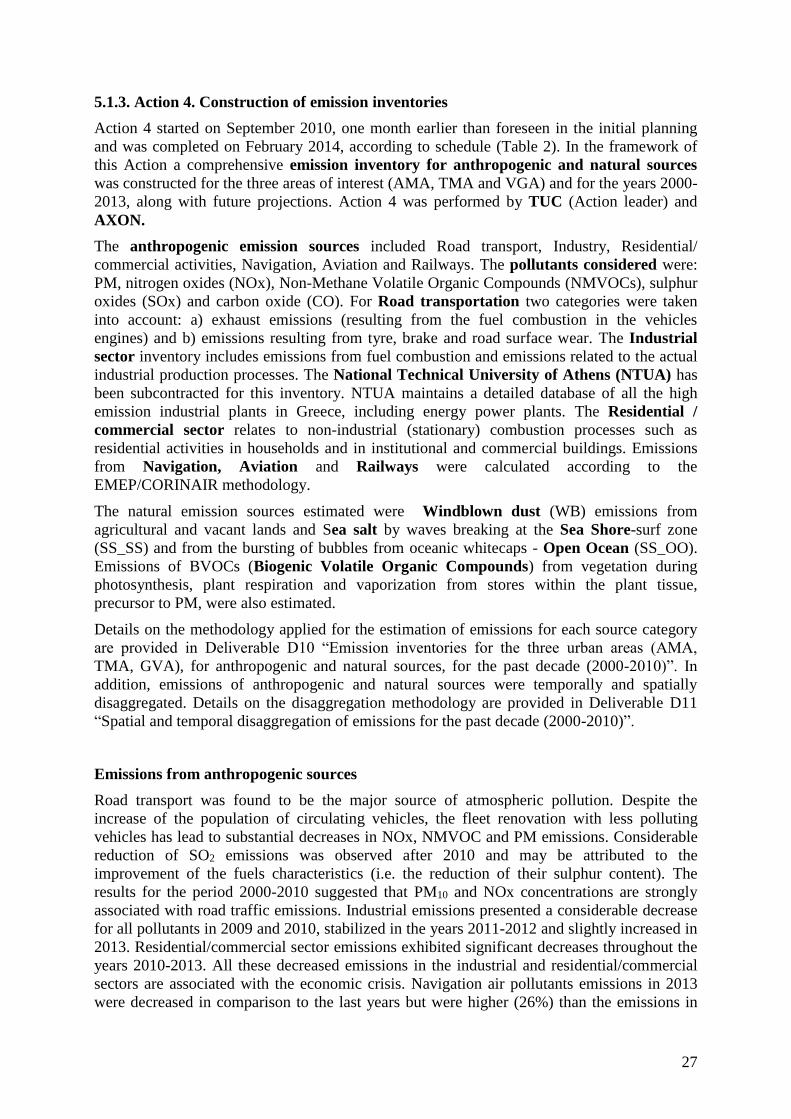
5.1.3. Action 4. Construction of emission inventories
Action 4 started on September 2010, one month earlier than foreseen in the initial planning
and was completed on February 2014, according to schedule (Table 2). In the framework of
this Action a comprehensive emission inventory for anthropogenic and natural sources
was constructed for the three areas of interest (AMA, TMA and VGA) and for the years 2000-
2013, along with future projections. Action 4 was performed by TUC (Action leader) and
AXON.
The anthropogenic emission sources included Road transport, Industry, Residential/
commercial activities, Navigation, Aviation and Railways. The pollutants considered were:
PM, nitrogen oxides (NOx), Non-Methane Volatile Organic Compounds (NMVOCs), sulphur
oxides (SOx) and carbon oxide (CO). For Road transportation two categories were taken
into account: a) exhaust emissions (resulting from the fuel combustion in the vehicles
engines) and b) emissions resulting from tyre, brake and road surface wear. The Industrial
sector inventory includes emissions from fuel combustion and emissions related to the actual
industrial production processes. The National Technical University of Athens (NTUA) has
been subcontracted for this inventory. NTUA maintains a detailed database of all the high
emission industrial plants in Greece, including energy power plants. The Residential /
commercial sector relates to non-industrial (stationary) combustion processes such as
residential activities in households and in institutional and commercial buildings. Emissions
from Navigation, Aviation and Railways were calculated according to the
EMEP/CORINAIR methodology.
The natural emission sources estimated were Windblown dust (WB) emissions from
agricultural and vacant lands and Sea salt by waves breaking at the Sea Shore-surf zone
(SS_SS) and from the bursting of bubbles from oceanic whitecaps - Open Ocean (SS_OO).
Emissions of BVOCs (Biogenic Volatile Organic Compounds) from vegetation during
photosynthesis, plant respiration and vaporization from stores within the plant tissue,
precursor to PM, were also estimated.
Details on the methodology applied for the estimation of emissions for each source category
are provided in Deliverable D10 “Emission inventories for the three urban areas (AMA,
TMA, GVA), for anthropogenic and natural sources, for the past decade (2000-2010)”. In
addition, emissions of anthropogenic and natural sources were temporally and spatially
disaggregated. Details on the disaggregation methodology are provided in Deliverable D11
“Spatial and temporal disaggregation of emissions for the past decade (2000-2010)”.
Emissions from anthropogenic sources
Road transport was found to be the major source of atmospheric pollution. Despite the
increase of the population of circulating vehicles, the fleet renovation with less polluting
vehicles has lead to substantial decreases in NOx, NMVOC and PM emissions. Considerable
reduction of SO2 emissions was observed after 2010 and may be attributed to the
improvement of the fuels characteristics (i.e. the reduction of their sulphur content). The
results for the period 2000-2010 suggested that PM10 and NOx concentrations are strongly
associated with road traffic emissions. Industrial emissions presented a considerable decrease
for all pollutants in 2009 and 2010, stabilized in the years 2011-2012 and slightly increased in
2013. Residential/commercial sector emissions exhibited significant decreases throughout the
years 2010-2013. All these decreased emissions in the industrial and residential/commercial
sectors are associated with the economic crisis. Navigation air pollutants emissions in 2013
were decreased in comparison to the last years but were higher (26%) than the emissions in

28
2000. Aviation emissions increased by 84% since 1990 with an average annual increase rate
of approximately 4%. Emissions from anthropogenic sources were also temporally and
spatially disaggregated. An example of spatial disaggregation of road transport emissions in
Thessaloniki is shown in Figure 13.
Figure 13. Spatial distribution of PM road traffic emissions in the TMA.
Emissions from natural sources
Emissions from natural sources were significant, especially in the case of coarse particles
(around 65 Gg per year for AMA; 6 Gg per year for TMA, 5 Gg per year for GVA). The most
significant natural source was the sea surface, with mean contributions to total PM over
AMA, TMA and GVA equal to 37%, 10% and 44% for PM2.5 and 85%, 65% and 84% for
PM2.5-10. Windblown dust accounted for a relatively small fraction of total natural PM
emissions in AMA, TMA and GVA (~8%; ~9%; ~8%). In addition, BVOCs emissions
accounted for approximately 1%, 16% and 4% of total PM emitted from the AMA, TMA and
VGA, respectively. Except for AMA natural PM emissions have increased during 2000-2010
whereas their relative contribution to total PM10 emissions has increased in all areas (from
0.9% in AMA to 88% in VGA) (Figure 14). Natural BVOCs emissions during the period
2010-2013 were enhanced compared to 2000-2010 whereas natural PM emissions were
decreased. No significant seasonal variation was observed in the natural PM emissions, while
BVOCs emissions were increased during the warm period due to the enhanced solar radiation
and temperature.
Future emission projections
Future fuel consumption scenarios were examined as provided by the Centre of Renewable
Energy Sources (CRES) and national reports. The projections were performed for the years
2015 and 2020. According to these fuel consumption scenarios, in 2015, an increase of the
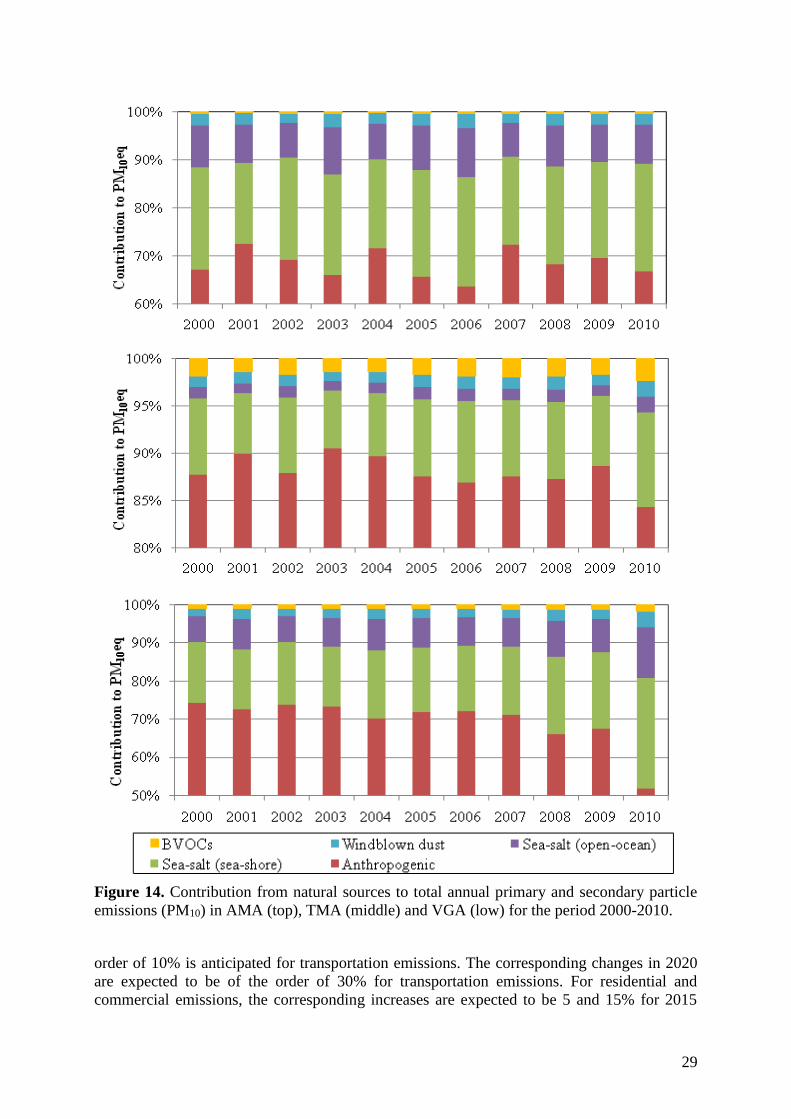
29
Figure 14. Contribution from natural sources to total annual primary and secondary particle
emissions (PM10) in AMA (top), TMA (middle) and VGA (low) for the period 2000-2010.
order of 10% is anticipated for transportation emissions. The corresponding changes in 2020
are expected to be of the order of 30% for transportation emissions. For residential and
commercial emissions, the corresponding increases are expected to be 5 and 15% for 2015

30
and 2020 respectively. Finally, industrial emissions are expected to present a constant
increase regarding natural sources, the projected changes in temperature, precipitation and
land use are expected to enhance windblown dust emissions.
References
EMEP/CORINAIR, Emission Inventory Guidebook (2009) Technical Report No 9, European
Environmental Agency, http://reports.eea.eu.int/EMEPCORINAIR4/en.
Deliverables & Milestones
All Milestones and Deliverables of Action 4 were achieved according to the foreseen time
schedule (Table 7). No major problems were encountered in this Action. Deliverables D10 –
D13 are attached to the present Report.
Continuation after the end of project: The emission inventories compiled for the years
2010-2013 have been used in the development of ACEPT-AIR Policy Tool. TUC and
AXON will update the Tool’s database with emission inventories for the years to come, as
they become available either from the National Emission Inventories submitted in the
framework of Greece’s environmental reporting obligations to the European Environmental
Agency and the United Nations Economic Commission for Europe, or from newly compiled
inventories by the two project partners.
Table 8. List of Deliverables and Milestones for Action 4. Foreseen and actual dates of
completion are also shown.
Completion of Deliverables Foreseen date Actual date
D10. Emission inventories for the three urban areas
(AMA, TMA, GVA), for anthropogenic and natural
sources, for the past decade (2000-2010)
31/08/2012 31/08/2012
D11. Spatial and temporal disaggregation of emissions
for the past decade (2000-2010)
30/11/2012 30/11/2012
D12. Emission inventories for the three urban areas
(AMA, TMA, GVA), for anthropogenic and natural
sources, for 2010-2013 and projections for the future
28/02/2014 28/02/2014
D13. Spatial and temporal disaggregation of emissions,
for 2010-2013 and projections for the future
28/02/2014 28/02/2014
Achievement of Milestones Foreseen date Actual date
M6. Completion of data collection 02/2012 02/2012
M7. Completion of data processing and analysis and of
models application (compilation of emission
inventories) for the past decade (2000-2010)
08/2012 08/2012
M8. Completion of spatial and temporal disaggregation
of emissions for the past decade (2000-2010) 11/2012 11/2012
M9. Completion of data processing and analysis and of
models application (compilation of emission
inventories) for 2010-2013 and projections for the
future
02/2014 02/2014
M10. Completion of spatial and temporal
disaggregation of emissions for 2010-2013 and
projections for the future
02/2014 02/2014

31
5.1.4. Action 5. An operational platform for the Control PM concentrations Policy Tool
Action 5 started on March 2011 and was completed on May 2013, according to the foreseen
time schedule (Table 2). In the framework of this Action the Operational Platform (OP) of
ACEPT-AIR Policy Tool was developed. The OP was constructed in such a way as to
include all available data on PM concentrations and source contributions (based on emission
inventories and receptor modelling) for the three studied areas: Athens, Thessaloniki and
Volos. All these data were used by ACEPT-AIR Policy Tool in order to assess trends in
concentrations and emissions in the course of the years, as well as to calculate changes in
PM concentration levels related to control measures or specific conditions leading to
emission reductions or increases. The development of ACEPT-AIR Polity Tool Operational
Platform was performed by AXON (Action leader) with the collaboration of all project
partners.
Design of OP modules
The design of the Operational Platform modules was carefully planned by all ACEPT-AIR
partners in order to ensure a functional, user friendly Policy Tool. The main issues were
summarized by AXON in the form of a questionnaire which was circulated to all partners and
were: (1) Which should be the specific functional possibilities of the OP; (2) Which are the
specific air pollutants concentration and emissions levels that will be inserted; (3) Should
other kind of data be used as well; What will be the time resolution of the input data; (4) Will
historical data be used and for which period for each area; (5) Which will be the structure and
the format of input data; In which form should the final results (output) be presented; (6) Will
future projections be made? (7) Which assumptions and scenarios should be examined; (8)
What possibilities of intervention to the Policy Tool’s databases and scenarios should be
allowed to partners and end-users.
The general concepts and functionalities of the Policy Tool were also discussed during the 1st
Informative Meeting with stakeholders, held in Athens on 14/12/2011.
The interaction between project partners as well as the feedback obtained by stakeholders
during the 1st Informative Meeting led to the identification of the main objectives of the
Policy Tool:
Complete overview of the PM concentrations measured and calculated emissions at the
three studied areas;
Estimation and direct presentation of the effects of specific interventions on PM
concentrations in selected Greek regions;
Access in relative information described in scientific papers and other material published
in the international press.
According to the above mentioned objective, the structure of the Tool’s Operational Platform
was determined. The final OP design included three interconnected yet clearly separated parts
(‘3-tier approach’):
the Database and programming related to manage it;
the Business Logic (‘Business Tier’) that includes the code referring to the update and
calculations to be performed;
the Presentation Interface.

32
Development of OP modules
Following the finalization of OP design, AXON proceeded to the development of the different
modules, as described below:
Development of Input Databases: PM and gaseous pollutant concentration data obtained
from all stations of the National Network of Air Quality Monitoring as well as from the
Municipality of Thessaloniki network have been incorporated into the Policy Tool database.
In addition to air pollutants’ concentration data, the Policy Tool includes emission source
data. Specifically, relative contribution of emission sources to PM concentration levels for
different regions, particle fractions (PM10 or PM2.5) and years are provided. These data
correspond to previous source apportionment studies of ACEPT-AIR partners, as well to the
results obtained by receptor modelling in the framework of Action 3. Moreover, the emission
inventory data collected and analyzed in the framework of Action 4 have been incorporated
and are presented with respect to: Distribution of emission sources for each pollutant and
emissions’ time series, spatial allocation and daily variations. Emission source data are also
used by the OP calculation code in order to quantify changes in PM concentrations due to
variation in emission source strengths, as described below.
Development of the Calculation Code: ACEPT-AIR Policy Tool calculation code was based
on the assumption that the increase or decrease in PM concentration (ΔC) caused by a
specific source (i.e. traffic, residential heating or industrial activities) is proportional to the
respective increase or decrease of this source’s emission rate (tons/year). This assumption
has been proven to be reasonable in the case of traffic emissions that have been the main
anthropogenic PM source in Athens Metropolitan Area during the last decades (Progiou and
& Ziomas, 2011). Since source apportionment results from Action 3 have demonstrated that
secondary aerosol formation may constitute a major PM source, changes in PM
concentrations were also related to changes in emissions of precursor gaseous pollutants:
sulfur dioxide (SO2), nitrogen oxides (NOx), ammonia (NH3) and mon-methane volatile
organic compounds (NMVOCs). Aerosol formation potential factors (Table 9) have been used
in order to quantify the emissions of different secondary pollutants based on the relevant
emissions of precursor gases, according to the methodology presented by de Leeuw (2002).
During the initial testing of ACEPT-AIT Policy Tool its has been acknowledged that PM
concentration changes over a long period (such as 10 years) could be the result of changes in
local emissions as well as an increase or decrease of the background concentration over
these years. For that reason, an additional change in PM concentration (ΔCbackground) may be
included in the calculation algorithm, if the user considers that it is relevant. Based on the
above, the general equation used in the calculation code is presented below:
(1)
where: Cnew and Cold are the initial and final (after emission changes) PM concentrations [μg
m-3]; n is the number of primary PM sources and k is the number of sources of gaseous
precursors; PE are the PM emissions from primary sources and ΔPE are the respective
reductions/increases expressed as a fraction of the initial emission rate; SE are the emissions
of gaseous precursors and ΔSE are the respective reductions/increases expressed as a fraction
of the initial emission rate; SA is the relative contributions of the specific source to the total
PM concentration, as quantified by receptor modeling; ΔCbackground is the estimated change
in the background concentration.
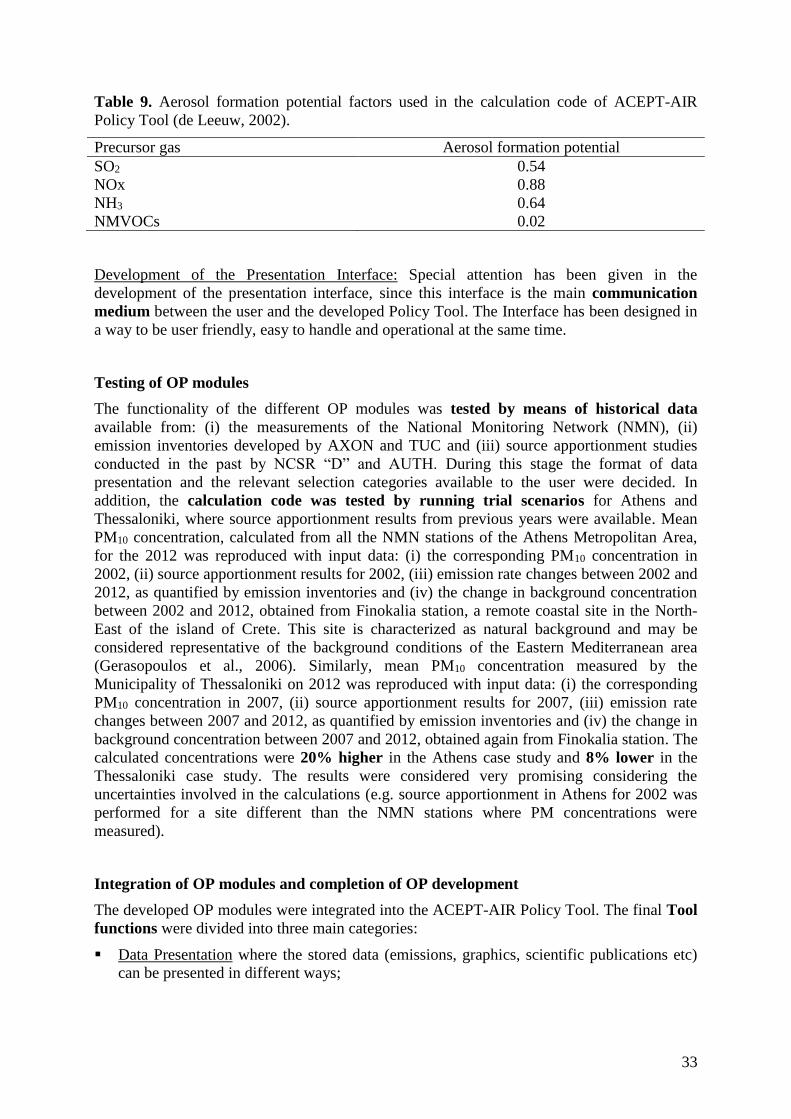
33
Table 9. Aerosol formation potential factors used in the calculation code of ACEPT-AIR
Policy Tool (de Leeuw, 2002).
Precursor gas Aerosol formation potential
SO2 0.54
NOx 0.88
NH3 0.64
NMVOCs 0.02
Development of the Presentation Interface: Special attention has been given in the
development of the presentation interface, since this interface is the main communication
medium between the user and the developed Policy Tool. The Interface has been designed in
a way to be user friendly, easy to handle and operational at the same time.
Testing of OP modules
The functionality of the different OP modules was tested by means of historical data
available from: (i) the measurements of the National Monitoring Network (NMN), (ii)
emission inventories developed by AXON and TUC and (iii) source apportionment studies
conducted in the past by NCSR “D” and AUTH. During this stage the format of data
presentation and the relevant selection categories available to the user were decided. In
addition, the calculation code was tested by running trial scenarios for Athens and
Thessaloniki, where source apportionment results from previous years were available. Mean
PM10 concentration, calculated from all the NMN stations of the Athens Metropolitan Area,
for the 2012 was reproduced with input data: (i) the corresponding PM10 concentration in
2002, (ii) source apportionment results for 2002, (iii) emission rate changes between 2002 and
2012, as quantified by emission inventories and (iv) the change in background concentration
between 2002 and 2012, obtained from Finokalia station, a remote coastal site in the North-
East of the island of Crete. This site is characterized as natural background and may be
considered representative of the background conditions of the Eastern Mediterranean area
(Gerasopoulos et al., 2006). Similarly, mean PM10 concentration measured by the
Municipality of Thessaloniki on 2012 was reproduced with input data: (i) the corresponding
PM10 concentration in 2007, (ii) source apportionment results for 2007, (iii) emission rate
changes between 2007 and 2012, as quantified by emission inventories and (iv) the change in
background concentration between 2007 and 2012, obtained again from Finokalia station. The
calculated concentrations were 20% higher in the Athens case study and 8% lower in the
Thessaloniki case study. The results were considered very promising considering the
uncertainties involved in the calculations (e.g. source apportionment in Athens for 2002 was
performed for a site different than the NMN stations where PM concentrations were
measured).
Integration of OP modules and completion of OP development
The developed OP modules were integrated into the ACEPT-AIR Policy Tool. The final Tool
functions were divided into three main categories:
Data Presentation where the stored data (emissions, graphics, scientific publications etc)
can be presented in different ways;

34
Scenarios Build-up where the stored emissions data can be processed taking into account
certain scenarios in order to forecast potential future concentrations changes/trends;
DataBase where the tool databases can be accessed in order to see, update, delete or add
new data.
A detailed Application guide and manual for the ACEPT-AIR Policy Tool has been
developed which includes: Installation guidelines, Description of all the functions of the
Operational Platform and Working examples that assist end users to understand and take
advantage of all the features of the developed Policy Tool. The developed Policy Tool was
demonstrated during the 2nd Informative Meeting for stakeholders, held in Thessaloniki on
22/02/2013. According to the feedback obtained during the meeting, some changes mostly
related to the Presentation Interface have been performed, leading to the final version of
ACEPT-AIR Policy Tool. The Policy Tool and its Application guide and manual have been
provided to all stakeholders.
References
Gerasopoulos E., Kouvarakis G., Babasakalis P., Vrekoussis M., Putaud J.-P., Mihalopoulos
N. (2006) Atmos. Environ., 40: 4679–4690.
de Leeuw F.A.A.M. (2002) Environ. Sci. Policy, 5: 135–145.
Progiou A.G., Ziomas I.C. (2011) Sci. Total Environ., 410-411: 1–7.
Deliverables & Milestones
All Milestones and Deliverables of Action 5 were achieved according to the foreseen time
schedule with no major problems (Table 10). ACEPT-AIR OP (Deliverable D14) and its
Application guide and manual (Deliverable D15) are attached to the present Report.
Table 10. List of Deliverables and Milestones for Action 5. Foreseen and actual dates of
completion are also shown.
Completion of Deliverables Foreseen date Actual date
D14. Operational Platform (OP) for the “ACEPT-AIR”
Policy tool 28/02/2013 28/02/2013
D15. Application guide and manual for the OP 30/09/2013 30/09/2013
Achievement of Milestones Foreseen date Actual date
M11. Development of OP modules (database,
integration of source apportionment) 08/2012 08/2012
M12. Testing of OP modules by means of historical data 12/2012 12/2012
M13. Integration of modules and completion of the OP
development 02/2013 02/2013
Continuation after the end of project: The Operational Platform of ACEPT-AIR Policy
Tool has been designed in such a way as to allow end users to access its database and update
the relevant input data (on PM concentrations or emissions). AXON and NCSR “D” have
committed to providing all necessary support to end users, related either to the use of the
Tool or its update. The ACEPT-AIR Tool support scheme has been planned in the framework
of Action 12 “After-life communication & continuation plan”.

35
5.1.5. Action 6. Development and application of a two-way direct interaction process
with stakeholders
Action 6 started with a delay of one month on February 2011 and was completed at the end of
the project, on August 2014 (Table 2). In the framework of this Action, a two-way direct
interaction process with key stakeholders was developed and implemented, with the
purpose of communicating the project outcome, obtaining feedback and promoting the use
of ACEPT-AIT Policy Tool by local, regional and national authorities. The Action was
coordinated by AUTH (Action leader) and all project partners were actively involved.
The key stakeholders of the project were local, regional and national authorities at the
studied areas:
The Ministry of Environment, Energy and Climate Change (MEECC)
The Coalition of 21 Local Authorities of North and East Athens, encompassing at least
one third of the Athens Metropolitan area
The Municipality of Thessaloniki
The Regional Unit of Magnesia and Sporades (former Prefecture of Magnesia)
The association of Motor Vehicles Importers – Representatives.
During the project implementation, several other stakeholders were involved and
participated in the project informative events: The Municipalities of Galatsi, Marousi,
N.Ionia, Chalandri and Keratsini-Drapetsona in Athens Metropolitan Area and the
Municipality of Delta in Thessaloniki Metropolitan Area, the Directorate of Environment and
Spatial Planning of Central Macedonia, the Directorate of Development of the Regional Unit
of Pieria, the Hellenic Statistical Authority, the Organization of Planning and Environmental
Protection of Thessaloniki, Volos Port Authority S.A., AGET Cement Industry, the Pan-
Hellenic Network of Ecological Organization (PANDIKO), the Regional Unit of Agria, FREE
RECYCLE company for electrical appliances recycling, the Public Power Corporation S.A.
and Technical Chamber of Greece
Information activities
During the course of the project implementation, NCSR “D”, AUTH and UTH were in close
communication with the local and regional authorities in their respective areas providing
them with updates on the progress of the project and obtaining feedback. NCSR “D” and
AXON also communicated on a regular basis with the Ministry of Environment, Energy and
Climate Change (MEECC), discussing key issues and specific management needs in relation
to the application of an integrated environmental policy for ambient air quality. Apart from
these informal communications, ACEPT-AIR team organized three Informative Events with
the participation of all project stakeholders and other interested parties. The minutes of each
Event were sent to all interested participants. During all meetings and Informative Events
views and needs of stakeholders were recorded, providing valuable material for the
development of the Policy tool.
The 1st Informative Event was organized in collaboration with the Coalition of 21 Local
Authorities of North and East Athens. The event was held on 14/12/ 2011, at the Municipality
of Chalandri, in Athens, with a total of 42 participants (Figure 15). Representatives of the
Ministry of Environment, Energy and Climate Change, a number of Municipalities of the
wider Athens area, the Municipality of Thessaloniki, the Prefecture of Magnesia, FREE
RECYCLE company and local press have attended. In addition, Mrs. G. Valaoras,

36
representative of ASTRALE Monitoring Team, and Prof. A. Chaloulakou, member of the
external evaluation team, were among the participants. ACEPT-AIR partners presented the
main objectives and actions of the project, as well as initial results from the summer
measurement campaign and the compilation of emission inventories. The presentations were
followed by a live discussion between ACEPT-AIR team and stakeholders, regarding the
results presented as well as the stakeholders’ role during the implementation of the project.
Figure 15. Photos from the Informative Events for stakeholders held in Chalandri, Athens on
December 2011 (left) and in Volos on 4/4/2013 (right).
The 2nd Informative Event was held at the Municipality of Thessaloniki on 5/4/2013, with a
total of 84 participants (Figure 16). Apart from representatives of key stakeholders, other
Municipalities in the Thessaloniki Metropolitan Area, the Public Power Corporation S.A., the
15th Primary School of Evosmos, the Directorate of Environment and Spatial Planning of
Central Macedonia, the Directorate of Development of the Regional Unit of Pieria, the
Organization of Planning and Environmental Protection of Thessaloniki and the Hellenic
Statistical Authority attended. The event was advertized through several press releases in the
local press and online information platforms. ACEPT-AIR partners provided an update on the
progress achieved, including: the final outcome of the measurement campaigns and chemical
characterization of PM in the three studied cities, the developed ACEPT-AIR Database,
Emission inventories compilation and the results from the application of source
apportionment techniques. In addition, Dr. M. Petrakakis from the Municipality of
Thessaloniki presented data on the evolution of PM concentrations in Thessaloniki before and
after the financial crisis. The presentation of results was followed by a demonstration of the
Operational Platform of ACEPT-AIT Policy Tool by Dr. Eleftheriadis (NCSR “D”) and Dr.
Progiou (AXON). The Event closed with a discussion among participants regarding details on
the results presented, as well as ways of effective use of the project outcome after its
completion
The 3rd Informative Event was held in Volos on 4/4/2014, with the participation of key
stakeholders only (Figure 15). This event was dedicated to the training of stakeholders in the
use of ACEPT-AIR Policy Tool. Prior to the event and by the end of 2013 all stakeholders
had in their procession an initial version of ACEPT-AIR Policy Tool (installed by project
partners) and relevant Training Material. The objectives of the 3rd Informative Event were
to record feedback on the functionalities of the Tool, possible problems or suggestions and to
provide formal training on the Tool after the hand-on experience stakeholders had already

37
gained by using it for the past few months. Among the topics discussed during the Event were
the methodologies applied for the development of the Tool’s calculation code and the
included databases on concentrations and emission strengths. Dr. Eleftheriadis (NCSR “D”)
demonstrated in detail all the functionalities of the Tool, discussing as well on the different
emission scenarios that may be applied and the best ways to make use of the Tool’s outcome
with respect to environmental management and development of effective control strategies.
Based on the comments received at this last event, the final version of ACEPT-AIR Policy
Tool was developed at the end of July 2014.
Figure 16. Photos from the Informative Event for stakeholders held in Thessaloniki on
5/4/2013.
Active participation of stakeholders in the project implementation
During the field measurement campaigns, NCSR “D” and AUTH have had the opportunity to
collaborate closely with the Ministry of Environment, Energy and Climate Change, the
Coalition of 21 Local Authorities of North and East Athens and the Municipality of
Thessaloniki. All three stakeholders assisted in site selection / preparation issues and were
constantly held informed of the progress of the measurement campaigns. In addition, NCSR
“D” has contacted the Coalition of 21 Local Authorities of North and East Athens to examine
the possibility of organizing short-term measurements at a number of municipalities. There
was increased interest by the part of the municipalities and Mobilab was employed in order to
conduct measurement in as many sites as possible (as described above in 5.1.1).
Deliverables & Milestones
In general, Milestones and Deliverables of Action 6 were achieved according to the foreseen
time schedule with no major problems (Table 11). Some small delays in the realization of the
Informative Events were mainly due to the availability of stakeholders since an effort was
made to ensure maximum participation at all events. Deliverable D17 was updated on April
2014, after the 3rd Informative Event, in order to include the minutes from this event as well.
Deliverables D16 (Training material for stakeholders), D17 (Minutes, invitations, lists of
participants and photos for the informative Events) and D18 (The final updated version of
ACEPT-AIR Policy Tool) are attached to the present Report.
Continuation after the end of project: In the course of the project, ACEPT-AIR partners in
Athens, Thessaloniki and Volos have developed a close and fruitful collaboration with the
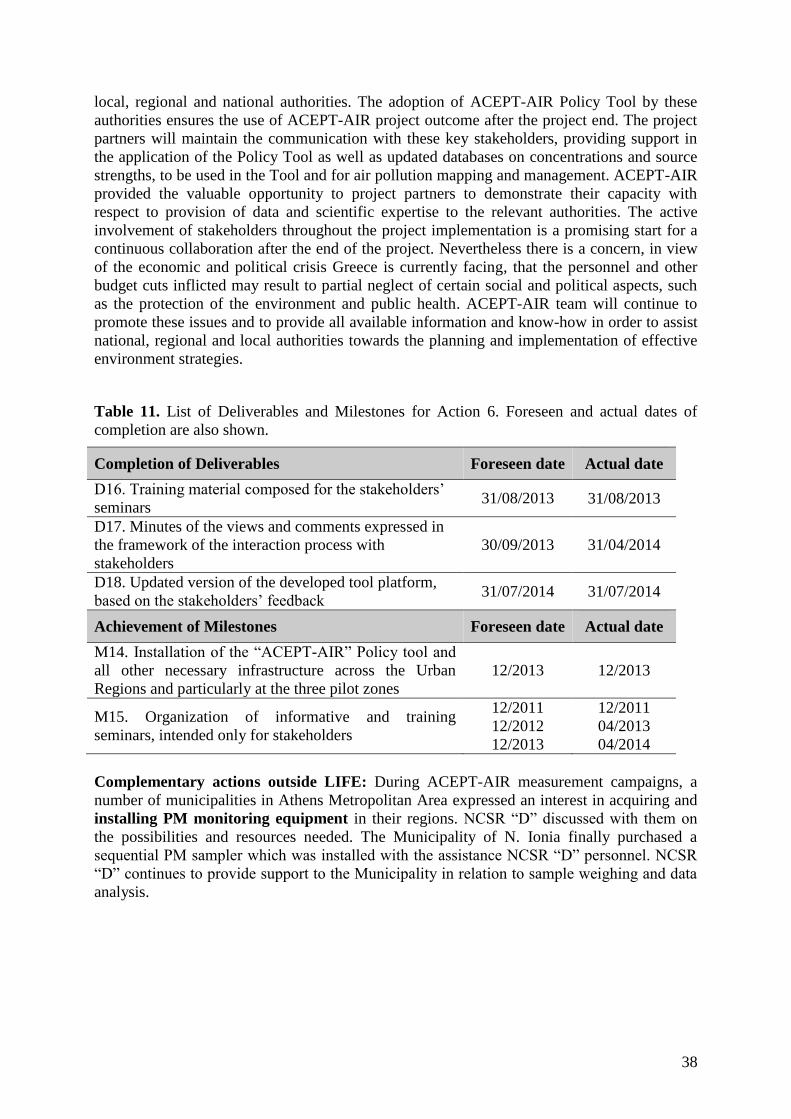
38
local, regional and national authorities. The adoption of ACEPT-AIR Policy Tool by these
authorities ensures the use of ACEPT-AIR project outcome after the project end. The project
partners will maintain the communication with these key stakeholders, providing support in
the application of the Policy Tool as well as updated databases on concentrations and source
strengths, to be used in the Tool and for air pollution mapping and management. ACEPT-AIR
provided the valuable opportunity to project partners to demonstrate their capacity with
respect to provision of data and scientific expertise to the relevant authorities. The active
involvement of stakeholders throughout the project implementation is a promising start for a
continuous collaboration after the end of the project. Nevertheless there is a concern, in view
of the economic and political crisis Greece is currently facing, that the personnel and other
budget cuts inflicted may result to partial neglect of certain social and political aspects, such
as the protection of the environment and public health. ACEPT-AIR team will continue to
promote these issues and to provide all available information and know-how in order to assist
national, regional and local authorities towards the planning and implementation of effective
environment strategies.
Table 11. List of Deliverables and Milestones for Action 6. Foreseen and actual dates of
completion are also shown.
Completion of Deliverables Foreseen date Actual date
D16. Training material composed for the stakeholders’
seminars 31/08/2013 31/08/2013
D17. Minutes of the views and comments expressed in
the framework of the interaction process with
stakeholders
30/09/2013 31/04/2014
D18. Updated version of the developed tool platform,
based on the stakeholders’ feedback 31/07/2014 31/07/2014
Achievement of Milestones Foreseen date Actual date
M14. Installation of the “ACEPT-AIR” Policy tool and
all other necessary infrastructure across the Urban
Regions and particularly at the three pilot zones
12/2013 12/2013
M15. Organization of informative and training
seminars, intended only for stakeholders
12/2011
12/2012
12/2013
12/2011
04/2013
04/2014
Complementary actions outside LIFE: During ACEPT-AIR measurement campaigns, a
number of municipalities in Athens Metropolitan Area expressed an interest in acquiring and
installing PM monitoring equipment in their regions. NCSR “D” discussed with them on
the possibilities and resources needed. The Municipality of N. Ionia finally purchased a
sequential PM sampler which was installed with the assistance NCSR “D” personnel. NCSR
“D” continues to provide support to the Municipality in relation to sample weighing and data
analysis.
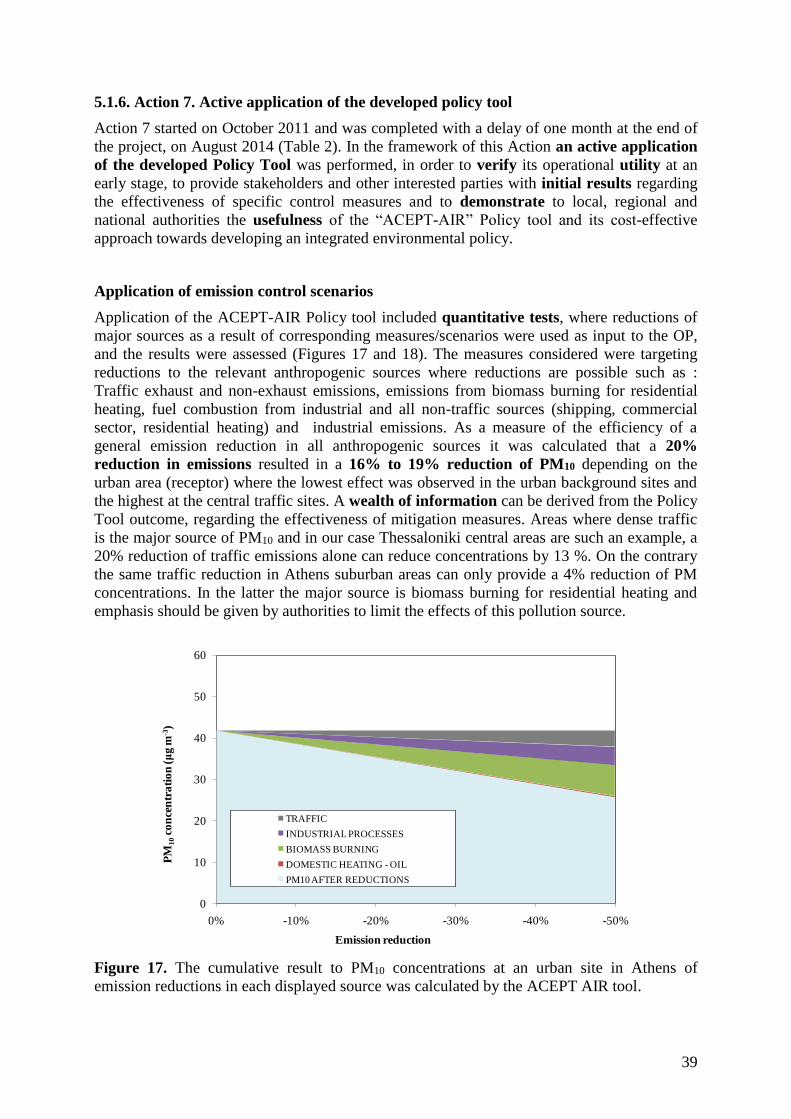
39
0
10
20
30
40
50
60
0% -10% -20% -30% -40% -50%
PM
10
con
cen
tra
tio
n (μ
g m
-3)
Emission reduction
TRAFFIC
INDUSTRIAL PROCESSES
BIOMASS BURNING
DOMESTIC HEATING - OIL
PM10 AFTER REDUCTIONS
5.1.6. Action 7. Active application of the developed policy tool
Action 7 started on October 2011 and was completed with a delay of one month at the end of
the project, on August 2014 (Table 2). In the framework of this Action an active application
of the developed Policy Tool was performed, in order to verify its operational utility at an
early stage, to provide stakeholders and other interested parties with initial results regarding
the effectiveness of specific control measures and to demonstrate to local, regional and
national authorities the usefulness of the “ACEPT-AIR” Policy tool and its cost-effective
approach towards developing an integrated environmental policy.
Application of emission control scenarios
Application of the ACEPT-AIR Policy tool included quantitative tests, where reductions of
major sources as a result of corresponding measures/scenarios were used as input to the OP,
and the results were assessed (Figures 17 and 18). The measures considered were targeting
reductions to the relevant anthropogenic sources where reductions are possible such as :
Traffic exhaust and non-exhaust emissions, emissions from biomass burning for residential
heating, fuel combustion from industrial and all non-traffic sources (shipping, commercial
sector, residential heating) and industrial emissions. As a measure of the efficiency of a
general emission reduction in all anthropogenic sources it was calculated that a 20%
reduction in emissions resulted in a 16% to 19% reduction of PM10 depending on the
urban area (receptor) where the lowest effect was observed in the urban background sites and
the highest at the central traffic sites. A wealth of information can be derived from the Policy
Tool outcome, regarding the effectiveness of mitigation measures. Areas where dense traffic
is the major source of PM10 and in our case Thessaloniki central areas are such an example, a
20% reduction of traffic emissions alone can reduce concentrations by 13 %. On the contrary
the same traffic reduction in Athens suburban areas can only provide a 4% reduction of PM
concentrations. In the latter the major source is biomass burning for residential heating and
emphasis should be given by authorities to limit the effects of this pollution source.
Figure 17. The cumulative result to PM10 concentrations at an urban site in Athens of
emission reductions in each displayed source was calculated by the ACEPT AIR tool.

40
0
10
20
30
40
50
60
0% -10% -20% -30% -40% -50%
PM
10
con
cen
trat
ion
(μg
m-3
)
Emission reduction
TRAFFIC
INDUSTRIAL PROCESSES
BIOMASS BURNING
FUEL COMBUSTION
PM10 AFTER REDUCTIONS
Proposed mitigation measures for reduction of PM concentrations
Measures proposed by ACEPT-AIR for Greek cities based on PM speciation and source
apportionment obtained during 2011-2012 and the most efficient reductions achievable as
calculated from the ACEPT-AIR Policy Tool are summarized at Table 12 below.
Figure 18. The cumulative result to PM10 concentrations at Thessaloniki traffic impacted site
of emission reductions in each displayed source was calculated by the ACEPT AIR tool.
Table 12. Proposed measured for the reduction of PM concentration in Greek cities.
Road traffic
Low emission zones (LEZ)
Expand and prioritize the recently (2012) implemented
free access for Euro 5 or newer technology vehicles
emitting less than 140 g/km or hybrids in the “green
ring”.
Parking
Creation of large parking lots at main transport
interfaces (train and metro stations) at the outskirts of
the city (park and ride system) with incentives (low
fares) in order to promote the combined use of car and
public transport.
Street cleaning Tandem use of sweeping and, more importantly, water
washing, especially during dry periods of the year.
Promoting low-carbon and low-
NOx vehicles and new technology
vehicles
Implement further Reductions in Road Tax and Import
Tax for low emission vehicles (for NO2 and PM).
Incentives to withdraw aged private vehicles and
replacement with modern (E5/E6) vehicles. Incentives
for installation of particle filters in heavy duty
commercial vehicles.
Expand public transport Network
Continuous expansion of Metro lines in Athens
(currently only 3) and completion of the Metro in
Thessaloniki. Improvement of Public Bus Network for
an efficient, ecologic and faster public transportation
(metro, train, and tram).
Reducing road transportation for Creating a terminal outside the Athens Metropolitan
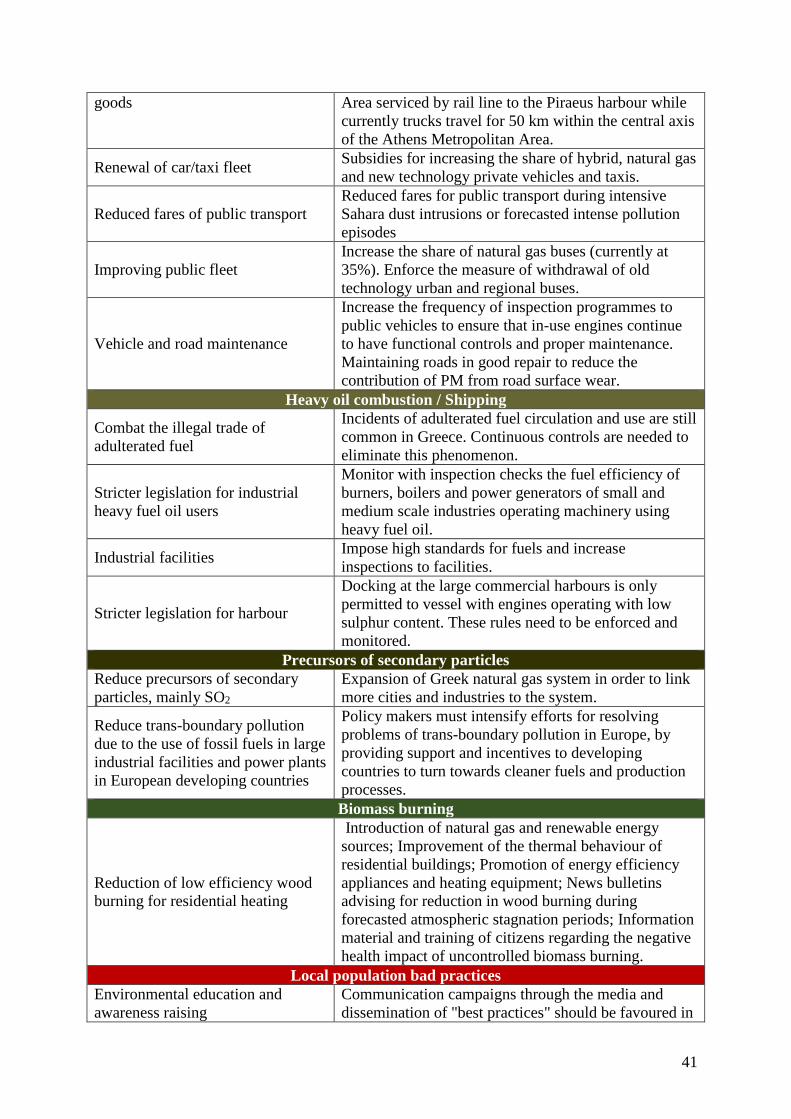
41
goods Area serviced by rail line to the Piraeus harbour while
currently trucks travel for 50 km within the central axis
of the Athens Metropolitan Area.
Renewal of car/taxi fleet Subsidies for increasing the share of hybrid, natural gas
and new technology private vehicles and taxis.
Reduced fares of public transport
Reduced fares for public transport during intensive
Sahara dust intrusions or forecasted intense pollution
episodes
Improving public fleet
Increase the share of natural gas buses (currently at
35%). Enforce the measure of withdrawal of old
technology urban and regional buses.
Vehicle and road maintenance
Increase the frequency of inspection programmes to
public vehicles to ensure that in-use engines continue
to have functional controls and proper maintenance.
Maintaining roads in good repair to reduce the
contribution of PM from road surface wear.
Heavy oil combustion / Shipping
Combat the illegal trade of
adulterated fuel
Incidents of adulterated fuel circulation and use are still
common in Greece. Continuous controls are needed to
eliminate this phenomenon.
Stricter legislation for industrial
heavy fuel oil users
Monitor with inspection checks the fuel efficiency of
burners, boilers and power generators of small and
medium scale industries operating machinery using
heavy fuel oil.
Industrial facilities Impose high standards for fuels and increase
inspections to facilities.
Stricter legislation for harbour
Docking at the large commercial harbours is only
permitted to vessel with engines operating with low
sulphur content. These rules need to be enforced and
monitored.
Precursors of secondary particles
Reduce precursors of secondary
particles, mainly SO2
Expansion of Greek natural gas system in order to link
more cities and industries to the system.
Reduce trans-boundary pollution
due to the use of fossil fuels in large
industrial facilities and power plants
in European developing countries
Policy makers must intensify efforts for resolving
problems of trans-boundary pollution in Europe, by
providing support and incentives to developing
countries to turn towards cleaner fuels and production
processes.
Biomass burning
Reduction of low efficiency wood
burning for residential heating
Introduction of natural gas and renewable energy
sources; Improvement of the thermal behaviour of
residential buildings; Promotion of energy efficiency
appliances and heating equipment; News bulletins
advising for reduction in wood burning during
forecasted atmospheric stagnation periods; Information
material and training of citizens regarding the negative
health impact of uncontrolled biomass burning.
Local population bad practices
Environmental education and
awareness raising
Communication campaigns through the media and
dissemination of "best practices" should be favoured in

42
order to sensitize population on the opportunity of the
previous measures.
Deliverables & Milestones
Milestone M16 was achieved according to the foreseen time schedule (Table 13). The
Operational Platform of ACEPT-AIR Tool was completed by the end of February 2013 and
the initial application of the Policy Tool was completed a year later (February 2014).
Nevertheless Deliverables D19 and D20 were finalized with a delay of 5 months in order to
take into account the comments of the external evaluators as expressed in the Plenary Meeting
held in Athens on 17 and 18/3/2014. This delay did not affect the successful implementation
of the project. The development of a simplified algorithm that relates PM emissions and
concentrations in the air is a challenging work, given the complexity of the processes involved
(such as primary and secondary aerosol formation etc.). In this context, the feedback and
suggestions of external evaluators who are considered experts in the field was essential
towards the development of a reliable Policy Tool. Deliverable D19 and D20 are attached to
the present Report.
Table 13. List of Deliverables and Milestones for Action 7. Foreseen and actual dates of
completion are also shown.
Completion of Deliverables Foreseen date Actual date
D19. PM concentration reductions in relation to the
implementation of specific measures / scenarios,
apportioned to changes in different source categories
31/03/2014 31/08/2014
D20. Proposed measures for the attainment of required
PM concentration reductions
31/03/2014 31/08/2014
Achievement of Milestones Foreseen date Actual date
M16. Initial application of the “ACEPT-AIR” Policy
Tool, to estimate relationships between PM
concentration reductions and the implementation of
specific measures
02/2014 02/2014
Continuation after the end of project: The continuous application of ACEPT-AIR Policy
Tool is a major objective of the project. Among target users are the relevant authorities and
policy makers as well as other interested parties, such as private companies who need to
assess the effectiveness of new technologies for emission control. The large publicity
achieved through a well planned dissemination scheme is expected to help towards the
adoption of the Policy Tool by different stakeholder groups. In addition, the continuous
support of ACEPT-AIR partners to the Tool end users (in terms of specific functionalities of
the Tool as well as updating of input databases) and the existing collaborations with the
national, regional and local authorities will further promote the use of the Policy Tool in the
future.

43
5.1.7. Action 10. Monitoring of Project progress
Action 10 started on March 2011 and was completed at the end of the project on August 2014
according to schedule (Table 2). In the framework of this Action the general progress of the
project implementation was monitored though a committee of external evaluators. The
Action was coordinated by NCSR “D” (Action leader) and all project partners were actively
involved. The external evaluators committee comprised of three experts in the field: Prof.
Roy Harrison (University of Birmingham, UK), Dr. Xavier Querol (CSIC, Spain) and Prof.
Archontoula Chaloulakou (NTUA, Greece).
Amendment of Action 10
During the preparation of the Inception report, the project’s Management Board and Steering
Committees reviewed the monitoring scheme described in the initial proposal and concluded
that both the methods employed and expected results were not clear and feasible in certain
cases. For this reason, an amendment of Action 10 was proposed and included in the
Inception Report (Annex X) submitted on 4/4/2011. The amendment was accepted by the
E.C. on 27/7/2011.
According to the amended monitoring scheme, the external consultants were sent all Reports
submitted to the E.C. in order to follow the project progress. In addition, they participated in
two plenary meetings, at the beginning (end of the 1st year) and towards the end of the
project. Based on the reports and personal communication with the Project Manager and the
Steering Committee, the three experts evaluated the project progress in relation to the initial
situation, objectives and expected results.
Dr. X. Querol and Prof. R. Harrison participated in the 3rd plenary meeting on 4/11/2011 in
Athens and had the opportunity to meet and discuss with all partners (Figure 19). Prof.
Chaloulakou visited NCSR “D” on a later date (13/1/2012) and discussed in detail with the
Project Manager and Scientific Secretary. Following the meetings, the three external
evaluators have prepared and submitted to the Project Manager their 1st evaluation report,
summarizing their comments and suggestions. The reports were forwarded to all beneficiaries
for further study. There was a general consensus regarding the satisfactory progress achieved.
A number of interesting points were put forward by the evaluators relating to the analysis of
chemical speciation data, the contribution of secondary aerosol and in particular organic
carbon, the application of receptor modeling and the contribution of African dust and forest
fires to PM levels.
Dr. X. Querol and Prof. R. Harrison also participated in the 7th plenary meeting on 17-
18/3/2014 in Athens (Figure 19). Following the meeting, the two external evaluators prepared
and submitted to the Project Manager their 2nd evaluation report. Both evaluators expressed
their approval of the methodological approaches used in ACEPT-AIR Polity Tool. They also
commented on the results of the source apportionment (SA) analysis which constitute a major
part of the Tool’s input data and affect greatly its output. They both agreed that some
refinement was needed on the SA results especially since two different receptor models (PMF
and CMB) were used. Based on these comments, NCSR “D” and AUTH repeated the source
apportionment analysis, which lead to two significant improvements in the Tool calculation
code: (i) the contribution of secondary organic aerosol was considered in the calculation code
of the Tool and (ii) source profiles for secondary inorganic and organic aerosol were used in
CMB modeling, providing contribution estimates for these sources as well in agreement with
PMF modeling.

44
Figure 19. Photos from the visit of external evaluators during the 3rd and 7th Plenary
Meetings, in Athens on 4/11/2011 (left) and 17-18/3/2014 (right), respectively.
Deliverables & Milestones
All Milestones and Deliverables of Action 10 were achieved prior to the foreseen time
schedule (Table 14). Prof. Chaloulakou withdrew from the external evaluators committee
during the 2nd year of the project implementation due to personal circumstances. The
implementation of Action 10 continued with no major problems with the remaining two
evaluators. Deliverables D28 refers to the two Evaluation reports. The first one has been
submitted along with the Mid-term Report and the second one is attached to the present
Report.
Table 14. List of Deliverables and Milestones for Action 8. Foreseen and actual dates of
completion are also shown.
Completion of Deliverables Foreseen date Actual date
D28. Documented efficiency quantified in the two
evaluation reports 30/11/2014 30/04/2014
Achievement of Milestones Foreseen date Actual date
M26. Publication of two evaluation reports (attached in
Mid-term and Final project report respectively)
10/1012
11/2014
06/2012
04/2014
Continuation after the end of project: The participation of Dr. Querol and Prof. Harrison in
the ACEPT-AIR evaluation committee has enhanced the collaboration between the project
partners and the University of Birmingham and CSIC research groups. ACEPT-AIR project
partners have and continue to benefit from this interaction and exchange of expertise.

45
10
20
30
40
50
60
70
2001 2003 2005 2007 2009 2011 2013
PM
10
(µ
g/m
3)
Annual mean PM10 AMA
Mean ALL MEAN SUB-URBAN BKG
MEAN URBAN TRAFFIC Annual limit value
10
30
50
70
90
110
2001 2003 2005 2007 2009 2011 2013
PM
10
(µ
g/m
3)
90.4 percentile PM10 AMAcorresponding to exceedances
Mean ALL MEAN SUB-URBAN BKG
MEAN URBAN TRAFFIC Daily limit value
5.1.8. Action 11. Action plan formulation for PM reduction
Action 11 started on February 2013 and was completed at the end of the project on August
2014 with a 6 month delay (Table 2). In the framework of this Action a comprehensive
characterization of air quality in relation to particulate matter at the three studied areas was
performed. In addition, the application of ACEPT-AIR Policy Tool along with the outcome of
source apportionment analysis was used in order to develop a specific set of measures and
policies for each area, in line with the concentration reductions required by Directive
2008/50/EC. The Action was coordinated by NCSR “D” (Action leader) and all project
partners were actively involved.
Characterization of air quality in relation to particulate matter
The PM10 and PM2.5 concentrations in Athens Metropolitan Area (AMA), Thessaloniki
Metropolitan Area (TMA) and the city of Volos have been studied in detail with respect to
concentration levels, chemical composition and quantitative source apportionment analysis by
receptor modelling. The threshold limits of both PM2.5 and PM10 were not exceeded in the
suburban areas of the Athens, Thessaloniki and Volos but this is not a result that should lead
to complacency towards effective mitigation measures for the reduction of air pollution in this
large urban area. The concentrations were much higher in the traffic impacted central areas
with fewer but yet emerging exceedances (Figure 20). The levels of PM2.5 in AMA stations
were below the target value of 25 μg m-3 at urban background sites and close to the target
value at urban traffic stations. In spite of the decreasing trend of PM concentrations more
efforts has to be made, in order to attain the WHO guidelines, and to prevent future
exceedances under the economic recovery and less favourable meteorological scenarios.
The need for mitigation measures becomes evident if one considers that due to the
economic crisis affecting Greece, gaseous precursors such as NOx and primary PM10
emissions have been reduced by more than 50%, while for others like SO2 the reduction is
more than 90%. Although the latter appears to be a technology and regulation based reduction
and may be permanent this is not the case for other pollutants. Their concentrations may rise
again when the economy recovers.
Figure 20. PM10 concentration long-term trend analysis for the AMA stations of the National
Monitoring Network (ALL) and separately for urban traffic and sub-urban background (SUB-
URBAN BKG) stations: Mean annual values (left) and 90.4 percentile values (right) which
corresponds to the concentration of the top 35 days per year.

46
One interesting observation here lies with the secondary aerosol component representing
sulphate nitrate and secondary organic species, which appears to constitute a major
component of the PM mass not directly linked to a primary emission source but is the result of
atmospheric chemistry by conversion of gaseous components to particulate matter at variable
timescales and dependent on atmospheric conditions. More specifically the sulphate
component, which is rather stable once formed as ammonium sulphate and has a large life
time in the atmosphere, it is observed at considerably higher concentrations than existing
measurements in Western and South Western Europe. Despite the reductions in emissions and
some peaks in Volos and Thessaloniki possibly attributed to local sources, a background level
for this component appears unaffected on an annual basis by local urban sources and can be
attributed to long range transport. Mitigation measures at a Regional and International level is
therefore suggested for this component.
The major stakeholder at the ACEPT-AIR project, the Ministry of Energy, Environment and
Climate Change, also has the competence and responsibility of air quality management and
monitoring. The historical data of exceedances of PM10 (and NO2) limit values during the last
decade shows in general a downward trend and is directly or indirectly linked to the
development of measures targeting mainly the reduction of traffic emissions, reduction in
fossil fuel use due to energy efficiency improvements or interventions in favour of alternative
fuels and renewable energy sources in the urban area. Nevertheless exceedances still persist
in central and other traffic impacted areas. Given the fact that traffic emissions do not change
significantly during the year with the exception of the August holiday period, it is interesting
to observe that more than half of the exceedances at central and traffic stations (after
removing the African dust influence) occurred during the cold days of the winter period when
intensive wood burning had (after 2010) become a major practice for residential heating in
large areas of Greek cities due to the economic crisis. During 2011-2012 the current dataset
shows the annual average relative contribution of wood burning for residential heating is
between 17 to 35 % of PM10 and 20 to 32% of PM2.5 at the different urban areas considerably
increased in comparison to 7% in PM10 and 11% in PM2.5 during 2002. Traffic emissions
from vehicle exhaust and non exhaust origins remains a constant source of PM10 and PM2.5
with equal share in the coarse and fine fraction at a level of 5-18% at urban background sites
to 44% at the Thessaloniki traffic site. Significant role also play distant or surrounding
industrial emissions for energy or materials (cement, petrochemicals) production in terms of
secondary organic, nitrate and sulphate aerosol leading to an average of 30 % of the PM10
mass concentration. Heavy oil combustion is another source of minor contribution averaged
over the whole of the year (generally bellow 10% for PM2.5).
Apart from anthropogenic sources, not insignificant contributions were also calculated for
Natural sources, especially for the PM10 size fraction, highlighting the presence of high
natural background levels in Greece. Sea salt accounted for 8%, 4% and 7% at urban
background sites in Athens, Thessaloniki and Volos. The respective relative contributions for
Mineral dust were 16%, 7% and 18%. A significant natural source affecting mainly Southern
Greece is the long range transport of African dust. The contribution of African dust in
PM10 concentrations was estimated for all three cities, based on the methodology proposed by
Escudero et al. (2007) and adopted by EC (2011). The average contribution of African dust to
PM10 concentrations during the ACEPT-AIR campaigns was estimated equal to 1.85 μg m-3
in Athens, 0.57 μg m-3 in Thessaloniki and 0.37 μg m-3 in Volos. The respective relative
contributions were equal to 6.6%, 1.6% and 0.8%.
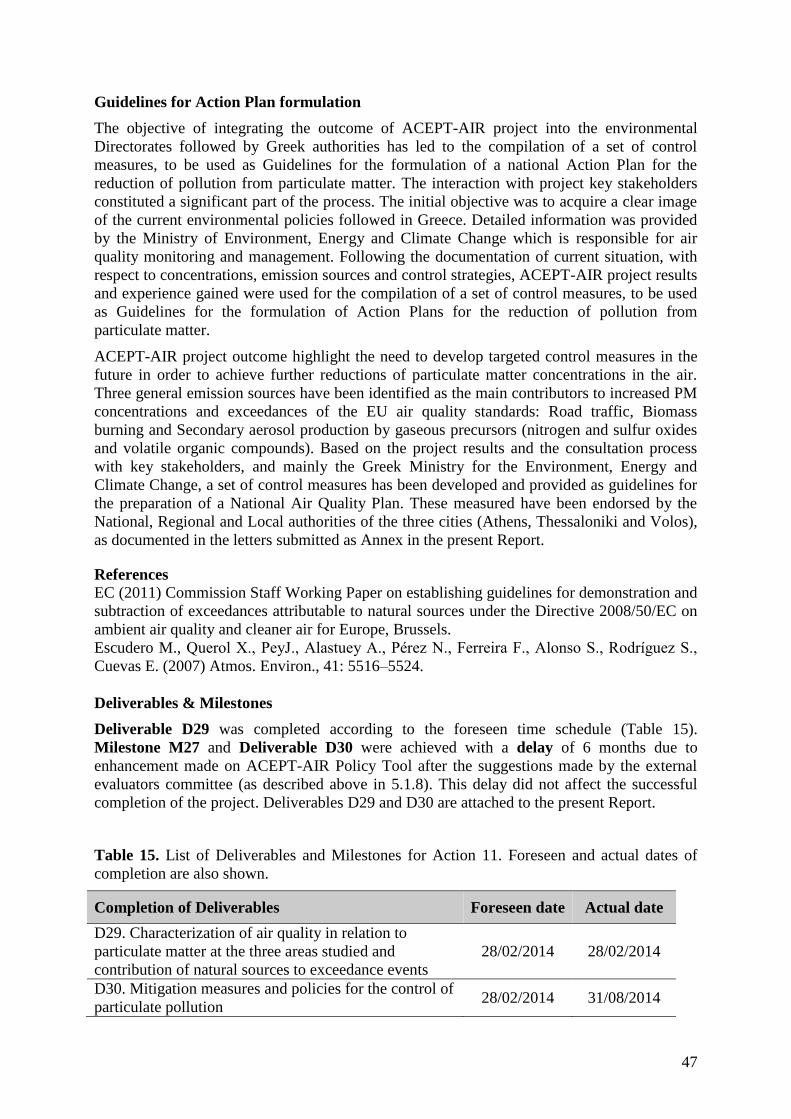
47
Guidelines for Action Plan formulation
The objective of integrating the outcome of ACEPT-AIR project into the environmental
Directorates followed by Greek authorities has led to the compilation of a set of control
measures, to be used as Guidelines for the formulation of a national Action Plan for the
reduction of pollution from particulate matter. The interaction with project key stakeholders
constituted a significant part of the process. The initial objective was to acquire a clear image
of the current environmental policies followed in Greece. Detailed information was provided
by the Ministry of Environment, Energy and Climate Change which is responsible for air
quality monitoring and management. Following the documentation of current situation, with
respect to concentrations, emission sources and control strategies, ACEPT-AIR project results
and experience gained were used for the compilation of a set of control measures, to be used
as Guidelines for the formulation of Action Plans for the reduction of pollution from
particulate matter.
ACEPT-AIR project outcome highlight the need to develop targeted control measures in the
future in order to achieve further reductions of particulate matter concentrations in the air.
Three general emission sources have been identified as the main contributors to increased PM
concentrations and exceedances of the EU air quality standards: Road traffic, Biomass
burning and Secondary aerosol production by gaseous precursors (nitrogen and sulfur oxides
and volatile organic compounds). Based on the project results and the consultation process
with key stakeholders, and mainly the Greek Ministry for the Environment, Energy and
Climate Change, a set of control measures has been developed and provided as guidelines for
the preparation of a National Air Quality Plan. These measured have been endorsed by the
National, Regional and Local authorities of the three cities (Athens, Thessaloniki and Volos),
as documented in the letters submitted as Annex in the present Report.
References
EC (2011) Commission Staff Working Paper on establishing guidelines for demonstration and
subtraction of exceedances attributable to natural sources under the Directive 2008/50/EC on
ambient air quality and cleaner air for Europe, Brussels.
Escudero M., Querol X., PeyJ., Alastuey A., Pérez N., Ferreira F., Alonso S., Rodríguez S.,
Cuevas E. (2007) Atmos. Environ., 41: 5516–5524.
Deliverables & Milestones
Deliverable D29 was completed according to the foreseen time schedule (Table 15).
Milestone M27 and Deliverable D30 were achieved with a delay of 6 months due to
enhancement made on ACEPT-AIR Policy Tool after the suggestions made by the external
evaluators committee (as described above in 5.1.8). This delay did not affect the successful
completion of the project. Deliverables D29 and D30 are attached to the present Report.
Table 15. List of Deliverables and Milestones for Action 11. Foreseen and actual dates of
completion are also shown.
Completion of Deliverables Foreseen date Actual date
D29. Characterization of air quality in relation to
particulate matter at the three areas studied and
contribution of natural sources to exceedance events
28/02/2014 28/02/2014
D30. Mitigation measures and policies for the control of
particulate pollution 28/02/2014 31/08/2014
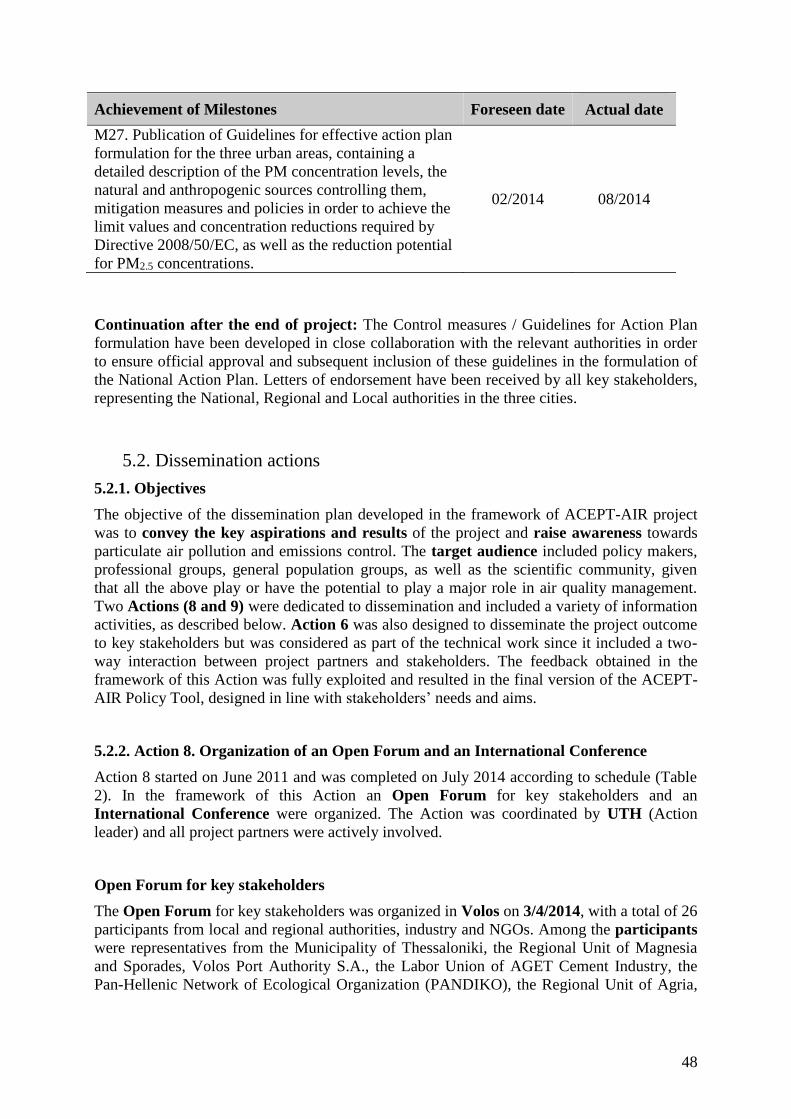
48
Achievement of Milestones Foreseen date Actual date
M27. Publication of Guidelines for effective action plan
formulation for the three urban areas, containing a
detailed description of the PM concentration levels, the
natural and anthropogenic sources controlling them,
mitigation measures and policies in order to achieve the
limit values and concentration reductions required by
Directive 2008/50/EC, as well as the reduction potential
for PM2.5 concentrations.
02/2014 08/2014
Continuation after the end of project: The Control measures / Guidelines for Action Plan
formulation have been developed in close collaboration with the relevant authorities in order
to ensure official approval and subsequent inclusion of these guidelines in the formulation of
the National Action Plan. Letters of endorsement have been received by all key stakeholders,
representing the National, Regional and Local authorities in the three cities.
5.2. Dissemination actions
5.2.1. Objectives
The objective of the dissemination plan developed in the framework of ACEPT-AIR project
was to convey the key aspirations and results of the project and raise awareness towards
particulate air pollution and emissions control. The target audience included policy makers,
professional groups, general population groups, as well as the scientific community, given
that all the above play or have the potential to play a major role in air quality management.
Two Actions (8 and 9) were dedicated to dissemination and included a variety of information
activities, as described below. Action 6 was also designed to disseminate the project outcome
to key stakeholders but was considered as part of the technical work since it included a two-
way interaction between project partners and stakeholders. The feedback obtained in the
framework of this Action was fully exploited and resulted in the final version of the ACEPT-
AIR Policy Tool, designed in line with stakeholders’ needs and aims.
5.2.2. Action 8. Organization of an Open Forum and an International Conference
Action 8 started on June 2011 and was completed on July 2014 according to schedule (Table
2). In the framework of this Action an Open Forum for key stakeholders and an
International Conference were organized. The Action was coordinated by UTH (Action
leader) and all project partners were actively involved.
Open Forum for key stakeholders
The Open Forum for key stakeholders was organized in Volos on 3/4/2014, with a total of 26
participants from local and regional authorities, industry and NGOs. Among the participants
were representatives from the Municipality of Thessaloniki, the Regional Unit of Magnesia
and Sporades, Volos Port Authority S.A., the Labor Union of AGET Cement Industry, the
Pan-Hellenic Network of Ecological Organization (PANDIKO), the Regional Unit of Agria,
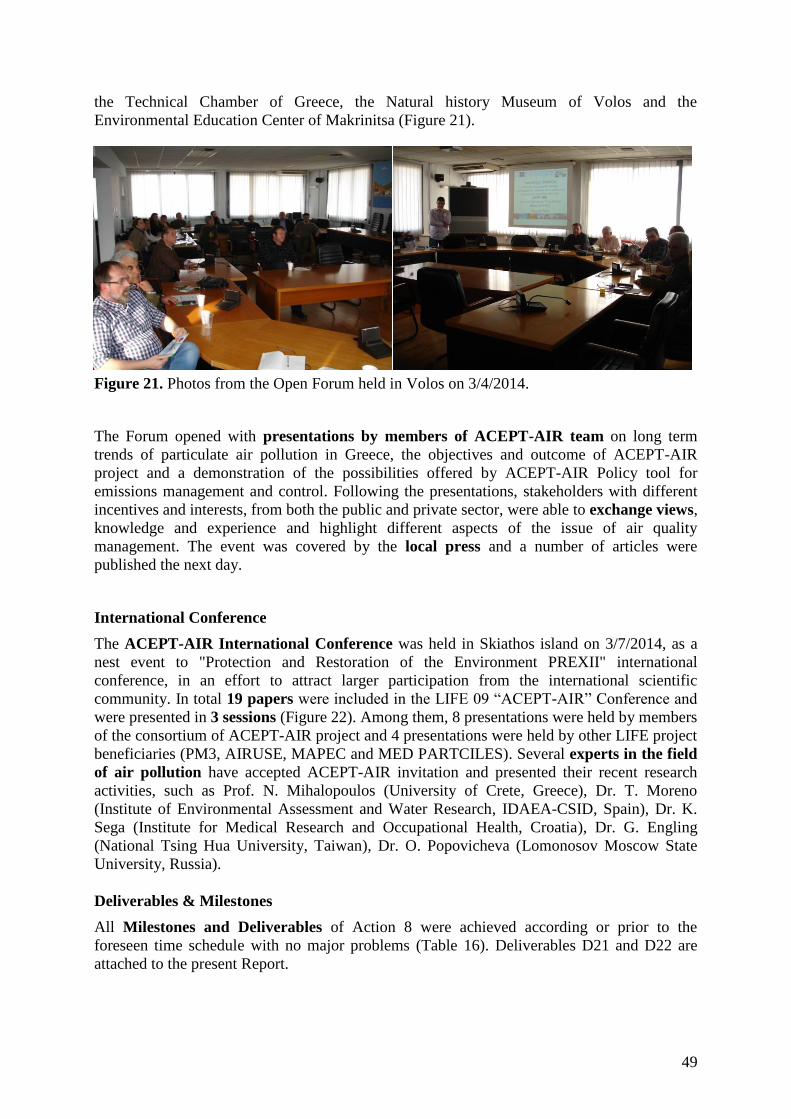
49
the Technical Chamber of Greece, the Natural history Museum of Volos and the
Environmental Education Center of Makrinitsa (Figure 21).
Figure 21. Photos from the Open Forum held in Volos on 3/4/2014.
The Forum opened with presentations by members of ACEPT-AIR team on long term
trends of particulate air pollution in Greece, the objectives and outcome of ACEPT-AIR
project and a demonstration of the possibilities offered by ACEPT-AIR Policy tool for
emissions management and control. Following the presentations, stakeholders with different
incentives and interests, from both the public and private sector, were able to exchange views,
knowledge and experience and highlight different aspects of the issue of air quality
management. The event was covered by the local press and a number of articles were
published the next day.
International Conference
The ACEPT-AIR International Conference was held in Skiathos island on 3/7/2014, as a
nest event to "Protection and Restoration of the Environment PREXII" international
conference, in an effort to attract larger participation from the international scientific
community. In total 19 papers were included in the LIFE 09 “ACEPT-AIR” Conference and
were presented in 3 sessions (Figure 22). Among them, 8 presentations were held by members
of the consortium of ACEPT-AIR project and 4 presentations were held by other LIFE project
beneficiaries (PM3, AIRUSE, MAPEC and MED PARTCILES). Several experts in the field
of air pollution have accepted ACEPT-AIR invitation and presented their recent research
activities, such as Prof. N. Mihalopoulos (University of Crete, Greece), Dr. T. Moreno
(Institute of Environmental Assessment and Water Research, IDAEA-CSID, Spain), Dr. K.
Sega (Institute for Medical Research and Occupational Health, Croatia), Dr. G. Engling
(National Tsing Hua University, Taiwan), Dr. O. Popovicheva (Lomonosov Moscow State
University, Russia).
Deliverables & Milestones
All Milestones and Deliverables of Action 8 were achieved according or prior to the
foreseen time schedule with no major problems (Table 16). Deliverables D21 and D22 are
attached to the present Report.
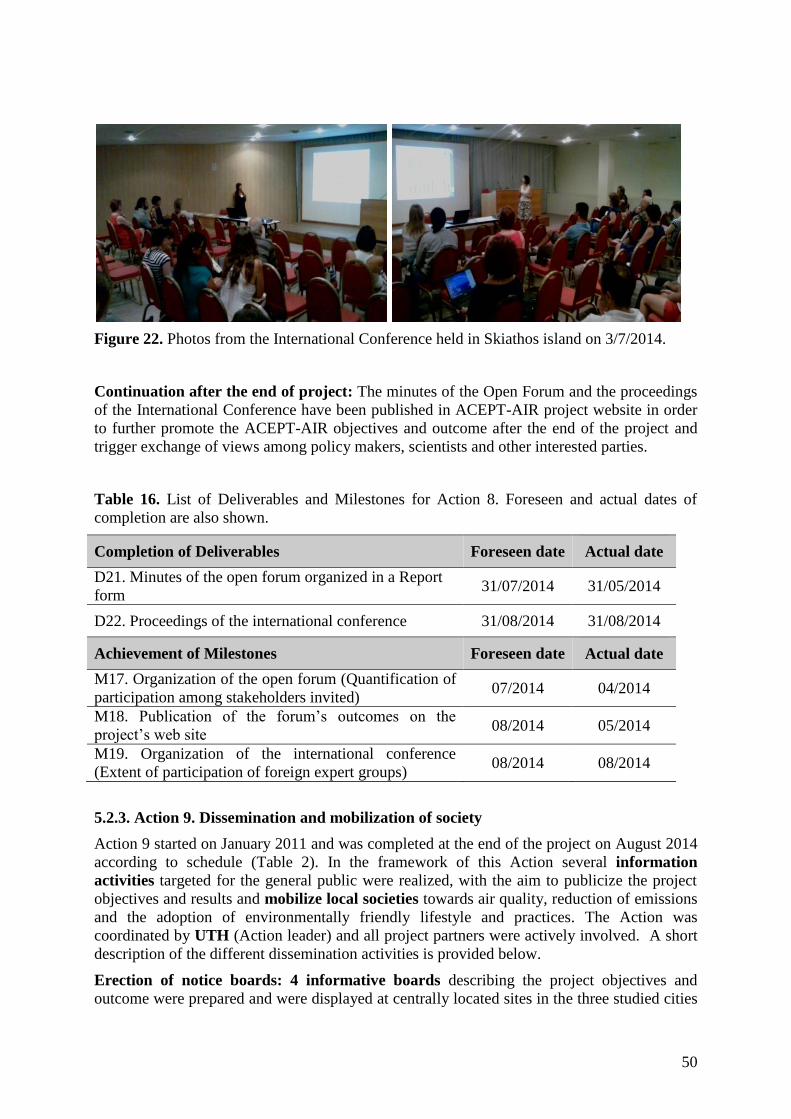
50
Figure 22. Photos from the International Conference held in Skiathos island on 3/7/2014.
Continuation after the end of project: The minutes of the Open Forum and the proceedings
of the International Conference have been published in ACEPT-AIR project website in order
to further promote the ACEPT-AIR objectives and outcome after the end of the project and
trigger exchange of views among policy makers, scientists and other interested parties.
Table 16. List of Deliverables and Milestones for Action 8. Foreseen and actual dates of
completion are also shown.
Completion of Deliverables Foreseen date Actual date
D21. Minutes of the open forum organized in a Report
form 31/07/2014 31/05/2014
D22. Proceedings of the international conference 31/08/2014 31/08/2014
Achievement of Milestones Foreseen date Actual date
M17. Organization of the open forum (Quantification of
participation among stakeholders invited) 07/2014 04/2014
M18. Publication of the forum’s outcomes on the
project’s web site 08/2014 05/2014
M19. Organization of the international conference
(Extent of participation of foreign expert groups) 08/2014 08/2014
5.2.3. Action 9. Dissemination and mobilization of society
Action 9 started on January 2011 and was completed at the end of the project on August 2014
according to schedule (Table 2). In the framework of this Action several information
activities targeted for the general public were realized, with the aim to publicize the project
objectives and results and mobilize local societies towards air quality, reduction of emissions
and the adoption of environmentally friendly lifestyle and practices. The Action was
coordinated by UTH (Action leader) and all project partners were actively involved. A short
description of the different dissemination activities is provided below.
Erection of notice boards: 4 informative boards describing the project objectives and
outcome were prepared and were displayed at centrally located sites in the three studied cities
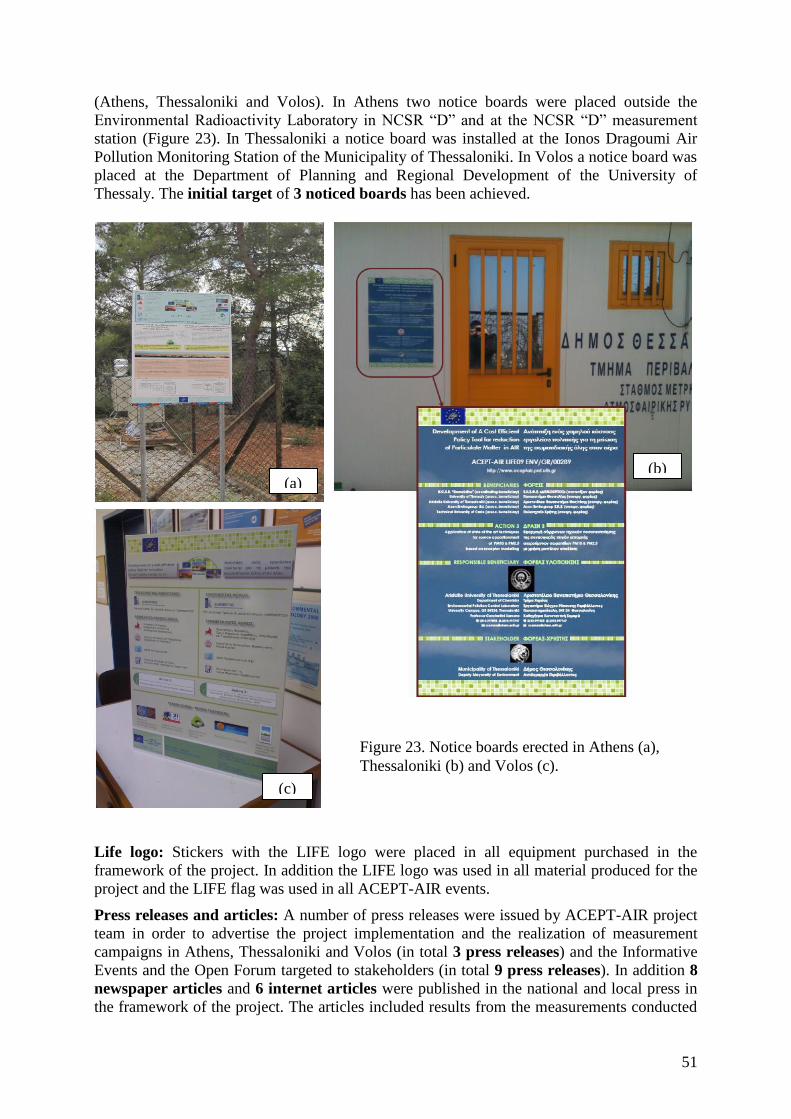
51
(c)
(b) (a)
(Athens, Thessaloniki and Volos). In Athens two notice boards were placed outside the
Environmental Radioactivity Laboratory in NCSR “D” and at the NCSR “D” measurement
station (Figure 23). In Thessaloniki a notice board was installed at the Ionos Dragoumi Air
Pollution Monitoring Station of the Municipality of Thessaloniki. In Volos a notice board was
placed at the Department of Planning and Regional Development of the University of
Thessaly. The initial target of 3 noticed boards has been achieved.
Life logo: Stickers with the LIFE logo were placed in all equipment purchased in the
framework of the project. In addition the LIFE logo was used in all material produced for the
project and the LIFE flag was used in all ACEPT-AIR events.
Press releases and articles: A number of press releases were issued by ACEPT-AIR project
team in order to advertise the project implementation and the realization of measurement
campaigns in Athens, Thessaloniki and Volos (in total 3 press releases) and the Informative
Events and the Open Forum targeted to stakeholders (in total 9 press releases). In addition 8
newspaper articles and 6 internet articles were published in the national and local press in
the framework of the project. The articles included results from the measurements conducted
Figure 23. Notice boards erected in Athens (a),
Thessaloniki (b) and Volos (c).
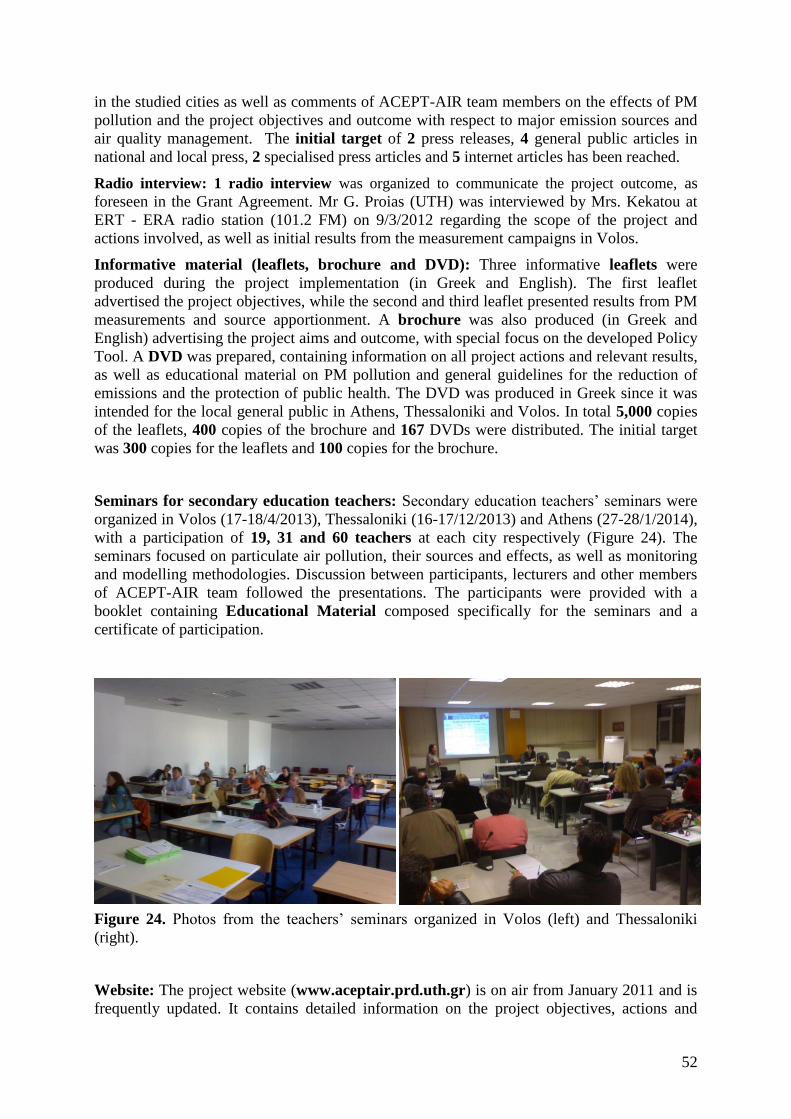
52
in the studied cities as well as comments of ACEPT-AIR team members on the effects of PM
pollution and the project objectives and outcome with respect to major emission sources and
air quality management. The initial target of 2 press releases, 4 general public articles in
national and local press, 2 specialised press articles and 5 internet articles has been reached.
Radio interview: 1 radio interview was organized to communicate the project outcome, as
foreseen in the Grant Agreement. Mr G. Proias (UTH) was interviewed by Mrs. Kekatou at
ERT - ERA radio station (101.2 FM) on 9/3/2012 regarding the scope of the project and
actions involved, as well as initial results from the measurement campaigns in Volos.
Informative material (leaflets, brochure and DVD): Three informative leaflets were
produced during the project implementation (in Greek and English). The first leaflet
advertised the project objectives, while the second and third leaflet presented results from PM
measurements and source apportionment. A brochure was also produced (in Greek and
English) advertising the project aims and outcome, with special focus on the developed Policy
Tool. A DVD was prepared, containing information on all project actions and relevant results,
as well as educational material on PM pollution and general guidelines for the reduction of
emissions and the protection of public health. The DVD was produced in Greek since it was
intended for the local general public in Athens, Thessaloniki and Volos. In total 5,000 copies
of the leaflets, 400 copies of the brochure and 167 DVDs were distributed. The initial target
was 300 copies for the leaflets and 100 copies for the brochure.
Seminars for secondary education teachers: Secondary education teachers’ seminars were
organized in Volos (17-18/4/2013), Thessaloniki (16-17/12/2013) and Athens (27-28/1/2014),
with a participation of 19, 31 and 60 teachers at each city respectively (Figure 24). The
seminars focused on particulate air pollution, their sources and effects, as well as monitoring
and modelling methodologies. Discussion between participants, lecturers and other members
of ACEPT-AIR team followed the presentations. The participants were provided with a
booklet containing Educational Material composed specifically for the seminars and a
certificate of participation.
Figure 24. Photos from the teachers’ seminars organized in Volos (left) and Thessaloniki
(right).
Website: The project website (www.aceptair.prd.uth.gr) is on air from January 2011 and is
frequently updated. It contains detailed information on the project objectives, actions and

53
results. All information is in Greek and English. The website will remain functioning for at
least 5 years after the completion of ACEPT-AIR project. Around 3,000 visitors were
recorded on a monthly basis at the last months of the project (target value 120 visitors per
month). A public profile of ACEPT-AIR project was also created at social networking media
(Facebook) with the view to enhance interaction with the general public.
Layman’s report: A Layman’s report has been published (both in Greek and English)
providing an overall description of the project objectives and actions as well as its major
results and achievements. The report is available in electronic format from the project
website. In addition 50 copies have been distributed to the general public, as foreseen in the
Grant Agreement.
Technical publications: 5 papers were published in international scientific journals, as
foreseen in the Grant Agreement. In addition, ACEPT-AIR team members participated in 19
international and national conferences communicating the project results to the international
scientific community through oral or poster presentations.
Deliverables & Milestones
All Milestones and Deliverables of Action 9 were achieved according or prior to the
foreseen time schedule with no major problems (Table 17). The only problems encountered
relate to the organization of seminars for secondary education teachers, which was delayed
due to low participation. UTH initially contacted the Directions of Secondary Education in
all three cities. A low level of interest was observed especially in Athens and Thessaloniki,
probably related to the large number of teachers’ seminars advertised each month as well as
the teachers’ strikes during 2013. A more direct form of communication was employed at a
second stage in order to increase participation. The seminars were advertized to the relevant
Teachers’ Societies (such as Chemistry or Physics), while Directions of schools in the areas
where ACEPT-AIR measurement campaigns were performed were also contacted. The
seminars were organized with a total of 110 participants, a number considered satisfactory
with respect to the initial target of 120 participants. Very positive feedback was obtained
from the participating teachers, despite the initial low interest. Deliverables D23 - D27 are
attached to the present Report.
Table 17. List of Deliverables and Milestones for Action 9. Foreseen and actual dates of
completion are also shown.
Completion of Deliverables Foreseen date Actual date
D23. Informative and dissemination material:
Informative notice boards, in Athens,
Thessaloniki and Volos
Articles in the local and national press
Informative leaflets and DVDs
30/06/2014 30/06/2014
D24. Informative material composed for the teachers’
seminars 31/08/2012 31/08/2012
D25 .The project website 28/02/2011 31/01/2011
D26. A Layman’s report 30/06/2014 30/06/2014
D27. Technical publications in international journals
and proceedings of international conferences 31/08/2014 31/08/2014

54
Achievement of Milestones Foreseen date Actual date
M20. Creation of the project website 02/2011 01/2011
M21. Information material 08/2011 08/2011
M22. Organization of teachers’ seminars (quantification
of participation in relation to initial target) 08/2012
04/2013
12/2013
01/2014
M23. Publication of articles in local and national press
and quantification of the extent of their reach 06/2014 06/2014
M24. Preparation of the “layman’s report 06/2014 06/2014
M25. Technical papers accepted for publication in
international journals and / or presentation in
international conferences
08/2014 08/2014
Continuation after the end of project: ACEPT-AIR notice boards remain erected at the
three cities, while the project website will continue functioning for at least 5 years after the
project end. A number of technical publications are being prepared to be submitted to
international journals, further publicising the project results. In addition, ACEPT-AIR team
members will present key outcome in conferences, workshops and other networking events.
During a workshop organized by LIFE AIRUSE project on “Quantitative methods for
evaluating daily contributions of African dust to ambient PMx levels over Europe during dust
outbreaks” (Barcelona, Spain, 27-28/4/2015), ACEPT-AIR Project Manager, Dr.
Eleftheriadis, presented results from on Saharan dust contribution during the ACEPT-AIR
measurement campaigns.
Complementary actions outside LIFE: ACEPT-AIR team members have been promoting
air quality management and effective emission control strategies, which are key concepts of
ACEPT-AIR project as well, through relevant presentations:
The Project Manager Dr. K. Eleftheriadias gave a speech at the opening session of the
Conference EcoTexnologia 2011, held at NCSR “D” on 12/3/2011, related with "The
effects of PM in the environmental pollution and public health".
Prof. C. Samara (AUTH) gave a speech during the opening session of the 21st Hellenic
Conference on Chemistry (Thessaloniki, 9-12/12/2011) entitled "Airborne Particulate
Matter: Chemical composition and bioactivity".
In addition, the Project Manager was participated in the following networking and
outreaching events in order to communicate the project results:
Briefing for Policy Makers Event on “Health Effects of Air Pollution”, Brussels,
31/1/2013: The event was organized by the European Commission, the World Health
Organization Regional Office for Europe, and the Health Effects Institute (U.S.A.). The
Coordinator of ACEPT-AIR considered that this was an opportunity to communicate the
results of the project to key stakeholders and get first reactions from the outcome of the
review of the EU Air policy and the Year of Air and the package of measures considered
by the European Parliament and the Council.
3rd AirMonTech Workshop “Current and Future Urban Air Quality Monitoring”,
Duisburg, 4 - 5/3/2013: The project progress and the Introduction of the Policy Tool were
presented to an audience of Air Pollution Health Effects specialists, at the FP7 Research
Project focusing on Air Pollution Monitoring Technologies for Urban areas. The ACEPT-
AIR presentation, entitled “Policy Tool for Reduction of PM in Air”, is available at the

55
following link: http://www.airmontech.eu/fileadmin/airmontech/user/2013-
presentations/10_Eleftheriadis.pdf
5.2.4. Action 12. After-life communication & continuation plan
Action 12 started on July 2013 (Table 2). In the framework of this Action an After-Life
communication & continuation plan was developed in order to secure the exploitation of
the project outcome after its completion. The Action was coordinated by UTH (Action leader)
and was performed in collaboration with NCSR “D”.
The main aspects of the After-Life communication & continuation plan which aspires to
ensure the sustainability of the project outcome and further promote its objectives are:
A modified project website including key strategies and experience gained through
ACEPT-AIR project. The website will be operating for a minimum of 5 years. A link to
the modified ACEPT-AIR website from the Coalition of 21 Local Authorities of North
and East Athens webpage has been created, further enhancing the visibility of ACEPT-
AIR key messages.
Submission of new proposals for the continuous funding of NCSR “D” and AUTH
research groups in an effort to produce updated source apportionment results in the future.
NCSR “D” and AUTH are already collaborating in the framework of other projects and
initiatives such as FAIRMODE and have submitted together new research proposals.
NCSR “D” is participating in a new LIFE project, AIRUSE, which will provide
information on the contribution of natural sources to PM concentration levels in Athens.
Source apportionment on new datasets will be also performed. AIRUSE outcome is
expected to be very useful with respect to changes in emissions sources and relevant
strengths during the beginning of the financial crisis in Greece (ACEPT-AIR campaigns)
and the years to follow. All the available results from AIRUSE or other future projects
will be used to update the Policy Tool databases and will be made available to the relevant
national, regional and local authorities.
AXON and TUC have committed to updating the emission inventories of the Policy Tool
whenever they have new available data.
A technical support desk has been created for ACEPT-AIR Tool users. Two members of
NCSR “D” team (S. Vratolis, permanent staff of NCSR “D” and E. Diapouli) have been
assigned to run the help desk which will be maintained for a minimum of 5 years. All
stakeholders involved have been given the relevant contact information.
ACEPT-AIR Policy Tool manual has been published in the project modified website in
order to attract additional end users. A contact link to NCSR “D” is included in case there
is an interest to obtain the Policy Tool.
Demonstration of ACEPT-AIR Policy Tool and the project results by the Project
Manager or other ACEPT-AIR team members in workshops, conferences etc. Enhanced
visibility of the project objectives and outcome may attract new users as well as new
collaborations that will assist towards the continuation of work done in the framework of
ACEPT-AIR and the production of new data.
Deliverables & Milestones
Deliverables D31 and D32 were completed according to the foreseen time schedule (Table
18). Milestones for this Action refer to indicators of progress to be assessed after the end of
the project. Deliverables D31 and D32 are attached to the present Report.

56
Table 18. List of Deliverables and Milestones for Action 12. Foreseen and actual dates of
completion are also shown.
Completion of Deliverables Foreseen date Actual date
D31. Publication of After-Life Communication plan 31/08/2014 31/08/2014
D32. Adoption of a modified project website of key
strategies by key stakeholder 31/08/2014 31/08/2014
Achievement of Milestones Foreseen date Actual date
Sustainability of target audience
Stakeholders participation in the development of
respective strategies they could effectively employ in
their respective fields of operation to contribute into PM
reduction
Continual public response through the access of
information on the website
The rate of number of visitors over time being kept at
similar levels as during the projects development
Friendly environmental policy making in the
development of new industries
Introduction of key legislation for existing and new
industries to demonstrate steps or strategies they will
employ in controlling emissions
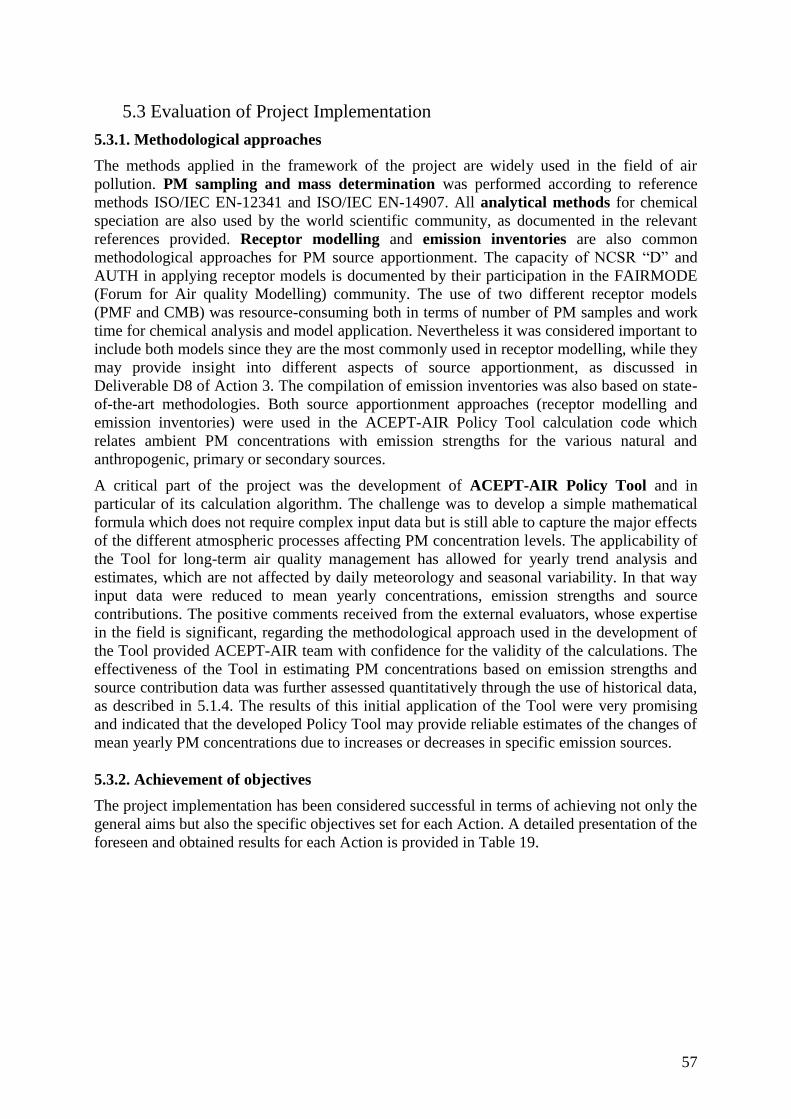
57
5.3 Evaluation of Project Implementation
5.3.1. Methodological approaches
The methods applied in the framework of the project are widely used in the field of air
pollution. PM sampling and mass determination was performed according to reference
methods ISO/IEC EN-12341 and ISO/IEC EN-14907. All analytical methods for chemical
speciation are also used by the world scientific community, as documented in the relevant
references provided. Receptor modelling and emission inventories are also common
methodological approaches for PM source apportionment. The capacity of NCSR “D” and
AUTH in applying receptor models is documented by their participation in the FAIRMODE
(Forum for Air quality Modelling) community. The use of two different receptor models
(PMF and CMB) was resource-consuming both in terms of number of PM samples and work
time for chemical analysis and model application. Nevertheless it was considered important to
include both models since they are the most commonly used in receptor modelling, while they
may provide insight into different aspects of source apportionment, as discussed in
Deliverable D8 of Action 3. The compilation of emission inventories was also based on state-
of-the-art methodologies. Both source apportionment approaches (receptor modelling and
emission inventories) were used in the ACEPT-AIR Policy Tool calculation code which
relates ambient PM concentrations with emission strengths for the various natural and
anthropogenic, primary or secondary sources.
A critical part of the project was the development of ACEPT-AIR Policy Tool and in
particular of its calculation algorithm. The challenge was to develop a simple mathematical
formula which does not require complex input data but is still able to capture the major effects
of the different atmospheric processes affecting PM concentration levels. The applicability of
the Tool for long-term air quality management has allowed for yearly trend analysis and
estimates, which are not affected by daily meteorology and seasonal variability. In that way
input data were reduced to mean yearly concentrations, emission strengths and source
contributions. The positive comments received from the external evaluators, whose expertise
in the field is significant, regarding the methodological approach used in the development of
the Tool provided ACEPT-AIR team with confidence for the validity of the calculations. The
effectiveness of the Tool in estimating PM concentrations based on emission strengths and
source contribution data was further assessed quantitatively through the use of historical data,
as described in 5.1.4. The results of this initial application of the Tool were very promising
and indicated that the developed Policy Tool may provide reliable estimates of the changes of
mean yearly PM concentrations due to increases or decreases in specific emission sources.
5.3.2. Achievement of objectives
The project implementation has been considered successful in terms of achieving not only the
general aims but also the specific objectives set for each Action. A detailed presentation of the
foreseen and obtained results for each Action is provided in Table 19.

58
Table 19. Assessment of obtained results in relation to foreseen objectives in the Gran Agreement.
Task Foreseen in the revised proposal Evaluation of achievement
Action 1: Project Management
Preparation of submission of 5 Reports to
the EC
Submission of 5 Reports
All Reports have been accepted by the EC, excluding the
present Report which is now submitted.
Action 2: Construction of PM concentration databases
ACEPT-AIR Database containing: (i)
Historical data; (ii) PM10 and PM2.5
concentrations and chemical
characterization obtained from the
measurement campaigns in 2 sites at AMA,
2 sites at TMA and 1 site in VGA
PM10 and PM2.5 concentration and
chemical composition databases
for the three urban areas
(AMA,TMA and VGA)
The developed Database contains all the information
foreseen in the initial proposal as well as historical data
which may be useful for long-term trend analysis. The
inclusion of all concentration data obtained in the framework
of the project in one Database makes the data easily
accessible to end users.
Action 3: Application of state of the art source apportionment techniques based on the developed databases and receptor modelling
Source apportionment by two receptor
models (PMF and CMB) have provided
source profiles and respective contributions
to PM10 and PM2.5 concentrations at the 5
sites where measurements were conducted.
Temporal variation has been examined with
respect to seasonal variability and long-term
changes based on historical data.
Chemical profile and respective
contribution of aerosol sources on
each region (AMA, TMA, GVA)
in the PM2.5 and PM10 fractions
Temporal variation in source
chemical composition and
strength
All the tasks foreseen have been completed. The application
of two different models allowed for comparison of results
and provided insight into the advantages and disadvantages
of each model.
Action 4: Construction of emission inventories
Emission inventories for the three urban
areas (AMA, TMA, GVA), for
anthropogenic and natural sources, for the
years 2000-2013 and future projections
Spatial and temporal disaggregation of
emissions
6 Emission inventories
corresponding to 3 urban areas
(AMA, TMA, GVA) and two
types of emissions, from
anthropogenic and natural
sources.
Spatial and temporal
disaggregation of emissions
All deliverables foreseen for this Action have been
completed. State-of-the-art methodologies have been
applied for the compilation of emission inventories and the
disaggregation of emissions.
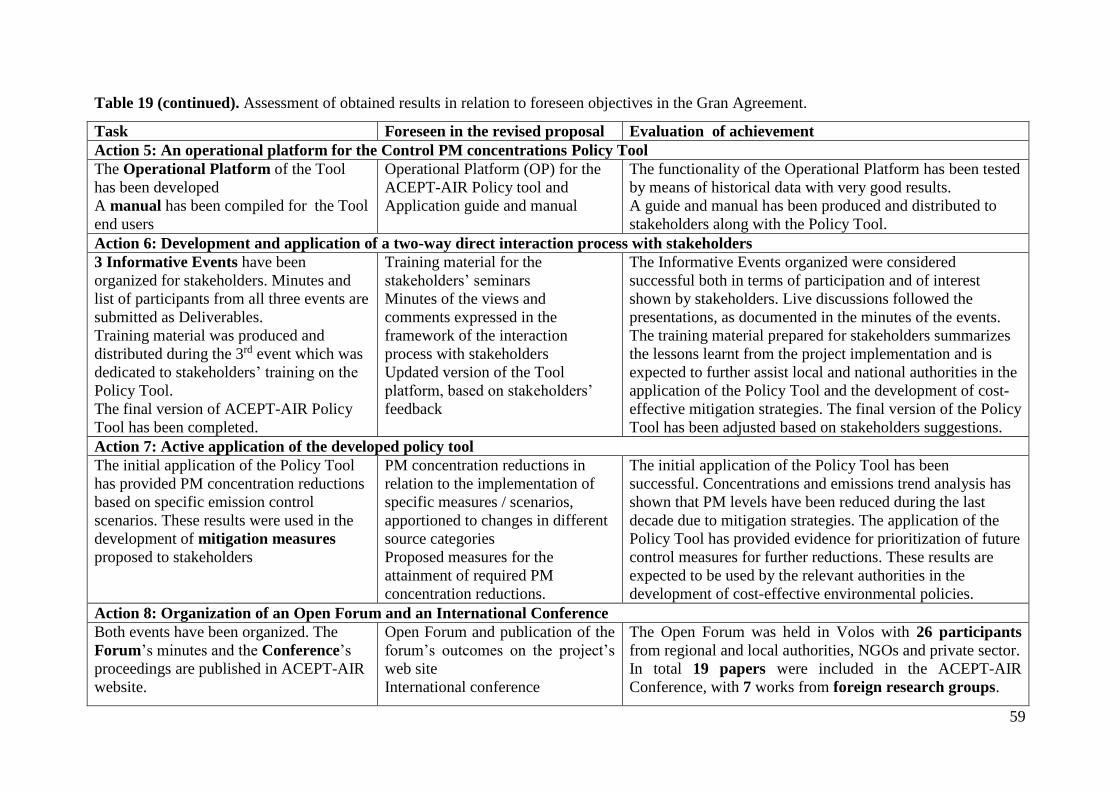
59
Table 19 (continued). Assessment of obtained results in relation to foreseen objectives in the Gran Agreement.
Task Foreseen in the revised proposal Evaluation of achievement
Action 5: An operational platform for the Control PM concentrations Policy Tool
The Operational Platform of the Tool
has been developed
A manual has been compiled for the Tool
end users
Operational Platform (OP) for the
ACEPT-AIR Policy tool and
Application guide and manual
The functionality of the Operational Platform has been tested
by means of historical data with very good results.
A guide and manual has been produced and distributed to
stakeholders along with the Policy Tool.
Action 6: Development and application of a two-way direct interaction process with stakeholders
3 Informative Events have been
organized for stakeholders. Minutes and
list of participants from all three events are
submitted as Deliverables.
Training material was produced and
distributed during the 3rd event which was
dedicated to stakeholders’ training on the
Policy Tool.
The final version of ACEPT-AIR Policy
Tool has been completed.
Training material for the
stakeholders’ seminars
Minutes of the views and
comments expressed in the
framework of the interaction
process with stakeholders
Updated version of the Tool
platform, based on stakeholders’
feedback
The Informative Events organized were considered
successful both in terms of participation and of interest
shown by stakeholders. Live discussions followed the
presentations, as documented in the minutes of the events.
The training material prepared for stakeholders summarizes
the lessons learnt from the project implementation and is
expected to further assist local and national authorities in the
application of the Policy Tool and the development of cost-
effective mitigation strategies. The final version of the Policy
Tool has been adjusted based on stakeholders suggestions.
Action 7: Active application of the developed policy tool
The initial application of the Policy Tool
has provided PM concentration reductions
based on specific emission control
scenarios. These results were used in the
development of mitigation measures
proposed to stakeholders
PM concentration reductions in
relation to the implementation of
specific measures / scenarios,
apportioned to changes in different
source categories
Proposed measures for the
attainment of required PM
concentration reductions.
The initial application of the Policy Tool has been
successful. Concentrations and emissions trend analysis has
shown that PM levels have been reduced during the last
decade due to mitigation strategies. The application of the
Policy Tool has provided evidence for prioritization of future
control measures for further reductions. These results are
expected to be used by the relevant authorities in the
development of cost-effective environmental policies.
Action 8: Organization of an Open Forum and an International Conference
Both events have been organized. The
Forum’s minutes and the Conference’s
proceedings are published in ACEPT-AIR
website.
Open Forum and publication of the
forum’s outcomes on the project’s
web site
International conference
The Open Forum was held in Volos with 26 participants
from regional and local authorities, NGOs and private sector.
In total 19 papers were included in the ACEPT-AIR
Conference, with 7 works from foreign research groups.

60
Table 19 (continued). Assessment of obtained results in relation to foreseen objectives in the Gran Agreement.
Task Foreseen in the revised proposal Evaluation of achievement
Action 9: Dissemination and mobilization of society
All dissemination activities foreseen
have been realized, as described in detail
in section 5.2.3.
Informative notice boards; Press
articles; Informative leaflets and
DVDs; Informative material for
teachers’ seminars; The project
website; A Layman’s report;
Technical publications to scientific
journals and conferences
The target numbers for dissemination have been either
achieved or surpassed (e.g. copies of leaflets and other
informative material, press articles, notice boards etc.). It was
difficult to find contacts in the school Directions and advertise
the seminars Participation in the teachers’ seminars was
slightly lower than expected since. Nevertheless there was
increased interest by the participants during the seminars.
Action 10: Monitoring of project progress
Two evaluation reports have been
submitted by the external evaluators.
Documented efficiency quantified
in the two evaluation reports
The amended description of this Action, submitted in the
Inception Report, has allowed for a clear monitoring plan for
the project progress. The external evaluators’ comments and
suggestions have been documented and were very useful for
the implementation of the project.
Action 11: Action plan formulation for PM reduction
The data collected during the project
provided a comprehensive
characterization of PM pollution and
respective sources in the 3 cities. These
data along with the initial application of
the Policy Tool resulted in a set of
mitigation measures to be used in action
plan formulation.
Characterization of air quality in
relation to PM at the three areas
studies and contribution of natural
sources to exceedance events
Mitigation measures and policies
for the control of PM
The outcome of Action 11 represents the general experience
gained through ACEPT-AIR project communicated to
stakeholders. The endorsement by national, regional and local
authorities of the project outcome (documented by their letters
after the end of the project) provides evidence that the Action
plan guidelines developed by ACEPT-AIR will be used in
future air quality management schemes and environmental
strategies.
Action 12: After-life communication & continuation plan
An after-Life plan has been developed.
The project website has been modified to
include all key results and has been
linked to the website of the 21 OTA.
Publication of After-Life
Communication plan
Adoption of a modified project
website by key stakeholder
The outcome of this Action will only be visible in the future.
The developed after-Life plan and the modified website which
will be functioning for at least 5 years after the end of the
project are expected to ensure sustainability of target audience
and continuous exploitation of the project outcome.

61
5.4 Analysis of long-term benefits
Environmental benefits: The project can improve the effectiveness of National, Regional
and Local policies on ambient air quality by providing the means to prioritize emission
control measures and take informed decisions based quantified PM reductions. The general
objectives of ACEPT-AIR project are in line with the requirements of Directive 2008/50/EC
for formulation of air quality plans and reductions of PM concentration levels, as well as
WHO Guidelines on ambient PM concentrations and the protection of public health. The
project has provided the relevant Greek authorities with a comprehensive characterization
of PM10 and PM2.5 pollution and corresponding emission sources in three characteristic urban
areas in Greece. It has also developed a set of mitigation measures based on the data
collected during the project as well as the application of ACEPT-AIR policy Tool, which can
be used for the formulation of a national Action Plan. Moreover, ACEPT-AIR Policy Tool
has been provided to the authorities, along with support training material. The project
stakeholders have been already trained in the use of the Tool and ACEPT-AIR partners will
continue to provide any support needed to end users. The direct environmental benefits of
the project relate to resource savings from the implementation of cost-effective environmental
policies and reductions of PM concentrations leading to attainment of air quality standards.
These benefits cannot be seen immediately since they require the implementation of the
proposed measures for an adequate time period (at least one year) in order to document the
effect on PM concentration levels.
Long-term benefits and sustainability: The long-term benefits of this project include:
A Polity Tool provided to policy makers for cost-effective air quality management: The
Tool can be easily updated with new concentration and emission strength data in order to
provide valid estimates for the following decades.
Long-term resource savings by the implementation of cost-effective environmental
strategies
Strong partnership between authorities and other stakeholders with ACEPT-AIR partners,
leading to continuous transfer of expertise
Motivation of national authorities and stakeholders to enhance their current air quality
policies
High visibility of mitigation measures proposed in the guidelines for Action Plan
formulation issued by the project
Mobilization and education of local populations with respect to particulate air pollution,
sources and effects as well as control strategies, including adoption of environmentally
friendly practices in everyday life
New business and employment opportunities in the area of air pollution mitigation
Long-term health benefits for the local populations due to the improvement of ambient air
quality by the implementation of effective emission control measures
Cost savings from reductions in hospitalizations and work absences due to air pollution
health effects
Air pollution monitoring actions by local authorities and stakeholders motivated by their
involvement in the project. The Coalition of 21 Local Authorities of North and East
Athens, the Municipality of Thessaloniki and the Municipality of N. Ionia in Athens have
already undertaken or intensified their monitoring activities.
New data on PM concentrations and chemical speciation and on source apportionment
provided by project partners. NCSR “D”, AUTH, AXON and TUC have already
committed to providing new data and updating the Policy Tool’s databases.
62
Replicability, demonstration, transferability, cooperation: ACEPT-AIR Policy Tool may
be applied to other regions as well. The software is provided free of charge to interested end
users and is easy to use, which may be drivers for its more extensive application in the future.
Nevertheless it requires input databases characteristic of the application region. PM
concentration data are easily accessible from national monitoring networks. Emission strength
and source contribution data require more resources and greater expertise to be obtained.
ACEPT-AIR partners cannot supply these data for other areas of interest but will provide any
support needed for the application of the Tool when the required input data are available. The
Policy Tool may be useful also to private companies for the assessment of effectiveness of
new technological solution on emission control with respect to ambient PM concentration
levels. The high visibility of the project outcome and the demonstration of ACEPT-AIR
Policy Tool may assist towards the mobilization of the general public to adopt control
measures (such as reduction of the use of fireplaces for residential heating, more extensive use
of public transportation) and to put pressure on the relevant authorities to implement effective
mitigation strategies. Air quality management needs both policy makers and local populations
/ stakeholders in order to be successful. In this framework the dissemination plan of ACEPT-
AIR project included all the above target groups.
Best Practice lessons: Several best practice methods for source apportionment have been
used, including two types of receptor models (PMF and CMB) and emission inventories. The
combination of these methods provided an added value to the project outcome and allowed
for the association of PM concentrations with emission strengths used in the calculation code
of ACEPT-AIR Tool. Application of the tool by policy makers may provide an assessment of
the existing best practice measures and may indicate a need for adjustments for a more cost-
efficient environmental policy.
Innovation and demonstration value: ACEPT-AIR Policy Tool is an innovative software
that relates PM concentrations with emission strengths and provides estimates of changes in
PM concentrations based on emission scenarios. The functionality of the Tool has been
demonstrated to local stakeholders as well as abroad during networking events with
international participation. The major innovative aspect of the Tool is its simple calculation
code which does not require complex input data and detailed temporal variability of
parameters.
Long term indicators of the project success: Future assessment of the project success may
be quantified based on the following long term indicators:
Adoption of control measures proposed by ACEPT-AIR project by National, Regional or
Local authorities
Sustainability of ACEPT-AIR Policy Tool in terms of its use by policy makers and
updating of its databases
Decrease of PM concentration levels and attainment of EU air quality standards
Continuous exchange of experience and know-how between project partners and key
stakeholders
New data on emission strengths and source contributions
Application of ACEPT-AIR Policy Tool in other regions.

63
6. Comments on the financial report
6.1. Summary of Costs Incurred
There has been no official amendment to the Budget of the GA but according to the Response
letter of Joakim Capitao (28/11/2012):
“The changes proposed in the budget and listed below seem acceptable. Please note,
however, that the eligibility of costs will be assessed at the time of the final payment. You
should also note that the reference budget remains the one in the signed grant agreement and
that, therefore, the impact of any other modifications needed in the future on the margin of
flexibility of 10% / 30.000 € provided by the Common Provisions will need to be evaluated
cumulatively.
Personnel: increased from 1.207.256 € to 1.248.085 €.
Travel: decreased from 126.267 € to 100.307 €.
External assistance: decreased from 83.500 € to 74.500 €.
Consumables: increased from 96.800 € to 98.800 €.
Other costs: increased from 51.617 € to 55.072 €.”
6.2. Accounting system
Every beneficiary has a unique code and record for every project except for AXON. Every
cost referring to the project is checked by the financial manager of the project and the
accounting office of every beneficiary for its legality and eligibility.
The timesheets used for the time recording system were manually completed and signed by
the responsible for the project for every beneficiary and the staff member, except for AUTH
which uses a computerized recording system.
PROJECT COSTS INCURRED
Cost category Budget according to the
grant agreement
Costs incurred within
the project duration
%
1. Personnel 1,254,065.73 1,268,175.16 101.13%
2. Travel 98,307.20 84,280.52 85.73%
3. External assistance 76,000.00 75,792.45 99.72%
4. Durables: total non-
depreciated cost
45,780.30 45,347.05 99.05%
- Infrastructure sub-
tot.
- Equipment sub-tot.
- Prototypes sub-tot. 45,780.30 45,347.05 99.05%
5. Consumables
6. Other costs 84,462.14 80,793.80 99.66%
7. Overheads 65,714.78 56,159.59 85.46%
TOTAL 107,599.70 107.194.58 99.62%

64
Every invoice contains a stamp with the details of the project that show the link to the LIFE+
project.
6.3. Partnership arrangements (if relevant)
The financial transactions between the coordinating beneficiary and the associated
beneficiaries have been done through a bank transaction. The financial reporting is
implemented by the associated beneficiaries themselves.
6.4. Auditor's report/declaration
Organization Name: NEXIA EUROSTATUS A.E. CERTIFIED AUDITORS
Company's Reg. No.: 141
Address: Head Office: 34, Frantzi Amvrosiou Street, 11745, Athens, Greece
Branch: 108, Kallistratous Street, 15771, Athens, Greece
Name of the auditor: Charalambides Antonios
Auditor’s Reg. No.: 18041
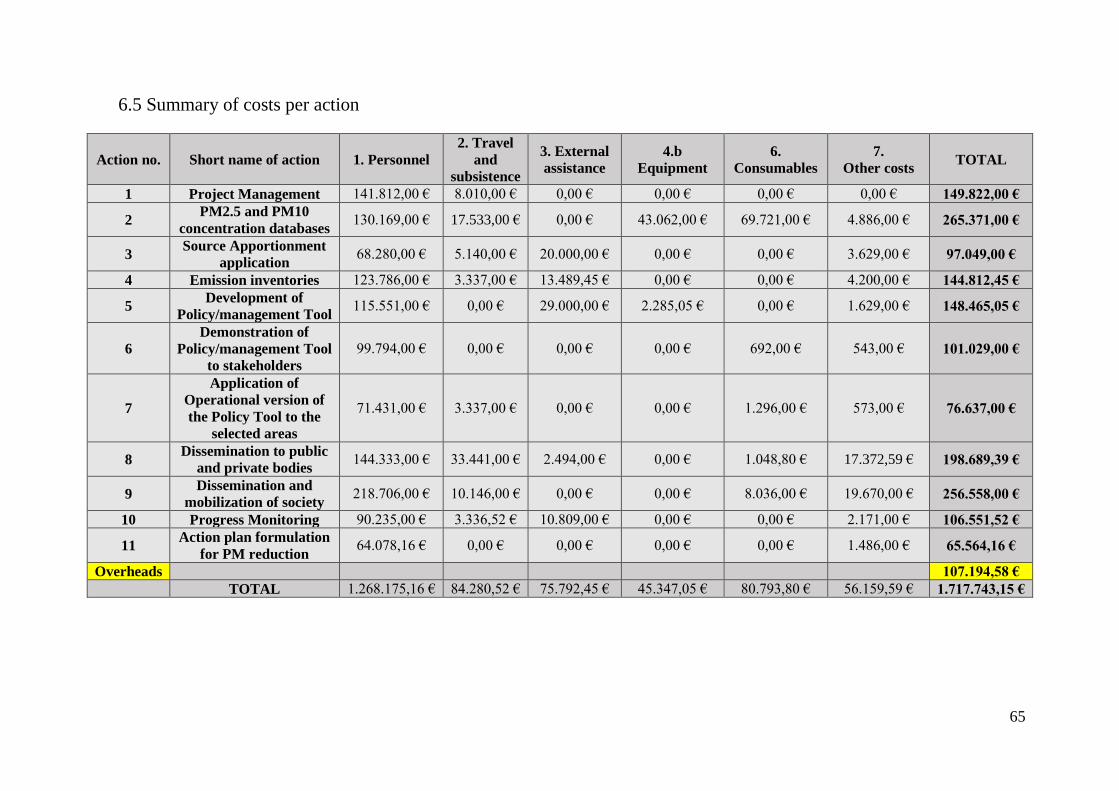
65
6.5 Summary of costs per action
Action no. Short name of action 1. Personnel
2. Travel
and
subsistence
3. External
assistance
4.b
Equipment
6.
Consumables
7.
Other costs TOTAL
1 Project Management 141.812,00 € 8.010,00 € 0,00 € 0,00 € 0,00 € 0,00 € 149.822,00 €
2 PM2.5 and PM10
concentration databases 130.169,00 € 17.533,00 € 0,00 € 43.062,00 € 69.721,00 € 4.886,00 € 265.371,00 €
3 Source Apportionment
application 68.280,00 € 5.140,00 € 20.000,00 € 0,00 € 0,00 € 3.629,00 € 97.049,00 €
4 Emission inventories 123.786,00 € 3.337,00 € 13.489,45 € 0,00 € 0,00 € 4.200,00 € 144.812,45 €
5 Development of
Policy/management Tool 115.551,00 € 0,00 € 29.000,00 € 2.285,05 € 0,00 € 1.629,00 € 148.465,05 €
6
Demonstration of
Policy/management Tool
to stakeholders
99.794,00 € 0,00 € 0,00 € 0,00 € 692,00 € 543,00 € 101.029,00 €
7
Application of
Operational version of
the Policy Tool to the
selected areas
71.431,00 € 3.337,00 € 0,00 € 0,00 € 1.296,00 € 573,00 € 76.637,00 €
8 Dissemination to public
and private bodies 144.333,00 € 33.441,00 € 2.494,00 € 0,00 € 1.048,80 € 17.372,59 € 198.689,39 €
9 Dissemination and
mobilization of society 218.706,00 € 10.146,00 € 0,00 € 0,00 € 8.036,00 € 19.670,00 € 256.558,00 €
10 Progress Monitoring 90.235,00 € 3.336,52 € 10.809,00 € 0,00 € 0,00 € 2.171,00 € 106.551,52 €
11 Action plan formulation
for PM reduction 64.078,16 € 0,00 € 0,00 € 0,00 € 0,00 € 1.486,00 € 65.564,16 €
Overheads 107.194,58 €
TOTAL 1.268.175,16 € 84.280,52 € 75.792,45 € 45.347,05 € 80.793,80 € 56.159,59 € 1.717.743,15 €
66
7. Annexes
7.1 Administrative annexes
Administrative Annex: List of personnel employed in the project
The Partnership agreement has been submitted with the Inception report (Annex IV of
Inception Report).
7.2 Technical annexes
List of abbreviations
Letters of endorsement for the ACEPT-AIR Life+09 ENV/GR/000289 Program
Deliverable D6. PM10 and PM2.5 concentration databases for the three urban areas (AMA,
TMA and VGA)
Deliverable D7. PM10 and PM2.5 chemical composition databases for the three urban areas
(AMA, TMA and VGA)
Deliverable D8. The chemical profile and respective contribution of aerosol sources on
each region (AMA, TMA, GVA) in the PM2.5 and PM10 fractions
Deliverable D9. The temporal variation in source chemical composition and strength
Deliverable D10. Emission inventories for the three urban areas (AMA, TMA, GVA), for
anthropogenic and natural sources, for the past decade (2000-2010)
Deliverable D11. Spatial and temporal disaggregation of emissions for the past decade
(2000-2010)
Deliverable D12. Emission inventories for the three urban areas (AMA, TMA, GVA), for
anthropogenic and natural sources, for 2010-2013 and projections for the
future
Deliverable D13. Spatial and temporal disaggregation of emissions, for 2010-2013 and
projections for the future
Deliverable D14. Operational Platform (OP) for the “ACEPT-AIR” Policy tool
Deliverable D15. Application guide and manual for the OP
Deliverable D16. Training material composed for the stakeholders’ seminars
Deliverable D17. Minutes of the views and comments expressed in the framework of the
interaction process with stakeholders
Deliverable D18. Updated version of the developed tool platform, based on the stakeholders’
feedback
Deliverable D19. PM concentration reductions in relation to the implementation of specific
measures / scenarios, apportioned to changes in different source categories
Deliverable D20. Proposed measures for the attainment of required PM concentration
reductions
Deliverable D28. Documented efficiency quantified in the two evaluation reports

67
Deliverable D29. Characterization of air quality in relation to particulate matter at the three
areas studied and contribution of natural sources to exceedance events
Deliverable D30. Mitigation measures and policies for the control of particulate pollution
7.3 Dissemination annexes
7.3.1 Layman's report
Deliverable D26. A “layman’s report”
7.3.2 After-LIFE Communication plan
Deliverable D31. Publication of After-Life Communication plan
Deliverable D32. Adoption of a modified project website of key strategies by key
stakeholder
7.3.3 Other dissemination annexes
Deliverable D21. Minutes of the open forum organized in a Report form
Deliverable D22. Proceedings of the international conference
Deliverable D23. Informative and dissemination material
Deliverable D24. Informative material composed for the teachers’ seminars
Deliverable D25. The project website
Deliverable D27. Technical publications in international journals and proceedings of
international conferences
ACEPT-AIR project photos
7.4 Final table of indicators
Final table of indicators
8. Financial report and annexes
Standard Payment Request and Beneficiary's Certificate
Consolidated Cost Statement for the Project
Financial Statement of the Individual Beneficiary
NCSR D (N.C.S.R. “Demokritos”)
AUTH (Aristotle University of Thessaloniki)
UTH (University of Thessaly)
AXON (Axon Envirogroup Ltd.)
TUC (Technical University of Crete)
Auditor's report and Annexes
Recommended