LOCAL FOOD PRODUCTION AND INSTITUTIONAL PURCHASING:
ASSESSING PRODUCER CONSUMER RELATIONSHIPS AT DUKE UNIVERSITY
by
Carl Chamberlin
Dr. Marie Lynn Miranda, Advisor
May 2011
Masters project submitted in partial fulfillment of the
requirements for the Master of Environmental Management degree in
the Nicholas School of the Environment of
Duke University
2011

Table of Contents
Introduction ..................................................................................................................................... 1
Objectives ....................................................................................................................................... 2
Background ..................................................................................................................................... 3
Context: Production ........................................................................................................................ 4
Context: Consumption .................................................................................................................. 12
Methods......................................................................................................................................... 18
Results: Production ....................................................................................................................... 23
Results: Consumption ................................................................................................................... 31
Discussion: Production ................................................................................................................. 35
Discussion: Consumption ............................................................................................................. 37
Recommendations ......................................................................................................................... 41
Challenges ..................................................................................................................................... 44
i
Abstract
LOCAL FOOD PRODUCTION AND INSTITUTIONAL PURCHASING:
ASSESSING PRODUCER CONSUMER RELATIONSHIPS AT DUKE UNIVERSITY
By
Carl Chamberlin
May 2011
Green purchasing policies are one aspect of campus sustainability that has been receiving
increasingly more interest at Duke University in the past three years. Concurrently, locally
supported food systems have been developing in the Research Triangle area, represented by
farmers’ markets, community supported agriculture, and retail cooperatives. Furthermore, within
the Duke Dining Services office, increased purchasing of locally produced food has been
identified as one of the top three opportunities being pursued by the Dining Director. This study
utilizes a farm-based survey to develop knowledge of the producer subsystem of the local food
system, and interviews of dining operators at Duke to understand the current use of local food in
purchasing policies. Local, small farmers are still relying heavily on farmers’ markets as their
main source of income, but many are branching out into other markets such as retail and
restaurants. Of the dining operators with the ability to use local food in their operations, six out
of ten were currently choosing to purchase locally, although some more than others. This
provides the university with a strong base to develop future policies to encourage increased
relationships between farmers and operators.
Approved
___________________________________ (MP advisor signature here) Dr. Marie Lynn Miranda
___________________________ Date
Master's Project submitted in partial fulfillment of the requirements for the Master of Environmental Management degree in the Nicholas School of the Environment, Duke University May 2011

1
Introduction
The choices consumers make with regard to what and how they choose to purchase food
has become a national topic of conversation, leading to what is commonly referred to in the
media as the “local food movement.” Widely popular books and articles from authors such as
Michael Pollan (The Omnivore’s Dilemma, In Defense of Food, Food Rules) and Barbara
Kingsolver (Animal, Vegetable, Miracle) examine the relationship between humans and food and
advocate for alternate systems to the current industrial model of food production. That industrial
model is dominated by a small number of large transnational corporations, whereas the
alternative relies on direct links between consumers and producers. Terms like organic, that used
to dominate the lexicon of alternative systems, are now giving way to ideas of local, and what it
means to truly maintain a sustainable food system. This movement is being driven on the
production side by small farmers and on the consumption side by individuals and organizations
interested in promoting sustainable practices.
A local model that provides an example of this alternative system is Fickle Creek Farm, a
145 acre farm in Efland, NC that supports a variety of livestock, a vegetable garden, and a bed
and breakfast. The main components of the production system are rotational grazing, low inputs,
native flora, and integration with the native ecosystem. The idea that the production system
should, in as many ways as possible, mimic the natural system is ingrained in the processes and
design of the farm. On the output side, Fickle Creek serves a variety of markets including a
number of farmers’ markets, a grocer, and five restaurants. Its distribution is no greater than 25
miles from the farm. The motivation for this study arose from two factors. First, a visit to this
farm, and a conversation with the farmers who manage it, helped me to understand how these
systems function in practice. If Fickle Creek Farm is successfully utilizing this system, how
2
many other farmers in the area are doing a similar thing? Second, conversations at Duke had
turned heavily toward making the campus a more sustainable place. If there are enough farmers
in the region joining the local food movement, could Duke University tap into this market? Thus
the central objective for this study is to research the potential for creating a mutually beneficial
relationship between local farmers and the university, and to do so through understanding both
the producer side (local farmers) and the consumption side (university dining).
Objectives
The central question of this study is: what is the potential for creating connections
between local food producers and Duke University dining services? As a secondary question,
what are some potential mechanisms for making these connections? This study addresses the
main question by looking at the structure and characteristics of the local food system near Duke,
and by looking at the structure and characteristics of the dining system – and assumes that
making such connections is a good idea. As an outgrowth of this research, the study addresses
the second question by identifying recommendations that could help Duke take advantage of the
local food producing resources that exist in the immediate area.
It is important to note that this project does not provide any cost-benefit analysis of the
switching to local food choices. It also isn’t aimed at converting all of Duke’s food purchasing
to local sources for a number of reasons. First, there may not be enough supply or enough
diversity of products to satisfy all the students’ needs. Second, there is a seasonal aspect to the
local food system that may inhibit fully implementing this type of system. Third, the barriers
that currently exist (discussed in later sections) are such that some operators would be unwilling
or unable to utilize these resources. The main impetus for pursuing a policy related to local
purchasing is to increase the sustainability of Duke’s purchasing decisions by: (1) diversifying

3
food procurement to include local sources and (2) plugging local resources into the system where
they are appropriate. Local food purchasing promotes sustainability through shorter distances
between consumers and producers, smaller farm size and scale, utilizing local food purchasing
venues, and by displaying a commitment to social and environmental dimensions of food
production (Jarosz, 2008).
Background
In 2003, the Duke environmental sustainability coordinator initiated a study to determine
the overall environmental impacts of the university dining system. The study, conducted by
Greg Andeck, a Master’s of Environmental Management candidate in the Nicholas School of the
Environment, identified significant impacts related to the university dining system, broken out
into five broad categories: food ingredients, solid waste, chemical use, energy consumption, and
consumer education. As a response to the recommendations put forth by the study, the Dining
Director has incorporated environmental goals into the evaluation of dining operators, and
broadly labeled sustainability as the third highest priority for the office (food temperature and
hand sanitation were the top two opportunities). Local food purchasing policies are a specific
aspect of sustainability in dining operations, and this study is designed to delve one step deeper,
by focusing on the procurement of locally produced food for use in dining facilities.
To develop a comprehensive and coherent policy on local food procurement at the
university, it is important to understand not only the current use of local food in the dining
system, but also the current market for local products. As such, each section of this report will
focus on both sides of this issue: production and consumption. Production sections will focus on
sustainable agriculture, food system issues, and the methodology for measuring the local food
market near Duke University. Consumption sections will focus on campus sustainability
4
movements, the dining services structure, and the current landscape of local food procurement at
the university. Thinking about food systems in an integrated sense, connecting both production
and consumption is utilized in the literature by Goodman (2002), Holloway (2007), and Selfa
(2002). Producer-consumer relationships are highly visible in local food systems, and this
research strives to evaluate these relationships in hopes of building this type of connection at
Duke University.
Context: Production
The production section starts by providing a model for understanding the food system,
defining the term sustainability, and then discussing both sustainable agriculture and sustainable
food systems. The section ends with a discussion of the concept of local.
Food System
In order to better understand the producer – consumer relationships being studied, it is
important to have an understanding of the systems in which they are rooted. The food system, at
a basic level, is the system through which food is transferred from the field, to the plate of
individuals eating that food. In reality, the system is much more complex, and a conceptual
model is used here to better describe the different aspects of the system and how they fit
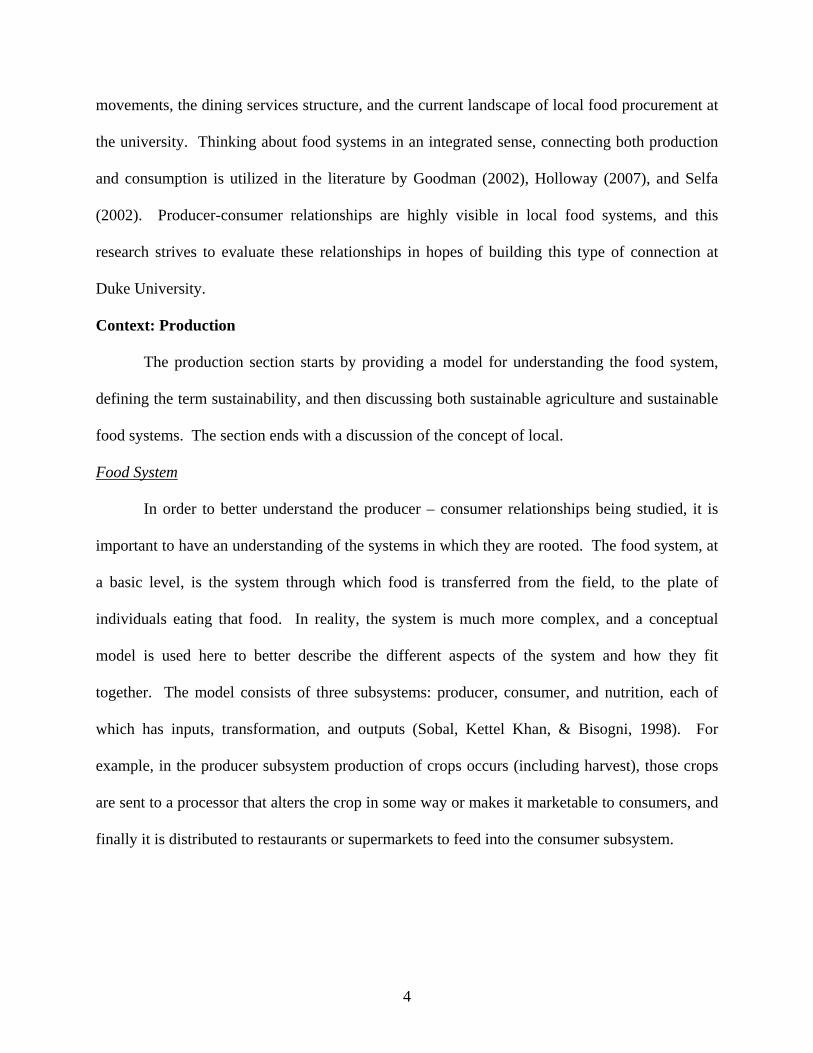
together. The model consists of three subsystems: producer, consumer, and nutrition, each of
which has inputs, transformation, and outputs (Sobal, Kettel Khan, & Bisogni, 1998). For
example, in the producer subsystem production of crops occurs (including harvest), those crops
are sent to a processor that alters the crop in some way or makes it marketable to consumers, and
finally it is distributed to restaurants or supermarkets to feed into the consumer subsystem.
The mod
social sy
Figure 1
P
C
N
del is linear
ystems, whic
shows the c
Table 1: Foo
SUBSYS
Producer Su
Consumer S
Nutrition Su
in this form
ch provide f
complete vie
od and Nutri
STEM
ubsystem
Subsystem
ubsystem
m, but it also
feedback loo
w of the foo
5
ition System
RE
P
Proce
D
A
Prepa
Co
Tran
U
o exists with
ops that help
od and nutrit
m (Sobal et al
ESOURCE
Production
essing (tran
Distribution
Acquisition
aration (tran
onsumption
Digestion (
nsport (tran
Utilization (
hin the cont
p define the
tion system,
l., 1998)
INPUTS
(input)
nsformation)
(output)
(input)
nsformation
n (output)
(input)
sformation)
(output)
text of other
system (So
with the thr
)
n)
)
r biophysica
obal et al., 1
ree subsystem
al and
998).
ms in

6
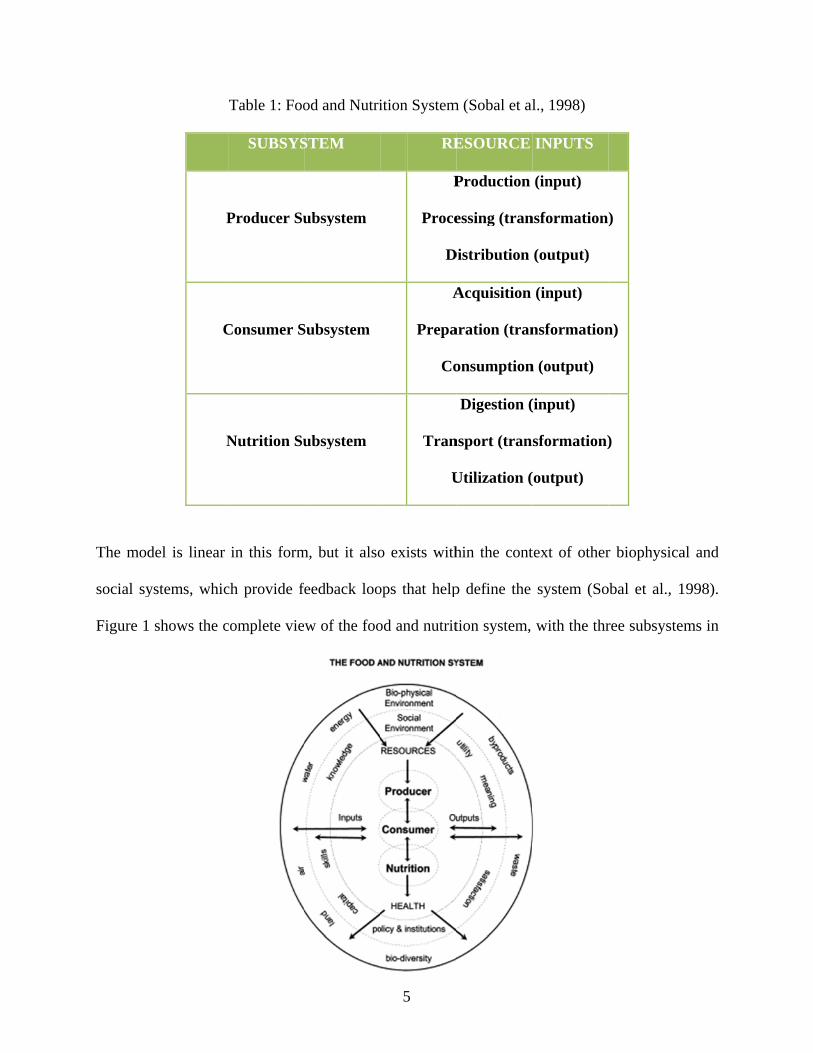
the middle, and biophysical and social systems influencing their functioning.
The conceptual model provides an overview of the food system, and describes the
different pathways through the system. However, all food doesn’t travel through the food system
in the same way, and four different routes represent the means through which consumers obtain
food. The four routes are: the mainstream system, charitable assistance, federal food assistance,
and the local food system (Pothukuchi, 2004). The mainstream, market-driven system is the
dominant path, which is global in nature, energy-intensive, and increasingly consolidated
(Feenstra, 2002). To fill in the gaps created by this system, charitable assistance (food banks and
soup kitchens) and federal food assistance (food stamps, WIC, etc.) are two paths that provide
food to those who cannot obtain it through the mainstream system (Pothukuchi, 2004). The
fourth route is an alternative, rather than a complement, to the mainstream, and is referred to as
the community food system (Pothukuchi, 2004). To put this into the context of a university, the
university system takes advantage of the mainstream system and the local food system, so this
study ignores the other two streams for the purpose of this project.
Defining Sustainability
In order to understand how local food systems can increase the sustainability of
purchasing decisions at Duke, we first need to define sustainability. Discussions of sustainability
invariably begin with the Brundtland Commission Report, Our Common Future: Report of the
World Commission on Environment and Development, which defines sustainable development as
“development that meets the needs of the present without compromising the ability of future
generations to meet their own needs (Brundtland Commission, 1987).” Though often criticized
for being vague, it laid the groundwork for future work in the realm of sustainability. Soon after
the Brundtland Report, Karl-Henrik Robert, a Swedish scientist, developed the Natural Step

7
Framework based on the principles of physics, as a way of defining sustainability scientifically.
This definition of sustainability attempts to define sustainability in a more systematic way, and is
the basis for how sustainability is applied in this study. After 22 iterations, sending his ideas to
other scientists for peer review, he settled on four systems conditions for sustainability:
Nature is not systematically increasing concentrations of substances extracted from the Earth’s crust,
Nature is not systematically increasing concentrations of substances produced by society,
Nature is not systematically increasing degradation by physical means, and
People are not subject to conditions that undermine their capacity to meet their needs (www.naturalstep.org).
These systems conditions are the lens through which this study judges sustainability. As an
example, traditional agriculture practices, as described in the literature, violate each one of these
conditions in most situations. Heavy reliance on fossil fuels for the production of synthetic
fertilizer and use in large farm equipment relates to the first condition. The use of synthetic
fertilizers and pesticides at a rate far higher than Earth’s systems can absorb and break down
these chemicals relates to the second condition. Tillage practices and other production factors
lead to high rates of erosion and soil degradation, which relates to the third condition. Finally,
the treatment of migrant farm workers in many areas of the US relates to the fourth condition.
Sustainable Agriculture
North Carolina has a diverse agricultural sector, and ranks in the top three in the US in
production of tobacco, sweet potatoes, hogs, turkeys, and trout.1 The agricultural sector provides
$68.3 billion annually to the state’s economy, which is a substantial portion of the state’s
income. However, the data provided by the state Department of Agriculture and Consumer
Services paints an incomplete picture of the agricultural resources that exist in NC. In addition
1 All agricultural data for NC from: NC Dept. of Agriculture and Consumer Services, Agriculture Statistics Division. http://www.agr.state.nc.us/stats/index.htm

8
to commodity farming, 97 farmers’ markets were in operation in 2006, and over 50 community
supported agriculture (CSA) programs were also in operation. Of the 54,000 farms identified in
NC in 2002, 67% were less than 100 acres. These activities are a smaller portion of the overall
agricultural sector, but they are a growing subsection supporting local food systems across the
state. Purchasing local or organic food enhances local economies, encourages farmers to enter
into new markets, and provides safe, healthy food grown. In that sense, it is a two-way street
benefiting both farmers and consumers.
The direct costs of implementing a policy related to local purchasing masks the indirect
costs of traditional food procurement policies. The modern industrial farming system is
responsible for a number of environmental problems, which have been counter balanced with
increasing agricultural yields (Horrigan, et al., 2002). The industrial system is generally
concerned with producing the greatest yield per acre at the lowest cost. The emphasis on
efficiency ignores the greater ecological systems in which farming is rooted, and the economic
system allows industrial farms to ignore the externalities they create. Negative impacts through
industrial farming include: contamination of soil and water, destruction of habitat, loss of genetic
diversity, and a decrease in soil and water resources (Horrigan, et al., 2002). Increased reliance
on chemical fertilizers and pesticides, which allow monoculture farming, are major contributors
to the problem.
In response, sustainable agriculture principles have been developed as an alternative to
the conventional model. The 1990 Farm Bill defines sustainable agriculture as: “An integrated
system of plant and animal production practices having a site specific application that will, over
the long-term: satisfy human food and fiber needs; enhance environmental quality and the
natural resource base upon which the agriculture economy depends; make the most efficient use

9
of nonrenewable resources and integrate, where appropriate, natural biological cycles and
controls; sustain the economic viability of farm/ranch operations; and enhance the quality of life
for farmers/ ranchers and society as a whole (Title XVI, Subtitle A, Section 1603).”
The global agricultural landscape hosts a myriad of production techniques, and
sustainability can be achieved in many different ways. For instance, many small farms use
methods such as polyculture, crop rotation, low inputs, integrated pest management, bio-
mimicry, etc. But while the methods of farming in a sustainable manner are varied, by
understanding the four systems conditions of sustainability, the principles are simple:
Strengthening the immune system of agricultural operations: stabilizing pests and nurturing natural pest control
Decreasing toxicity in the system and environment through optimum use of external synthetic chemicals
Optimizing metabolic functioning such as nutrient cycling and organic matter recycling
Balancing regulatory systems – nutrient cycles, water balance, energy flows, population regulation
Enhancing conservation and regeneration of soil and water resources and biodiversity
Increasing and sustaining long-term productivity (Altieri, 2002).
One important trend in the NC agriculture sector, as well as in other parts of the US, is
the consolidation of small and mid-size farms into larger industrial scale farms (personal
communication, Cohn 2007). It is important to note that industrial scale farming isn’t the same
as corporate owned farming, especially in North Carolina where the vast majority of farms are
still family owned, even the large ones. Local food systems are helping to revitalize many small
farmers, but the same markets don’t exist for mid-size farmers, which has led to an increased
polarization between large and small farms. Institutional buyers, such as universities, are a new
market for small farmers with the potential for providing a market for mid-size farmers as well.
Currently, small farmers have been able to take advantage of small, local markets, but are
10
running into obstacles with larger markets, such as universities (Johnson & Stevenson, 1998;
Strohbehn & Gregoire, 2004, Vogt & Kaiser, 2008). The growth of small farms, through the
relationships developed at universities and other institutions, may work to revitalize mid-size
farms.
Sustainable Food Systems
The concept of a sustainable food system is referred to in a number of different ways in
the literature, as community food systems, alternative food networks, food sheds, and
regenerative food systems (Pothukuchi, 2004; Jarosz, 2008; Kloppenburg, et al. 1996; and
Dahlberg, 1993). In general, they share four characteristics: shorter distances between producers
and consumers, small farm sizes, food purchasing venues (such as CSA’s, farmers’ markets, and
cooperative markets), and a commitment to social and environmental goals (Jarosz, 2008). The
different names highlight attributes that are similar as well: the sense that these systems are
based in local communities; the idea that they are an alternative to the traditional food system;
geographically-based elements are incorporated; and the systems are sustainable or regenerative.
Implicit in the idea of sustainable food systems is the thought that the traditional global system is
in many ways unsustainable (Grey, 2000; O’Hara & Stagl, 2001; La Trobe & Acott, 2000).
Other ideas of a sustainable food system are more geographically based. The concept of
a food shed, similar to a watershed, helps reinforce the idea of proximity between producers and
consumers by adding a natural or geographical element to procurement of food (Kloppenburg, et
al., 2000). The distance between production of food and consumers, in the global system, has
been shown to be vast. One Iowa study calculated food traveled 1,546 miles from conventional
sources, as opposed to 44.6 miles from local food projects (Pirog, et al., 2001). A full life-cycle
analysis of the greenhouse gas associated emissions from food production, though, finds that
11
transportation only accounts for 11% of greenhouse gas emissions, compared to 83% for the
production phase (Weber & Matthews, 2008). In that sense, “food miles” may not be as
important a factor as dietary choices, but proximity contributes to other positive factors in the
system, for instance developing bonds between producers and consumers (Kloppenburg, 1996).
Concepts of Local
Defining the “local” in a sustainable food system can be difficult, and different groups
within the same population may view proximity differently. In a study of producers and
consumers in Washington State, differences were shown between producers and consumers
within the same county, as well as between producers in different counties and consumers in
different counties (Selfa & Qazi, 2005). Responses generally varied between proximity (miles
travelled), county boundaries, and state boundaries. As an alternative to the global system, local
is generally perceived in the literature as being good, although a number of authors have
cautioned against this assumption (DuPuis & Goodman, 2005; Hinrichs, 2003; Born & Purcell,
2006). Both Dupuis (2005) and Hinrichs (2003) advocate a more critical analysis of the term, as
it can lead to defensive politics in a region. It is also noted that local producers may or may not
be more environmentally sustainable, and in many cases, the limits of local may need to be
expanded to fulfill nutritional needs of certain populations (Hinrichs, 2003). Lastly, Born (2006)
identifies “the local trap” (assuming local is preferable to global), by defining scale as being
socially produced. Since scale is a social development, food produced at a local scale is no more
likely to be sustainable than food produced in a global system. These concepts of local in the
literature aren’t arguments against the benefits of a local food system, but rather arguments that
the idea of local needs to be more carefully considered.

12
A 2010 study of local food systems by the USDA Economic Research Service provides
the most recent review of the definition and characteristics of the local food systems. The
highlighted findings include (Martinez, et al. 2010):
There is still no generally accepted definition of the term “local.” As an example of the range of definitions, the 2008 Farm Act defines a local food product as being less than 400 miles from its origin, or within the state it was produced.
Local food markets account for a growing portion of total US agricultural sales. Direct-to-consumer sales accounted for 0.8 percent of sales in 2007.
Local food systems are more likely to occur where there are small farms located near metropolitan counties.
Consumers are willing to pay more for locally produced food.
Governments at all levels are increasingly supporting local food systems.
Context: Consumption
The consumption section starts off with a discussion of broader campus sustainability,
and then focuses on the duke dining system, the associated PACE scoring system utilized by
dining services, and how sustainability fits into the PACE system. Lastly, this section finishes
with an overview of farm-to-school movements at other universities.
Campus Sustainability Movement
Three years after the Brundtland Commission Report, and two years before the Earth
Summit in Rio, a group of university leaders met and signed the Talloires Declaration, in
Talloires, France (Bartlett and Chase, 2004). Twenty university leaders from around the world
signed the original document, and today over 350 university leaders have signed on (Duke is not
one of the current signatories). The declaration states that environmental degradation is
occurring all over the world and that, “universities have a major role in the education, research,
policy formation, and information exchange necessary to make these goals possible (USLF,
1990).” The declaration set forth ten goals:

13
Increase awareness of environmentally sustainable development
Create an institutional culture of sustainability
Educate for environmentally responsible citizenship
Foster environmental literacy for all
Practice institutional ecology
Involve all stakeholders
Collaborate for interdisciplinary approaches
Enhance capacity of primary and secondary schools
Broaden service and outreach nationally and internationally
Maintain the movement (USLF, 1990)
The Sustainable Endowments Institute releases a College Sustainability Report Card every year,
and in 2008, Duke received a B+ overall, and an A under the category Food and Recycling
(Sustainability Endowment Institute, 2008). Duke receives credit for its recycling program, as
well as Bon Appetit’s efforts to purchase local food.
Dining History2
Prior to 1997, Duke Dining Services managed all 18 union-run dining facilities on
campus with approximately $14 million in revenue annually. During that time, Jim Wulforst
was managing dining operations for Time Magazine in New York City, and subsequently for
Time Warner after the merger. Wulforst brought his experience and expertise to Duke in 1997,
and has worked tirelessly to improve operations since that time. Today, all of Duke’s eateries
are operated as private contracts with approximately $30 million in revenue annually. The
transition from union to privatization occurred without cutting any food-service jobs and
currently consists of approximately 32 locations with 16 contracts. Layoffs were avoided during
the transition by reassigning workers to other union supported jobs on campus (e.g., grounds and
2 The history of the Duke Dining system is based on a personal communication with Jim Wulforst, Director of Dining Services, October 19, 2007.
14
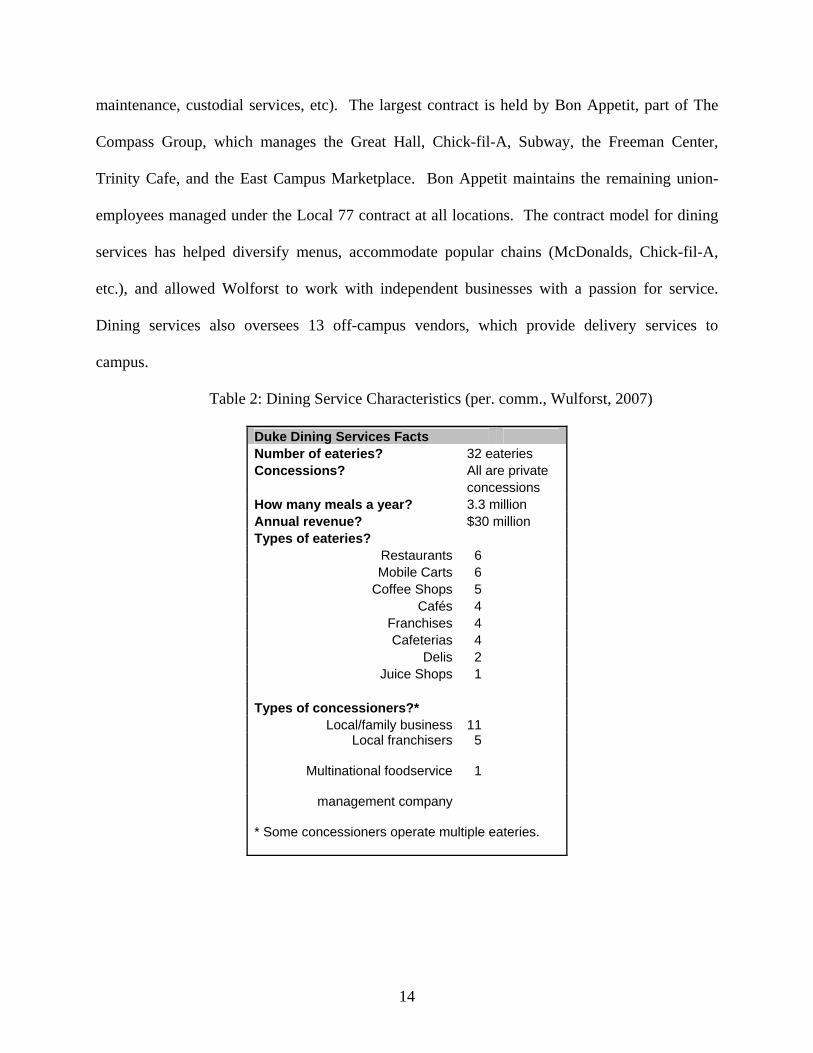
maintenance, custodial services, etc). The largest contract is held by Bon Appetit, part of The
Compass Group, which manages the Great Hall, Chick-fil-A, Subway, the Freeman Center,
Trinity Cafe, and the East Campus Marketplace. Bon Appetit maintains the remaining union-
employees managed under the Local 77 contract at all locations. The contract model for dining
services has helped diversify menus, accommodate popular chains (McDonalds, Chick-fil-A,
etc.), and allowed Wolforst to work with independent businesses with a passion for service.
Dining services also oversees 13 off-campus vendors, which provide delivery services to
campus.
Table 2: Dining Service Characteristics (per. comm., Wulforst, 2007)
Duke Dining Services Facts Number of eateries? 32 eateries Concessions? All are private concessions How many meals a year? 3.3 million Annual revenue? $30 million Types of eateries?
Restaurants 6 Mobile Carts 6
Coffee Shops 5 Cafés 4
Franchises 4 Cafeterias 4
Delis 2 Juice Shops 1
Types of concessioners?*
Local/family business 11 Local franchisers 5
Multinational foodservice 1
management company
* Some concessioners operate multiple eateries.

15
PACE Program3
The PACE (Performance Assessment for Culinary Excellence) Program is an evaluation
system used by dining services to evaluate vendors on a fixed performance scale. Wolforst
conceived the program during a tour of Air Force facilities overseas, and based it on a system
used by the Air Force to evaluate its bases (per. comm., Wulforst, 2007). The program,
instituted in 2003, uses four main components to identify the strengths and weaknesses of each
vendor (per. comm., Wulforst, 2007):
Operational performance review - audit of five main categories: kitchen operations, serving and dining operations, personnel, sanitation and maintenance, and management.
Customer care review - three “mystery shoppers” and one senior staff assessing the customer experience.
Periodic review of operations - pared down variation of the operational review.
Student committee quality review - similar to the customer care review.
The operational performance review is the backbone of the program, and is performed
once a year. Based largely on this review, and buttressed by the two separate customer care
reviews, each operation receives a numerical score on a scale from 1 to 1000. At the end of each
year, approximately $60,000 in performance incentives are handed out based on the scoring
system, with awards for best facility, sustained excellence, and continued improvement.
Incentive can include awards and/or funds designated for new equipment/upgrades. The
standards are updated annually and weigh heavily in contract renewals. The points breaks down
like so, in order of weight: sanitation & maintance-275, serving & dining-225, personnel-175,
management-175, and kitchen operations-150. As expected, cleanliness is the most important
category, followed by the dining experience provided by the operator.
3 Duke Dining Services, 2007. Performance Assessment for Culinary Excellence. Unpublished internal document.

16
PACE and Sustainability
The forming of the Ad Hoc Committee on Green Dining, and the addition of a green
dining position has led to more focused efforts in sustainability. On a list of opportunities
currently being pursued by Dining Services, greening initiatives are ranked third in a list of ten
by importance (food temperature and hand sanitation were the top two opportunities). Listed
under greening initiatives on the Dining Services list of opportunities, they have identified four
initiatives: composting, recycling, unbleached napkins, and purchasing local and organic4.
Connecting this back to the PACE Program, the scoring system lists “greening” as a category
under management, and currently is allotted 55 points out of 1000 – that number has actually
decreased. The greening category addresses a number of options: recycling/composting-30,
containers-5, unbleached napkins-7, organic ingredients-3, lights-5, and water conservation-5.
The connection between PACE and sustainability is important for a number of reasons.
First, all four initiatives identified under opportunities are being pursued except for incentives for
purchasing local (local and organic aren’t the same things). This is important because dining
services has listed “buying local” as a top three opportunity, yet they haven’t incorporated it into
the scoring system. Second, although greening initiatives are addressed, they currently make up
only 5% of the program. This is important for this study as the recommendations make the case
for increasing this share in the future. Third, the PACE program has a design that lends itself
toward implementing sustainability. Much of the work in corporate sustainability is focused on
developing metrics, similar to the set of metrics in the PACE program, for measuring and
documenting sustainability.
4 Duke Dining Service, 2007. Top Ten Dining Priorities. Unpublished internal document.

17
Farm- to-School Programs
Local buying programs at colleges and universities are generally referred to as farm-to-
college programs. The moniker is also used more broadly as farm-to-institution, and is derived
from the more popular farm-to-school programs that exist around the country at public and
private K-12 institutions (Vogt, 2008). Farm-to-school programs are more widespread, relatively
successful, in many cases supported by government funding, and have served as a model for
farm-to-college programs. Colleges and universities have many advantages public school
systems don’t have, such as greater funding for food services, customers (students) exerting
more influence, and kitchens with staff qualified to prepare fresh food, all of which are lacking in
many school systems (Vallianatos et al., 2004). On the other hand, colleges and universities are
in many ways run like a business, which requires a return on investment for many of its costs.
Not only are direct costs for purchasing local products higher than traditional procurement
(which is generally the lowest cost alternative by design) but increased transaction costs occur
through interactions with multiple farmers rather than one distributor (Vogt, 2008).
In general, farm-to-institution programs are designed to connect farmers or already
existing farmer organizations with schools, colleges, or other institutions (hospitals, prisons, etc.)
that require a relatively steady supply of food on a yearly basis. The programs suffer from many
of the same obstacles, but remain popular due to the vast opportunities, or perceived
opportunities that exist. In one respect, the greatest opportunity stems from the fact that many of
these institutions are spending billions of dollars a year on food, a portion of which could be
rerouted to local purchases. Another perceived opportunity is the plight of the small American
farmer looking for an outlet for his goods. Both ideas are true, although they aren’t that simple,
and the benefits don’t always match up. For instance, not all institutions are designed to be able

18
to accept fresh, unprocessed food, and many small farmers aren’t set up to accommodate the
many requirements of larger institutions.
The National Farm to College Program is maintained by the Community Food Security
Coalition (CFSC), a non-profit committed to expanding and supporting local food systems in
communities across the US. According to data reported by the CFSC, there were approximately
125 schools in the US managing farm-to-college type programs in 2005 (CFSC, 2008).
Programs range from small purchases for special event type catering to larger, more established
programs that provide locally sourced food in cafeterias daily. The data collected through their
survey are not exhaustive by any means (data were collected through a voluntary survey of
individuals who have visited their website), but it provides anecdotal evidence to support the
claim that these programs are gaining prominence within university systems. Two food service
companies, Bon Appetit and Parkhurst Dining, also provided data on their contributions to local
sourcing for universities. Bon Appetit is the largest food service contractor at Duke University.
Methods
This study utilizes two main methods for collecting data: a farm based survey, and
interviews with dining operators. The production survey utilized in this study is designed to do
two main things: first, develop a baseline understanding of the state of local food production in
the region, and second, analyze what markets are currently being served in the local food system.
In order to think about policies aimed at helping farmers, it is important to understand their
current situation. The dining manager interviews (consumer side), are designed to develop a
baseline understanding of the connections that already exist between the dining operations and
local farmers. By connecting the current state of the local market with the current relationships
that already exist, one can better develop and relate policies aimed at benefitting both groups.

19
These results lead to the final section, which provides recommendations to further develop the
bond between local farmers and dining operators.
Production: Farmer Survey
In order to evaluate the characteristics of the current local food system in the Durham
area, this study uses a farmer survey to assess where farmers are currently marketing products,
what products are being marketed, and future opportunities for marketing. The survey
(Appendix A), contained 18 questions eliciting background information, market information, and
production techniques. Background information was used to get a baseline for the sample and
describe the group of farmers participating in the local food system. Questions covered physical
make-up of the farm, location, income, age, gender, type of products and percentage of each
product. Market information was used to understand current and future marketing opportunities,
as well as marketing phrases used to distinguish products. Lastly, information on production
techniques was used to understand what farmers’ perceptions of sustainable farming are at an
individual level.
The survey was hand delivered and in most cases returned the same day as administered.
The purpose of this technique was to insure a high percentage of respondents returning the
survey. Since the sample size of small farmers participating in the local food system is already
relatively limited, especially in the geographic area under study, it was important to take
measures to ensure an appropriate sample of farmers were surveyed. Small farmers, by nature,
are a busy population demographic, as they are generally performing much of the farm work
without a lot of help. In addition, small farmers tend to be harder to identify, as many do not
have websites, which ruled out internet and e-mail techniques. Telephone and mail survey’s
techniques were also considered, but due to constraints on time and ensuring a high response
20
rate, in person delivery of surveys was used. Farmers’ markets are a centralized place where
small farmers participating in the local food system gather, two criteria important for the survey;
and so it was decided to be an appropriate venue for making contact.
By choosing this sampling method, a number of limitations were placed on the data, and
a number of biases were introduced. For instance, the farmers at the market may not be entirely
representative of the small farming community in the Durham area. The trade-off is they all are
participating in the local food system, by nature of participating in the market. Farmers’ markets
are a popular place for farmers to connect with customers and are a mainstay of the local food
system. Since 100% of the sample is using the farmers’ market to market their products to
consumers, the survey assesses markets for products in addition to the farmers’ market. Another
important piece of the puzzle for the assessment was the opportunities farmers were interested in
pursuing in the future.
Four farmers’ markets were chosen as sites to administer the survey, based on their
physical proximity to the Duke University Campus.
Durham Farmers’ Market: 501 Foster Street, Durham, NC 27701
o Survey Administered: July 19, 2008
o Distance from Duke: 2.5 miles
o Farms no more than 70 miles away
Carrboro Farmers’ Market: 301 W. Main Street, Carrboro, NC 27510
o Survey Administered: August 13, 2008
o Distance from Duke: 14.6 miles
o Farms no more than 50 miles away
Orange County Farmers’ Market: 306 E. Revere Road, Hillsborough, NC 27278

21
o Survey Administered: August 16, 2008
o Distance from Duke: 13.5 miles
o Farms no more than 50 miles away
Hillsborough Farmers’ Market: 128 N. Churton Street, Hillsborough, NC 27278
o Survey Administered: August 16, 2008
o Distance from Duke: 12.7 miles
o Farms no more than 50 miles away
Consumption: Dining Interviews
In order to evaluate the current use of local food in the dining system, the study employed
interviews of dining operators on campus that could potentially incorporate local food resources
into their operation. Interviews were conducted over the phone, with support from the Duke
Dining Director. Of the 32 “eateries” on campus, operations that are under the control of Dining
Services, ten interviews were conducted based on one criterion: the ability to utilize local food in
the operation. The study assumes that not all operation were able to utilize locally purchased
goods, e.g. coffee and bagel shops, McDonalds, etc. The number of interviews hides the fact that
some owners have multiple operations on campus. For instance, the Alpine Atrium, Alpine
Bagels, and Alpine Café all share the same owner, and as such, share similar purchasing policies.
The Compass Group, whose company Bon Appétit is the largest food contractor on campus,
operates The Marketplace, The Great Hall, The Freeman Center for Jewish Life, Chick-fil-A,
Subway, and Trinity Café, which makes up almost 80% of the total annual food budget at Duke.
The interesting thing about Bon Appétit is that certain operations utilize local purchasing, while
the traditional chain operations under their control do not (i.e., Subway and Chick-fil-A). Other

establishm
interview
T
than a str
policies a
gain kno
barriers t
purchasin
agricultu
around th
programs
liability,
sample o
certified
menus, a
1998).
Table 3:
ments that d
wed as likely
The interview
rict survey th
as they saw
owledge into
to purchasin
ng identified
ure products
he country, a
s. Barriers i
labor, storag
of universitie
organic, of
and offering
Common Re
do not serve
y candidates b
ws of the din
hough, I wan
fit, and as t
o the amoun
ng locally for
d by Johnso
in universi
and illumina
identified at
ge, and com
es incorpora
ffering food
local food
equirements
e food, such
because they
ning manage
nted owners/
the conversa
nt of local
r food mana
on and Stev
ity food ser
ates many of
universities
mmitments (J
ating local fo
d directly fro
from the in
for Procure
22
h as the Duk
y do not serv
ers were bas
/managers to
ation allowe
purchasing
agers. The in
venson (199
rvice operat
f the opportu
included: p
Johnson & S
ood and foun
om a few s
ndustrial dist
ment at Univ
ke Coffeehou
ve prepared
sed on the sa
o be able to
ed. The purp
taking plac
nterview foc
98). This s
tions, highlig
unities and ba
rices, conve
Stevenson, 1
und four app
small farms
tribution sys
versities (Jo
use and Que
foods at tho
ame set of q
elaborate on
pose of the
ce, as well
cused on the
study focuse
ghts a num
arriers facing
enience of on
998). The s
proaches bein
s, offering l
stem (Johns
ohnson and S
enchers wer
se operation
questions. R
n their purch
interview w
as the perc
e barriers to
es on sustain
mber of prog
g farm-to-co
ne stop shop
study looked
ng used: off
ocal food th
on & Steve
Stevenson, 1
re not
ns.
Rather
hasing
was to
eived
local
nable
grams
ollege
pping,
d at a
fering
heme
nson,
998)

23
One observation of note is that the interviews of establishments that used locally sourced
products in their operations were more extensive than those that had not, because they were more
aware of the system, and more able to elaborate on the questions directed for the study. As such,
the discussion of barriers in the system is biased toward operators who utilized local purchasing
policies because they were better able to discuss the issues.
Results: Production
In order to survey the local food system in the Durham area, 29 surveys were handed out
at the Durham Farmers’ Market, with 22 surveys completed; 18 surveys were handed out at the
Carrboro Farmers’ market, with 15 surveys completed; 11 surveys were handed out at the
Hillsborough Farmers’ market, with 8 surveys completed; and 7 surveys were handed out at the
Orange County Farmers’ market, with 5 surveys completed. A total of 65 surveys were
administered at the four farmers’ markets, and 50 were completed for a 77% response rate.
Those farmers who choose not to participate in the survey stated two main reasons for not
returning the survey: (1) they did not have time to complete the survey during the length of the
market (either due to being busy, or being uninterested in completing another survey), or (2) they
felt they could not provide all of the requested information and hence chose not to answer any
questions.
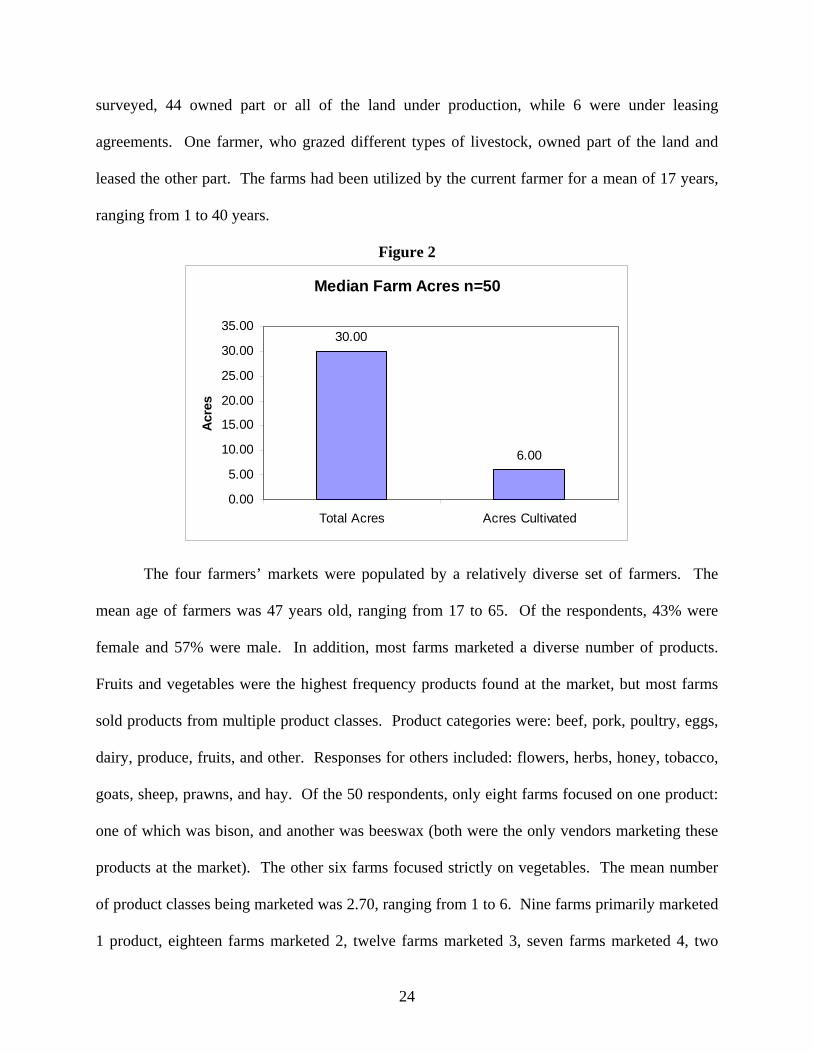
The median farm size for the sample was 30 acres, with a range of .3 to 1100 acres. A
number of large farms focusing on livestock skew the mean farm size of the population, which is
why the median is reported. The median cultivated acres were 6 acres, with a range of .25 to 800
acres. The large range of farm sizes is explained by the types of farms, and the methods of
farming. The eight largest farms surveyed were farms that utilized grazing techniques for cattle,
bison, goat, sheep, and/or pigs (in their case, cultivated meant grazed). Of the 50 farmers
24
surveyed, 44 owned part or all of the land under production, while 6 were under leasing
agreements. One farmer, who grazed different types of livestock, owned part of the land and
leased the other part. The farms had been utilized by the current farmer for a mean of 17 years,
ranging from 1 to 40 years.
Figure 2
The four farmers’ markets were populated by a relatively diverse set of farmers. The
mean age of farmers was 47 years old, ranging from 17 to 65. Of the respondents, 43% were
female and 57% were male. In addition, most farms marketed a diverse number of products.
Fruits and vegetables were the highest frequency products found at the market, but most farms
sold products from multiple product classes. Product categories were: beef, pork, poultry, eggs,
dairy, produce, fruits, and other. Responses for others included: flowers, herbs, honey, tobacco,
goats, sheep, prawns, and hay. Of the 50 respondents, only eight farms focused on one product:
one of which was bison, and another was beeswax (both were the only vendors marketing these
products at the market). The other six farms focused strictly on vegetables. The mean number
of product classes being marketed was 2.70, ranging from 1 to 6. Nine farms primarily marketed
1 product, eighteen farms marketed 2, twelve farms marketed 3, seven farms marketed 4, two
Median Farm Acres n=50
30.00
6.00
0.00
5.00
10.00
15.00
20.00
25.00
30.00
35.00
Total Acres Acres Cultivated
Acr
es

25
farms marketed 5, and one farm marketed 6. The farms that marketed four products or greater
generally had fruits and vegetables with some combination of meat or eggs as well.
Figure 3
Figure 4
An attempt was made at quantifying the percentage of income that was derived from each
product. Of those vegetable producers who responded to that particular question, 66.67% of
produce farmers, vegetables made up 66.25% of total farm income. Produce was the most
commonly marketed product, and it was also a high proportion of the farmer’s total income. Of
Frequency of Individual Products n=50
7 58
18
2
42
26 24
05
1015202530354045
Beef
Pork
Poultr
yEgg
sDairy
Produc
e
Fruits
Other
Nu
mb
er o
f F
arm
s
Frequency of Products Marketed n=50
9
12
7
2 1
18
0
5
10
15
20
1 2 3 4 5 6
Number of Products Marketed
Nu
mb
er o
f F
arm
s

26
those beef producers who responded to the question, 57% of beef farmers, beef made up 72.5%
of total farm income. Those farms that focused on raising steer, tended to rely mainly on beef
for on-farm income, which is likely due to the amount of effort that goes into maintaining a herd
of cows. Of those pork farmers who responded to the question, 40% of pork farmers, pork made
up 12.5% of total farm income. Pork farmers generally had a diverse set of products contributing
to total on-farm income. Of those poultry farmers who responded to the question, 37.5% of
poultry farmers, poultry made up 36.7% of total on-farm income. Of those egg farmers who
responded to the question, 61.1% of egg farmers, eggs made up only 7.9% of total on-farm
income, which suggests eggs were a source of side income rather than a main source of income.
Of those dairy farmers who responded to the question, 100% of dairy farmers, dairy contributed
97.5% of total on-farm income. The dairy farm result is consistent with the beef farm result, as
managing a herd of dairy cows requires a substantial effort. Of those fruit farmers who
responded to the question, 61.5% of fruit farmers, fruit contributed 25.65% of income, and was
generally paired up with vegetable farms. Those farmers that raised both fruit and vegetables
derived a larger percentage of income from the latter. Lastly, those farmers’ marketing other
products who responded to the question, 66.67% of farmers, the other category represented
39.6% of total on farm income. Table 4 and Figure 5 summarize this information.
Table 4: Percentage of Total Farm Income
Item (# of respondents)
% of respondents
% of Income
Beef (4) 57.1 72.5
Pork (2) 40.0 12.5 Poultry (3) 37.5 26.7 Eggs (11) 61.1 7.9 Dairy (2) 100.0 97.5
Produce (28) 66.7 66.3 Fruit (16) 61.5 25.7
Other (16) 66.7 39.6

27
Figure 5
Total on farm income was also estimated by providing eleven income ranges to choose
from starting with less than $5,000 and ending with over $200,000. Figure 6 summarizes the
income data. The two largest categories were $25,000-$34,999 (27%) and <$5,000 (22%). The
data varied greatly between farmers’ markets: Durham Farmers’ market farmers had the highest
income frequency in the category $50,000-$74,999; Carrboro Farmers’ market farmers had the
highest income frequency in the category $25,000-$34,999; Hillsborough Farmers’ market
farmers had the highest income frequency in the category >$5,000; and the Orange County
Farmers’ market farmers had more in the lower income ranges than higher income ranges.
Interestingly enough, Hillsborough and Orange County Markets had the highest frequency of
farmers with off-farm income, with 100% and 71.4% respectively. The Durham and Carrboro
Markets farmers had off-farm income frequencies of 21.4% and 46.2% respectively. The data
suggest that while Hillsborough and Orange County farmers had less on farm income, they made
up for this with more off-farm income. Farmers at the Durham and Carrboro Markets seem to
rely more heavily on their on-farm income as the greatest portion of their total.
Percent of Total Farm Income
72.5
12.5
26.67
7.9
97.5
66.25
25.65
39.625
0
20
40
60
80
100
120
Beef (4) Pork (2) Poultry (3) Eggs (11) Dairy (2) Produce(28)
Fruit (16) Other (16)

28
Figure 6
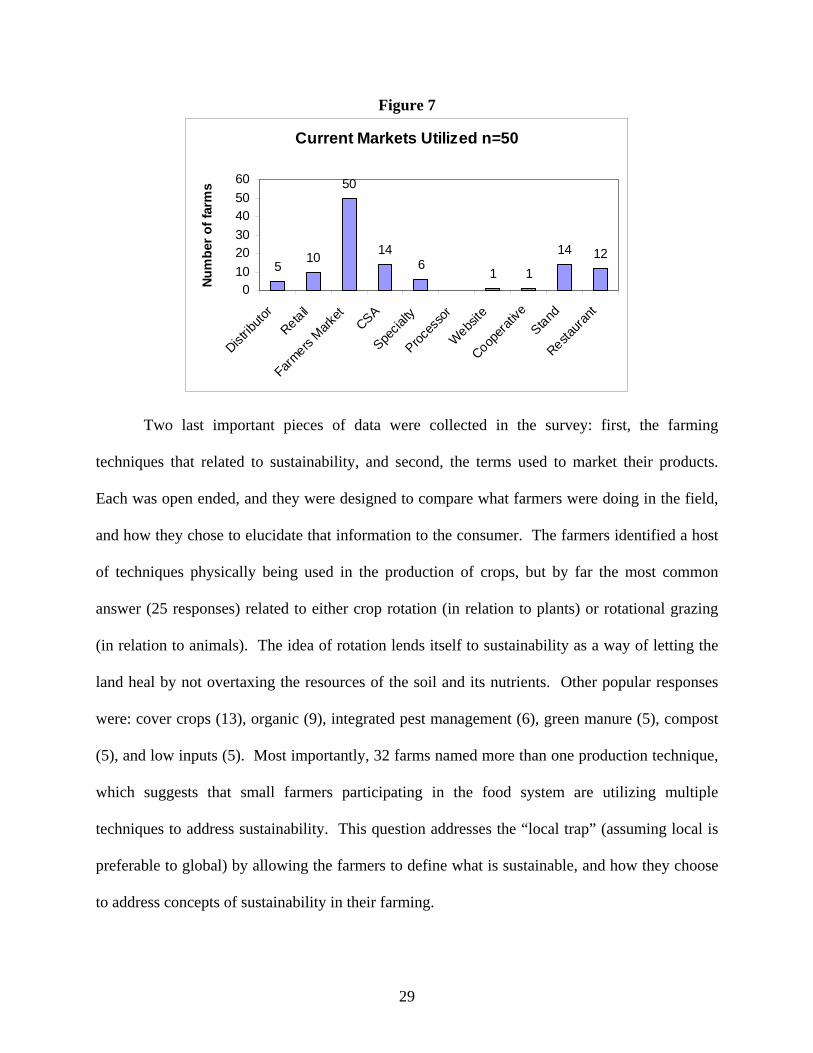
Each farmer surveyed participated in the farmers’ market, which as described in the
methods, was used as a technique designed to increase the survey response rate. Seven farmers
surveyed used the farmers’ market as the sole market for their products. Fourteen farmers also
participated in a Community Supported Agriculture (CSA) program, twelve farmers’ marketed to
restaurants, fourteen sold products directly from the farm, ten used retail outlets, five farms used
a distributor, six used specialty stores, and one each used a website or cooperative. The survey
also elicited information regarding the percentage of income derived from each market, although
the data were inconsistent and difficult to compare. Anecdotally, based on those respondents
who provided this information, the majority derived 50% of more of their farm income from the
farmers’ market, and much less from other markets. This suggests that while farmers are indeed
branching out into new markets and developing new customer relationships, the farmers’ market
is still a vital aspect of the local food system. The data also shows that only twelve farmers were
currently utilizing restaurants as a market for their products, which suggests there could be future
potential for utilizing this opportunity.
On Farm Income n=39
22%
9%
8%
3%27%
5%
10%
8%
5%
0%
3%
<5000
5 ~9999
10~14999
15~24999
25~34999
35~49999
50~74999
75~99999
100~149999
150~199999
>200
29
Figure 7
Two last important pieces of data were collected in the survey: first, the farming
techniques that related to sustainability, and second, the terms used to market their products.
Each was open ended, and they were designed to compare what farmers were doing in the field,
and how they chose to elucidate that information to the consumer. The farmers identified a host
of techniques physically being used in the production of crops, but by far the most common
answer (25 responses) related to either crop rotation (in relation to plants) or rotational grazing
(in relation to animals). The idea of rotation lends itself to sustainability as a way of letting the
land heal by not overtaxing the resources of the soil and its nutrients. Other popular responses
were: cover crops (13), organic (9), integrated pest management (6), green manure (5), compost
(5), and low inputs (5). Most importantly, 32 farms named more than one production technique,
which suggests that small farmers participating in the food system are utilizing multiple
techniques to address sustainability. This question addresses the “local trap” (assuming local is
preferable to global) by allowing the farmers to define what is sustainable, and how they choose
to address concepts of sustainability in their farming.
Current Markets Utilized n=50
510
50
146
1 1
14 12
010
2030
4050
60
Distrib
utor
Retail
Farmers
Mar
ket
CSA
Specia
lty
Proce
ssor
Webs
ite
Cooper
ative
Stand
Restaur
ant
Nu
mb
er o
f fa
rms

30
Figure 8
The largest range of responses from farmers came from the question related to terms used
to market products. The farmers identified 14 different marketing terms, and the majority of
those who responded to the question, 85%, used more than one term to describe their operation.
Half the terms used describe some sort of specific production techniques, or on farm policies,
and the other half of the marketing terms are more broad impressions of farming. Of those
farmers who responded with multiple marketing terms, approximately half used a combination of
broad and detailed terms, while the other half used either broad or detailed terms.
Table 5: Marketing Terms
Marketing Terms n=37 Broad Detailed
Local (23) Free Range (10) Sustainable (11) Pesticide Free (7)
Organic (7) Pasture Raised (4) Fresh (4) Antibiotic Free (2)
Homestead (3) Grass Fed (4) Natural (9) No rBGH (2)
Healthy (2) Heirloom (2)
Frequency of Production Techniques n=36
25
4 4 5
13
3 35
3 41
6 5
96
0
5
10
15
20
25
30
Crop
rota
tion
Polycu
lture
Raised be
ds
Compost
Cover c
rop
Drip Ir
rigat
ion
Passiv
e Sola
r
Low in
put
Mulc
hNo til
l
Biodies
elIP
M
Green
man
ure
Organ
ic
No chem
icals
# o
f F
arm
s

Results:
Bon App
B
is the lar
Trinity C
Subway,
honey fr
Carolina
marketin
locally, t
educating
and usin
service c
their com
and com
Oracle C
Consumpti
pétit
Bon Appétit M
rgest food co
Café on Eas
and Chic-f
om Chapel
Organics (E
ng cooperativ
the food serv
g students, b
ng Monterrey
company at D
mmitment to
mpanies arou
Corporation.
F
ion
Managemen
ontractor on
st Campus,
fil-A on We
Hill, beef f
ECO). It sh
ve that sour
vice compan
buying cage
y Bay Aqua
Duke, Aram
social respo
nd the coun
Figure 9: Lo
nt Company
n campus. A
and The Gr
st Campus.
from Pinetop
hould be no
rces produce
ny addressed
free eggs, h
arium seafoo
mark, in 2005
onsibility, an
ntry includin
ocations of L
31
(Bon Appét
As stated ea
reat Hall, T
Figure 9 s
p, dairy from
ted that EC
e from all ov
d sustainabil
hormone free
od guideline
5. They are
nd they man
ng: Wesleya
Local Purch
tit) is owned
arlier, they o
The Freeman
shows the lo
m Siler city
CO, while lab
ver the state
lity through:
e beef and p
es. Bon Ap
e highly rega
nage dining
an University
hases by Bon
d by the Com
operate The
n Center for
ocations of
y, and produ
beled as Pit
e. In additi
adjusting m
poultry, 100%
ppetit replac
arded within
services at o
y, MIT, Cis
n Appetit
mpass Group
Marketplace
r Jewish Stu
those purch
uce from Ea
ttsboro, is a
on to purch
menus season
% grass fed
ced another
n the industr
other univer
sco Systems
p and
e and
udies,
hases:
astern
food
hasing
nally,
beef,
food
ry for
rsities
s, and

32
Bon Appétit sponsors an “Eat Local Challenge” that requires chefs at its cafes all around
the country to create a meal entirely sourced within 150 miles of the campus. The program is
part of Bon Appétit’s Farm-to-Fork program and their Circle of Responsibility. The Circle of
Responsibility is a corporate level program that takes into account environment, community and
well-being. According to the Circle of Responsibility website, Bon Appetit pursues local
purchasing for three reasons: flavor (food that is grown locally is fresher), environment (impacts
associated with transportation), and community (supporting agricultural heritage).
The benefits of local food procurement and sustainability policies do not carry over into
the franchises under the control of the company. Bon Appetit pays franchising rights to Subway
and Chic-fil-A in order to run these operations at Duke. As such, these two dining
establishments have their own sourcing guidelines and procurement policies, which need to be
abided by. Any customer going into a Subway or Chic-fil-A expects a level of consistency in the
operations that leaves little room for diverse suppliers based on product specifications set forth
by each company. Each company has their own supply chain policies designated in the
franchising agreement, which are followed by the individual store managers.
Refectory
The Refectory at Duke’s Divinity School is making significant strides toward
sustainability, and is the leading local food purchaser at Duke. The dining establishment is
owned and operated by Laura Hall, and is a prime example of Dining Services working with
talented owners to provide a unique dining experience at the university. Local content has to be
at least 35%, although it averages 50% and can reach up to 70% in the summer. Of a total 50
suppliers being used by the operation, 32 suppliers, or 64% are considered local by the owner.
Over the course of the year, a total of 54% of total purchases were made through local farms of

33
vendors. Local purchasing is also diverse in the method of procurement. Some farmers deliver
goods directly to the restaurant, other products occasionally may be picked up by the owner (or
manager), and trips are also made to the farmers’ market to round out procurement, especially in
the summer. The owners stress “sustainable” over “organic,” although they do generally serve
approximately 20% organic ingredients. Organic is a federally defined term, which is regulated
by the USDA, whereas sustainable, in this context, is a broader definition of food that may
include organic, but focuses more on whether the food is local and the individual production
practices of farmers that promote sustainability. Local purchasing encompasses produce, meat,
dairy, and free-range eggs. Other aspects of sustainability include: educating students, adjusting
their menu seasonally, and cooking from scratch while eschewing processed foods. The
Refectory is expanding on Duke’s campus next year as the operator of the cafeteria at the Duke
Law School.
Saladelia
The Perk at Bostock Library is a café, which is operated by Saladelia, a Durham based
company that has its main café location on University Drive. The café serves coffee, soups,
salads, and sandwiches. The company currently has six local suppliers that provide just fewer
than 30% of total purchases. The two largest product classes sourced locally are produce and
eggs. In addition to local purchasing, the company addresses concerns over sustainability
through hormone and antibiotic free meat, wild caught seafood, fair trade coffee, and educating
consumers. Saladelia has developed reciprocal relationships with farmers as well, by sending
compostable food scraps to a local farm for composting.

34
Nasher
The Nasher Café is owned and operated by Giorgios Hospitality Group, a company that
operates six other restaurants in the Durham area. The café uses 13 local food suppliers for
meat, eggs, and vegetables, as well as two other local suppliers of baked goods. While I am still
waiting for individual numbers from the manager on the percentage of total purchases, the
companies focus on fresh ingredients lends itself well to the local food system. Restaurants
operated by Giorgios Hospitality Group are generally more upscale, sit-down establishments,
and the Nasher is no different. Providing a higher level of service allows the company to pass
any extra costs of procurement on to the consumer.
Tommy’s
Tommy’s Rubs, Grubs, and Suds is a southern barbeque restaurant located in McClendon
Tower, owned by Tom Meyer and Managed by David Dennis. The dining establishment
features locally sourced pork and chicken in their barbeque menu, as well as sweet potatoes and
other locally grown produce. As a traditional North Carolina barbeque restaurant, it is important
to get the style right, but also to use as many ingredients from the state as possible. This
provides the customers with a more complete dining experience.
Faculty Commons
The Faculty Commons is owned and operated by Sage and Swift Catering Company,
which is a Durham-based catering company that also operates Watts Grocery on Broad Street.
The establishment is designed as a place where students and faculty can sit together in order to
foster a greater dialogue between the two groups. By using locally sourced ingredients, the
establishment is connecting customers with farmers as well, and it has a staff that truly seems
excited about the food buying policies.
35
Other Operators
The remaining dining operators interviewed on campus had no local purchasing policies.
Most establishments used US Foodservice, which is one of the largest foodservice distributors in
the country. Interviews with these operators were generally shorter and less informative than
those conversations with other operators for a couple of reasons. First, by having a reliable food
supplier in place that provided for the establishments needs, managers were content with the
service provided. Second, by using one supplier, they generally had less knowledge of where the
food was coming from. Finally, by having less knowledge of the local food system and
relationships with diverse suppliers, they weren’t as able to speak to the barriers of such a
system. Those operators who did source local products were able to speak more constructively
about the system, and the employees of the establishments usually were also well versed in the
purchasing habits of the owners.
Discussion: Production
Survey Implications
Survey respondents were instructed to skip any questions they didn’t want to answer and
stop participating in the survey at any time as they felt comfortable. Some respondents heeded
this advice and chose to skip questions, or stopped the survey half-way through. Of the 50
respondents, five refused to answer a substantial portion of the survey. The resulting responses
were enlightening, but consistent information across each question would have been beneficial.
In addition, while most respondents related the types of products being sold, far fewer
respondents related the relative percentages of each product. A number of explanations may be
found for these inconsistencies, some relating to the distribution technique, and some related to
the survey itself. For instance, farmers’ markets are relatively busy, due to the short time frame

36
(4 hours) and frequency of occurrence (twice per week), which may have affected the answers
provided. Additionally, a few surveys were only filled out on one side, which means some
respondents either forgot or were too busy to complete the whole survey.
One issue that was raised by multiple farmers, which unfortunately was not picked up
under any of the survey questions, was the fact that a number of farmers were unable to keep up
with current demand for their products. During the explanation of survey goals, at the beginning
of administering the survey, was usually when this information was related to the investigator.
This has major implications for the consumer, as well as for the markets that farmers can access.
It is an obvious statement, but a very important one: farmers can only sell what they harvest, and
consumers can only buy what harvest is available every year. The local food system, as shown
in the survey results, is made up of relatively small farms. In order to serve all the existing
markets, one of two things must happen: current farmers need to expand production, or more
farmers are needed to satisfy demand. Looking ahead to the consumption discussion, this issue
is going to have major consequences for food service managers looking to develop relationships
with farmers. Building connections between farmers and food service managers is going to be
vital if managers are going to be able to take advantage of limited supplies.
Another consequence of the local food system, as it is described by the survey, is that
food service managers may need to expand the term local in order to meet their demand
requirements. For instance, Bon Appetit uses Eastern Carolina Organics (ECO) as a produce
supplier for its kitchens, and ECO uses farmers from all over North Carolina as suppliers. ECO
is a food marketing and distribution cooperative based in Pittsboro. The question then becomes:
how do we define local? For this study, a geographical boundary wasn’t set to determine local
from not local, as it was assumed that if farmers were able to service the local farmers’ market,

37
they would be able to service other vendors in the Durham area. It is also beyond the scope of
this research to define, in a strict manner, what the appropriate meaning of local should be for
dining operators at Duke. In this sense, producers and consumers are on a similar footing: both
are looking for options that are broadly thought of as sustainable, rather than a strict sense of
food miles. This seems logical, because sustainability, as defined earlier in the paper, is based on
a set of principles and not a prescribed set of techniques.
Discussion: Consumption
The study conducted by Johnson and Stevenson (1998) at the University of Wisconsin-
Madison identified a number of barriers to instituting local food purchasing policies. During
interviews for this study, managers were asked to identify the barriers that they saw as
influencing the decision to purchase local products. The six categories of barriers identified by
Johnson and Stevenson were: current system, price, one-stop shopping, risk, and commitments.
In the course of conducting interviews of campus operators, this study identified one other
barrier to purchasing locally: availability. Using these categories, operators demonstrated how
they each viewed the local food system, and how that connected to their buying habits.
Current System
The current system argument was the single most common argument made by operators
not purchasing locally, and in every case, it was the main barrier identified. Operators that have
a reliable supplier generally don’t see the need to expand beyond that, as long as their needs are
satisfied. The implication of this barrier is that any recommendations need to be focused on
addressing and overcoming this barrier over the others. Laura Hall, the owner of the Refectory,
also identified this barrier as an important factor. She was aware of the complications of getting
involved in the system, as well as the extra resources needed to manage multiple suppliers
38
(discussed later). Working with farmers entails building relationships, and those establishments
that work with US Foodservice or any other of the large suppliers, already have a relationship
with that company.
The process of branching out requires more management and resources than some
companies are willing to spend. The next section focuses on the barrier of price, but one barrier
that is implicit in the current system argument is the idea of transaction costs. It takes time and
effort to build the types of relationships described in this analysis. The time and effort is an
additional cost to the operator beyond the unit price, but that is incurred by the operator before he
or she can take advantage of local sourcing. The recommendations discussed later are focused
on addressing this fundamental barrier.
Price
Dining establishments on campus are essentially independent operators, which provide a
commission to the Dining Services office in order to conduct business on campus. In that
capacity, operators have to be keenly aware of the bottom line in order to stay profitable at their
locations. Ironically, price was only mentioned by one operator as a barrier to buying local
products. Although it wasn’t identified as the main barrier by many of the operators, this is more
likely a function of other barriers being more important than price, rather than price not being an
issue. The important point that came from talking with Saladelia and Bon Appétit about the
price barrier is that price only becomes a factor when thinking about purchasing in narrow terms.
For most companies that purchase locally (and this came up many times in the discussions), there
was a mutual benefit to both the operator and the farmer. Thinking more broadly about price in
this context, both operators said that it was important to work with the farmers on finding a price
that was beneficial to both parties. By spending that extra effort to work with the farmers,

39
especially within the context of building relationships, the importance of price in many cases
decreased.
One-Stop Shopping
The crux of the one-stop shopping argument is that it is easier to get products from one
supplier than it is to get products from multiple suppliers. The extra time involved in managing
multiple suppliers was brought up by both The Refectory and Saladelia. These two operators are
interesting because The Refectory has thirty plus suppliers, and Saladelia has six suppliers.
Laura Hall mentioned that time management was a reason she felt other operators may be
unwilling to source locally, and Saladelia provided it as a reason it did not purchase more locally.
In the case of the Refectory, Hall enjoys the challenge of managing a large number of suppliers,
and her commitment to sustainability is built into the vision of her restaurant. The vision and
goals of a company are what drives purchasing policies, and it is the reason why the Refectory
and Bon Appetit are enjoying success at the university. In the interview with the dining director,
he made is clear that the initial impetus for seeking a new operator to run the largest part of the
dining operations (The Marketplace, The Great Hall, etc.) was finding an operator whose goals
and vision matched up with the goals and vision he had for dining services.
Risk and Uncertainty
The University of Wisconsin study found that many universities had a minimum
requirement for liability insurance for suppliers of food to dining operations. In conversations
with the Dining Director, this requirement was not apparent at Duke, and by the amount of local
purchasing that is currently occurring, it would seem that this is not a deterrent. In fact, no
operators discussed risk as a significant barrier to sourcing locally. In a general sense, risk is tied
into the fact that many operators choose to stick with one large supplier, as there can be greater

40
uncertainty in developing an unfamiliar system. On the other hand, having a less diverse
supplier base can be riskier than having multiple suppliers, especially if one supplier gets into
trouble. In the conversation with Chef Marconi of Bon Appétit, he related that in his view, risk
was not a barrier because working with farmers provided numerous benefits. Keeping food
safety in mind is important, in his view, especially for washing produce and other items, but the
benefits of having fresh ingredients outweighed many risks.
Commitments
A vicious cycle was identified by Johnson and Stevenson (1998), wherein farmers want
commitments from food operators before planting to ensure they have a market for their product
and operators are often unwilling to make such commitments as they are generally worried about
production risks. In the event of a natural disaster that wipes out a crop, operators would be in
an unfortunate situation. In that system, farmers would be unwilling to plan the harvest around
operator’s needs, and products would be unavailable for operators when they need them. Chef
Marconi was keenly aware of the commitments needed, both from his experience at Duke and
previous work experiences. In the past, he worked with farmers during the production season, as
well as purchasing from farmers’ markets, but he suggested that working with farmers before the
planting season can be an ideal model for building relationships.
From the experience that farmers have over many growing seasons, they are keenly
aware of the amount of harvest their land can produce for each product. In addition, they have
built a positive track record by successfully harvesting year after year. By the same token, food
service managers are also aware of their seasonal needs through providing service at the
university, which is relatively uniform year to year, as the number of students, staff and faculty
remains fairly consistent. By utilizing that knowledge, food service managers can plan for their

41
own demands throughout the year and work with the farmers to develop a mutually beneficial
relationship.
Availability
The issue of availability is one that came up in a number of conversations with food
service managers, and is also a major impetus for this research. In order for food service
managers to adopt local buying policies, there needs to be an adequate supply of local food to be
purchased. In the Durham area, the local food system is growing, and expanding into new
markets, as shown by the farmer survey. Bon Appétit is in the process of establishing new
relationships with farmers in order to expand their supply of local food in coming years.
Saladelia related that it would be willing to use more suppliers if there was a greater availability
of products.
Operator Current System Costs
Number of
Suppliers Risk Commitment Availability Alpine X Armadillo X Compass * X X Faculty Commons * Gracie's X Nasher * Refectory * X X Saladelia (Perk) * X X X Tommy's * Twinnies/Blue Express X
* Indicates operators with local food purchasing policies established
Recommendations
The recommendations can form one large program or campaign revolving around locally
produced food in NC, or each can be taken individually as initiatives to support green dining
activities at the university. Each recommendation is an idea that is focused on either providing
an incentive for operators to purchase locally, or making it easier for farmers and food service

42
operators to interact. Based on the key requirements identified by Johnson and Stevenson, there
are costs to both the university and to the farmer in order to connect the two. The
recommendations are provided to help diminish those costs, or offset the costs associated with
local purchasing.
(1) Adjust PACE scoring to provide incentives for buying local product – In Greg Andeck’s
inventory of green dining at Duke, adjusting the PACE scoring system was one the main
recommendations associated with each category. It is also the “low-hanging fruit” as it costs the
university very little to adjust the system and operators have an incentive to follow the system in
order to thrive in this environment. Reviews of the scoring and weighting of the categories takes
place yearly, and responds in part to student demand, as well as other factors. Student
preferences can be passed along through the Student Dining Advisory Committee, a Student
Government committee that connects dining administrators (Jim Wulforst) with students. The
members of this committee are also part of the process that provides reviews of the operations as
part of the PACE program.
The addition of a local food purchasing provision in the scoring would allow operators to
decide whether it is in their interest to purchase locally and make purchases that are appropriate
to their facility, without providing an unnecessary cost burden to do so. The scoring system
allows the operator different options for incorporating sustainability into their operations,
sourcing locally would be one of those options. Another provision of the PACE system that
could influence the implementation of sustainability measures is the monetary incentives given at
the end of each year. This monetary incentive can help operators offset any extra costs associated
with implementing sustainability measures, such as sourcing locally.

43
Local purchasing policies could be added into the PACE program in other ways as well.
Currently, each category in the PACE system has a number associated with it, and you score
points in that category if you comply. For example, an operator can get seven points for using
unbleached napkins, but gets zero points in that category if they use do not use this type of
napkin. Another more flexible way to apply the scoring in the PACE system could be to provide
dining operators with a list of greening activities, from which they could choose to implement a
predetermined number, based on their needs and resources. In this situation, the operator would
get a certain number of points depending on how many greening activities they implemented,
and they have the flexibility to choose which activities are appropriate to their operation.
(2) Dedicated staff position – Any university involvement in green dining or work
facilitating farmers and food service operators is going to require a staff person focused on these
issues. Greg Andeck offered up this suggestion in his MP, and subsequent to that, the duties of
green dining coordinator were defined by Dining Services and given to one of the current
employees. I offer up this recommendation again because the duties were given to the current
Quality Assurance Specialist, and the dining director made mention during the interview that the
portion of time being allocated to greening activities is trumped by the current duties required of
that position. A dedicated staff member is one that can budget the majority or their time to green
dining.
(3) Connect food managers with farmer – Developing relationships between dining operators
and farmers is essential to breaking down many perceived barriers, such as quality, quantity, and
reliability. It has the added benefit of illuminating local production resources that dining
operators may be unaware of. In that sense, connecting these two groups does two things: 1) it
allows dining operators to become knowledgeable about what farmers in the area can provide

44
and how they provide it; and 2) it allows farmers to become more knowledgeable about what the
dining operators are looking for in terms of quality and selection. Connections can be made in
two ways, by organizing a university forum that includes farmers and operators or organizing
farm tours for operators to see how the farm systems work. The idea is building relationships,
and ideally both methods would be pursued, as they are directly related.
(4) Duke facilitated farmers’ co-operative – Duke cannot lower the direct costs associated
with purchasing local food, but it can lower the transaction costs for dining operators to purchase
from farmers. The idea behind the university supported co-operative is that the university helps
a group of farmers form a co-operative, and in return, the co-operative has an established market
ready to purchase their products. As an example of the effectiveness of co-operatives, Bon
Appetit uses ECO as a source for produce instead of sourcing from multiple produce growers in
the area. In many cases, farmers are going to need to collaborate in order to overcome
institutional barriers. University involvement or support of this type of collaboration would
ensure the co-op has a guaranteed market once formed, and ensure the co-op is focused on the
university as a supply partner.
A co-operative that is supported by or facilitated by the university is also a natural step
forward after the connections have been developed from recommendation number 3. Once the
connections/relationships have been developed wherein both sides have an interest in moving
forward, a co-operative is a structure that helps overcome a number of barriers identified by the
operators in this study.
Challenges
The most important test of whether a program or initiative can be effective is whether or
not it is feasible, or in other words, if a program is not feasible to implement, then it is not worth

45
pursuing. The most important aspects of feasibility for the sake of these recommendations are
economic feasibility and organizational feasibility. Economic feasibility is concerned with the
return on investment from such a project (do the benefits outweigh the costs) and organizational
feasibility is concerned with whether the structure of the system is amenable to such a program.
Economic Feasibility – As alluded to throughout this analysis, the direct economic costs of
purchasing local food can be higher than that of traditional procurement. Many food service
operators are willing to work with farmers to reach a mutually beneficial agreement on
prices. Nevertheless, costs are incurred on both the producer side (farmers) and consumer
side (university), which are both addressed through the recommendations. Opportunities
exist at the university, through offsetting costs with incentives and lowering transaction costs
by building relationships, which can increase the economic feasibility of such a project.
Operational Feasibility – Two aspects of the system structure may affect the organizational
feasibility of the recommendations: franchise procurement policies, and the system of
contract management. Franchise procurement policies require restaurant chains operating at
the university such as McDonalds, Chick-fil-A, and Subway, to use particular food service
companies for purchasing. Franchise arrangements leave less room for changing
procurement policies than individually owned operations. The system of contract
management, as opposed to the pre-1997 system of Dining Service operated facilities, makes
it difficult for the university to apply across the board policies related to procurement. Many
of the colleges analyzed by Johnson and Stevenson (1998) were relatively small and still
operated their own facilities, which made it easier for the university to exert influence. The
existence of the PACE Program, in my view, provides the leverage the university needs to
make appropriate changes.

46
The feasibility and practicality of these recommendations hinges lastly on the priorities of
Dining Services, which is in turn influenced by student pressure and demand. As mentioned
earlier, green dining has remained a high priority item for Dining Services, but the PACE scoring
system fails to properly address green dining issues. I have met with Jim Wulforst, the dining
director, and he is highly open to student engagement and activity in the realm of dining
management. The original resistance I encountered when approaching this issues was a function
of how busy Dining Services employees remain during the year, and not a function of lack of
interest. In addition to his work at Duke, Jim travels and speaks extensively to other universities
and institutional dining operators interested in the PACE Program. It is a novel program and
ahead of the curve in many respects compared to other institutional systems. I cannot stress
enough the importance of student involvement in any changes. The success of the Refectory,
which markets itself as an environmentally-friendly eatery, and sources a greater percentage of
its food locally than the other operators, illustrates that there is a demand for locally sourced food
on campus. Jim evaluates the system and makes changes on a yearly basis based on student and
employee input. Feasibility rests as much on student demand, as on any other factor. If the
students demand local, Dining Services will respond to the request.

47
Appendix A: Farmer’s Market Survey
Farmer Survey of Market Trends Privacy Statement: Hi, my name is Carl Chamberlin, I am a Master’s student at Duke University, and I am hoping you would consider participating in a survey on markets for farm products. This survey is part of the research for my Master’s Project at Duke University, and is intended to help identify the current markets being served by small farmers. It also will be used to determine if other markets exist that could be utilized in the future. I will not record your name or the name of the farm, so the survey will be confidential. The survey should take no more than 5 minutes. Please feel free to skip questions or stop at any time. Here is my card so you can contact me if you have any future comments of concerns, please contact Carl Chamberlin, [email protected], with any questions about this study. Thank you for your participation.” 1. How many acres comprise your farm? __________
2. How many acres are actively cultivated? __________
3. Is the land owned or leased? Circle one: Owned Leased
4. What year did you start farming? __________
5. What items do you produce? Check all that apply: __Beef __Dairy __Pork __Vegetables __Poultry __Fruits __Eggs __Other __________ 6. What is the annual gross income from farming activities? __less than $5,000 __$25,000 to 34,999 __$100,000 to 149,999 __$5,000 to 9,999 __$35,000 to 49,999 __$150,000 to 199,999 __$10,000 to 14,999 __$50,000 to 74,999 __$200,000 or more __$15,000 to 24,999 __$75,000 to 99,999 7. What is the annual gross income for the entire household? __less than $5,000 __$25,000 to 34,999 __$100,000 to 149,999 __$5,000 to 9,999 __$35,000 to 49,999 __$150,000 to 199,999 __$10,000 to 14,999 __$50,000 to 74,999 __$200,000 or more __$15,000 to 24,999 __$75,000 to 99,999

48
8. Please list other sources of farm income that may apply, i.e. government payments, agritourism, bed and breakfast, etc. 9. What year were you born? __________ 10. What is your gender? __________ 11. What county do you farm in? __________ 12. Please list all production techniques used in regards to sustainability or conservation, i.e. polyculture, crop rotation, low inputs, IPM, etc. 13. What percent (estimation) of income is derived from each product sold? ____Beef ____Dairy ____Pork ____Vegetables ____Poultry ____Fruits ____Eggs ____Other __________ 14. Where are products marketed or sold? Check all that apply: __Distributor/wholesaler __Processor __Retailer __Website __Farmers’ market __Cooperative __CSA __Farm Stand __Specialty Store __Other _________ 15. What percentage of income (estimate) is derived from each venue? __Distributor/wholesaler __Processor __Retailer __Website __Farmers’ market __Cooperative __CSA __Farm Stand __Specialty Store __Other _________ 16. What other option may exist for marketing that aren’t being utilized?

49
17. List phrases used to market different products, i.e. organic, natural, free-range, local, sustainable, etc. 18. Do you perform value added processing? If so, please list types.
Appendix B: Dining Operator Question
1. Does your establishment purchase any ingredients from local sources?
2. Does your establishment have a local food policy?
3. If so, can you provide any figures on the number of supplier?
4. If so, can you provide any figures on the percentage of total purchases?
5. What do you perceive as barriers to purchasing directly from farmers?

50
Works Cited Altieri, M. (2002). Agroecological Principles for Sustainable Agriculture. In N. Uphoff (Ed.),
Agroecological Innovations: Increasing Food Production with Participatory Development. Sterling, VA: Earthscan Publishing Ltd.
Bartlett, P., & Chase, G. (Eds.). (2004). Sustainability on Campus: Stories and Strategies for
Change. Cambridge, MA: The MIT Press. Born, B., & Purcell, M. (2006). Avoiding the local trap - Scale and food systems in planning
research. Journal of Planning Education and Research, 26(2), 195-207. Brundtland Commission. (1987). Our Common Future. Retrieved July 18, 2008, from
http://www.un-documents.net/wced-ocf.htm Cohn, Gerry. (2007). Discussion of trends in NC agriculture. Personal communication, June
2007. Community Food Security Coalition. (2005). Farm-to-College. Retrieved July 18, 2008, from
www.farmtocollege.org. Dahlberg, K. (Ed.). (1993). Regenerative Food Systems: Broadening the Scope and Agenda of
Sustainability. New York: John Wiley & Sons. Dupuis, E., & Goodman, G. (2005). Should we go “home” to eat?: toward a reflexive politics of
localism. Journal of Rural Studies. 21, 359-371. Feenstra, G. (2002). Creating space for sustainable food systems: Lessons from the field.
Agriculture and Human Values, 19(2), 99-106. Grey, M. (2000). The Industrial Food Stream and its Alternatives in the United States: An
Introduction. Human Organization, 59(2), 143-150. Goodman, D. (2002). Rethinking Food Production-Consumption: Integrative Perspectives (Vol.
42, pp. 271-277). Hinrichs, C. C. (2003). The practice and politics of food system localization. Journal of Rural
Studies, 19(1), 33-45. Holloway, L., Kneafsey, M., Venn, L., Cox, R., Dowler, E., & Tuomainen, H. (2007). Possible
food economies: A methodological framework for exploring food production-consumption relationships. Sociologia Ruralis, 47(1), 1-19.
Horrigan, L, Lawrence, R., & Walker P. (2002). How Sustainable Agriculture Can Adress the
Environmental and Human Health Harms of Industrial Agriculture. Environmental Health Perspectives. 110, 445-456.

51
Jarosz, L. (2008). The city in the country: Growing alternative food networks in Metropolitan
areas. Journal of Rural Studies, 24(3), 231-244. Johnson, D., & Stevenson, G. (1998). Something to Cheer About: National Trends and Prospects
for Sustainable Agriculture Products in Food Service Operations of Colleges and Universities: The Center for Integrated Agricultural Systems, University of Wisconsin-Madison.
Kloppenburg, J., Hendrickson, J., & Stevenson, G. W. (1996). Coming in to the foodshed.
Agriculture and Human Values, 13(3), 33-42. Kloppenburg, J., Lezberg, S., De Master, K., Stevenson, G. W., & Hendrickson, J. (2000).
Tasting food tasting sustainability: Defining the attributes of an alternative food system with competent, ordinary people. Human Organization, 59(2), 177-186.
La Trobe, H. L., & Acott, T. G. (2000). Localising the global food system. International Journal
of Sustainable Development and World Ecology, 7(4), 309-320. Martinez, S, et al. (2010). Local Food Systems: Concepts, Impacts, and Issues. US Department
of Agriculture, Economic Research Service. ERR 97. O'Hara, S. U., & Stagl, S. (2001). Global food markets and their local alternatives: A socio-
ecological economic perspective. Population and Environment, 22(6), 533-554. Pirog, R., Pelt, T. V., Enshayan, K., & Cook, E. (2001). Food, Fuel and Freeways: An Iowa
perspective on how far food travels, fuel usage, and greenhouse gas emissions: Leopold Center for Sustainable Agriculture.
Pothukuchi, K. (2004). Community Food Assessment: A First Step in Planning for Community
Food Security (Vol. 23, pp. 356-377). Selfa, T., & Qazi, J. (2005). Place, Taste, or Face-to-Face? Understanding Producer–Consumer
Networks in “Local” Food Systems in Washington State. Agriculture and Human Values, 22(4), 451-464.
Sobal, J., Kettel Khan, L., & Bisogni, C. (1998). A conceptual model of the food and nutrition
system. Social Science & Medicine, 47(7), 853-863. Strohbehn, C., & Gregoire, M. (2004). Local Food: From Farm to College and University
Foodservice. Journal of Foodservice Management and Education, 1(1). Sustainable Endowment Institute. (2008). College Sustainability Report Card. Retrieved July
18, 2008

52
ULSF. (1990). The Talloires Declaration. Retrieved July 18, 2008, from http://www.ulsf.org/programs_talloires_td.html
Vallianatos, M., Gottlieb, R., & Haase, M. A. (2004). Farm-to-School: Strategies for Urban
Health, Combating Sprawl, and Establishing a Community Food Systems Approach (Vol. 23, pp. 414-423).
Weber, C. L., & Matthews, H. S. (2008). Food-miles and the relative climate impacts of food
choices in the united states. Environmental Science & Technology, 42(10), 3508-3513. Wulforst, Jim. (2007). Discussion of Duke Dining System. Personal communication, October 19,
2007. Vogt, R. A., & Kaiser, L. L. (2008). Still a time to act: A review of institutional marketing of
regionally-grown food. Agriculture and Human Values, 25(2), 241-255.
Recommended