www.TransformingTransportation.org
London's Transport: Delivering
homes, jobs and growth
Shashi Verma, Director of Costumer Experience, TFL, London
Presented at Transforming Transportation 2016
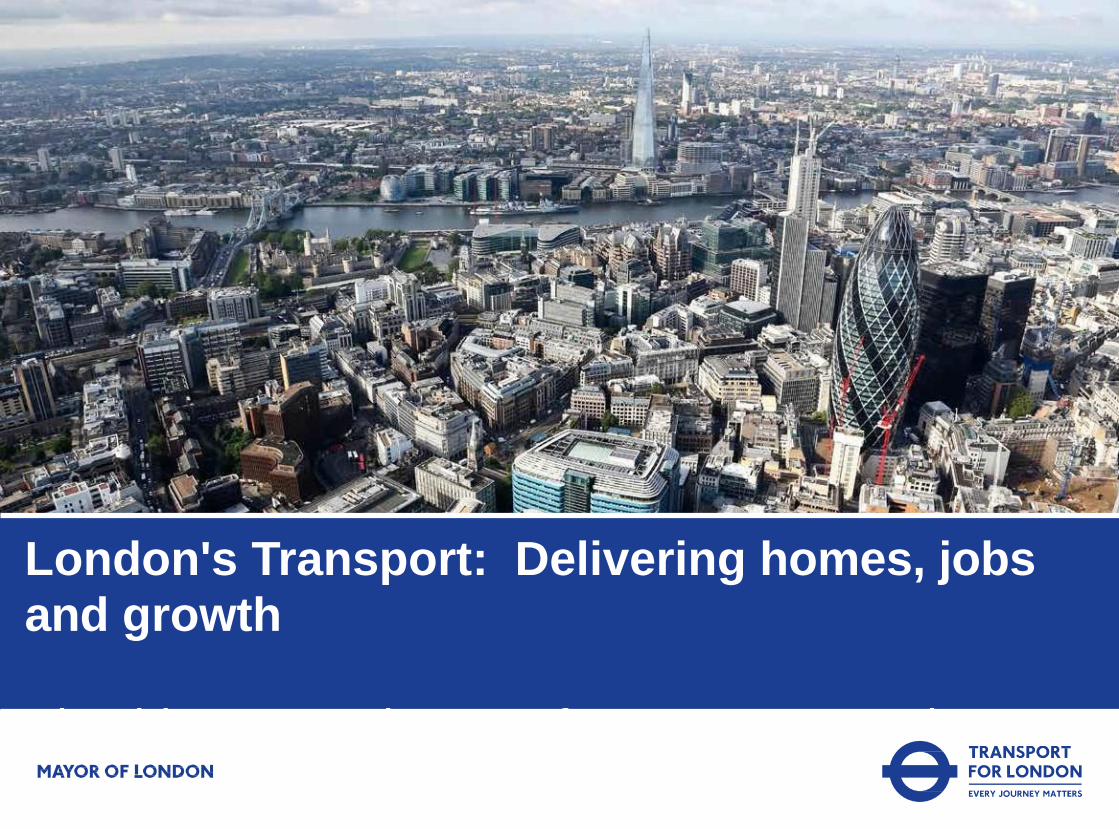
London's Transport: Delivering homes, jobsand growth
Shashi Verma, Director of Customer Experience
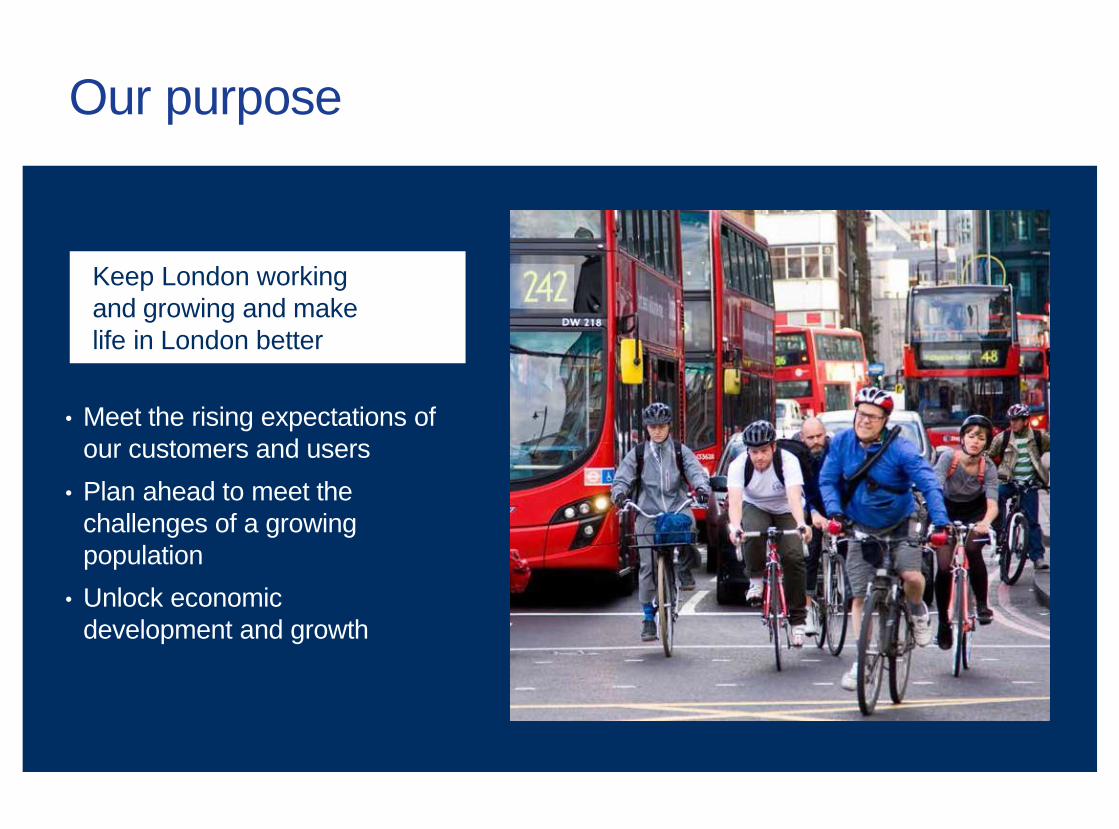
Our purpose
• Meet the rising expectations of
our customers and users
• Plan ahead to meet the
challenges of a growing
population
• Unlock economic
development and growth
Keep London working
and growing and make
life in London better
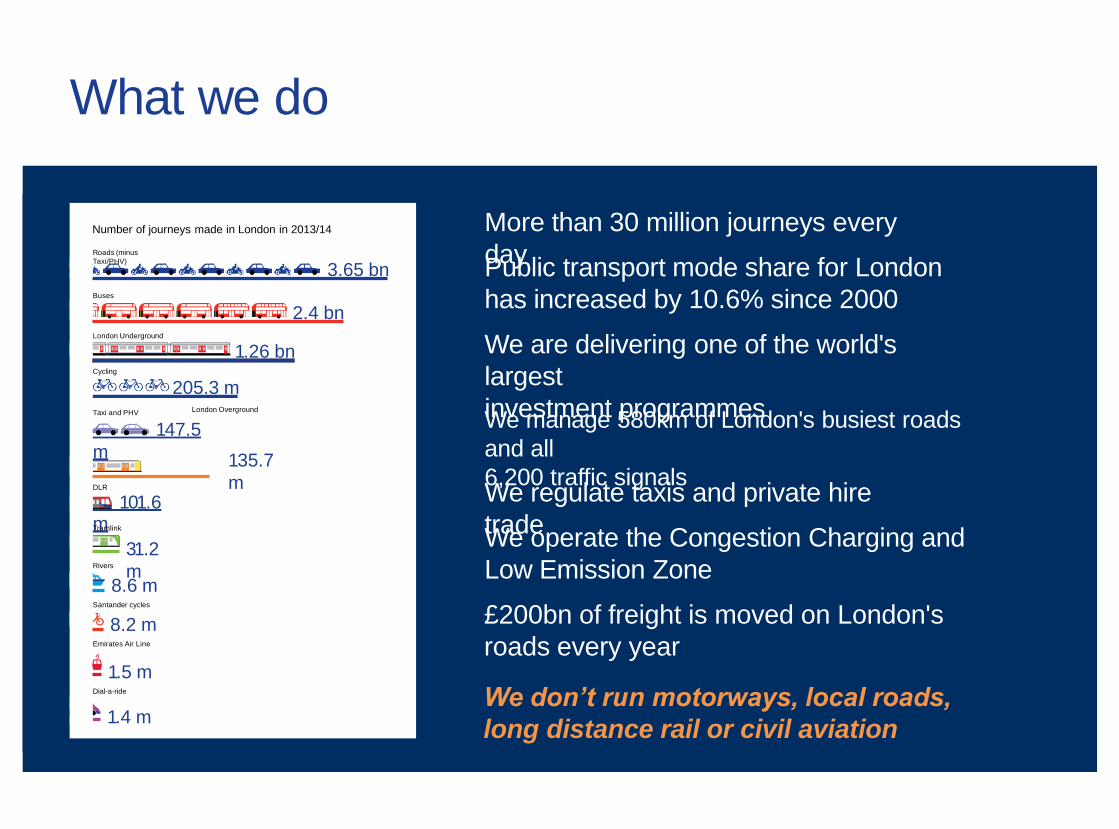
What we do
Number of journeys made in London in 2013/14
2.4 bnBuses
1.5 mDial-a-ride
Rivers
8.6 mSantander cycles
8.2 mEmirates Air Line
DLR
101.6m
205.3 mLondon Overground
135.7
m
Tramlink
31.2
m
1.26 bnLondon Underground
Cycling
Taxi and PHV
147.5
m
3.65 bnRoads (minus
Taxi/PHV)
1.4 m
More than 30 million journeys every
dayPublic transport mode share for London
has increased by 10.6% since 2000
We are delivering one of the world's
largest
investment programmesWe manage 580km of London's busiest roads
and all
6,200 traffic signalsWe regulate taxis and private hire
trade
£200bn of freight is moved on London's
roads every year
We operate the Congestion Charging and
Low Emission Zone
We don’t run motorways, local roads,
long distance rail or civil aviation

Our
Responsibilities

The Role of Mayoral
StrategiesDemocratic accountability and
transparency
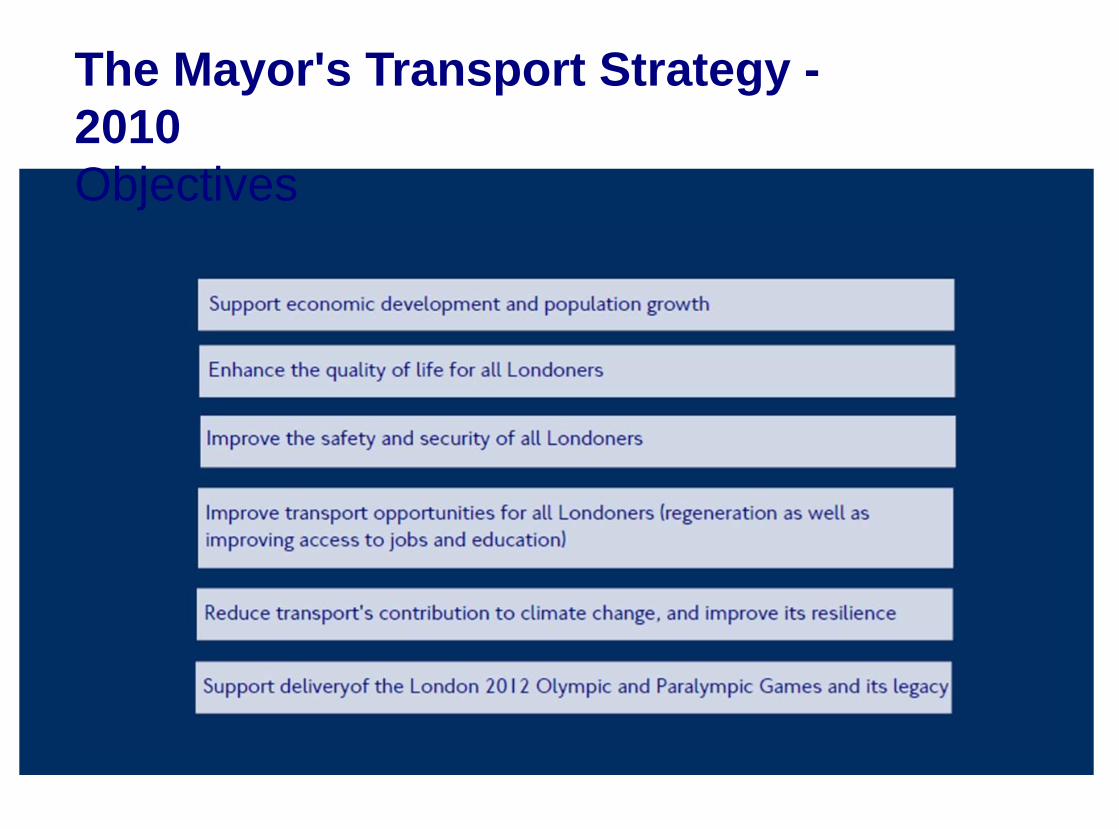
The Mayor's Transport Strategy -
2010
Objectives
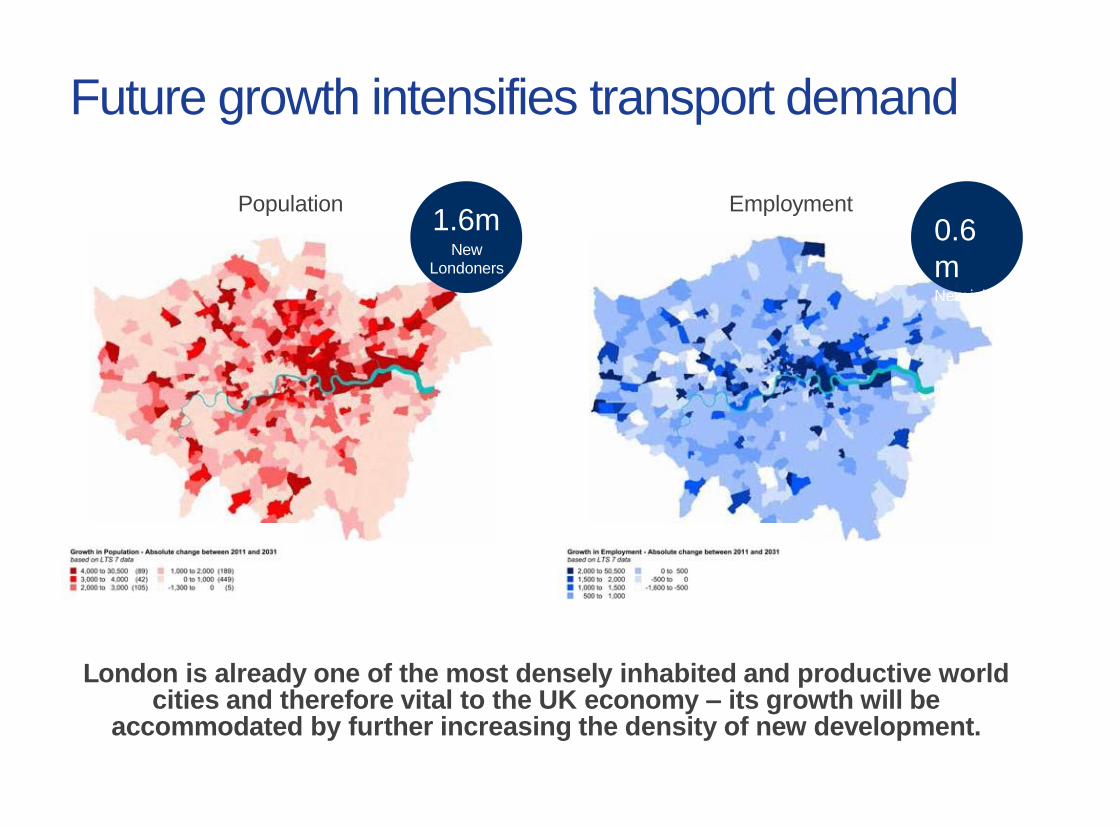
Future growth intensifies transport demand
London is already one of the most densely inhabited and productive worldcities and therefore vital to the UK economy – its growth will be
accommodated by further increasing the density of new development.
1.6mNew
Londoners
0.6
mNew jobs
Population Employment
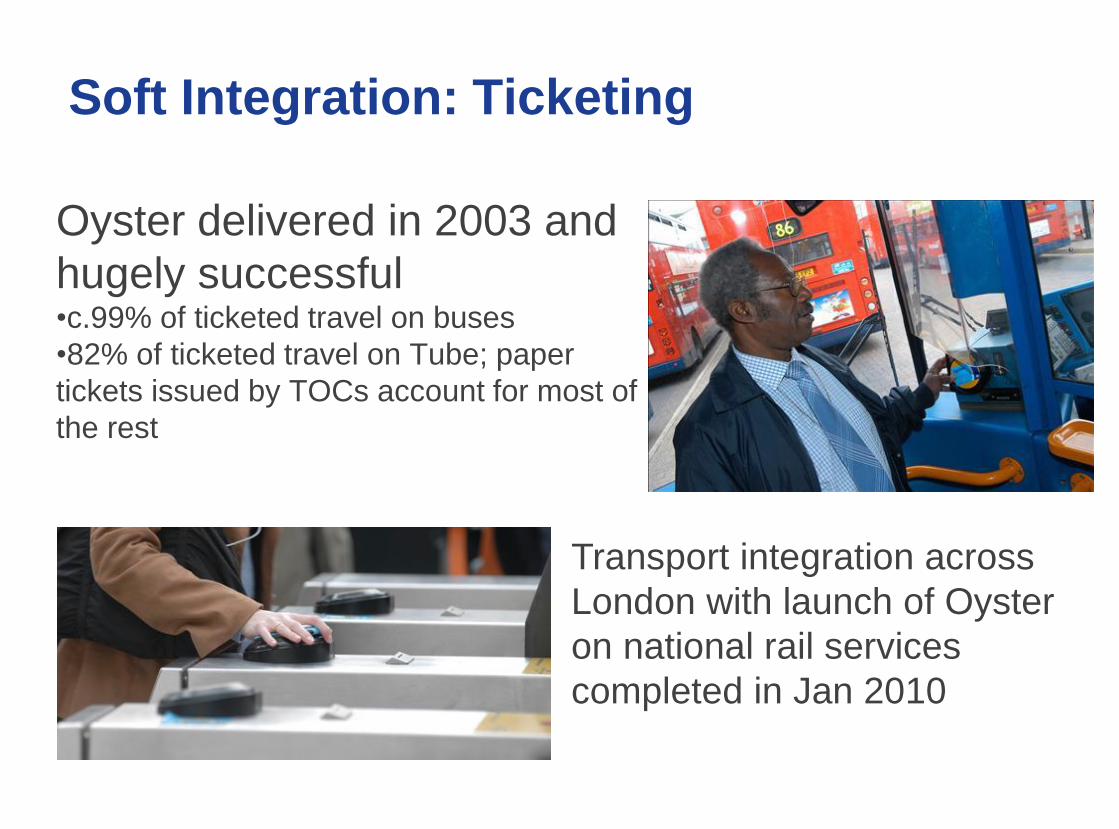
Soft Integration: Ticketing
Oyster delivered in 2003 and
hugely successful •c.99% of ticketed travel on buses
•82% of ticketed travel on Tube; paper
tickets issued by TOCs account for most of
the rest
Transport integration across
London with launch of Oyster
on national rail services
completed in Jan 2010
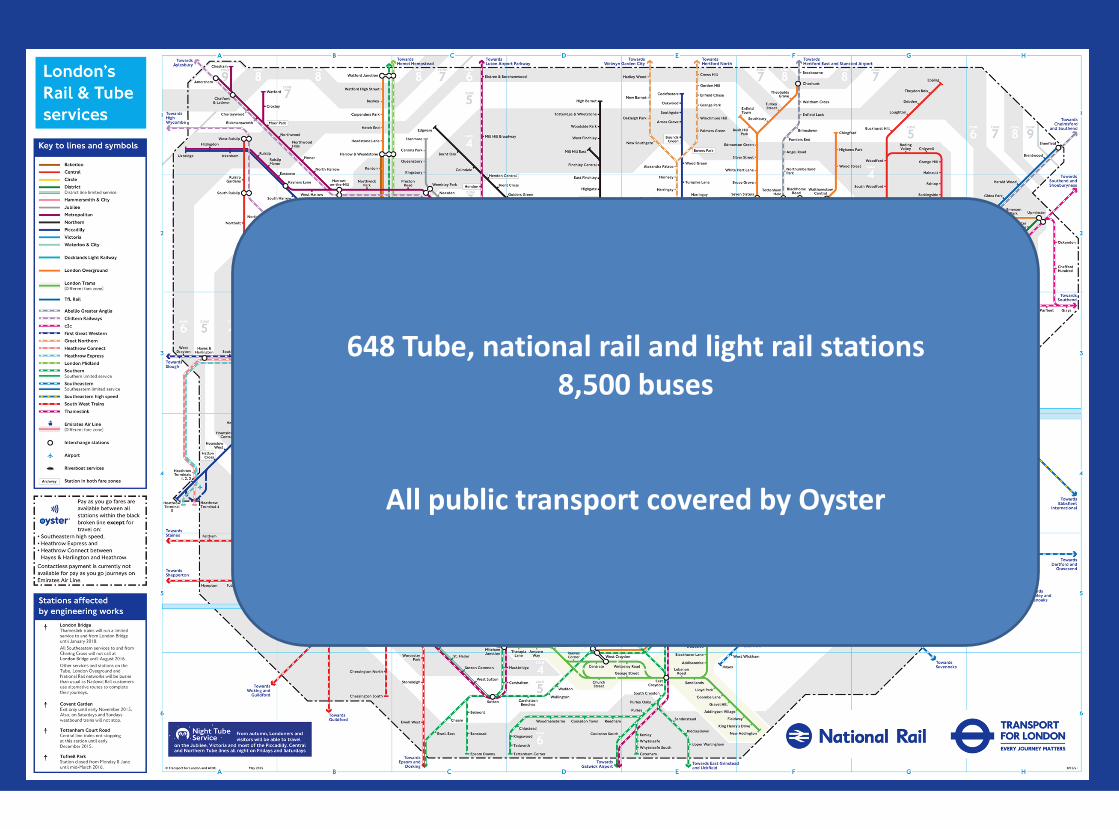
648 Tube, national rail and light rail stations8,500 buses
All public transport covered by Oyster

Multi-modal use of transport system
2.0 million 4.8 million 2.0 million
Bus only Rail only
Active Oyster cards: 8.8 millionLondon population: 8.4 million
Fares setting
• Fares on TfL systems set by the Mayor (alone)
• Fares on national rail system set by nine private train companies under
regulation from Department for Transport (national)
• All governed by limits set within Travelcard Agreement and Oyster pay as you
go Agreement
• Fares increase every year on 2 January
• Fares set by reference to inflation (RPI), plus or minus whatever level the Mayor
decides; main aim to ensure that the system is funded for inflation
• Individual fares go up by more or less depending on fares policy objectives;
each ticket type has different demographic characteristics
Shows that there can be a lot of flexibility in fare setting while still providing an integrated system, a critical commercial factor in many cities
13
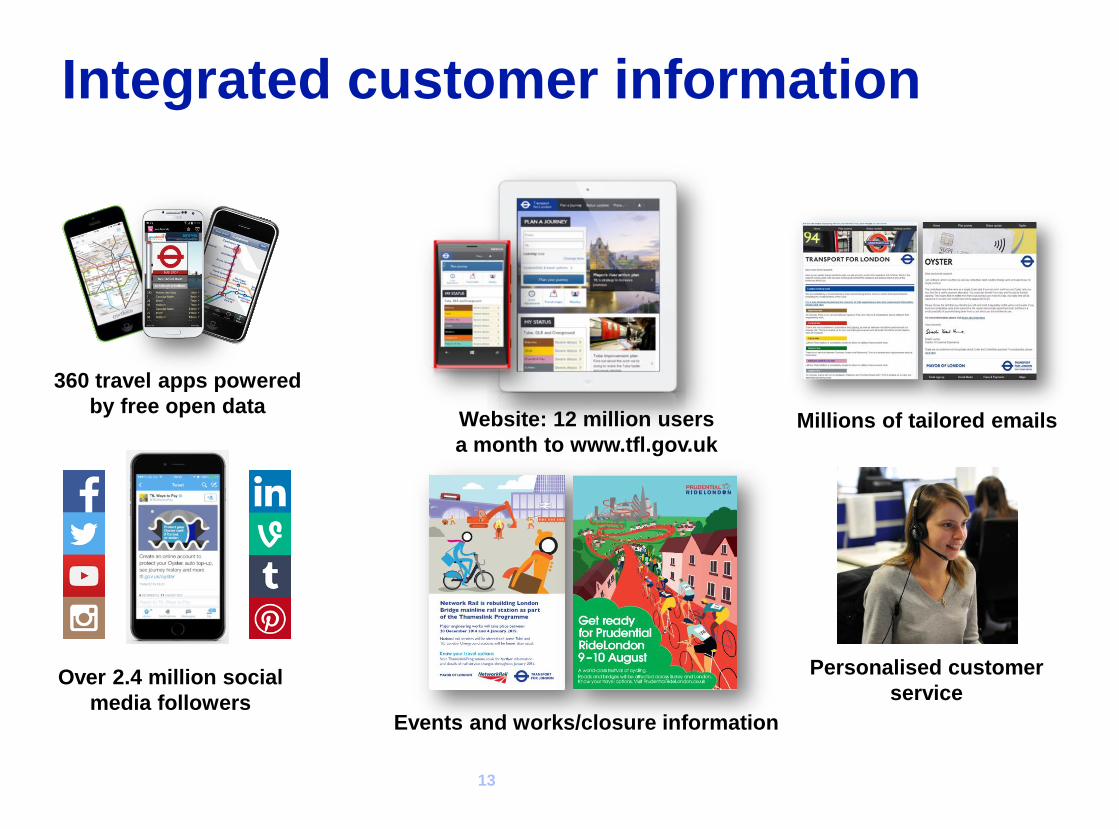
Integrated customer information
360 travel apps powered
by free open data
Over 2.4 million social
media followers
Millions of tailored emailsWebsite: 12 million users
a month to www.tfl.gov.uk
Personalised customer
service
Events and works/closure information
14
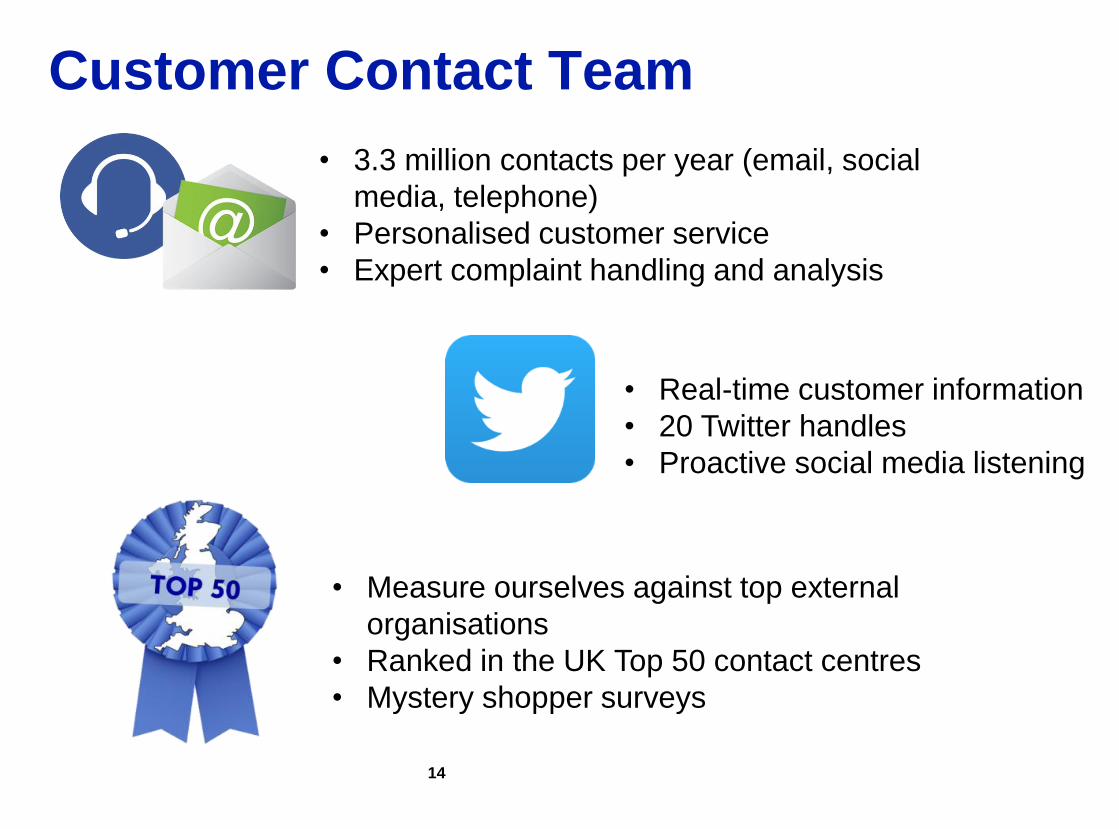
Customer Contact Team
• Measure ourselves against top external
organisations
• Ranked in the UK Top 50 contact centres
• Mystery shopper surveys
• 3.3 million contacts per year (email, social
media, telephone)
• Personalised customer service
• Expert complaint handling and analysis
• Real-time customer information
• 20 Twitter handles
• Proactive social media listening
15
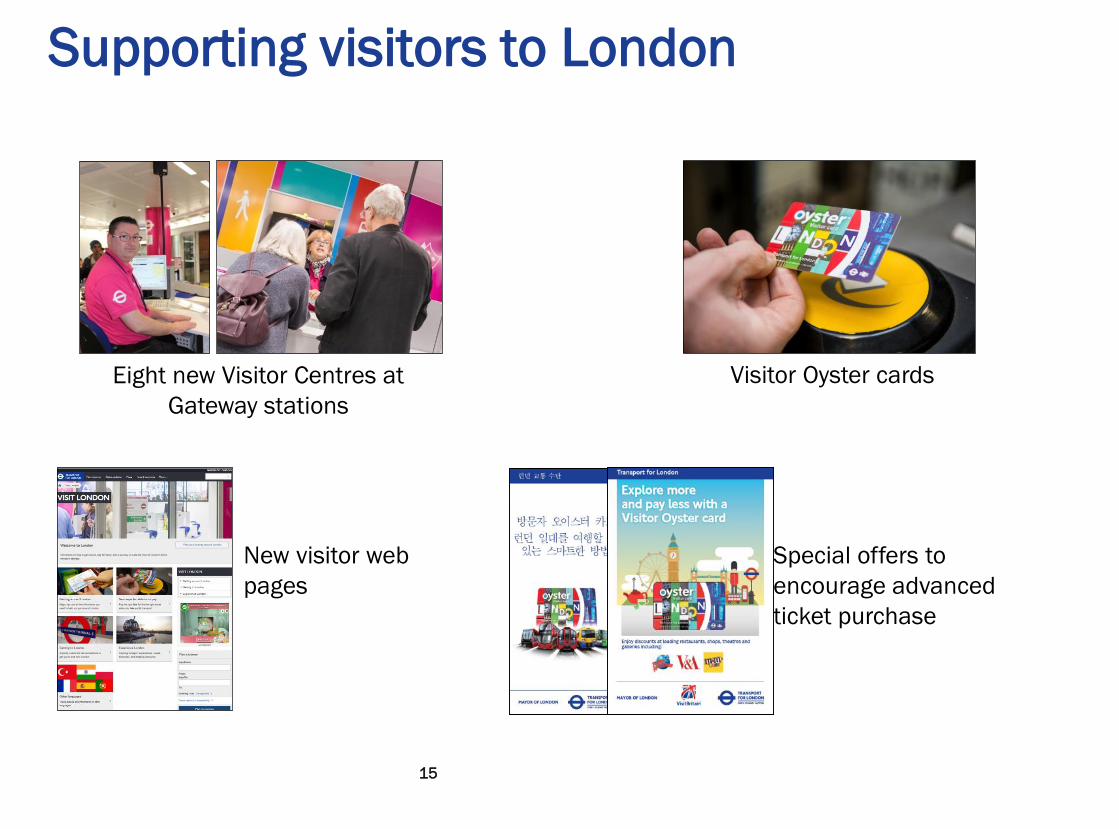
Supporting visitors to London
Eight new Visitor Centres at
Gateway stations
New visitor web
pages
Visitor Oyster cards
Special offers to
encourage advanced
ticket purchase
16
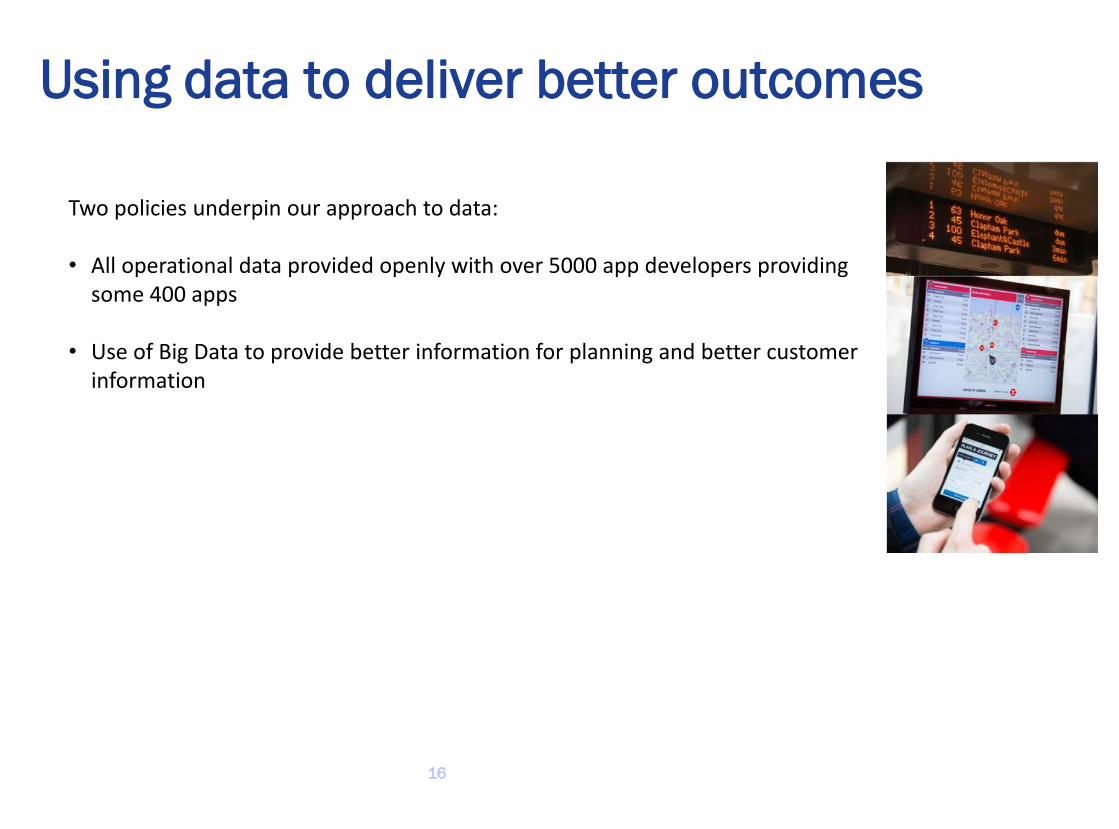
Using data to deliver better outcomes
Analysis of large data sets to reveal patterns and enable
action
Source
sApplication
Two policies underpin our approach to data:
• All operational data provided openly with over 5000 app developers providing some 400 apps
• Use of Big Data to provide better information for planning and better customer information
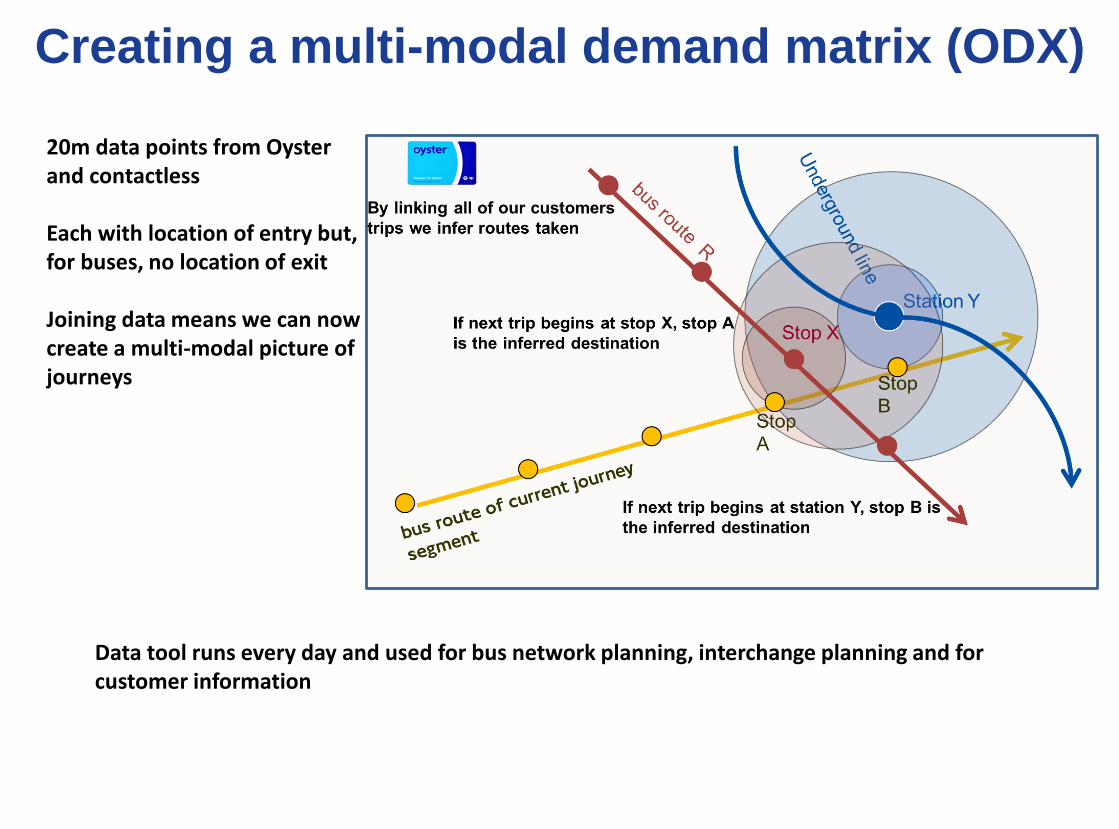
Creating a multi-modal demand matrix (ODX)
20m data points from Oyster and contactless
Each with location of entry but, for buses, no location of exit
Joining data means we can now create a multi-modal picture of journeys
Data tool runs every day and used for bus network planning, interchange planning and for customer information

Business Intelligence
ODX generates data for every route, every day. Powering new BI
dashboards providing insights including Route Loading Analysis, Loading
profile, and an O-D Matrix.
Recommended