Machine Learning in Action
Andres KullProduct Analyst @ Pipedrive
Machine Learning Estonia meetup, October 11, 2016

About me
• Pipedrive:
• product analyst, from Feb 2016
• Funderbeam:
• data scientist, 2013-2015
• Elvior
• CEO, 1992 - 2012
• software development, test automation
• model based testing (PhD, 2009)
Topics
• About Pipedrive
• Predictive analytics in Pipedrive
• Closer insight to one predictive model
• Thought process
• Tools and methods used
• Deployment
• Monitoring

About Pipedrive (2 min video)

Some facts about Pipedrive
• > 30k paying customers
• from 155 countries
• biggest markets are US, Brazil
• > 220 employees
• ~ 180 in Estonia (Tallinn, Tartu)
• ~ 40 in New York
• 20 different nationalities
image area

My tasks @Pipedrive
• Serve product teams with data insight
• Predictive analytics / towards sales AI

CRM companies are rushing to AI
$75 mil
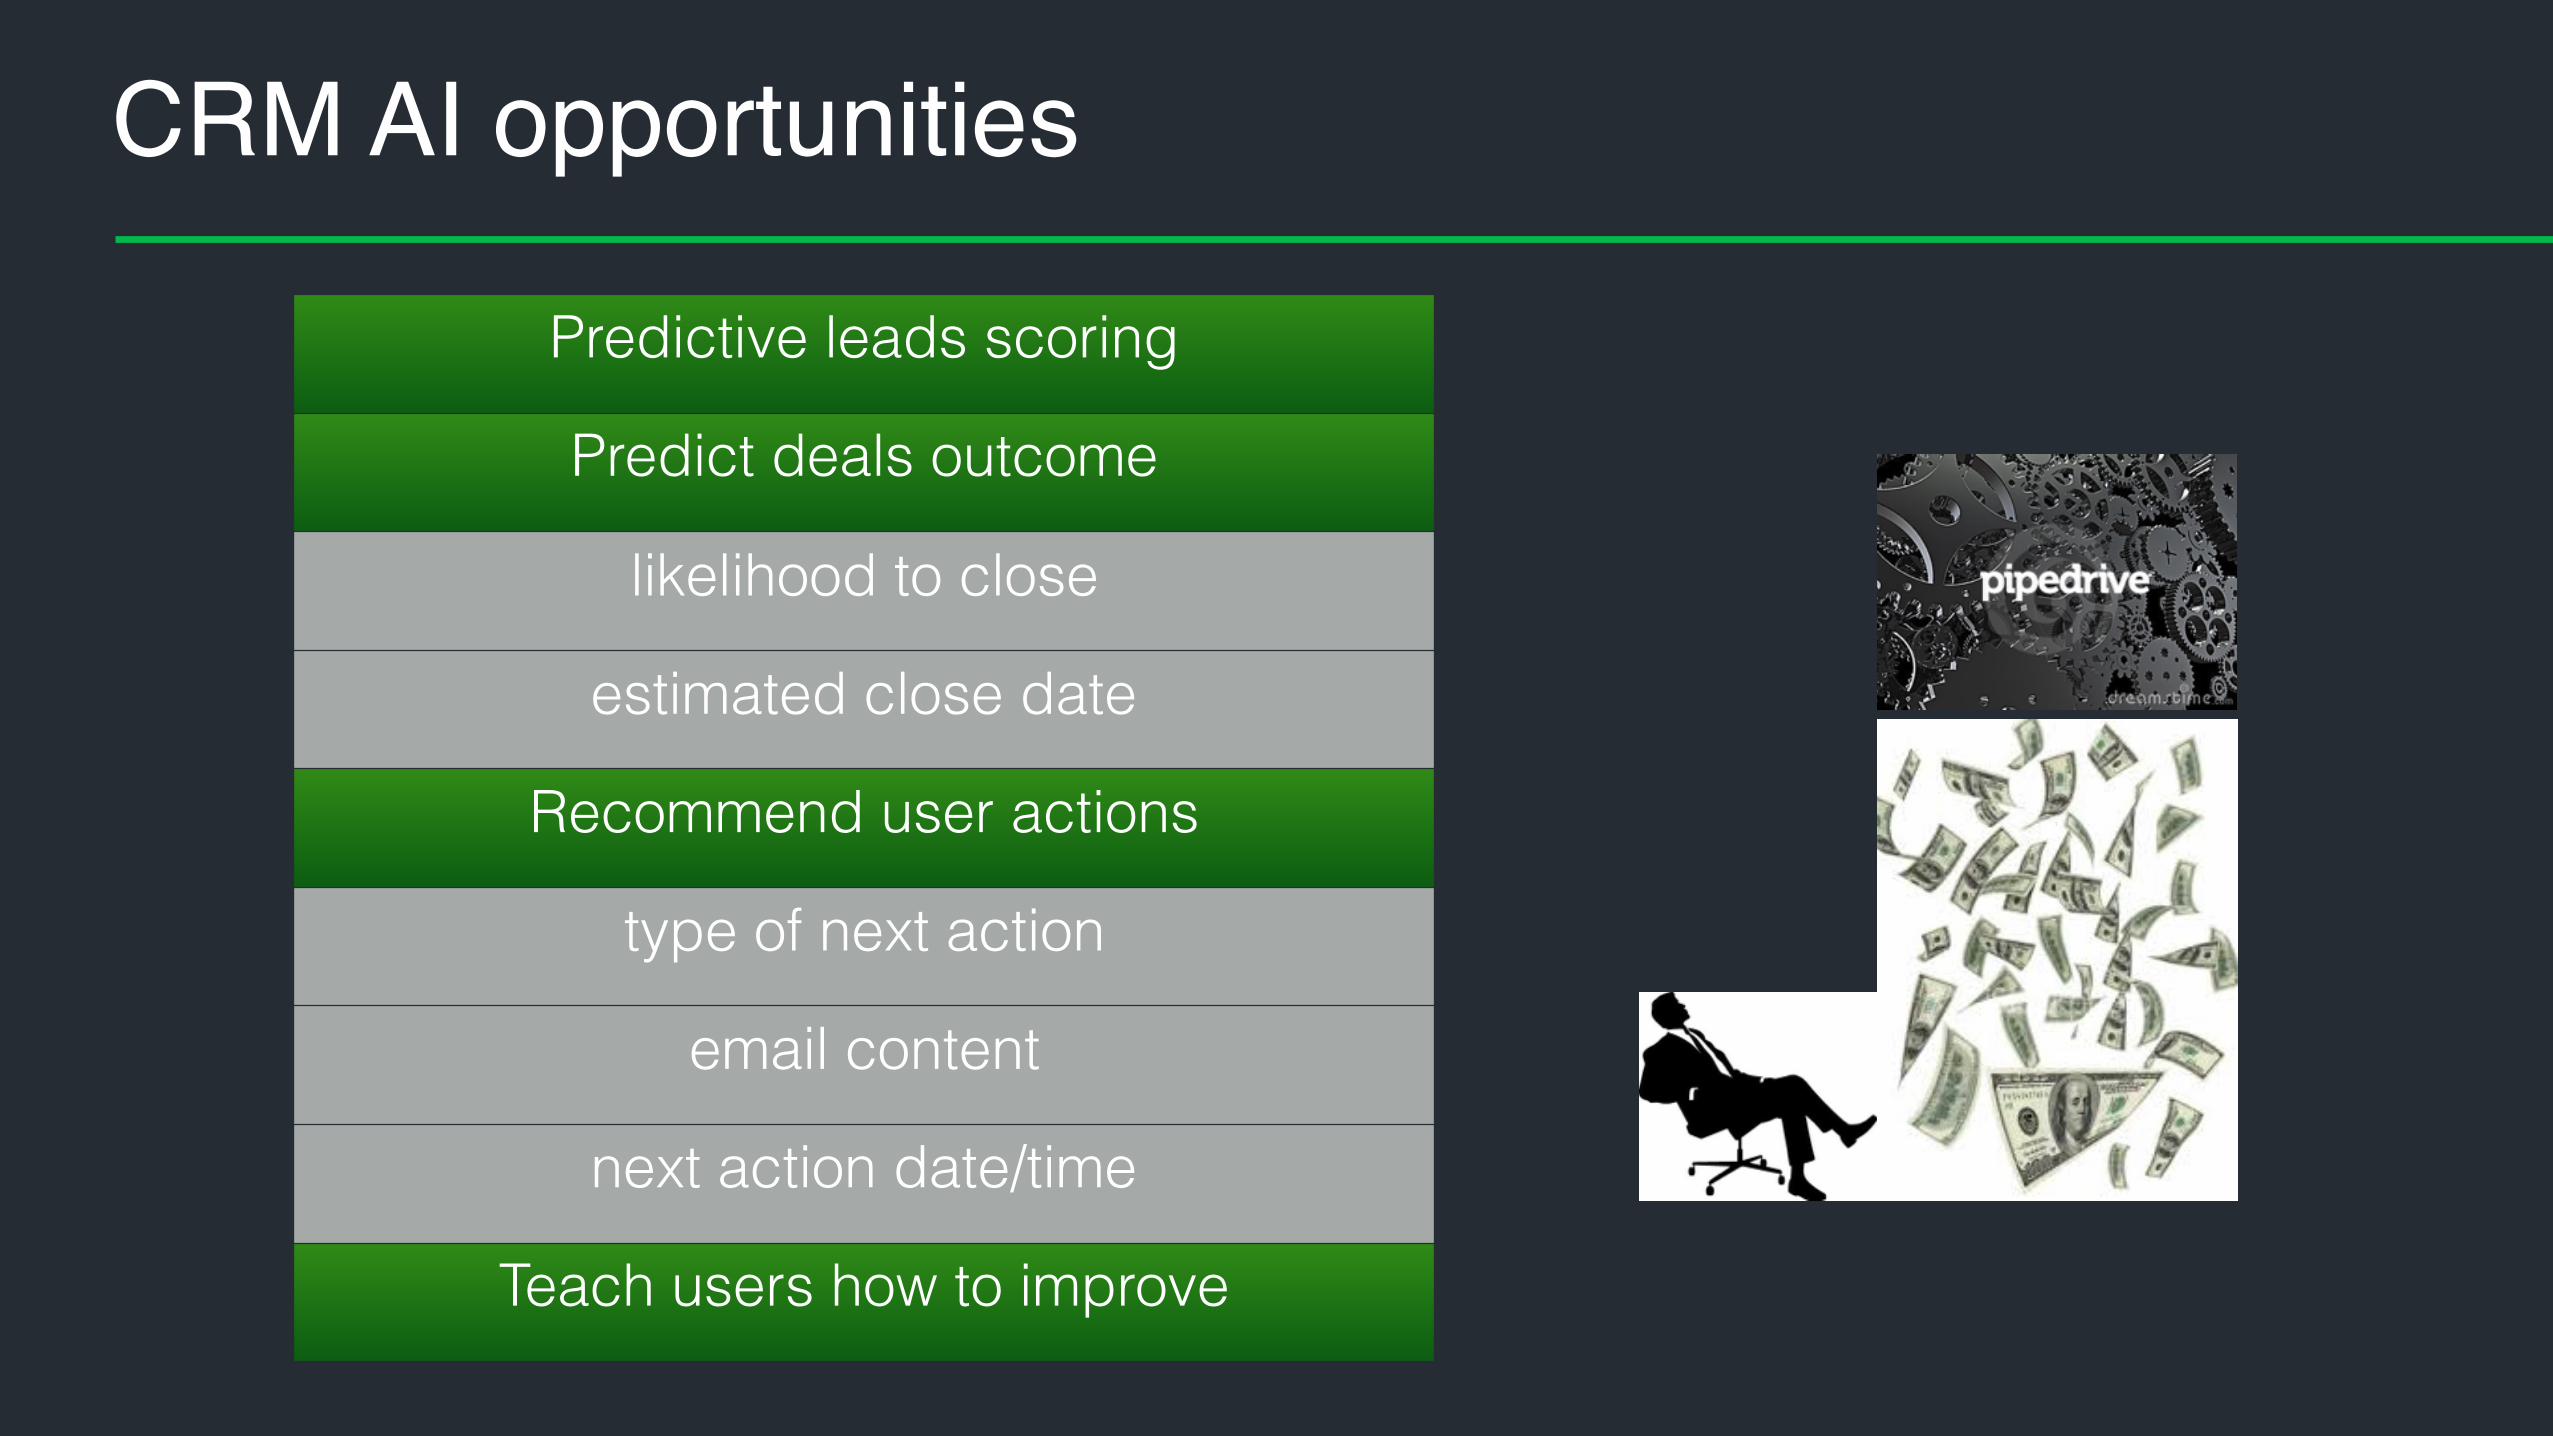
CRM AI opportunities
Predictive leads scoring
Predict deals outcome
likelihood to close
estimated close date
Recommend user actions
type of next action
email content
next action date/time
Teach users how to improve

Predictive analytics solutions at Pipedrive
For marketing, sales and support
For users • predicting open deals pipeline value • provides means to adjust selling process to meet the sales goals
Deals success prediction
• identify customers who are about to churn • provides health score of subscription
Churn prediction
• identify inactive companies in trial
Trial conversion prediction
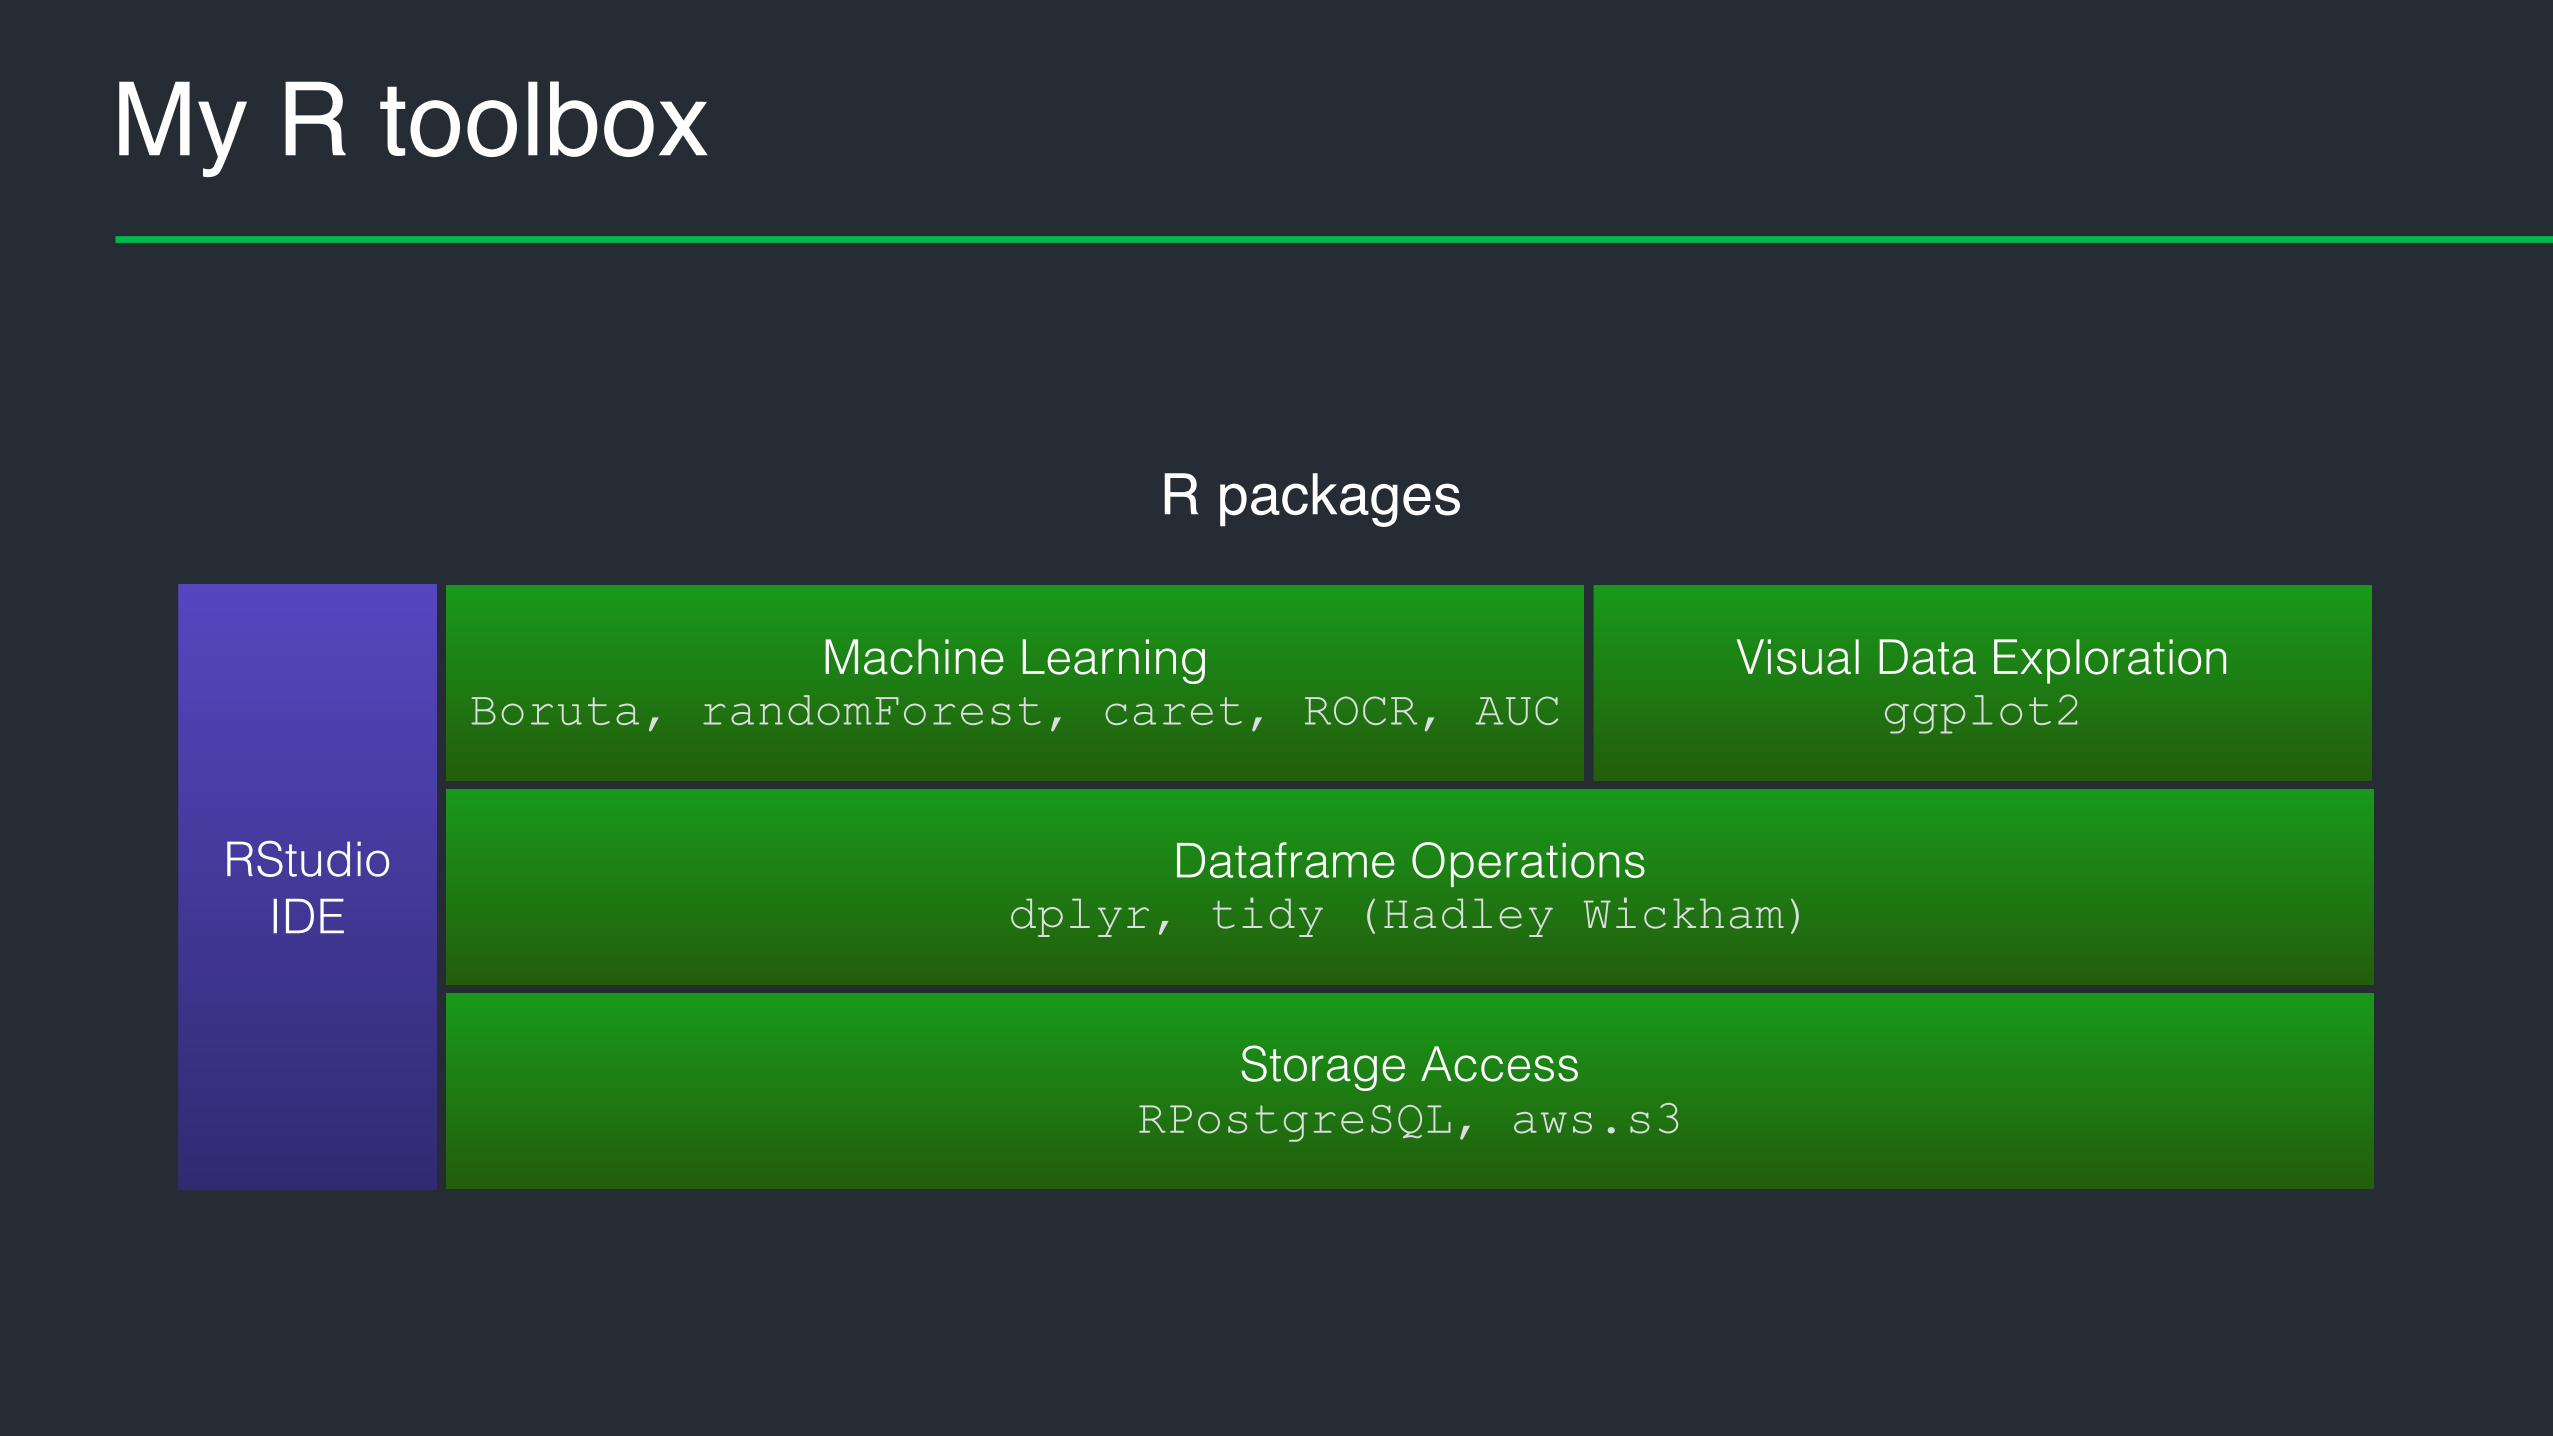
My R toolbox
Storage Access RPostgreSQL, aws.s3
Dataframe Operations dplyr, tidy (Hadley Wickham)
Machine Learning Boruta, randomForest, caret, ROCR, AUC
Visual Data Exploration ggplot2
RStudio IDE
R packages

R references
Everything you need is to follow
Hadley Wickham
http://hadley.nz/ @hadleywickham #rstats
… and you are in good hands

Trials conversion model

Business goal
• increase trial users conversion rate
• identify such trial companies who need
some engagement triggersimage area
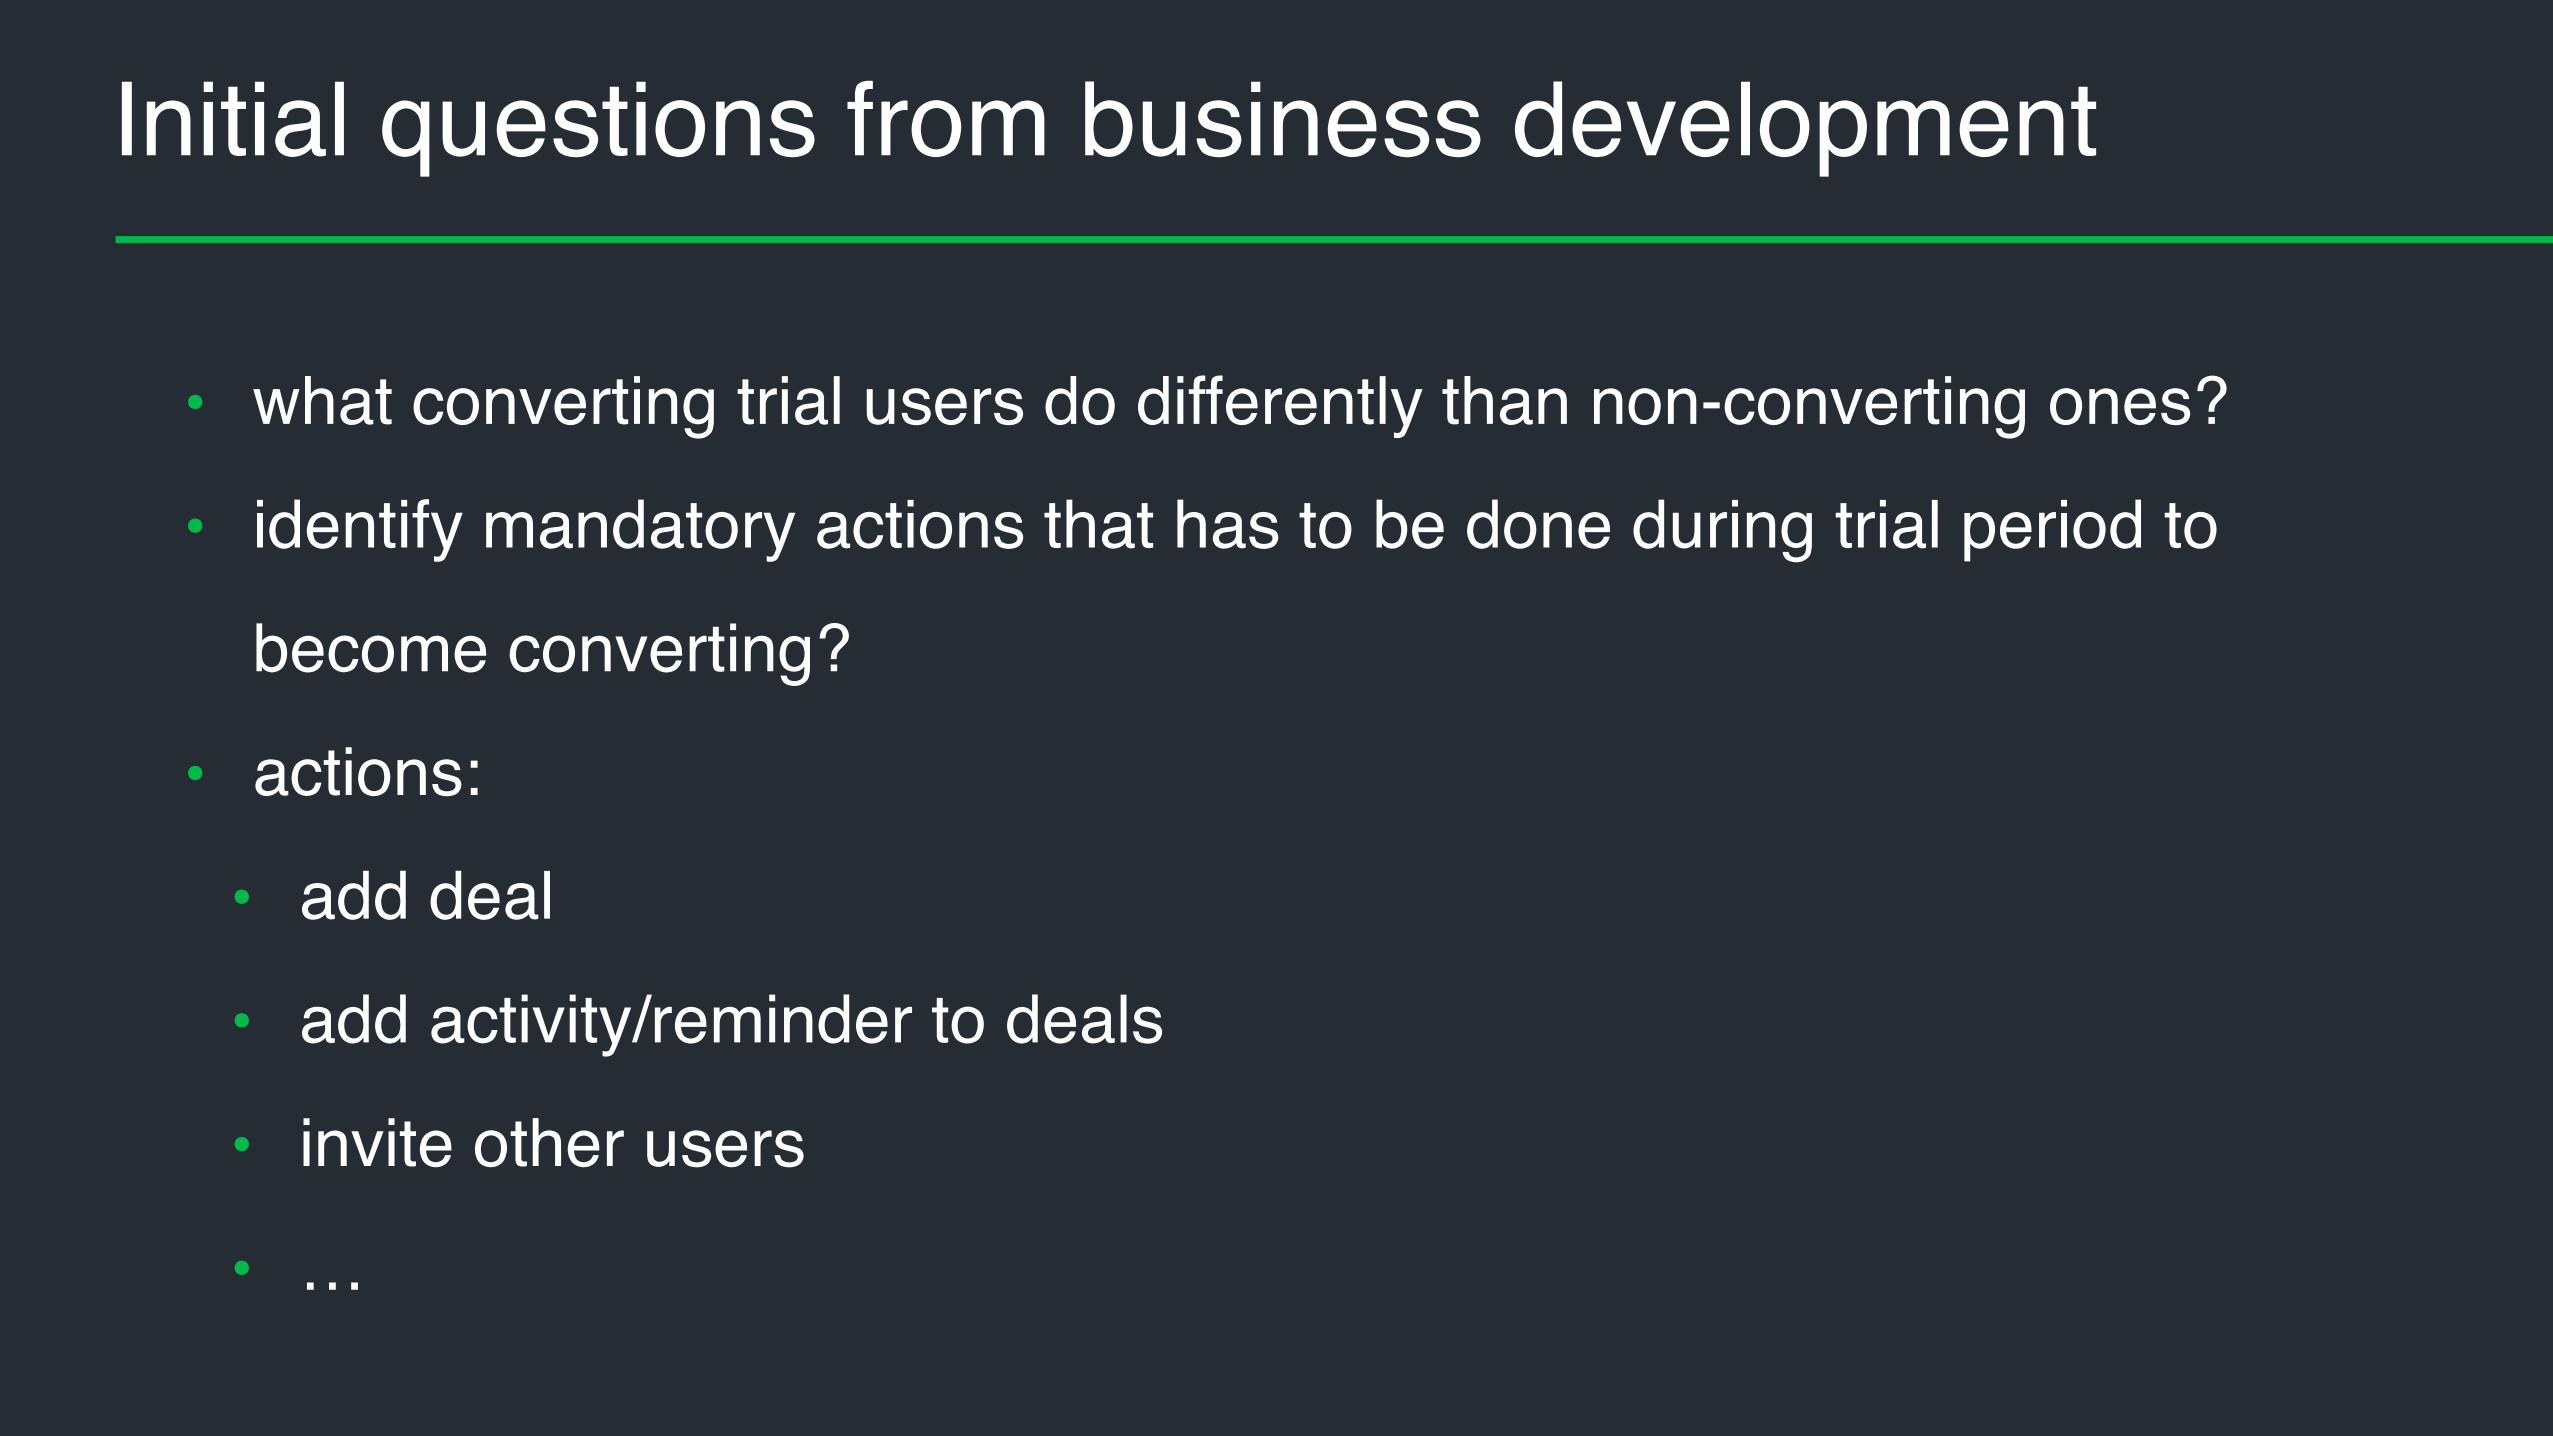
Initial questions from business development
• what converting trial users do differently than non-converting ones?
• identify mandatory actions that has to be done during trial period to
become converting?
• actions:
• add deal
• add activity/reminder to deals
• invite other users
• …

Actions of successful trial companies
Percentages of successful trial companies who have done particular actions by
7th, 14th, 30th day

Actions split by successful and unsuccessful trials
• which percentage of companies
have performed particular action
by day 7 split by converting and
non-converting companies

Training a decision tree model
resulting modelselected features
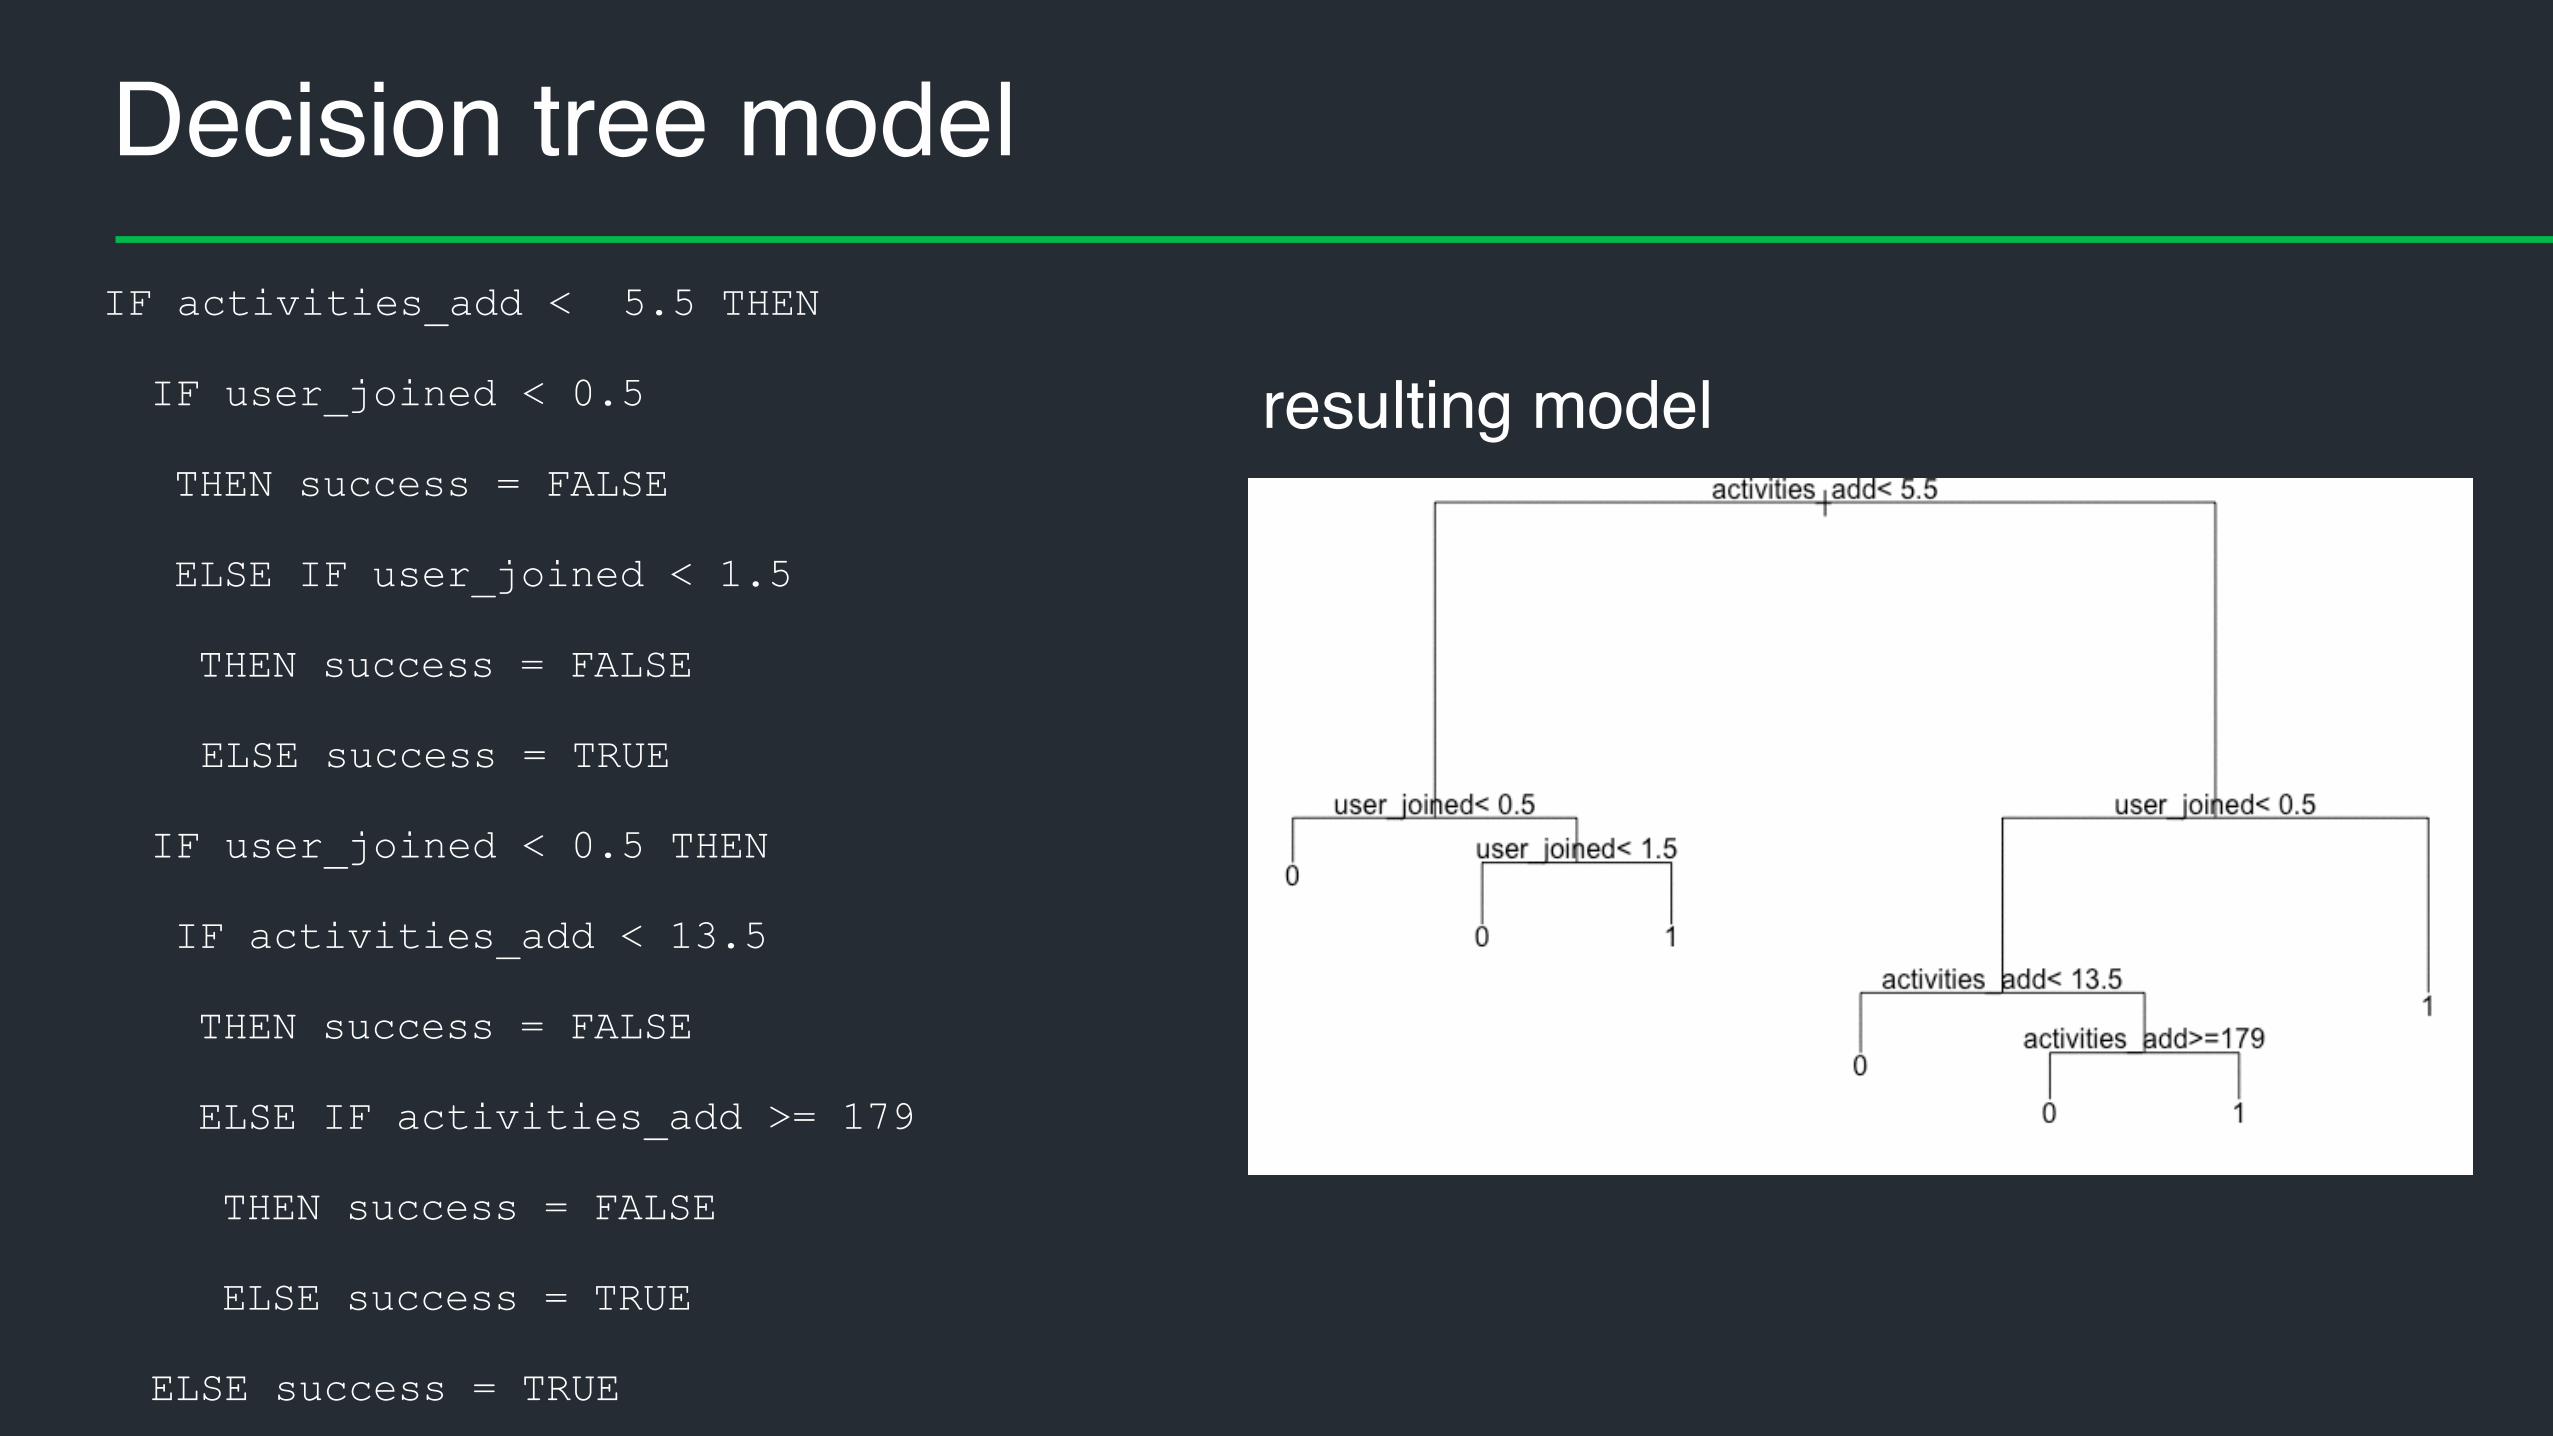
Decision tree model
resulting modelIF activities_add < 5.5 THEN
IF user_joined < 0.5
THEN success = FALSE
ELSE IF user_joined < 1.5
THEN success = FALSE
ELSE success = TRUE
IF user_joined < 0.5 THEN
IF activities_add < 13.5
THEN success = FALSE
ELSE IF activities_add >= 179
THEN success = FALSE
ELSE success = TRUE
ELSE success = TRUE
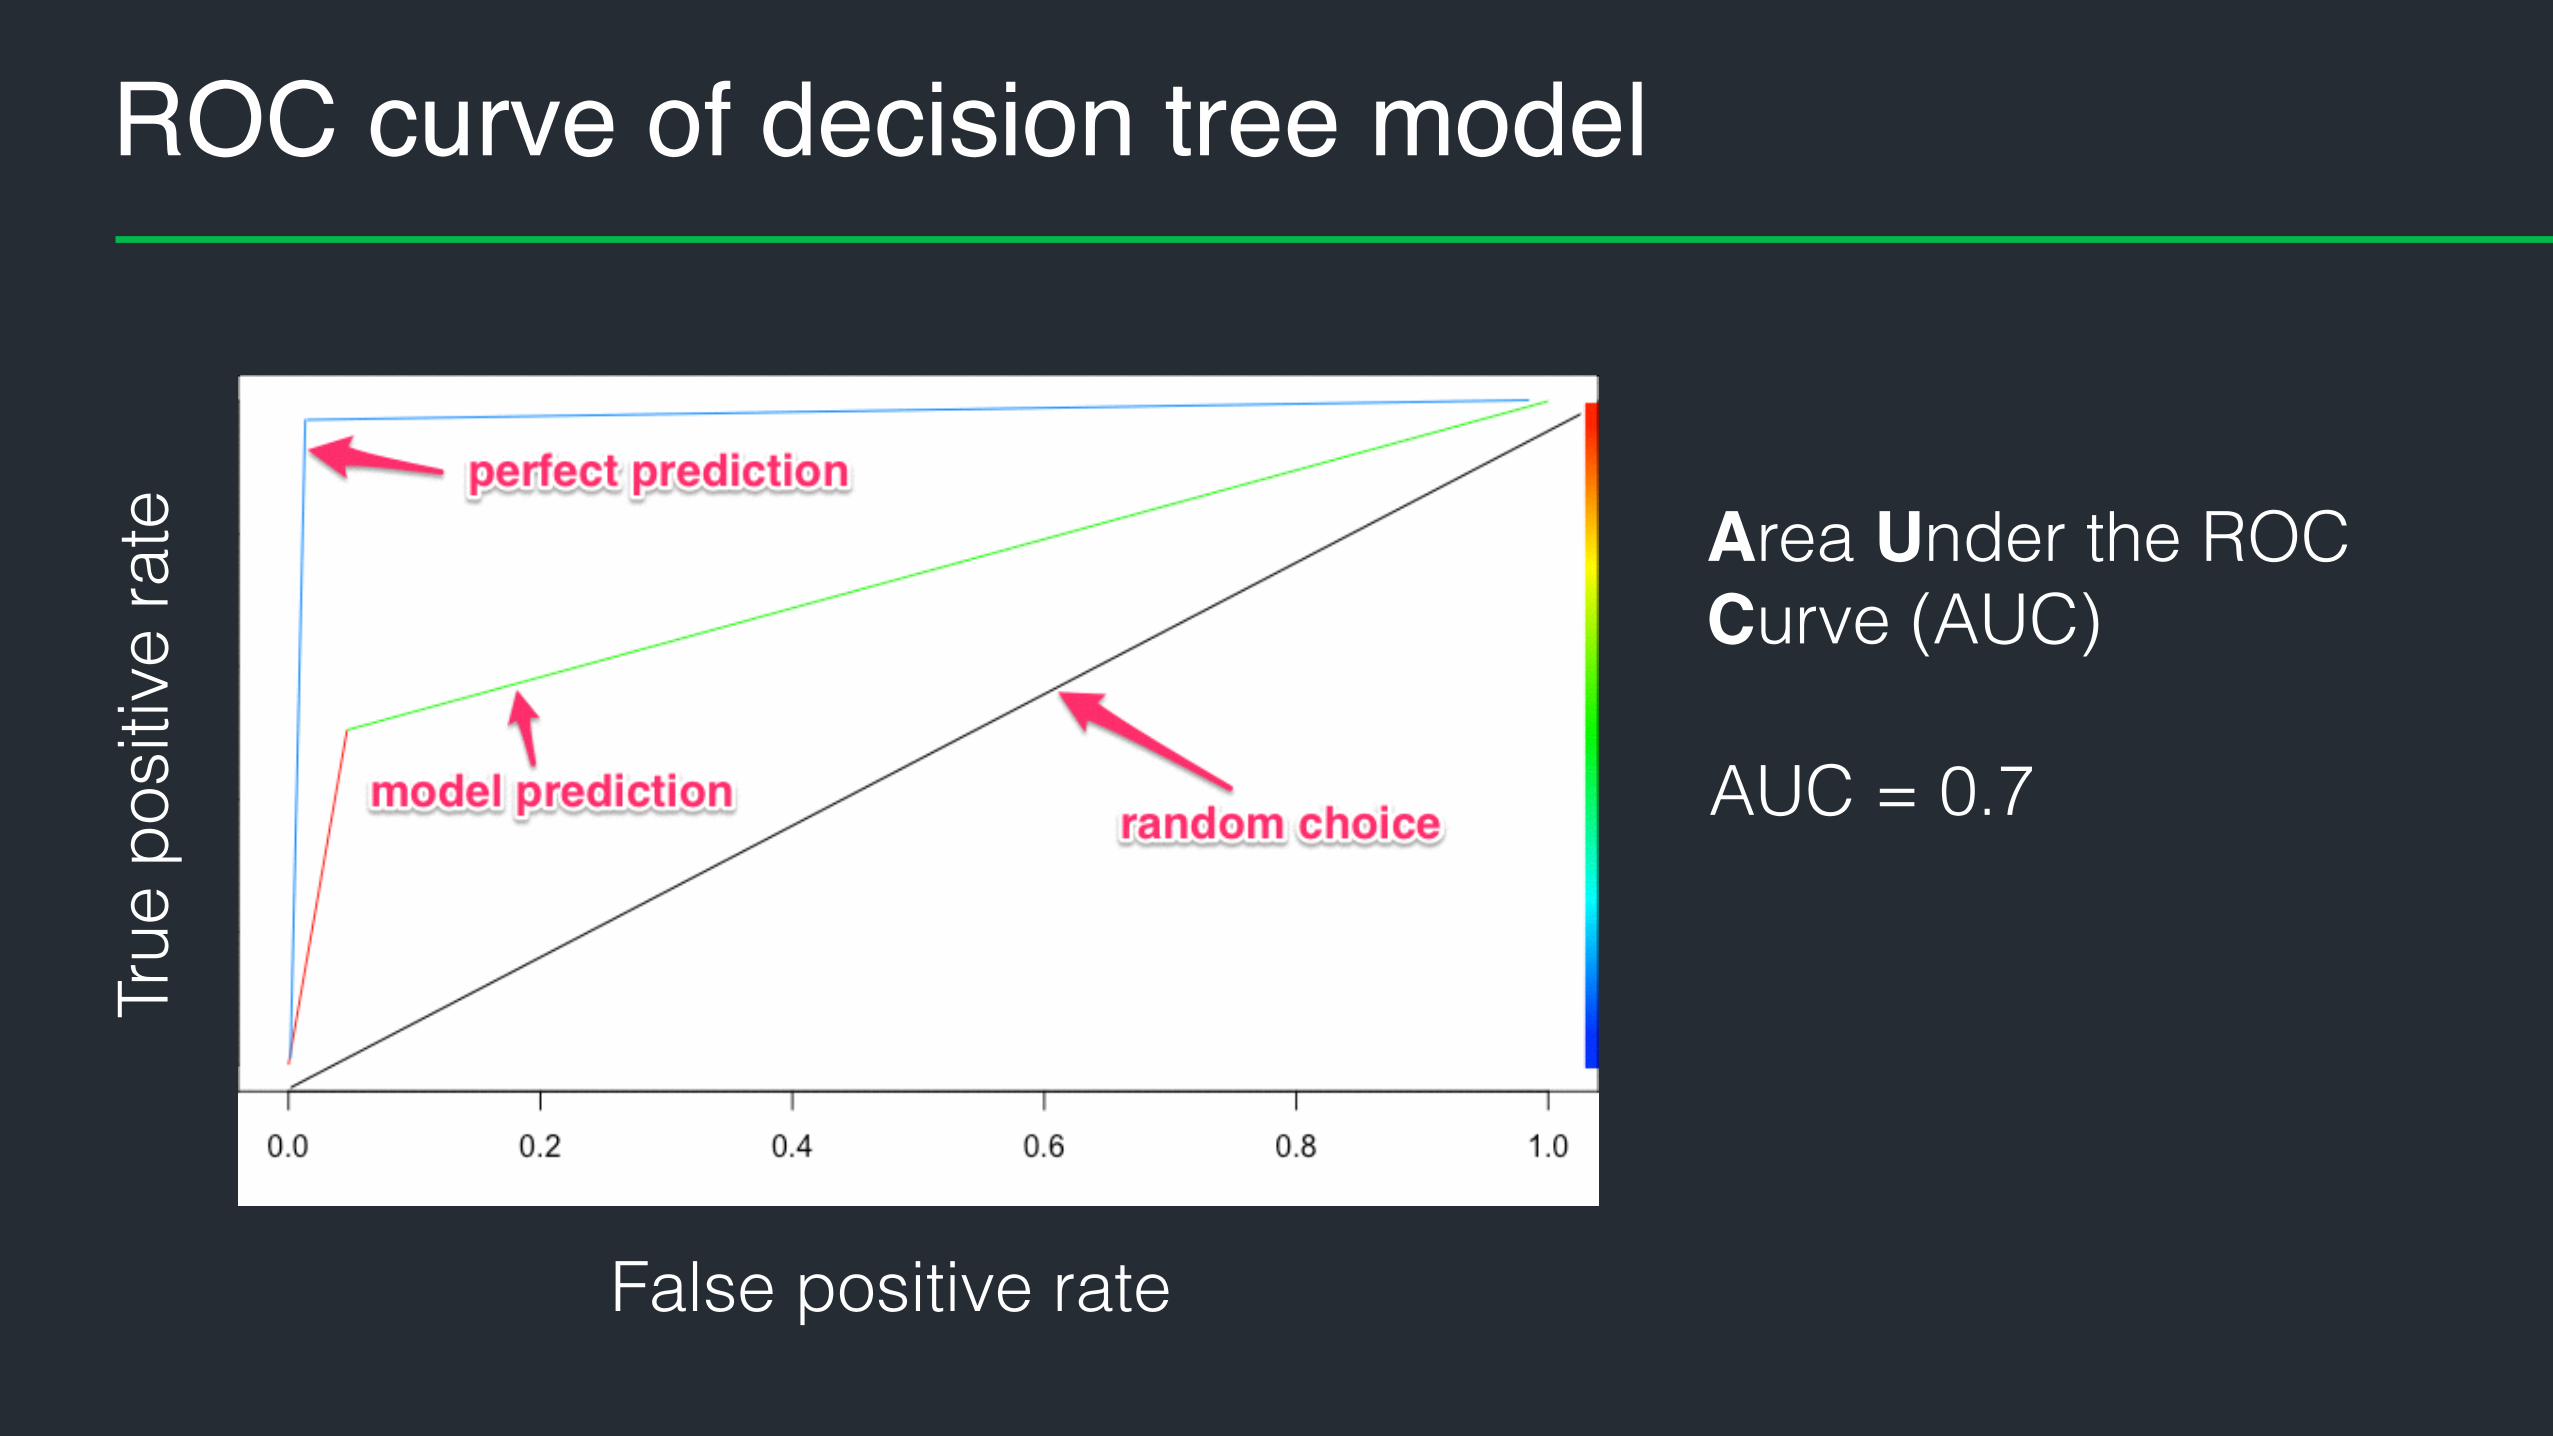
ROC curve of decision tree modelTr
ue p
ositi
ve ra
te
AUC = 0.7
False positive rate
Area Under the ROC Curve (AUC)
Can we do any better?
• Sure!
• Better feature selection
• Better ML algorithm (random forest)
• Better model evaluation with cross validation training
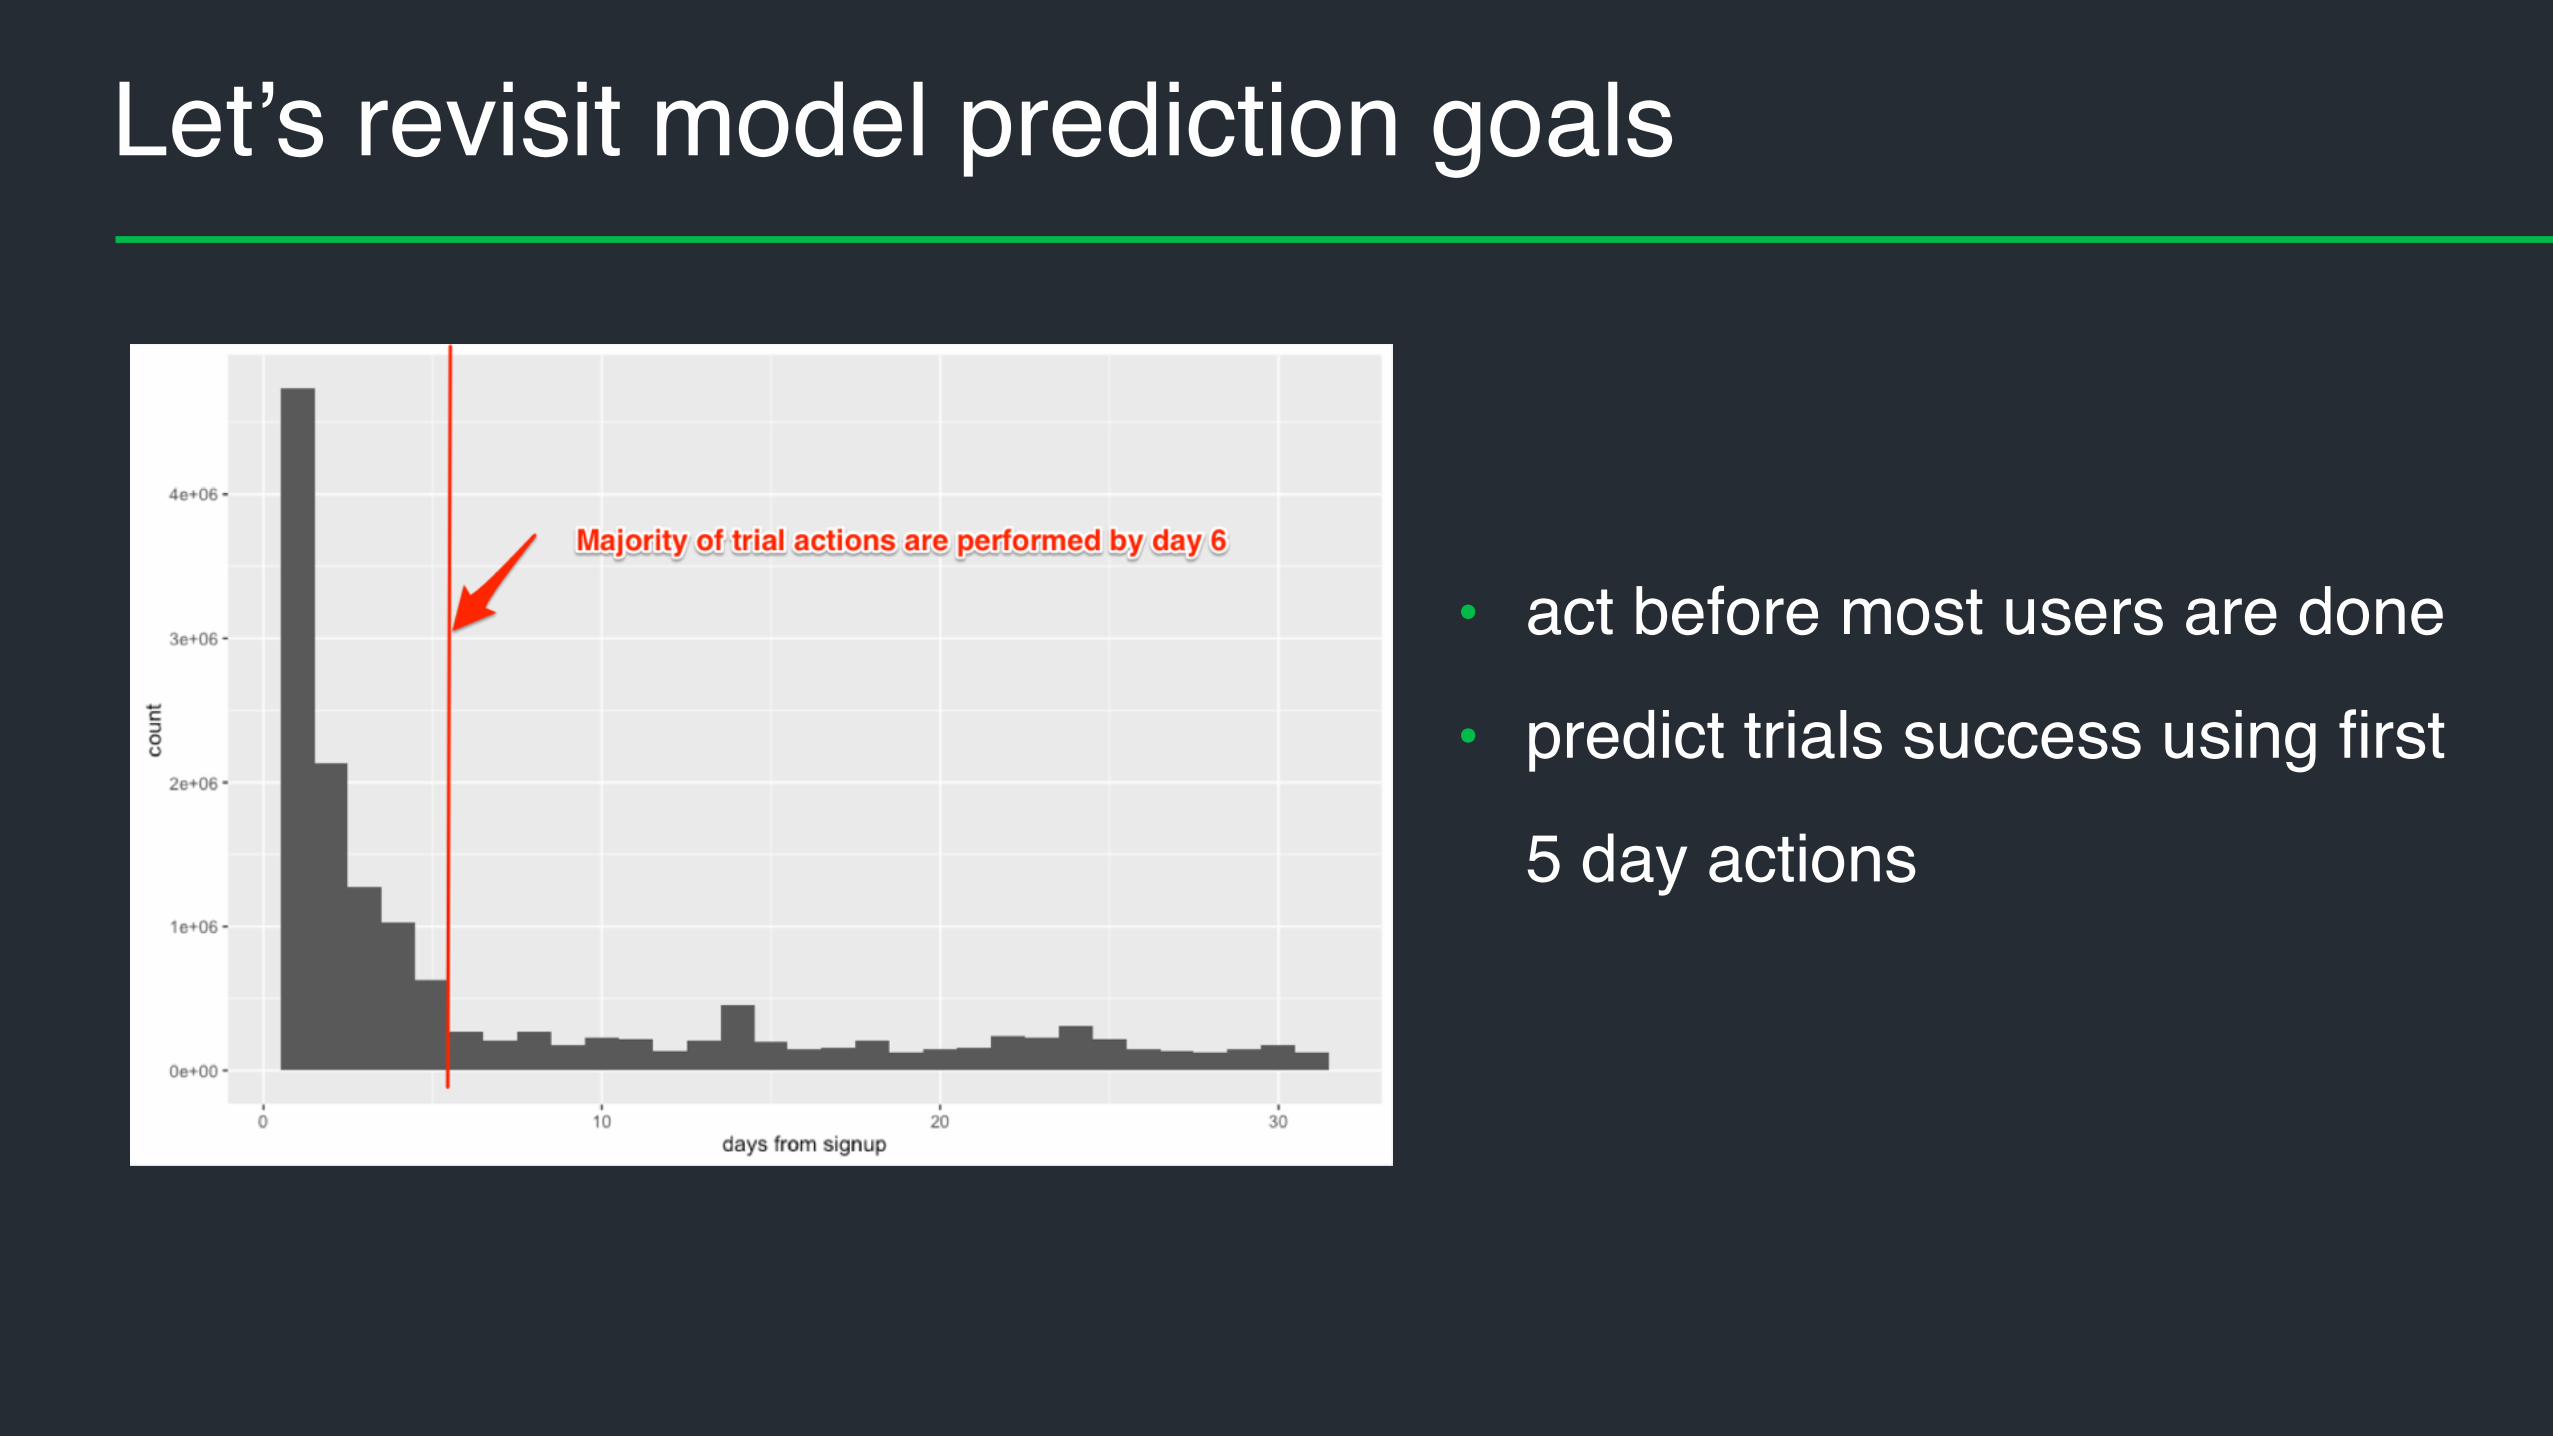
Let’s revisit model prediction goals
• act before most users are done
• predict trials success using first
5 day actions
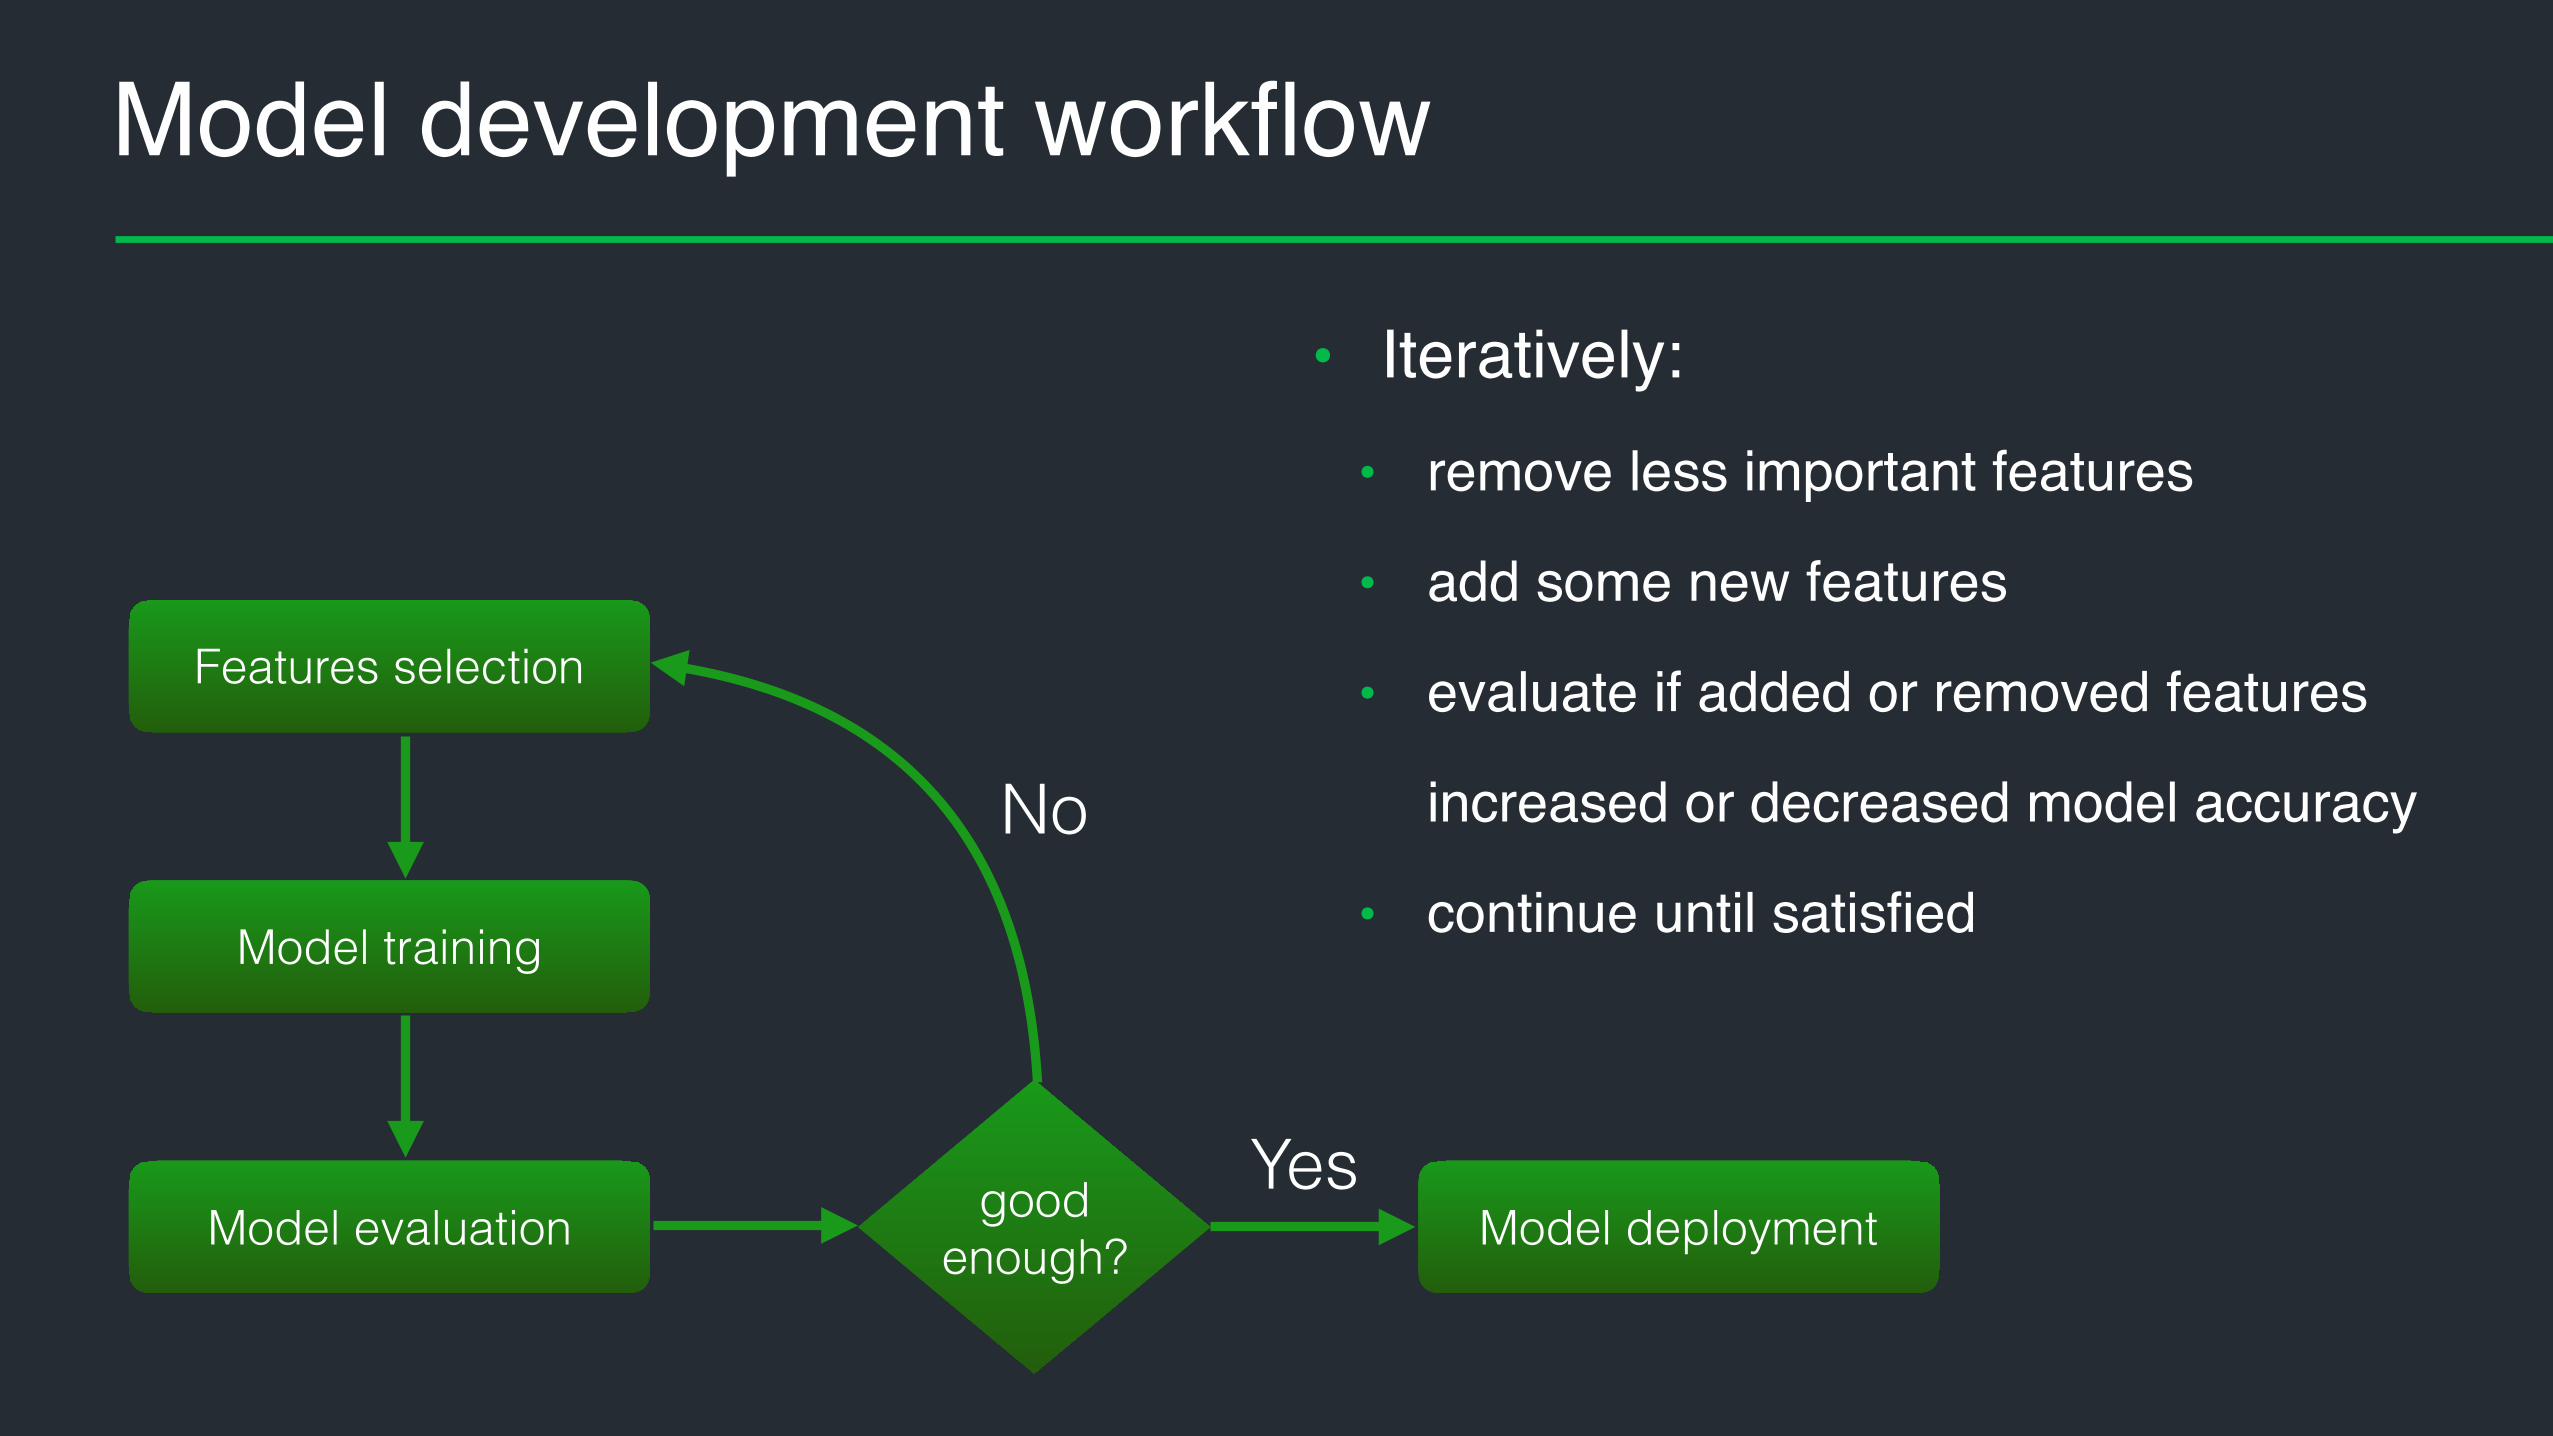
Model development workflow
Features selection
Model training
Model evaluation Model deploymentgood enough?
Yes
No
• Iteratively:• remove less important features
• add some new features
• evaluate if added or removed features
increased or decreased model accuracy
• continue until satisfied

Feature selection
• Select all relevant features
• Let the ML algorithm do the work
• filter out irrelevant features
• order features by importance
All relevant features I can imagine
Selected features

Filter out irrelevant features
• R Boruta package was used• bor <- Boruta(y ~ ., data = train)
• bor <- TentativeRoughFix(bor) # for fixing Tentative features
• bor$finalDecision # <- contains Confirmed / Rejected for all features
• Only confirmed features will be passed to model training phase
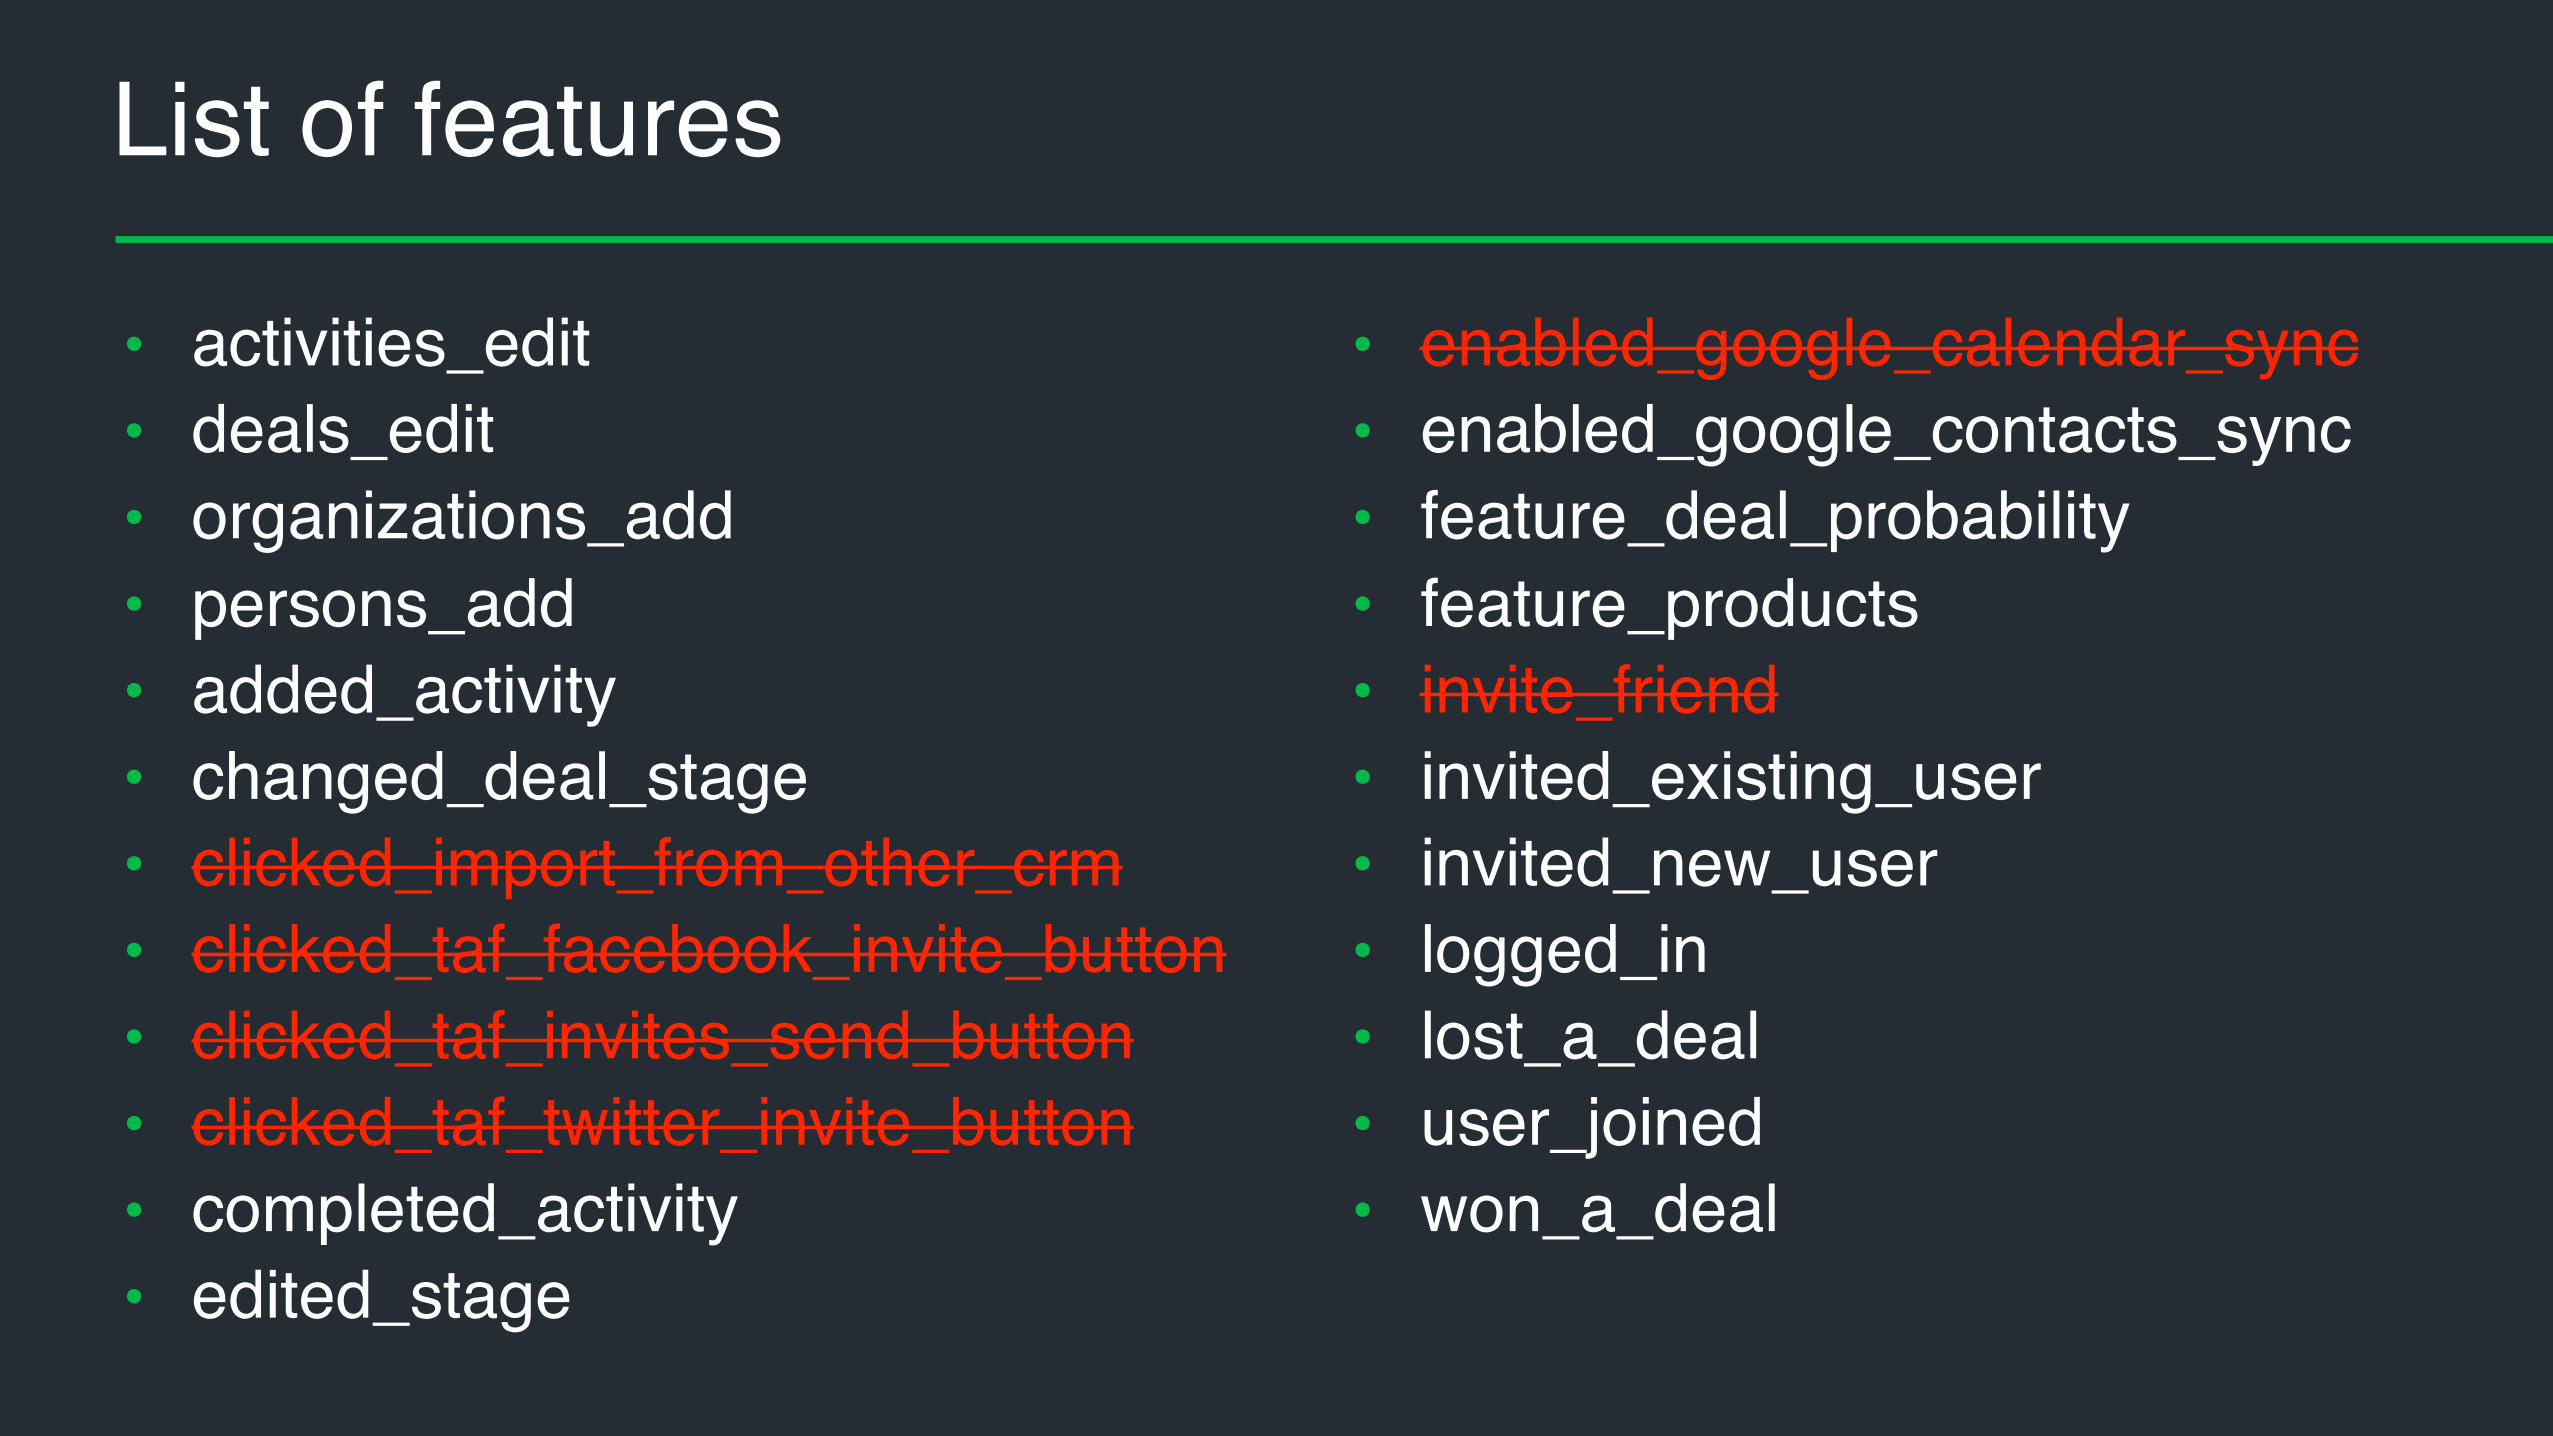
List of features
• activities_edit• deals_edit• organizations_add• persons_add• added_activity• changed_deal_stage• clicked_import_from_other_crm• clicked_taf_facebook_invite_button• clicked_taf_invites_send_button• clicked_taf_twitter_invite_button• completed_activity• edited_stage
• enabled_google_calendar_sync• enabled_google_contacts_sync• feature_deal_probability• feature_products• invite_friend• invited_existing_user• invited_new_user• logged_in• lost_a_deal• user_joined• won_a_deal

Order features by importance
• R RandomForest trained model object includes feature importances
• First you train the model• rf_model <- randomForest(y ~ ., data = train, )
• … and then access the features relative importances• imp_var <- varImp(rf_model)$importance

Features ordered by relative importance
1 persons_add 2 organizations_add 3 added_deal 4 logged_in 5 deals_edit 6 added_activity 7 changed_deal_stage 8 activities_edit 9 user_joined 10 invited_new_user 11 completed_activity 12 won_a_deal 13 lost_a_deal 14 feature_products 15 feature_deal_probability 16 invited_existing_user 17 edited_stage
100.000000 88.070291 85.828879 84.296198 74.448121 69.044263 61.072545 51.355769 28.947384 28.329157 21.877124 17.906090 12.477377 9.518529 8.309032 3.781910 0.000000

Split data to training and test data
• inTrain <- createDataPartition(y = all_ev[y][,1], p = 0.7, list = FALSE)
• train <- all_ev[inTrain, ]
• test <- all_ev[-inTrain, ]
• training set: 70% of companies
• hold-out test set: 30% of companies
• R caret package createDataPartition() function was used to split data

Model training using 5-fold cross validation
rf_model <- train(y ~ ., data = train,
method = "rf",
trControl = trainControl(
method = "cv",
number = 5
),
metric = "ROC",
tuneGrid = expand.grid(mtry = c(2, 4, 6, 8))
)
• R caret package train() and trainControl() functions do the job

Model evaluation
mtry <- rf_model$bestTune$mtry
train_auc <- rf_model$results$ROC[as.numeric(rownames(rf_model$bestTune))]
• model AUC on training data
• model AUC on test data score <- predict(rf_model, newdata = test, type = "prob")
pred <- prediction(score[, 2], test[y])
test_auc <- performance(pred, "auc")
• AUC on training data 0.82..0.88
• AUC on test data 0.83..0.88
• Benchmark (decision tree) AUC = 0.7
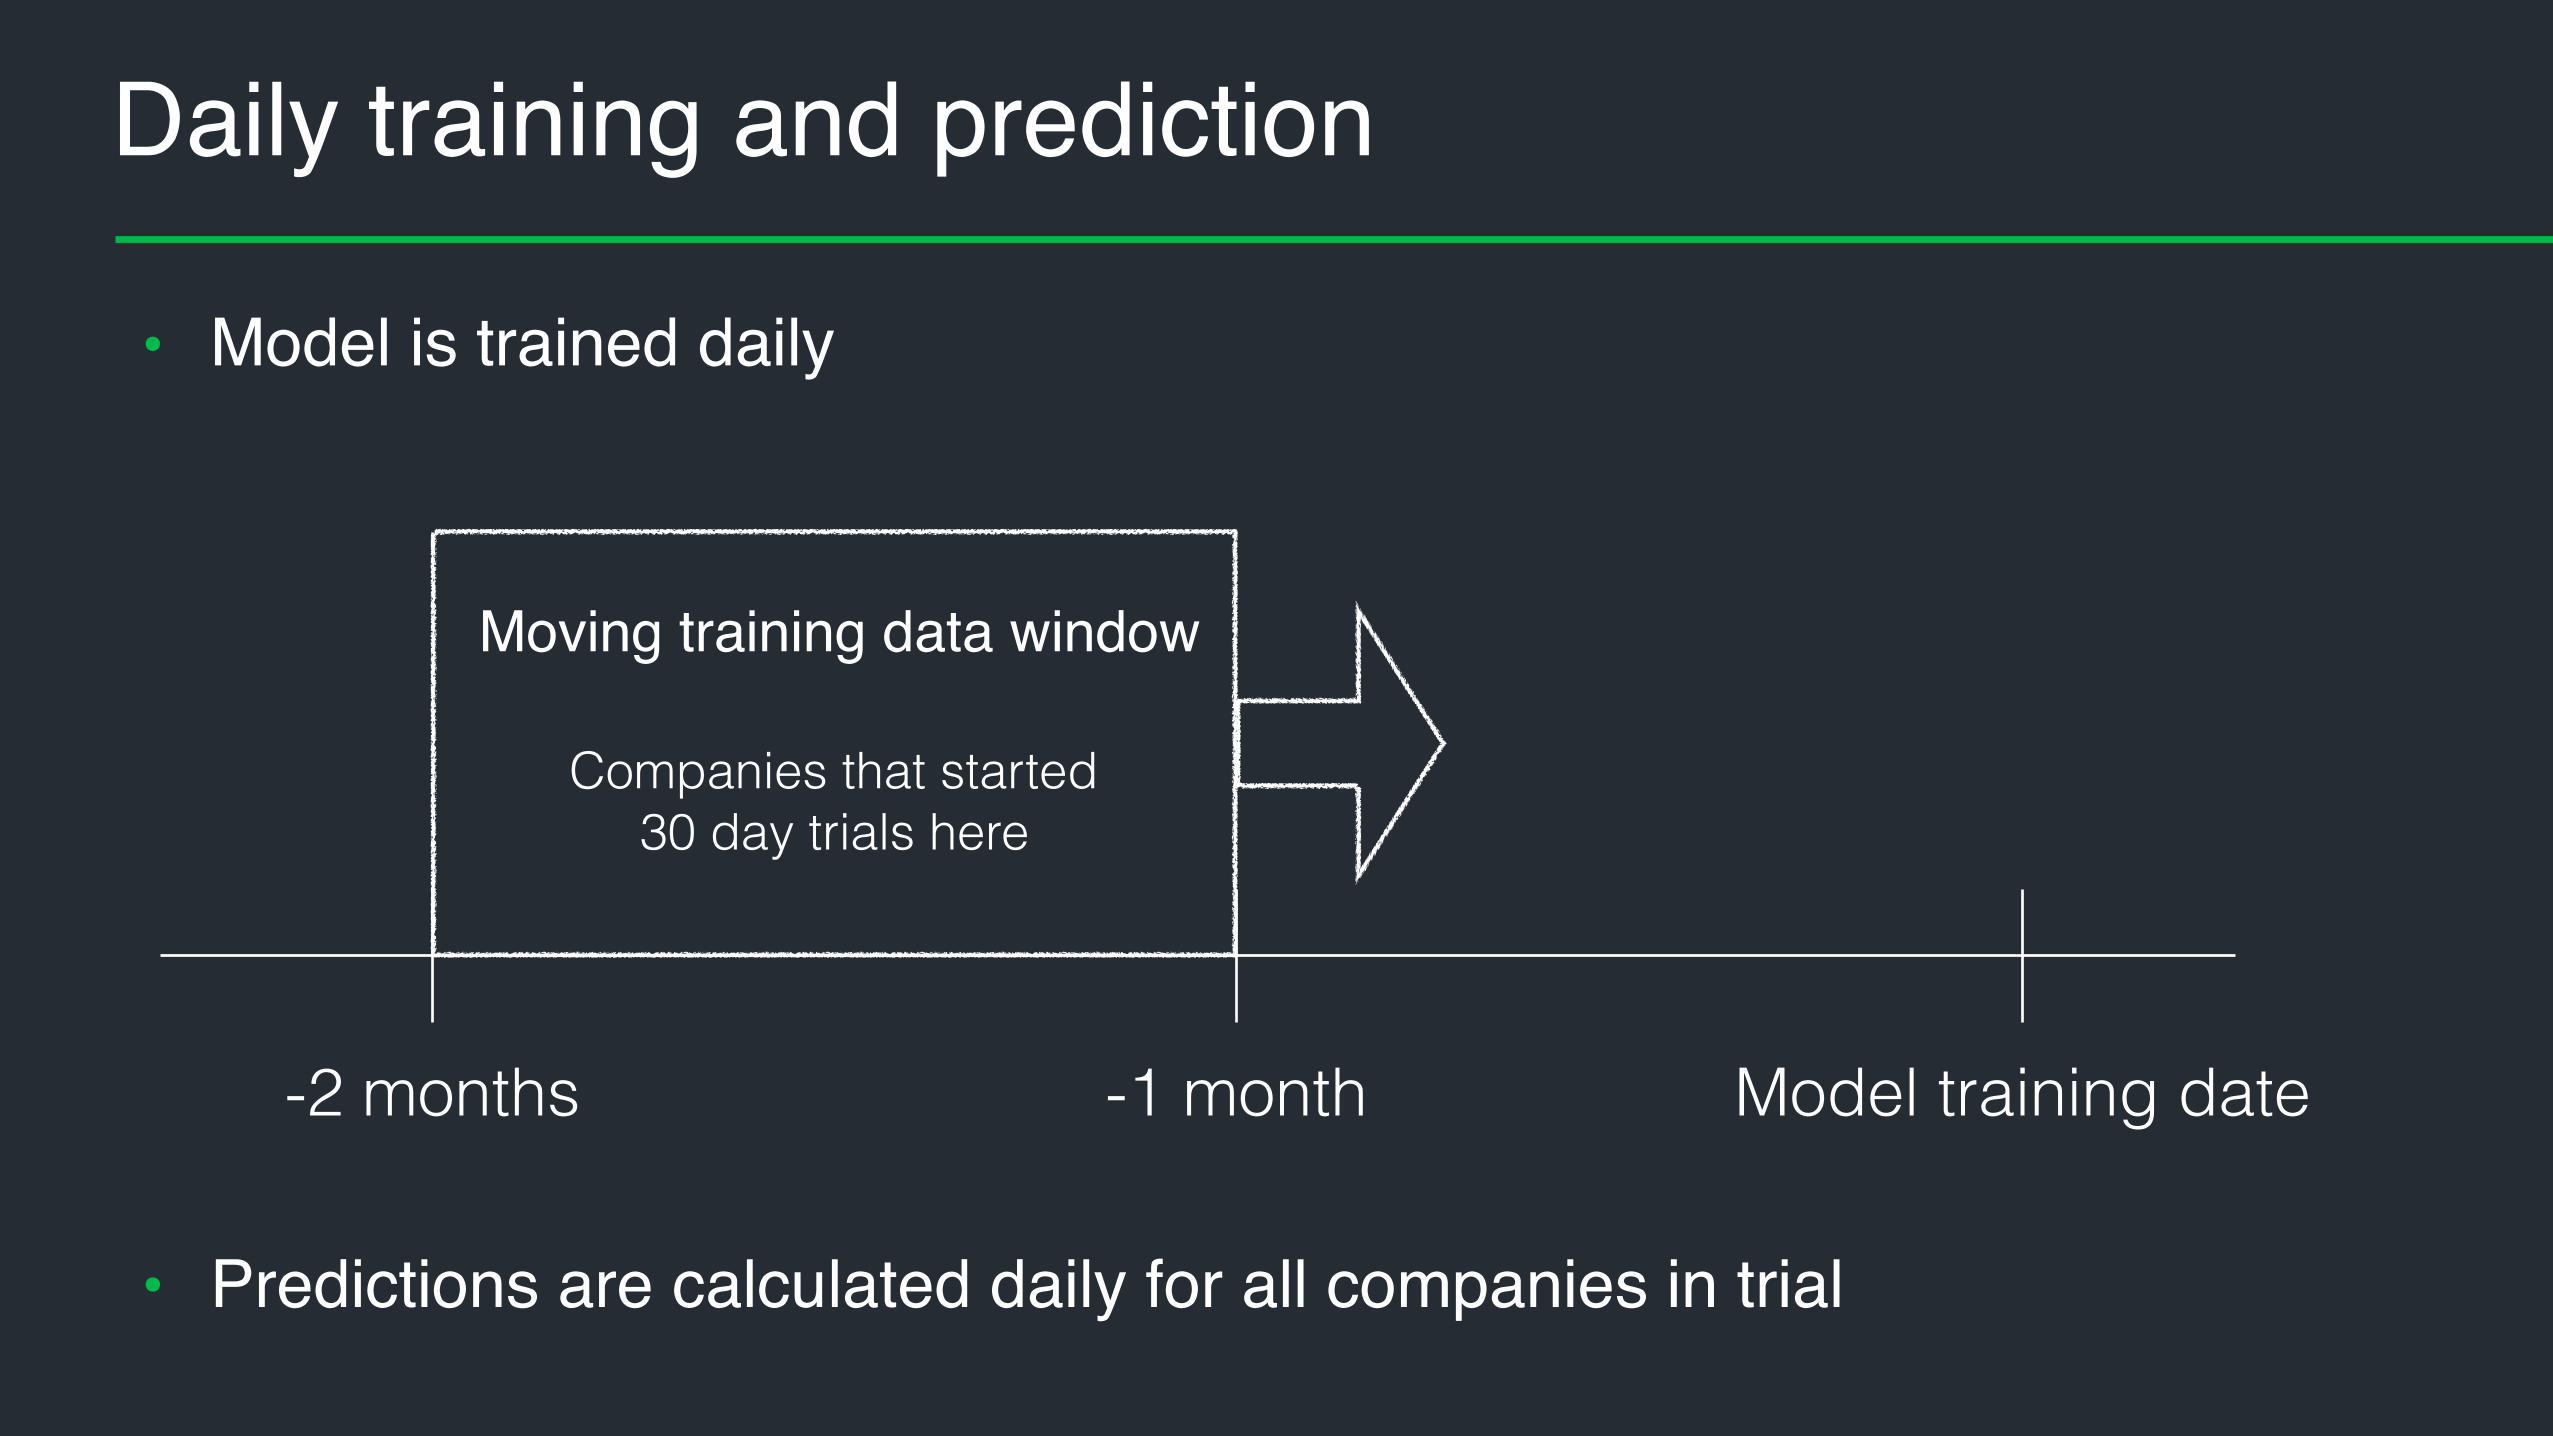
Daily training and prediction
• Model is trained daily
Model training date-1 month-2 months
Companies that started 30 day trials here
Moving training data window
• Predictions are calculated daily for all companies in trial

Model and predictions traceability
• Use cases
• Monitoring processes
• Explaining prediction results
• Relevant data has to be saved for traceability
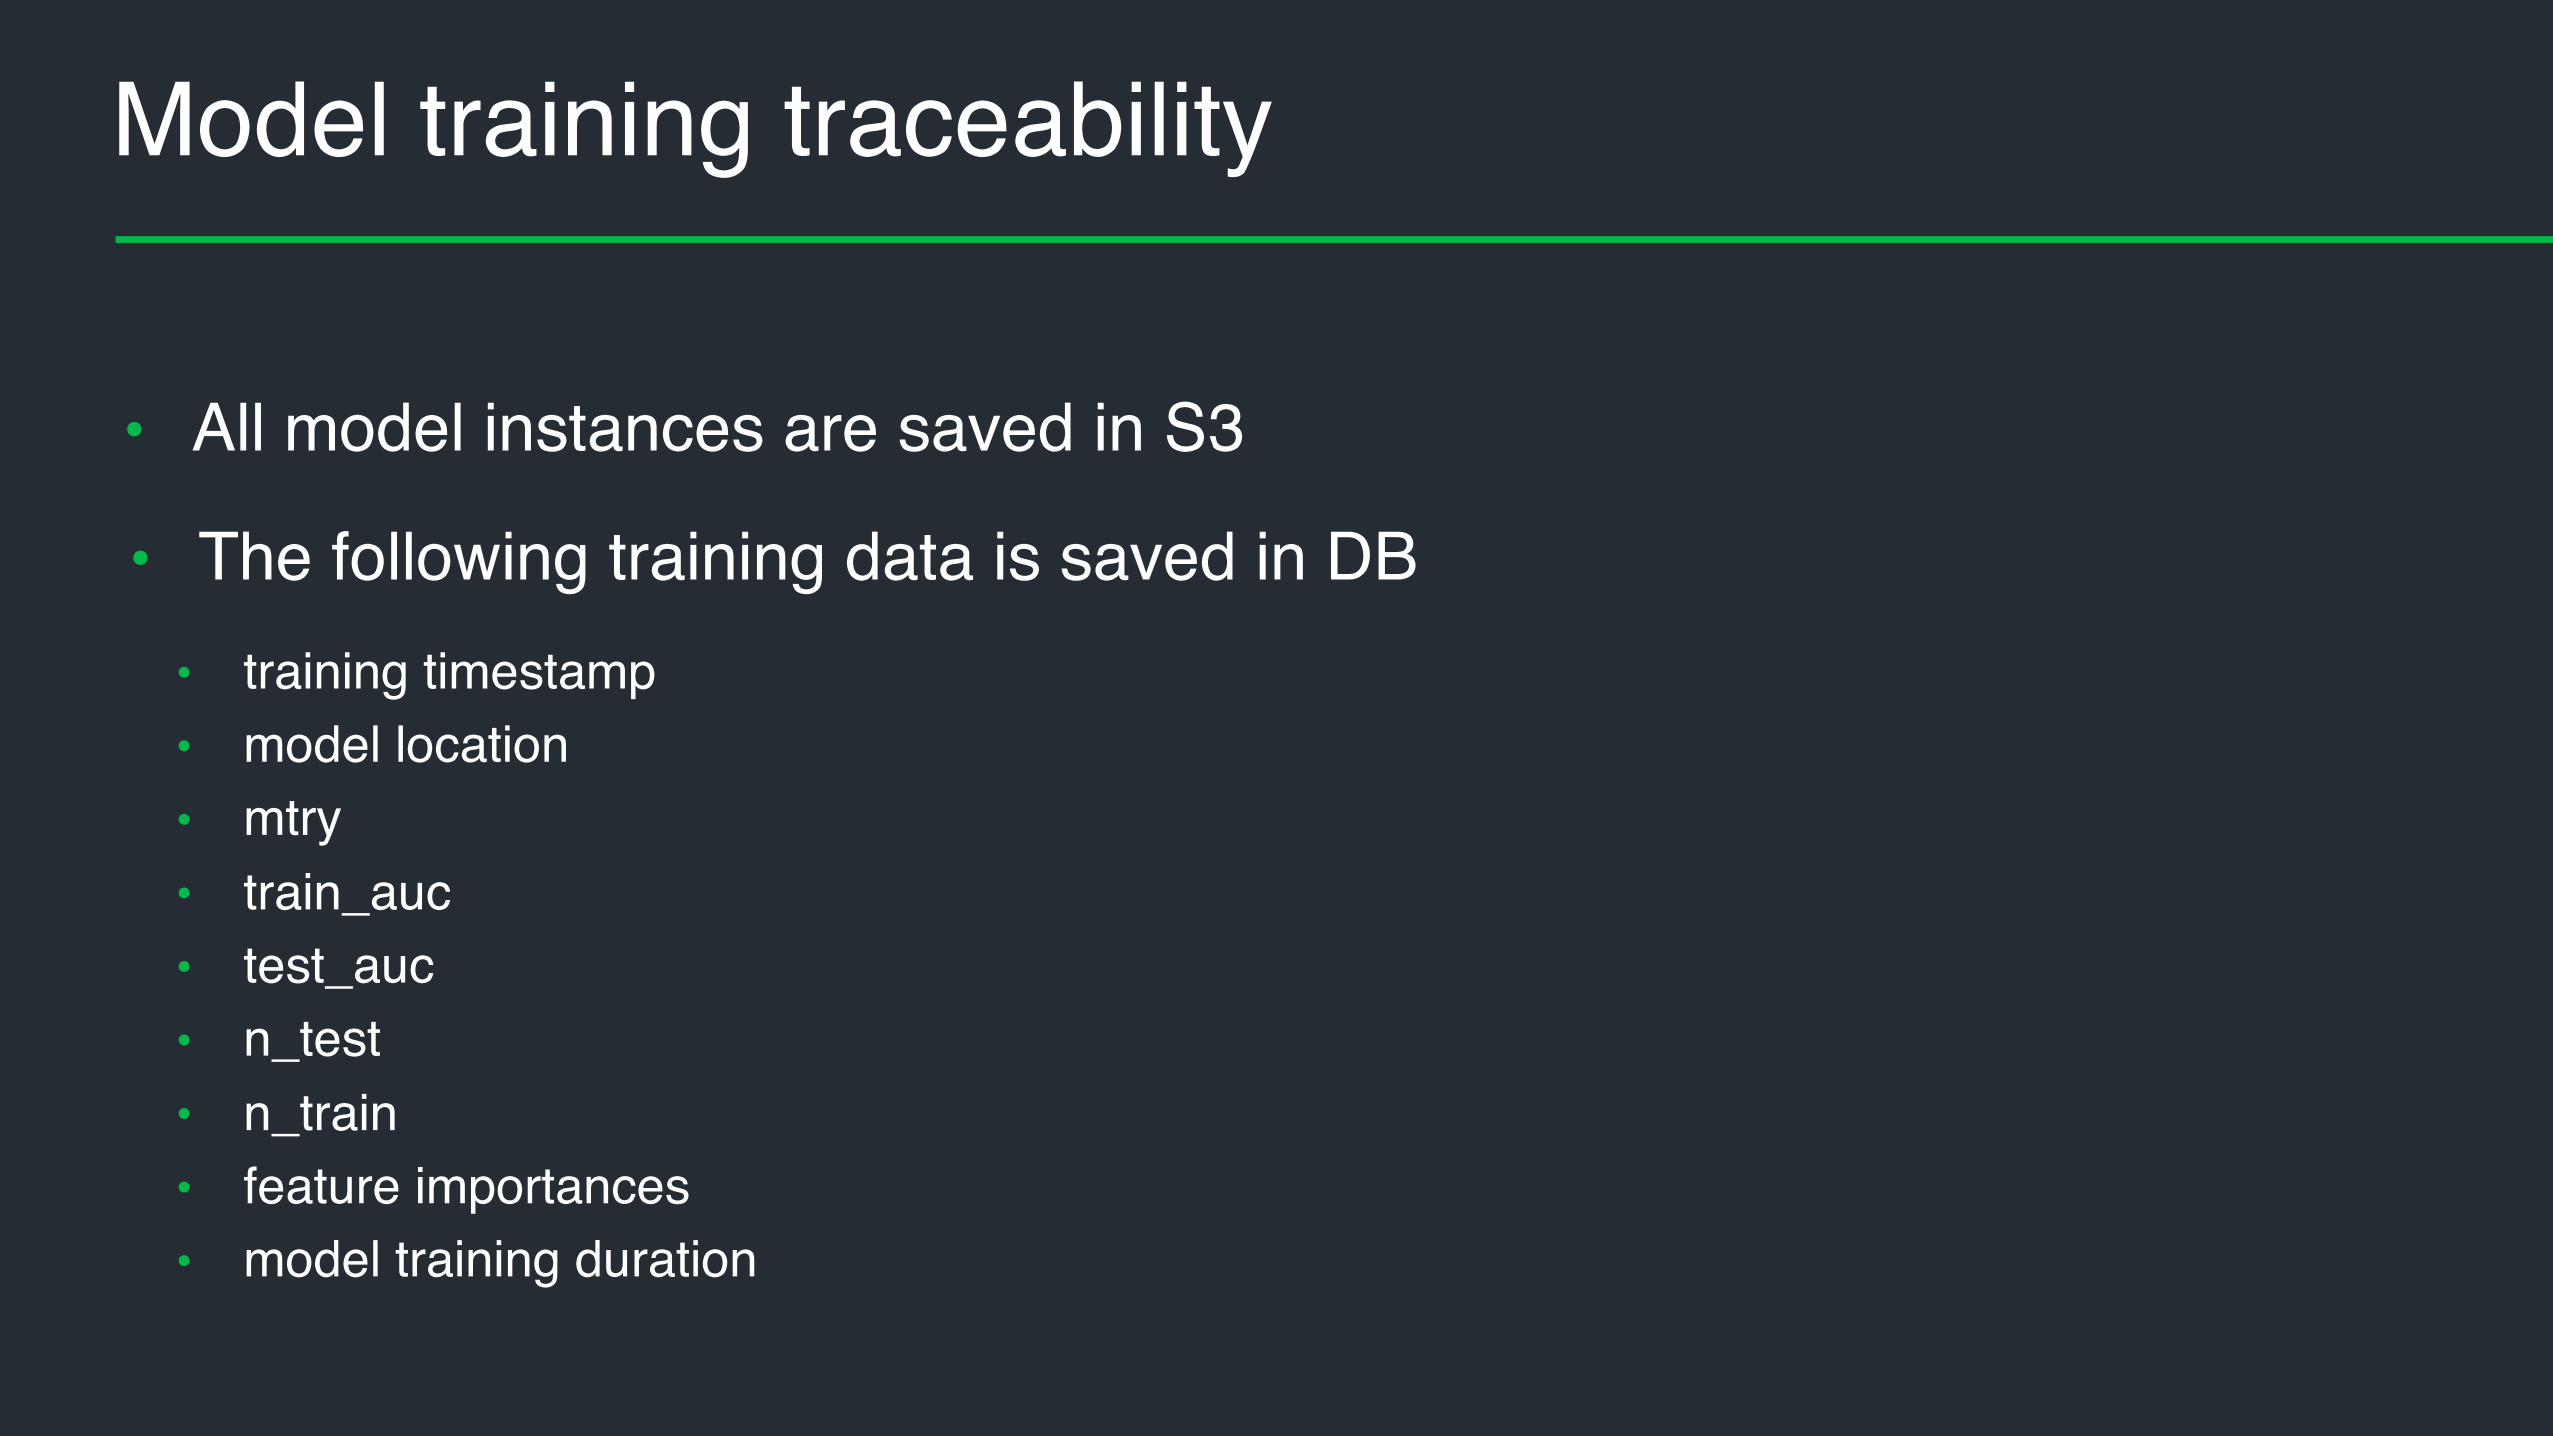
Model training traceability
• All model instances are saved in S3
• The following training data is saved in DB• training timestamp• model location• mtry• train_auc• test_auc• n_test• n_train• feature importances• model training duration
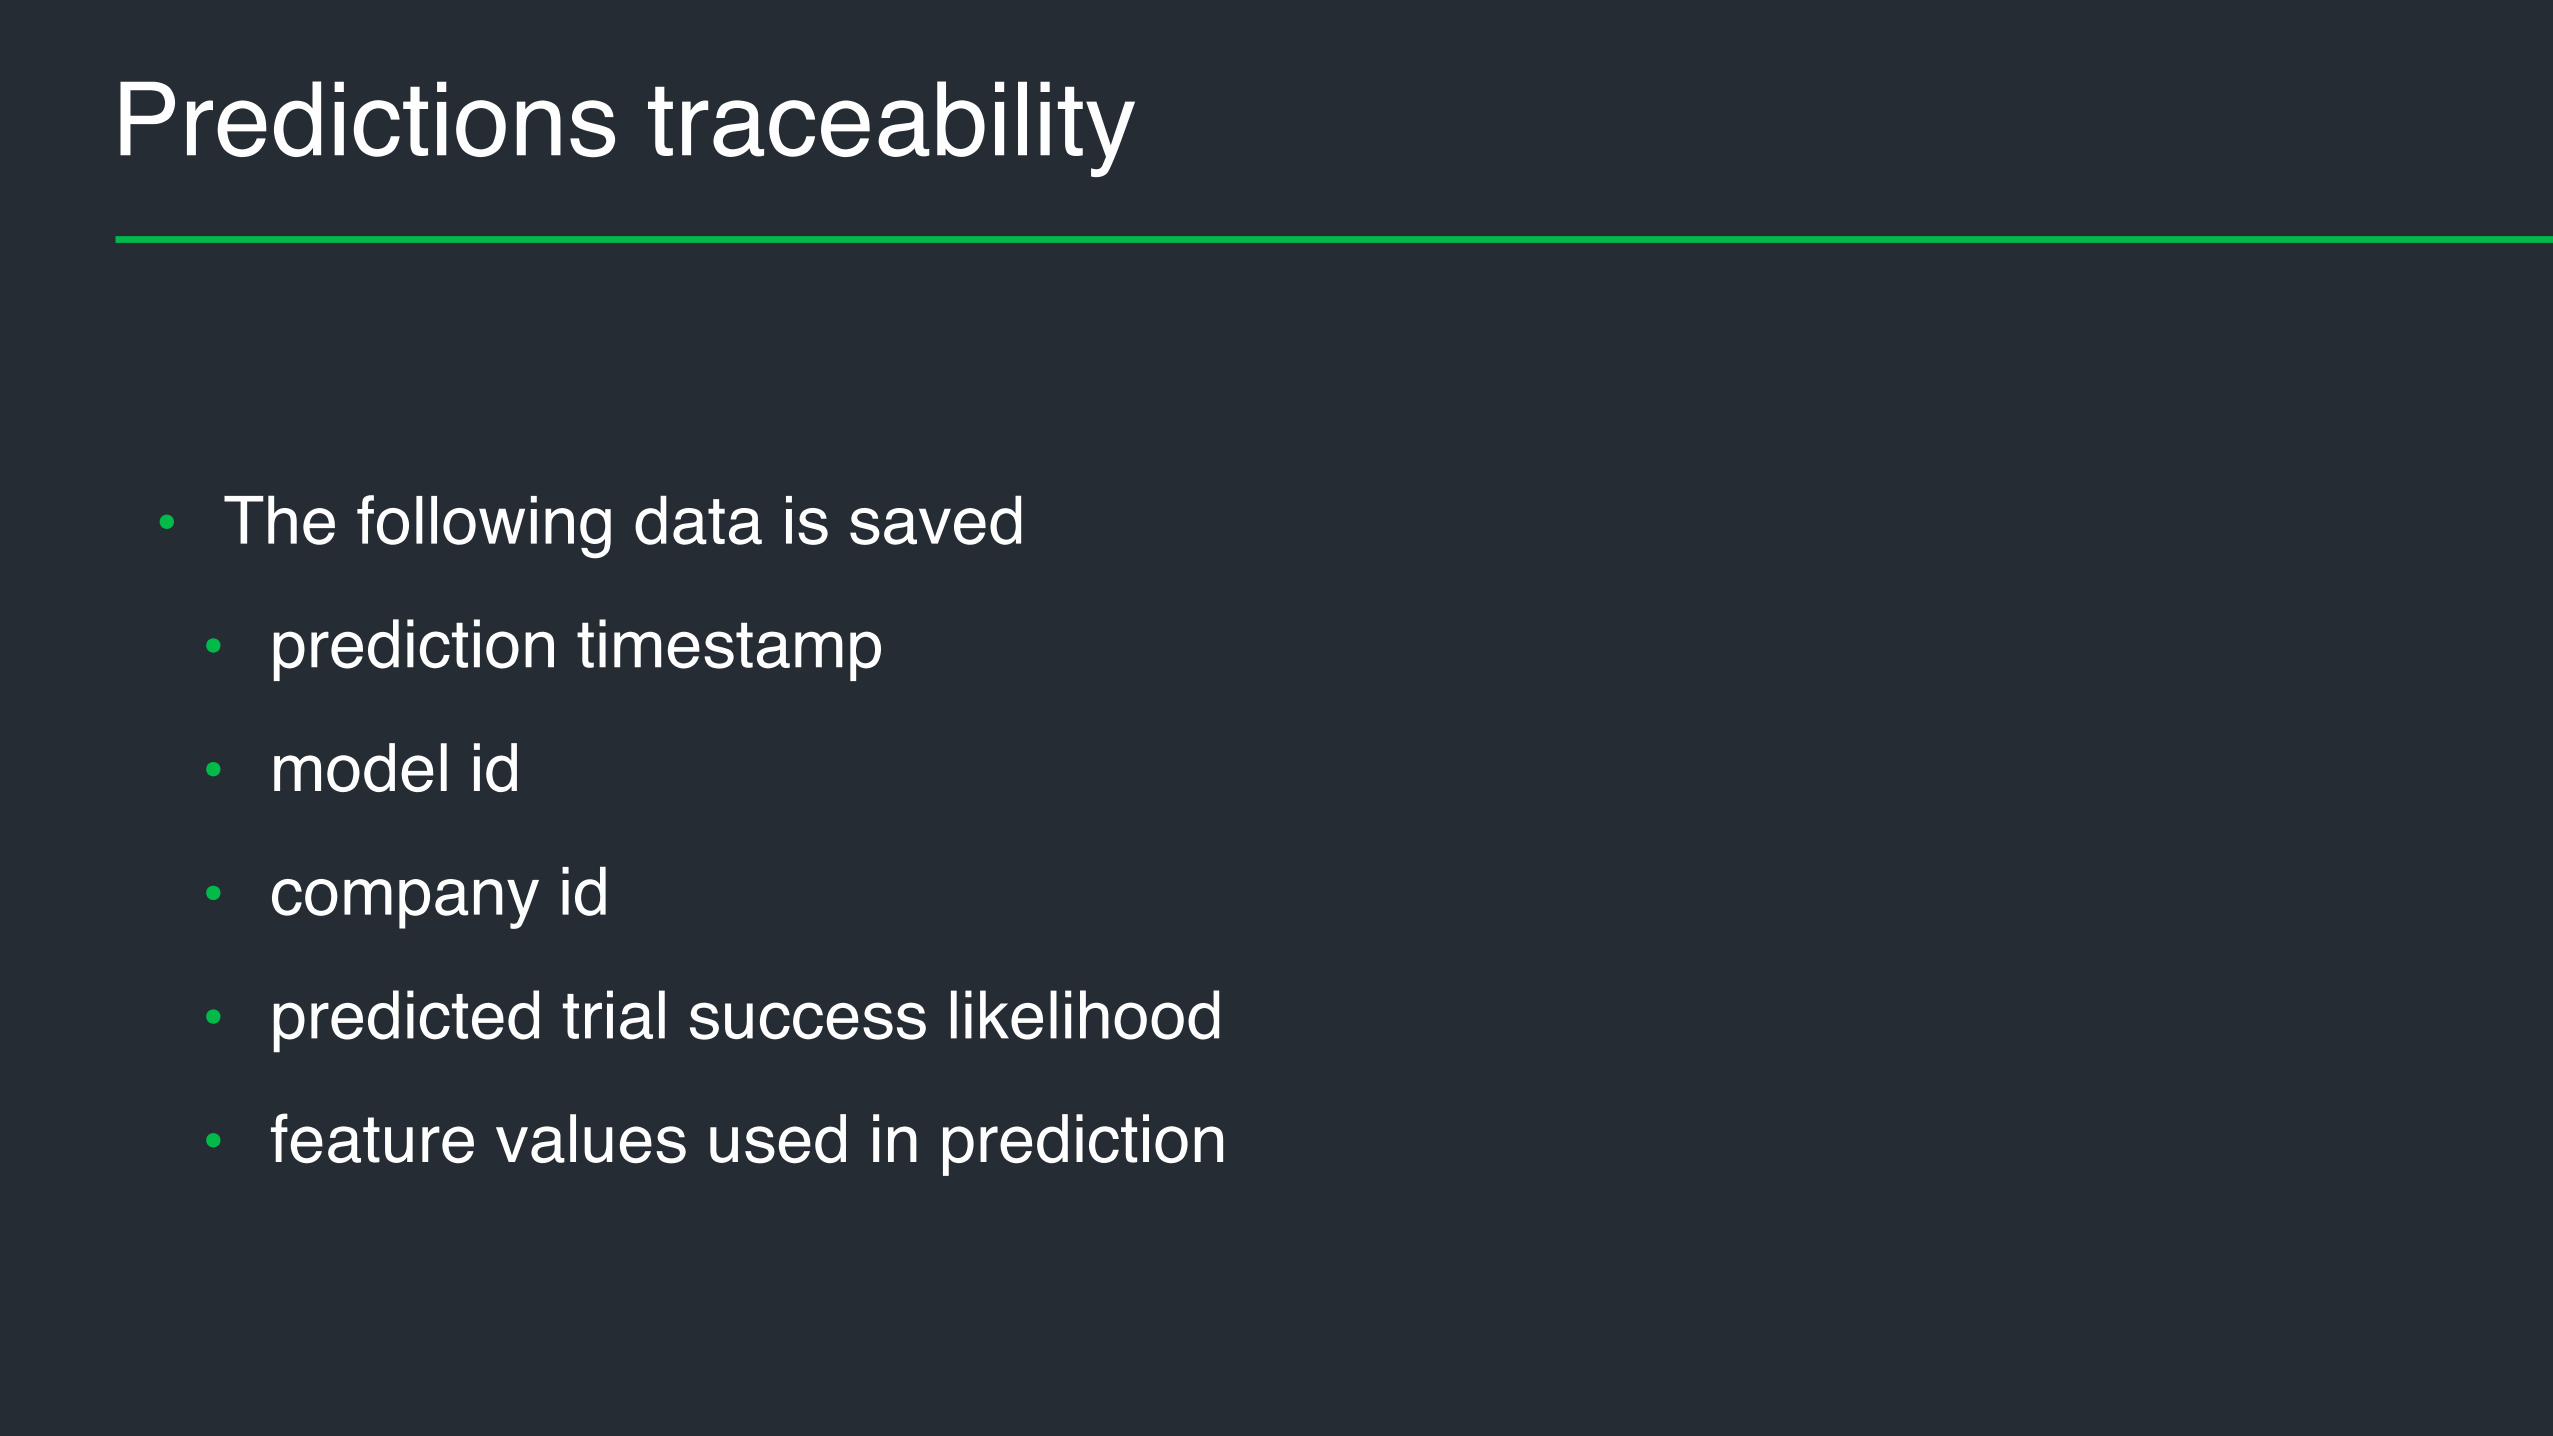
Predictions traceability
• The following data is saved
• prediction timestamp
• model id
• company id
• predicted trial success likelihood
• feature values used in prediction
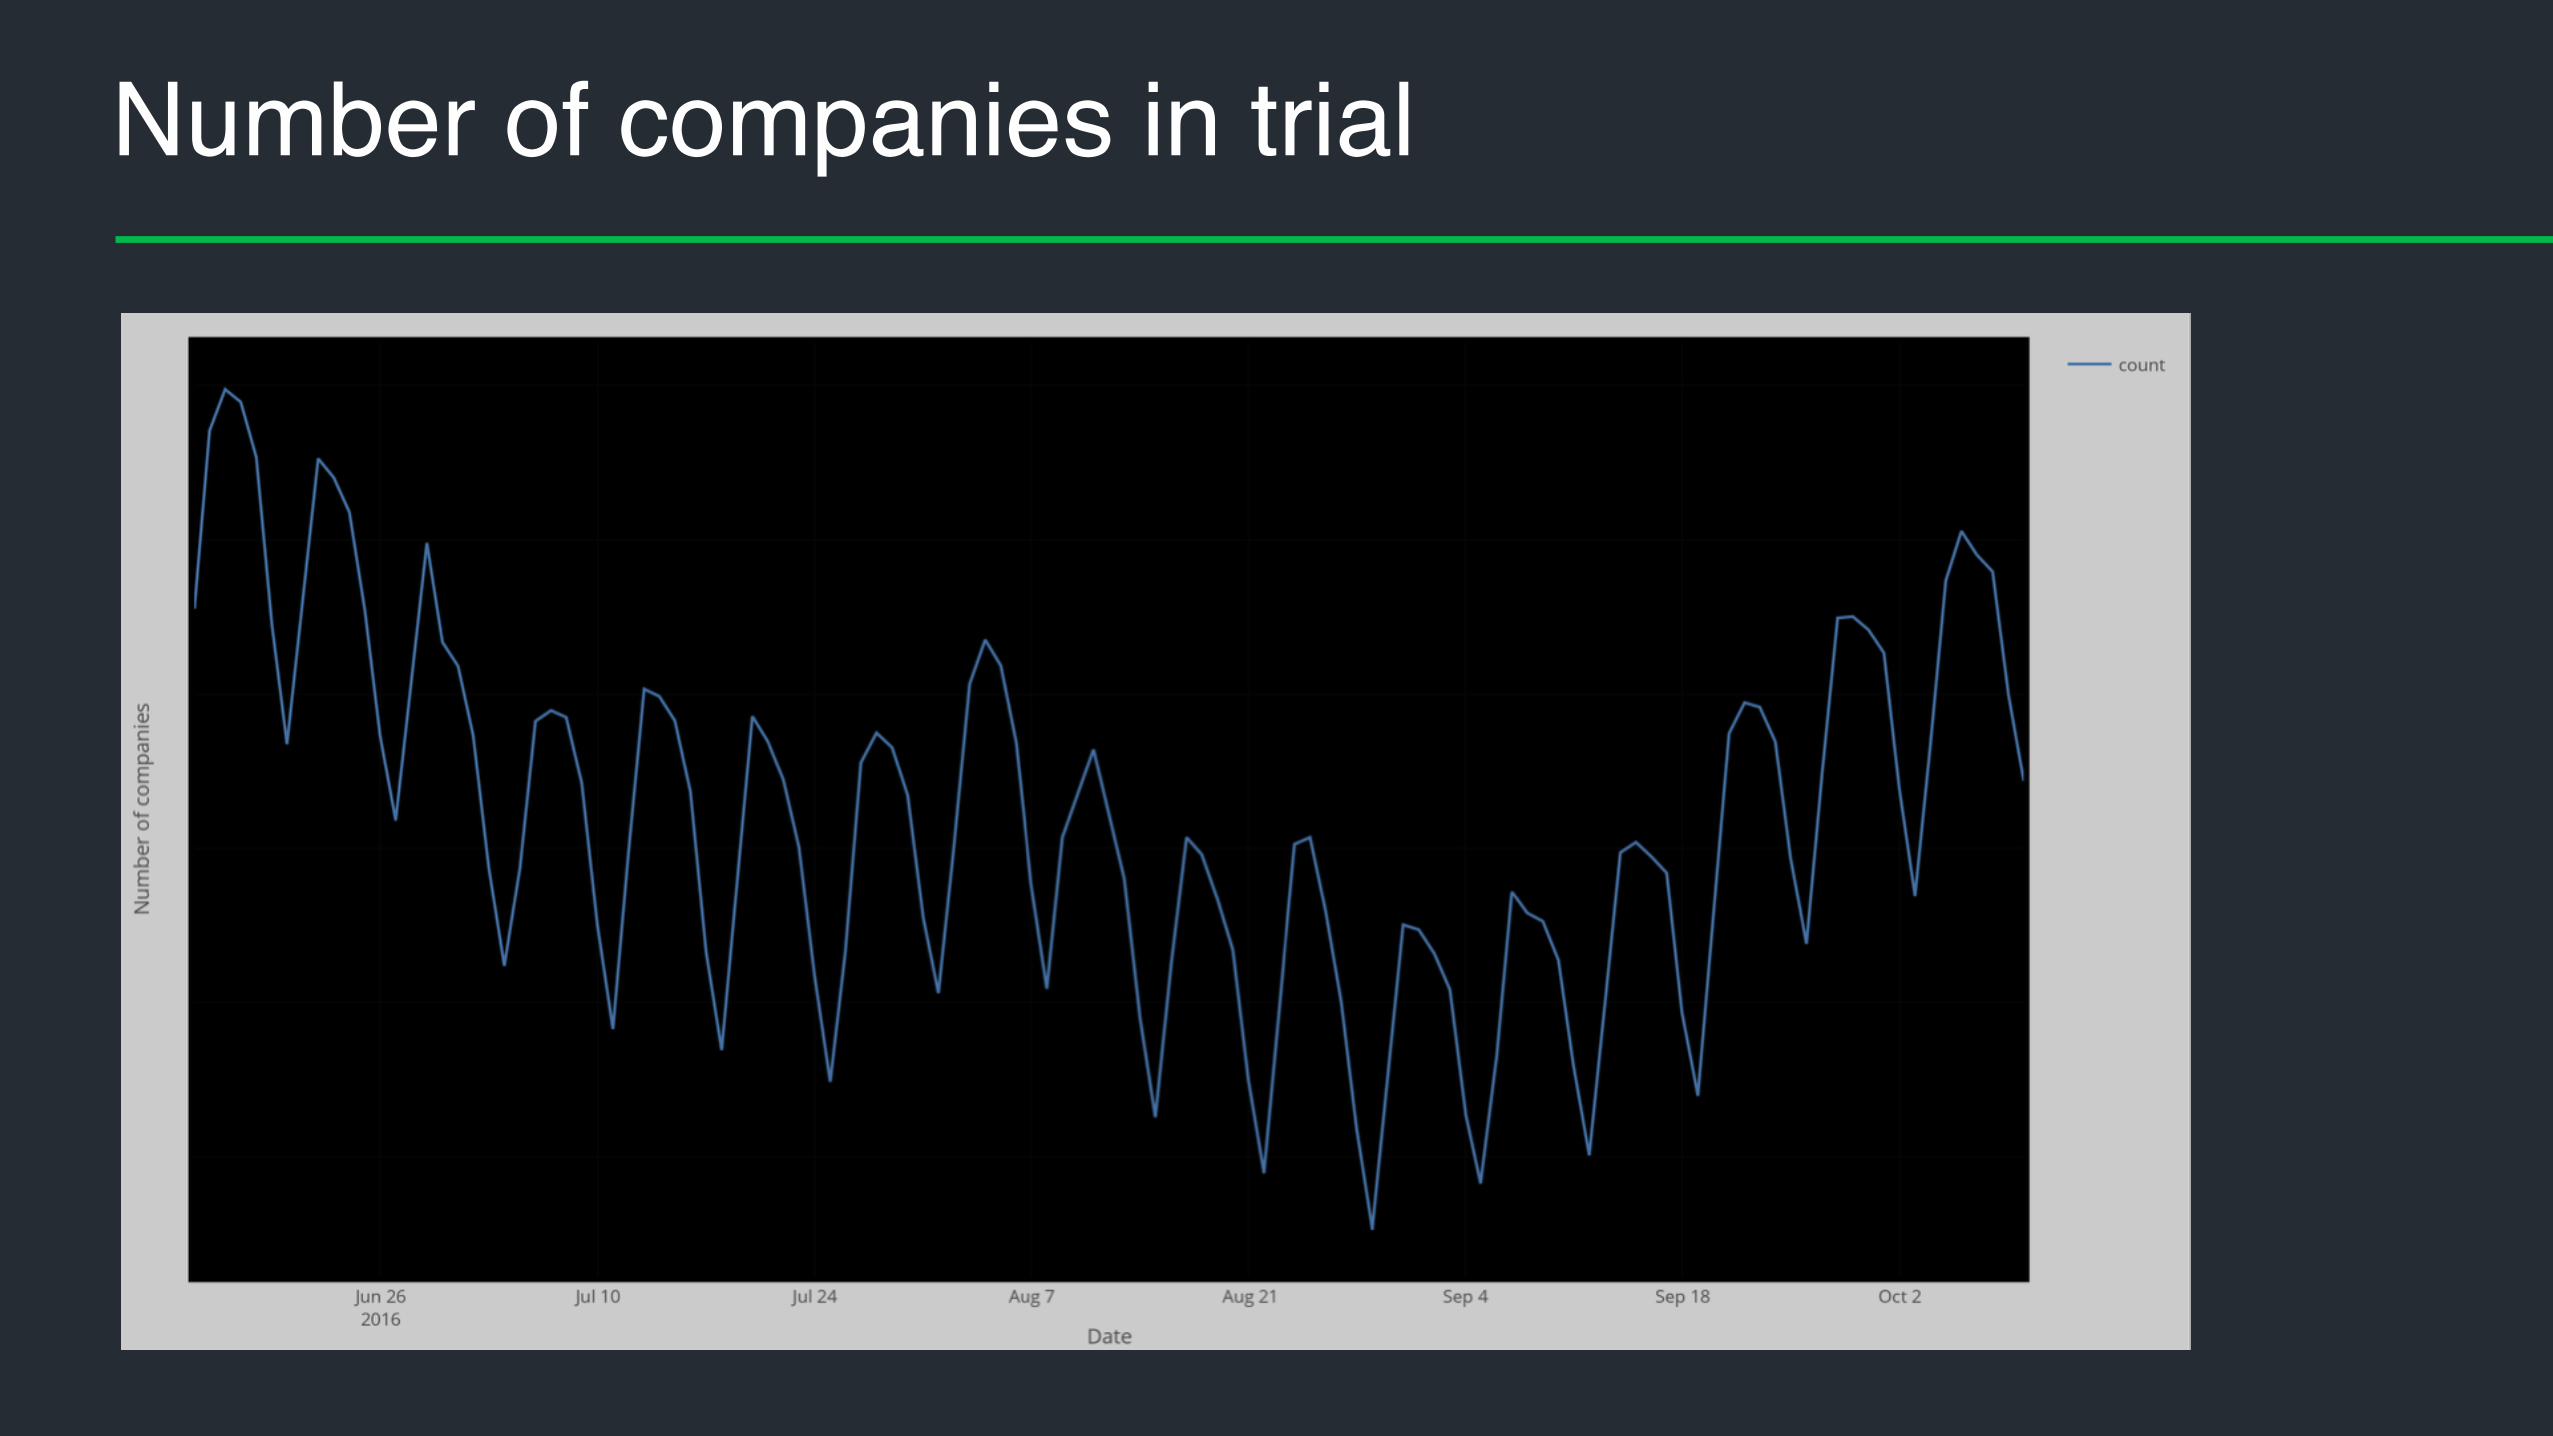
Number of companies in trial

training AUC vs test AUC
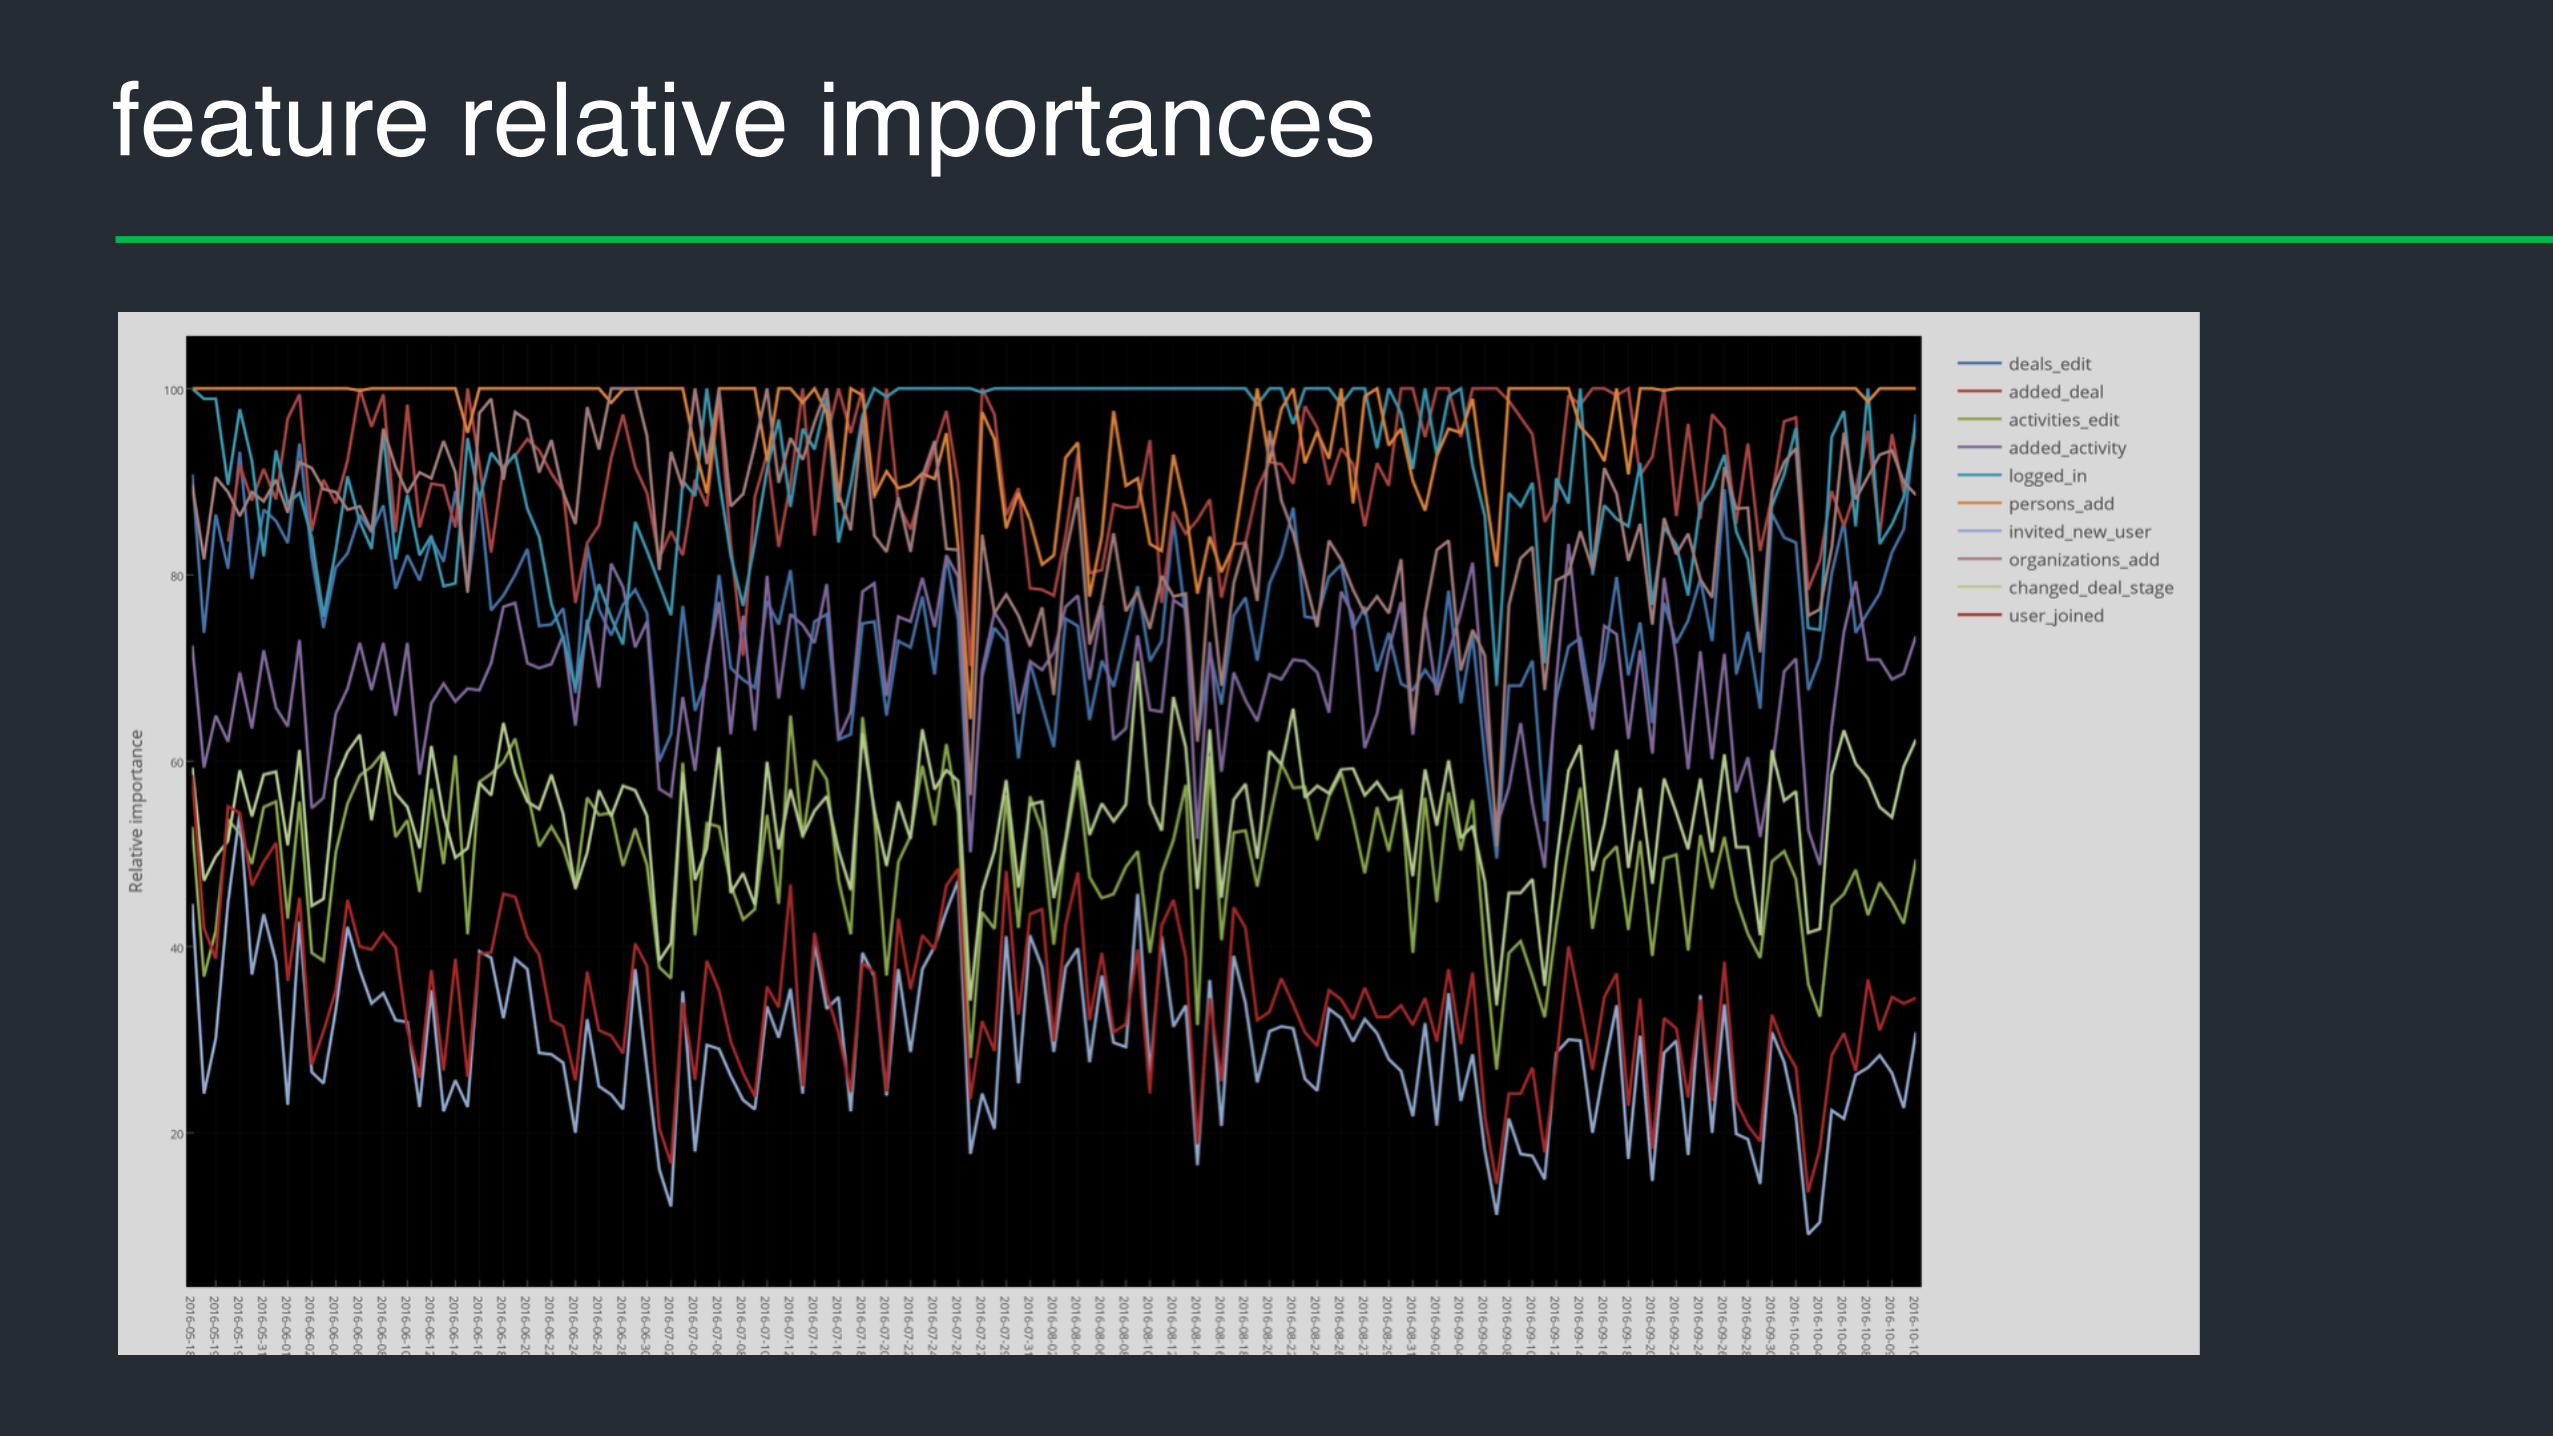
feature relative importances

modelling duration
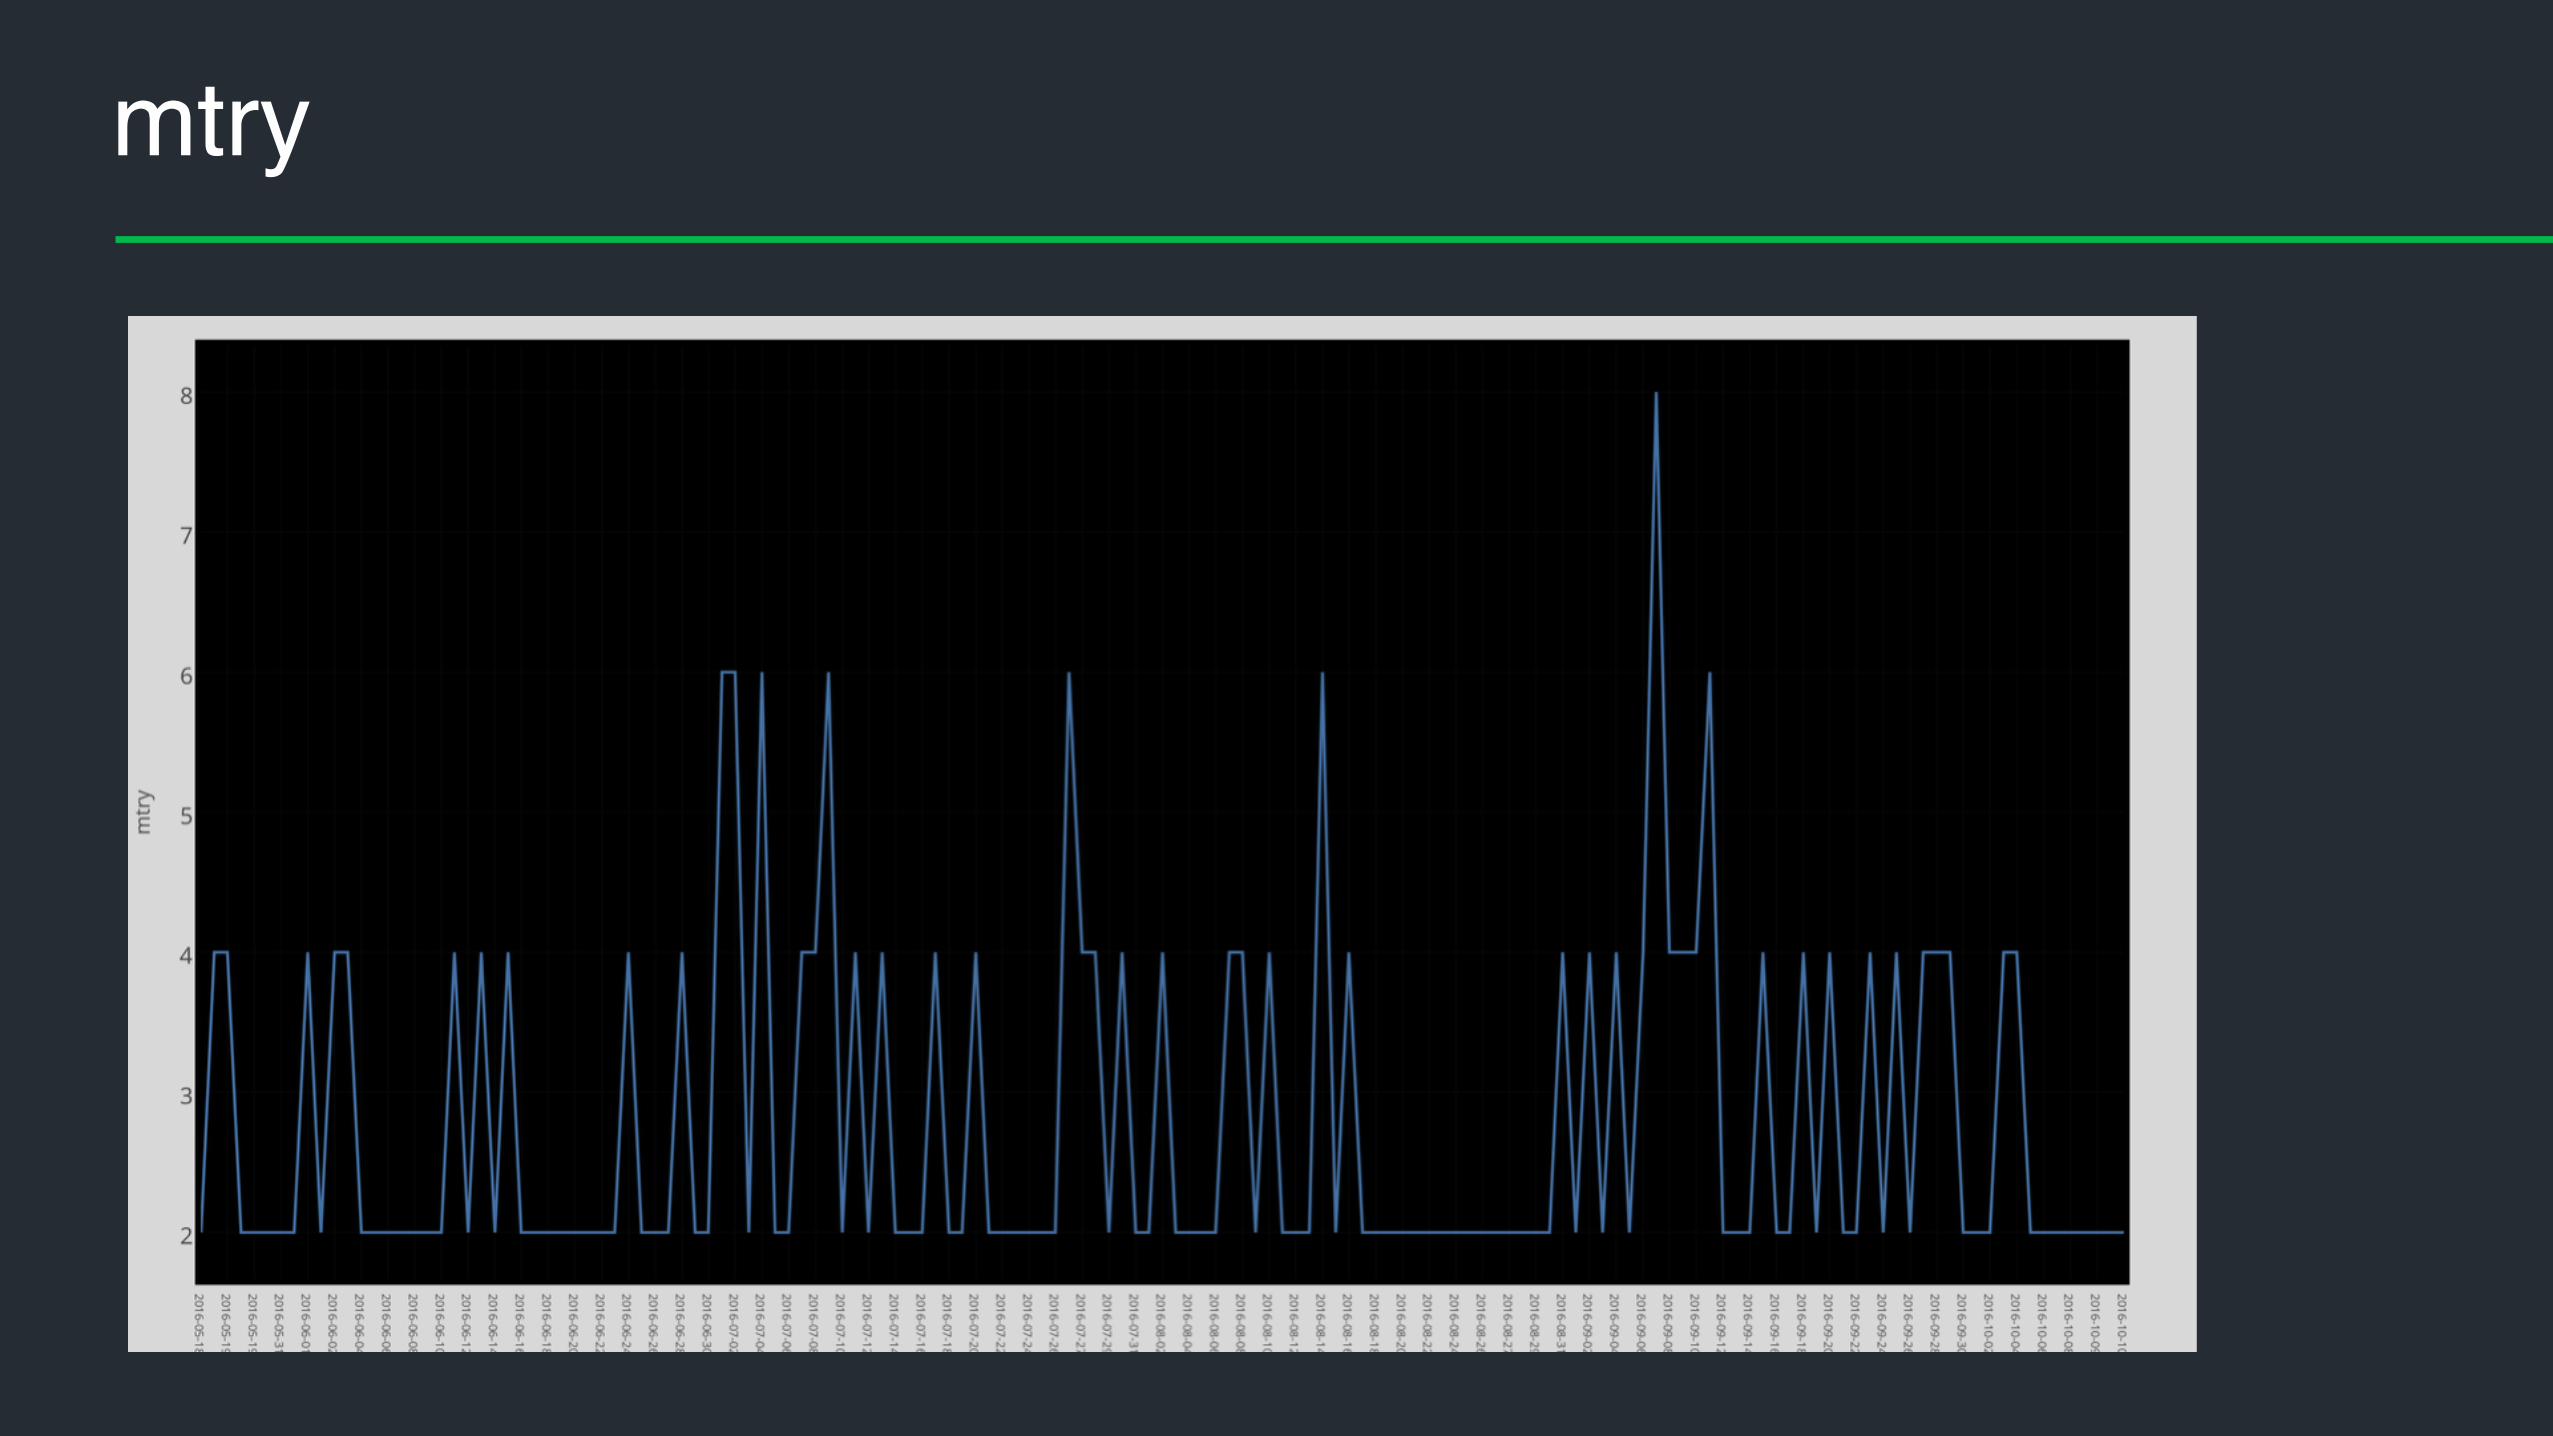
mtry
Recommended