1
Macroprudential indicators of the financial sector
June 2015
Macroeconomic risk indicators ............................................................................................3
1 Manufacturing Purchasing Managers’ Index (PMI) in selected economies .......................3
2 Services Purchasing Managers’ Index (PMI) in selected economies .................................3
3 Consumer confidence indicators in the United States .......................................................3
4 Economic sentiment indicators in the euro area ................................................................3
5 Unemployment rates in selected economies .....................................................................3
6 Consumer price inflation in selected economies ...............................................................3
7 Industrial production indices in selected economies .........................................................4
8 Retail sales indices in selected economies ........................................................................4
9 General government balances of EU countries in 2014 ....................................................4
10 Gross government debt of EU countries in the first quarter of 2015 ................................4
Financial market risk indicators ..........................................................................................4
11 Price commodity indices ................................................................................................4
12 Exchange rate indices ....................................................................................................4
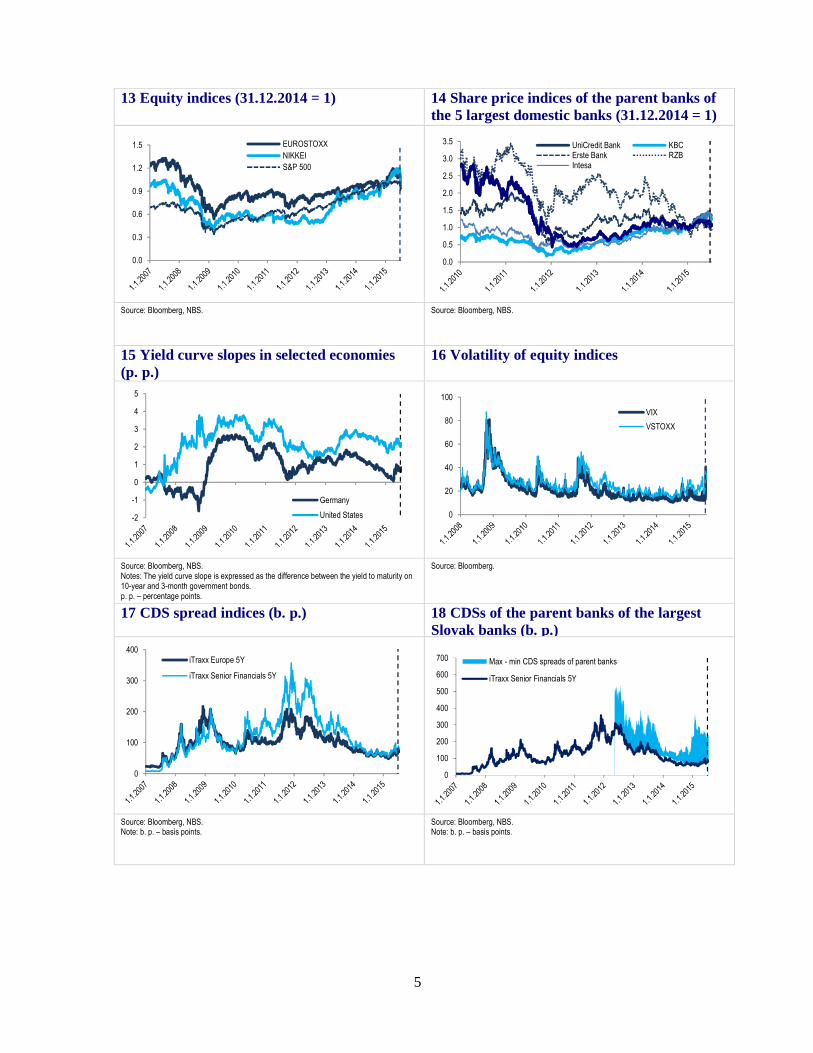
13 Equity indices ................................................................................................................5
14 Share price indices of the parent banks of the 5 largest domestic banks ..........................5
15 Yield curve slopes in selected economies .......................................................................5
16 Volatility of equity indices .............................................................................................5
17 CDS spread indices ........................................................................................................5
18 CDSs of the parent banks of the largest Slovak banks ....................................................5
19 3-month rates and the OIS spread ...................................................................................6
20 Inflation-linked swap prices ...........................................................................................6
21 Credit spreads on 5-year government bonds issued by countries with higher risk ...........6
22 Credit spreads on 5-year government bonds issued by selected central European countries and Germany .......................................................................................................6
Corporate credit risk indicators ..........................................................................................6
23 Export and the business environment .............................................................................6
24 Export and corporate sales .............................................................................................6
25 Sales in selected sectors compared with their level for the period 06/2007 to 06/2008 ....7
26 Corporate loans and sales ...............................................................................................7
27 Interest rate spreads on new loans to enterprises .............................................................7

2
28 Non-performing loans and default rates..........................................................................7
29 Loans at risk ..................................................................................................................7
30 Debt-servicing burden by components ...........................................................................7
31 Commercial real estate: prices (EUR/m2) and vacancy rates in the office segment .........8
32 Commercial real estate: sales of the new apartments in the residential segment ..............8
33 Comparison of corporate balance sheets and sales ..........................................................8
34 Liabilities of non-financial corporations .........................................................................8
Household credit risk indicators ..........................................................................................8
35 Household indebtedness in Slovakia and in selected countries .......................................8
36 Changes in household financial assets ............................................................................8
37 Number of unemployed by income category ..................................................................9
38 Index of employment in selected sectors ........................................................................9
39 Expected employment in selected sectors .......................................................................9
40 Index of real wages in selected sectors ...........................................................................9
41 The consumer confidence index and its components ......................................................9
42 Non-performing household loans ...................................................................................9
43 Loan-to-value (LTV) ratio ........................................................................................... 10
44 Housing affordability index ......................................................................................... 10
Market risk and liquidity risk indicators ......... ................................................................. 10
45 Value at Risk for investments in different types of financial instruments ...................... 10
46 Loan-to-deposit ratio .................................................................................................... 10
47 Liquid asset ratio.......................................................................................................... 10
General notes:
The formulation '31 December 2014 = 1' in the index means that the given index was set in such
a way that its value as at that date (31 December 2014) was 1.

3
Macroeconomic risk indicators
1 Manufacturing Purchasing Managers’ Index (PMI) in selected economies
2 Services Purchasing Managers’ Index (PMI) in selected economies
Source: Bloomberg. Note: PMI (Purchasing Managers’ Index) is an indicator of the economic health of the manufacturing or service sector: an index value of more than 50 represents expansion, while a value of below 50 represents contraction.
Source: Bloomberg. Note: PMI (Purchasing Managers’ Index) is an indicator of the economic health of the manufacturing or service sector: an index value of more than 50 represents expansion, while a value of below 50 represents contraction. 3 Consumer confidence indicators in the
United States 4 Economic sentiment indicators in the euro area
Source: Bloomberg. Note: The chart refers to US consumer confidence indices produced by two different institutions.
Source: Bloomberg. Notes: ESI is the Economic Sentiment Indicator compiled by the European Commission. ZEW represents the economic sentiment indicator compiled by a private company ZEW (Zentrum für Europäische Wirtschaftsforschung).
5 Unemployment rates in selected economies 6 Consumer price inflation in selected economies
Source: Eurostat, Bureau of Labor Statistics. Note: Seasonally adjusted.
Source: Eurostat, Bureau of Labor Statistics. Note: Year-on-year percentage changes in the consumer price indices.
30
35
40
45
50
55
60
65
XII.0
6
VI.0
7
XII.0
7
VI.0
8
XII.0
8
VI.0
9
XII.0
9
VI.1
0
XII.1
0
VI.1
1
XII.1
1
VI.1
2
XII.1
2
VI.1
3
XII.1
3
VI.1
4
XII.1
4
VI.1
5
Euro area United States China
30
35
40
45
50
55
60
65
XII.0
6
VI.0
7
XII.0
7
VI.0
8
XII.0
8
VI.0
9
XII.0
9
VI.1
0
XII.1
0
VI.1
1
XII.1
1
VI.1
2
XII.1
2
VI.1
3
XII.1
3
VI.1
4
XII.1
4
VI.1
5
Euro area United States
20
40
60
80
100
120
XII.0
6
VI.0
7
XII.0
7
VI.0
8
XII.0
8
VI.0
9
XII.0
9
VI.1
0
XII.1
0
VI.1
1
XII.1
1
VI.1
2
XII.1
2
VI.1
3
XII.1
3
VI.1
4
XII.1
4
VI.1
5
Conference Board Consumer Confidence IndexUniversity of Michigan Consumer Sentiment Index
-90
-60
-30
0
30
60
90
60
70
80
90
100
110
XII.0
7
VI.0
8
XII.0
8
VI.0
9
XII.0
9
VI.1
0
XII.1
0
VI.1
1
XII.1
1
VI.1
2
XII.1
2
VI.1
3
XII.1
3
VI.1
4
XII.1
4
VI.1
5
ESI ZEW (right-hand scale)
3%
5%
7%
9%
11%
13%
15%
XII.0
6
VI.0
7
XII.0
7
VI.0
8
XII.0
8
VI.0
9
XII.0
9
VI.1
0
XII.1
0
VI.1
1
XII.1
1
VI.1
2
XII.1
2
VI.1
3
XII.1
3
VI.1
4
XII.1
4
VI.1
5
Euro area United States Slovakia
-1%
0%
1%
2%
3%
4%
5%
XII.0
9
VI.1
0
XII.1
0
VI.1
1
XII.1
1
VI.1
2
XII.1
2
VI.1
3
XII.1
3
VI.1
4
XII.1
4
VI.1
5
Euro area United States Slovakia

4
7 Industrial production indices in selected economies
8 Retail sales indices in selected economies
Source: Eurostat, US Federal Reserve. Notes: Rebalanced (average: 2007 = 100). Seasonally adjusted.
Source: Eurostat, US Department of Commerce. Notes: Rebalanced (average 2007 = 100). Seasonally adjusted.
9 General government balances of EU countries in 2014
10 Gross government debt of EU countries in the first quarter of 2015
Source: Eurostat. Note: Balance is expressed as a percentage of GDP.
Source: Eurostat. Note: Gross government debt is expressed as a percentage of GDP.
Financial market risk indicators
11 Price commodity indices (31.12.2014 = 1) 12 Exchange rate indices (31.12.2014 = 1)
Source: Bloomberg, NBS.
Source: Bloomberg, NBS.
80
90
100
110
120
130
140XI
I.06
VI.0
7
XII.0
7
VI.0
8
XII.0
8
VI.0
9
XII.0
9
VI.1
0
XII.1
0
VI.1
1
XII.1
1
VI.1
2
XII.1
2
VI.1
3
XII.1
3
VI.1
4
XII.1
4
VI.1
5
Euro area United States Slovakia Germany
90
95
100
105
110
115
120
125
XII.0
6
VI.0
7
XII.0
7
VI.0
8
XII.0
8
VI.0
9
XII.0
9
VI.1
0
XII.1
0
VI.1
1
XII.1
1
VI.1
2
XII.1
2
VI.1
3
XII.1
3
VI.1
4
XII.1
4
VI.1
5
Euro area United States Slovakia Germany
-12%
-9%
-6%
-3%
0%
3%
Cyp
rus
Spai
nU
KC
roat
iaSl
oven
iaPo
rtuga
lIre
land
Fran
ceG
reec
ePo
land
Belg
ium
Finl
and
Italy
Slov
akia
Bulg
aria
Hun
gary
Euro
are
aAu
stria
Net
herla
nds
Mal
taC
zech
Rep
ublic
Swed
enR
oman
iaLa
tvia
Lith
uani
aEs
toni
aLu
xem
bour
gG
erm
any
Den
mar
k
0%
30%
60%
90%
120%
150%
180%
Gre
ece
Italy
Portu
gal
Belg
ium
Irela
ndC
ypru
sSp
ain
Fran
ceEu
ro a
rea
GB
Cro
atia
Aust
riaSl
oven
iaH
unga
ryG
erm
any
Mal
taN
ethe
rland
sFi
nlan
dSl
ovak
iaPo
land
Den
mar
kSw
eden
Cze
ch R
epub
licR
oman
iaLi
thua
nia
Latv
iaBu
lgar
iaLu
xem
bour
gEs
toni
a
0.0
0.3
0.6
0.9
1.2
1.5
1.8
Brent oil price index
Gold price index
0.7
0.8
0.9
1.0
1.1
1.2
1.3
1.4 USD / EUR CZK / EUR
HUF / EUR PLN / EUR
5
13 Equity indices (31.12.2014 = 1) 14 Share price indices of the parent banks of the 5 largest domestic banks (31.12.2014 = 1)
Source: Bloomberg, NBS. Source: Bloomberg, NBS.
15 Yield curve slopes in selected economies (p. p.)
16 Volatility of equity indices
Source: Bloomberg, NBS. Notes: The yield curve slope is expressed as the difference between the yield to maturity on 10-year and 3-month government bonds. p. p. – percentage points.
Source: Bloomberg.
17 CDS spread indices (b. p.)
18 CDSs of the parent banks of the largest Slovak banks (b. p.)
Source: Bloomberg, NBS. Note: b. p. – basis points.
Source: Bloomberg, NBS. Note: b. p. – basis points.
0.0
0.3
0.6
0.9
1.2
1.5 EUROSTOXXNIKKEIS&P 500
0.0
0.5
1.0
1.5
2.0
2.5
3.0
3.5 UniCredit Bank KBCErste Bank RZBIntesa
-2
-1
0
1
2
3
4
5
Germany
United States 0
20
40
60
80
100
VIX
VSTOXX
0
100
200
300
400iTraxx Europe 5Y
iTraxx Senior Financials 5Y
0
100
200
300
400
500
600
700 Max - min CDS spreads of parent banks
iTraxx Senior Financials 5Y

6
19 3-month rates and the OIS spread (%, p. p.)
20 Inflation-linked swap prices (p. p.)
Source: Bloomberg, NBS. Note: p. p. – percentage points.
Source: Bloomberg, NBS. Notes: Inflation-linked swaps are swap transactions in which one counterparty pays a fixed rate (a swap price) and the other pays a rate corresponding to the return on a selected price index. The inflation-linked swap price is calculated on a non-coupon basis. p. p. – percentage points.
21 Credit spreads on 5-year government bonds issued by countries with higher risk (p. p.)
22 Credit spreads on 5-year government bonds issued by selected central European countries and Germany (p. p.)
Source: Bloomberg, NBS. Notes: The vertical scales shows differences between yields on 5-year bonds issued by the different countries and 5-year OIS rates, representing a 5-year interest rate on high-rated bonds. p. p. – percentage points.
Source: Bloomberg, NBS. Notes: The Chart shows percentage differences between yields on 5-year government bonds denominated in the domestic currencies of the countries and 5-year swap rates for the respective currencies. p. p. – percentage points.
Corporate credit risk indicators
23 Export and the business environment
24 Export and corporate sales
Source: NBS, OECD, Statistics Office of the SR. Source: Ministry of Economy of the SR, NBS, OECD, Statistical Office of the SR.
0
1
2
3
4
5
6
OIS Spread
3-month EURIBOR
3-month OIS
-6
-4
-2
0
2
4
5-year swaps linked to euro area inflation5-year swaps linked to US inflation1-year swaps linked to euro area inflation1-year swaps linked to US inflation
0
20
40
60
0
5
10
15
20
25IrelandItalySpainPortugalGreece (right-hand scale)
-2
-1
0
1
2
3
4 SlovakiaCzech RepublicPolandGermany
-45%
-30%
-15%
0%
15%
30%
45%
70
80
90
100
110
120
130
XII.0
8
VI.0
9
XII.0
9
VI.1
0
XII.1
0
VI.1
1
XII.1
1
VI.1
2
XII.1
2
VI.1
3
XII.1
3
VI.1
4
XII.1
4
Business sentiment - Slovakia (left-hand scale)Business sentiment - main trading partners (left-hand scale)Economic Sentiment Indicator (left-hand scale)Export - annual rate of change (right-hand scale)
-45%
-30%
-15%
0%
15%
30%
45%
XII.0
8
VI.0
9
XII.0
9
VI.1
0
XII.1
0
VI.1
1
XII.1
1
VI.1
2
XII.1
2
VI.1
3
XII.1
3
VI.1
4
XII.1
4
Export - annual rate of changeSales in total - annual rate of changeSales weighted by bank exposures - annual rate of change
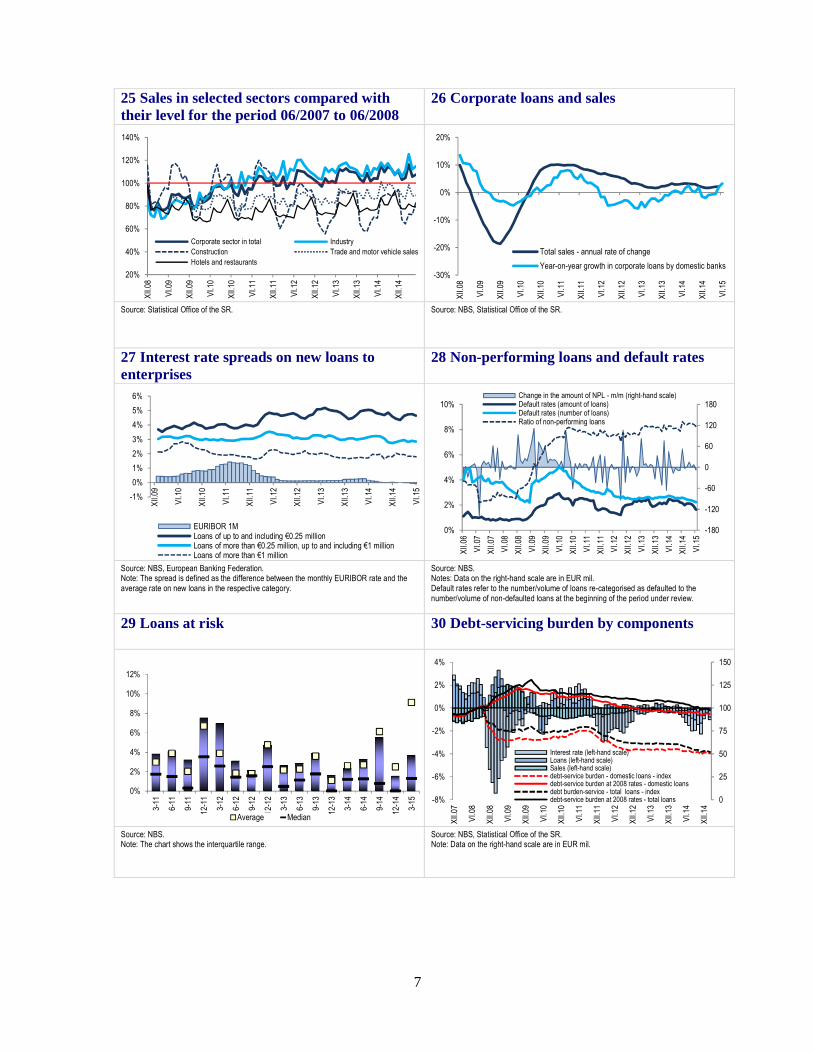
7
25 Sales in selected sectors compared with their level for the period 06/2007 to 06/2008
26 Corporate loans and sales
Source: Statistical Office of the SR. Source: NBS, Statistical Office of the SR.
27 Interest rate spreads on new loans to enterprises
28 Non-performing loans and default rates
Source: NBS, European Banking Federation. Note: The spread is defined as the difference between the monthly EURIBOR rate and the average rate on new loans in the respective category.
Source: NBS. Notes: Data on the right-hand scale are in EUR mil. Default rates refer to the number/volume of loans re-categorised as defaulted to the number/volume of non-defaulted loans at the beginning of the period under review.
29 Loans at risk 30 Debt-servicing burden by components
Source: NBS. Note: The chart shows the interquartile range.
Source: NBS, Statistical Office of the SR. Note: Data on the right-hand scale are in EUR mil.
20%
40%
60%
80%
100%
120%
140%XI
I.08
VI.0
9
XII.0
9
VI.1
0
XII.1
0
VI.1
1
XII.1
1
VI.1
2
XII.1
2
VI.1
3
XII.1
3
VI.1
4
XII.1
4
Corporate sector in total IndustryConstruction Trade and motor vehicle salesHotels and restaurants
-30%
-20%
-10%
0%
10%
20%
XII.0
8
VI.0
9
XII.0
9
VI.1
0
XII.1
0
VI.1
1
XII.1
1
VI.1
2
XII.1
2
VI.1
3
XII.1
3
VI.1
4
XII.1
4
VI.1
5
Total sales - annual rate of change
Year-on-year growth in corporate loans by domestic banks
-1%
0%
1%
2%
3%
4%
5%
6%
XII.0
9
VI.1
0
XII.1
0
VI.1
1
XII.1
1
VI.1
2
XII.1
2
VI.1
3
XII.1
3
VI.1
4
XII.1
4
VI.1
5
EURIBOR 1MLoans of up to and including €0.25 millionLoans of more than €0.25 million, up to and including €1 millionLoans of more than €1 million
-180
-120
-60
0
60
120
180
0%
2%
4%
6%
8%
10%
XII.0
6
VI.0
7
XII.0
7
VI.0
8
XII.0
8
VI.0
9
XII.0
9
VI.1
0
XII.1
0
VI.1
1
XII.1
1
VI.1
2
XII.1
2
VI.1
3
XII.1
3
VI.1
4
XII.1
4
VI.1
5
Change in the amount of NPL - m/m (right-hand scale)Default rates (amount of loans)Default rates (number of loans)Ratio of non-performing loans
0%
2%
4%
6%
8%
10%
12%
3-11
6-11
9-11
12-1
1
3-12
6-12
9-12
12-1
2
3-13
6-13
9-13
12-1
3
3-14
6-14
9-14
12-1
4
3-15
Average Median
0
25
50
75
100
125
150
-8%
-6%
-4%
-2%
0%
2%
4%
XII.0
7
VI.0
8
XII.0
8
VI.0
9
XII.0
9
VI.1
0
XII.1
0
VI.1
1
XII.1
1
VI.1
2
XII.1
2
VI.1
3
XII.1
3
VI.1
4
XII.1
4
Interest rate (left-hand scale)Loans (left-hand scale)Sales (left-hand scale)debt-service burden - domestic loans - indexdebt-service burden at 2008 rates - domestic loansdebt burden-service - total loans - indexdebt-service burden at 2008 rates - total loans

8
31 Commercial real estate: prices (EUR/m2) and vacancy rates in the office segment
32 Commercial real estate: sales of the new apartments in the residential segment
Source: CBRE, NBS. Note: The chart plots prices and vacancy rates in Bratislava.
Source: Lexxus, NBS.
33 Comparison of corporate balance sheets and sales
34 Liabilities of non-financial corporations
Source: NBS, Statistical Office of the SR. Source: NBS.
Household credit risk indicators
35 Household indebtedness in Slovakia and in selected countries
36 Changes in household financial assets
Source: Eurostat. Notes: The ratio of total debt of households to disposable income. Data are available to 2013 only.
Source: NBS. Notes: Data refer to quarter-on-quarter changes. Owing to methodology changes, no historical data are available as yet. Data on the left-hand scale are in EUR million.
0%
5%
10%
15%
20%
0
5
10
15
203.
096.
099.
0912
.09
3.10
6.10
9.10
12.1
03.
116.
119.
1112
.11
3.12
6.12
9.12
12.1
23.
136.
139.
1312
.13
3.14
6.14
9.14
12.1
43.
15
Price per m2 / month - inner centrePrice per m2 / month - outer centrePrice per m2 / month - outside centreOffice vacancy rate - inner centre (right-hand scale)Office vacancy rate - outer centre (right-hand scale)Office vacancy rate - outside centre (right-hand scale)
0%
20%
40%
60%
80%
100%
-600
-300
0
300
600
900
1 200
3.09
9.09
3.10
9.10
3.11
9.11
3.12
9.12
3.13
9.13
3.14
9.14
3.15
Number of apartments where sales fell through (left-hand scale)Number of apartments sold in a given quarter (left-hand scale)Residential segment: Net new apartment sales (left-hand scale)Share of projects with positive net apartment sales (right-hand scale)
0%
5%
10%
15%
20%
25%
30%
12.0
7
6.08
12.0
8
6.09
12.0
9
6.10
12.1
0
6.11
12.1
1
6.12
12.1
2
6.13
12.1
3
6.14
12.1
4
Ratio of domestic bank loans (excl. loans for commercial property) to annual salesRatio of domestic bank loans to annual salesRatio of external funding to annual sales
0%
10%
20%
30%
40%
50%
12.0
3
12.0
4
12.0
5
12.0
6
12.0
7
12.0
8
12.0
9
12.1
0
12.1
1
12.1
2
12.1
3
12.1
4
External funding as a share of total corporate liabilitiesFunds from the rest of the world sector as a share of corporate liabilities
0%
30%
60%
90%
120%
150%
2005 2006 2007 2008 2009 2010 2011 2012 2013
Belgium Czech Republic GermanySpain Hungary AustriaPoland Slovakia
0%
15%
30%
45%
60%
75%
-1000
0
1000
2000
3000
4000
3.13 6.13 9.13 12.13 3.14 6.14 9.14 12.14 3.15
Curenncy and depositsShares and other equityInsurance, pension and standardised guarantee systemsRatio of financial liabilites to financial assets (right-hand scale)Currency and deposits as a share of financial assets (right-hand scale)

9
37 Number of unemployed by income category
38 Index of employment in selected sectors
Source: Central Office of Labour, Social Affairs and Family of the SR. Notes: Left-hand and right-hand scales: Numbers of job seekers are in thousands. Household income categories – categorisation based on the KZAM employment classification and KZAM income data; it consists of three categories: higher-income category (income of over €800 per month) – legislators, senior officials and managers, scientists, professionals, technicians, health professionals, and teaching professionals; middle-income category (income between €600 and €800 per month) – office workers, craft and skilled workers, processors, and plant and machinery operators; lower-income category (income of up to €600) – service and retail workers, agricultural and forestry workers, auxiliary and unskilled workers.
Source: Statistical Office of the SR. Note: Year-on-year changes.
39 Expected employment in selected sectors 40 Index of real wages in selected sectors
Source: Statistical Office of the SR. Notes: Index data.
Source: Statistical Office of the SR. Note: HICP - Harmonised Index of Consumer Prices, change on the same period of the previous year.
41 The consumer confidence index and its components
42 Non-performing household loans
Source: Statistical Office of the SR. Source: NBS.
Note: Left-hand scale: ratio of non-performing household loans to total household loans. Data on the right-hand scale are in EUR mil.
0
20
40
60
80
100
0
2
4
6
8
10
12VI
.07
VI.0
8
VI.0
9
VI.1
0
VI.1
1
VI.1
2
VI.1
3
VI.1
4
VI.1
5
VI.0
8
VI.0
9
VI.1
0
VI.1
1
VI.1
2
VI.1
3
VI.1
4
VI.1
5
Higher-income category Medium-income categoryLower-income category
Number of job seekersInflow of job seekers
80
85
90
95
100
105
110
XII.0
9
VI.1
0
XII.1
0
VI.1
1
XII.1
1
VI.1
2
XII.1
2
VI.1
3
XII.1
3
VI.1
4
XII.1
4
VI.1
5
Manufacturing ConstructionWholesale Retail tradeAccomodation Transportation and storage
-60
-40
-20
0
20
40
XII.0
7
VI.0
8
XII.0
8
VI.0
9
XII.0
9
VI.1
0
XII.1
0
VI.1
1
XII.1
1
VI.1
2
XII.1
2
VI.1
3
XII.1
3
VI.1
4
XII.1
4
VI.1
5
Services Industry Trade Construction
98
100
102
104
106
85
90
95
100
105
110XI
I.08
VI.0
9
XII.0
9
VI.1
0
XII.1
0
VI.1
1
XII.1
1
VI.1
2
XII.1
2
VI.1
3
XII.1
3
VI.1
4
XII.1
4
VI.1
5
HICP (righ-hand scale)IndustryConstructionWholesale trade except for motor vehiclesRetail trade except for motor vehicles
-60
-30
0
30
60
90
XII.0
7
VI.0
8
XII.0
8
VI.0
9
XII.0
9
VI.1
0
XII.1
0
VI.1
1
XII.1
1
VI.1
2
XII.1
2
VI.1
3
XII.1
3
VI.1
4
XII.1
4
VI.1
5
Consumer confidence indexExpected financial situation of householdsExpected economic situation in SlovakiaExpected unemploymentExpected household savings
-100
-50
0
50
100
150
0%
2%
4%
6%
8%
10%
XII.0
8
VI.0
9
XII.0
9
VI.1
0
XII.1
0
VI.1
1
XII.1
1
VI.1
2
XII.1
2
VI.1
3
XII.1
3
VI.1
4
XII.1
4
VI.1
5
Upper and lower quartiles of the non-performing loan (NPL) ratioWeighted average of the NPL ratioMonth-on-month changes in the amount of NPLs (right-hand scale)

10
43 Loan-to-value (LTV) ratio 44 Housing affordability index
Source: NBS. Note: Loan-to-value ratio is the loan value divided by the value of the loan collateral.
Source: NBS, Statistical Office of the SR. Notes: Housing affordability index is an index representing the ratio of disposable income to loan instalments. The calculation of disposable income takes into account the average wage and average expenditure of households; the calculation of the instalment amount takes into account the average apartment price, average interest rate, average maturity, and a constant LTV ratio (75%). The calculation methodology for the housing affordability index is set out in the following paper: Rychtárik, Š., Krčmár, M. (2011), “Vývoj na trhu úverov na bývanie a jeho interpretácia” (Developments in the housing loan market and their interpretation), Nehnuteľnosti a bývanie 2010 (Real Estate and Housing), Vol. No 2, Bratislava, 2010.
Market risk and liquidity risk indicators
45 Value at Risk for investments in different types of financial instruments
Source: Bloomberg, NBS. Notes: The data represent the loss (as a percentage of the given investment) that should not be exceeded over a period of 10 days at a confidence level of 99%. This loss was determined on the basis of a risk factor volatility calculation, using exponentially weighted moving averages.
46 Loan-to-deposit ratio 47 Liquid asset ratio
Source: NBS. Note: ARDAL – Debt and Liquidity Management Agency.
Source: NBS.
50%
60%
70%
80%
90%
100%XI
I.09
VI.1
0
XII.1
0
VI.1
1
XII.1
1
VI.1
2
XII.1
2
VI.1
3
XII.1
3
VI.1
4
XII.1
4
VI.1
5
Interquartile range Banks in total Large banks
0
50
100
150
200
250
Q1
Q2
Q3
Q4
Q1
Q2
Q3
Q4
Q1
Q2
Q3
Q4
Q1
Q2
Q3
Q4
Q1
Q2
Q3
Q4
Q1
Q2
Q3
Q4
Q1
Q2
Q3
Q4
Q1
Q2
Q3
Q4
Q1
Q2
Q3
Q4
Q1
Q2
Q3
Q4
Q1
Q2
2005 2006 2007 2008 2009 2010 2011 2012 2013 2014 2015
Housing affordability index (constant LTV)Housing affordability index (variable LTV)
0%
10%
20%
30%
40%Open position in USD
5-year euro-denominated bonds
Equity investments (EUROSTOXXindex)
0%
20%
40%
60%
80%
100%
XII.0
3
XII.0
4
XII.0
5
XII.0
6
XII.0
7
XII.0
8
XII.0
9
XII.1
0
XII.1
1
XII.1
2
XII.1
3
XII.1
4
Loan-to-deposit ratio for households including mortgage bondsLoan-to-deposit ratio (including ARDAL deposits and mortgage bonds issued)Loan-to-deposit ratio (excluding ARDAL deposits and mortgage bonds issued)Loan-to-deposit ratio (including ARDAL deposits and excluding mortgage bonds issued)
0.0
1.0
2.0
3.0
XII.0
9III
.10
VI.1
0IX
.10
XII.1
0III
.11
VI.1
1IX
.11
XII.1
1III
.12
VI.1
2IX
.12
XII.1
2III
.13
VI.1
3IX
.13
XII.1
3III
.14
VI.1
4IX
.14
XII.1
4III
.15
VI.1
5
Banking sector - medianRetail banks - median
Recommended