MAGNETIC AND ELECTROMAGNETIC CHARACTERIZATION
OF
BARIUM HEXAFERRITE CERAMICS AND THEIR POLYMER MATRIX
COMPOSITES
A THESIS SUBMITTED TO
THE GRADUATE SCHOOL OF NATURAL AND APPLIED SCIENCES
OF
MIDDLE EAST TECHNICAL UNIVERSITY
BY
SERAY KAYA
IN PARTIAL FULFILLMENT OF THE REQUIREMENTS
FOR
THE DEGREE OF MASTER OF SCIENCE
IN
METALLURGICAL AND MATERIALS ENGINEERING
JUNE 2014


Approval of the thesis:
MAGNETIC AND ELECTROMAGNETIC CHARACTERIZATION
OF
BARIUM HEXAFERRITE CERAMICS AND THEIR POLYMER MATRIX
COMPOSITES
submitted by SERAY KAYA in partial fulfillment of the requirements for the
degree of Master of Science in Metallurgical and Materials Engineering
Department, Middle East Technical University by,
Prof. Dr. Canan ÖZGEN __________
Dean, Graduate School of Natural and Applied Sciences
Prof. Dr. C. Hakan GÜR __________
Head of Department, Metallurgical and Materials Engineering
Assoc. Prof. Dr. Arcan Fehmi DERĠCĠOĞLU _________
Supervisor, Metallurgical and Materials Engineering Dept. METU
Prof. Dr. Abdullah ÖZTÜRK _________
Co-Supervisor, Metallurgical and Materials Engineering Dept. METU
Examining Committee Members:
Prof. Dr. Abdullah ÖZTÜRK ______________
Metallurgical and Materials Eng. Dept. METU
Assoc. Prof. Dr. Arcan Fehmi DERĠCĠOĞLU ______________
Metallurgical and Materials Eng. Dept. METU
Assoc. Prof. Dr. Caner DURUCAN ______________
Metallurgical and Materials Eng. Dept. METU
Assoc. Prof. Dr. H.Emrah ÜNALAN ______________
Metallurgical and Materials Eng. Dept. METU
Prof. Dr. Mehmet ERDOĞAN ______________
Metallurgical and Materials Eng. Dept. GAZĠ University
Date: 25.06.2014

iv
I hereby declare that all information in this document has been obtained and
presented in accordance with academic rules and ethical conduct. I also
declare that, as required by these rules and conduct, I have fully cited and
referenced all material and results that are not original to this work.
Name, Last name : Seray KAYA
Signature :
v
ABSTRACT
MAGNETIC AND ELECTROMAGNETIC CHARACTERIZATION
OF
BARIUM HEXAFERRITE CERAMICS AND THEIR POLYMER MATRIX
COMPOSITES
Kaya, Seray
M.Sc., Department of Metallurgical and Materials Engineering
Supervisor : Assoc. Prof. Dr. Arcan Fehmi DERĠCĠOĞLU
Co-Supervisor : Prof. Dr. Abdullah ÖZTÜRK
June 2014, 84 pages
In this study, BaHF-based polymer matrix composites were prepared as potential
EM wave absorbing materials. Firstly, BaHF powders and platelets were
synthesized by mixed oxide method and by molten salt synthesis (MSS) technique,
respectively, which were further used as additives in the EM wave absorbing
composites. The effect of molten salt composition on the amount of BaHF phase
formation, as well as, on the morphology and magnetic properties of the final
products were discussed according to the characterization results. Quantitative XRD
results showed that with the increase in NaCl flux content, BaHF formation was
enhanced and the highest conversion (97.8 wt%) was obtained in the case of 100
wt% NaCl flux. Corners of the BaHF platelets in NaCl flux were rounded, while
KCl flux produced sharp edge platelets. Increasing NaCl content in the flux
improved the coercivity and remnant magnetization of BaHF, leading to a more
pronounced hard magnetic behavior.
vi
In the second part of the study, BaHF-based polymer matrix composites were
prepared by tape casting method, and their electromagnetic wave absorption
potentials were investigated within 18-40 GHz frequency range by free-space
measurement method. Effect of BaHF content and alignment on the EM wave
properties was investigated. To enhance the EM wave absorption potential of the
resulting composites, graphite or nickel flakes were incorporated into polymer
matrix, and multilayered composites were produced. BaHF-Ni flake containing
composites revealed 50-75% EM wave absorption in 18-40 GHz range with the
synergistic effect of the magnetic and ohmic loss effective in the structure.
Keywords: Barium Hexaferrite Ceramics, Mixed Oxide Method, Molten Salt
Synthesis, Electromagnetic Wave Absorption, Polymer Matrix Composites.

vii
ÖZ
BARYUM HEKZAFERRĠT SERAMĠKLERĠNĠN VE BARYUM HEKZAFERRĠT
POLĠMER MATRĠS KOMPOZĠTLERĠNĠN MANYETĠK VE
ELEKTROMANYETĠK KARAKTERĠZASYONU
Kaya, Seray
Yüksek Lisans, Metalurji ve Malzeme Mühendisliği Bölümü
Tez Yöneticisi : Doç. Dr. Arcan Fehmi DERĠCĠOĞLU
Tez Ġkinci Danışmanı : Prof. Dr. Abdullah ÖZTÜRK
Haziran 2014, 84 sayfa
Bu çalışmada,EM dalga absorplama performansı için BaHF polimer matrisli
kompozitler üretilmiştir. Ġlk olarak, BaHF tozu ve plakaları sırasıyla karışık oksit
yöntemi ve eriyik tuz yöntemi ile üretilmiş ve sonrasında ise, elektromanyetik dalga
sönümleyen kompozitlerde kullanılmıştır. Karakterizasyon sonuçlarından elde
edilen veriler doğrultusunda, eriyik tuz kompozisyonunun oluşan BaHF’nin faz
miktarına aynı zamanda da, morfoloji ve manyetik özelliklerine olan etkileri
tartışılmıştır. Niceliksel X-Işınları Kırınımı sonuçları, NaCl tuz miktarının artışı ile
BaHF faz oluşumunun arttığını ve en yüksek dönüşümün (ağırlıkça % 97.8)
ağırlıkça % 100 NaCl tuzunda elde edildiğini göstermiştir. NaCl tuzunda, BaHF
plakalarının köşeleri yuvarlak iken, KCl tuzu, keskin köşeli plakalar oluşturmuştur.
Eriyik içerisindeki NaCl miktarının artışı, BaHF’nin koersivite ve remanent
manyetizasyonunu iyileştirirp, daha kalıcı manyetik özelliklerin oluşumunu
sağlamıştır.

viii
Çalışmanın ikinci kısmında, şerit döküm yöntemi ile BaHF-polimer matrisli
kompozitleri üretilmiştir ve serbest uzay yöntemi ile 18-40 GHz frekans aralığında
elektromanyetik dalga sönümleme performansları ölçülmüştür. BaHF faz miktarının
ve yönlenmesinin elektromanyetik dalga etkileşim özelliklerine etkileri
incelenmiştir. Kompozitlerin elektromanyetik dalga sönümleme özelliklerini
iyileştirmek amacıyla, polimer matrisi içerisine grafit ve nikel plakalar eklenmiş ve
çok katmanlı kompozitler oluşturulmuştur. BaHF/Nikel içeren polimer matris
kompozitleri, yapıdaki manyetik ve ohmik kayıpların etkisi ile 18-40 GHz frekans
aralığında yaklaşık olarak 50-75 % EM dalga absorplama özelliği göstermiştir.
Anahtar Kelimeler: Baryum Hekzaferrit, Karışık Oksit Yöntemi, Eriyik Tuz
Sentezi, Elektromanyetik Dalga Sönümleme, Polimer Matris Kompozitler

ix
Trgrg54VVvVVgvfvfVVVfrrIV
To My Family,

x
ACKNOWLEDGMENTS
I would like to express my sincere appreciation to Assoc. Prof. Dr. Arcan
Dericioğlu for his supervision, guidance, support and encouragement throughout the
study.
I am grateful to all the staff of the Department of Metallurgical and Materials
Engineering and all my labmates Eda Aydoğan, Özgür Hamat, Aylin Güneş, Güney
Daloğlu and Selen Güner for their moral support and friendship during my master’s
education.
Finally, I owe a depth to my family for their endless love, moral and monetary
support and encouragement throughout my life.

xi
TABLE OF CONTENTS
ABSTRACT ............................................................................................................ v
ÖZ.......................................................................................................................... vii
ACKNOWLEDGMENTS ........................................................................................ x
TABLE OF CONTENTS ....................................................................................... xi
LIST OF TABLES ............................................................................................... xiii
LIST OF FIGURES ............................................................................................... xv
1. INTRODUCTION ............................................................................................... 1
2. LITERATURE REVIEW .................................................................................... 5
2.1.Interaction of Electromagnetic Waves with Materials………………….... .. 5
2.2 Electromagnetic Wave Absorbing Materials……………………………. .. .6
2.2.1 Radar Absorbing Materials (RAMs)…………………………………...6
2.2.1.1 Salisbury Screen .............................................................................. 7
2.2.1.2 Jaumann Absorber ............................................... …………………9
2.2.2.Magnetic Lossy Media ................................................................. ……10
2.3 Ferrite Materials .......................................................................................... 10
2.3.1 Spinel Ferrites .................................................................................... ..10
2.3.2 Garnet Ferrites .................................................................................. …12
2.3.3 Hexagonal Ferrites and Barium Hexaferrite ........................................ 12
2.4 Types of Ferrites According to Their Magnetic Properties ......................... 14
2.4.1 Magnetically Soft Ferrites .................................................................... 14
2.4.2 Magnetically Hard Ferrites .................................................................. 15

xii
2.5 Studies on Barium Ferrite Ceramics and Their Composites……………... 16
2.6 Hysteresis Behavior of Magnetic Materials……………………………… 18
3.EXPERIMENTAL PROCEDURE ..................................................................... 21
3.1 General Procedure ....................................................................................... 21
3.2 Sample Preparation ...................................................................................... 22
3.2.1 Preparation of BaHF Powders by Mixed Oxide Method
....................................................................................................................... 22
3.2.2 Preparation of BaHF Platelets by Molten Salt Synthesis Method
................................................................................................................. …..23
3.2.3 Fabrication of BaHF-Polymer Matrix Electromagnetic (EM) Wave
Absorbing Composites .................................................................................. 25
3.2.3.1 BaHF Powder-Polymer Matrix Composite Production ................. 25
3.2.3.2 BaHF Platelet-Polymer Matrix Composite Production…… ......... 26
3.2.3.3BaHF Platelet and Graphite Flake or Nickel Flake-Polymer Matrix
Composite Production……………… ....................................................... 27
3.3.Characterization ........................................................................................... 28
3.3.1 Microstructural Characterization .......................................................... 28
3.3.2 Phase Analysis .................................................................................... ..28
3.3.3 Magnetic Characterization ................................................................... 30
3.3.4 Electrical Conductivity Measurement… .............................................. 31
3.3.5 Electromagnetic Characterization ........................................................ 32
4. RESULTS AND DISCUSSION ....................................................................... 35
4.1 XRD and SEM Analyses of Powders Synthesized by Mixed Oxide Method
........................................................................................................................... 35
4.2 SEM and XRD Analyses of Platelets Synthesized by Molten Salt
Synthesis………………………………………………… ................................ 36
4.3 Magnetic Measurement Results of BaHF Powders and Platelets .............. 43
xiii
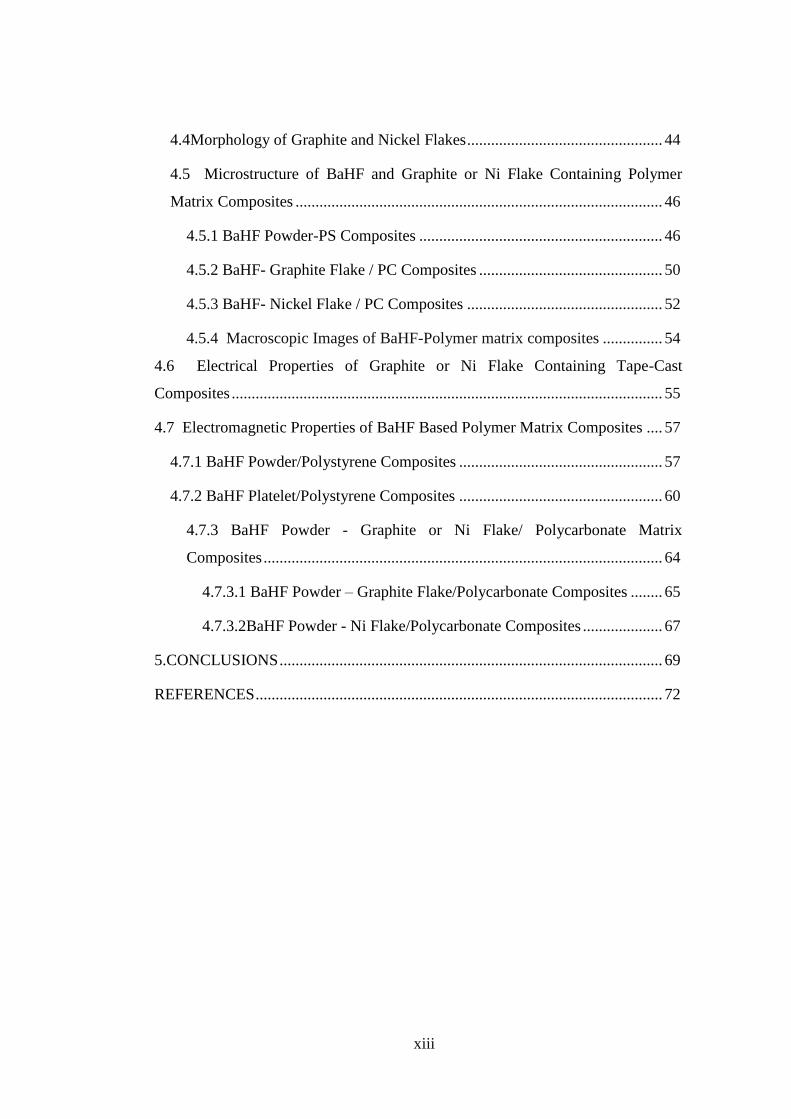
4.4Morphology of Graphite and Nickel Flakes ................................................. 44
4.5 Microstructure of BaHF and Graphite or Ni Flake Containing Polymer
Matrix Composites ............................................................................................ 46
4.5.1 BaHF Powder-PS Composites ............................................................. 46
4.5.2 BaHF- Graphite Flake / PC Composites .............................................. 50
4.5.3 BaHF- Nickel Flake / PC Composites ................................................. 52
4.5.4 Macroscopic Images of BaHF-Polymer matrix composites ............... 54
4.6 Electrical Properties of Graphite or Ni Flake Containing Tape-Cast
Composites ............................................................................................................ 55
4.7 Electromagnetic Properties of BaHF Based Polymer Matrix Composites .... 57
4.7.1 BaHF Powder/Polystyrene Composites ................................................... 57
4.7.2 BaHF Platelet/Polystyrene Composites ................................................... 60
4.7.3 BaHF Powder - Graphite or Ni Flake/ Polycarbonate Matrix
Composites .................................................................................................... 64
4.7.3.1 BaHF Powder – Graphite Flake/Polycarbonate Composites ........ 65
4.7.3.2BaHF Powder - Ni Flake/Polycarbonate Composites .................... 67
5.CONCLUSIONS ................................................................................................ 69
REFERENCES ...................................................................................................... 72

xiv
LIST OF TABLES
Table 4.1 Magnetic properties of barium hexaferrite ceramics synthesized by
mixed oxide method and by molten salt synthesis method in five different molten
flux compositions. ......................................................................................... ……43

xv
LIST OF FIGURES
Figure 2.1 EM wave shielding mechanism in materials [20]. ............................ ….5
Figure 2.2 Schematic illustration of Salisbury screen [40]. ................................ …7
Figure 2.3 Schematic illustration of Jaumann Absorbers [40]. ............................... 8
Figure 2.4 Two octants of the spinel unit cell, A and B represent tetrahedrally and
octahedrally coordinated sites, respectively [44]. ........................................... …..10
Figure 2.5 The structure of Barium Hexaferrite [50]. ......................................... ..12
Figure 2.6 Electron spin moments of soft ferrites [52]. ................................... …13
Figure 2.7 Typical hysteresis curve of a ferromagnetic material [67]. ................ .18
Figure 3.1 Binary phase diagram of NaCl and KCl including the flux
compositions and calcination temperatures [70]. ................................. ………….21
Figure 3.2 Binary phase diagram of NaCl and KCl including the flux
compositions and calcination temperatures [70]……………………………….. . 22
Figure 3.3 Full-pattern fitting analysis of an autoclaved and heat-treated
serpentine [71]……………………………………………………………………28
Figure 3.4 Four-Point Probe Measurement System [73]……………………….. . 29
Figure 3.5 Set up of “Free-space method.”…………………………………….. . 30
Figure 4.1 X-ray diffraction pattern of barium hexaferrite powders prepared by
mixed oxide method………………………………………………………… .. …32
Figure 4.2 Morphology of BaHF powders prepared by mixed oxide method…...33
Figure 4.3 Platelet size as a function of flux composition at 850 °C, 900 °C and
950 °C for (a) 1 h, (b) 2 h, (c) 2.5 h and (d) 3.5 h of
calcination…………………… ........................................................................... ..35

xvi
Figure 4.4 SEM images of barium hexaferrite platelets calcined in (a) 100 wt %
KCl, (b) 90 wt % KCl-10 wt % NaCl, (c) 44 wt % NaCl- 56 wt % KCl, (d) 90 wt
% NaCl- 10 wt % KCl, and (e) 100 wt % NaCl at 900 °C for 2h ........................ 36
Figure 4.5 X-Ray diffraction pattern of barium hexaferrite platelets synthesized in
100 wt % KCl flux composition………………………………………………… 37
Figure 4.6 X-Ray diffraction pattern of barium hexaferrite platelets synthesized in
90 wt % KCl- 10 wt % NaCl flux composition. .................................................... 37
Figure 4.7 X-Ray diffraction pattern of barium hexaferrite platelets synthesized in
44 wt % NaCl- 56 wt % KCl flux composition. .................................................... 38
Figure 4.8 X-Ray diffraction pattern of barium hexaferrite platelets synthesized in
90 wt % NaCl- 10 wt % KCl flux composition. .................................................... 38
Figure 4.9 X-Ray diffraction pattern of barium hexaferrite platelets synthesized in
100 wt % NaCl flux composition. ......................................................................... 39
Figure 4.10 Quantitative XRD analysis of the platelets calcined at 900 ºC for 2
hours in varying flux compositions. ...................................................................... 40
Figure 4.11 300K hysteresis curve of the barium hexaferrite powder synthesized
by the mixed oxide method. .................................................................................. 41
Figure 4.12 300K hysteresis curves of barium hexaferrite ceramics synthesized in
100 wt % KCl, 90 wt % KCl, 44 wt % NaCl, 90 wt % NaCl and 100 wt % NaCl.
........................................................................................................................... …42
Figure 4.13 SEM images of graphite flakes at two different magnifications
(a) 1600x, (b) 6000x. ............................................................................................. 45
Figure 4.14 SEM images of nickel flakes at 6000x magnification at two different
locations. ................................................................................................................ 45
Figure 4.15 Optical microscope image of tape cast a) 10 wt% BaHF/PS composite
b) 20 wt% BaHF/PS composite c) 30 wt% BaHF/PS composite (50x)………… 47
Figure 4.16 Optical microscope image of as cast a) 10 wt% BaHF/PS composite
b) 20 wt% BaHF/PS composite c) 30 wt% BaHF/PS composite (100x)………. . 49

xvii
Figure 4.17 Optical microscope images of a-d) BaHF/Graphite-PC composites from
different locations of the samples (500x)…………………………………………51
Figure 4.18 Optical microscope images of a-d) BaHF/Ni-PC Composite (200x),
e), f) BaHF/Ni -PC Composite (500x)……………………………………………53
Figure 4.19 Macroscopic images of a) tape cast 10 wt% BaHF/PS composite
b) tape cast 20 wt% BaHF/PS composite, c) tape cast 30 wt% BaHF/PS
composite…………………………………………………………………………54
Figure 4.20 Macroscopic images of a) tape cast BaHF/Ni-PC composite b) tape
cast BaHF/graphite-PC composite………………………………………………. 55
Figure 4.21 EM wave reflection and transmission losses of 10, 20, 30 wt% BaHF
powder containing polystyrene matrix tape-cast composites………………........ 58
Figure 4.22 EM wave absorption of 10, 20, 30 wt% BaHF powder containing
polystyrene matrix tape-cast composites……………………………………….. .58
Figure 4.23 EM wave reflection and transmission losses of 10, 20, 30 wt% BaHF
powder containing polystyrene matrix as-cast composites ................................... 59
Figure 4.24 EM wave absorption of 10, 20, 30 wt% BaHF powder containing
polystyrene matrix as-cast composites……………………………………… .. …60
Figure 4.25 EM wave reflection and transmission losses of composites containing
BaHF platelets synthesized in 5 different flux compositions…………………… 61
Figure 4.26 EM wave absorption of composites containing BaHF platelets
synthesized in 5 different flux compositions……………………………………. 60
Figure 4.27 EM wave reflection and transmission losses of tape-cast and as-cast
composites containing BaHF platelets………………………………………… .. 63
Figure 4.28 EM wave absorption of tape-cast and as-cast composites containing
BaHF platelets………………………………………………………………… .. .63
Figure 4.29 EM wave reflection and transmission losses of BaHF powder and
graphite flake containing polycarbonate matrix composites for varying number of
tapes cascaded to form the multilayered structure……………………………… 66

xviii
Figure 4.30 EM wave absorption of BaHF powder and graphite flake containing
polycarbonate matrix composites for varying number of tapes cascaded to form
the multilayered structure…………………………………………………… . ….66
Figure 4.31 EM wave reflection and transmission losses of BaHF powder and Ni
flake containing polycarbonate matrix composites for varying number of tapes
cascaded to form the multilayered structure……………………………………. . 68
Figure 4.32 EM wave absorption of BaHF powder and Ni flake containing
polycarbonate matrix composites for varying number of tapes cascaded to form
the multilayered structure………………………………………………… . …….68
1
CHAPTER 1
1. INTRODUCTION
Technological developments and innovations have necessitated widespread usage of
the electromagnetic waves within a broad band frequency range.
The electromagnetic waves are used in various civilian and military oriented
application areas such as radars, telecommunications and wireless information
transfer systems as well as medical diagnostic and research systems [1]. These
applications operate at high frequencies and wide frequency bands where they
should meet high performance, operational security and stability requirements.
Interaction of emitted waves with the environment and with each other has become
a growing social and industrial problem. These problems along with the operational
requirements boosted the development of electromagnetic (EM) wave absorbing
materials. In this context, research studies have been focused recently on the
development of EM wave absorbing and interference shielding materials among
which composites have attracted vast importance.
Composites made by dispersing metallic (nickel, silver, etc.) and nonmetallic
(carbon) particles [1, 2] as well as stainless steel and carbon fibers [3-7] in epoxy
type polymeric matrices are used as EM absorbing materials at different
frequencies. Furthermore, particles like ferrites and nickel that provide magnetic
loss could be used as EM wave absorbing additive materials [1, 8, 9].
Among ferrites, barium hexaferrite (BaHF) with a chemical composition of
BaFe12O19 has been used as an additive in EM wave absorbing composites due to its
large saturation magnetization, high Curie temperature, excellent chemical stability,
high corrosion resistance and easiness in processing [10].

2
Various processing methods such as the mixed oxide method [11], sol–gel process
[11], hydrothermal synthesis [12], chemical co-precipitation [13], crystallization
from a glassy precursor [13], spray-pyrolysis [14] and the molten salt synthesis
(MSS) [15] have been utilized for the production of BaHF powders. These methods
result in powders with varying particle sizes, morphologies, and magnetic
properties.
Among these processing methods, MSS allows the low temperature synthesis of
BaHF platelets starting from mixed oxides [15]. In this method, reactions can be
completed in a relatively short time interval because of the short diffusion distances
and high mobility of raw materials in molten salts, in addition to the high reactivity
of the salts [16]. The MSS method was also shown to allow the preparation of
complex oxide ceramics with anisometric morphologies [17, 18].
The purpose of the present study was to produce BaHF- based polymer matrix
electromagnetic wave absorbing composites and to investigate their EM wave
absorption properties in the 18-40 GHz frequency range. In order to accomplish this
purpose, BaHF powders with nano meter in size were synthesized by mixed oxide
method using barium carbonate and iron(III) oxide as the starting materials. Micron
size BaHF platelets were prepared by the MSS method in various weight
proportions of NaCl–KCl salt mixtures as a liquid medium. X-Ray diffraction
analysis (XRD), scanning electron microscopy (SEM) and vibrating sample
magnetometer (VSM) were used to identify the characteristics of the synthesized
BaHF powders and platelets. The effect of molten salt composition on the amount
of BaHF phase formation as well as on the morphology and magnetic properties of
the final products were discussed in relation to the results obtained from the
characterization studies.
In the scope of EM wave absorbing BaHF-based polymer matrix composite
production efforts, BaHF powders and platelets were dispersed in PS matrix by tape
casting method. Their EM wave absorption potentials were investigated within 18-
40 GHz frequency range by free-space measurement method.

3
Effect of BaHF content on the EM wave absorption properties were investigated by
adding varying amounts of BaHF powders or platelets into PS matrix. In order to
improve the EM wave absorption potential of the resulting composites, in addition
to BaHF powders graphite or nickel (Ni) flakes were incorporated into polymer
matrix. Consequently, EM wave absorbing potential of multilayered BaHF-Graphite
flake and BaHF-Ni flake composites were examined. The effect of the number of
cascaded layers, and amount of additives, on the EM absorption properties of
BaHF-Graphite flake and BaHF-Ni flake composites were investigated in 18-40
GHz frequency range.
In the following chapter (Chapter 2), basic principles related to interaction of EM
waves with materials, types of EM absorbing materials, general information about
ferrites, properties and crystal structure of BaHF is presented along with a brief
related literature review. Third chapter covers the materials, production methods
and characterization techniques utilized throughout this study. In the Results and
Discussion chapter (Chapter 4), XRD, SEM and VSM data of BaHF powders and
platelets are presented and achieved results are discussed. Effect of molten salt
composition on the amount of BaHF phase formation as well as on the morphology
and magnetic properties of the final products are discussed. Following that EM
wave reflection, transmission and absorption properties of BaHF–based polymer
matrix composites are presented. In this context, the effect of additive type and
amount along with the number of cascaded layers on the EM absorption capabilities
of BaHF-based polymer matrix composites are presented. Finally, highlights of the
current study are given in the Conclusions chapter.

4
5
CHAPTER 2
2. LITERATURE REVIEW
2.1. Interaction of Electromagnetic Waves with Materials
The electromagnetic waves which propagate self-paced or spread from artificial
sources are being used in several military and civilian areas, for instance radars,
telecommunications, wireless information transfer systems. They are even being
used in medical diagnostic and research systems. As a result of the advances in
technology, electromagnetic waves with centimeter and millimeter wavelengths are
being used widespread and the interaction of emitted waves with the environment
and with each other has become a growing problem.
Operating at high frequencies and wide frequency bands, the above mentioned
applications need to satisfy both high performance and operational security along
with specific stability requirements, which renders the development of
electromagnetic wave absorbing materials crucial. In this context, in recent years
researches have been focused on the development of electromagnetic (EM) wave
absorbing and interference shielding materials.
The main function of EM wave absorbing materials is to limit the energy in distinct
areas and definite values or to hinder the wide spreading of waves [19]. In Figure
2.1, the interaction between electromagnetic wave and a target material is
schematically illustrated.

6
Figure 2.1 EM wave shielding mechanism in materials [20].
2.2. Electromagnetic Wave Absorbing Materials
A material to be used as an electromagnetic wave absorber, it should damp or
dissipate the electromagnetic energy effectively. This condition occurs by the ohmic
loss due to transport of charged particles (electrons and/or ions) or by dielectric
(molecular) polarization loss and/or by magnetic polarization losses [19]. The
materials which satisfy these properties are named as “electromagnetic wave
absorbing materials”. According to their application areas, EM wave absorbing
materials can be classified as radar absorbing materials (RAM), electromagnetic
interference shielding (EMI) materials and materials used in high frequency
communication lines.
2.2.1 Radar Absorbing Materials (RAMs)
The working principle of recent technology radars is that, one transmitter sends
radio waves in pulses and these waves reach the target and reflect, so they are
detected by a receiver [21].

7
From the reflected waves, receiver can analyze target’s direction, distance and
speed. There are two ways to lower the echo of the wave received from the target
[22]. Studies carried have shown that the shape changes in target, changes its
aerodynamic structure and also reduces its echo effectiveness. For this reason,
studies have focused on the second way, namely EM wave absorbing materials. In
this context, EM wave absorbing composites attracted some more attention due to
some disadvantages of the monolithic materials used in EM wave absorption such
as their heavy weights, low environmental resistance and deficient mechanical
properties [23].
RAMs are designed to make the target undetectable by lowering its radar cross
section (RCS) [21]. Generally, composite insulator materials, conductive particle
polymers, ceramics and ferrites are used as RAMs [22-26]. The composites made
by dispersing powder or fibrous type dielectric, metallic, carbon or ferrite materials
in polymeric matrices can be applied on surfaces in the form of paints or tiles. In
addition to these, ferrite type materials can be used as RAMs in the form of sintered
tiles [29-34].
In all of these materials, the power of radar absorbing is related with the material’s
thickness, geometry and surface topography. In the case of the composite RAMs,
this condition depends on the additive material’s amount and dimension as well as
the interaction between the additive and the matrix phases. Composites containing
conducting metallic and/or nonmetallic particles (nickel, silver, carbon etc.)
dispersed in epoxy type polymeric matrices [23, 32], as well as stainless steel and
carbon fiber reinforced composites [33-37] can be used as EM wave absorbing
materials at different frequencies. In addition to these, particles which provide
magnetic loss like ferrites and nickel can also be used as EM wave absorbing
additive materials [23, 38, 39].

8
2.2.1.1 Salisbury Screen
The first version of RAMs is known as “Salisbury Screen.” The thin screen of EM
wave absorbing materials (such as glass-fiber cloth impregnated with a lossy resin
containing graphite or carbon black) is placed at a distance which is an odd multiple
of λ/4 (λ being the working design wavelength) from a metal surface constituting a
quarter-wave window (Figure 2.2) [19]. If the distance between the thin screen and
the metal surface is not λ/4, some of the incident wave is scattered. When this
distance difference exceeds λ/4, the extent of the unwanted scattering also increases.
Because of this, Salisbury screen is a material that works in a narrow frequency
range being not a very useful one.
Figure 2.2 Schematic illustration of Salisbury screen [40].

9
2.2.1.2 Jaumann Absorber
Increasing the range of effective frequency band is possible with a material system
that is composed of thin materials which are cascaded one after another in the form
of distinct thin layers. The electrical resistance in the system decreases gradually
through the material from the first layer to the last. This system is called a
“Jaumann Absorber” (Figure 2.3). The frequency band coverage increases by the
addition of thin layers with extra separators, which eventually increases the total
thickness and hence the cost [21]. Because of such reasons, Jaumann Absorbers are
usually not preferred in practice as EM wave absorbers.
Figure 2.3. Schematic illustration of Jaumann Absorbers [40].

10
2.2.2 Magnetic Lossy Media
The absorber material can be replaced by a thinner one when a magnetic lossy
material is incorporated into the structure. These materials are thinner when
compared with dielectric containing ones. However, they are effective at lower
frequency bands, and they have higher densities due to high content of iron.
The newly developed EM wave absorbing materials should work in wide frequency
bands, and they should have low weight and good structural strength [41]. In this
point of view, the ferrite containing polymer matrix composites are possible
candidates for EM wave absorption applications.
Magnetic absorbers and lossy ferrite particles dispersed in a matrix are widely used
in tailoring electromagnetic properties of polymers or polymer matrix composites
[42]. Magnetic susceptibility and permanent magnetization provided by the
ferromagnetic particles such as carbonyl iron, cobalt and nickel can also be utilized
in such EM wave absorbing composites.
2.3 Ferrite Materials
Magnetic ceramics are made of ferrites, which are crystalline minerals composed of
iron oxide in combination with some other metal. They are given the general
formula M(FexOy), M representing metallic elements other than iron [43]. Ferrites
are classified into three groups according to their crystalline structure. These are
Spinel, Garnet and Hexagonal Ferrites.
2.3.1 Spinel Ferrites
The ferrimagnetic oxides known as ferrites, have the general formula
M2+
O·Fe23+
O3, where M2+
is a divalent metallic ion such as Fe2+
, N2+
, Cu2+
, Mg2+
.
In the crystal structure, oxygen ions are in a nearly close-packed cubic array.
11
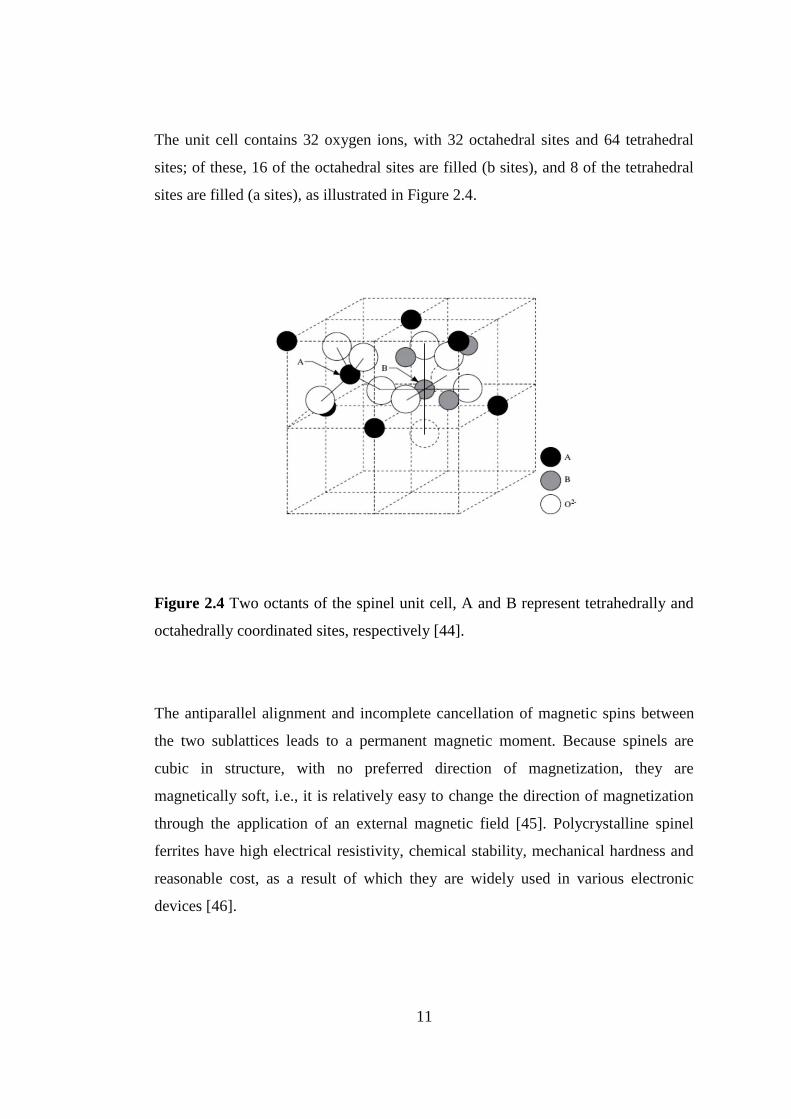
The unit cell contains 32 oxygen ions, with 32 octahedral sites and 64 tetrahedral
sites; of these, 16 of the octahedral sites are filled (b sites), and 8 of the tetrahedral
sites are filled (a sites), as illustrated in Figure 2.4.
Figure 2.4 Two octants of the spinel unit cell, A and B represent tetrahedrally and
octahedrally coordinated sites, respectively [44].
The antiparallel alignment and incomplete cancellation of magnetic spins between
the two sublattices leads to a permanent magnetic moment. Because spinels are
cubic in structure, with no preferred direction of magnetization, they are
magnetically soft, i.e., it is relatively easy to change the direction of magnetization
through the application of an external magnetic field [45]. Polycrystalline spinel
ferrites have high electrical resistivity, chemical stability, mechanical hardness and
reasonable cost, as a result of which they are widely used in various electronic
devices [46].
12
2.3.2 Garnet Ferrites
They have the structure of the silicate mineral garnet and the chemical formula
M3(Fe5O12), where M is yttrium or a rare-earth trivalent cation. In addition to
tetrahedral and octahedral sites, such as those seen in spinels, garnets have
dodecahedral (12-coordinated) sites. The net ferrimagnetism is thus a complex
result of antiparallel spin alignment among the three types of sites. Garnets are also
magnetically hard [47].
2.3.3 Hexagonal Ferrites and BaHF
The hexagonal ferrites have a structure related to the spinel structure yet with
hexagonal close-packed oxygen ions and a unit cell made up of two formulae of
AB12O19, where A is divalent (Ba, Sr or Pb) and B is trivalent (Al, Ga, Cr or Fe),
corresponding to a molecular formula A2+
O·B23+
O3. The best known example is
magnetoplumbite, which has a formula PbFe12O19 and barium ferrite, BaFe12O19.
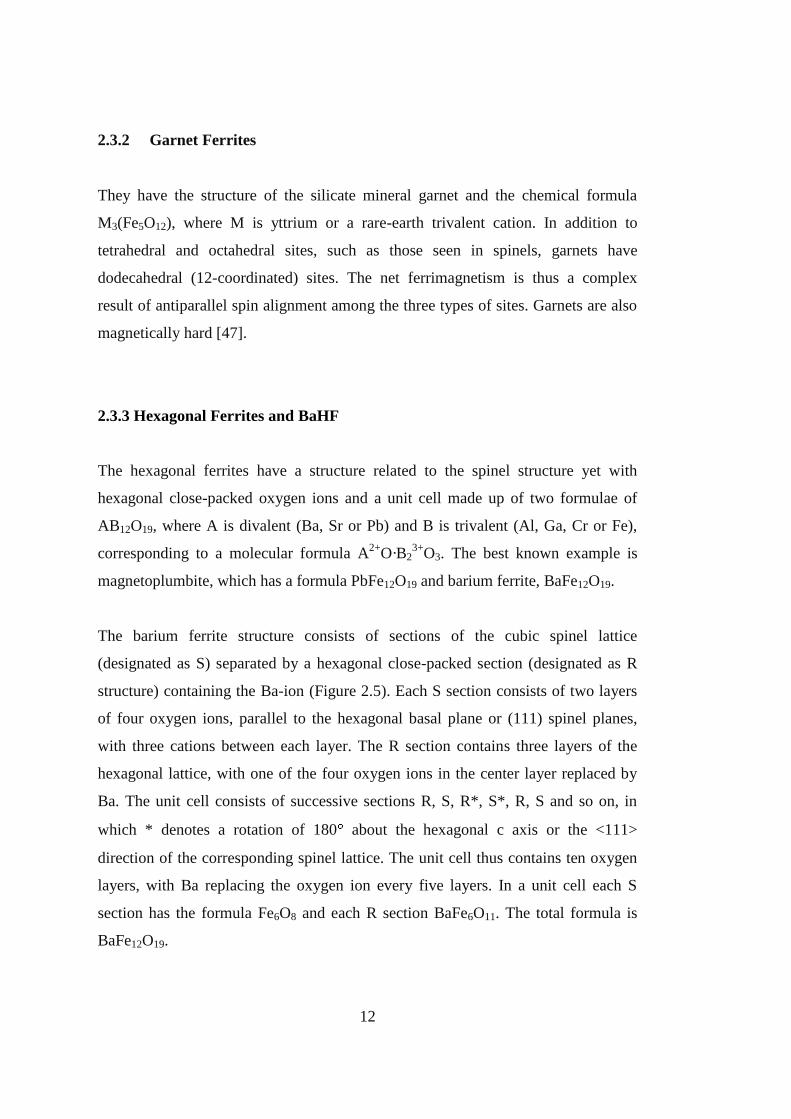
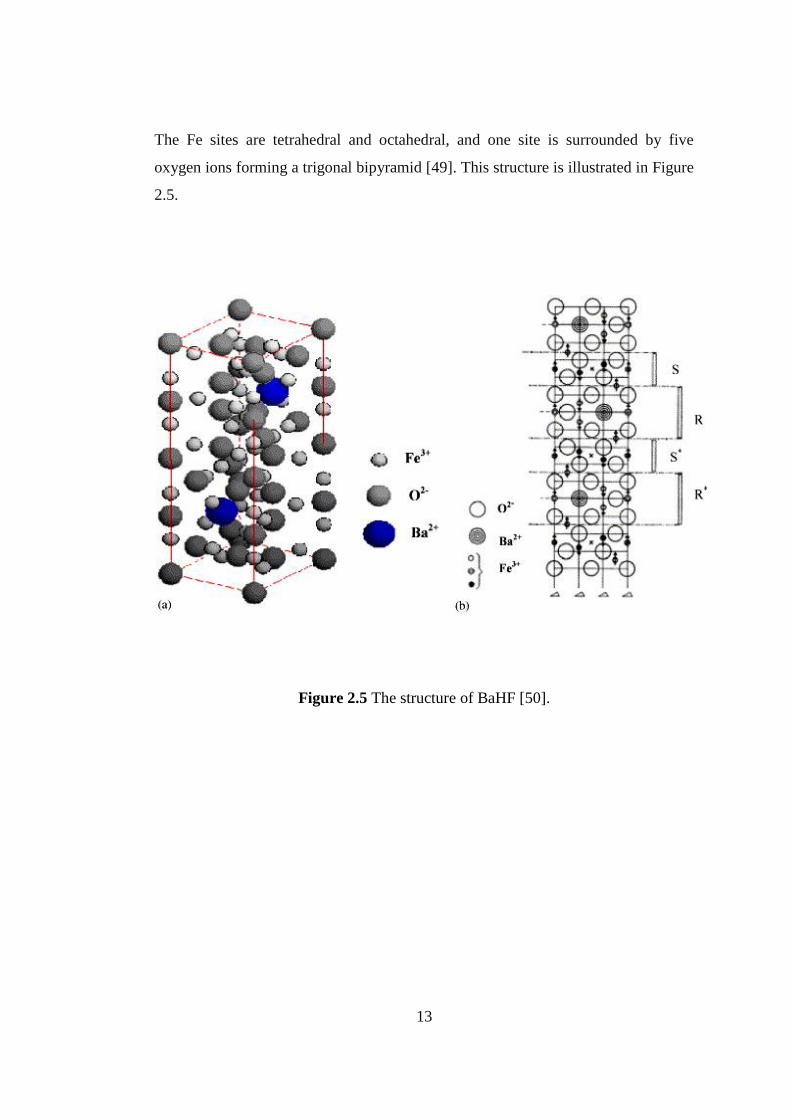
The barium ferrite structure consists of sections of the cubic spinel lattice
(designated as S) separated by a hexagonal close-packed section (designated as R
structure) containing the Ba-ion (Figure 2.5). Each S section consists of two layers
of four oxygen ions, parallel to the hexagonal basal plane or (111) spinel planes,
with three cations between each layer. The R section contains three layers of the
hexagonal lattice, with one of the four oxygen ions in the center layer replaced by
Ba. The unit cell consists of successive sections R, S, R*, S*, R, S and so on, in
which * denotes a rotation of 180 about the hexagonal c axis or the <111>
direction of the corresponding spinel lattice. The unit cell thus contains ten oxygen
layers, with Ba replacing the oxygen ion every five layers. In a unit cell each S
section has the formula Fe6O8 and each R section BaFe6O11. The total formula is
BaFe12O19.
13
The Fe sites are tetrahedral and octahedral, and one site is surrounded by five
oxygen ions forming a trigonal bipyramid [49]. This structure is illustrated in Figure
2.5.
Figure 2.5 The structure of BaHF [50].
14
2.4 Types of Ferrites According to Their Magnetic Properties
As ceramics, ferrites are magnetic materials made by mixing iron oxide (Fe2O3)
with other oxides and carbonates in the powdered form. The powders are then
compacted and sintered at elevated temperatures. Sometimes finishing machining is
necessary to produce the desired shape of the part [51].
Ferrites are classified into two groups according to their magnetic properties as soft
and hard ferrites.
2.4.1 Magnetically Soft Ferrites
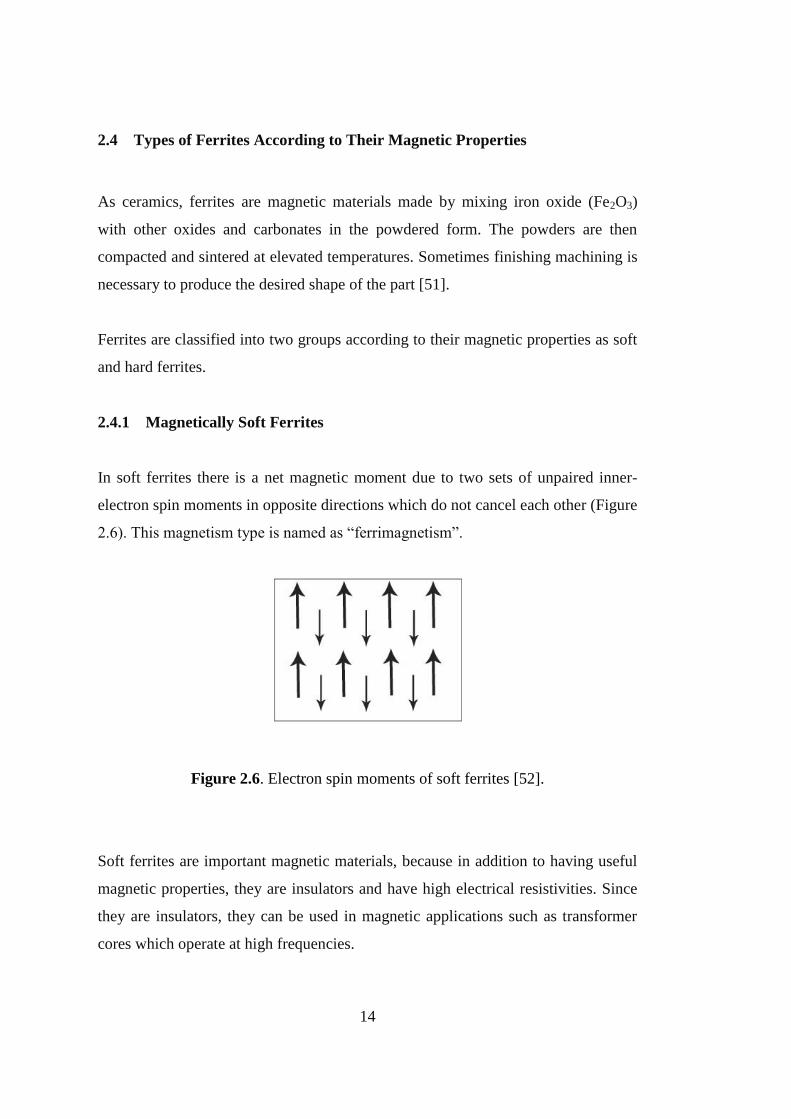
In soft ferrites there is a net magnetic moment due to two sets of unpaired inner-
electron spin moments in opposite directions which do not cancel each other (Figure
2.6). This magnetism type is named as “ferrimagnetism”.
Figure 2.6. Electron spin moments of soft ferrites [52].
Soft ferrites are important magnetic materials, because in addition to having useful
magnetic properties, they are insulators and have high electrical resistivities. Since
they are insulators, they can be used in magnetic applications such as transformer
cores which operate at high frequencies.

15
Some of the most important uses of soft ferrites are for low-signal, memory-core,
audiovisual and recording-head applications. At low signal levels, soft ferrite cores
are used for transformers and low-energy inductors [53].
2.4.2 Magnetically Hard Ferrites
A group of hard ferrites which are used for permanent magnets have the general
formula MO·6Fe2O3 and are hexagonal in crystal structure. The hexagonal ferrites
are low in cost, low in density and have a high coercive force. The high magnetic
strengths of these materials is due mainly to their high magnetocrystalline
anisotropy [55]. The magnetization of these materials is believed to take place by
domain wall nucleation and motion, as their grain size is too large for single-domain
behavior.
Hard-ferrite permanent magnets find widespread use in generators, relays, and
motors. Electronic applications include magnets for loudspeakers, telephone ringers,
and receivers. They are also used for holding devices for door closers, seals and
latches as well as in many toy designs [56].
The most important ferrite of this group is barium ferrite (BaO·6Fe2O3), which was
introduced in the Netherlands by the Philips Company in 1952 under the trade name
Ferroxdure [54]. In recent years the barium ferrites have been replaced by the
strontium ferrites to some extent, which have the general formula (SrO·6Fe2O3)
providing superior magnetic properties compared with the barium ferrites. These
ferrites are produced by almost the same method used for the soft ferrites, with most
being wet-pressed in a magnetic field to align the easy magnetizing axis of the
particles with the applied field.

16
It has been found that the magnetization and anisotropic constant of strontium
ferrite are greater than that of barium ferrite, and, furthermore, the Curie
temperature is slightly higher. For this reason, strontium ferrite magnets have been
the primary ferrite materials in commercial production since about 1980 [57].
It is known that the saturation magnetization and the anisotropy constant of PbO .
6Fe203 compound are lower than those of Sr and Ba ferrites, therefore, Pb ferrite
magnets are not equivalent to ordinary Sr and Ba ferrite magnets as far as their
magnetic properties are concerned [58]. More important than all of these issues,
lead ferrites are toxic, as a result of which they do not have a wide use in ferrite
industry.
2.5 Studies on Barium Ferrite Ceramics and Their Composites
M-type barium hexaferrites (BaHFs) (BaFe12O19) have attracted considerable
attention because of their excellent magnetic properties and potential applications in
various fields. As a hexaferrite, BaFe12O19 is one of the most frequently used ferrite
in applications as permanent magnets [57].
In these type of ferrites the magnetic coercivity typically decreases with increasing
crystallite size due to multi-domain formation and the easy movement of the
domain walls [58].
Coercivity is also affected by the change of magnetocrystalline anisotropy. For
strontium ferrite with hexagonal platelet-like morphology, when the c-axis is
considered to be the easy-axis of magnetization, change of lattice parameter c would
result in a decrease in coercivity. With the decrease of c (or c/a ratio), there is a
decline in the degree of magnetocrystalline anisotropy and hence the reduction of
coercivity [59].

17
Hexagonal ferrites having more permeability and higher magnetic resonance
frequency than spinel ferrites are used as chip inductors and microwave absorbers in
the GHz range [58]. Furthermore, due to their high saturation magnetization, great
magnetic coercivity, high magnetocrystalline anisotropy field and excellent
chemical stability, BaHFs are used in magnetic permanent and perpendicular
recording media or electromagnetic wave absorption materials [59].
In this context, there are various studies reporting on the usage of BaHF powders as
lossy additive in EM wave absorbing materials. In one of these studies Abbas et.al.
[60] prepared Co2+-
Si4+
substituted BaHF polymer composites made of polyaniline
and investigated their electromagnetic absorption properties at the 8.2-12.4 GHz
range. The composites showed a minimum reflection loss of -29 dB at 10.97 GHz.
BaHF powders can be doped with various elements in order to improve their
magnetic properties. In such a study pure and V2O5 doped BaCoxZn2-xFe16O27
barium ferrites where x=1.0, 1.3 and 1.5 were prepared by double-sintering method.
The electromagnetic absorption results showed that when compared to undoped
samples, 1.0 wt% V2O5 doped samples have about 50 % higher permeabilities
which was explained by improved domain wall permeability [61].
BaHFs can be synthesized by various methods. Wu et.al. [41] prepared
BaMe2Fe16O27 by sol-gel method. Me2 was selected as Co2, CoNi and CoZn and
obtained barium ferrites were blended with paraffin to make composites. The
BaCoZnFe16O27/paraffin composite showed the best microwave absorption among
the other two composites. Maximal reflection loss achieved was -16.23 dB.
In a study reported by Tehrani et. al. [62] BaMg0.25Mn0.25Co0.5Ti1.0Fe10O19 was
prepared by solid state reaction method. Synthesized ferrite powders were
incorporated in PVC matrix to form EM wave absorbing composites.
18
Vector network analyzer was used to investigate the EM wave absorption properties
of the composites. At the 12-18 GHz frequency range, -40 dB maximum reflection
loss was obtained.
In another study, undoped M-type BaHF prepared by reverse microemulsion
technique was electromagnetically characterized in the 8-18 GHz ranges [63]. The
minimum value of reflection loss reached was -28.52 dB at 13.80 GHz frequency.
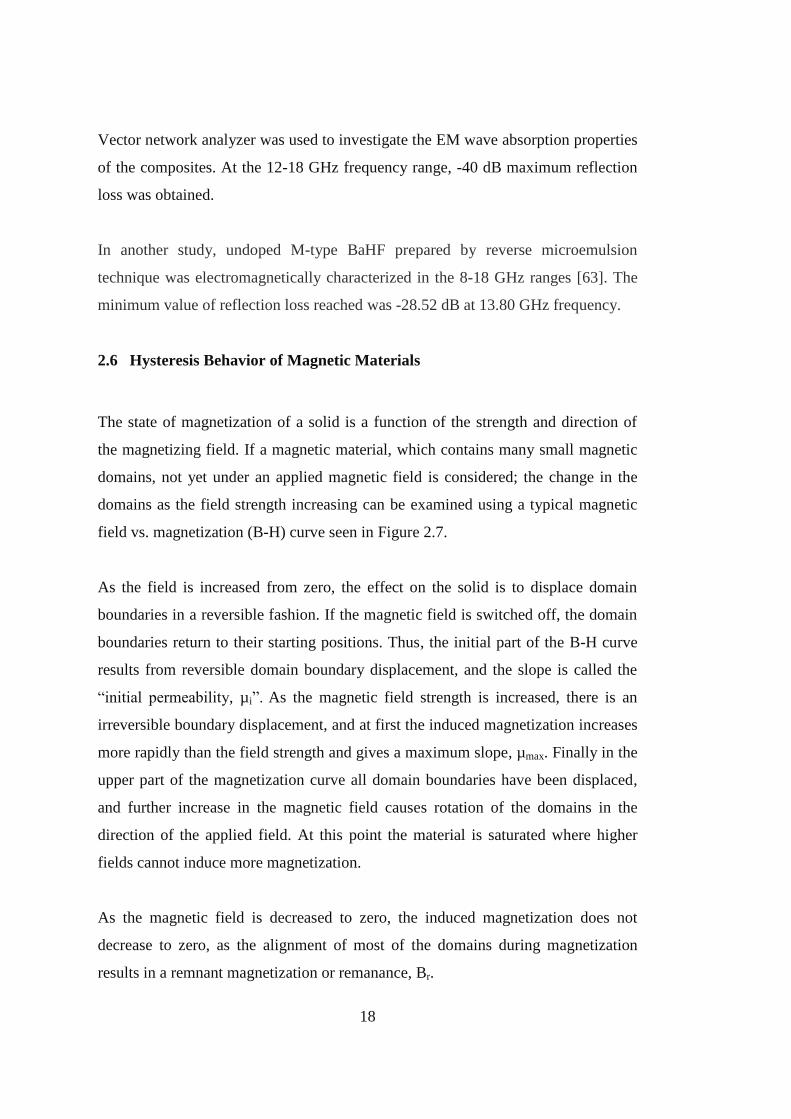
2.6 Hysteresis Behavior of Magnetic Materials
The state of magnetization of a solid is a function of the strength and direction of
the magnetizing field. If a magnetic material, which contains many small magnetic
domains, not yet under an applied magnetic field is considered; the change in the
domains as the field strength increasing can be examined using a typical magnetic
field vs. magnetization (B-H) curve seen in Figure 2.7.
As the field is increased from zero, the effect on the solid is to displace domain
boundaries in a reversible fashion. If the magnetic field is switched off, the domain
boundaries return to their starting positions. Thus, the initial part of the B-H curve
results from reversible domain boundary displacement, and the slope is called the
“initial permeability, µi”. As the magnetic field strength is increased, there is an
irreversible boundary displacement, and at first the induced magnetization increases
more rapidly than the field strength and gives a maximum slope, µmax. Finally in the
upper part of the magnetization curve all domain boundaries have been displaced,
and further increase in the magnetic field causes rotation of the domains in the
direction of the applied field. At this point the material is saturated where higher
fields cannot induce more magnetization.
As the magnetic field is decreased to zero, the induced magnetization does not
decrease to zero, as the alignment of most of the domains during magnetization
results in a remnant magnetization or remanance, Br.

19
When the direction of the magnetic field is reversed, the induced magnetization
decreases and finally becomes zero at a value of the magnetic field strength called
the coercive force, Hc. Further increased magnetic field strength in this opposite
direction eventually causes magnetic saturation in the reverse direction and causes a
saturation, Bs, and remanance, Br, values of the same magnitude as in the first
quadrant. As an applied field is cycled from one direction to the other direction, the
hysteresis loop is followed.
Since the area of the hysteresis loop represents the energy or work to bring about
changes in the magnetic domain structure, the product B H, called the energy
product, represents a net loss in the system, usually in the form of heat [66]. In
applications in which the magnetic material is cycled around the magnetization
curve many times per second, hysteresis losses are critical, and soft magnetic
materials (with low Br) are required.
Figure 2.7. Typical hysteresis curve of a ferromagnetic material [67].

20

21
CHAPTER 3
3 EXPERIMENTAL PROCEDURE
3.1. General Procedure
BaHF powders and platelets were synthesized to fabricate BaHF-polymer matrix
composites. Mixed oxide technique was used for the production of BaHF powders.
BaHF platelets were produced by molten salt synthesis method. In both of the
methods, the molar ratio of the initial materials Fe2O3 to BaCO3 was 5.3 in order to
complete the transformation to BaHF. This molar ratio was adopted from similar
studies reported in literature [68, 69]. Mixed oxide method included two calcination
steps. The first one was at 1040 ºC for 5 h and the following one was at 1050 ºC for
7 h. In the case of the molten salt synthesis, BaHF platelets were produced using
five different compositions of NaCl and KCl molten salts at 900 ºC for 2 h.
BaHF-polymer matrix composites were fabricated by dispersing BaHF powders and
platelets in the PS solution and then by tape casting this dispersion.
The average particle and platelet sizes were measured by applying quantitative
metallographic analysis on the scanning electron microscope (FE-SEM, FEI 430
NanoSEM, Oregon, USA) images of the solid residues. Resulting solid residues
were characterized by quantitative X-Ray analysis in order to determine the amount
of BaHF formation.
Magnetic behavior of the synthesized BaHF powders and platelets were clarified via
magnetic hysteresis curves obtained using vibrating sample magnetometer (VSM)
(Cryogenic Limited PPMS, London, UK) at 300 K.

22
For the electromagnetic characterization of the BaHF-polymer matrix composites in
the 18-40 GHz range free-space method was used in combination with a network
analyzer.
3.2. Sample Preparation
3.2.1. Preparation of BaHF Powders by Mixed Oxide Method
Mixed oxide method was applied for the synthesis of BaHF powders. Reagent grade
powders of Fe2O
3 (Sigma-Aldrich, 99.999%) and BaCO
3 (Sigma-Aldrich, 99%)
were used as the starting materials. Fe2O
3 and BaCO
3 were mixed in Fe
2O
3/BaCO
3
molar ratio of 5.3. The starting materials were weighed in the required molar
proportions and ball milled for 1.5 h in distilled water. Zirconia balls were used as
the milling medium, where the ball to solid mixture weight ratio was 7. Water was
added just to embed the ball and solid mixture in the polypropylene container. In
order to remove the water from the mixture after ball milling, drying was applied in
an oven at 80 ºC for 24 h. After this, the first calcination step was applied at
1040 ºC for 5 h in a muffle furnace in ambient air. Following the first calcination
step, ball milling was applied using zirconia balls for 12 h in distilled water for
further reduction of particle size. After applying the second drying at 80 ºC for 24 h,
the second calcination step was done at 1050 ºC for 7 h to allow the completion of
the below given reaction.
BaCO3 + 6Fe2O3 = BaFe12O19 + CO2 (g)
Synthesized BaHF powders were sieved utilizing 150 mesh sieve followed by ball
milling at 375 rpm using zirconia balls for 12 h for the final particle size reduction.
23
Finally, BaHF powders with particle size ranging between 400 and 600 nm were
achieved. These values were measured by applying quantitative metallographic
analysis on the scanning electron microscope images.
Image J programme was used. Average of 20 different random particles were
calculated and the standard deviation was 65 nm.
3.2.2. Preparation of BaHF Platelets by Molten Salt Synthesis Method
BaHF platelets were prepared by molten salt synthesis method. In this process,
reagent grade powders of Fe2O3 (Sigma-Aldrich, 99.999%), BaCO3 (Sigma-Aldrich,
99%), KCl (Sigma-Aldrich, 99%) and NaCl (Sigma-Aldrich, 99.5%) were used as
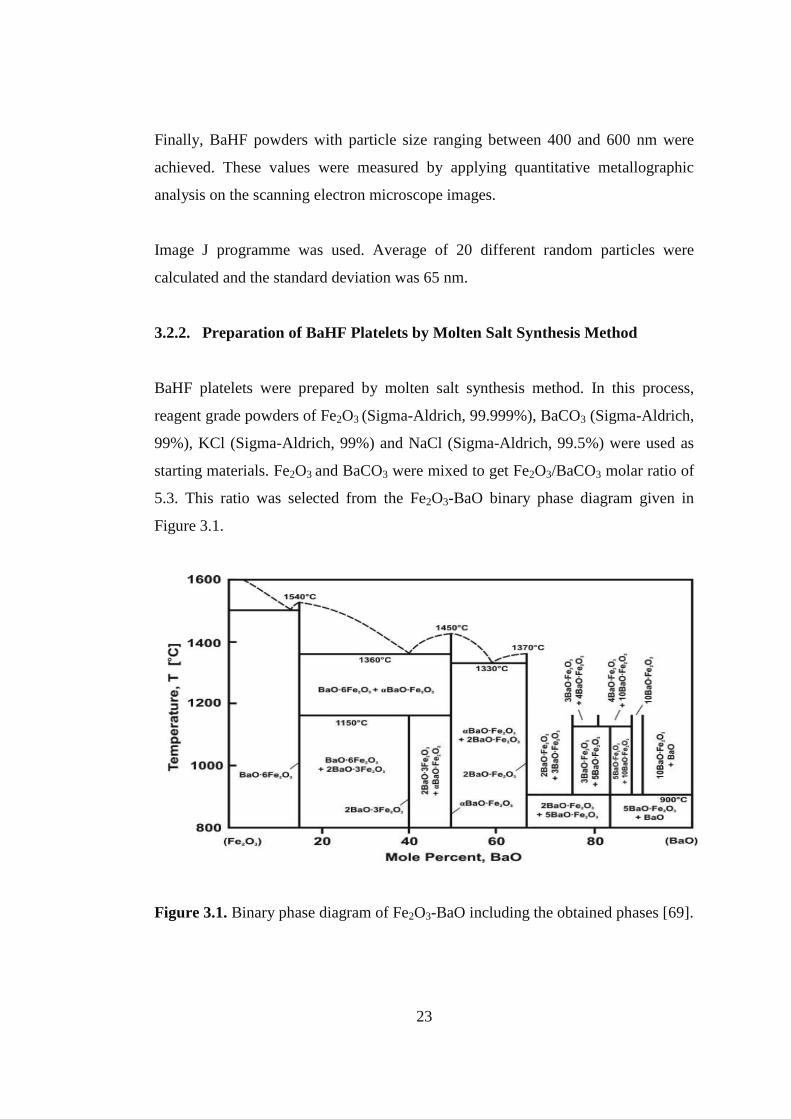
starting materials. Fe2O3 and BaCO3 were mixed to get Fe2O3/BaCO3 molar ratio of
5.3. This ratio was selected from the Fe2O3-BaO binary phase diagram given in
Figure 3.1.
Figure 3.1. Binary phase diagram of Fe2O3-BaO including the obtained phases [69].
24
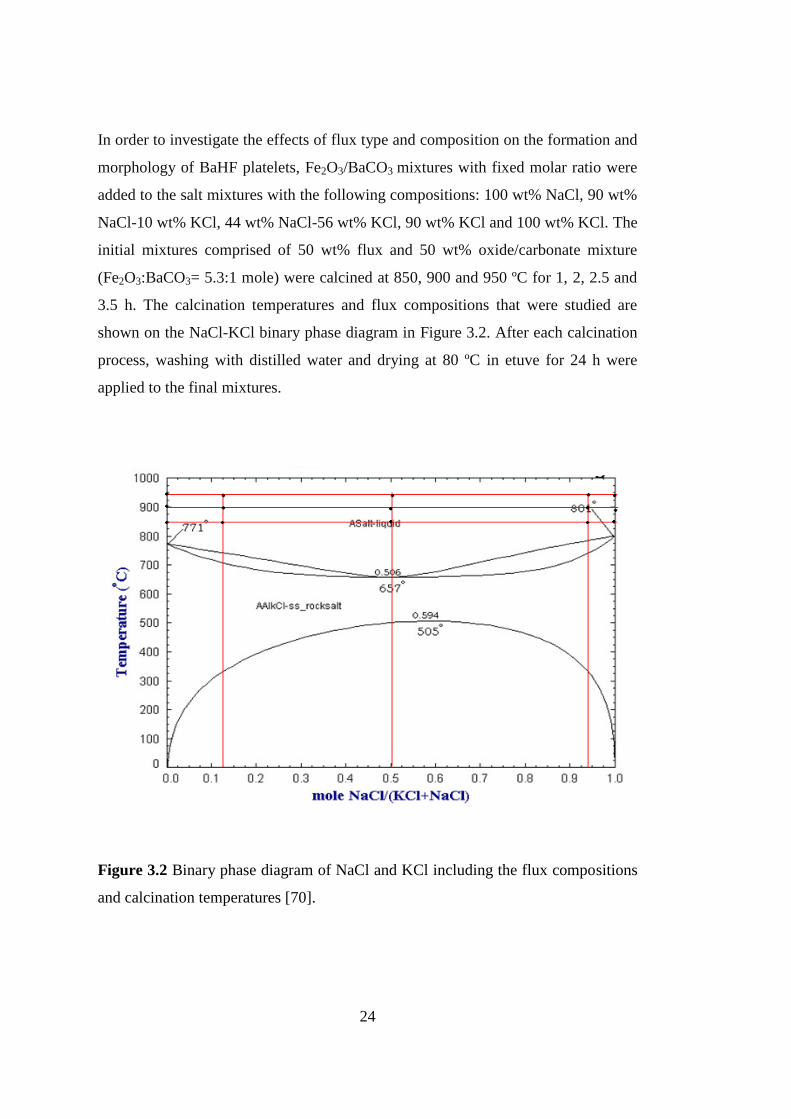
In order to investigate the effects of flux type and composition on the formation and
morphology of BaHF platelets, Fe2O3/BaCO3 mixtures with fixed molar ratio were
added to the salt mixtures with the following compositions: 100 wt% NaCl, 90 wt%
NaCl-10 wt% KCl, 44 wt% NaCl-56 wt% KCl, 90 wt% KCl and 100 wt% KCl. The
initial mixtures comprised of 50 wt% flux and 50 wt% oxide/carbonate mixture
(Fe2O3:BaCO3= 5.3:1 mole) were calcined at 850, 900 and 950 ºC for 1, 2, 2.5 and
3.5 h. The calcination temperatures and flux compositions that were studied are
shown on the NaCl-KCl binary phase diagram in Figure 3.2. After each calcination
process, washing with distilled water and drying at 80 ºC in etuve for 24 h were
applied to the final mixtures.
Figure 3.2 Binary phase diagram of NaCl and KCl including the flux compositions
and calcination temperatures [70].

25
The average size of the platelets was measured by applying quantitative
metallographic analysis on the scanning electron microscope (FE-SEM, FEI 430
NanoSEM, Oregon-USA) images.
3.2.3. Fabrication of BaHF-Polymer Matrix Electromagnetic (EM) Wave
Absorbing Composites
EM wave absorbing composites composed of the synthesized BaHF powders as the
filler materials and PS as the polymer matrix were fabricated by tape casting. BaHF
powders synthesized by mixed oxide method or BaHF platelets synthesized by
molten salt synthesis method were added to PS solutions to form dispersion to be
casted.
3.2.3.1 BaHF Powder-Polymer Matrix Composite Production
BaHF powders synthesized by mixed oxide method were used as the inorganic filler
of the EM wave absorbing composites. In the fabrication procedure, 30 ml of PS
solution, composed of 65 wt% chloroform and 35 wt% PS in granular form, was
mixed with 10, 20, and 30 wt% BaHF powders. The mixtures were put in a mixer
and homogenized at 2000 rpm for 5 min. Obtained solution was tape casted with a
thickness of 50 µm. Tapes were dried for 24 h. 6.5 x 6.5 cm squares were cut from
the dried tapes.
In order to investigate the effect of texture on the EM wave absorption properties of
the composites, the rest of the tapes were obtained without tape casting process. For
that, 20 ml of PS solution was mixed with 10, 20, and 30 wt% BaHF powders, and
homogenized at 2000 rpm for 5 min using a planetary centrifugal homogenizing
mixer (Thinky ARE-310, Tokyo, Japan). Obtained solution was poured directly on
a previously cleaned glass surface and dried for 24 h in ambient atmosphere. Square
shaped specimens of size 6.5 x 6.5 cm were cut from the dried part.

26
5 square shaped individual specimens were stacked on top of each other to form the
5-layered BaHF powder-PS matrix composite. The thickness of the 5-layered
composites was 250 µm.
3.2.3.2 BaHF Platelet-Polymer Matrix Composite Production
BaHF platelets synthesized by molten salt synthesis method were used to fabricate
EM wave absorbing composites. As mentioned earlier, BaHF platelets were
synthesized in five different flux compositions of 100 wt% NaCl, 90 wt% NaCl-10
wt% KCl, 44 wt% NaCl-56 wt% KCl, 10 wt% NaCl-90 wt% KCl, and 100 wt%
KCl.
For the fabrication of the composites, 30 ml of PS solution, composed of 65 wt%
chloroform and 35 wt% PS in granular form, was mixed with 30 wt% BaHF
platelets synthesized in 5 different flux compositions.
These mixtures were put in the previously mentioned planetary centrifugal
homogenizing mixer and homogenized at 2000 rpm for 5 min. Obtained dispersion
was tape cast on a glass surface with a thickness of 50 µm. Tapes were dried in
ambient air at 23 ºC for 24 h. Square shaped specimens of size 6.5 x 6.5 cm were
cut from the dried tape.
In order to investigate the effect of texture on the EM wave absorption properties of
the BaHF platelet-PS matrix composites, control samples were prepared by casting
(without tape casting). 20 ml of PS solution was mixed with 30 wt% BaHF platelets
synthesized in 100 wt% NaCl flux composition. This mixture was similarly
homogenized at 2000 rpm for 5 min. The obtained solution was poured directly to a
glass surface and dried for 24 h under identical ambient conditions. Square shaped
specimens of size 6.5 x 6.5 cm were cut from the dried as-cast composite.

27
2 square shaped specimens were placed on top of each other to prepare a 2-layered
BaHF platelet-PS matrix composite. The thickness of the 2-layered composite was
100 µm.
3.2.3.3 BaHF Platelet and Graphite Flake or Nickel Flake-Polymer Matrix
Composite Production
In order to improve the EM wave absorption properties of BaHF platelet containing
composites, BaHF platelet and graphite flake or nickel flake-polymer matrix
composites were prepared. For this purpose, 30 ml of PC solution, composed of 62
wt% chloroform and 38 wt% PC in granular form, was mixed with 3 g of BaHF
platelet and 1 g of graphite flake (natural, -325 mesh, 99.8 %, metals basis-Alfa
Aesar). In the case of the nickel flake containing composites, 30 ml of the above
mentioned PC solution was mixed with 3 g BaHF platelets and 1 g nickel flake (-
325 mesh, 0.37 micrometer thick, typically 99.8 %, metals basis-Alfa Aesar).
The mixtures were mixed and homogenized at 2000 rpm for 5 min. Obtained
dispersions were tape casted with a thickness of 50 µm. Tapes were dried in
ambient air at 23 ºC for 24 h. Square shaped specimens of size 6.5 x 6.5 cm were
cut from the dried tapes.
Individual square shaped specimens were stacked on top of each other to form
multilayered BaHF platelet and graphite flake or nickel flake-pc matrix composites.
The effect of number of layers on the EM wave absorption properties of BaHF
platelet and graphite flake or nickel flake-PC matrix multilayered composites were
investigated in 18-40 GHz range.

28
3.3. Characterization
3.3.1. Microstructural Characterization
The sizes and morphologies of BaHF powders, BaHF platelets, graphite flakes and
nickel flakes were examined by using scanning electron microscope (FE-SEM, FEI
430 NanoSEM, Oregon-USA). No metallographic preparation or coating was done
to observe the samples in the microscope. Low accelerating voltages in the range of
5-10 kV was sufficient for the examinations since there was no coating.
Polished surfaces of the BaHF and Graphite or Ni flake containing polymer matrix
composites were investigated by optical microscope. OLYMPUS PME3-F200
transmitted light metallurgical microscope was utilized both in bright-field and
dark-field illumination modes for the observations of the BaHF/PS, BaHF/Ni-PC
and BaHF/Graphite-PC composites.
3.3.2. Phase Analysis
X-Ray diffraction (XRD) technique was used to determine the phase content of the
obtained powders and platelets. Rigaku D/MAX2200/ PC with Cu Kα source having
Kα1=1.54056 Å and Kα2=1.5444 Å wavelengths was utilized in the 2 range of 15º
to 80º with a scanning rate of 2º/min. Quantitative XRD analyses were applied to
the solid residues obtained from the flux compositions of 100 wt% NaCl, 90 wt%
NaCl–10 wt% KCl, 44 wt% NaCl–56 wt% KCl (1:1 mol), 90 wt% KCl–10 wt%
NaCl and 100 wt% KCl by using the software of Rigaku D/MAX2200/ PC. In this
analysis the “Peak Fitting Approach” was utilized. Fitting of full X-Ray diffraction
(XRD) patterns is an effective method for quantifying abundances during X-Ray
diffraction analyses.
29
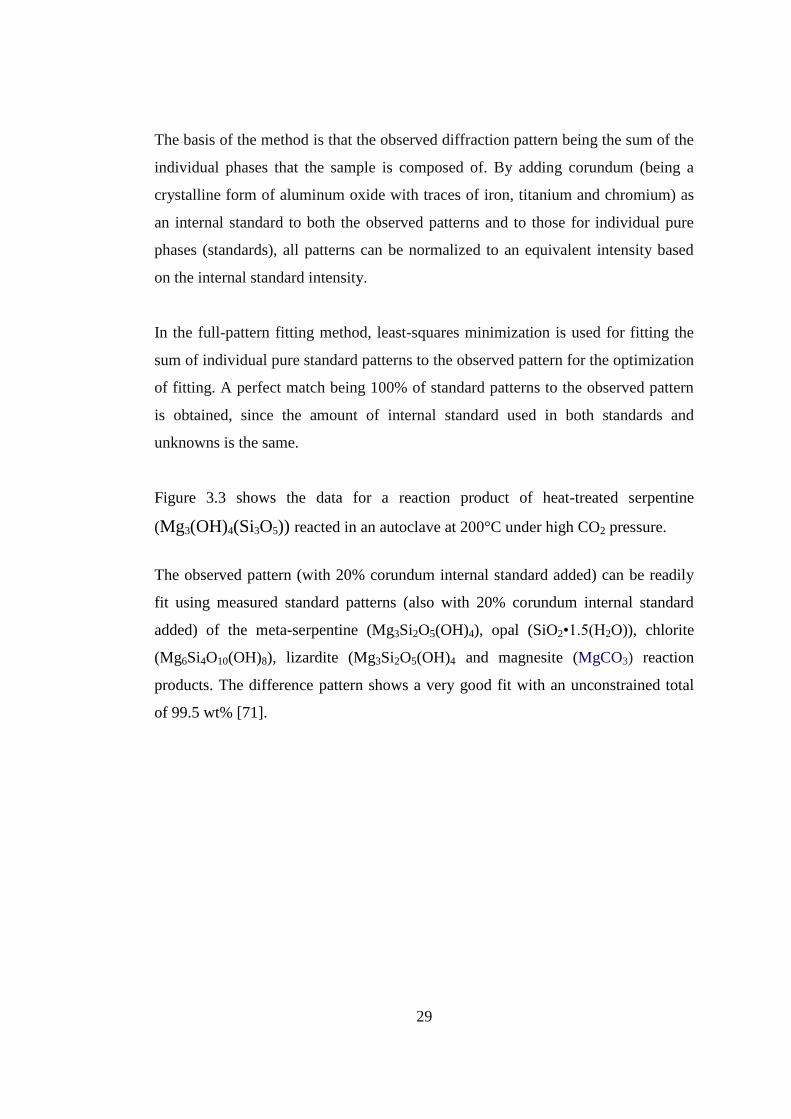
The basis of the method is that the observed diffraction pattern being the sum of the
individual phases that the sample is composed of. By adding corundum (being a
crystalline form of aluminum oxide with traces of iron, titanium and chromium) as
an internal standard to both the observed patterns and to those for individual pure
phases (standards), all patterns can be normalized to an equivalent intensity based
on the internal standard intensity.
In the full-pattern fitting method, least-squares minimization is used for fitting the
sum of individual pure standard patterns to the observed pattern for the optimization
of fitting. A perfect match being 100% of standard patterns to the observed pattern
is obtained, since the amount of internal standard used in both standards and
unknowns is the same.
Figure 3.3 shows the data for a reaction product of heat-treated serpentine
(Mg3(OH)4(Si3O5)) reacted in an autoclave at 200°C under high CO2 pressure.
The observed pattern (with 20% corundum internal standard added) can be readily
fit using measured standard patterns (also with 20% corundum internal standard
added) of the meta-serpentine (Mg3Si2O5(OH)4), opal (SiO2•1.5(H2O)), chlorite
(Mg6Si4O10(OH)8), lizardite (Mg3Si2O5(OH)4 and magnesite (MgCO3) reaction
products. The difference pattern shows a very good fit with an unconstrained total
of 99.5 wt% [71].

30
Figure 3.3 Full-pattern fitting analysis of an autoclaved and heat-treated
serpentine [71].
3.3.3. Magnetic Characterization
Magnetic behavior of the synthesized BaHF powders and platelets were
investigated via magnetic hysteresis curves obtained using vibrating sample
magnetometer (VSM) (Cryogenic Limited PPMS, London- UK) at 300 K. B-H
curves of the samples were obtained via vibrating sample magnetometer at external
magnetic field values between 10000 and 10000 Oersteds applied where applied
external magnetic fields were changing between .
VSM measurements were conducted on samples with powder form. Consequently,
hysteresis loss and saturation magnetization were determined for the samples
obtained by different processing parameters.

31
3.3.4. Electrical Conductivity Measurement
The electrical conductivities of BaHF/graphite and BaHF/Ni polymer matrix
composites were measured using Jandel universal 4-point probe measurement
system an example of which is schematically illustrated in Figure 3.4. Current is
applied to the sample by the two end probes and voltage taken from the two middle
probes is detected. By using the current and voltage values, sheet resistance and
bulk resistivity of the samples were measured. For low resistivity materials (100 Ω-
1 kΩ) 1-5 mA was applied while for high resistivity materials (1 kΩ-10 kΩ) applied
current was 10 µA-0.1 mA.
The sheet resistance, RS, of the composite tapes was determined using the following
equation [72]:
RS = ρ*V/I (Ω /sq) (3.1)
where RS is in per square, voltage V in mV and current I in mA where ρ is the
geometric factor of the thin films or wafers being typically 4.5324.
Figure 3.4 Four-Point probe measurement system [73].
32
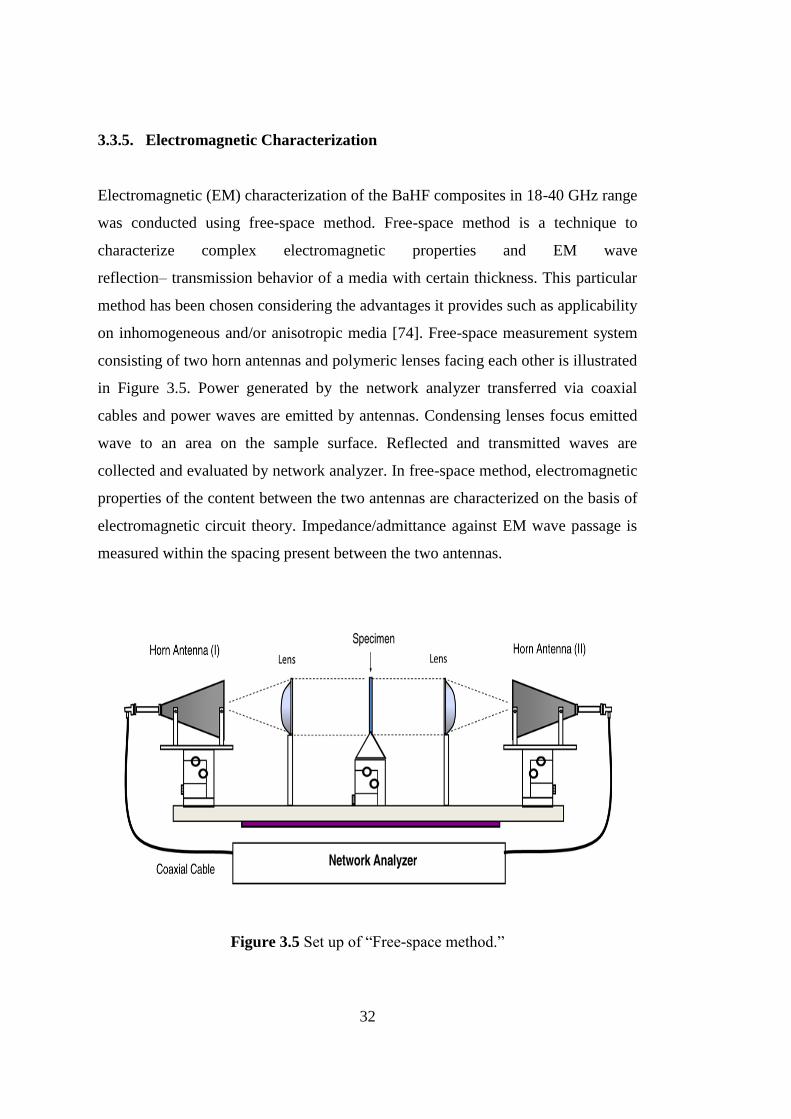
3.3.5. Electromagnetic Characterization
Electromagnetic (EM) characterization of the BaHF composites in 18-40 GHz range
was conducted using free-space method. Free-space method is a technique to
characterize complex electromagnetic properties and EM wave
reflection– transmission behavior of a media with certain thickness. This particular
method has been chosen considering the advantages it provides such as applicability
on inhomogeneous and/or anisotropic media [74]. Free-space measurement system
consisting of two horn antennas and polymeric lenses facing each other is illustrated
in Figure 3.5. Power generated by the network analyzer transferred via coaxial
cables and power waves are emitted by antennas. Condensing lenses focus emitted
wave to an area on the sample surface. Reflected and transmitted waves are
collected and evaluated by network analyzer. In free-space method, electromagnetic
properties of the content between the two antennas are characterized on the basis of
electromagnetic circuit theory. Impedance/admittance against EM wave passage is
measured within the spacing present between the two antennas.
Figure 3.5 Set up of “Free-space method.”

33
Waves reflected from the specimen surface as well as the ones transmitted through
the specimen are collected and evaluated by the network analyzer (Anritsu 37269E,
Vector Network Analyzer, 40 MHz-40 GHz, Anritsu Company, Morgan Hill CA,
USA) in 18-40 GHz frequency range. Reflection (RdB) loss and transmission loss
(TdB) values are recorded in terms of dB for different composite specimen sets.
Reflection loss and transmission loss are indications of the ratio of the power
reflected (PR) or power transmitted (PT) to total power supplied by the system (P0)
as given in the following two equations. Ratio of the power neither reflected nor
transmitted is absorbed by the composite samples (% EM Wave Absorption) which
can be determined by Equation 3.4 based on the principle of energy conservation.
During study, TRL calibration of the system is done prior to free-space
measurements. After calibration, samples are placed into measurement opening at
the center of the distance between the two horn antennas.

34
35
CHAPTER 4
4. RESULTS AND DISCUSSION
4.1. XRD and SEM Analyses of Powders Synthesized by Mixed Oxide Method
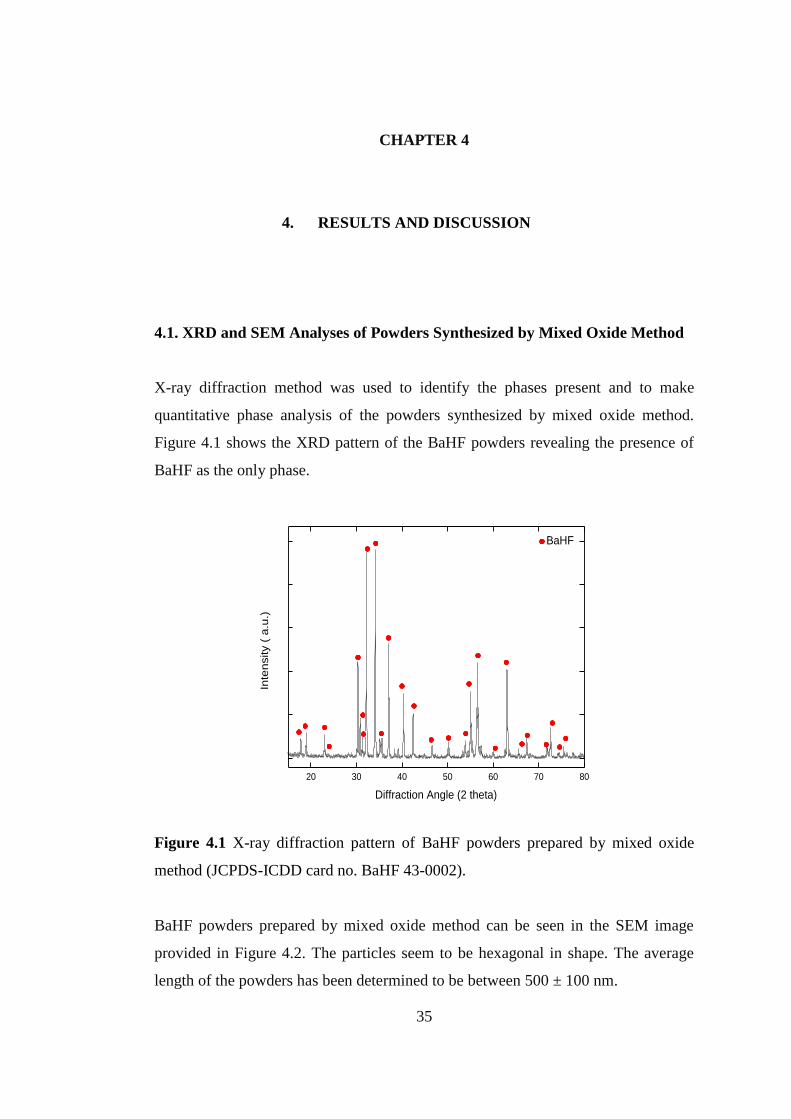
X-ray diffraction method was used to identify the phases present and to make
quantitative phase analysis of the powders synthesized by mixed oxide method.
Figure 4.1 shows the XRD pattern of the BaHF powders revealing the presence of
BaHF as the only phase.
Figure 4.1 X-ray diffraction pattern of BaHF powders prepared by mixed oxide
method (JCPDS-ICDD card no. BaHF 43-0002).
BaHF powders prepared by mixed oxide method can be seen in the SEM image
provided in Figure 4.2. The particles seem to be hexagonal in shape. The average
length of the powders has been determined to be between 500 ± 100 nm.
20 30 40 50 60 70 80
Inte
nsity (
a.u
.)
Diffraction Angle (2 theta)
BaHF

36
Figure 4.2 SEM image of BaHF powders prepared by mixed oxide method.
4.2. SEM and XRD Analyses of Platelets Synthesized by Molten Salt Synthesis
The platelets were synthesized in molten salt in order to be used in a further study
for the fabrication of BaHF-polymer matrix electromagnetic wave absorbing
composites utilizing tape casting technique. Thus, the largest possible platelet radius
with high aspect ratio was desired. Calcination time, temperature, flux type and
composition were investigated systematically in order to determine the optimum
condition to achieve maximum possible platelet size.
Figure 4.3 shows the platelet size distribution as a function of flux composition for
varying calcination durations and temperatures. It is observed that under all
conditions platelet size in KCl flux is the smallest.

37
With the increase in the NaCl flux content, platelet size increases. However, after a
certain concentration approaching the equi-molar flux composition, platelet size
starts to decrease. It should be noted that platelet size in NaCl flux was larger than
that in KCl for all calcination temperatures and durations applied. This
demonstrates the lower apparent activation energy for platelet growth in NaCl rich
fluxes. As a result, for the same calcination temperatures and durations, the apparent
activation energy for platelet growth in NaCl flux should be lower than that in the
KCl flux. Compared to other temperatures, platelet size at 900 °C was the largest
for most of the compositions, especially for 2 h calcination duration. For this
reason, morphology studies using SEM, quantitative phase analysis using XRD,
magnetic characterization using VSM and characterization of the electromagnetic
wave absorption properties of the resulting composites using free-space method
with the network analyzer were concentrated on the BaHF platelets calcined at
900 °C for 2 h.

38
(a) (b)
(c) (d)
Figure 4.3 Platelet size as a function of flux composition at 850, 900 and 950 °C for
(a) 1 h, (b) 2 h, (c) 2.5 h and (d) 3.5 h of calcination. Fit to the data point are for
visual aid.
0 20 40 60 80 1001.0
1.2
1.4
1.6
1.8
2.0
2.2
2.4
Pla
tele
t S
ize (
m)
wt% NaCl
2h-850 0C
2h-900 0C
2h-950 0C
0 20 40 60 80 1001.0
1.2
1.4
1.6
1.8
2.0
2.2
2.4
Pla
tele
t S
ize
(m
)
wt % NaCl
2.5h-850 0C
2.5h-900 0C
2.5h-950 0C
0 20 40 60 80 1001.0
1.2
1.4
1.6
1.8
2.0
2.2
2.4
Pla
tele
t S
ize
(m
)
wt% NaCl
3.5h-850 0C
3.5h-900 0C
3.5h-950 0C
0 20 40 60 80 1001.0
1.2
1.4
1.6
1.8
2.0
2.2
2.4
Pla
tele
t S
ize (
m)
wt% NaCl
1h-850 0C
1h-900 0C
1h-950 0C

39
SEM images in Figure 4.4 illustrate both the morphologies and the platelet sizes at
900 °C for 2 h calcination of BaHF platelets synthesized in molten salt.
Figure 4.4 SEM images of BaHF platelets calcined in (a) 100 wt% KCl, (b) 90 wt%
KCl-10 wt% NaCl, (c) 44 wt% NaCl- 56 wt% KCl, (d) 90 wt% NaCl- 10 wt% KCl,
and (e) 100 wt% NaCl at 900 °C for 2 h.
Regarding the morphology of the BaHF platelets, in the case of the synthesis at
900 °C in NaCl flux, corners of the platelets became rounder (Figure 4.4 (e)). This
is speculated to be caused by the selective desorption from the corners as a result of
curvature dependent chemical potential change around the sharp corners of the
platelets in the molten NaCl flux. In the case of platelet synthesis in KCl flux, either
no desorption occurred or desorption occurred homogenously on all the surfaces
and corners of the platelets so that platelet shape with sharp corners was preserved
(Figure 4.4 (a)). The aspect ratios of the platelets was determined to be
approximately 3 to 4 for all calcination conditions.

40
Figures 4.5-4.9 show the phase content of the BaHF platelets synthesized by molten
salt synthesis method at 900 °C for 2 h with different flux types and compositions.
In all of the XRD patterns presence of some amount of remaining Fe2O3 phase can
be observed. The amount of Fe2O3 phase is decreasing as the content of NaCl in the
flux increases.
Figure 4.5 X-Ray diffraction pattern of BaHF platelets synthesized in
100 wt% KCl flux composition.
Figure 4.6 X-Ray diffraction pattern of BaHF platelets synthesized in
90 wt% KCl- 10 wt% NaCl flux composition.
20 30 40 50 60 70 80
Inte
nsity (
a.u
.)
Diffraction Angle (2 theta)
4.7 % Fe2O395.3 % BaHF
100 % KCl
20 30 40 50 60 70 80
Inte
nsity (
a.u
.)
Diffraction Angle (2 theta)
4.2 % Fe2O395.8 % BaHF
90 % KCl

41
Figure 4.7 X-Ray diffraction pattern of BaHF platelets synthesized in
44 wt% NaCl- 56 wt% KCl flux composition.
Figure 4.8 X-Ray diffraction pattern of BaHF platelets synthesized in 90 wt%
NaCl- 10 wt% KCl flux composition.
20 30 40 50 60 70 80
Inte
nsity (
a.u
.)
Diffraction Angle (2 theta)
3.2 % Fe2O3
96.8 % BaHF
44 % NaCl
20 30 40 50 60 70 80
Inte
nsity (
a.u
.)
Diffraction Angle (2 theta)
2.5 % Fe2O
3
97.5 % BaHF
90 % NaCl

42
Figure 4.9 X-Ray diffraction pattern of BaHF platelets synthesized in
100 wt% NaCl flux composition.
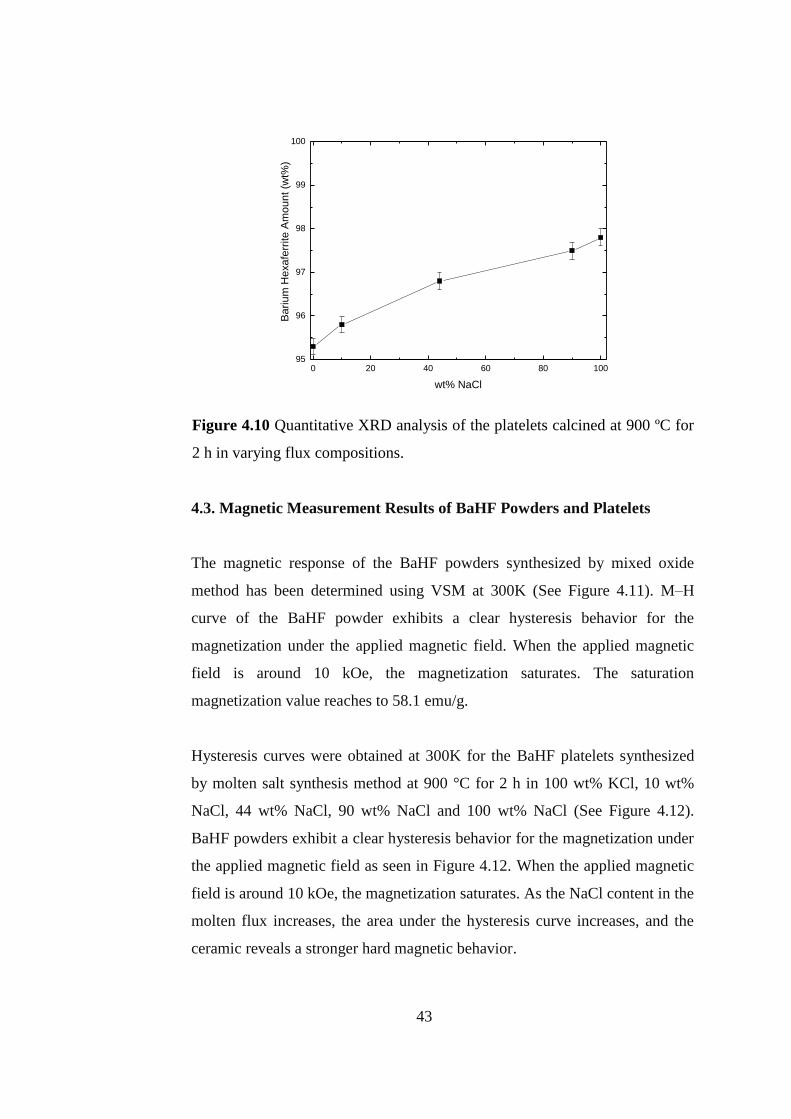
Figure 4.10 shows the amount of BaHF phase formed during calcination at
900 ºC for 2 h as a function of flux composition which was determined using
quantitative XRD analysis.
It is obvious that formation of BaHF phase within the system is the lowest
when synthesis has been done in 100 wt% KCl flux. With the increase in the
NaCl content, the amount of BaHF phase increases gradually up to 97.8 wt%
at 100 wt% NaCl flux composition.
20 30 40 50 60 70 80
Inte
nsity (
a.u
.)
Diffraction Angle (2 theta)
2.2 % Fe2O397.8 % BaHF
100 % NaCl
43
Figure 4.10 Quantitative XRD analysis of the platelets calcined at 900 ºC for
2 h in varying flux compositions.
4.3. Magnetic Measurement Results of BaHF Powders and Platelets
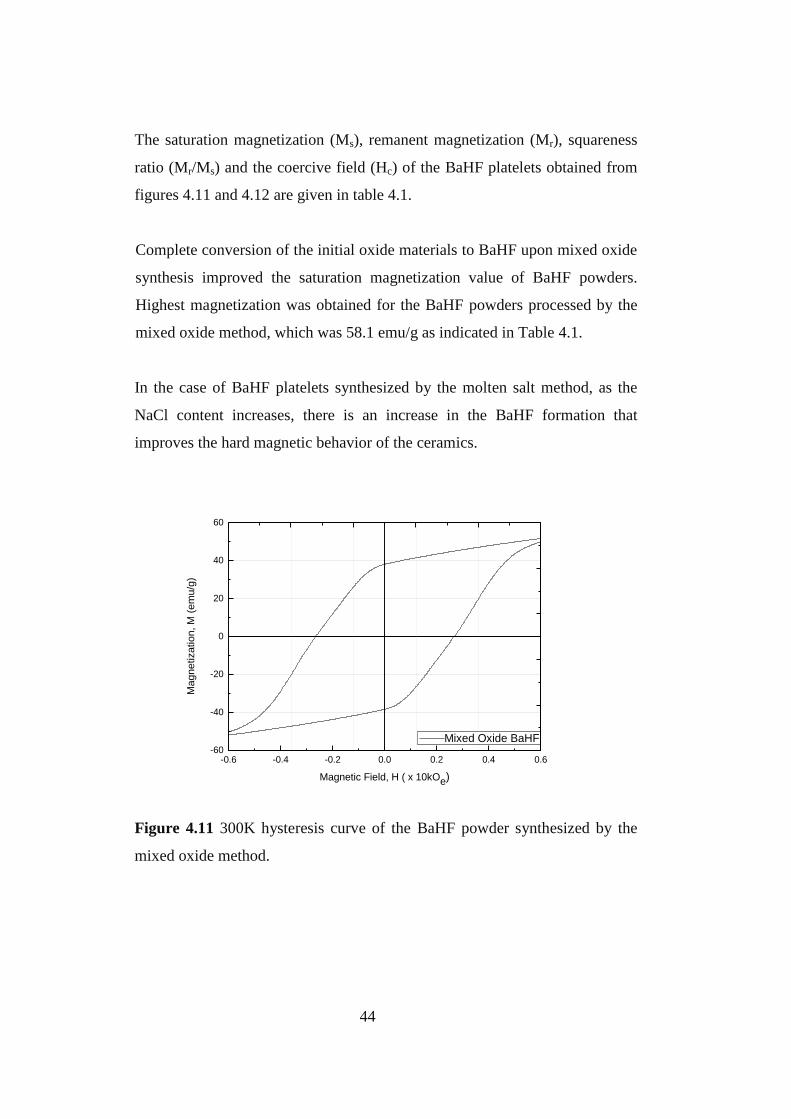
The magnetic response of the BaHF powders synthesized by mixed oxide
method has been determined using VSM at 300K (See Figure 4.11). M–H
curve of the BaHF powder exhibits a clear hysteresis behavior for the
magnetization under the applied magnetic field. When the applied magnetic
field is around 10 kOe, the magnetization saturates. The saturation
magnetization value reaches to 58.1 emu/g.
Hysteresis curves were obtained at 300K for the BaHF platelets synthesized
by molten salt synthesis method at 900 °C for 2 h in 100 wt% KCl, 10 wt%
NaCl, 44 wt% NaCl, 90 wt% NaCl and 100 wt% NaCl (See Figure 4.12).
BaHF powders exhibit a clear hysteresis behavior for the magnetization under
the applied magnetic field as seen in Figure 4.12. When the applied magnetic
field is around 10 kOe, the magnetization saturates. As the NaCl content in the
molten flux increases, the area under the hysteresis curve increases, and the
ceramic reveals a stronger hard magnetic behavior.
0 20 40 60 80 10095
96
97
98
99
100
Ba
riu
m H
exa
ferr
ite
Am
ou
nt (w
t%)
wt% NaCl
44
The saturation magnetization (Ms), remanent magnetization (Mr), squareness
ratio (Mr/Ms) and the coercive field (Hc) of the BaHF platelets obtained from
figures 4.11 and 4.12 are given in table 4.1.
Complete conversion of the initial oxide materials to BaHF upon mixed oxide
synthesis improved the saturation magnetization value of BaHF powders.
Highest magnetization was obtained for the BaHF powders processed by the
mixed oxide method, which was 58.1 emu/g as indicated in Table 4.1.
In the case of BaHF platelets synthesized by the molten salt method, as the
NaCl content increases, there is an increase in the BaHF formation that
improves the hard magnetic behavior of the ceramics.
Figure 4.11 300K hysteresis curve of the BaHF powder synthesized by the
mixed oxide method.
-0.6 -0.4 -0.2 0.0 0.2 0.4 0.6-60
-40
-20
0
20
40
60
Magnetization, M
(em
u/g
)
Magnetic Field, H ( x 10kOe)
Mixed Oxide BaHF

45
Figure 4.12 300K hysteresis curves of BaHF platelets synthesized in 100 wt% KCl,
90 wt% KCl, 44 wt% NaCl, 90 wt% NaCl and 100 wt% NaCl.

46
Table 4.1. Magnetic properties of BaHF powders and platelets synthesized by
mixed oxide method and by molten salt synthesis method in five different molten
flux compositions.
Although magnetic saturation values change around 55 emu/g for all flux
compositions, the highest saturation value of 56.5 emu/g was obtained in the case of
44 wt% NaCl composition. On the other hand, the highest coercivity of 1600 Oe
was obtained for 90 wt% NaCl and 100 wt% NaCl compositions. It is clear that an
increase in the NaCl content in the flux improves the BaHF conversion which in
turn results in higher coercivity and remanant magnetization. High coercivity and
remanant magnetization indicate the augmentation in the hard magnetic behavior of
the synthesized ceramics.
Flux Composition
(wt%)
BaHF Amount
(wt%) Hc(Oe) Mr(emu/g) Ms(emu/g) Mr/ Ms
Mixed Oxide 100 2660 38.15 58.1 0.65
100 wt% KCl 95.3 753 21.9 55.0 0.40
90 wt% KCl-10 wt%
NaCl 95.8 838 25.0 54.3 0.45
44 wt% NaCl 96.8 1380 31.4 56.5 0.55
90 wt% NaCl 97.5 1600 32.0 55.2 0.58
100 wt% NaCl 97.8 1600 33.2 55.6 0.59
47
BaHF powders synthesized by mixed oxide method have higher saturation
magnetization than BaHF platelets synthesized by molten salt method. The reason
for this is that, in mixed oxide method, higher amount of BaHF is produced and so
all the magnetic dipoles in a solid piece are mutually aligned with the external field
causing an increase in the saturation magnetization. The other reason is that, BaHF
platelets have larger sizes than BaHF powders causing, multi-domain formation and
the easy movement of the domain walls, therefore decreasing the coercivities.
For the BaHF platelets, as the NaCl content in the flux increases, the platelet
average length increases, therefore the aspect ratio of the platelets increase and thus
the coercivity is increased.
4.4. Morphology of Graphite and Nickel Flakes
The size and morphology of the graphite flakes used in the electromagnetic wave
absorbing polymer matrix composites along with the synthesized BaHF powders
were investigated using field emission type SEM. No metallographic surface
preparation or coating was applied to observe the samples in the microscope. Low
accelerating voltage in the range of 5-10 kV was utilized for the examinations. In
the recorded images 10 flakes were chosen randomly and size measurements were
conducted on these flakes and the average of the 10 measurements were reported.
According to the measurements the graphite flakes have hexagonal morphologies
with average length of 20 µm and average thickness of 0.73 µm leading to an aspect
ratio of 27.4. The Ni flakes have irregular morphology with average length of 15
µm and average thickness of 0.57 µm resulting in an aspect ratio of 26.3.

48
Figure 4.13 SEM images of graphite flakes at two different magnifications (a) 1600x,
(b) 6000x.
Figure 4.14 SEM images of Ni flakes at 6000x magnification at two different
locations in the sample.
49
4.5. Microstructure of BaHF and Graphite or Ni Flake Containing Polymer
Matrix Composites
4.5.1 BaHF Powder-PS Composites
Figure 4.15 a, b, c show the optical microscope images of tape cast PS matrix
composites containing 10, 20 and 30 wt% BaHF powders. As the amount of BaHF
in the composite increases, the surface coverage of the particles in the tapes seems
to be increasing as expected. The least particle network formation and hence surface
coverage is observed in the composite tape containing 10 wt% BaHF, which is
evident from the bright, transparent regions in Figure 4.15 a. The highest amount of
surface coverage was obtained in the composite tape containing 30 wt% BaHF as
seen in Figure 4.15 c.

50
Figure 4.15 Optical microscope image of tape cast a) 10 wt% BaHF/PS
composite b) 20 wt% BaHF/PS composite c) 30 wt% BaHF/PS composite
(50x).

51
Figure 4.16 a, b and c show the optical microscope images of as-cast 10, 20 and 30
wt% BaHF powder containing PS matrix composites at higher magnification. Since
composites are as-cast there is no particle alignment expected resulting in
inhomogeneous particle distribution in the composite structures. It is observed that the
BaHF particles are oriented randomly with fairly uniform distribution. Besides the
morphology of the as-cast composites, as the content of BaHF in the composite
increases, the particle coverage in the structure seems to be increasing. Similar to the
case with the previously discussed tape-cast composites, the least particle network
formation and hence surface coverage is observed in the composite containing 10 wt%
BaHF, while the highest coverage is observed in 30 wt% BaHF containing composite.

52
Figure 4.16 Optical microscope image of as cast a) 10 wt% BaHF/PS
composite b) 20 wt% BaHF/PS composite c) 30 wt% BaHF/PS composite
(100x).

53
4.5.2 BaHF- Graphite Flake / PC Composites
The surfaces of the BaHF powder and graphite flake containing PC matrix
composites were investigated using an inverted type metallurgical microscope at
500x magnification (See Figure 4.17). Regions designated by “A” in Figure 4.17 b)
and d) are the graphite flakes distributed in the PC matrix, while the regions
designated with “B” show the PC matrix containing BaHF powders.
Figure 4.17 show different locations on the surface of the same composite again at
500x magnification. The average size of graphite flakes measured as 20 µm is
matching with the sizes of the regions shown as “A”. The graphite flakes seems to
be in contact with each other pointing out to the achievement of percolation in tape-
cast polymer matrix composites containing graphite flakes.
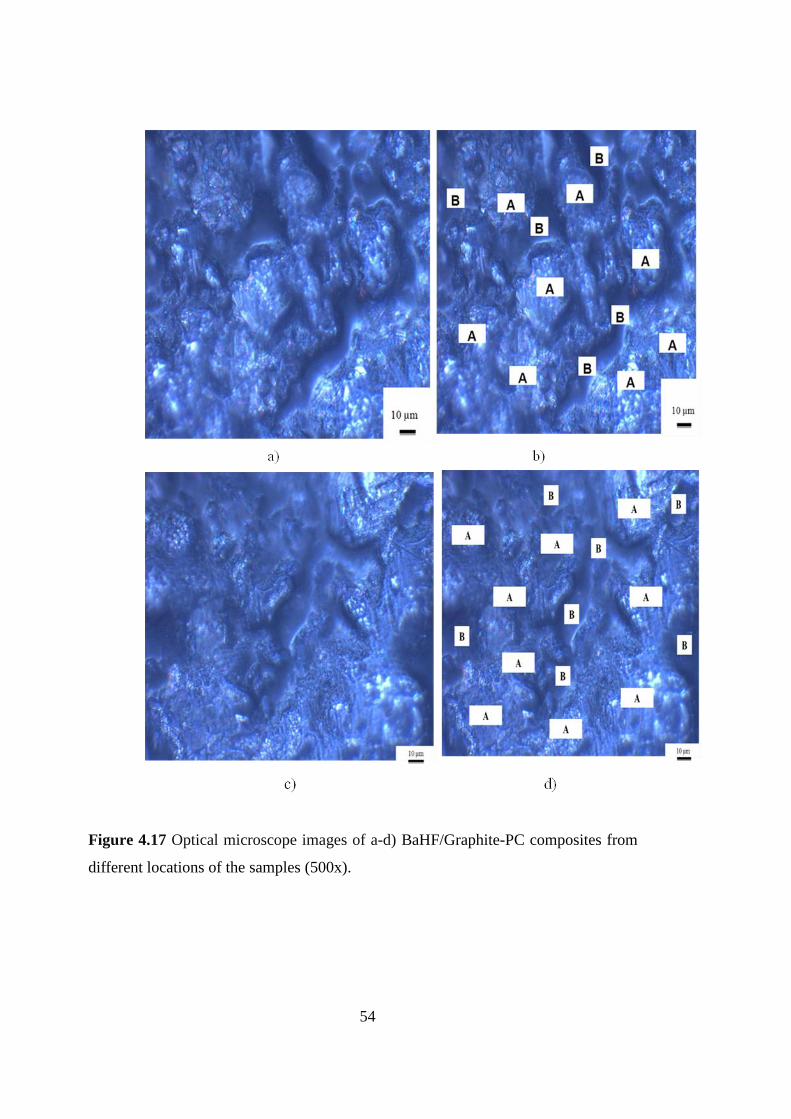
54
Figure 4.17 Optical microscope images of a-d) BaHF/Graphite-PC composites from
different locations of the samples (500x).
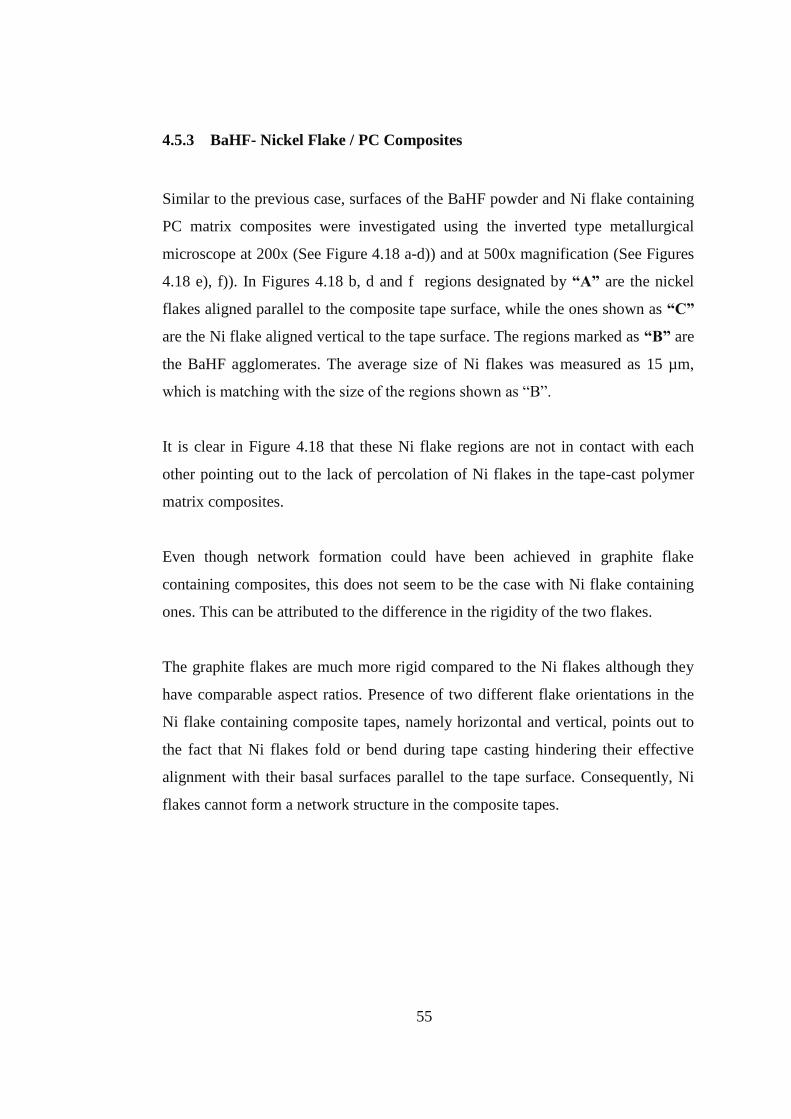
55
4.5.3 BaHF- Nickel Flake / PC Composites
Similar to the previous case, surfaces of the BaHF powder and Ni flake containing
PC matrix composites were investigated using the inverted type metallurgical
microscope at 200x (See Figure 4.18 a-d)) and at 500x magnification (See Figures
4.18 e), f)). In Figures 4.18 b, d and f regions designated by “A” are the nickel
flakes aligned parallel to the composite tape surface, while the ones shown as “C”
are the Ni flake aligned vertical to the tape surface. The regions marked as “B” are
the BaHF agglomerates. The average size of Ni flakes was measured as 15 µm,
which is matching with the size of the regions shown as “B”.
It is clear in Figure 4.18 that these Ni flake regions are not in contact with each
other pointing out to the lack of percolation of Ni flakes in the tape-cast polymer
matrix composites.
Even though network formation could have been achieved in graphite flake
containing composites, this does not seem to be the case with Ni flake containing
ones. This can be attributed to the difference in the rigidity of the two flakes.
The graphite flakes are much more rigid compared to the Ni flakes although they
have comparable aspect ratios. Presence of two different flake orientations in the
Ni flake containing composite tapes, namely horizontal and vertical, points out to
the fact that Ni flakes fold or bend during tape casting hindering their effective
alignment with their basal surfaces parallel to the tape surface. Consequently, Ni
flakes cannot form a network structure in the composite tapes.
56
Figure 4.18 Optical microscope images of a-d) BaHF/Ni-PC Composite (200x),
e), f) BaHF/Ni -PC Composite (500x).

57
4.5.4 Macroscopic Images of BaHF-Polymer matrix composites
Figure 4.19 Macroscopic images of a) tape cast 10 wt% BaHF/PS composite
b) tape cast 20 wt% BaHF/PS composite, c) tape cast 30 wt% BaHF/PS composite.
Figure 4.19 shows the macroscopic images of tape cast 10, 20 and 30 wt%
BaHF/PS composites. As the BaHF content in the tape increases, the surface of the
tape becomes denser.
a b c
)
)

58
Figure 4.20 Macroscopic images of a) tape cast BaHF/Ni-PC composite b) tape cast
BaHF/graphite-PC composite.
Figure 4.20 shows the macroscopic images of tape cast BaHF/Ni-PC composite and
tape cast BaHF/graphite-PC composites.
4.6. Electrical Properties of Graphite or Ni Flake Containing Tape-Cast
Composites
The sheet resistance (Rs) of graphite or Ni flake containing composites was
measured by four point probe measurement method. Sheet resistance of the
BaHF/graphite flake composite was determined to be 13.5 kΩ /sq. However, in the
case of Ni flake containing composites electrical conduction could not be measured
within the sensitivity of the above-mentioned four-point probe measurement setup.
a b

59
Although Ni has a higher bulk electrical conductivity than graphite (conductivity of
bulk nickel is 14.3 x 10⁶
S/m [75], conductivity of bulk graphite is 2 to 3 x 10⁵ S/m
when electrical field is perpendicular to basal plane, 3.3 x 10² S/m when electrical
field is parallel to basal plane [76]), electrical conduction in the Ni flake containing
composites could not be achieved.
This can be attributed to the lack of network formation and hence percolation of Ni
flakes as demonstrated in Figure 4.18.
As mentioned earlier, Ni flakes were not aligned well during tape casting due to
lack of their rigidity hindering percolation in the composite tape structure. Because
of this reason a measurable electrical conductivity was not detected by the used four
point probe measurement setup in the Ni flake containing polymer matrix
composites. On the contrary to this, as shown in Figure 4.17 graphite flakes can be
aligned well by tape casting in the composite structure due to their superior rigidity.
Consequently, graphite flakes with their basal surfaces aligned parallel to the
surface of the composite tape come into contact with each other forming a network
and providing the measured electrical conduction.
60
4.7. Electromagnetic Properties of BaHF Based Polymer Matrix Composites
4.7.1 BaHF Powder/PS Composites
In order to investigate the effect of BaHF amount on the EM wave reflection and
transmission characteristics of BaHF/PS composites within 18-40 GHz frequency
range, reflection and transmission loss of 10 wt%, 20 wt% and 30 wt% BaHF powder
containing composites are presented in Figure 4.21. It is clear that as BaHF content in
the PS matrix increases, reflection loss of the composite increases, which is evident
from the increasing dB values pointing out to stronger reflection from the composite
surface. This is something expected, since the EM waves incident to the composite
surface encounter to more inorganic particles with increasing BaHF content leading to
higher reflection.
Even though particle content dependence of the transmission loss of the composites is
not that pronounced, still a slight decrease in transmission loss evident from the
decreasing dB values pointing out to weaker transmission through the composite with
increasing inorganic content can be observed. This is similarly expected, as more
frequent interaction of EM waves with the increasing amount of particles hinders the
passage of the EM waves through the material.
Electromagnetic wave absorption values of the composites calculated from the
measured reflection and transmission losses based on the principle of conservation
energy sample is given in Figure 4.22. It is clear from this figure that increasing BaHF
particle content results in stronger EM wave absorption. This points out to the
increasing lossy character of the composite with increasing BaHF content mainly
based on the magnetic loss provided by the ferrimagnetic nature of the synthesized
BaHF powders. EM wave absorption of the composite containing 30 wt% BaHF
powder changes between 5 and 35 % being highest among the other two composites.

61
Figure 4.21 EM wave reflection and transmission losses of 10, 20, 30 wt% BaHF
powder containing PS matrix tape-cast composites.
Figure 4.22 EM wave absorption of 10, 20, 30 wt% BaHF powder containing PS
matrix tape-cast composites.
EM wave interaction characteristics of as-cast BaHF powder /PS composites were also
investigated in order to determine the effect of processing method on their EM wave
reflection, transmission and hence absorption properties.
18 20 22 24 26 28 30 32 34 36 38 40-35
-30
-25
-20
-15
-10
-5
0
Tra
nsm
issio
n L
oss (
dB
)
Frequency (GHz)
Tape cast- 10 wt% BaHF
Tape cast- 20 wt% BaHF
Tape cast- 30 wt% BaHF18 20 22 24 26 28 30 32 34 36 38 40
-35
-30
-25
-20
-15
-10
-5
0
Re
fle
ctio
n L
oss (
dB
)
Frequency (GHz)
Tape Cast- 10 wt% BaHF
Tape Cast- 20 wt% BaHF
Tape Cast- 30 wt% BaHF
18 20 22 24 26 28 30 32 34 36 38 40
0
10
20
30
40
50
60
70
80
90
100
Ab
so
rptio
n P
erc
en
tag
e (
%)
Frequency (GHz)
Tape Cast- 10 wt% BaHF
Tape Cast- 20 wt% BaHF
Tape Cast- 30 wt% BaHF
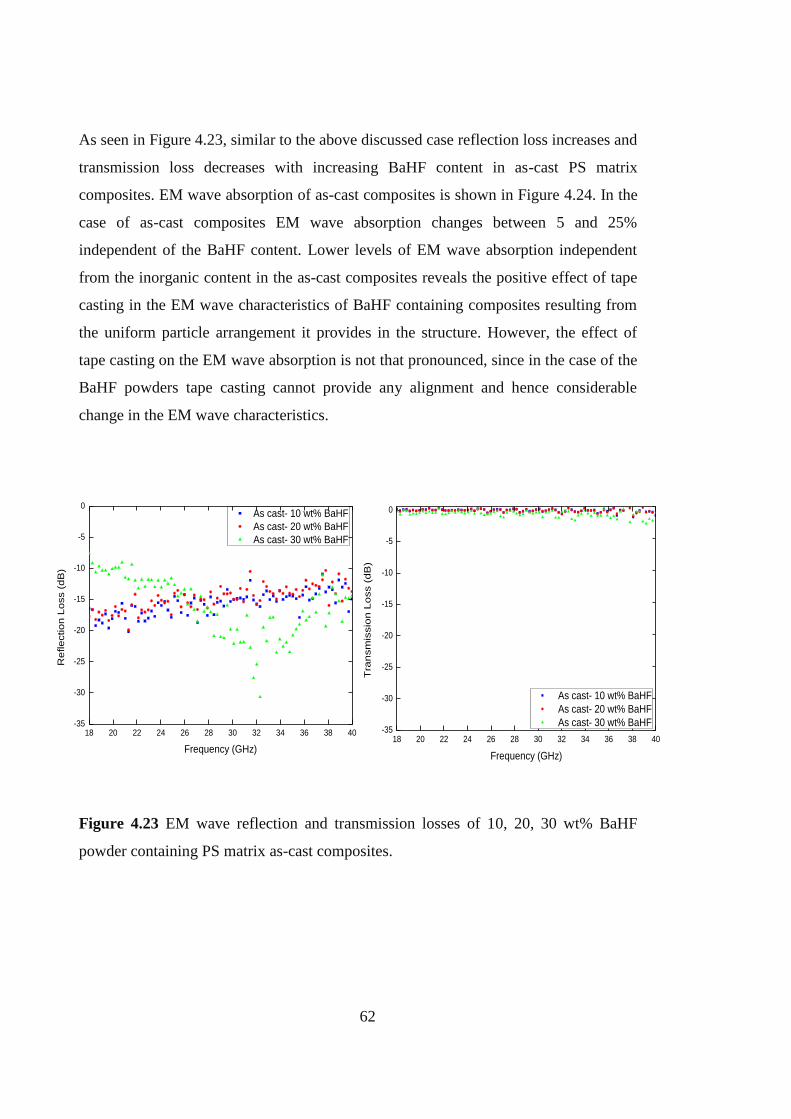
62
As seen in Figure 4.23, similar to the above discussed case reflection loss increases and
transmission loss decreases with increasing BaHF content in as-cast PS matrix
composites. EM wave absorption of as-cast composites is shown in Figure 4.24. In the
case of as-cast composites EM wave absorption changes between 5 and 25%
independent of the BaHF content. Lower levels of EM wave absorption independent
from the inorganic content in the as-cast composites reveals the positive effect of tape
casting in the EM wave characteristics of BaHF containing composites resulting from
the uniform particle arrangement it provides in the structure. However, the effect of
tape casting on the EM wave absorption is not that pronounced, since in the case of the
BaHF powders tape casting cannot provide any alignment and hence considerable
change in the EM wave characteristics.
Figure 4.23 EM wave reflection and transmission losses of 10, 20, 30 wt% BaHF
powder containing PS matrix as-cast composites.
18 20 22 24 26 28 30 32 34 36 38 40-35
-30
-25
-20
-15
-10
-5
0
Tra
nsm
issio
n L
oss (
dB
)
Frequency (GHz)
As cast- 10 wt% BaHF
As cast- 20 wt% BaHF
As cast- 30 wt% BaHF18 20 22 24 26 28 30 32 34 36 38 40
-35
-30
-25
-20
-15
-10
-5
0
Re
fle
ctio
n L
oss (
dB
)
Frequency (GHz)
As cast- 10 wt% BaHF
As cast- 20 wt% BaHF
As cast- 30 wt% BaHF

63
Figure 4.24 EM wave absorption of 10, 20, 30 wt% BaHF powder containing PS
matrix as-cast composites.
4.7.2 BaHF Platelet/PS Composites
The effect of NaCl-KCl flux composition on the EM wave interaction
characteristics has been examined. 5 different flux compositions were taken into
consideration, namely 100 wt% KCl, 90 wt% KCl- 10 wt% NaCl, 56 wt% KCl-44
wt% NaCl, 90 wt% NaCl-10 wt% KCl and 100 wt% NaCl. BaHF platelets prepared
by molten salt synthesis in varying flux compositions were mixed with the PS
matrix, and composites were obtained by tape casting. In the composites containing
BaHF powders synthesized by mixed oxide method, the highest EM wave
absorption was achieved by the addition of 30 wt% BaHF. Because of this reason,
30 wt% BaHF was chosen as the BaHF platelet content to be added in the PS
matrix. Reflection and transmission loss of the composites containing BaHF
platelets synthesized in 5 different flux compositions are given in Figure 4.25.
Reflection loss of the composites changes between -20 and -10 dB for all flux
compositions.
18 20 22 24 26 28 30 32 34 36 38 40
0
10
20
30
40
50
60
70
80
90
100
Ab
so
rptio
n P
erc
en
tag
e (
%)
Frequency (GHz)
As cast- 10 wt% BaHF
As cast- 20 wt% BaHF
As cast- 30 wt% BaHF

64
Specifically, composite containing platelets synthesized in 100 wt% NaCl reveals a
reflection loss around -15 dB throughout the whole frequency range. Transmission
loss of all composites changes between about -3 and -1 dB independent of the flux
composition.
EM wave absorption of the composites containing BaHF platelets synthesized in 5
different flux compositions is given in Figure 4.26. As discussed in the earlier
sections, BaHF platelets synthesized in varying fluxes reveal different
morphologies, phase contents and hence magnetic properties. The effect of these
differences reveals itself in the EM wave absorption properties of the composites.
BaHF platelets synthesized in 100 wt% NaCl flux has the highest magnetic
coercivity and magnetic remanence, which results in the highest EM wave
absorption reaching to about 25% based on the highest magnetic loss achieved in
the BaHF platelets synthesized in 100 wt% NaCl composition.
Figure 4.25 EM wave reflection and transmission losses of composites containing
BaHF platelets synthesized in 5 different flux compositions.
18 20 22 24 26 28 30 32 34 36 38 40-35
-30
-25
-20
-15
-10
-5
0
Tra
nsm
issio
n L
oss (
dB
)
Frequency ( GHz)
100 wt % KCl
90 wt % KCl
56 wt % KCl
10 wt % KCl
100 wt % NaCl
18 20 22 24 26 28 30 32 34 36 38 40-35
-30
-25
-20
-15
-10
-5
0
Re
fle
ctio
n L
oss (
dB
)
Frequency ( GHz)
100 wt % KCl
90 wt % KCl
56 wt % KCl
10 wt % KCl
100 wt % NaCl
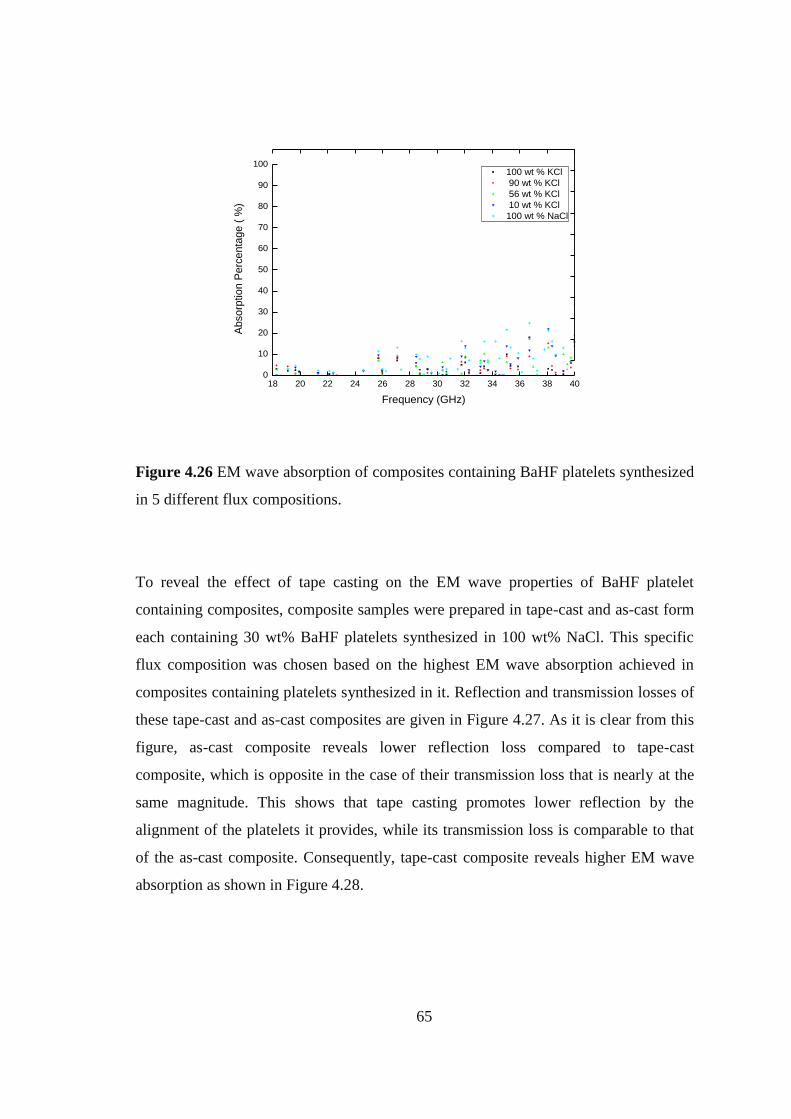
65
18 20 22 24 26 28 30 32 34 36 38 400
10
20
30
40
50
60
70
80
90
100
Ab
so
rptio
n P
erc
en
tag
e (
%)
Frequency (GHz)
100 wt % KCl
90 wt % KCl
56 wt % KCl
10 wt % KCl
100 wt % NaCl
Figure 4.26 EM wave absorption of composites containing BaHF platelets synthesized
in 5 different flux compositions.
To reveal the effect of tape casting on the EM wave properties of BaHF platelet
containing composites, composite samples were prepared in tape-cast and as-cast form
each containing 30 wt% BaHF platelets synthesized in 100 wt% NaCl. This specific
flux composition was chosen based on the highest EM wave absorption achieved in
composites containing platelets synthesized in it. Reflection and transmission losses of
these tape-cast and as-cast composites are given in Figure 4.27. As it is clear from this
figure, as-cast composite reveals lower reflection loss compared to tape-cast
composite, which is opposite in the case of their transmission loss that is nearly at the
same magnitude. This shows that tape casting promotes lower reflection by the
alignment of the platelets it provides, while its transmission loss is comparable to that
of the as-cast composite. Consequently, tape-cast composite reveals higher EM wave
absorption as shown in Figure 4.28.

66
Figure 4.27 EM wave reflection and transmission losses of tape-cast and as-cast
composites containing BaHF platelets.
Figure 4.28 EM wave absorption of tape-cast and as-cast composites containing
BaHF platelets.
18 20 22 24 26 28 30 32 34 36 38 40-35
-30
-25
-20
-15
-10
-5
0
Tra
nsm
issio
n L
oss (
dB
)
Frequency ( GHz)
Tape cast- 100 wt % NaCl
As cast- 100 wt % NaCl
18 20 22 24 26 28 30 32 34 36 38 40-35
-30
-25
-20
-15
-10
-5
0
Re
fle
ctio
n L
oss (
dB
)
Frequency ( GHz)
Tape cast- 100 wt % NaCl
As cast- 100 wt % NaCl
18 20 22 24 26 28 30 32 34 36 38 400
10
20
30
40
50
60
70
80
90
100
Ab
so
rptio
n P
erc
en
tag
e (
%)
Frequency ( GHz)
Tape cast- 100 wt % NaCl
As cast- 100 wt % NaCl
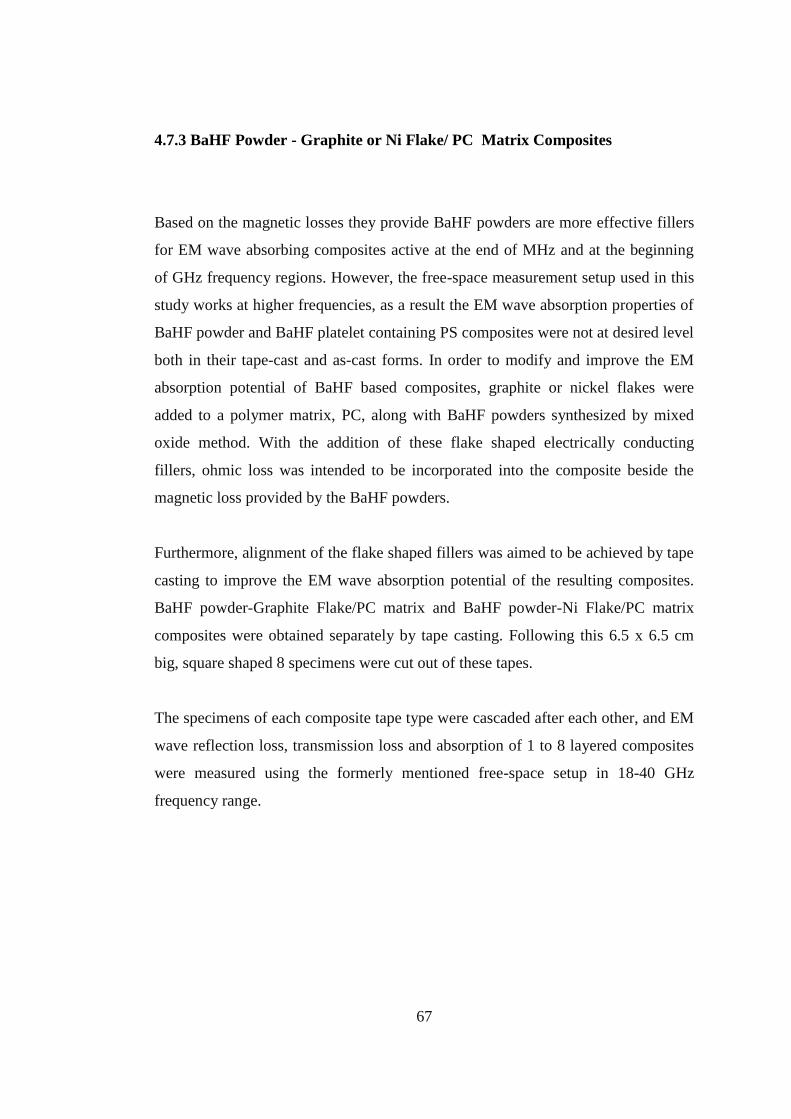
67
4.7.3 BaHF Powder - Graphite or Ni Flake/ PC Matrix Composites
Based on the magnetic losses they provide BaHF powders are more effective fillers
for EM wave absorbing composites active at the end of MHz and at the beginning
of GHz frequency regions. However, the free-space measurement setup used in this
study works at higher frequencies, as a result the EM wave absorption properties of
BaHF powder and BaHF platelet containing PS composites were not at desired level
both in their tape-cast and as-cast forms. In order to modify and improve the EM
absorption potential of BaHF based composites, graphite or nickel flakes were
added to a polymer matrix, PC, along with BaHF powders synthesized by mixed
oxide method. With the addition of these flake shaped electrically conducting
fillers, ohmic loss was intended to be incorporated into the composite beside the
magnetic loss provided by the BaHF powders.
Furthermore, alignment of the flake shaped fillers was aimed to be achieved by tape
casting to improve the EM wave absorption potential of the resulting composites.
BaHF powder-Graphite Flake/PC matrix and BaHF powder-Ni Flake/PC matrix
composites were obtained separately by tape casting. Following this 6.5 x 6.5 cm
big, square shaped 8 specimens were cut out of these tapes.
The specimens of each composite tape type were cascaded after each other, and EM
wave reflection loss, transmission loss and absorption of 1 to 8 layered composites
were measured using the formerly mentioned free-space setup in 18-40 GHz
frequency range.

68
4.7.3.1 BaHF Powder – Graphite Flake/PC Composites
Reflection and transmission loss of the BaHF powder and graphite flake containing
PC matrix composites are given in Figure 4.29 for 1 up to 8 layer tapes cascaded
after each other. As it is clear from this figure, transmission loss decreases with
increasing number of tapes pointing out to the lower amount of transmission
through the multilayered composite material. This is expected, since with the
increasing number of tapes the medium is getting richer in terms of the lossy filler
content suppressing the transmission of the EM waves.
However, unexpectedly this is just the opposite in the case of the reflection loss.
Reflection loss of the composite decreases with the increasing number of tapes in
the multilayered structure. This unexpected tendency appears even though the
conducting filler content in the composite medium increases with increasing
number of layers. The decrease in the reflection despite the increase in the
conducting filler content in the medium can be attributed to the multiple scattering
of the EM waves within the multilayered composite structure formed by individual
tapes.
The reflection loss of 8 layered composite changes between about -25 and -17 dB in
the frequency range under interest, where its transmission loss changes between -3
and -5 dB in the same frequency range.
As the main target is to minimize both EM wave reflection and transmission
simultaneously in order to achieve maximum EM wave absorption, the 8 layered
composite seems to have an optimum combination in terms of this target.
Consequently, as it is seen in Figure 4.30, the 8 layered composite reveals the
maximum EM wave absorption changing between 30-70% in the frequency range
under interest..
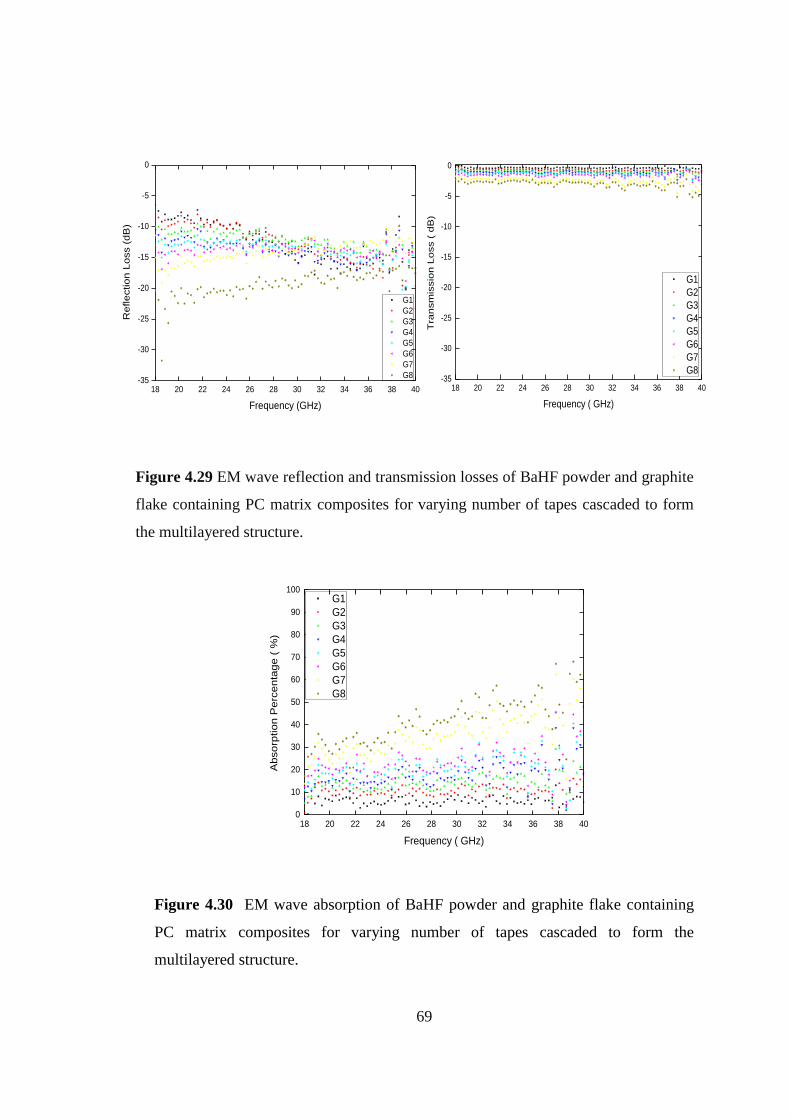
69
Figure 4.29 EM wave reflection and transmission losses of BaHF powder and graphite
flake containing PC matrix composites for varying number of tapes cascaded to form
the multilayered structure.
Figure 4.30 EM wave absorption of BaHF powder and graphite flake containing
PC matrix composites for varying number of tapes cascaded to form the
multilayered structure.
18 20 22 24 26 28 30 32 34 36 38 40-35
-30
-25
-20
-15
-10
-5
0
Re
fle
ctio
n L
oss (
dB
)
Frequency (GHz)
G1
G2
G3
G4
G5
G6
G7
G8
18 20 22 24 26 28 30 32 34 36 38 40-35
-30
-25
-20
-15
-10
-5
0
Tra
nsm
issio
n L
oss (
dB
)
Frequency ( GHz)
G1
G2
G3
G4
G5
G6
G7
G8
18 20 22 24 26 28 30 32 34 36 38 400
10
20
30
40
50
60
70
80
90
100
Ab
so
rptio
n P
erc
en
tag
e (
%)
Frequency ( GHz)
G1
G2
G3
G4
G5
G6
G7
G8

70
4.7.3.2. BaHF Powder - Ni Flake/PC Composites
Reflection and transmission loss of the BaHF powder and Ni flake containing PC
matrix composites are given in Figure 4.31 for 1 up to 8 layer tapes cascaded after
each other. Unlike the case with the graphite flake containing composites (Figure
4.29), reflection loss of Ni flake containing composites increases with increasing
number of tapes cascaded in multilayer form. This is somehow expected as the
amount of the conducting filler increases the composite medium becomes more
reflective against the EM waves.
Here it should be noted that as demonstrated earlier unlike the graphite flake
containing ones Ni flake containing tapes do not reveal a measurable conductivity.
This seems to be contradicting with the increasing reflection loss with increasing
number of Ni flake containing tapes. Absence of electrical conduction in Ni flake
containing tapes points out to the lack of network formation and hence percolation
of Ni flakes.
However, despite their lack of electrical conductivity increasing reflection loss of Ni
flake containing tapes with their increasing number shows that rather than a
conducting network, presence of locally conducting domains in the tape structure
can also provide lossy character. Ferromagnetic nature of the Ni has to be also
considered at this point which might be contributing this lossy character. The reason
behind this unexpected relation and occurrence can be explained within the scope of
a further study involving the modeling of the EM wave interaction characteristics
and electrical properties of such discontinuous media.
Transmission loss of Ni flake containing composites decreases with increasing
number tapes in the cascaded structure. This tendency is in good correlation with
the increasing reflection loss, since the reflective media are normally expected to be
less transmitting against the EM waves. Consequently, both the reflection and
transmission loss of the 8 layered cascaded structure changes between -5 and -10 dB
for the frequency range investigated.
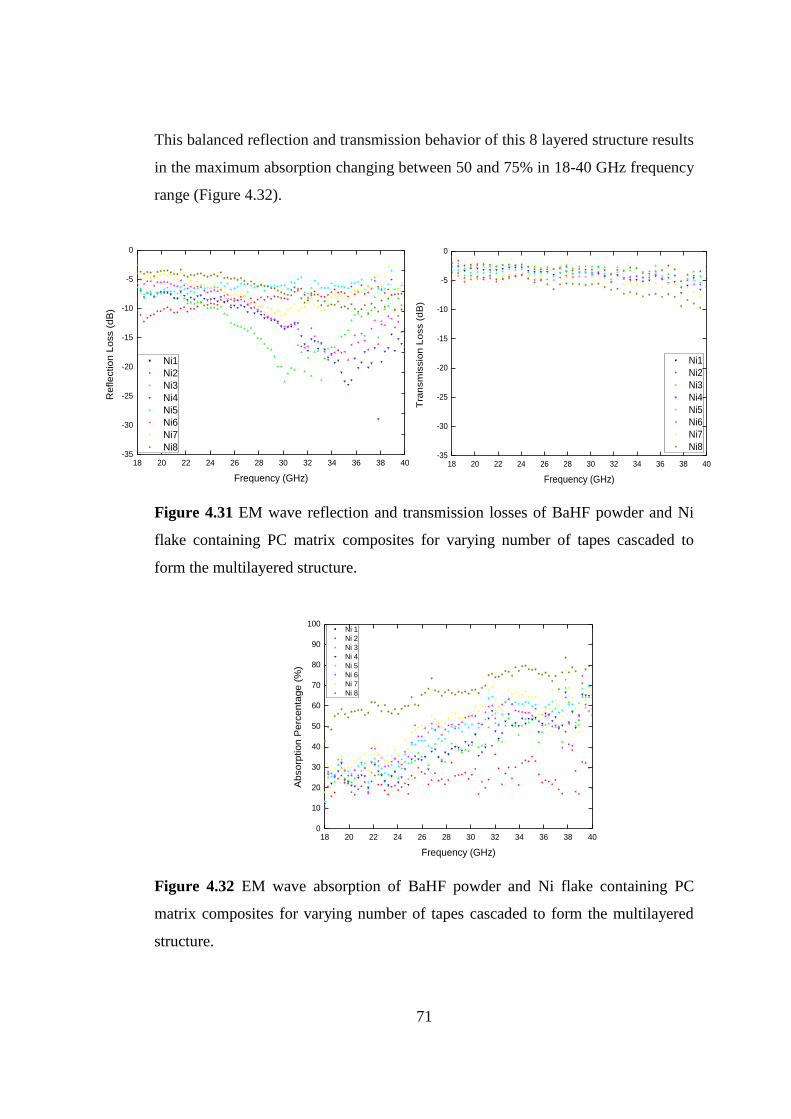
71
This balanced reflection and transmission behavior of this 8 layered structure results
in the maximum absorption changing between 50 and 75% in 18-40 GHz frequency
range (Figure 4.32).
Figure 4.31 EM wave reflection and transmission losses of BaHF powder and Ni
flake containing PC matrix composites for varying number of tapes cascaded to
form the multilayered structure.
Figure 4.32 EM wave absorption of BaHF powder and Ni flake containing PC
matrix composites for varying number of tapes cascaded to form the multilayered
structure.
18 20 22 24 26 28 30 32 34 36 38 40-35
-30
-25
-20
-15
-10
-5
0
Tra
nsm
issio
n L
oss (
dB
)
Frequency (GHz)
Ni1
Ni2
Ni3
Ni4
Ni5
Ni6
Ni7
Ni8
18 20 22 24 26 28 30 32 34 36 38 40-35
-30
-25
-20
-15
-10
-5
0
Re
fle
ctio
n L
oss (
dB
)
Frequency (GHz)
Ni1
Ni2
Ni3
Ni4
Ni5
Ni6
Ni7
Ni8
18 20 22 24 26 28 30 32 34 36 38 400
10
20
30
40
50
60
70
80
90
100
Ab
so
rptio
n P
erc
en
tag
e (
%)
Frequency (GHz)
Ni 1
Ni 2
Ni 3
Ni 4
Ni 5
Ni 6
Ni 7
Ni 8

72

73
CHAPTER 5
5. CONCLUSIONS
In BaHF-based electromagnetic (EM) wave absorbing polymer matrix composites,
BaHF powders and platelets were used. Mixed oxide method was applied to
synthesize nano meter size BaHF powders, while micron size BaHF platelets were
prepared by molten-salt synthesis method in various weight proportions of NaCl–
KCl salt mixtures.
X-Ray diffraction analysis (XRD), scanning electron microscopy (SEM) and
vibrating sample magnetometer (VSM) were used to identify the characteristics of
the synthesized BaHF platelets. The effect of molten salt composition on the
amount of BaHF phase formation, as well as, on the morphology and magnetic
properties of the final products were discussed according to the results obtained
from the characterization tools.
BaHF-based polymer matrix composites were prepared by tape casting method, and
their EM wave absorption potentials were investigated within 18-40 GHz frequency
range by free-space measurement method. In order to enhance the EM wave
absorption potential of BaHF-based polymer matrix composites, graphite or Ni
flakes were incorporated in the composites together with BaHF powders.
Composites were fabricated by tape casting and cascading the obtained tapes after
each other forming a multilayered composite structure. EM wave absorbing
multilayered composites were characterized in terms of their EM wave reflection
and transmission losses along with their EM wave absorption.
74
Following points demonstrate the major conclusions drawn at the end of this study:
In molten salt synthesis method, BaHF platelet size in NaCl flux was larger
than that in KCl for all the calcination temperatures and durations applied.
This demonstrates the lower apparent activation energy for platelet growth
in NaCl rich fluxes.
Compared to other temperatures, platelets synthesized in 90 wt% NaCl
containing flux had the largest platelet size of 2 m at 900 °C for 2 h
calcination duration.
For the morphology of the BaHF platelets, in the case of the synthesis at
900 °C in NaCl flux, corners of the platelets became rounded. This is
speculated to be caused by the selective desorption from the corners of the
platelets as a result of chemical potential change around the sharp corners of
the platelets in the molten NaCl flux. In the case of platelet synthesis in KCl
flux, either no desorption occurred or desorption occurred homogenously on
all the surfaces and corners of the platelets so that platelet shape with sharp
corners was preserved.
Quantitative XRD results showed that NaCl plays a prominent role on the
formation of BaHF phase. As the content of NaCl in the flux increases,
BaHF formation is enhanced. The highest conversion which is 97.8% is
obtained in the case of synthesis in 100 wt% NaCl flux.
Flux composition has clear impact on the magnetic properties of BaHF
platelets mainly based on the efficiency of transformation. Increasing NaCl
content in the flux improves the coercivity and remnant magnetization of
BaHF along with the area under the hysteresis curve leading to a more
pronounced hard magnetic behavior in the synthesized ceramics.

75
In the case of the BaHF-based polymer matrix composites, as the content of
BaHF in the structure increases, the electromagnetic absorption properties
are enhanced. The highest EM wave absorption reaching to 25% was
obtained in 30 wt% BaHF containing composites.
EM wave absorption of tape-cast composites are slightly higher than that of
the as-cast ones caused by the texture or inorganic phase alignment formed
during tape casting.
Composites containing BaHF platelets synthesized in 100 wt% NaCl flux
revealed the highest EM wave absorption values resulted from the magnetic
loss provided by this platelets due to the highest magnetic coercivity and
magnetic remanance they reach.
In order to modify and improve the EM wave absorption properties of
BaHF-based polymer matrix composites, graphite or Ni flakes were added to
the composite together with the BaHF powders.
Multilayered composites were prepared by cascading the composite tapes
containing these inorganic mixtures, as a result enhanced EM wave
absorption was obtained by the multiple interaction of EM waves reflected
from and transmitted through successive layers.
Because of the synergistic effect of the magnetic and ohmic loss provided by
the nickel, BaHF-Ni flake composites revealed a balanced reflection and
transmission behavior resulting in the maximum EM wave absorption
achieved between 50 and 75% in 18-40 GHz frequency range.

76

77
REFERENCES
[1] Chin W. S and Lee D. G., “Development of the Composite RAS (radar
absorbing structure) for the X-band frequency range,” Compos. Struct. , vol. 77, pp.
457-465, (2007).
[2] Pinho M.S., Gregori M. L., Nunes R. C. R., and Soares B. G., “Performance of
radar absorbing materials by waveguide measurements for X-and Ku- band
frequencies.”, Eur. Polym. J., vol. 38, pp. 2321-2327, (2002).
[3] Huang C. Y., Mo W. W., and Roan M. L., “Studies on the influence of double-
layer electroless metal deposition on the electromagnetic interference shielding
effectiveness of carbon fiber/ABS composites.” Surf. Coat. technol., vol. 184, pp.
163-169, (2004).
[4] Shui X.P. and Chung D. D.L., “ Submicron diameter nickel filaments and their
polymer-matrix composites,” J. Mater. Sci., vol. 35, pp. 1773-1785, (2000).
[5] Tzeng S. S. and Chang F. Y, “ EMI shielding effectiveness of metal-coated
carbon fiber-reinforced ABS composites.”, Mater. Sci. Eng., A, vol. 302. pp. 258-
267, (2001).
[6] Wu. J. and Chung D.D. L., “Increasing the electromagnetic interference
shielding effectiveness of carbon fiber polymer-matrix composite by using activated
carbon fibers.” Carbon, vol. 40. pp. 445-447, (2002).
[7] Zhano N., Zou T., Shi C. Li J. and Guo W., “Microwave absorbing properties of
activated carbon-fiber felt screens (vertical-arranged carbon fibers/epoxy resin
composites.” Mater. sc. Eng., B, vol. 127, pp. 207-211, (2006).
[8] Park K. Y., Lee S. E., Kim C. G., and Han J. H., “Fabrication of electromagnetic
characteristics of electromagnetic wave absorbing sandwich structures,” Comp. Sci.
Technol., vol. 66. pp. 576-584, (2006).

78
[9] Oh J. H., Oh K. S., Kim C. G., and Hong C. S., “Design of radar absorbing
structures using glass/epoxy composite containing carbon black in X-band
frequency ranges.” Composites Part B, vol. 35. pp. 49-56, (2004).
[10] Y. Liu, M.G.B. Drew, J. Wang, M. Zhang “Preparation, characterization and
magnetic properties of the doped barium hexaferrites
BaFe12−2xCox/2Znx/2SnxO19, x=0.0−2.0”, Journal of Magnetism and Magnetic
Materials, pp. 814–818, 322 (7) (2010).
[11] M.C. Dimri, S.C. Kashyap, D.C. Dube, “ Electrical and magnetic properties of
barium hexaferrite nanoparticles prepared by citrate precursor method”, Ceramics
International, 30 (7) pp. 1623–1626, (2004).
[12] W. Roos, “ Formation of chemically coprecipitated barium ferrite”, Journal of
the American Ceramic Society, 63 (11–12) pp. 601–603, (1980).
[13] D. Barb, L. Diamandescu, A. Rusi, D. TA˘rA˘bA˘sanu-MihA˘ilA˘, M.
Morariu, V. Teodorescu, “ Preparation of barium hexaferrite by a hydrothermal
method: structure and magnetic properties”, Journal of Materials Science, 21 (4) pp.
1118–1122, (1986).
[14] S. Singhal, T. Namgyal, J. Singh, K. Chandra, S. Bansal, “ A comparative
study on the magnetic properties of MFe12O19 and MAlFe11O19 (M=Sr, Ba and Pb)
hexaferrites with different morphologies”, Ceramics International, 37 (6) pp. 1833–
1837, (2011).
[15] E.K. Akdogan, R.E. Brennan, M. Allahverdi, A. Safari, “ Effects of molten salt
synthesis (MSS) parameters on the morphology of Sr3Ti2O7 and SrTiO3 seed
crystals”, Journal of Electroceramics, 16 (2) pp. 159–165, (2006).
[16] R.H. Arendt, J.H. Rosolowski, J.W. Szymaszek, “Lead zirconate titanate
ceramics from molten salt solvent synthesized powders”, Materials Research
Bulletin, 14 (5) pp. 703–709, (1979).
[17] J.P. Wang, Y. Liu, M. Hu, M.L. Zhang, “ Effects of different molten-salt on the
synthesis of hexagonal barium ferrite”, Chinese Journal of Aeronautics, 19 pp.
S206–S209, (2006).

79
[18] S. Dursun, R. Topkaya, N. Akdoan, S. Alkoy, “ Comparison of the structural
and magnetic properties of submicron barium hexaferrite powders prepared by
molten salt and solid state calcination routes”, Ceramics International, 38 (5) pp.
3801–3806, (2012).
[19] Neelkanta P.S., “Handbook of Electromagnetic Materials: Monolithic and
Composite Versions and Their Applications”, CRC-Press, (1995). Pp:491, Chapter
22.
[20] Retrieved on 1 st of January, 2014 from,
http://www.emiguru.com/blogpix/shieldpix_150x150_p1.jpg
[21] Knott E.F., Shaeffer J. F and Tuley M. T., “Radar Cross Section”, Aztech
House Inc., 2 nd Edition (1993). Pp:9,10
[22] Chin W. S. and Lee D. G., Composite Structures, Article in Press (2005).
[23] Chin W. S and Lee D. G., “ Development of the Composite RAS (radar
absorbing structure) for the X-band frequency range,” Compos. Struct. , vol. 77, pp.
457-465, (2007).
[24] Seo I. S., Chin W. S. and Lee D. G., Composite Structures 665, 33-542 (2004).
[25] Wang C. M. B. and Li Q., Materials and Design, 19 113-120 (1998).
[26] Ghasemi A., Hossienpour A., Morisako A., Saatchi A. and Salehi M., Journal
of Magnetism and Magnetic Materials, Article in Press (2005).
[27] Wang C., Li L., Zhou J., Qi X., Yue Z. and Wang X., Journal of Magnetism
and Magnetic Materials, pp. 100-106 (2002).
[28] Rezende M. C., Martin I. M., Milacci M. A. S., and Nohara E.L., “ Radar
cross section measurements (8-12 GHz) of flat plates painted with microwave
absorbing materials,” IEEE, vol. 1, pp. 263-267, (2001).

80
[29] Amin M. B. and James J. R., The radio and Electronic Engineer, Part 1 pp.
209-218, (1981).
[30] Weir W. B. ,” Automatic measurement of complex dielectric constant and
permeability at microwave frequencies,” IEEE, pp. 33-36, (1974).
[31] Biscaro R. S., Nohara E. L., Peixoto G. G., Faez R., and Rezende M. C., “
Performance evaluation of conducting polymer paints as radar absorbing materials,”
IEEE, pp. 355-358, (2003).
[32] Pinho M.S., Gregori M. L., Nunes R. C. R., and Soares B. G., “ Performance of
radar absorbing materials by waveguide measurements for X-and Ku- band
frequencies.”, Eur. Polym. J., vol. 38, pp. 2321-2327, (2002).
[33] Huang C. Y., Mo W. W., and Roan M. L., “Studies on the influence of double-
layer electroless metal deposition on the electromagnetic interference shielding
effectiveness of carbon fiber/ABS composites.” Surf. Coat. technol., vol. 184, pp.
163-169, (2004).
[34] Shui X.P. and Chung D. D.L., “ Submicron diameter nickel filaments and their
polymer-matrix composites,” J. Mater. Sci., vol. 35, pp. 1773-1785, (2000).
[35] Tzeng S. S. and Chang F. Y, “ EMI shielding effectiveness of metal-coated
carbon fiber-reinforced ABS composites.”, Mater. Sci. Eng., A, vol. 302. pp. 258-
267, (2001).
[36] Wu. J. and Chung D.D. L., “ Increasing the electromagnetic interference
shielding effectiveness of carbon fiber polymer-matrix composite by using activated
carbon fibers.” Carbon, vol. 40. pp. 445-447, (2002).
[37] Zhano N., Zou T., Shi C. Li J. and Guo W., “Microwave absorbing properties
of activated carbon-fiber felt screens (vertical-arranged carbon fibers/epoxy resin
composites.” Mater. sc. Eng., B, vol. 127, pp. 207-211, (2006).
[38] Park K. Y., Lee S. E., Kim C. G., and Han J. H., “Fabrication of
electromagnetic characteristics of electromagnetic wave absorbing sandwich
structures,” Compos. Sci. Technol. , vol. 66. pp. 576-584, (2006).

81
[39] Oh J. H., Oh K. S., Kim C. G., and Hong C. S., “ Design of radar absorbing
structures using glass/epoxy composite containing carbon black in X-band
frequency ranges.” Composites Part B vol. 35. pp. 49-56, (2004).
[40] Saville P., “ A review of optimisation techniques for layered radar absorbing
materials,” Technical Memorandum, Atlantic, 2004.
[41] Bhattacharyya A., Sengupta D. L., “ Radar cross section analysis and control,”
Artech House, 1991.
[42] Marshall S. V. and Skitek G. G., “ Electromagnetic concepts and applications,”
Prentice hall, New Jersey, 3 rd Edition, (1990).
[43] Valenzuela R., “ Magnetic ceramics,” Cambridge University Press, (1994).
[44] McCurrie R. A., “ Ferromagnetic materials: structure and properties,”
Academic Press, London. (1994).
[45] Smith J., Wijn H. P. J., “Ferrites”, New York, Wiley, (1959).
[46] Kaiser M., “Influence of V2O5 ion addition on the conductivity and grain
growth of Ni–Zn–Cu ferrites,” Current Applied Physics 10 (4) 975-984. (2010).
[47] Özgür Ü., Alivov Y., Morkoç H., “Microwave ferrites, “ Part 1: Fundamental
properties, J Mater Sci: Mater Electron 20 (9) 789-834, (2009).
[48] E.Aydogan, S.Kaya, A. F. Dericioglu, “Morphology and Magnetic Properties
of Barium Hexaferrite Ceramics Synthesized in x wt% NaCl-(100-x) wt% KCl
Molten Salts”, Ceramics International, 40, 2331-2336, (2014).
[49] B.T. Shirk, W.R.Buessem, “Temperature Dependence of Ms and K 1 of
BaFe12O19 and SrFe12O19 Single Crystals, J.Appl.Phys.40, 1294(1969).
[50] K.Haneda, H.Kojima, “Magnetization reversal process in chemically
precipitated and ordinary prepared BaFe12O19”, J.Appl.Phys. 44,3760(1973).

82
[51] Winkler G., “ Crystallography, chemistry and technology of ferrites. In
magnetic properties of materials,” McGraw-Hill, London, (1971).
[52] Retrieved on 1 st of January, 2014 from,
http://origin-ars.els-cdn.com/content/image/1-s2.0-S0304885304002793-gr1.jpg
[53] Louh R., Reynolds III T. G., Buchanan R. C., “ Ferrite ceramics in ceramic
materials for electronics,” Marcel Dekker Inc., Newyork, (2004).
[54] Retrieved on 1 st of January, 2014 from
http://www.doitpoms.ac.uk/tlplib/ferromagnetic/types.php
[55] Moulson A. J., Herbert J. M., “ Electroceramics: Materials, properties,
applications,” John Wiley & Sons Ltd., (2003).
[56] RF Absorbers Catalog, Advanced ElectroMagnetics, Inc., Santee, CA, (2011).
[57] Sugimoto M, “The Past, Present, and Future of Ferrites”, Journal of the
American Ceramic Society, Volume 82, Issue 2, Article first published online: 22
DEC 2004
[58] Hsiang H-I, Chang C-H, “Molten salt synthesis and magnetic properties of
3BaO·2CoO·12Fe2O3 powder”, Journal of Magnetism and Magnetic Materials, 278
218-222, (2004).
[59] He1 X, Zhong1 W, Yan1 S, Au2 C-T, L ¨u1 L and Du1 Y, “The structure,
morphology and magnetic properties of Sr-ferrite powder prepared by the molten-
salt method”, J. Phys. D: Appl. Phys. 47 235002 (10pp), (2014).
[60] Abbas S. M., Chatterjee R., “Electromagnetic and microwave absorption
properties of (Co2+-Si4+) substituted barium hexaferrites and its polymer
composite,” Journal of Applied Physics 101(7), (2007).
[61] Wu Y. P., Ong C. K.,“Improved microwave magnetic and attenuation
properties due to the dopant V2O5 in W-type barium ferrites.”, Journal of Physics
D-Applied Physics 39(14), 2915-2919, (2006).

83
[62] Wu Y., Huang Y., “Several W-type barium ferrites with different Me2:
Preparation and the electromagnetic properties.”, Cailiao Yanjiu Xuebao/Chinese
Journal of Materials Research 25(6), 607-612, (2011).
[63] Tehrani M. K., Ghasemi A., “Wideband electromagnetic wave absorber using
doped barium hexaferrite in Ku-band.”, Journal of Alloys and Compounds, 509(33),
8398-8400, (2011).
[64] Liangchao L, Chen K., “Attractive microwave-absorbing properties of M-
BaFe12O19 ferrite.”, Journal of Alloys and Compounds, 557(0), 11-17, (2013).
[65] Retrieved on 2 nd of January, 2014 from
http://weblog.sirajs.com/article/magnetic-properties-materials
[66] Smith W. F., “ Principles of materials science and engineering,” McGraw-Hill,
3 rd Edition, Chapter 11 Magnetic Materials, (1996).
[67] Retrieved on 11 th of November, 2013 from
http://commons.wikimedia.org/wiki/File:BH_Curve_and_Loop.jpg
[68] R.H.Arendt,” Liquid‐phase sintering of magnetically isotropic and anisotropic
compacts of BaFe12O19 and SrFe12O19”, Journal of Applied Physics, 44(7), 3300,
(1973).
[69] Y.T.Chien, H.C.Pan,“Preparation and Properties of Barium Ferrite Using Hot-
Rolled Mill Scale “, Journal of American Ceramic Society 72(8) (1989) 1328-1332.
[70] Retrieved on 1 st of January, 2014 from
http://www.crct.polymtl.ca/fact/phase_diagram.php?file=KCl-NaCl.jpg&dir=FTsalt
[71] Steve J. Chipera, David L. Bish, “Fitting Full X-Ray Diffraction Patterns for
Quantitative Analysis: A Method for Readily Quantifying Crystalline and
Disordered Phases”, Advances in Materials Physics and Chemistry, 3, 47-53,
(2013).
[72]Retrieved on 10 th of June, 2014 from
http://nanolab.berkeley.edu/labmanual/chap8/8.024ptprb2.pdf
84
[73]Retrieved on 10 th of June, 2014 from
http://www.imagesco.com/articles/superconductors/four-pt-schematic.gif
[74] N. Gagnon, “Design and Study of a Free - Space Quasi Optical Measurement
System, in "Institute for Electrical and Computer Engineering" (University of
Ottawa, Ottawa, 2002).
[75]Retrieved on 10 th of June, 2014 from http://www.tibtech.com/conductivity.php
[76]Retrieved on 8 th of June, 2014 from
http://chemistry.stackexchange.com/questions/820/electrical-conductivity-of
graphite.
Recommended


![Index [ftp.feq.ufu.br]ftp.feq.ufu.br/Luis_Claudio/Segurança/Safety/Double/fire_handbook... · Backdraft Explosion 174 Barium 216 Barium Carbonate 300 Barium Chlorate 300 Barium Nitrate](https://img.pdfslide.net/doc/110x75/5ea2585052451660ed3ed304/index-ftpfequfubrftpfequfubrluisclaudioseguranasafetydoublefirehandbook.jpg)