A Bioeconomic analysis of Maldivian Skipjack Tuna Fishery
Master thesis in International Fisheries Management
(30 Credits)
By Solah Mohamed
Department of Economics and Management Norwegian College of Fishery Science
University of Tromsø
May 2007

- i -
ABSTRACT
Skipjack tuna fishery in the Maldives is the most important and by far the
predominant fishery in the country. This fishery is an open access fishery and has been
developing over the years. With the technological development fishers have been moving
further in search of fish and catch has been increasing steadily.
No stock assessment of the exploited tuna stock has been undertaken. Effort data
from the Maldivian skipjack tuna fishery from 1985 to 2005 is standardised to a standard
year 2005 vessel and standardised effort has together with catch data been used to calculate
the parameter values for the Schafer and Fox surplus production models. The parameterised
models are used to estimate the reference equilibriums of open access, maximum
sustainable yield, maximum economic yield and the solution of social optimum. The
analysis indicates that present level of effort in the fishery is close to the level of maximum
sustainable yield (of about 100 thousand tonnes), but increase in cost and uncertainties
related to recent changes in fishing pattern may show this situation to be unsustainable and
cause a reduction in fishing effort under open access. This analysis also suggests that with
current cost and price, this fishery may not be biologically overfished.
Keywords: Maldivian Fisheries, Skipjack tuna fisheries, Fisheries Bioeconomics,
West Indian Ocean Tuna Fishery

- ii -
ACKNOWLEDGEMENT
Tusen Takk to the Norwegian Centre for International Cooperation in Higher
Education (SIU). If not for the NORAD scholarship my dream of studying in Norway
would never become a reality.
My sincere gratitude goes to my supervisor Associate Professor Arne Eide. His
guidance and advice was unprecedented from the very beginning till the very end. I could
not have asked for more. Thank you indeed.
Thanks to all the lecturers and tutors who generously shared their knowledge and
kept up with us.
It is a pleasure to meeting my IFM class mates. In spite of our differences we have
became a close bunch of friends. I’m going to miss my wonderful classmates.
My wife is the one who persuaded me to apply for this scholarship. Throughout
the course, more than anyone else, she has been supportive and encouraging. I thank my
wife for believing in me and standing behind me in every challenge I aspire in my life.
There is a never ending list of people I want to thank for helping me to complete
this journey. For all those who contributed (even in a small way) to the success of my study
in Tromsø, I say thank you very much.
Solah MOHAMED
- iii -
TABLE OF CONTENT
Abstract ................................................................................................................................... i
Acknowledgement ................................................................................................................. ii
Table of Content ................................................................................................................... iii
List of Tables ........................................................................................................................ iv
List of Figures ........................................................................................................................ v
1. Introduction.................................................................................................................... 1
2. Background .................................................................................................................... 3
2.1. Biology of Skipjack tuna ....................................................................................... 3 2.2. Skipjack tuna fishery in West Indian Ocean.......................................................... 4 2.3. Maldivian Tuna fishery.......................................................................................... 5 2.4. Last 20 years of the Industry.................................................................................. 6 2.5. Market forces in the Maldivian Skipjack tuna fishery........................................... 9
3. Bioeconomic model ..................................................................................................... 11
3.1. Biological Growth Models................................................................................... 11 3.1.1. Verhulst-Schafer Growth Model (Logistic Growth Model) ........................ 11 3.1.2. Gompertz-Fox Growth Model ..................................................................... 13
3.2. Fisheries Economics ............................................................................................ 15 3.2.1. Open Access Equilibrium (OAE) ................................................................ 16 3.2.2. Maximum sustainable Yield (MSY)............................................................ 16 3.2.3. Maximum Economic Yield (MEY) ............................................................. 17 3.2.4. Optimum Sustainable Yield......................................................................... 17
4. Data and Parameter Estimation.................................................................................... 19
4.1. Standardising Catch and Effort Data ................................................................... 20 4.2. Harvest parameter estimation .............................................................................. 22 4.3. Economic parameters........................................................................................... 24
5. Results.......................................................................................................................... 27
5.1. Reference points................................................................................................... 27
6. Discussion and Conclusion .......................................................................................... 31
Reference ............................................................................................................................. 35
Appendix 1........................................................................................................................... 37
Appendix 2........................................................................................................................... 39
- iv -
LIST OF TABLES
Table 1: Formulae to calculate open access equilibrium effort level .................................. 16
Table 2: Formulae to calculate effort level that could achieve maximum sustainable yield17
Table 3: Formulae to calculate effort level that could achieve maximum economic yield . 17
Table 4: Formulae to calculate reference points .................................................................. 18
Table 5: Catch, effort, average engine power, percentage change in engine power and standardised effort for the Maldivian Skipjack Tuna fishery: 1985-2005. Catch and number of fishing trips data are form (MPND, 2005a), (MPND, 2005b) and (MPND, 2006). ....................................................................................................... 21
Table 6: Parameters estimated for Schaefer model by linear regression using standardised effort and CPUE data from 1985-2005................................................................... 23
Table 7: Parameters estimated for Fox model by linear regression using standardised effort and ln(CPUE) data from 1985-2005....................................................................... 24
Table 8: Components of cost of unit effort (c) in the Maldivian Skipjack tuna Fishery based on estimates of 2005 prices..................................................................................... 25
Table 9: Calculated reference points.................................................................................... 28
Table 10: Table shows how net profit per fishing trip might change with the changes in cost and revenue. Calculations are based on 2005 values. Values are in US$. ............. 29
- v -
LIST OF FIGURES
Figure 1: Maldivian EEZ and 75 mile reserved for local fishers (Shiham Adam, 2004) ...... 1
Figure 2: Skipjack Tuna (Kalhubila mas in Maldivian language). Illustration source: (Coad, 1995), www.fishbase.org.......................................................................................... 3
Figure 3: Catch trend in West Indian Ocean by major gear groups 1950 - 2005. PS= Purse Seine, BB= Bait Boats, Gill= Gill Net, Oth= Other of gears such as line and long line. Purse seine fleets are mainly by France and Spain. Bait boats are almost exclusively from Maldives. Data source Indian Ocean Tuna Commission (IOTC, 2006a). ...................................................................................................................... 4
Figure 4: Price fluctuation in the main markets for Maldivian Skipjack tuna. Data source for Thailand and European market (Josupeit, 2006). Local purchase price data from (MPND, 2005a) and (MPND, 2005b). Local purchase price is converted to US$ using average exchange rate for the year.................................................................. 7
Figure 5: Development of Maldivian skipjack tuna fishery, 1985 – 2005. ........................... 8
Figure 6: Illustrates the difference between Logistic and Gompertz population growth model. ..................................................................................................................... 14
Figure 7: Regression plot of CPUE against standardised effort .......................................... 22
Figure 8: Regression plot of ln(CPUE) against standardised effort .................................... 23
Figure 9: Harvest curves for Maldivian skipjack Tuna fishery for Schaefer and Fox model, along with actual harvest from 1985 to 2005. ........................................................ 27
Figure 10: Open Access Equilibrium situation in Maldivian Skipjack tuna fishery based on the Schaefer model. Bold lines show the current situation..................................... 28
Figure 11: Open Access Equilibrium situation in Maldivian Skipjack tuna fishery based on the Fox model. Bold lines show the current situation. ........................................... 29

- 1 -
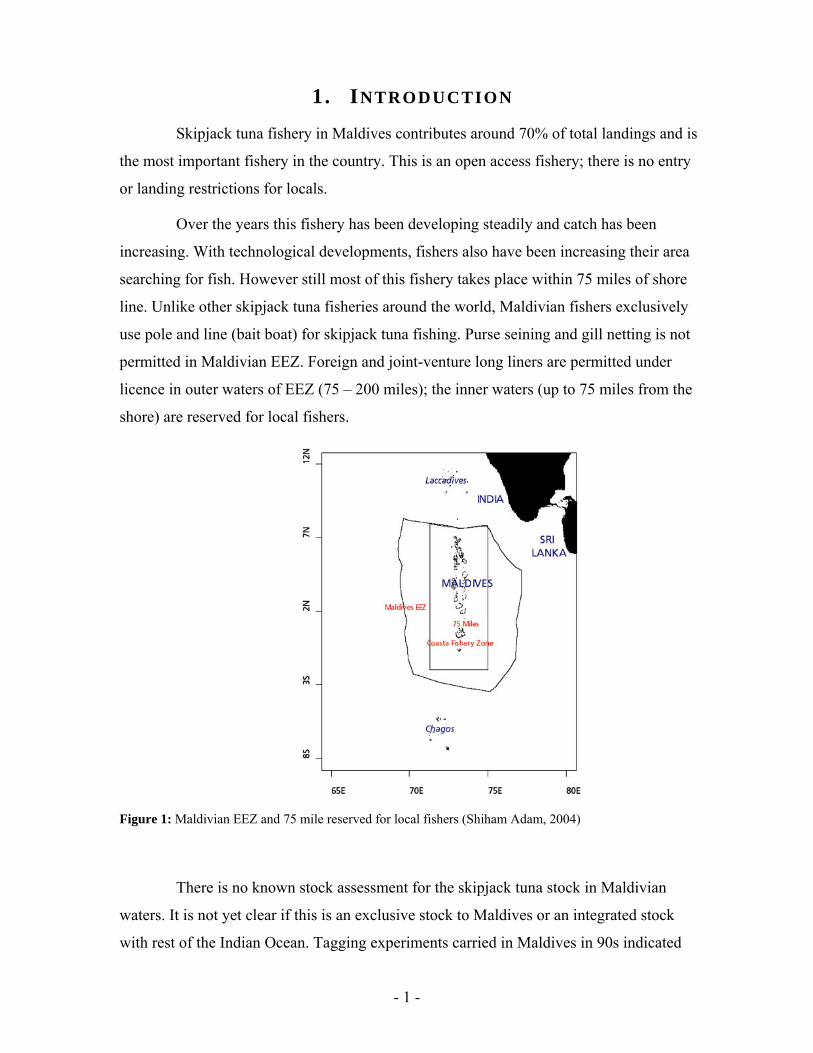
1. INTRODUCTION
Skipjack tuna fishery in Maldives contributes around 70% of total landings and is
the most important fishery in the country. This is an open access fishery; there is no entry
or landing restrictions for locals.
Over the years this fishery has been developing steadily and catch has been
increasing. With technological developments, fishers also have been increasing their area
searching for fish. However still most of this fishery takes place within 75 miles of shore
line. Unlike other skipjack tuna fisheries around the world, Maldivian fishers exclusively
use pole and line (bait boat) for skipjack tuna fishing. Purse seining and gill netting is not
permitted in Maldivian EEZ. Foreign and joint-venture long liners are permitted under
licence in outer waters of EEZ (75 – 200 miles); the inner waters (up to 75 miles from the
shore) are reserved for local fishers.
Figure 1: Maldivian EEZ and 75 mile reserved for local fishers (Shiham Adam, 2004)
There is no known stock assessment for the skipjack tuna stock in Maldivian
waters. It is not yet clear if this is an exclusive stock to Maldives or an integrated stock
with rest of the Indian Ocean. Tagging experiments carried in Maldives in 90s indicated

- 2 -
that there is very little migration from Maldivian water to rest of the Indian Ocean (Shiham
Adam & Sibert, 2002). Also no stock assessment is available for the Indian Ocean skipjack
tuna stock. Given the characteristics of skipjack tuna and as they appear to be less
migratory than other species of tuna, the last report of the Indian Ocean Tuna Commission
(IOTC) acknowledged that smaller management units for skipjack could be possible
(IOTC, 2006b). Hence in this analysis skipjack tuna stock in Maldivian waters is
considered exclusive to Maldivian fishers.
Increasing cost of fishing effort may be the biggest problem to face for Maldivian
fishers in the future. Increasing fuel prices may force the fleet to cut down the effort and
many may have to leave the fishery. Also increase in other costs may cause a difficult
situation and less ability to compete in the world market.
This analysis is an attempt to figure out the current situation in the Maldivian
skipjack tuna fishery and to predict the trend in this fishery. Surplus production models of
Schaefer (Schaefer, 1954) and Fox (Fox, 1970) were use to estimate the management
reference point for Maldivian skipjack tuna fishery. For this type of fisheries other analyses
methods may be preferable, but impossible given the data available.
Second section of this thesis gives some background information for the study,
starting with brief information about the biology of this species and then followed by an
overview of the Skipjack tuna fishery in the West Indian Ocean. This section then
continues with a description of the Maldivian skipjack tuna fishery in particular. The last
part of this section focuses market forces in this fishery.
The third section introduces bioeconomic modelling. Surplus production models
by Schaefer (Schaefer, 1954) and Fox (Fox, 1970) are used in the analyses. Second part of
the section presents equations representing economic reference points.
Fourth section is about the data and parameter estimation. Effort data of 21 years
is standardised by a standard vessel of base year 2000. Parameters for the models are
estimated using the regression methods used by Schaefer and Fox. Economic parameters
are then calculated based on 2005 prices.
Fourth section presents the results of the analysis followed by the discussion and
conclusion in the fifth section.
- 3 -
2. BACKGROUND
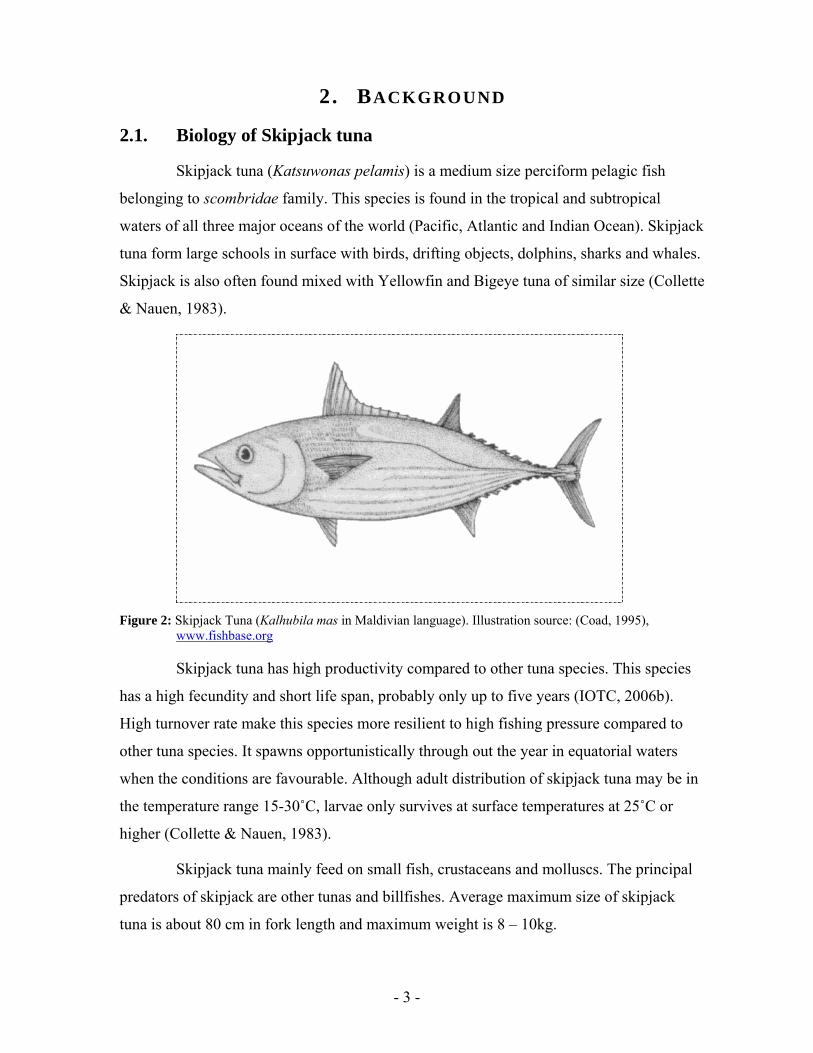
2.1. Biology of Skipjack tuna
Skipjack tuna (Katsuwonas pelamis) is a medium size perciform pelagic fish
belonging to scombridae family. This species is found in the tropical and subtropical
waters of all three major oceans of the world (Pacific, Atlantic and Indian Ocean). Skipjack
tuna form large schools in surface with birds, drifting objects, dolphins, sharks and whales.
Skipjack is also often found mixed with Yellowfin and Bigeye tuna of similar size (Collette
& Nauen, 1983).
Figure 2: Skipjack Tuna (Kalhubila mas in Maldivian language). Illustration source: (Coad, 1995),
www.fishbase.org
Skipjack tuna has high productivity compared to other tuna species. This species
has a high fecundity and short life span, probably only up to five years (IOTC, 2006b).
High turnover rate make this species more resilient to high fishing pressure compared to
other tuna species. It spawns opportunistically through out the year in equatorial waters
when the conditions are favourable. Although adult distribution of skipjack tuna may be in
the temperature range 15-30˚C, larvae only survives at surface temperatures at 25˚C or
higher (Collette & Nauen, 1983).
Skipjack tuna mainly feed on small fish, crustaceans and molluscs. The principal
predators of skipjack are other tunas and billfishes. Average maximum size of skipjack
tuna is about 80 cm in fork length and maximum weight is 8 – 10kg.
- 4 -
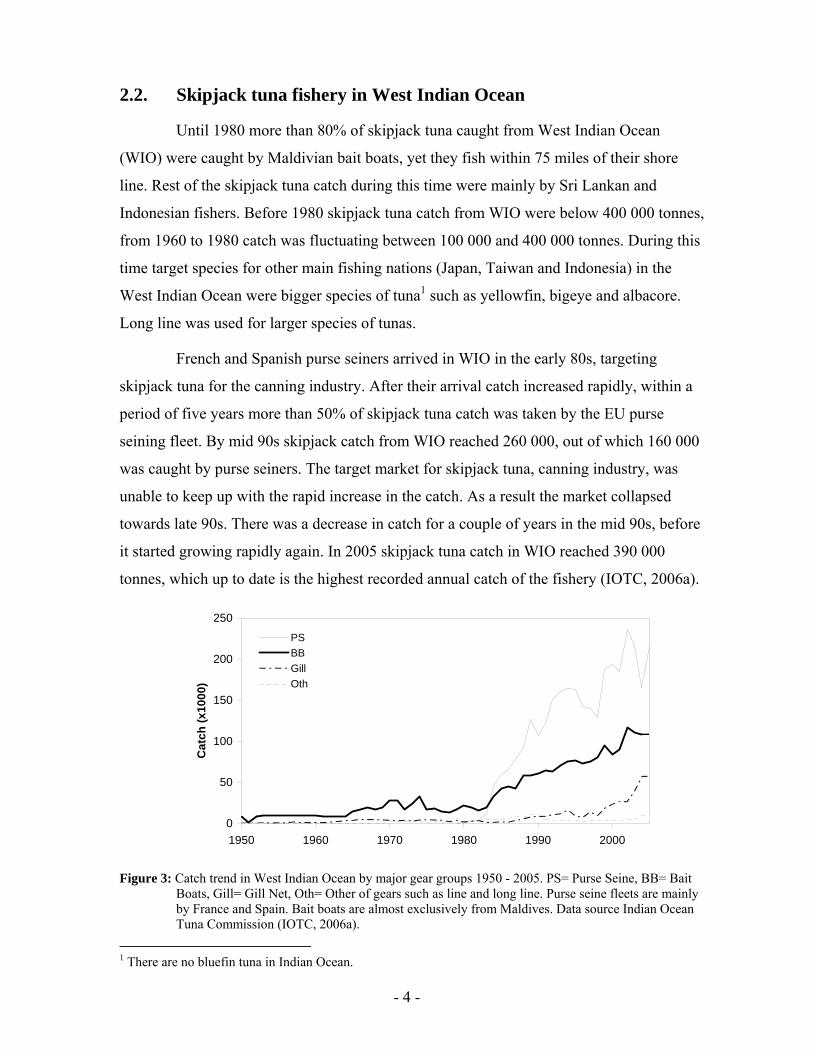
2.2. Skipjack tuna fishery in West Indian Ocean
Until 1980 more than 80% of skipjack tuna caught from West Indian Ocean
(WIO) were caught by Maldivian bait boats, yet they fish within 75 miles of their shore
line. Rest of the skipjack tuna catch during this time were mainly by Sri Lankan and
Indonesian fishers. Before 1980 skipjack tuna catch from WIO were below 400 000 tonnes,
from 1960 to 1980 catch was fluctuating between 100 000 and 400 000 tonnes. During this
time target species for other main fishing nations (Japan, Taiwan and Indonesia) in the
West Indian Ocean were bigger species of tuna1 such as yellowfin, bigeye and albacore.
Long line was used for larger species of tunas.
French and Spanish purse seiners arrived in WIO in the early 80s, targeting
skipjack tuna for the canning industry. After their arrival catch increased rapidly, within a
period of five years more than 50% of skipjack tuna catch was taken by the EU purse
seining fleet. By mid 90s skipjack catch from WIO reached 260 000, out of which 160 000
was caught by purse seiners. The target market for skipjack tuna, canning industry, was
unable to keep up with the rapid increase in the catch. As a result the market collapsed
towards late 90s. There was a decrease in catch for a couple of years in the mid 90s, before
it started growing rapidly again. In 2005 skipjack tuna catch in WIO reached 390 000
tonnes, which up to date is the highest recorded annual catch of the fishery (IOTC, 2006a).
0
50
100
150
200
250
1950 1960 1970 1980 1990 2000
Cat
ch (x
1000
)
PSBBGillOth
Figure 3: Catch trend in West Indian Ocean by major gear groups 1950 - 2005. PS= Purse Seine, BB= Bait
Boats, Gill= Gill Net, Oth= Other of gears such as line and long line. Purse seine fleets are mainly by France and Spain. Bait boats are almost exclusively from Maldives. Data source Indian Ocean Tuna Commission (IOTC, 2006a).
1 There are no bluefin tuna in Indian Ocean.
- 5 -
Maldivian catches has also increased gradually since 1980 due to increasing
fishing power (bigger boats with larger engines) and also due to use of fish aggregating
devices (FADs). In the last 10 years Maldivian bait boats contributed for about 30% of the
catch in the WIO, but still Maldivian fishers stay within 75 miles of their shore line.
2.3. Maldivian Tuna fishery
Historically Maldivian fisheries were almost exclusively based on the skipjack
tuna fishery. Smoked and dried skipjack tuna, commonly known as Maldive Fish sold to
Sri Lanka, used to be the principle source of foreign currency to Maldives. Over the years
new types of fisheries were introduced and establish, but still skipjack tuna fishery is the
most important and by far predominant fishery in Maldives.
Before 70s there were not many forms of processing the fish. Basically there were
two types of end products; traditional smoked and dried tuna (Maldive Fish) and Slated and
Dried fish. Only tuna species were used to make Maldive Fish. For salting, sharks and reef
fish were the favourites, but tuna species are also salted in good fishing seasons.
In 1970 Sri Lanka cut back its import of Maldive Fish. In order to find an
alternative for the foreign currency, government of Maldives invited foreign companies to
Maldives to buy fish from fishermen, and Japanese Marubeni Cooperation became the first
foreign company to start purchasing fish from Maldivian fishermen (Anon, 2003).
The mechanisations of Maldivian fishing boats started in the mid 70s. This
allowed fishers to increase the area searching for fish and catch operation. As local fish
catch increased, the need for product diversification and enhancing value addition resulted
in setup of a Maldivian-Japanese joint venture canning plant in 1978 in the island of
Felivaru.
Due to price fluctuations in the tuna market in late 70s and early 80s, foreign
companies in Maldivian fisheries industry started leaving in early 80s. When Japanese
investors ceased their operation in the Felivaru canning factory, government purchased the
canning factory and later upgraded from 8 tonnes canning capacity to 50 tonnes canning
capacity and a new factory was opened in 1986 (Anon, 2003).
- 6 -
In April 1983 State Trading Organisation (STO) of Maldives took over the fish
purchasing operations from the last remaining Japanese company in the Maldives. After the
Japanese companies relinquished their fish purchasing and caning operations in Maldives,
government purchased the facilities used for their operations. From then on fish
purchasing, freezing and canning operations were carried out by government companies,
though under different names in different periods of time.
2.4. Last 20 years of the Industry
The following years after Japanese companies left Maldives, skipjack tuna fishery
industry kept on growing steadily. While processing and export of Maldive Fish is open to
all, export of frozen and canned tuna was controlled and monopolised by the government
until recently.
Fisheries Projects Implementation Department (FPID), under STO, was
established in 1986. This company took over the canning operation in the upgraded
canning factory at Felivaru. They also took over the rest of the fish purchasing and freezing
operations in the country, which included number of fish collecting and freezing vessels.
During the time of FPID government invested on two fish collecting and freezing centres at
the south of the country. In 1990 a high profile corruption case emerged in FPID, many in
the top level staff of the company were removed from their posts and investigated for
corruption. Government dismantled FPID and formed yet another company, Maldives
Industrial Fisheries Company (MIFCO), to take over the operations of FPID, this time
independent from STO.
With a single government company acting as the major force in the post harvest
sector, effect of world market fluctuation on the local market was very little; fishermen had
almost a fixed price for their catch in spite of ups and downs in the world market price.
Even when the world tuna market collapsed in 1999/2000 the company was obliged to buy
fish from fishermen. The government company also had a social responsibility to support
the livelihood of the fishermen.
- 7 -
0
200
400
600
800
1,000
1,200
1,400
1985 1990 1995 2000 2005
Loca
l Pur
chas
e an
d Th
ai M
arke
t Pric
e (U
S$/T
on)
0
5
10
15
20
25
30
Can
ned
Tuna
Pric
e (U
S$/C
arto
n)
Frozen SJ at Thai Local Purchase Canned Tuna at EU
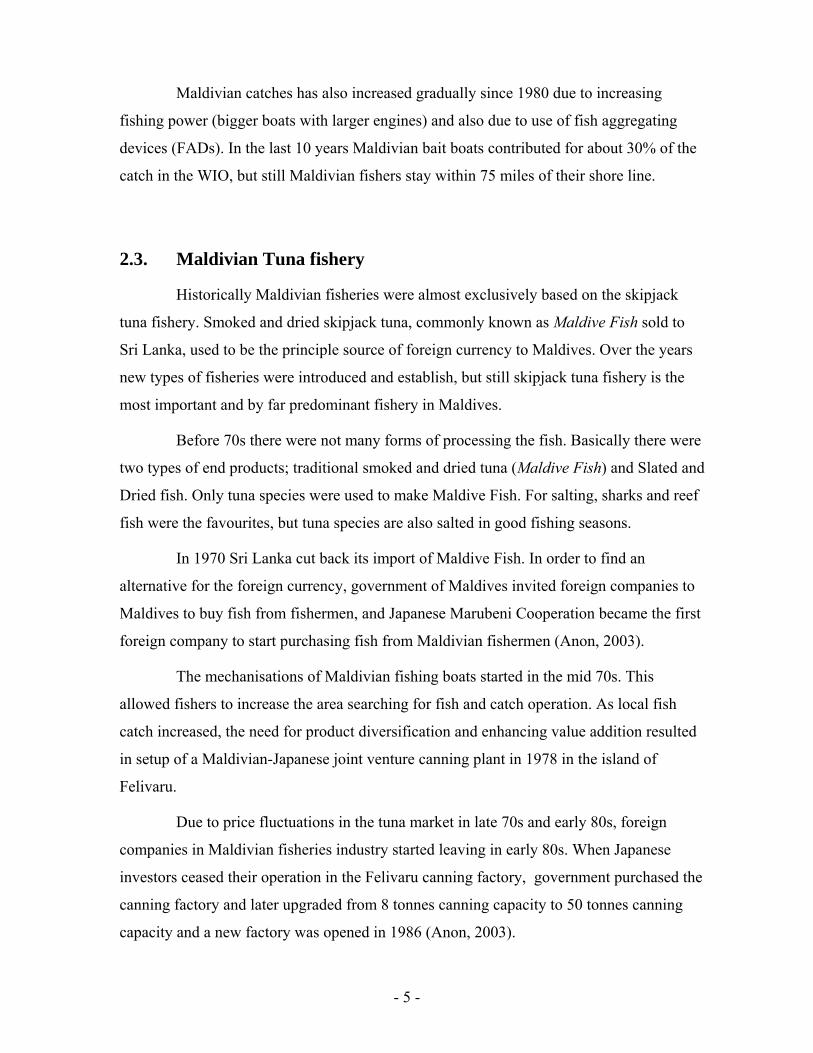
Figure 4: Price fluctuation in the main markets for Maldivian Skipjack tuna. Data source for Thailand and
European market (Josupeit, 2006). Local purchase price data from (MPND, 2005a) and (MPND, 2005b). Local purchase price is converted to US$ using average exchange rate for the year.
With a stable purchase price and steady increase in the catch, harvest sector was
encouraged to invest in larger boats; on the other hand with the uncertainty in the world
market the post harvest sector was lagging behind. Some of the reasons that contributed to
the lack of development in the post harvest sector could be;
1. Lack of incentives to invest enough in the sector: The government company
is enjoying a monopoly situation and there was lot of uncertainty in the
fluctuating world market.
2. Corruption inside the government fisheries company: During the time when
canned tuna and frozen tuna price was at its highest, allegedly there was lot
of corruption going on in the government fisheries company.
3. Social burden on the government fisheries company: In spite of the world
market crash in 1999/2000, MIFCO was obliged to purchase fish from
fishermen. Government lent money to MIFCO during the time of the crisis.
This was also the time Maldives had the highest catches; harvest sector got
money and reason to invest while MIFCO was dragged into debt as a result
of borrowing money to pay fishermen.
- 8 -
-
25
50
75
100
125
150
1985 1990 1995 2000 2005
Cat
ch (x
1000
tonn
es)
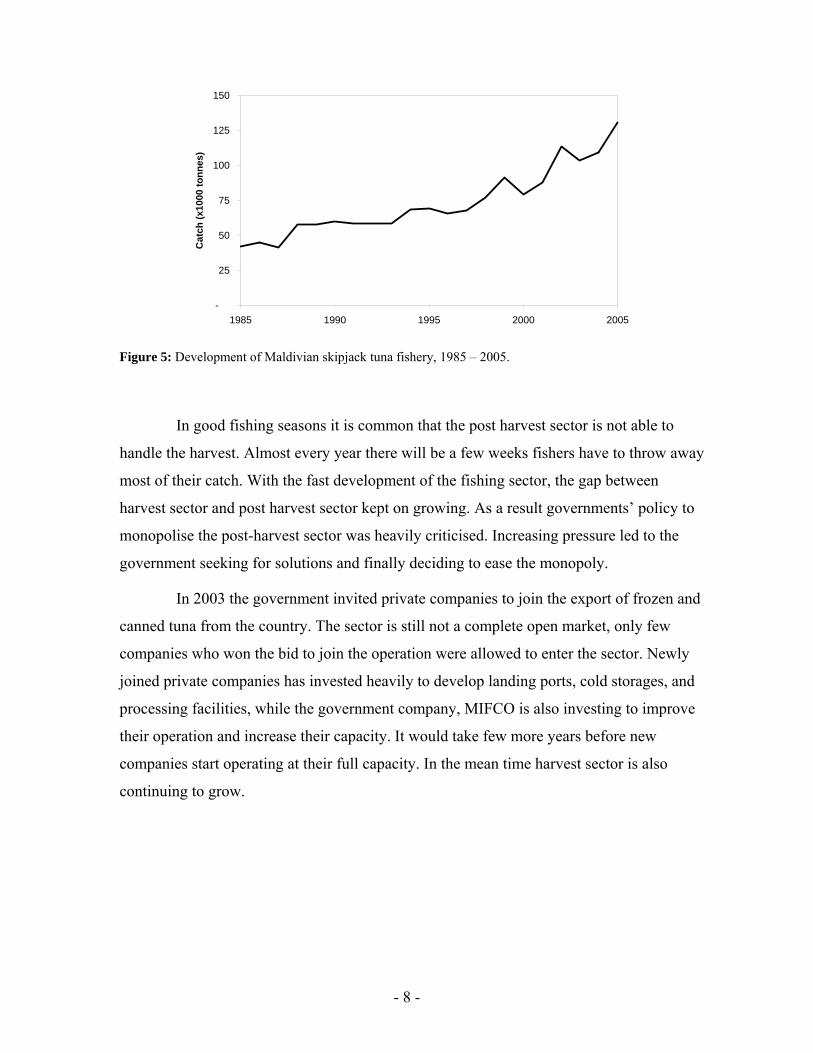
Figure 5: Development of Maldivian skipjack tuna fishery, 1985 – 2005.
In good fishing seasons it is common that the post harvest sector is not able to
handle the harvest. Almost every year there will be a few weeks fishers have to throw away
most of their catch. With the fast development of the fishing sector, the gap between
harvest sector and post harvest sector kept on growing. As a result governments’ policy to
monopolise the post-harvest sector was heavily criticised. Increasing pressure led to the
government seeking for solutions and finally deciding to ease the monopoly.
In 2003 the government invited private companies to join the export of frozen and
canned tuna from the country. The sector is still not a complete open market, only few
companies who won the bid to join the operation were allowed to enter the sector. Newly
joined private companies has invested heavily to develop landing ports, cold storages, and
processing facilities, while the government company, MIFCO is also investing to improve
their operation and increase their capacity. It would take few more years before new
companies start operating at their full capacity. In the mean time harvest sector is also
continuing to grow.
- 9 -
2.5. Market forces in the Maldivian Skipjack tuna fishery
About 20-30% of the skipjack catch is consumed locally, the rest goes to export.
Major forms of skipjack export are as frozen tuna, canned tuna and as Maldive Fish. Frozen
tuna and canned tuna processing and export are by companies while Maldive Fish is
processed in small scale cottage industry and sold to exporters, and exporters sell them to
Sri Lankan market.
Purchasing prices by companies are somewhat stable while local consumer market
price and auction market price for cottage industry fluctuates a lot. As the purchasing price
of big companies is less elastic to supply, in periods of low catches big companies would
be the last choice of the fishermen. When fishing is low fishers go to the island markets
before delivering to collector vessels or collecting centres of the companies. At island
markets they might choose to auction the whole catch or retail it. When catches are very
low fishers choose to sell them on local market at higher price. In local consumer market it
is common to reach a price of 1 US$ per kilo tuna when supply is low. Maldive Fish
processors mainly get their raw material from auctions at island markets. Going price of
these auctions depends on the supply and also Maldive Fish price at Sri Lankan market.
As government is easing the monopoly in the sector, competition between the
companies are expected to make purchase price more elastic to supply and also to the
fluctuations in the world market.
Major export market for Maldivian frozen skipjack tuna is Bangkok, while the
European market is the most important for canned tuna. Having a very small share of the
market, Maldives has no influence on these markets. In the Bangkok frozen tuna market
Maldives is competing with countries like Taiwan, South Korea and Indonesia. In the
European canned tuna market Maldives in competing with countries like Thailand, Spain
and Philippines. High production costs due to lack of resources in the country gives the
Maldives disadvantages in these markets. Low fishing costs (compared to other fishing
methods such as purse seining) of pole and line fishing has enabled Maldivian stay in these
markets. With increasing cost of effort, this advantage may soon disappear.

- 10 -
- 11 -
3. BIOECONOMIC MODEL
3.1. Biological Growth Models
3.1.1. Verhulst-Schafer Growth Model (Logistic Growth Model)2
Populations of organisms cannot grow infinitely, growth of organisms are
constrained by environmental conditions and food availability. It has been shown that
populations of organisms strive to stabilise at highest possible population size for a given
set of conditions (Schaefer, 1954). Marginal growth of a population increases when the size
of the population decreases, and marginal growth decreases when the size of the population
increases, this may be called density dependent growth. Biological growth of such
population may be expressed as
2)( sXrXXF += (1)
Where X is population size, r is the growth rate of the population and s is the mortality rate
which is negative. This is a parabolic equation also referred to as Verhults’ equation or the
logistic growth equation (Schaefer, 1954).
When the population reach the environmental carrying capacity, K, growth and
mortality of the population is equal, and rate of change of population size with respect to
time (dX/dt) becomes zero. The mortality rate s can now be expressed in terms of r and K
as
Krs −
= (2)
Substituting s in equation (1) by equation (2) we get the most commonly used expression of
the logistic growth equation.
⎟⎠⎞
⎜⎝⎛ −=
KXrXXF 1)( (3)
Harvest is just another type of mortality. With the introduction of harvest, the rate
of population change (dX/dt) is;
2 P. F Verhulst first introduced the logistic growth function in 1883, but it became popular when R. Pearl and L. J. Reed rediscovered it and used it in an empirical work, employing statistics from US population in 1920.
- 12 -
),()( XEHXFdtdX
−= (4)
where
F(X) = Natural annual net growth of the stock
H (E, X) = Annual harvest as a function of fishing effort (E) and stock size (X).
In the absence of harvest, rate of change of population size (dX/dt) equals the
biological growth rate of the population, F(X).
Annual rate of renewal of a fish stock depends on three major factors; biological
environment, physical environment, and magnitude of the remaining population. Biological
environment and physical environment may be considered to be constant in the long run
(Schaefer, 1957). Population size is reduced by natural and fishing mortality. Harvesting
increases the total mortality, consequently natural growth rate increases to balance the
mortality. As the fish population strives to balance the total mortality with the growth, the
population reaches a new equilibrium at a point where the growth rate equals total
mortality, which occurs at a lower population size than the environmental carrying capacity
level K. When the fish stock reaches equilibrium with a given effort level, all the biological
growth of the population is harvested and there is no net change in the population size.
Then
)(),( XFXEH = (5)
Assuming that each unit of effort harvest equal amounts from the targeted stock,
harvest may be described by (Schaefer, 1954)
H (E, X) = qEX (6)
where q is the catchability coefficient. Equation (6) implies that harvest (H) is proportional
to the stock size (X) at a given fishing effort E. Assuming an equilibrium situation where
catch equal natural growth, the equilibrium stock size (X) may be expressed in terms of K,
q, E and r.
qXEKXrXXF =⎟⎠⎞
⎜⎝⎛ −= 1)(
and when 0≠X
- 13 -
⎟⎠⎞
⎜⎝⎛ −=
rqEKX 1 (7)
By substituting X in equation (6) by (7), we get the long term catch equation.
rKEqqKEEH
22
)( −= (8)
This implies that although harvest is a function of effort and stock size for a short
term, in a long run stock size becomes only a function of effort (given that environmental
conditions are constant) and the sustainable yield too becomes a function of effort only.
Equation (8) takes the form of a parabolic equation, which allows us to use a
linear regression in order to estimate the parameters of the function of sustainable harvest
(H). Dividing both sides of equation (8) by effort (E) we get the linear equation of catch per
unit of effort (CPUE).
rKEqqK
EHCPUE
2
−== (9)
3.1.2. Gompertz-Fox Growth Model
In 1970 W. W. Fox outlined an alternative surplus-yield model, assume Gompertz
growth function, resulting in an exponential relationship between fishing effort and
population size and asymmetrical harvest curves (Fox, 1970). Generalised form of the
Gompertz curve can be represented as (Winsor, 1932),
)ln(ln)( XKXXF −= µ , (10)
Assuming that biological growth of the subjected population follows the model
suggested by Gompertz, and also assuming the fleet is homogenous and all vessels have the
same fishing power.
µµqE
KeXqEXXKXXF
−
=⇒=⎟⎠⎞
⎜⎝⎛= ln)( (11)
By substituting X in equation (6) by (11) we get
- 14 -
µqE
qEKeXEH−
=),( (12)
Dividing both sides of the equation (12) by fishing effort (E) yields
µqE
qKeEHCPUE
−
== (13)
A log-linear expression is found by
EqqKCPUEµ
−= )ln()ln( (14)
Time
Popu
latio
n Si
ze
LogisticGompertz
Population Size
F(X)
LogisticGompertz
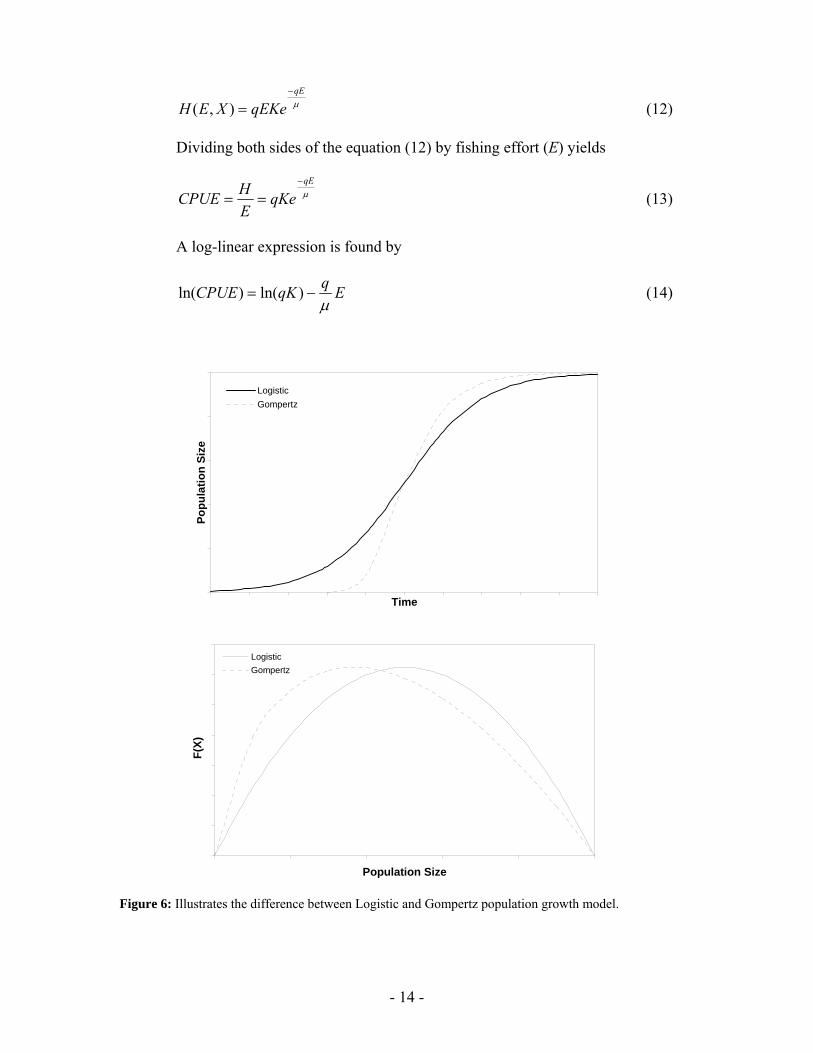
Figure 6: Illustrates the difference between Logistic and Gompertz population growth model.
- 15 -
The major difference between Logistic model and the Gompertz model is that at
lower population size Gompertz model predicts a higher growth rate than logistic model.
At higher population size logistic model predicts a higher growth rate than prediction by
Gompertz model. In Logistic model maximum growth occurs at half of the maximum
population level. In Gompertz model maximum growth occurs at population level less than
the half of maximum population, around 37% of maximum population. In other words
population growth curve of Gompertz model is skewed to left while population growth
curve of logistic model is symmetrical. This is illustrated in the Figure 6.
3.2. Fisheries Economics
At any point in time, harvest is a function of fishing effort and size of the fish
stock. For any given population size higher the effort, larger the harvest. At any given level
of effort, the larger the population size is, the larger is the harvest (Anderson, 1986). As
discussed earlier, when harvesting is introduced to a virgin fish stock, the size of the stock
decreases and a new equilibrium stock level is reached at a level below the environmental
carrying capacity level. Since the catch varies with the level of effort a different
equilibrium population will result at each level of effort. And as shown in the previous
section long term stock size and sustainable yield becomes only a function of effort.
In fisheries economics input is Fishing Effort which may be considered as an
intermediate product that requires input of labour capital and investment. If c is the unit
cost for each unit of effort3 (E), the total cost in the fishery may be defined as
cEETC =)( (15)
And assuming a constant price for all the harvest, the total revenue from the
fishery would be unit price (p) multiplied by the total harvest (H).
)()( EpHETR = (16)
3 Fishing effort may be measured in different units. The unit of choice is based on the type of fishery. For trawling, time trawled may be used, for pot or gillnet soak time may be the best unit to measure the effort. But in most of the cases number of fishing trips may be the only available measure of effort.
- 16 -
While assuming the unit cost of effort (c) also to include opportunity costs, the
revenue exceeding what is need to cover the cost TC, is the resource rent (π):
)()()( ETCETRE −=π (17)
3.2.1. Open Access Equilibrium (OAE)
If the fishery follows basic economic laws, fishers would continue to enter the
fishery until there is no supernormal profit (resource rent, in fisheries terms) to earn from
the fishery. In other words fishers would continue enter the fishery until their average
revenue levels with their marginal cost of effort. Assuming fishing homogenous fleet and
all input factors have the same opportunity costs, the situation of open access may be
defined as follows in equilibrium
cEEHpETC
EETRETC
EETR
=⇒=⇒=−)()(')(0)(')( (18)
Substituting the harvest equations (Equation (8) for Schaefer model, equation (12)
for Fox model) for harvest, (H) in equation (18) and solving the equation to effort (E), we
may find the effort level at which the fishery would stabilise if a fishery is unregulated.
Table 1: Formulae to calculate open access equilibrium effort level
Open Access Equilibrium: AR = MC
Schaefer KqrqK
pcEOA 2⋅⎟⎟
⎠
⎞⎜⎜⎝
⎛−=
Fox qpcqKEOA
µ⋅⎟⎟⎠
⎞⎜⎜⎝
⎛⎟⎟⎠
⎞⎜⎜⎝
⎛−= lnln
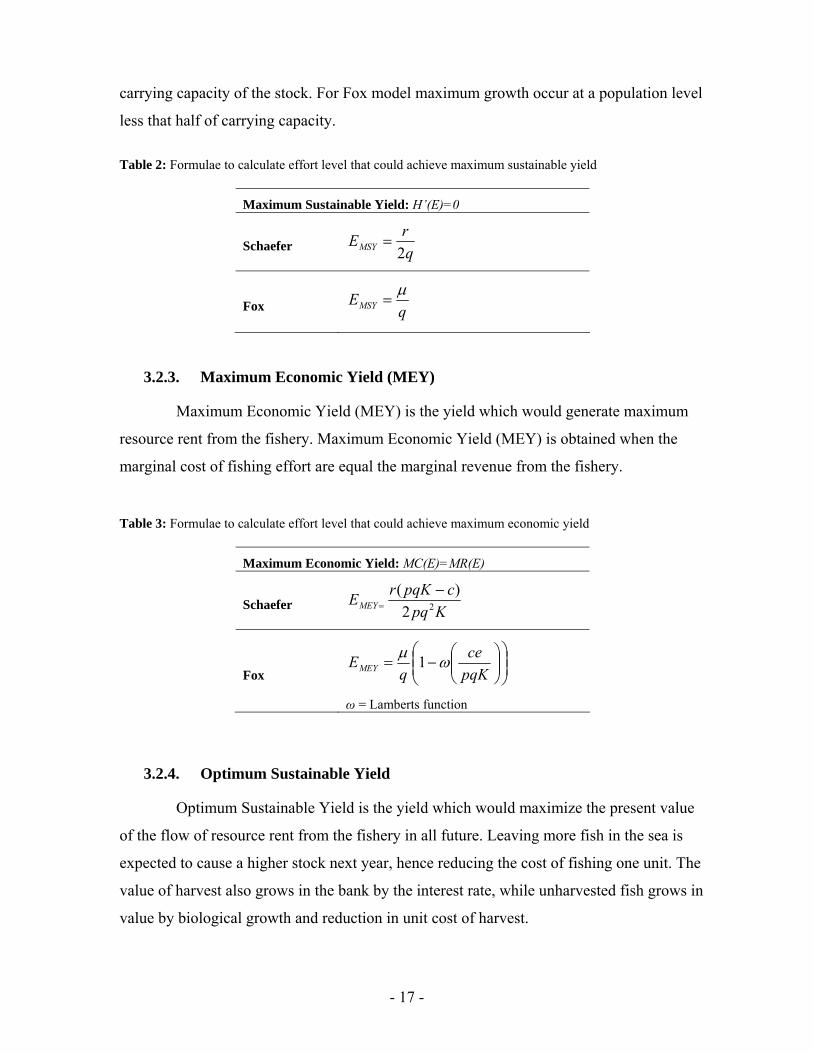
3.2.2. Maximum sustainable Yield (MSY)
Maximum sustainable yield (MSY) is the largest yield that can be sustained for
indefinite period of time. This occurs at the point where the natural annual net growth of
the fish stock is maximised. For Schaefer model maximum growth exactly at half of the
- 17 -
carrying capacity of the stock. For Fox model maximum growth occur at a population level
less that half of carrying capacity.
Table 2: Formulae to calculate effort level that could achieve maximum sustainable yield
Maximum Sustainable Yield: H’(E)=0
Schaefer qrEMSY 2
=
Fox qEMSY
µ=
3.2.3. Maximum Economic Yield (MEY)
Maximum Economic Yield (MEY) is the yield which would generate maximum
resource rent from the fishery. Maximum Economic Yield (MEY) is obtained when the
marginal cost of fishing effort are equal the marginal revenue from the fishery.
Table 3: Formulae to calculate effort level that could achieve maximum economic yield
Maximum Economic Yield: MC(E)=MR(E)
Schaefer KpqcpqKrEMEY 22)( −
=
Fox ⎟⎟⎠
⎞⎜⎜⎝
⎛⎟⎟⎠
⎞⎜⎜⎝
⎛−=
pqKce
qEMEY ωµ 1
ω = Lamberts function
3.2.4. Optimum Sustainable Yield
Optimum Sustainable Yield is the yield which would maximize the present value
of the flow of resource rent from the fishery in all future. Leaving more fish in the sea is
expected to cause a higher stock next year, hence reducing the cost of fishing one unit. The
value of harvest also grows in the bank by the interest rate, while unharvested fish grows in
value by biological growth and reduction in unit cost of harvest.
- 18 -
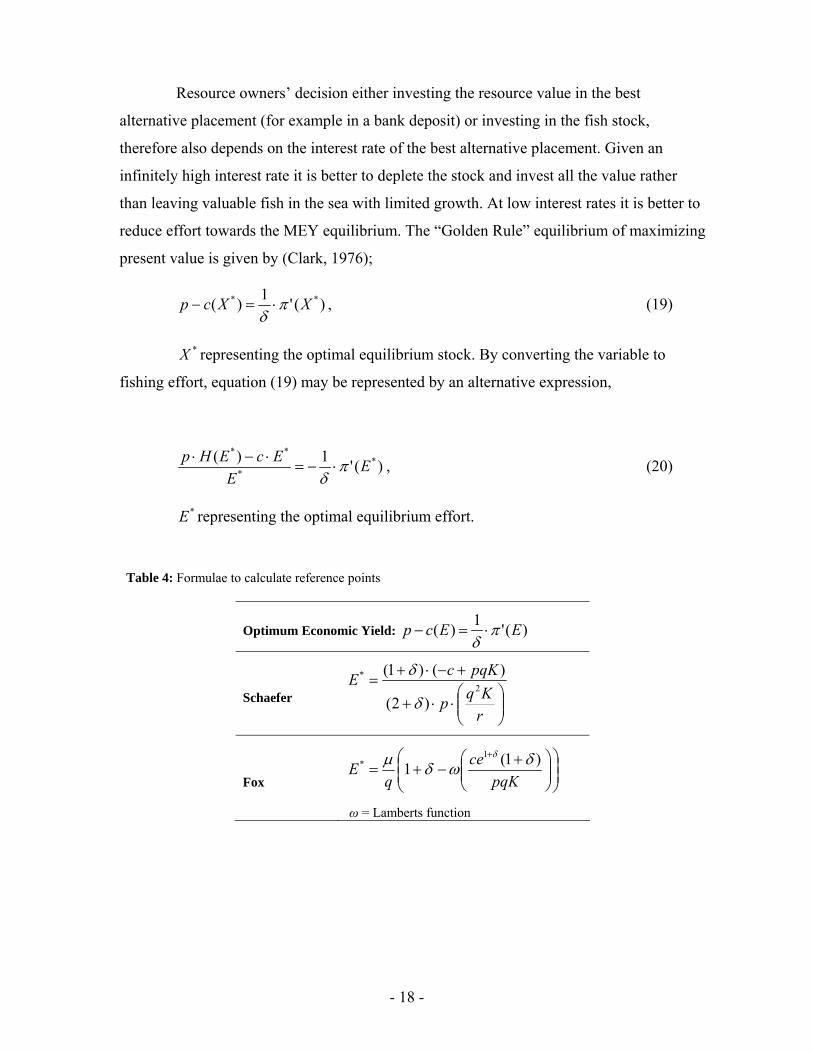
Resource owners’ decision either investing the resource value in the best
alternative placement (for example in a bank deposit) or investing in the fish stock,
therefore also depends on the interest rate of the best alternative placement. Given an
infinitely high interest rate it is better to deplete the stock and invest all the value rather
than leaving valuable fish in the sea with limited growth. At low interest rates it is better to
reduce effort towards the MEY equilibrium. The “Golden Rule” equilibrium of maximizing
present value is given by (Clark, 1976);
)('1)( ** XXcp πδ⋅=− , (19)
*X representing the optimal equilibrium stock. By converting the variable to
fishing effort, equation (19) may be represented by an alternative expression,
)('1)( **
**
EE
EcEHp πδ⋅−=
⋅−⋅ , (20)
*E representing the optimal equilibrium effort.
Table 4: Formulae to calculate reference points
Optimum Economic Yield: )('1)( EEcp πδ⋅=−
Schaefer ⎟⎟⎠
⎞⎜⎜⎝
⎛⋅⋅+
+−⋅+=
rKqp
pqKcE2
*
)2(
)()1(
δ
δ
Fox ⎟⎟⎠
⎞⎜⎜⎝
⎛⎟⎟⎠
⎞⎜⎜⎝
⎛ +−+=
+
pqKce
qE )1(1
1* δωδµ δ
ω = Lamberts function
- 19 -
4. DATA AND PARAMETER ESTIMATION
Catch and effort data are from Statistical Yearbooks of Maldives (MPND, 2005a),
(MPND, 2005b), (MPND, 2006). In the Statistical Yearbooks effort is given in number of
fishing trips per year. Catch and effort data is given separately for mechanised bait boats,
sailing (non-mechanised) bait boats, trolling, and rowing vessels. Catch by mechanised
boats was so dominant for the time period data is available, that catch by other categories
of vessels in this fishery in negligible. By 1990 there were hardly any non-mechanised bait
boats in the skipjack tuna fishery. For trolling and rowing vessels, skipjack tuna is not a
target species. Therefore only Skipjack catch and fishing trips made by the mechanised bait
boats is used in the parameter estimations.
Although the large majority of mechanised boats are specialised in pole and line
skipjack tuna fishing, there are several boats specialised for yellowfin tuna fishing in this
category. Since the number of vessels engaged in yellowfin tuna fishery is not documented
separately, fishing trips made by mechanised boats also includes trips targeting yellowfin
tuna. As yellowfin and skipjack of similar sizes often form mixed schools catch by
mechanised boats may be a mix of yellowfin and skipjack. National statistics shows in
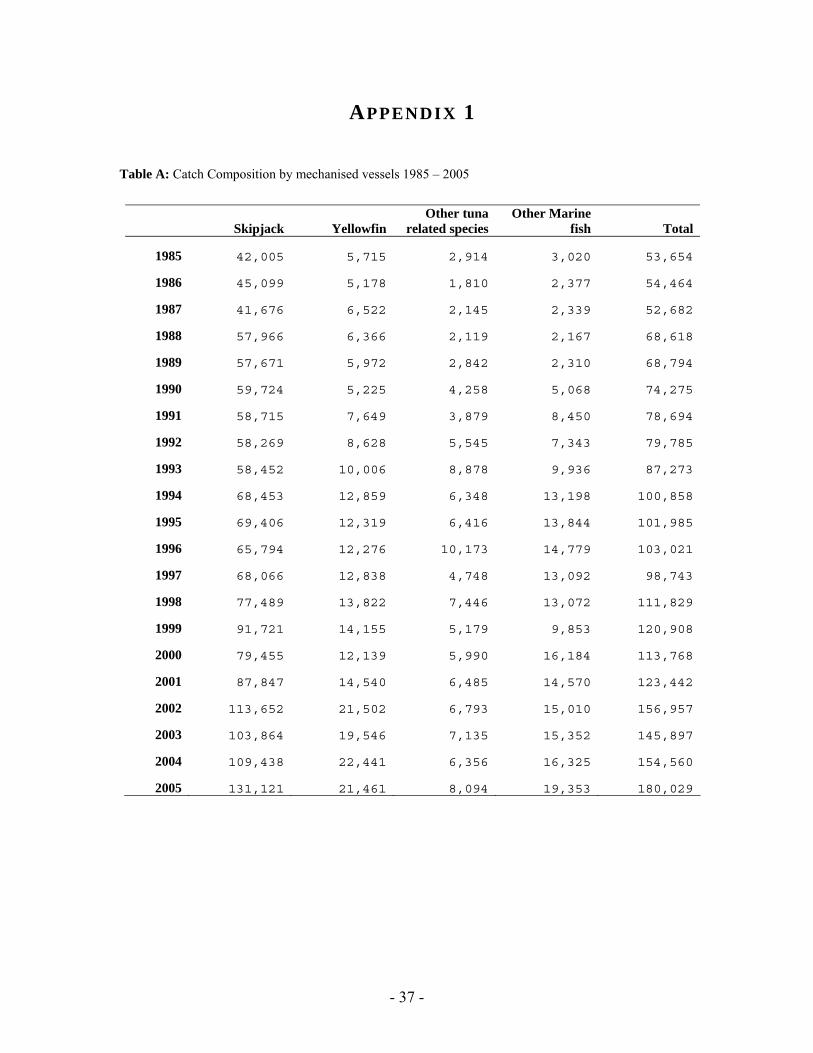
recent years about 70% of the catch by mechanised boats is skipjack, 12% is yellowfin and
the rest is other tuna related species. (Catch compositions of mechanised boats are given in
Appendix 1.)
Similar sizes of yellowfin and skipjack do not differ much in price. But the GG
category of Yellowfin (Yellowfin above 12kg, instantly killed, bled, gutted, gilled and
chilled on board) of good quality can get a much higher price than skipjack. Composition
of other species in the mechanised bait boats catch becomes significant when calculating
the revenue from the fishery, because they generate revenue and contribute to cover the
cost. Although there are prices differences between species and markets, purchase price by
the government company is the only available documented price in a time series. For this
reasons in the parameter estimations it was assumed a constant price for the harvest of
mechanised boats, which is the skipjack purchase price by companies.
- 20 -
4.1. Standardising Catch and Effort Data
Catch and effort data is aggregated for each year; catch in metric tonnes and effort
in total number of fishing trips. Catch data was categorised by type of vessels and species.
Over the years technological developments has significantly changed the fishing
power of the vessels. Also even in one year there could be significant difference in fishing
power between vessels of different sizes. Therefore to compare the effort of different years
and different sizes of vessels it is necessary standardise the effort to one standard vessel. To
standardise the fishing effort 2005 is taken as the base year.
Engine power is a factor reflecting many components of the effort that potentially
could change the efficiency. In general highly powered engines are used in bigger vessels.
Following factors increase fishing efficiency of larger vessels with higher engine power.
1. Larger engines give higher speed, allowing them to cover larger areas
searching for fish.
2. Bigger vessels can carry more bait and with larger bait wells bait stay alive
for a longer period of time allowing bigger vessels to search larger areas
without returning for more bait.
3. Bigger boats also have more people on board and use more poles to catch
fish, enabling these vessels to load more fish in shorter time.
4. With bigger storage bigger vessels can carry more fish per trip.
Since the catch and effort data was not categorised by the size of vessel or engine
power, average motor size in horsepower4 has been calculated. To standardise the fishing
trips for all the years, the percentage change in engine power has been used, 2005 being the
base year.
In the second step of standardising effort, has to be scaled to a standard vessel of
the year 2005. This is because all the prices and costs used in calculations are based on the
year 2005.
4 Engine horsepower for fishing vessels are not available from any official publication. These averages are calculated from an unofficial registry data base recorded by the Ministry of Transport and Civil Aviation.
- 21 -
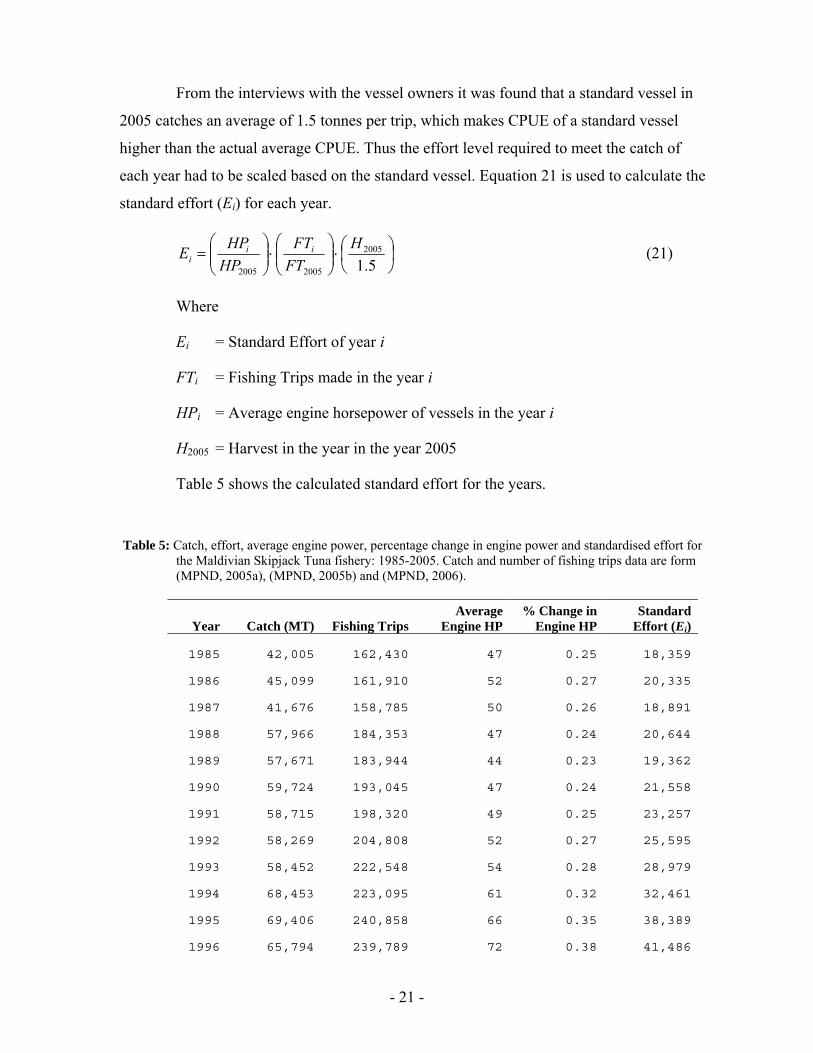
From the interviews with the vessel owners it was found that a standard vessel in
2005 catches an average of 1.5 tonnes per trip, which makes CPUE of a standard vessel
higher than the actual average CPUE. Thus the effort level required to meet the catch of
each year had to be scaled based on the standard vessel. Equation 21 is used to calculate the
standard effort (Ei) for each year.
⎟⎠⎞
⎜⎝⎛⋅⎟⎟
⎠
⎞⎜⎜⎝
⎛⋅⎟⎟⎠
⎞⎜⎜⎝
⎛=
5.12005
20052005
HFT
FTHPHPE ii
i (21)
Where
Ei = Standard Effort of year i
FTi = Fishing Trips made in the year i
HPi = Average engine horsepower of vessels in the year i
H2005 = Harvest in the year in the year 2005
Table 5 shows the calculated standard effort for the years.
Table 5: Catch, effort, average engine power, percentage change in engine power and standardised effort for
the Maldivian Skipjack Tuna fishery: 1985-2005. Catch and number of fishing trips data are form (MPND, 2005a), (MPND, 2005b) and (MPND, 2006).
Year Catch (MT) Fishing Trips
Average Engine HP
% Change in Engine HP
Standard Effort (Ei)
1985
42,005 162,430 47
0.25 18,359
1986
45,099 161,910 52
0.27 20,335
1987
41,676 158,785 50
0.26 18,891
1988
57,966 184,353 47
0.24 20,644
1989
57,671 183,944 44
0.23 19,362
1990
59,724 193,045 47
0.24 21,558
1991
58,715 198,320 49
0.25 23,257
1992
58,269 204,808 52
0.27 25,595
1993
58,452 222,548 54
0.28 28,979
1994
68,453 223,095 61
0.32 32,461
1995
69,406 240,858 66
0.35 38,389
1996
65,794 239,789 72
0.38 41,486
- 22 -
Year Catch (MT) Fishing Trips
Average Engine HP
% Change in Engine HP
Standard Effort (Ei)
1997
68,066 237,661 81
0.42 46,136
1998
77,489 224,751 91
0.47 48,844
1999
91,721 210,816 105
0.55 53,260
2000
79,455 202,195 123
0.64 59,584
2001
87,847 205,897 141
0.73 69,391
2002
113,652 209,839 156
0.81 78,551
2003
103,864 208,471 164
0.85 82,008
2004
109,438 213,656 176
0.92 90,079
2005
131,121 189,941 192
1.00 87,414
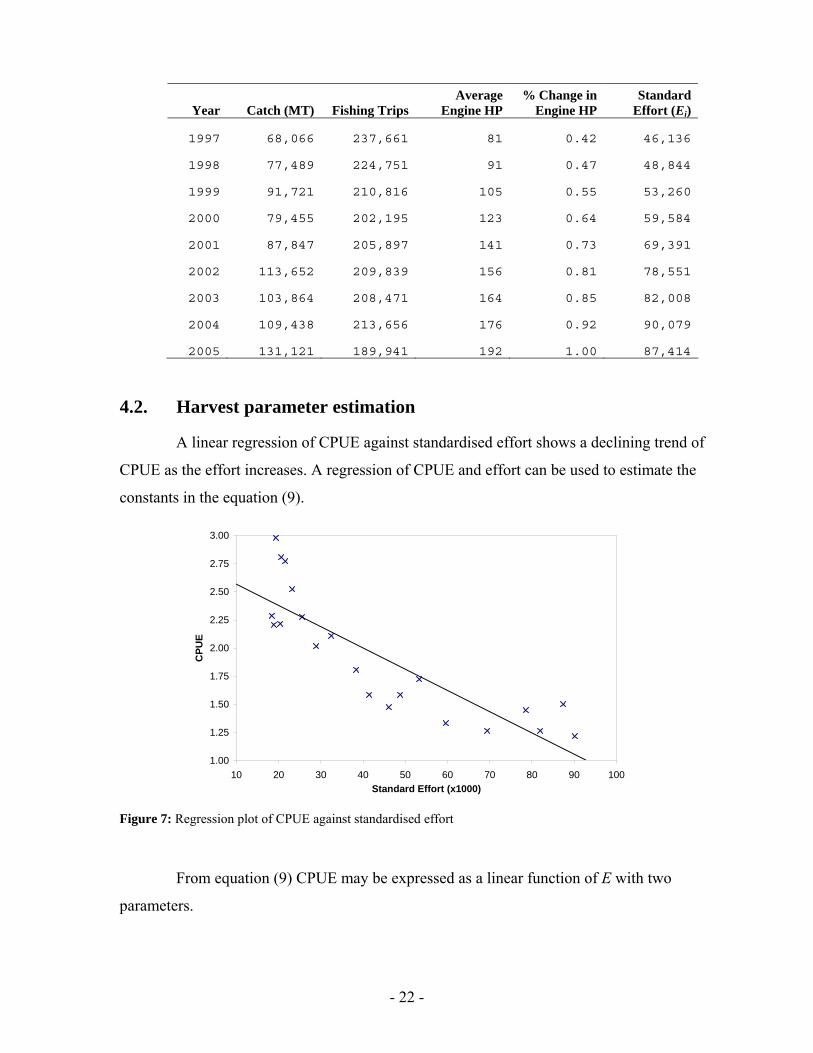
4.2. Harvest parameter estimation
A linear regression of CPUE against standardised effort shows a declining trend of
CPUE as the effort increases. A regression of CPUE and effort can be used to estimate the
constants in the equation (9).
1.00
1.25
1.50
1.75
2.00
2.25
2.50
2.75
3.00
10 20 30 40 50 60 70 80 90 100Standard Effort (x1000)
CPU
E
Figure 7: Regression plot of CPUE against standardised effort
From equation (9) CPUE may be expressed as a linear function of E with two
parameters.
- 23 -
ECPUEErKqqKCPUE 21
2
αα +=⇒−= (22)
where α1=qK and is the intercept of the line, and α2= –q2K/r and is the slope of the
line. Estimated parameter values for the constants α1 and α2 were obtained by linear
regression and are presented in Table 6.
Table 6: Parameters estimated for Schaefer model by linear regression using standardised effort and CPUE
data from 1985-2005
Parameters Coefficients Standard Error t Stat P-value Intercept (α1) 2.75631948 0.133028 20.71977 1.67 E-14
Slope (α2) -1.8908 E-05 2.65 E-06 -7.14202 8.66 E-07
Adjusted R Square 0.71432024
In the regression analysis adjusted R2 of 0.7 indicates that 70% of the CPUE
variation is explained by this model.
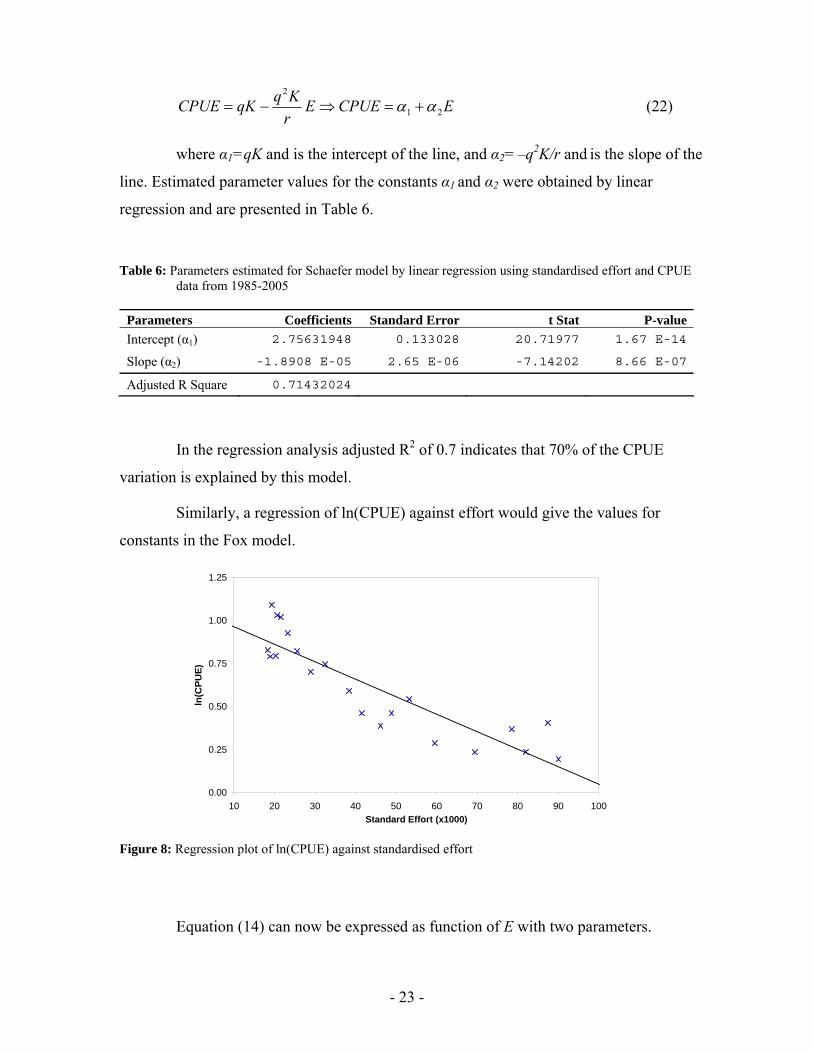
Similarly, a regression of ln(CPUE) against effort would give the values for
constants in the Fox model.
0.00
0.25
0.50
0.75
1.00
1.25
10 20 30 40 50 60 70 80 90 100Standard Effort (x1000)
ln(C
PUE)
Figure 8: Regression plot of ln(CPUE) against standardised effort
Equation (14) can now be expressed as function of E with two parameters.
- 24 -
ECPUEEqqKCPUE 21)ln()ln()ln( ββµ
+=⇒−= (23)
where β1=ln(qK) and β2= –q/µ.
Since )ln(1 qK=β and 1βeqK = equation (12) may be written as follows
)( 21.),( EeEXEH ββ += (24)
Estimated parameter vales for β1 and β2 were obtained by log-linear regression and
are presented in Table 7.
Table 7: Parameters estimated for Fox model by linear regression using standardised effort and ln(CPUE)
data from 1985-2005
Parameters Coefficients Standard Error t Stat P-value Intercept (β1) 1.06352341 0.060879 17.46939 3.67 E-13Slope (β2) -1.0169 E-05 1.21 E-06 -8.39382 8.15 E-08Adjusted R Square 0.77642681
In this model adjusted R2 value of 0.77 indicates that 77% of the variation in the
CPUE is explained by this model.
4.3. Economic parameters
Reference points for management are calculated on the basis of 2005 data.
Towards the end of 2005 purchasing price of fisheries companies were fluctuating around
Mrf 3.80 – Mrf 4.50 per kilogram of skipjack (corresponding to about US$ 300 – 350 per
tonne)5. However, depending on the supply price at local consumer market and auction
price in islands markets may be higher than companies’ price. Since no documented data is
available on consumer market price and auction price, in this analysis a unit price of
harvest (p) is assumed to be US$ 350. And in the revenue calculation it was assumed that a
standard vessel catches 1.5 tonnes per trip.
5 Exchange rate is Mrf12.80 = US$1
- 25 -
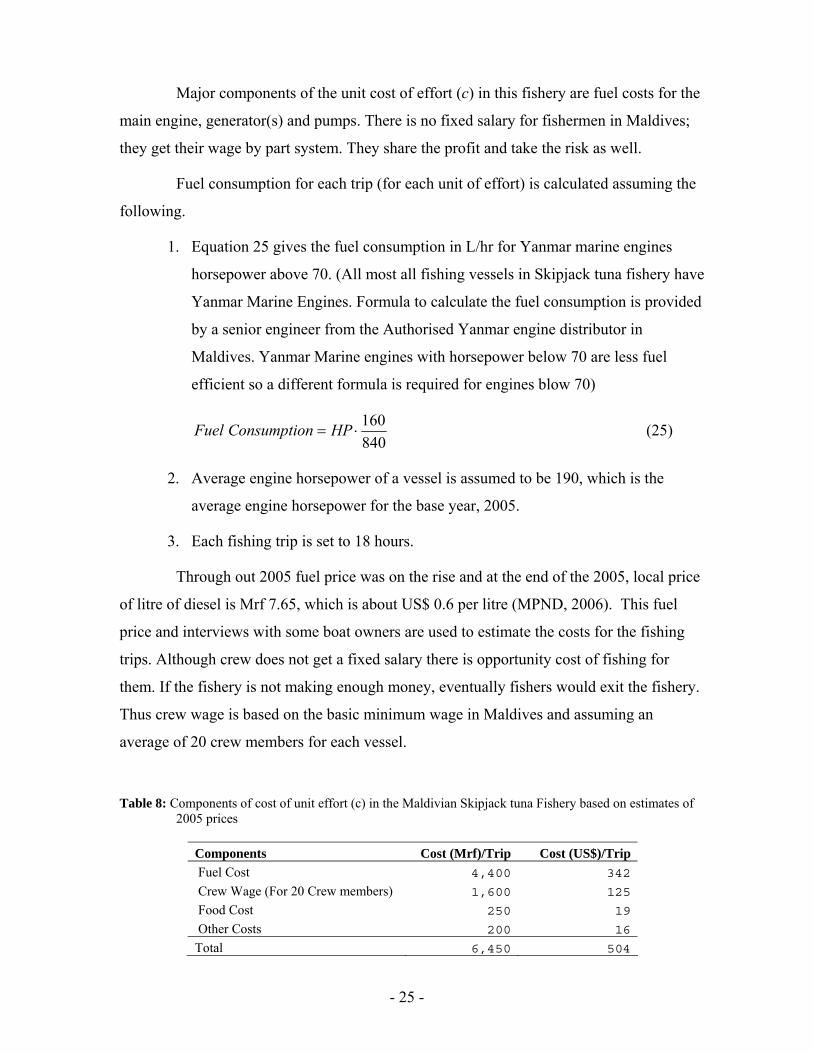
Major components of the unit cost of effort (c) in this fishery are fuel costs for the
main engine, generator(s) and pumps. There is no fixed salary for fishermen in Maldives;
they get their wage by part system. They share the profit and take the risk as well.
Fuel consumption for each trip (for each unit of effort) is calculated assuming the
following.
1. Equation 25 gives the fuel consumption in L/hr for Yanmar marine engines
horsepower above 70. (All most all fishing vessels in Skipjack tuna fishery have
Yanmar Marine Engines. Formula to calculate the fuel consumption is provided
by a senior engineer from the Authorised Yanmar engine distributor in
Maldives. Yanmar Marine engines with horsepower below 70 are less fuel
efficient so a different formula is required for engines blow 70)
840160⋅= HPnConsumptioFuel (25)
2. Average engine horsepower of a vessel is assumed to be 190, which is the
average engine horsepower for the base year, 2005.
3. Each fishing trip is set to 18 hours.
Through out 2005 fuel price was on the rise and at the end of the 2005, local price
of litre of diesel is Mrf 7.65, which is about US$ 0.6 per litre (MPND, 2006). This fuel
price and interviews with some boat owners are used to estimate the costs for the fishing
trips. Although crew does not get a fixed salary there is opportunity cost of fishing for
them. If the fishery is not making enough money, eventually fishers would exit the fishery.
Thus crew wage is based on the basic minimum wage in Maldives and assuming an
average of 20 crew members for each vessel.
Table 8: Components of cost of unit effort (c) in the Maldivian Skipjack tuna Fishery based on estimates of
2005 prices
Components Cost (Mrf)/Trip Cost (US$)/Trip Fuel Cost 4,400 342
Crew Wage (For 20 Crew members) 1,600 125
Food Cost 250 19
Other Costs 200 16
Total 6,450 504
- 26 -
Table 8 shows cost estimates of different cost components and the unit cost of
fishing effort. In the calculations of economic parameters unit cost of effort (c) is assumed
to be US$ 500.
To estimate the OSY interest rate of 3% was assumed. This is based on the saving
deposit rate by the commercial banks in the Maldives. OSY based on interest rate of 10% is
also calculated to show what might happen in case of an increase in interest rate.
- 27 -
5. RESULTS
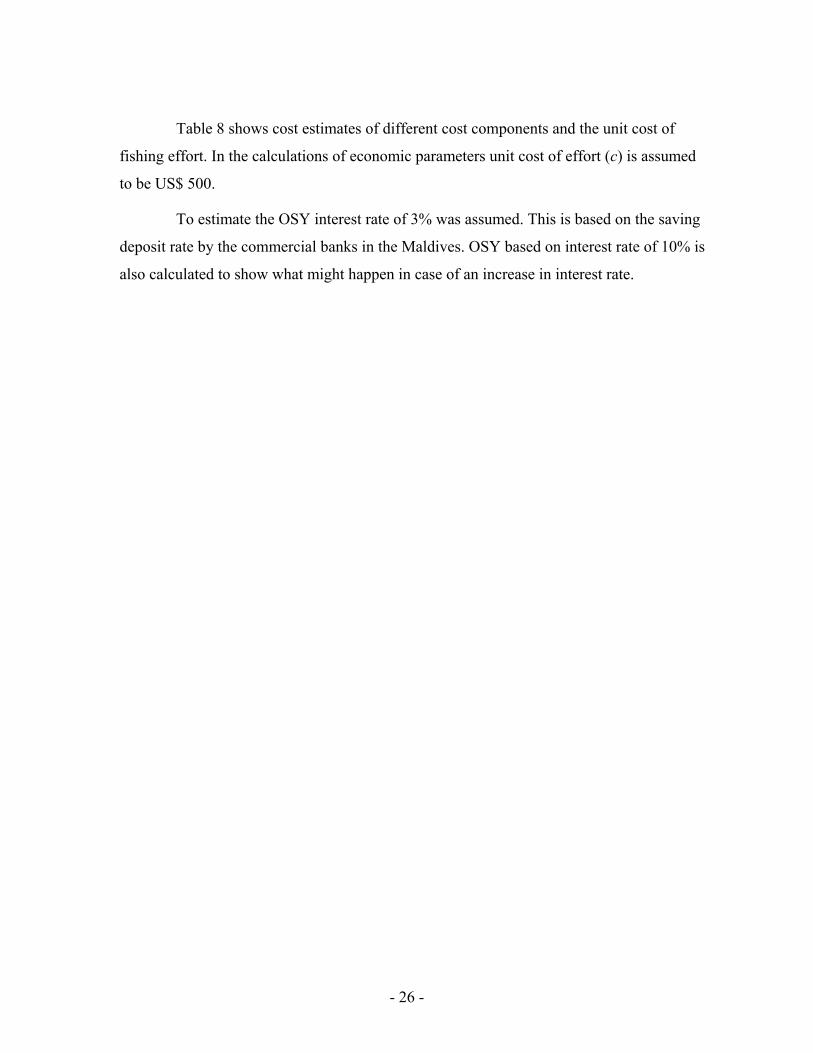
The figure 9 shows the harvest curves constructed for Schafer and Fox model
using the calculated parameters for the Maldivian skipjack tuna fishery. Along with the
harvest curves actual harvest from the historical catch data is also shown in the figure. This
figure shows the consistency of the prediction based on the standard effort applied.
-
20
40
60
80
100
120
140
- 20 40 60 80 100 120 140
Standard Effort (x1000)
Har
vest
(x10
00 T
onne
s)
Figure 9: Harvest curves for Maldivian skipjack Tuna fishery for Schaefer and Fox model, along with actual
harvest from 1985 to 2005.
Figure 9 shows that there is not much difference between MSY prediction by
Schaefer model and Fox model. This is confirmed by the calculations presented in the table
9. This figure also indicates that in recent years catch levels are outside the sustainable
levels.
5.1. Reference points
To calculate the reference points, equations were simplified by replacing the
constants with α and β calculated by the regression analysis. Simplifications for all the
reference points are shown in Appendix 2.
- 28 -
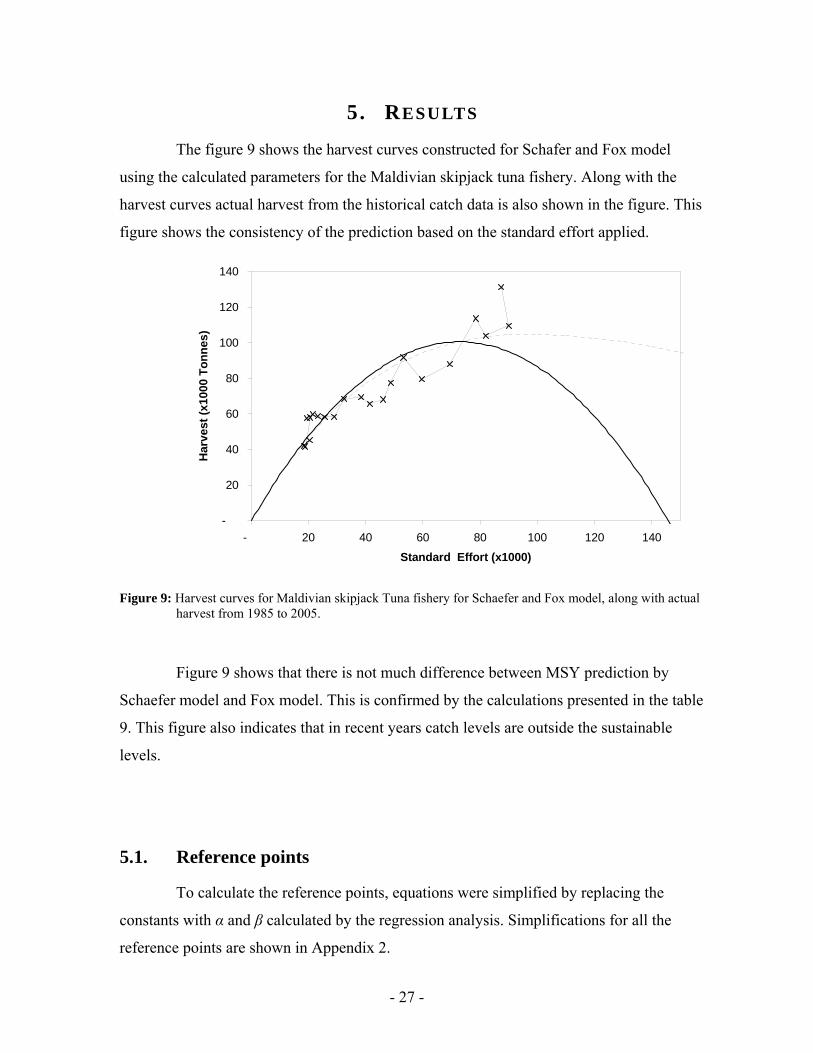
Table 9: Calculated reference points
Reference Points Effort Harvest
Schaefer 35,112 73,469Maximum Economic Yield
Fox 31,514 66,253
Schaefer 35,631 74,205Optimum Sustainable Yield (δ =0.03)
Fox 31,747 66,585
Schaefer 36,631 75,805Optimum Sustainable Yield (δ =0.10)
Fox 32,973 68,300
Schaefer 70,223 100,319Open Access Equilibrium
Fox 69,507 99,296
Schaefer 72,889 100,453Maximum Sustainable Yield
Fox 98,334 104,783
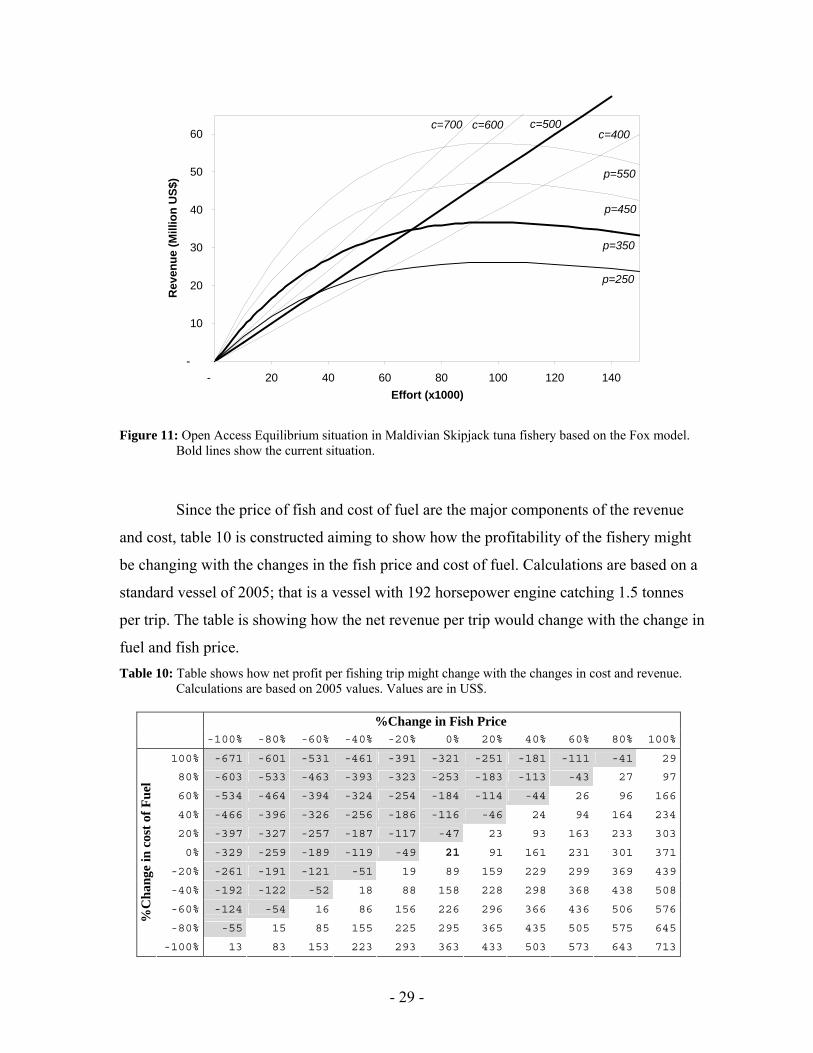
In recent years price of fish and fuel has been fluctuating a lot. These fluctuations
are causing the cost and venue changes to the fishery. Figures 10 and 11 shows how the
open access equilibrium points might change with the changes in revenue and cost.
p=350
c=500
p=250
p=450
p=550
c=400c=600c=700
-
10
20
30
40
50
60
- 20 40 60 80 100 120 140
Effort (x1000)
Rev
enue
(Mill
ion
US$
)
Figure 10: Open Access Equilibrium situation in Maldivian Skipjack tuna fishery based on the Schaefer
model. Bold lines show the current situation.
- 29 -
p=350
c=500
p=250
p=450
p=550
c=400c=600c=700
-
10
20
30
40
50
60
- 20 40 60 80 100 120 140Effort (x1000)
Rev
enue
(Mill
ion
US$
)
Figure 11: Open Access Equilibrium situation in Maldivian Skipjack tuna fishery based on the Fox model. Bold lines show the current situation.
Since the price of fish and cost of fuel are the major components of the revenue
and cost, table 10 is constructed aiming to show how the profitability of the fishery might
be changing with the changes in the fish price and cost of fuel. Calculations are based on a
standard vessel of 2005; that is a vessel with 192 horsepower engine catching 1.5 tonnes
per trip. The table is showing how the net revenue per trip would change with the change in
fuel and fish price. Table 10: Table shows how net profit per fishing trip might change with the changes in cost and revenue.
Calculations are based on 2005 values. Values are in US$.
%Change in Fish Price
-100% -80% -60% -40% -20% 0% 20% 40% 60% 80% 100%
100% -671 -601 -531 -461 -391 -321 -251 -181 -111 -41 29
80% -603 -533 -463 -393 -323 -253 -183 -113 -43 27 97
60% -534 -464 -394 -324 -254 -184 -114 -44 26 96 166
40% -466 -396 -326 -256 -186 -116 -46 24 94 164 234
20% -397 -327 -257 -187 -117 -47 23 93 163 233 303
0% -329 -259 -189 -119 -49 21 91 161 231 301 371
-20% -261 -191 -121 -51 19 89 159 229 299 369 439
-40% -192 -122 -52 18 88 158 228 298 368 438 508
-60% -124 -54 16 86 156 226 296 366 436 506 576
-80% -55 15 85 155 225 295 365 435 505 575 645
%C
hang
e in
cos
t of F
uel
-100% 13 83 153 223 293 363 433 503 573 643 713

- 30 -
- 31 -
6. DISCUSSION AND CONCLUSION
The regression results show that the both Schaefer and Gompertz/Fox models aim
to explain most of the variation found in the empirical data. The Fox model seems to give a
slightly better fit than what is found in the Schafer model, indicated by the higher adjusted
R square of the Fox model (0.77 versus 0.71 for Schafer model). Plot of CPUE towards
effort (Figure 7) indicates that the linear model (CPUE vs. Effort) possibly introduces a
systematic error, as a curved, non-linear CPUE-effort relationship is indicated by the
empirical data. The Fox model offers a log-linear relationship which gives a better fit, but a
certain systematic error seems to maintain. A Richard’s type of model (also referred to as
the Pella-Tomlinson model) introduce a parameter allowing both convex and concave the
CPUE-effort relationship (e.g. squeezing the MSY-level to the left or right of the two
models applied in this study). Introducing yet another parameter on the other hand also
increases estimation error in the model. Given the limited data available, the alternative of
introducing the Richard model was rejected.
Based on the analysis catch and effort level of the last few years are out of the
sustainable harvest curve and catch level should be coming down. Open access equilibrium
effort level (EOA) is situated in the same area in both models, around 70,000 standard effort
units. This level of effort was passed already in 2002 and the effort still increases. Both
models also show EOA to be below the EMSY level, though not too far from EMSY. Revenue
and cost being the factor that moves EOA along the equilibrium harvest curve, future
changes in fuel and fish price would determine if this fishery will be stabilising at MSY or
below it.
The actual EAO might however be higher than the estimated because Maldivian
fishers do not have a fixed salary; they share the profit and also the risk. In islands where
opportunities for alternative employments are low, fishers would produce a higher effort in
open access because of the lower opportunity cost of labour.
The current effort level is beyond the maximum sustainable yield effort level
(EMSY) as estimated by the Schaefer model. The Fox model indicates that this fishery is yet
to reach its EMSY.
- 32 -
New generation of vessels coming into this fishery are larger and more fuel
consuming. These vessels are also designed for multi-day fisheries and have better bait
holding capacities. Increased efficiency of these vessels may in fact increase the revenue
and may move the position of EOA to a higher effort level, in spite of the increased fuel
cost. For the last few years catch has continued to be above the equilibrium levels
estimated by the models of this study (Figure 9). This may indicate improved fishing
efficiency or simply reflecting the fact that an equilibrium level is not obtained.
In the calculations the skipjack tuna purchasing price by the government company
is assumed to represent the average price per unit of harvest, being the only documented
price available over time. As mentioned earlier the GG category of yellowfin tuna reaches
much higher prices, almost three times higher than for skipjack. Most of the local
consumers and cottage industry for Maldive Fish also often pay a higher price than the
companies.
Export of GG yellowfin tuna to Japanese and European market started in the late
90s. Some of the mechanised vessels in skipjack tuna fishery moved over to the yellowfin
fishery and many new vessels joined this fishery; the fishery is still developing rapidly.
Increased export of Maldive Fish starting from the year 2000 led to an expansion in the
cottage industry for the Maldives fish. This expansion increased the demand for skipjack
tuna consequently increasing the average price of skipjack tuna in the local market. These
observations suggest that most likely revenue from the fishery may be underestimated.
OSY of this fishery at the interest rate of 3% was estimated to be around 74,000
tonnes per year, which is not too far from the MEY. An increase in interest rate would
move OSY towards OA equilibrium. As for now this fishery is an open access fishery, each
individual fishers’ aim is to maximise his immediate gain. Moreover, most of the fishers
are poor and their income from fishery hardly meets their daily needs. For this reasons for
Maldivian fishers there is little incentive to try to achieve OSY or even MEY.
In the last report of the Scientific Committee of IOTC they stated that “No
quantitative stock assessment is currently available for skipjack tuna in the Indian Ocean.
The range of stock indicators available to the Scientific Committee do not signal that there
are any problems in the fishery currently”, and their management advice is “there is no
need for immediate concern about the status of skipjack tuna” (IOTC, 2006b). Their advice
- 33 -
is mainly based on the trend that is observed in many fisheries, declining catch with the
increasing effort, has not been seen in the Indian Ocean skipjack tuna fishery.
This analysis indicates that with the current prices and costs Maldivian skipjack
tuna fishery may not be biologically overfished. High cost of effort is preventing the
fishery from moving beyond the effort of MSY. At the moment, increasing cost of effort
seems to be the main concern in this fishery. If the current trend of increasing fishing cost
continues, and if not balanced by an increase in revenue by increasing the price of catch
efficiency, very soon the whole skipjack tuna fishing industry may face an economic
collapse and consequently a reduced effort. Increased efficiency of vessels and price
increase may radically alter this conclusion.
A critical assumption in the models presented here is that subjected Skipjack tuna
stock is exploited solely by Maldivian fishers. This assumption is based on the growing
evidence that skipjack tuna is less migratory than most of the other tuna species. Tagging
experiments carried out in Maldives during the 90s’ show that Maldivian species to a very
low degree migrate to other areas (Shiham Adam & Sibert, 2002). Large scale tagging
experiment covering the whole Indian Ocean and Maldives are however needed to indicate
the level of migration from other areas to Maldives. Such study is now being conducted by
Indian Ocean Tuna Commission (IOTC), but it may still be a few years until the result of
this study is available (IOTC, 2006b).
Determining the boundaries of this skipjack tuna stock is going to be the key to the
management and stock assessment. If this stock turned out to be a shared stock, use of FAD
by purse seines in the West Indian Ocean could be having a potential effect on the
Maldivian bait boat fishery. Even though there is little emigration from Maldivian waters to
the rest of the Indian Ocean, recruitment for Maldivian skipjack tuna may take elsewhere in
the West Indian Ocean.
By each technological improvement, from the traditional sailing vessels to
mechanised vessels in 70s, introduction of global positioning devices in 90s and then to
new generation of bigger vessels capable of multi-day fisheries, Maldivian fishers have
been increasing their range of searching for fish. By doing so they are exposed to larger
biomasses, which may be regarded as an increased fish stock. At this point the boundaries
of the stock are not known, question remains to be answered. However if an increased
- 34 -
stock size (if there is any increase) is found to be due to an increase in search area, being
due to technological advances, the conclusions presented here may have to be dramatically
altered.
In Maldivian tuna fishery it may not be entirely correct to define short term
harvest as just a function of effort and stock size. Availability of bait is another extra
component that largely determines the harvest in bait boat fishery. No matter what the
stock size or effort level is, there won’t be any harvest without bait in this fishery. As the
abundance of bait shows seasonal fluctuations, during the seasons when bait abundance is
low fishermen spends longer time searching and harvesting bait, effectively increasing their
fishing effort.
Major finding from this analysis is that the fishery may not be biologically over
exploited due to the high cost of effort. The study also indicates that effort level could be
coming down in future. It is good news that fishery may not be over exploited easily.
However, reduction of effort level could means loosing the only option of livelihood for
many fishermen in the islands. Given that a high employment is the main objective, the
immediate problem to address in this fishery seems to be reduction of cost of effort. The
same goes to maximising sustainable yield, while resource rent could not be maximising
could not be obtained without significant effort reduction.
- 35 -
REFERENCE
Anderson, L.G. (1986) The Economics of Fisheries Management, Revised and Enlarged edition in edited by The John Hopkins University Press, Baltomore and London.
Anon (2003) 25 Years of Canning in edited by Felivaru Tuna Processing Plant, Felivaru, Maldives.
Clark, C.W. (1976) Mathematical Bioeconomics: The Optimal Management of Renewable Resources in edited by John Wiley & Sons, New York.
Coad, B.W. (1995) Encyclopedia of Canadian fishes.. Canadian Museum of Nature and Canadian Sportfishing in edited by Productions Inc. , Singapore.
Collette, B.B. & Nauen, C.E. (1983) FAO species catalogue. Vol. 2. Scombrids of the world. An annotated and illustrated catalogue of tunas, mackerels, bonitos and related species known to date. FAO species catalogue in edited by FAO Fish.
Fox, W.W. (1970) An Exponential Surplus-Yield Model for Optimizing Exploited Fish Populations. Transactions of the American Fisheries Society, 90, 80-88.
IOTC (2006a) Nominal Catch Data 1950 - 2005.
IOTC (2006b). Report of the Ninth Session of the Scientific Committee of the IOTC. Indian Ocean Tuna Commission, Victoria, Seychelles.
Josupeit, H. (2006) Global World Tuna Markets. In Infofish Tuna Conference, Bangkok, Thailand.
MPND (2005a). 25 Years of Statistics, Maldives. Ministry of Planning and National Development, Male'.
MPND (2005b). Statistical Yearbook of Maldives 2005. Ministry of Planning and National Development, Male'.
MPND (2006). Statistical Yearbook of Maldives 2006. Ministry of Planning and National Development, Male'.
Schaefer, M.B. (1954) Some aspects of the Dynamics of Populations Important to the Management of the Commercial Marine Fisheries. Bulletin of Inter-American Tuna Commission, 1, 27 - 56.
Schaefer, M.B. (1957) Some Considerations of Population Dynamics and Economics in Relation to the Management of the Commercial Marine Fisheries. Journal of Fisheries Research Board of Canada, 14, 669 - 681.
Shiham Adam, M. (2004). Country Review: Maldives. In Review of the state of world marine capture fisheries management: Indian Ocean (ed C. De Young). FAO Fisheries Department, Rome.
Shiham Adam, M. & Sibert, J.R. (2002) Population dynamics and movements of skipjack tuna (Katsuwonus pelamis) in the Maldivian fishery: analysis of tagging data from an advection-diffusion-reaction model. Aquatic Living Resources, 15, 13-23.
Winsor, C.P. (1932) The Gompertz Curve as a Growth Curve. Procedings of National Academy of Sciences, 18, 1 - 8.

- 36 -
- 37 -
APPENDIX 1
Table A: Catch Composition by mechanised vessels 1985 – 2005
Skipjack Yellowfin Other tuna
related species Other Marine
fish Total
1985 42,005 5,715 2,914 3,020 53,654
1986 45,099 5,178 1,810 2,377 54,464
1987 41,676 6,522 2,145 2,339 52,682
1988 57,966 6,366 2,119 2,167 68,618
1989 57,671 5,972 2,842 2,310 68,794
1990 59,724 5,225 4,258 5,068 74,275
1991 58,715 7,649 3,879 8,450 78,694
1992 58,269 8,628 5,545 7,343 79,785
1993 58,452 10,006 8,878 9,936 87,273
1994 68,453 12,859 6,348 13,198 100,858
1995 69,406 12,319 6,416 13,844 101,985
1996 65,794 12,276 10,173 14,779 103,021
1997 68,066 12,838 4,748 13,092 98,743
1998 77,489 13,822 7,446 13,072 111,829
1999 91,721 14,155 5,179 9,853 120,908
2000 79,455 12,139 5,990 16,184 113,768
2001 87,847 14,540 6,485 14,570 123,442
2002 113,652 21,502 6,793 15,010 156,957
2003 103,864 19,546 7,135 15,352 145,897
2004 109,438 22,441 6,356 16,325 154,560
2005 131,121 21,461 8,094 19,353 180,029
- 38 -
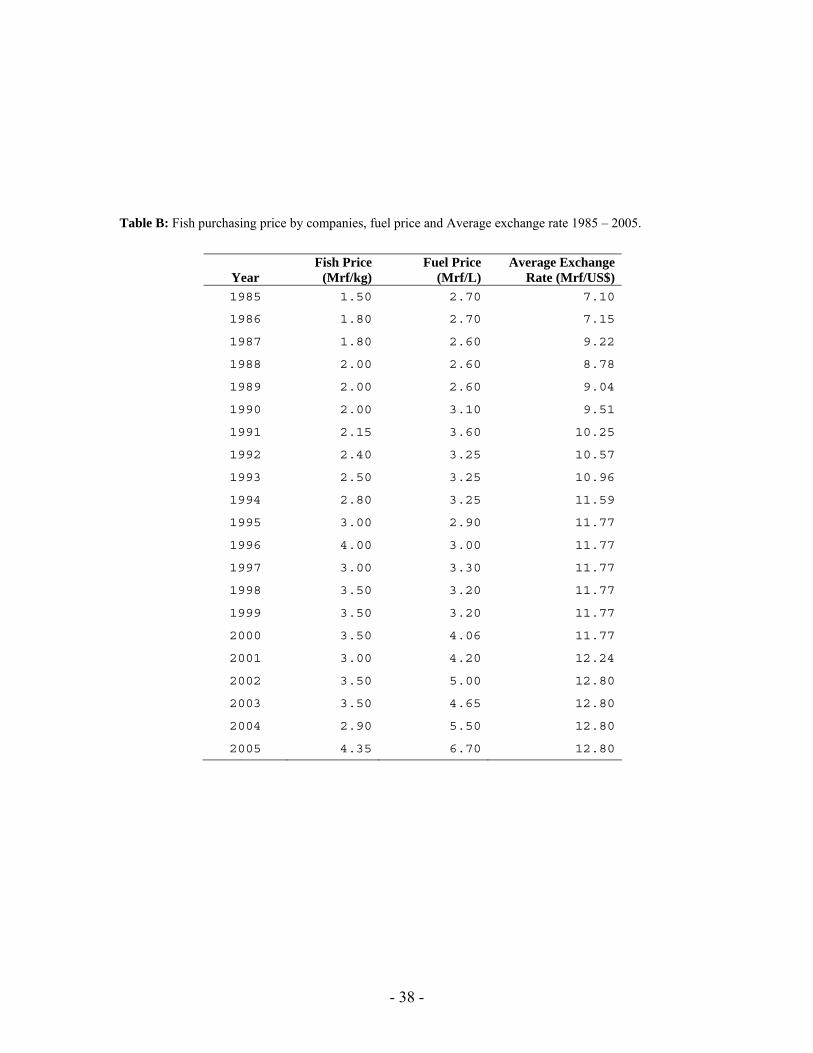
Table B: Fish purchasing price by companies, fuel price and Average exchange rate 1985 – 2005.
Year Fish Price
(Mrf/kg) Fuel Price
(Mrf/L) Average Exchange
Rate (Mrf/US$) 1985 1.50 2.70 7.10
1986 1.80 2.70 7.15
1987 1.80 2.60 9.22
1988 2.00 2.60 8.78
1989 2.00 2.60 9.04
1990 2.00 3.10 9.51
1991 2.15 3.60 10.25
1992 2.40 3.25 10.57
1993 2.50 3.25 10.96
1994 2.80 3.25 11.59
1995 3.00 2.90 11.77
1996 4.00 3.00 11.77
1997 3.00 3.30 11.77
1998 3.50 3.20 11.77
1999 3.50 3.20 11.77
2000 3.50 4.06 11.77
2001 3.00 4.20 12.24
2002 3.50 5.00 12.80
2003 3.50 4.65 12.80
2004 2.90 5.50 12.80
2005 4.35 6.70 12.80
- 39 -
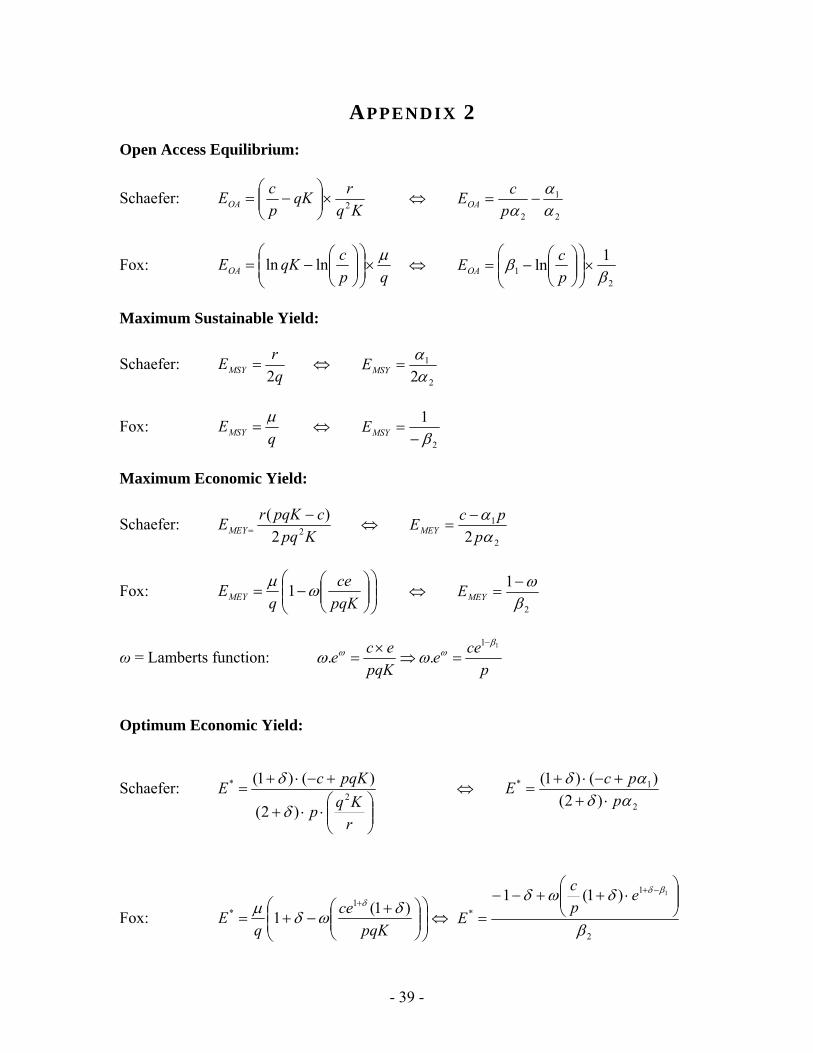
APPENDIX 2
Open Access Equilibrium:
Schaefer: Kq
rqKpcEOA 2×⎟⎟
⎠
⎞⎜⎜⎝
⎛−= ⇔
2
1
2 αα
α−=
pcEOA
Fox: qp
cqKEOAµ
×⎟⎟⎠
⎞⎜⎜⎝
⎛⎟⎟⎠
⎞⎜⎜⎝
⎛−= lnln ⇔
21
1lnβ
β ×⎟⎟⎠
⎞⎜⎜⎝
⎛⎟⎟⎠
⎞⎜⎜⎝
⎛−=
pcEOA
Maximum Sustainable Yield:
Schaefer: qrEMSY 2
= ⇔ 2
1
2αα
=MSYE
Fox: q
EMSYµ
= ⇔ 2
1β−
=MSYE
Maximum Economic Yield:
Schaefer: Kpq
cpqKrEMEY 22)( −
= ⇔ 2
1
2 αα
ppcEMEY
−=
Fox: ⎟⎟⎠
⎞⎜⎜⎝
⎛⎟⎟⎠
⎞⎜⎜⎝
⎛−=
pqKce
qEMEY ωµ 1 ⇔
2
1βω−
=MEYE
ω = Lamberts function: p
ceepqK
ece11
..β
ωω ωω−
=⇒×
=
Optimum Economic Yield:
Schaefer:
⎟⎟⎠
⎞⎜⎜⎝
⎛⋅⋅+
+−⋅+=
rKqp
pqKcE2
*
)2(
)()1(
δ
δ ⇔ 2
1*
)2()()1(
αδαδ
ppcE
⋅++−⋅+
=
Fox: ⎟⎟⎠
⎞⎜⎜⎝
⎛⎟⎟⎠
⎞⎜⎜⎝
⎛ +−+=
+
pqKce
qE )1(1
1* δωδµ δ
⇔ 2
1
*
1)1(1
β
δωδ βδ⎟⎟⎠
⎞⎜⎜⎝
⎛⋅++−−
=
−+epc
E
Recommended


![SKJ Skipjack BET Bigeye tuna YFT Yellowfin tuna...(growth rate, plumpness of the fish) and • the ecology (distances, movement, orientation) [“ecological trap” ] Impact of increasing](https://img.pdfslide.net/doc/110x75/6101d7b2205e3a4e2e7d5229/skj-skipjack-bet-bigeye-tuna-yft-yellowfin-growth-rate-plumpness-of-the-fish.jpg)