MANAGEMENT'S DISCUSSION AND ANALYSIS OF FINANCIAL CONDITION AND RESULTS OF OPERATIONS
For the three month period ended March 31, 2017

Page M1 AutoCanada 2017 First Quarter Report
Table of Contents 1. READER ADVISORIES ........................................................................................................................................................... M2
2. EXECUTIVE SUMMARY ......................................................................................................................................................... M3
3. OUTLOOK .................................................................................................................................................................................. M7
4. MARKET ...................................................................................................................................................................................... M8
5. SELECTED QUARTERLY FINANCIAL INFORMATION ............................................................................................. M12
6. RESULTS OF OPERATIONS ............................................................................................................................................... M13
7. SAME STORES RESULTS .................................................................................................................................................... M19
8. ACQUISITIONS, RELOCATIONS AND REAL ESTATE ............................................................................................. M22
9. LIQUIDITY AND CAPITAL RESOURCES ....................................................................................................................... M25
10. OUTSTANDING SHARES .................................................................................................................................................... M29
11. DIVIDENDS .............................................................................................................................................................................. M29
12. FREE CASH FLOW ............................................................................................................................................................. M30
13. CRITICAL ACCOUNTING ESTIMATES AND ACCOUNTING POLICY DEVELOPMENTS ............................ M33
14. DISCLOSURE CONTROLS AND INTERNAL CONTROLS OVER FINANCIAL REPORTING ....................... M33
15. RISK FACTORS ...................................................................................................................................................................... M33
16. FORWARD LOOKING STATEMENTS ............................................................................................................................ M33
17. NON-GAAP MEASURES ..................................................................................................................................................... M34
AutoCanada 2017 First Quarter Report Page M2
1. READER ADVISORIES
This Management’s Discussion & Analysis
(“MD&A”) was prepared as of May 4, 2017 to
assist readers in understanding AutoCanada
Inc.’s (the “Company” or “AutoCanada”)
consolidated financial performance for the three
month period ended March 31, 2017 and
significant trends that may affect AutoCanada’s
future performance. The following discussion and
analysis should be read in conjunction with the
unaudited condensed interim consolidated
financial statements and accompanying notes
(the “Interim Consolidated Financial
Statements”) of AutoCanada as at and for the
three month period ended March 31, 2017, the
audited annual consolidated financial statements
and accompanying notes (the "Consolidated
Financial Statements") of AutoCanada as at and
for the year ended December 31, 2016, and MD&A
for the year ended December 31, 2016. Results
are reported in Canadian dollars. Certain dollars
have been rounded to the nearest thousand
dollars, unless otherwise stated.
To provide more meaningful information, this
MD&A typically refers to the operating results for
the three month period ended March 31, 2017 of
the Company, and compares these to the
operating results of the Company for the three
month period ended March 31, 2016.
This MD&A contains forward-looking statements.
Please see the section “FORWARD-LOOKING
STATEMENTS” for a discussion of the risks,
uncertainties and assumptions used to develop
our forward-looking information. This MD&A also
makes reference to certain non-GAAP measures
to assist users in assessing AutoCanada’s
performance. Non-GAAP measures do not have
any standard meaning prescribed by GAAP and
are therefore unlikely to be comparable to similar
measures presented by other issuers. These
measures are identified and described under the
section “NON-GAAP MEASURES”.
Additional information regarding our Company,
including our 2016 Annual Information Form,
dated March 16, 2017, is available on SEDAR at
www.sedar.com and our website
www.autocan.ca. Such additional information is
not incorporated by reference herein, unless
otherwise specified, and should not be deemed
to be made part of this MD&A.

Page M3 AutoCanada 2017 First Quarter Report
2. EXECUTIVE SUMMARY
Highlights
New vehicles sold remained flat, with 8,508 units sold in the first quarter of 2017 and 8,502 units in
the first quarter of 2016, compared to an overall market increase of 4.6%. While the overall market is
up 4.6%, new unit sales from the 19 brands that we specifically retail are up 3.3% in the quarter
compared to the prior year.
Overall Gross profit remained flat at $111,627 in the first quarter, compared to $111,709 in the same
quarter of 2016, with gross profit as a percentage of revenue increasing from 16.8% to 17.5%.
The used vehicle department led the gain in gross profit as a percentage of revenue increasing from
5.6% in the first quarter of 2016 to 7.2% in the first quarter of 2017.
Finance, insurance and other, per vehicle retailed, has increased 3.7% year-over-year.
Parts, service and collision repair gross profit remained flat at $47,284 in the first quarter, compared
to $47,669 in the same quarter of 2016.
Normalized operating expenses, after adjusted for non-recurring items, was 86.4% compared to
86.0% in Q1, 2016.
Performance vs. the First Quarter of Prior Year
The following table summarizes the Company's results for the quarter ended March 31, 2017:
Three months ended March 31
Consolidated Operational Data 2017 2016 % Change
EBITDA(1,2) 14,136 18,312 (22.8)%
Adjusted EBITDA(1,2) 15,514 16,447 (5.7)%
Net earnings(1) 3,678 7,272 (49.4)%
Adjusted net earnings(1,2) 4,602 6,253 (26.4)%
Basic EPS 0.13 0.27 (51.9)%
Adjusted diluted EPS(2) 0.17 0.23 (26.1)%
New retail vehicles sold (units) 6,753 7,078 (4.6)%
New fleet vehicles sold (units) 1,755 1,424 23.2%
New vehicles sold (units) 8,508 8,502 0.1%
Used retail vehicles sold (units) 4,547 4,799 (5.3)%
Total vehicles sold (units) 13,055 13,301 (1.8)%
Revenue 639,027 666,872 (4.2)%
Gross Profit 111,627 111,709 (0.1)%
Gross Profit % 17.5% 16.8% 4.2%
Operating expenses 98,170 96,047 2.2%
Operating expenses as % of gross profit 87.9% 86.0% 2.2%
Free cash flow(2) 621 4,045 (84.6)%
Adjusted free cash flow(2) 15,217 6,035 152.2%
(1) Represents the portion attributable to AutoCanada Shareholders. (2) These financial measures have been calculated as described under “NON-GAAP MEASURES”.

AutoCanada 2017 First Quarter Report Page M4
Industry
During the first quarter of 2017, the Canadian automotive retail sector new vehicle sales increased to
422 thousand units, up 4.6% compared to the prior year. The industry’s new light vehicle sales in
Alberta were up 9.2% year-over-year, while sales in Saskatchewan and British Columbia were up 17.9%
and 4.7%, respectively.
AutoCanada’s unit sales in these provinces did not reflect the overall performance of the automotive
sector due to our brand mix and dealership locations. While the overall market is up 4.6%, new light
vehicle sales from the 19 brands that we retail are up 3.3% in the quarter compared to the prior year1.
Further impacting our results, our dealership mix in certain provinces are skewed towards brands that
saw year-over-year declines as compared to the overall provincial growth.
Our Performance
Sales, Gross Profit & Net Earnings
Profitability arising from the dealerships’ business operations improved year-over-year, while overall
Company net earnings declined by $3.6 million. This decline arose primarily from two non-recurring
items, which we have isolated in order to show the normalized impact, including management transition
costs related to the departure of the Company’s former President during the current quarter, offset by
the sale of Newmarket Nissan Infiniti in the first quarter of the prior year. Net earnings was down 26.4%
in 2017 on a comparative adjusted basis.
Our results should be analyzed dealership-wide across all business streams, looking not only at new
vehicle sales, but also at used vehicle sales, the parts, service and collision revenue stream and also
finance and insurance. In the quarter, we held our overall gross profit flat through improvement in
margins in used vehicles and parts, service and collision operations.
The Company experienced a 4.2% decline in total revenue of $639.0 million for the three-month period
ended March 31, 2017, as compared to the first quarter of 2016 of $666.9 million. Gross profit for the
quarter was flat at $111.6 million, while gross profit margin improved to 17.5% from 16.8%.
New Vehicles
AutoCanada’s new vehicle sales are still highly dependent on our Alberta stores’ performance, as our
concentration of 25 dealerships in the province represented 42% of our total revenue. Of these
dealerships, 11 are domestic brands which have generally been our larger volume stores. Our Alberta
same stores were down 2.2% on a total revenue basis compared to the same period in 2016.
New vehicle revenue decreased 2.7% during the quarter to $353.5 million, compared to $363.2 million
during the prior year’s first quarter. The most significant impact on revenues was the $1,163 decline in
new vehicle revenue per unit, partially due to a larger number of fleet vehicles sold as a percentage of
total sales. New vehicle gross profit for the quarter declined 6.2% to $25.6 million when compared to the
same period of 2016, which is correlated to the lower per unit revenue generated.
Certain brands have experienced a disproportionate amount of downward pressure on new vehicle sales
compared to other brands throughout the prolonged downturn. We intend to reduce our exposure to
specific geographies and brands through our acquisition strategy which targets new locations and
brands that more closely reflect the larger Canadian market. By diversifying both regionally and by
brand, AutoCanada’s results will more closely reflect the Canadian market as a whole.
1 DesRosiers Automotive Consultants Inc.

Page M5 AutoCanada 2017 First Quarter Report
Used Vehicles
During the first quarter of 2017, used vehicle revenue declined 8.2% year-over-year to $165.4 million. The
decrease is largely the result of 252 fewer units sold. Used vehicle gross profit increased by 14.6% or
$455 per unit to $11.9 million compared to the same period of the prior year. The increase in gross profit
per vehicle reflects our continuing focus on decreasing the length of time that inventory is on hand and
increasing turnover.
Finance Insurance and Other
Finance, insurance and other revenue increased by 1.7%, which, compared to the decline in new retail
vehicle units sold shows continuous strength of the finance, insurance and other revenue stream.
Finance, insurance and other product gross margin increased 1.7% year-over-year as we increased
efforts to sell finance and insurance products that tend to generate a higher gross profit than other
products or services. During the quarter, average revenue per finance and insurance product increased
by $161 and average gross profit per finance and insurance product increased by $148 compared to the
same period of the prior year.
Service, Parts and Collision Repairs
The first quarter of 2017 experienced 12,125 fewer repair orders completed in our 949 services bays
compared to the same period of 2016, partially offset by an increase of $7 per order. First quarter
revenue decreased by 4.2% to $90.7 million from $94.7 million generated in the same quarter of 2016.
Gross profit for the business stream was essentially flat at $47.3 million, a decrease of $385 thousand
from the same quarter in 2016, despite the lower repair volume, due to an increase in gross profit per
repair order of $12.
Operating expenses
Operating expenses increased by $2.2 million to $98.2 million in the first quarter of 2017 compared to
$96.0 million in the comparative period of 2016. However, after accounting for non-recurring
management transition costs of $1.7 million, operating expenses reduces to $96.5 million, or 86.4% of
gross profit, compared to 86.0% in the same quarter in 2016.
Normalized Operating Expenses $
Operating expenses, per Statement of Comprehensive Income 98,170
Non-recurring costs:
Management transition costs (1,684)
Normalized operating expenses 96,486
Gross Profit 111,627
Normalized operating expenses as a percentage of gross profit 86.4%
Growth
We continuously monitor our strategic objectives and have a five-year capital plan set at $145.3 million,
through to the end of fiscal 2021. Dealership relocations, renovation projects, and Open Point
opportunities are prudently considered against our overall growth strategy. We allocate capital to
improve existing stores in conjunction with manufacturers’ brand image programs and our ability to
maximize vehicle sales and service in our market areas.
During the first quarter of 2017, we spent $2.5 million on relocations, renovations and Open Point
locations. We intend to continue to acquire dealerships that broaden our brand representations as well
as meet our goal of greater geographic diversification.

AutoCanada 2017 First Quarter Report Page M6
Acquisitions
Our acquisition strategy continues to focus on diversifying across Canada through the addition of
flagship stores in major markets. Our target acquisitions are not only evaluated in terms of accretion but
also for how they will advance our Company, unit sales volumes, and market share. Our ability to
generate strong cash flow is a key element in our acquisition plan. Subsequent to the first quarter we
announced an agreement to purchase all of the issued and outstanding shares of Mercedes-Benz Rive-
Sud, which has operated in the greater Montreal area for nearly 50 years. The acquisition, once closed,
brings AutoCanada's dealership count to 57, expanding our brand offering to 20 and adds another top-
selling luxury brand. The new addition is consistent with AutoCanada's strategy of adding new brands in
metropolitan areas to further expand our dealer network and drive growth potential in major Canadian
markets. We remain optimistic in our ability to make additional acquisitions in 2017, as conversations
with manufacturers we have not partnered with progress and the pipeline of potential transactions
remains attractive.
Reorganization
In the first quarter of 2017, we reorganized teams at Dealer Support Services into brand platforms. Each
platform, being FCA, General Motors, European Import and Asian Import, has a dedicated team
composed of sales, marketing, and fixed operations specialists. These brand platform teams are better
tailored to focus on brand specific issues, have consistent approaches to operations, meet manufacturer
guidelines, and target specific financial objectives. We believe that this new brand alignment by
manufacturer will allow us to optimize financial earnings, and better able to serve our dealerships to
leverage best practices and thus increase our overall success. No reorganizing charges were incurred as
a result of this organizational change.

Page M7 AutoCanada 2017 First Quarter Report
3. OUTLOOK
The outlook regarding new retail vehicle sales in Canada is difficult to predict, as manufacturers do not
publicly disclose fleet and retail sales separately and is largely a function of the condition of the local
economy and affordability which equates to vehicle price, loan rates, and trade in values. In Canada,
factors contributing to new vehicle sales will vary widely by province.
Despite new light vehicle sales for the Canadian market decreasing 1.6% in April1, we believe that there
are opportunities to grow in our dealerships, with particular focus on new vehicle sales, gross profit
margins and cost reductions. We remain focused on delivering better financial performance irrespective
of the energy sector and market conditions in our key markets, while also maintaining our focus on cost
reductions. In the first quarter we were able to maintain gross profit and increase gross profit as a
percentage of revenue despite lower vehicle sales and we plan to continue our success in this area.
Of the 17 dealerships that became same store in the fourth quarter of 2016, 11 of these are located in
Alberta. As a result, we anticipate same stores sales results will continue to be impacted in 2017 as the
Alberta economy begins to recover. We will continue to dedicate significant resources to newly acquired
dealerships to integrate acquisitions and position them to be successful in their respective markets.
We plan to spend approximately $30.9 million in 2017 on dealership relocations and expansions.
Construction continues on the relocation of Audi Winnipeg, which we anticipate will be completed in Q4,
2017 and will lead to increased customer traffic and sales. We are also constructing two new Nissan
Open Point locations in Calgary and Ottawa.
We are committed to delivering meaningful returns to our shareholders. Although we continue to
confront headwinds in key markets, we believe that we can generate better results by improving
employee productivity, realizing the benefits of our scale and continuing to grow our brand and
geographic footprints with accretive acquisitions.
1 DesRosiers Automotive Consultants Inc.

AutoCanada 2017 First Quarter Report Page M8
4. MARKET
The Company’s geographical profile is illustrated below by the number of dealerships, revenues and
gross profit by province for the three month periods ended March 31, 2017 and March 31, 2016.
March 31, 2017
Location of Dealerships
Number of
Franchises1
Number of
Dealerships1
Revenue
Revenue
% of Total
Gross Profit
Gross Profit
% of Total
British Columbia 13 11 124,753 20% 21,143 19%
Alberta 28 25 269,944 42% 48,146 43%
Saskatchewan 4 4 57,805 9% 11,013 10%
Manitoba 4 4 38,995 6% 8,028 7%
Ontario 9 8 54,323 8% 8,937 8%
Quebec 4 2 62,346 10% 9,666 9%
Atlantic 2 2 30,861 5% 4,694 4%
Total 64 56 639,027 100% 111,627 100%
(1) “Dealerships" refers to each physical storefront while "Franchises" refers to each separate franchise agreement.
March 31, 2016
Location of Dealerships
Number of
Franchises1
Number of
Dealerships1
Revenue
Revenue
% of Total
Gross Profit
Gross Profit
% of Total
British Columbia 13 11 147,478 22% 21,741 20%
Alberta 27 24 273,924 41% 50,670 45%
Saskatchewan 4 4 51,238 8% 9,378 8%
Manitoba 4 4 41,537 6% 7,923 7%
Ontario 6 6 47,317 7% 6,849 6%
Quebec 4 2 65,995 10% 9,589 9%
Atlantic 2 2 39,383 6% 5,559 5%
Total 60 53 666,872 100% 111,709 100%
(1) “Dealerships" refers to each physical storefront while "Franchises" refers to each separate franchise agreement.
The Company’s manufacturers profile is illustrated below by number of dealerships and revenues by
manufacturer for the three month periods ended March 31, 2017 and March 31, 2016.
March 31, 2017 March 31, 2016
Manufacturer
Number of Franchises1
Number of Dealerships1
Revenue
Revenue
% of Total
Number of Franchises1
Number of Dealerships1
Revenue
Revenue
% of Total
FCA 23 17 268,283 42% 21 16 302,867 45%
General Motors 9 9 141,777 22% 9 9 130,392 20%
Hyundai 9 9 42,718 7% 8 8 49,244 7%
Nissan / Infiniti 7 7 67,982 11% 7 7 58,991 9%
Volkswagen / Audi
8 8 40,928 6% 7 7 40,633 6%
BMW / MINI 4 2 62,346 10% 4 2 64,834 10%
Other 4 4 14,993 2% 4 4 19,911 3%
Total 64 56 639,027 100% 60 53 666,872 100%
(1) "Dealerships" refers to each physical storefront while "Franchises" refers to each separate franchise agreement.

Page M9 AutoCanada 2017 First Quarter Report
Performance vs. the Canadian New Vehicle Market
The Canadian automotive retail sector year-to-date has increased 4.6% compared to the prior year. New
light vehicle sales in Alberta for the quarter ended March 31, 2017 were up 9.2%, and up 4.7% in British
Columbia when compared to the same period in 2016.
The Company's same stores unit sales of new vehicles decreased by 8.5% during the three month period
ended March 31, 2017. The Company lagged behind the Canadian market in the first quarter of 2017.
Though our same stores unit sales has declined year-over-year, our same stores unit sales of new
vehicles has trended upwards during the quarter with March unit sales exceeding sales in the same
period of the prior year. During the quarter, the Company has focused on maintaining gross profit
company-wide to offset reduced sales volumes. While the Company’s same stores revenue has
decreased 7.1%, gross profit was largely maintained with a decline of only 1.2% for same stores,
compared to the first quarter of the prior year.
The following table summarizes Canadian new light vehicle sales for the three month periods ended
March 31, 2017 and March 31, 2016 by province:
Canadian New Vehicle Sales by Province1,2
March 31,
2017
March 31,
2016 Percent Change Unit Change
British Columbia 50,251 48,000 4.7% 2,251
Alberta 53,342 48,865 9.2% 4,477
Saskatchewan 12,659 10,738 17.9% 1,921
Manitoba 12,698 11,639 9.1% 1,059
Ontario 172,665 162,287 6.4% 10,378
Quebec 92,994 93,592 (0.6)% (598)
Atlantic 26,909 27,775 (3.1)% (866)
Total 421,518 402,896 4.6% 18,622
(1) DesRosiers Automotive Consultants Inc. (2) Readers are cautioned that the above table includes sales channels that the Company does not fully participate in such as daily
rentals, and small and medium size leasing companies that are not part of the franchise dealership network.
Canadian New Vehicle Sales by Brand3,4
March 31,
2017
March 31,
2016 Percent Change Unit Change
Audi 6,887 5,855 17.6% 1,032
BMW 7,855 7,652 2.7% 203
FCA 64,089 62,831 2.0% 1,258
General Motors 61,248 54,622 12.1% 6,626
Hyundai 24,128 27,807 (13.2)% (3,679)
Infiniti 2,800 2,780 0.7% 20
Kia 13,775 13,965 (1.4)% (190)
MINI 1,156 1,099 5.2% 57
Mitsubishi 4,439 4,958 (10.5)% (519)
Nissan 30,836 27,236 13.2% 3,600
Subaru 10,422 9,443 10.4% 979
Volkswagen 10,311 12,196 (15.5)% (1,885)
Total – AutoCanada Brands 237,946 230,444 3.3% 7,502
Other – Non-AutoCanada Brands 183,572 172,452 6.4% 11,120
Total 421,518 402,896 4.6% 18,622
(3) DesRosiers Automotive Consultants Inc. (4) Readers are cautioned that the above table includes sales channels that the Company does not fully participate in such as daily
rentals, and small and medium size leasing companies that are not part of the franchise dealership network.

AutoCanada 2017 First Quarter Report Page M10
List of Dealerships
The following table sets forth the dealerships that we currently own and operate and the date opened or
acquired by the Company or its predecessors, organized by location.
Location
Operating Name
Franchise
Year Opened or Acquired
Same Stores1
Owned or Leased2
Wholly-Owned Dealerships:
Abbotsford, BC Abbotsford Volkswagen Volkswagen 2011 Y Leased
Chilliwack, BC Chilliwack Volkswagen Volkswagen 2011 Y Owned
Kelowna, BC Okanagan Chrysler Jeep Dodge FIAT FCA 2003 Y Leased
Maple Ridge, BC Maple Ridge Chrysler Jeep Dodge FIAT FCA 2005 Y Leased
Maple Ridge, BC Maple Ridge Volkswagen Volkswagen 2008 Y Leased
Prince George, BC Northland Chrysler Jeep Dodge FCA 2002 Y Owned
Prince George, BC Northland Hyundai Hyundai 2005 Y Owned
Prince George, BC Northland Nissan Nissan 2007 Y Owned
Victoria, BC Victoria Hyundai Hyundai 2006 Y Owned
Airdrie, AB Airdrie Chrysler Jeep Dodge Ram FCA 2015 Q3 2017 Leased
Calgary, AB Courtesy Chrysler Dodge FCA 2013 Y Leased
Calgary, AB Calgary Hyundai Hyundai 2014 Y Leased
Calgary, AB Crowfoot Hyundai Hyundai 2014 Y Leased
Calgary, AB Courtesy Mitsubishi Mitsubishi 2014 Y Leased
Calgary, AB Northland Volkswagen Volkswagen 2014 Y Leased
Calgary, AB Fish Creek Nissan Nissan 2014 Y Leased
Calgary, AB Hyatt Infiniti Infiniti 2014 Y Leased
Calgary, AB Tower Chrysler Jeep Dodge Ram FCA 2014 Y Leased
Edmonton, AB Crosstown Chrysler Jeep Dodge FIAT FCA 1994 Y Leased
Edmonton, AB Capital Chrysler Jeep Dodge FIAT FCA 2003 Y Leased
Edmonton, AB North Edmonton Kia Kia 2014 Y Owned
Grande Prairie, AB Grande Prairie Chrysler Jeep Dodge FIAT FCA 1998 Y Owned
Grande Prairie, AB Grande Prairie Hyundai Hyundai 2005 Y Owned
Grande Prairie, AB Grande Prairie Subaru Subaru 1998 Y Owned
Grande Prairie, AB Grande Prairie Mitsubishi Mitsubishi 2007 Y Owned
Grande Prairie, AB Grande Prairie Nissan Nissan 2007 Y Owned
Grande Prairie, AB Grande Prairie Volkswagen Volkswagen 2013 Y Owned
Ponoka, AB Ponoka Chrysler Jeep Dodge FCA 1998 Y Owned
Sherwood Park, AB Sherwood Park Hyundai Hyundai 2006 Y Owned
Sherwood Park, AB Sherwood Park Volkswagen Volkswagen 2017 Q2 2019 Owned
Saskatoon, SK Dodge City Chrysler Jeep Dodge Ram FCA 2014 Y Leased
Winnipeg, MB Audi Winnipeg Audi 2013 Y Owned
Winnipeg, MB St. James Volkswagen Volkswagen 2013 Y Owned
Winnipeg, MB Eastern Chrysler Jeep Dodge FCA 2014 Y Owned
Cambridge, ON Cambridge Hyundai Hyundai 2008 Y Owned
Mississauga, ON 401 Dixie Hyundai Hyundai 2008 Y Leased
Guelph, ON Guelph Hyundai Hyundai 2016 Q1 2019 Leased
Guelph, ON Wellington Motors FCA 2016 Q1 2019 Leased
Toronto, ON Toronto Chrysler Jeep Dodge Ram FCA 2014 Y Leased
Montreal, QB Mercedes-Benz Rive-Sud4 Mercedes-Benz 2017 Q2 2019 Leased
Moncton, NB Moncton Chrysler Jeep Dodge FCA 2001 Y Owned
Dartmouth, NS Dartmouth Chrysler Jeep Dodge FCA 2006 Y Leased

Page M11 AutoCanada 2017 First Quarter Report
Equity Investments:
Duncan, BC Island Chevrolet Buick GMC General Motors 2013 Y Leased
Kelowna, BC Kelowna Chevrolet General Motors 2015 Q4 2017 Owned
Edmonton, AB Lakewood Chevrolet General Motors 2014 Y Owned
Sherwood Park, AB Sherwood Park Chevrolet General Motors 2012 Y Leased
Sherwood Park, AB Sherwood Buick GMC General Motors 2012 Y Leased
Spruce Grove, AB Grove Dodge Chrysler Jeep FCA 2015 Q1 2018 Leased
North Battleford, SK Bridges Chevrolet Buick GMC General Motors 2014 Y Owned
Prince Albert, SK Mann-Northway Auto Source General Motors 2014 Y Leased
Saskatoon, SK Saskatoon Motor Products General Motors 2014 Y Leased
Winnipeg, MB McNaught Cadillac Buick GMC General Motors 2014 Y Owned
Laval, QB BMW Laval and MINI Laval BMW / MINI 2014 Y Owned
Montreal, QB BMW Canbec and MINI Mont Royal BMW / MINI 2014 Y Leased
Ottawa, ON Hunt Club Nissan Nissan 2015 Q1 2018 Leased
Ottawa, ON 417 Nissan Nissan 2015 Q1 2018 Leased
Ottawa, ON 417 Infiniti Infiniti 2015 Q1 2018 Leased
Dealership Loan Financing:
Edmonton, AB Southview Acura3 Acura 2016 N/A N/A
Whitby, ON Whitby Oshawa Honda3 Honda 2015 N/A N/A
(1) Same stores (indicated with the letter “Y” in the table above) means the franchised automobile dealership has been owned for at least 2 full years since acquisition. The dealership is then included in the quarter thereafter, for Same Stores analysis.
(2) This column summarizes whether the dealership property is owned or leased. (3) For further detail on dealership loan financing, refer to "LIQUIDITY AND CAPITAL RESOURCES" section under Related Party
Transactions. (4) On May 1, 2017, the Company acquired shares of Mercedes-Benz Rive-Sud. See “ACQUISITIONS, RELOCATIONS, AND REAL ESTATE"
for more information related to this dealership acquisition.

AutoCanada 2017 First Quarter Report Page M12
5. SELECTED QUARTERLY FINANCIAL INFORMATION
The following table shows the unaudited results of the Company for each of the eight most recently completed
quarters. The results of operations for these periods are not necessarily indicative of the results of operations to be
expected in any given comparable period.
(in thousands of dollars, except Gross Profit %,
Earnings per share, and Operating Data)
Q1
2017
Q4
2016
Q3
2016
Q2
2016
Q1
2016
Q4
2015
Q3
2015
Q2
2015
Income Statement Data
New vehicles 353,540 348,107 444,482 497,025 363,181 368,242 471,018 483,435
Used vehicles 165,408 157,724 179,582 208,016 180,108 167,100 179,270 194,956
Parts, service and collision repair 90,735 92,310 95,585 100,317 94,721 102,220 93,139 99,304
Finance, insurance and other 29,344 31,133 33,529 36,899 28,862 34,752 37,778 39,182
Revenue 639,027 629,274 753,178 842,257 666,872 672,314 781,205 816,877
New vehicles 25,590 25,042 31,578 34,410 27,267 27,482 34,300 34,861
Used vehicles 11,940 10,064 12,950 13,758 10,420 10,326 10,949 11,000
Parts, service and collision repair 47,284 52,957 47,676 52,957 47,669 51,760 48,336 49,859
Finance, insurance and other 26,813 28,722 30,733 33,577 26,353 34,354 35,088 33,955
Gross profit 111,627 116,785 122,937 134,702 111,709 123,922 128,673 129,675
Gross Profit % 17.5% 18.6% 16.3% 16.0% 16.8% 18.4% 16.5% 15.9%
Operating expenses 98,170 97,397 99,041 107,932 96,047 101,310 100,824 100,568
Operating expenses as a % of gross profit 87.9% 83.4% 80.6% 80.1% 86.0% 81.8% 78.4% 77.6%
Net earnings (loss)(2,5) 3,678 13,785 (32,619) 14,158 7,272 (7,361) 11,690 13,523
Adjusted net earnings(2,5,6) 4,602 7,536 10,327 15,523 6,253 8,610 12,535 13,957
EBITDA(2,5) 14,136 25,260 23,842 27,072 18,312 23,353 26,379 27,397
EBITDA as a % of Sales(2,5) 2.7% 4.5% 3.6% 3.7% 3.2% 3.5% 3.8% 3.8%
Free cash flow(2) 621 23,424 30,897 37,922 4,045 9,066 14,995 17,776
Adjusted free cash flow(2) 15,217 13,133 27,766 21,632 6,035 8,078 18,951 19,187
Basic earnings (loss) per share 0.13 0.50 (1.19) 0.53 0.27 (0.29) 0.48 0.56
Diluted earnings (loss) per share 0.13 0.50 (1.19) 0.53 0.27 (0.29) 0.47 0.56
Basic adjusted earnings per share(2,6) 0.17 0.28 0.38 0.57 0.23 0.34 0.51 0.56
Diluted adjusted earnings per share(2,6) 0.17 0.27 0.38 0.57 0.23 0.34 0.51 0.57
Dividends declared per share 0.10 0.10 0.10 0.10 0.25 0.25 0.25 0.25
Operating Data
Vehicles (new and used) sold(3) 13,055 12,912 15,955 17,425 13,301 14,150 17,086 17,739
New vehicles sold(3) 8,508 8,449 10,983 12,098 8,502 9,210 12,018 12,296
New retail vehicles sold(3) 6,753 7,590 8,949 9,374 7,078 8,016 9,985 9,929
New fleet vehicles sold(3) 1,755 859 2,034 2,724 1,424 1,194 2,033 2,367
Used retail vehicles sold(3) 4,547 4,463 4,972 5,327 4,799 4,940 5,068 5,443
# of service/collision repair orders completed(3) 197,069 217,418 209,912 227,446 209,194 230,772 202,692 215,142
Absorption rate(2) 82% 86% 89% 90% 83% 93% 91% 94%
# of dealerships at period end 56 55 53 53 53 54 50 49
# of same stores dealerships 47 44 33 27 27 28 26 24
# of service bays at period end 949 928 898 898 898 912 862 842
Same stores revenue growth(1) (7.1)% (10.0)% (9.2)% (3.2)% (3.1)% (12.1)% (6.9)% (2.8)%
Same stores gross profit growth(1) (1.2)% (5.8)% (11.0)% (5.3)% (5.5)% (14.3)% (14.1)% (11.0)%
(1) Same stores revenue growth and Same stores gross profit growth is calculated using franchised automobile dealerships that we have owned for at least 2 full years, which includes the GM Stores, as these stores have been treated as acquisitions as at July 11, 2014. Same store growth is in comparison with the same quarter in the prior year.
(2) These financial measures have been calculated as described under "NON-GAAP MEASURES". (3) This number includes 100% of vehicles and service and collision repair orders sold by these dealerships in which we have less than 100% investment. (4) The results from operations have historically been lower in the first and fourth quarters of each year, largely due to consumer purchasing patterns during the
holiday season, inclement weather and the reduced number of business days during the holiday season. As a result, our financial performance is generally not as strong during the first and fourth quarters than during the other quarters of each fiscal year. The timing of acquisitions may have also caused significant fluctuations in operating results from quarter to quarter.
(5) Represents the portion attributable to AutoCanada Shareholders. (6) In Q1 2017, the Company redefined the calculation of adjusted net earnings. As a result, the values presented for Q1 2016 and Q2 2016 have been restated as
presented above.

Page M13 AutoCanada 2017 First Quarter Report
6. RESULTS OF OPERATIONS
First Quarter Operating Results
EBITDA attributable to AutoCanada shareholders for the quarter decreased by 22.8% to $14.1 million
compared to the results of the Company for the same period in the prior year. The decrease in EBITDA
attributable to AutoCanada shareholders for the quarter is mainly attributable to a decrease in new
vehicle gross profit along with adjusted items: the additional Executive Management transition costs this
quarter, and a $3.2 million gain on disposal of assets in the first quarter of 2016 related to the disposition
of a dealership. Adjusted EBITDA attributable to AutoCanada shareholders for the quarter ended March
31, 2017 decreased by 5.7% to $15.5 million compared to the same quarter in the prior year.
The following table illustrates EBITDA and adjusted EBITDA attributable to AutoCanada shareholders for
the three month period ended March 31, for the last three years of operations:
(in thousands of dollars) 2017 2016 2015
Period from January 1 to March 31
Net earnings attributable to AutoCanada shareholders 3,678 7,272 4,969
Income taxes2 1,249 2,477 1,707
Depreciation of property and equipment2 4,596 4,687 3,932
Interest on long-term indebtedness2 4,613 3,876 2,079
EBITDA attributable to AutoCanada shareholders1 14,136 18,312 12,687
Add back:
Share-based compensation attributed to changes in share price 4 59 (330)
Revaluation of redemption liabilities (310) 1,262 323
Unrealized gain on embedded derivative - 20 214
Gain on dealership divestiture3 - (3,206) -
Non-recurring management transition costs3 1,684 - -
Adjusted EBITDA attributable to AutoCanada shareholders1 15,514 16,447 12,894
(1) This financial measure is identified and defined under the section “NON-GAAP MEASURES”. (2) Represents the portion attributable to AutoCanada shareholders. (3) In Q1 2017, the Company redefined the calculation of adjusted EBITDA. As a result, the values presented for Q1 2016 have been restated
as presented above.
Pre-tax earnings attributable to AutoCanada shareholders decreased by $4.8 million or 49.5% year-over-
year to $4.9 million for the quarter. Net earnings attributable to AutoCanada shareholders decreased by
$3.6 million or 49.4% year-over-year to $3.7 million in the first quarter of 2017. Income tax expense
attributable to AutoCanada shareholders decreased by $1.3 million to $1.2 million in the first quarter of
2017.
Adjusted net earnings attributable to AutoCanada shareholders decreased by $1.7 million or 26.4% year-
over-year to $4.6 million for the quarter.

AutoCanada 2017 First Quarter Report Page M14
The following table reconciles net earnings to adjusted net earnings for the three month period ended
March 31, for the last three years of operations:
(in thousands of dollars) 2017 2016 2015
Net earnings attributable to AutoCanada shareholders 3,678 7,272 4,969
Add back:
Share-based compensation attributed to changes in share price, net of tax
3 43 (245)
Revaluation of redemption liabilities (310) 1,262 323
Unrealized gain on embedded derivative - 20 214
Gain on dealership divestiture2 - (2,344) -
Non-recurring management transition costs2 1,231 - -
Adjusted net earnings attributable to AutoCanada shareholders1 4,602 6,253 5,261
Weighted average number of shares - Basic 27,358,766 27,362,440 24,409,574
Weighted average number of shares - Diluted 27,509,758 27,427,695 24,520,694
Adjusted net earnings per share attributable to AutoCanada shareholders - Basic1
0.17 0.23 0.22
Adjusted net earnings per share attributable to AutoCanada shareholders - Diluted1
0.17 0.23 0.21
(1) This financial measure is identified and defined under the section “NON-GAAP MEASURES”. (2) In Q1 2017, the Company redefined the calculation of adjusted net earnings. As a result, the values presented for Q1 2016 have been restated
as presented above.
Revenues
The following table summarizes revenue for the three month periods ended March 31:
2017
$
2016
$
Change
$
New vehicles 353,540 363,181 (9,641)
Used vehicles 165,408 180,108 (14,700)
Finance, insurance and other 29,344 28,862 482
Parts, service and collision repair 90,735 94,721 (3,986)
Total Revenue 639,027 666,872 (27,845)
New vehicles
The $9.6 million year-over-year decrease in revenue in the quarter from new vehicles is due to a decline
in revenue per unit of $1,163, partially offset by an increase in six new vehicles sold compared to the first
quarter of 2016.

Page M15 AutoCanada 2017 First Quarter Report
Used vehicles
The $14.7 million year-over-year decrease in revenue in the quarter from used vehicles is due to a decline
in used vehicles sold of 252 units and a decrease in revenue per unit of $1,153 compared to the same
period of the prior year.
Finance, insurance and other
While finance and insurance products are also sold with used retail vehicles, finance and insurance
products are largely sold in conjunction with new retail vehicles. The quarterly year-over-year finance,
insurance and other revenue increased by 1.7% while new retail vehicle units sold increased by 0.1%.
Finance and insurance revenue per vehicle sold has increased by 3.6% year-over-year, or $78, to $2,248
in the quarter. The average revenue per finance and insurance product increased by $161 compared to
the same period of the prior year.
Parts, service and collision repair
The $4.0 million year-over-year decrease in revenue in the first quarter from parts, service and collision
repair is due to a quarterly decline in repair orders of 12,125, offset by a quarterly increase in revenue per
order of $7. While retail service revenue has remained constant, there has been a significant decline in
warranty and repair orders due to reduced vehicle recalls and warranty repairs. Collision repair and
warranty work have also declined as a result of unseasonably warm temperatures during Q1 2017
compared to the same period in the prior year, which resulted in fewer weather related breakdowns.
There has also been a decrease in parts and accessories added to vehicles sold this quarter.
Gross Profit
The following table summarizes gross profit for the three month periods ended March 31:
2017
$
2016
$
Change
$
New vehicles 25,590 27,267 (1,677)
Used vehicles 11,940 10,420 1,520
Finance, insurance and other 26,813 26,353 460
Parts, service and collision repair 47,284 47,669 (385)
Total Gross Profit 111,627 111,709 (82)
New vehicles
The $1.7 million year-over-year decrease in gross profit in the first quarter from new vehicles is due to a
decrease in gross profit per unit of $199 and an increase in new vehicles sold of six.

AutoCanada 2017 First Quarter Report Page M16
Used vehicles
The $1.5 million year-over-year increase in gross profit in the quarter from used vehicles is due primarily
to an increased gross profit per unit of $455, offset by a 252 unit decline in used vehicles sold. The
increase in gross profit per vehicle stems from Management’s continued focus on tightening inventory,
decreasing the length of time that inventory is on hand and increasing turnover. By decreasing the
length of time used inventory is available for sale and selling slow moving inventory at wholesale
auctions earlier, we are able to make room on dealership lots to focus on higher quality inventory.
Finance, insurance and other
The increase in finance, insurance and other is tied to the slight increase in new vehicle unit sales. The
first quarter finance, insurance and other gross profit increased by 1.7% year-over-year as new vehicle
units sold increased by 0.1%. This is mainly attributable to increased efforts in selling finance and
insurance products this quarter. Finance and insurance gross profit per vehicle sold has increased by
3.7% year-over-year, or $73, to $2,054 in the quarter. The average gross profit per finance and insurance
product increased by $148 compared to the same period of the prior year.
Parts, service and collision repair
The slight decrease in gross profit in the quarter from parts, service and collision repair is due to a year-
over-year decline in repair orders of 12,125, offset by an increase in gross profit per order of $12. As
mentioned, the decrease in gross profit can be mainly attributable to the decrease in parts and
accessories added to vehicles sold this quarter, as well as a significant decline in warranty repair orders
and collision repair work.
Operating Expenses
Operating costs consist of four major categories:
Employee costs
Employee costs are the costs associated with employing staff both at the dealerships and at
AutoCanada’s head office. Dealership employees are largely commission based, resulting in employee
costs being largely variable in nature. Our dealership pay structures are tied to meeting sales objectives,
maintaining customer satisfaction indices, as well as improving gross profit and net income.
Administrative costs
Administrative costs comprise the remaining costs of running our dealerships. Advertising, utilities,
service shop consumables, information processing, insurance, and consulting costs comprise a
significant portion of the administrative costs. Administrative costs can be either fixed or variable in
nature. The Company also operates a centralized marketing department and information technology
department, both of which provide services to the dealerships to leverage the size of the group as a
means to lower the operating costs of the dealerships.
Facility lease costs
Facility lease costs relate to the cost of leasing dealership facilities not owned by AutoCanada. Facility
lease costs are fixed in nature as lease contracts are based on the market value of the property and are
long-term.

Page M17 AutoCanada 2017 First Quarter Report
Depreciation of property and equipment
Depreciation of property and equipment relates to the depreciation of the dealership assets including
buildings, machinery and equipment, leasehold improvements, company and lease vehicles, furniture,
and computer hardware. Depreciation rates vary based on the nature of the asset.
Since many operating expenses are variable in nature, Management considers operating expenses as a
percentage of gross profit to be a good indicator of expense control.
The following table summarizes operating expenses as a percentage of gross profit, broken into their
fixed and variable components. Fixed expenses are costs that do not fluctuate with changes in sales
volume while variable expenses are costs that vary depending on sales volume.
Three months ended March 31
Operating expenses as a % of Gross Profit 2017 2016 Change
Employee costs before management transition costs 53.2% 52.9% 0.3%
Management transition costs 1.5% - % 1.5%
Administrative costs - variable 17.9% 18.2% (0.3)%
Total variable expenses 72.6% 71.1% 1.5%
Administrative costs - fixed 5.8% 5.2% 0.6%
Facility lease costs 5.1% 5.3% (0.2)%
Depreciation of property and equipment 4.4% 4.4% - %
Total fixed expenses 15.3% 14.9% 0.4%
Total operating expenses 87.9% 86.0% 1.9%
Variable Expenses
Employee costs have increased in the quarter by 1.8% mainly due to additional management transition
costs, related to the departure of the Company’s former President during the quarter. This accounts for
1.5% of operating expenses as a percentage of gross profit. Excluding management transition costs,
employee costs have slightly increased by 0.3%.
Variable administrative costs decreased by 0.3% for the quarter ended March 31, 2017, as a percentage
of gross profit. The decline is the result of our continued focus on cost control over the quarter.
Management continues to dedicate resources to cost control and expects to the same trend for the
remainder of 2017.
Fixed Expenses
Fixed administrative costs increased by 0.6% for the quarter, as a percentage of gross profit. This is
mainly attributable to increased property taxes on property purchased since the first quarter of 2016 (43
properties owned this quarter compared to 38 properties owned in the previous comparative quarter).
Facility lease costs decreased by 0.2% and depreciation of property and equipment remained constant
for the quarter, as a percentage of gross profit.
Income Taxes
The following table summarizes income taxes for the three month periods ended March 31:
2017
$
2016
$
Current tax 4,487 11,941
Recovery of deferred tax (2,492) (8,825)
Income tax expense 1,995 3,116

AutoCanada 2017 First Quarter Report Page M18
Income tax expense is recognized based on Management's best estimate of the weighted average
annual income tax rate expected for the full financial year. The estimated average annual rates used for
the three month period ended March 31, 2017 was 26.9% (March 31, 2016 26.8%).
Finance Costs
The Company incurs finance costs on its revolving floorplan facilities, long term indebtedness and
banking arrangements.
During the three month period ended March 31, 2017, finance costs on our revolving floorplan facilities
increased by 8.7% to $3.3 million, partially due to an additional $32.0 million of inventory from new
stores which weren’t included in the prior year. Finance costs on long term indebtedness increased by
19.0% to $4.6 million due to the increase in the Company's revolving term facility from $111.0 million in Q1
2016 to $152.1 million in Q1 2017.
Some of our manufacturers provide non-refundable credits on the finance costs for our revolving
floorplan facilities to offset the dealership’s cost of inventory that, on average, effectively provide the
dealerships with interest-free floorplan financing for the first 45 to 60 days of ownership of each
financed vehicle. Floorplan credits are recorded as a reduction in the cost of new vehicle inventory and
subsequently a reduction in the cost of sales as vehicles are sold.
Management believes that a comparison of floorplan financing costs to floorplan credits can be used to
evaluate the efficiency of our new vehicle sales relative to stocking levels.
The following table details the carrying cost of vehicles based on floorplan interest net of floorplan
assistance earned:
Three months ended March 31
(in thousands of dollars) 2017 2016 Change
Floorplan financing 3,295 3,030 265
Floorplan credits earned (3,714) (3,274) (440)
Net carrying cost of vehicle inventory (419) (244) (175)

Page M19 AutoCanada 2017 First Quarter Report
7. SAME STORES RESULTS
Same stores is defined as a franchised automobile dealership that has been owned for at least two full
years since acquisition. The dealership is then included in the quarter thereafter, for same stores analysis.
The Company believes that it takes two years for an acquired dealership or Open Point to achieve
normal operating results.
The dealerships which have been acquired over the past two years are integrating well into their
respective platforms and within the Company. Three dealerships have been added to same stores in the
first quarter of 2017. We believe that there continues to be opportunities within these dealerships and
continue to dedicate significant resources to newly acquired dealerships to successfully integrate
acquisitions in an efficient manner. As a result, we expect to incur additional selling and administrative
costs in the future to successfully integrate new dealerships into our model.
Number of Same Stores by Province
The following table summarizes the number of same stores for the period ended March 31, 2017 by
province:
British
Columbia Alberta Saskatchewan Manitoba Ontario Quebec Atlantic Total
FCA 3 6 1 1 1 - 2 14
Hyundai 2 4 - - 2 - - 8
General Motors 1 3 3 1 - - - 8
Volkswagen 3 2 - 1 - - - 6
Nissan/Infiniti 1 3 - - - - - 4
Mitsubishi - 2 - - - - - 2
BMW/MINI - - - - - 2 - 2
Audi - - - 1 - - - 1
Subaru - 1 - - - - - 1
KIA - 1 - - - - - 1
Total 10 22 4 4 3 2 2 47
Same Stores Revenue and Vehicles Sold
Three Months Ended March 31
(in thousands of dollars) 2017 2016 % Change
Revenue Source
New vehicles - Retail 251,515 277,777 (9.5)%
New vehicles - Fleet 58,810 49,844 18.0%
Total New vehicles 310,325 327,621 (5.3)%
Used vehicles - Retail 104,673 121,601 (13.9)%
Used vehicles - Wholesale 43,987 44,976 (2.2)%
Total Used vehicles 148,660 166,577 (10.8)%
Finance, insurance and other 26,270 26,494 (0.8)%
Subtotal 485,255 520,692 (6.8)%
Parts, service and collision repair 78,096 86,040 (9.2)%
Total 563,351 606,732 (7.1)%
New retail vehicles sold (units) 5,802 6,338 (8.5)%
New fleet vehicles sold (units) 1,542 1,279 20.6%
Used retail vehicles sold (units) 4,076 4,433 (8.1)%
Total 11,420 12,050 (5.2)%
Total vehicles retailed (units) 9,878 10,771 (8.3)%
AutoCanada 2017 First Quarter Report Page M20
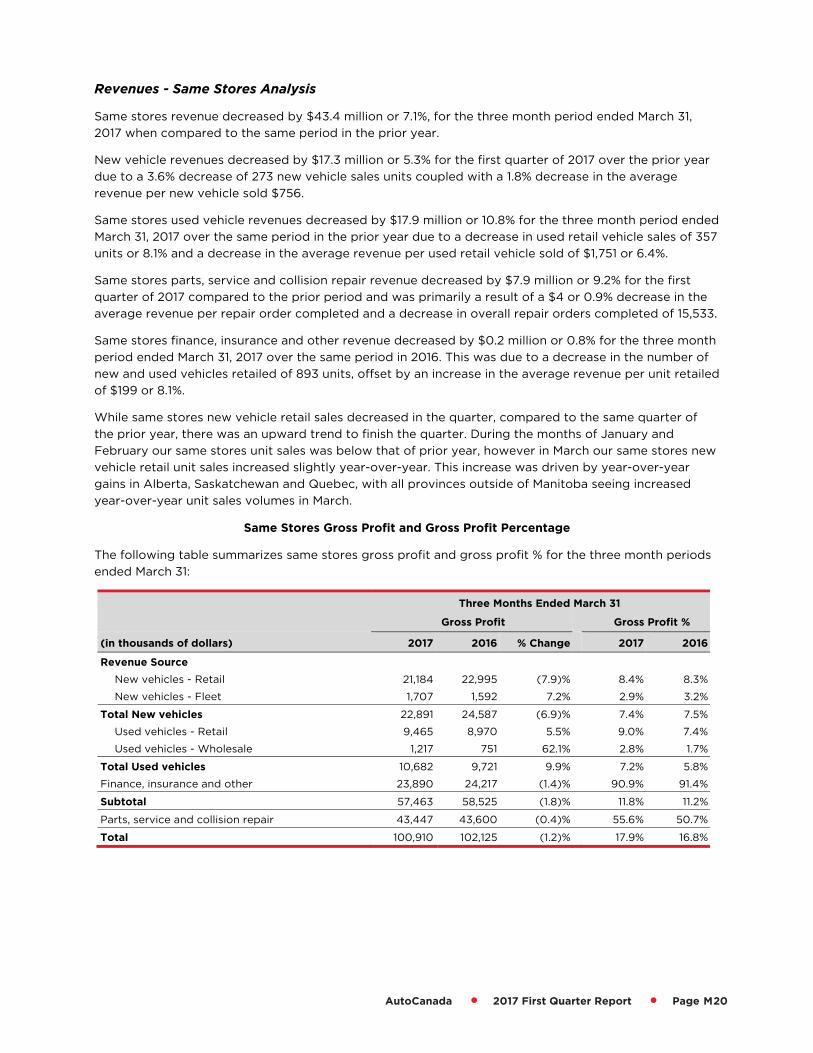
Revenues - Same Stores Analysis
Same stores revenue decreased by $43.4 million or 7.1%, for the three month period ended March 31,
2017 when compared to the same period in the prior year.
New vehicle revenues decreased by $17.3 million or 5.3% for the first quarter of 2017 over the prior year
due to a 3.6% decrease of 273 new vehicle sales units coupled with a 1.8% decrease in the average
revenue per new vehicle sold $756.
Same stores used vehicle revenues decreased by $17.9 million or 10.8% for the three month period ended
March 31, 2017 over the same period in the prior year due to a decrease in used retail vehicle sales of 357
units or 8.1% and a decrease in the average revenue per used retail vehicle sold of $1,751 or 6.4%.
Same stores parts, service and collision repair revenue decreased by $7.9 million or 9.2% for the first
quarter of 2017 compared to the prior period and was primarily a result of a $4 or 0.9% decrease in the
average revenue per repair order completed and a decrease in overall repair orders completed of 15,533.
Same stores finance, insurance and other revenue decreased by $0.2 million or 0.8% for the three month
period ended March 31, 2017 over the same period in 2016. This was due to a decrease in the number of
new and used vehicles retailed of 893 units, offset by an increase in the average revenue per unit retailed
of $199 or 8.1%.
While same stores new vehicle retail sales decreased in the quarter, compared to the same quarter of
the prior year, there was an upward trend to finish the quarter. During the months of January and
February our same stores unit sales was below that of prior year, however in March our same stores new
vehicle retail unit sales increased slightly year-over-year. This increase was driven by year-over-year
gains in Alberta, Saskatchewan and Quebec, with all provinces outside of Manitoba seeing increased
year-over-year unit sales volumes in March.
Same Stores Gross Profit and Gross Profit Percentage
The following table summarizes same stores gross profit and gross profit % for the three month periods
ended March 31:
Three Months Ended March 31
Gross Profit Gross Profit %
(in thousands of dollars) 2017 2016 % Change 2017 2016
Revenue Source
New vehicles - Retail 21,184 22,995 (7.9)% 8.4% 8.3%
New vehicles - Fleet 1,707 1,592 7.2% 2.9% 3.2%
Total New vehicles 22,891 24,587 (6.9)% 7.4% 7.5%
Used vehicles - Retail 9,465 8,970 5.5% 9.0% 7.4%
Used vehicles - Wholesale 1,217 751 62.1% 2.8% 1.7%
Total Used vehicles 10,682 9,721 9.9% 7.2% 5.8%
Finance, insurance and other 23,890 24,217 (1.4)% 90.9% 91.4%
Subtotal 57,463 58,525 (1.8)% 11.8% 11.2%
Parts, service and collision repair 43,447 43,600 (0.4)% 55.6% 50.7%
Total 100,910 102,125 (1.2)% 17.9% 16.8%

Page M21 AutoCanada 2017 First Quarter Report
Gross Profit Same Store Analysis
Same stores gross profit decreased by $1.2 million or 1.2% for the three month period ended March 31,
2017 when compared to the same period in the prior year.
New vehicle gross profit decreased by $1.7 million or 6.9% in the three month period ended March 31,
2017 when compared to 2016 as a result of a 3.6% decrease in new vehicle sales of 273 units and a 3.4%
decrease in the average gross profit per new vehicle sold of $111.
Used vehicle gross profit increased by $1.0 million or 9.9% in the three month period ended March 31,
2017 over the prior year. This was due to an increase in the average gross profit per used vehicle retailed
of $299 or 14.8%, slightly offset by a decrease in the number of used retail vehicles sold of 357 units or
8.1%.
Parts, service and collision repair gross profit decreased by $0.2 million or 0.4% in the three month
period ended March 31, 2017 when compared to the same period in the prior year as a result of a
decrease in the number of repair orders completed of 15,533, offset by an increase in the average gross
profit per repair order completed of $21 or 9.0%.
Finance and insurance gross profit decreased by $0.3 million or 1.4% in the three month period ended
March 31, 2017 when compared to the prior year as a result of an 893 unit decrease, offset by an increase
in the average gross profit per unit sold of $171 or 7.6%.
The following table summarizes same store total revenue for the three month periods ended March 31 by
province:
(in thousands of dollars) 2017 2016 % Change
British Columbia 110,967 137,913 (19.5)%
Alberta 242,901 248,432 (2.2)%
Saskatchewan 57,805 51,238 12.8%
Manitoba 38,995 41,537 (6.1)%
Ontario 19,469 22,234 (12.4)%
Quebec 62,346 65,995 (5.5)%
Atlantic 30,868 39,383 (21.6)%
Total 563,351 606,732 (7.1)%
The following table summarizes same store total gross profit for the three month periods ended
March 31 by province:
(in thousands of dollars) 2017 2016 % Change
British Columbia 19,250 20,190 (4.7)%
Alberta 45,076 45,982 (2.0)%
Saskatchewan 11,013 9,378 17.4%
Manitoba 8,028 7,922 1.3%
Ontario 3,185 3,504 (9.1)%
Quebec 9,666 9,589 0.8%
Atlantic 4,692 5,560 (15.6)%
Total 100,910 102,125 (1.2)%

AutoCanada 2017 First Quarter Report Page M22
8. ACQUISITIONS, RELOCATIONS AND REAL ESTATE
Dealership Operations and Expansion
Our goals are to maximize the profit potential of every store and to generate incremental growth
through accretive acquisitions. With the addition of our first Mercedes-Benz dealership after the quarter,
we now currently operate 57 dealerships, representing 65 franchises. We continue to focus on our
acquisition strategy, focusing on growth throughout Canada with a greater diversification in both
geography and brand. The Company is being patient with our acquisition strategy, focusing on
acquisitions that are accretive and provide diversity. The Company plans to diversify across Canada
through the acquisition of flagship stores in major markets. Management and the Company have
excellent relationships with our manufacturer partners, providing the Company with greater
opportunities with brands we currently operate.
Mercedes-Benz Rive-Sud
On May 1, 2017, the Company purchased 100% of the voting shares of Mercedes-Benz Rive-Sud, which
owns and operates a Mercedes-Benz dealership in Montreal, Quebec for total cash consideration of $17.0
million. The acquisition was financed by drawing on the Company's revolving term facility. In 2016, the
dealership retailed 1,270 new and used vehicles and generated revenue of $90 million. This dealership
represents our first Mercedes-Benz franchise and we are extremely pleased to have added a top selling
luxury brand to our portfolio and look forward to experience sustained success and growth in Mercedes-
Benz.
History has shown that within two years a newly acquired store adopts AutoCanada processes and
culture. As we expand our presence into eastern Canada we are establishing regional and brand
specialists whose role it is to ensure that every store in our portfolio meets not only our volume and
profit targets but also every automakers’ sales and customer satisfaction objectives.
AutoCanada continues to diligently evaluate acquisition opportunities. We believe that we have
sufficient capital to acquire stores that meet our specific criteria in 2017. While our focus remains on
flagship stores in major markets, we are also targeting smaller stores that offer both organic growth as
well as synergies with our other local stores.
Dealership Open Points
The retail automotive industry is a mature industry and rights to open new franchised automobile
dealerships are rarely awarded by the automobile manufacturers. However, from time to time
automobile manufacturers may seek to establish new dealerships in attractive markets. The right to open
a new franchised automobile dealership in a specific location granted by an automobile manufacturer to
a dealer is referred to in the industry as an Open Point. Generally, a new franchised automobile
dealership is fully performing within one to three years depending on the manufacturer and location.
The Company will review on a case by case basis whether to own or lease a particular dealership facility.
In either case, the Company would incur the costs of equipping and furnishing these facilities, including
the costs relating to the integration of our management information systems into the new dealerships.
Costs relating to Open Points are significant, and vary by dealership depending upon size and location.
Volkswagen – Sherwood Park, Alberta
In February 2014, the Company announced that it had been awarded the right to a Volkswagen Open
Point dealership in Sherwood Park, Alberta. The Company has constructed an approximately 45,000
square foot facility in Sherwood Park, designed to Volkswagen Canada image standards. The dealership
opened on February 1, 2017. The Volkswagen Open Point has a potential of 800 new vehicles annually
which the Company anticipates achieving in two to three years of operation.

Page M23 AutoCanada 2017 First Quarter Report
Nissan – Calgary, Alberta
The dealership construction is expected to begin late 2017 with anticipated opening in mid 2018. The
dealership will be constructed by a third party and subsequently leased by the Company.
Nissan - Ottawa, Ontario
AutoCanada intends to operate the dealership out of a new facility, designed to Nissan image standards,
with construction commenced and anticipated opening in late 2017.
Capital Plan
The Company maintains a capital plan for contemplated future capital projects. Details of the capital
plan are described below:
Dealership Relocations
Management estimates the total capital requirements of currently planned dealership relocations to be
approximately $67.6 million to the beginning of 2020. The Company expects dealership relocations to
provide long term earnings sustainability and result in significant improvements in revenues and overall
profitability. Management continually updates its capital plan and as such the estimates provided may
vary as delays occur or projects are added or removed.
Current Dealership Expansion and Imaging Requirements
The Company has identified approximately $63.6 million in capital costs that it may incur to expand or
renovate various current locations through to 2021. The Company is required by its manufacturers to
undertake periodic imaging upgrades to its facilities. Included above are the estimated costs and timing
related to the re-imaging requirements by Hyundai Canada. The Company expects re-imaging to attract
more customers to its dealerships.
Open Point Opportunities
Management regularly reviews potential Open Point opportunities. If successful in being awarded these
opportunities, Management would then estimate additional capital costs to construct suitable facilities
for Open Points. The Company currently estimates approximately $14.1 million in capital costs that it may
incur by the first quarter of 2020 related to currently awarded Open Points. If awarded in the future,
Management will provide additional cost estimates and timing of construction. To be successful in some
opportunities, Management may be required to secure appropriate land for the potential Open Points, in
which case, additional land purchase costs may be incurred in the future.

AutoCanada 2017 First Quarter Report Page M24
The following summarizes the capital plan for contemplated future capital projects:
(in millions of dollars) 2017 2018 2019 2020 2021 Total
Same Store
Dealership Relocations 16.7 15.8 33.1 2.0 - 67.6
Current Dealership Expansion and Imaging Requirements
5.2 13.9 - 3.0 9.5 31.6
Capital Plan 21.9 29.7 33.1 5.0 9.5 99.2
Cash Outlay1 16.3 17.6 21.1 5.0 9.5 69.5
Non Same Store
Current Dealership Expansion and Imaging Requirements
2.9 5.0 6.8 9.5 7.8 32.0
Open Point Opportunities 2.7 7.6 2.1 1.7 - 14.1
Capital Plan 5.6 12.6 8.9 11.2 7.8 46.1
Cash Outlay1 5.6 12.6 8.9 11.2 7.8 46.1
Total Capital Plan 27.5 42.3 42.0 16.2 17.3 145.3
Total Cash outlay1 21.9 30.2 30.0 16.2 17.3 115.6
(1) Refers to amount expected to be funded by internal Company cash flow.
The five year capital plan at March 31, 2017 is $145.3 million for contemplated future capital projects
remaining. Of this, the Company is committed to capital expenditure obligations in the amount of $15.8
million with expected completion of these commitments during the year.
Notwithstanding the capital plan laid out above, expected capital expenditures are subject to deferral
due to issues in obtaining permits, construction delays, changes in re-imaging requirements, economic
factors, or other delays that are normal to the construction process. The above is considered to be a
guide for when the Company expects to perform capital expenditures, however, significant deferral may
occur in the future. Management closely monitors the capital plan and adjusts as appropriate based on
Company performance, manufacturer requirements, expected economic conditions, and individual
dealership needs. Management performs a robust analysis on all future expenditures prior to the
allocation of funds. Timing of dealership relocations is determined based on the dealership’s current
performance, the market, and expected return on invested capital. It is expected that a dealership
relocation will result in improved performance and increased profitability.

Page M25 AutoCanada 2017 First Quarter Report
9. LIQUIDITY AND CAPITAL RESOURCES
Our principal uses of funds are for capital expenditures, repayment of debt, funding the future growth of
the Company and paying dividends to Shareholders. We have historically met these requirements by
using cash generated from operating activities and through short term and long term indebtedness. The
Company had drawn $152.1 million on its $250.0 million revolving term facility.
Under our franchise agreements, manufacturers require us to maintain a minimum level of working
capital. We maintain working capital in excess of manufacturer requirements which may be used for
capital expenditures.
Cash Flow from Operating Activities
Cash flow from operating activities (including changes in non-cash working capital) of the Company for
the three month period ended March 31, 2017 was $3.0 million (cash provided by operating activities of
$15.8 million less negative net change in non-cash working capital of $12.8 million) compared to $6.8
million (cash provided by operating activities of $8.7 million less negative net change in non-cash
working capital of $1.9 million) in the same period of the prior year. The decrease is mainly attributable
to lower net income of $5.8 million compared to $9.0 million in Q1 2016.
Cash Flow from Investing Activities
For the three month period ended March 31, 2017, cash flow from investing activities of the Company
was a net outflow of $5.0 million as compared to a net inflow of $2.2 million in the same period of the
prior year, which is mainly attributable to proceeds on divesture of dealership of $10.1 million in Q1 2016
that did not exist this quarter.
Cash Flow from Financing Activities
For the three month period ended March 31, 2017, cash flow from financing activities was a net outflow
of $3.8 million as compared to a net outflow of $1.6 million in the same period of 2016, which is mainly
attributable the net repayment of indebtedness this quarter compared to net proceeds from
indebtedness in Q1 2016, and dividends paid to non-controlling interests by subsidiaries that did not
occur in Q1 2016.
Credit Facilities and Floor Plan Financing
Details of the Company's credit facilities and floorplan financing are included in Note 28 of the annual
audited consolidated financial statements for the year ended December 31, 2016. Updates to credit
facilities and floorplan financing are included in Note 18 of the interim consolidated financial statements
for the three month period ended March 31, 2017.
AutoCanada 2017 First Quarter Report Page M26
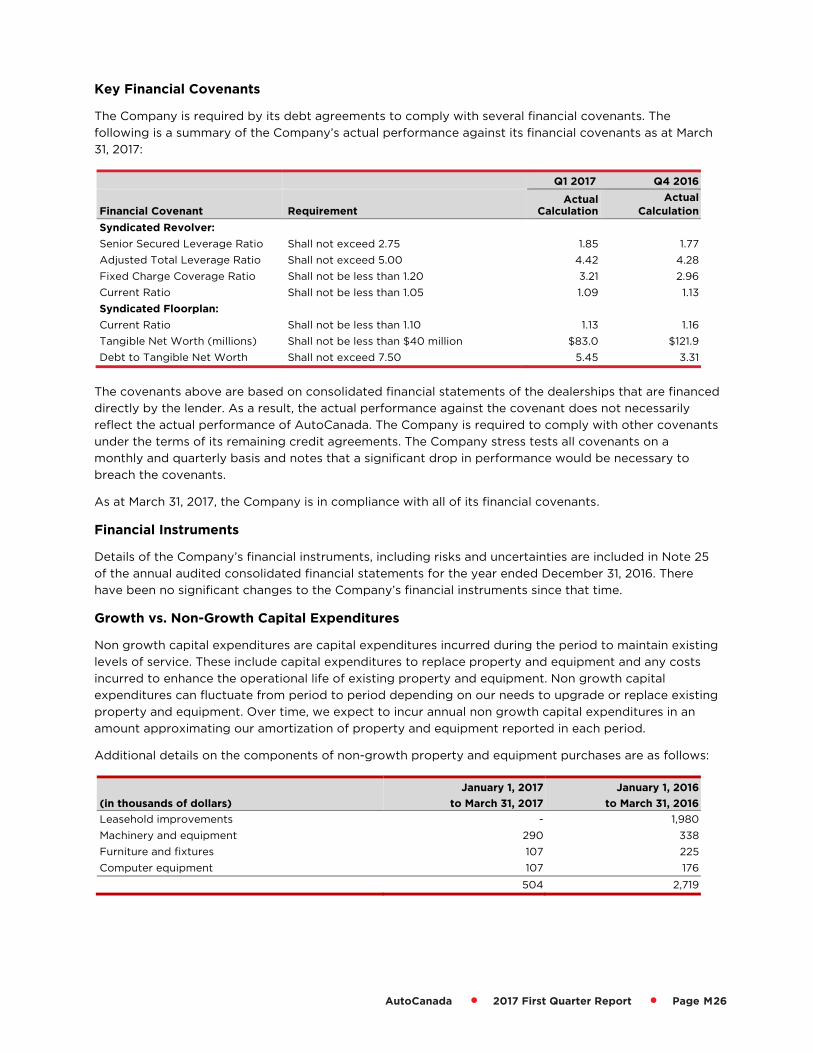
Key Financial Covenants
The Company is required by its debt agreements to comply with several financial covenants. The
following is a summary of the Company’s actual performance against its financial covenants as at March
31, 2017:
Q1 2017 Q4 2016
Financial Covenant Requirement Actual
Calculation
Actual
Calculation
Syndicated Revolver:
Senior Secured Leverage Ratio Shall not exceed 2.75 1.85 1.77
Adjusted Total Leverage Ratio Shall not exceed 5.00 4.42 4.28
Fixed Charge Coverage Ratio Shall not be less than 1.20 3.21 2.96
Current Ratio Shall not be less than 1.05 1.09 1.13
Syndicated Floorplan:
Current Ratio Shall not be less than 1.10 1.13 1.16
Tangible Net Worth (millions) Shall not be less than $40 million $83.0 $121.9
Debt to Tangible Net Worth Shall not exceed 7.50 5.45 3.31
The covenants above are based on consolidated financial statements of the dealerships that are financed
directly by the lender. As a result, the actual performance against the covenant does not necessarily
reflect the actual performance of AutoCanada. The Company is required to comply with other covenants
under the terms of its remaining credit agreements. The Company stress tests all covenants on a
monthly and quarterly basis and notes that a significant drop in performance would be necessary to
breach the covenants.
As at March 31, 2017, the Company is in compliance with all of its financial covenants.
Financial Instruments
Details of the Company’s financial instruments, including risks and uncertainties are included in Note 25
of the annual audited consolidated financial statements for the year ended December 31, 2016. There
have been no significant changes to the Company’s financial instruments since that time.
Growth vs. Non-Growth Capital Expenditures
Non growth capital expenditures are capital expenditures incurred during the period to maintain existing
levels of service. These include capital expenditures to replace property and equipment and any costs
incurred to enhance the operational life of existing property and equipment. Non growth capital
expenditures can fluctuate from period to period depending on our needs to upgrade or replace existing
property and equipment. Over time, we expect to incur annual non growth capital expenditures in an
amount approximating our amortization of property and equipment reported in each period.
Additional details on the components of non-growth property and equipment purchases are as follows:
(in thousands of dollars)
January 1, 2017
to March 31, 2017
January 1, 2016
to March 31, 2016
Leasehold improvements - 1,980
Machinery and equipment 290 338
Furniture and fixtures 107 225
Computer equipment 107 176
504 2,719

Page M27 AutoCanada 2017 First Quarter Report
Amounts relating to the expansion of sales and service capacity are considered growth expenditures.
Growth expenditures are discretionary, represent cash outlays intended to provide additional future cash
flows and are expected to provide benefit in future periods. Dealership relocations are included as
growth expenditures if they contribute to the expansion of sales and service capacity of the dealership.
During the three month period ended March 31, 2017, growth capital expenditures of $4.3 million were
incurred. These expenditures related primarily to costs relating to the opening of Sherwood Park
Volkswagen as well as building construction costs for dealership relocations and future Open Point
dealerships.
The following table provides a reconciliation of the purchase of property and equipment as reported on
the Statement of Cash Flows to the purchase of non-growth property and equipment as calculated in
the free cash flow section below:
(in thousands of dollars) January 1, 2017 to
March 31, 2017 January 1, 2016 to
March 31, 2016
Purchase of property and equipment from the Statement of Cash Flows 4,844 6,864
Less: Amounts related to the expansion of sales and service capacity (4,340) (4,145)
Purchase of non-growth property and equipment 504 2,719
Repairs and maintenance expenditures are expensed as incurred and have been deducted from earnings
for the period. Repairs and maintenance expense incurred during the three month period ended March
31, 2017 were $1.6 million (2016 $1.6 million).
Planned Capital Expenditures
Our capital expenditures consist primarily of leasehold improvements, the purchase of furniture and
fixtures, machinery and equipment, service vehicles, computer hardware and computer software.
Management expects that our annual capital expenditures will increase in the future, as a function of
increases in the number of locations requiring maintenance capital expenditures, the cost of opening
new locations and increased spending on information systems.
For further information regarding planned capital expenditures, see “ACQUISITIONS, RELOCATIONS
AND REAL ESTATE” above.
Financial Position
The following table shows selected audited balances of the Company (in thousands) for December 31,
2016 and December 31, 2015, as well as unaudited balances of the Company at March 31, 2017,
September 30, 2016, June 30, 2016, March 31, 2016, September 30, 2015, and June 30, 2015:
(in thousands of dollars)
March 31, 2017
Dec. 31, 2016
Sep. 30, 2016
Jun. 30, 2016
Mar. 31, 2016
Dec. 31, 2015
Sep. 30, 2015
Jun. 30, 2015
Cash and cash equivalents
100,402 103,221 96,368 77,582 72,878 62,274 77,071 77,676
Trade and other receivables
113,688 85,587 108,363 115,427 116,092 90,821 118,853 124,683
Inventories 701,559 619,718 597,831 555,957 628,641 596,542 581,258 620,837
Total Assets 1,707,063 1,600,615 1,547,344 1,548,879 1,578,225 1,532,182 1,508,028 1,517,978
Revolving floorplan facilities
688,173 582,695 569,581 532,283 600,578 548,322 550,857 607,694
Non-current debt and lease obligations
330,563 330,351 291,408 295,922 293,273 285,759 313,073 287,202

AutoCanada 2017 First Quarter Report Page M28
Net Working Capital
The automobile manufacturers represented by the Company require the Company to maintain net
working capital for each individual dealership. At March 31, 2017, the aggregate of net working capital
requirements was approximately $104.6 million. At March 31, 2017, all working capital requirements had
been met by each dealership. The working capital requirements imposed by the automobile
manufacturers’ may limit our ability to fund capital expenditures, acquisitions, dividends, or other
commitments in the future if sufficient funds are not generated by the Company. Net working capital, as
defined by automobile manufacturers, may not reflect net working capital as determined using GAAP
measures. As a result, it is possible that the Company may meet automobile manufacturers’ net working
capital requirements without having sufficient aggregate working capital using GAAP measures. The
Company defines net working capital amounts as current assets less current liabilities as presented in
the consolidated financial statements.
The net working capital requirements above restrict the Company’s ability to transfer funds up from its
subsidiaries, as each subsidiary dealership is required to be appropriately capitalized as explained above.
In addition, our VCCI Facilities require the VW and Audi dealerships to maintain minimum cash and
equity, which also restricts our ability to transfer and consolidate funds.
Off Balance Sheet Arrangements
The Company has operating lease commitments, with varying terms through 2037, to lease premises
and equipment used for business purposes. The Company leases the majority of the lands and buildings
used in its franchised automobile dealership operations from related parties and other third parties.
The minimum lease payments over the upcoming fiscal years will be as follows:
(in thousands of dollars) $
2017 14,632
2018 17,370
2019 14,945
2020 12,984
2021 12,752
Thereafter 124,594
Total 197,277
Information regarding our contractual obligations with respect to long-term debt, capital lease
obligations and other long-term obligations is included in the Liquidity Risk section of Note 25 of the
Company’s annual consolidated financial statements.
Related Party Transactions
Note 34 of the annual consolidated financial statements of the Company for the year ended December
31, 2016 summarizes the transactions between the Company and its related parties.
Administrative support fees
The Company currently earns administrative support fees from companies controlled by Mr. Patrick
Priestner ("Priestner"), the Chair of the Board of Directors of AutoCanada. The administrative support
fees consist of a portion of human resource and fixed costs associated with providing technological and
administrative support to these companies. The Company believes that providing support services to
these companies provides value to both the companies supported and AutoCanada. By providing
support, AutoCanada is able to reduce its overall overhead expenses.

Page M29 AutoCanada 2017 First Quarter Report
Related party transactions are measured based on the proportionate allocation of actual costs incurred
multiplied by the number of resources and/or hours provided to or used by the related party. There are
no ongoing or continuing obligations of the Company to provide these services or for the related parties
to utilize these services.
Loan to related parties
The Company has provided dealership loan financing to PPH Holdings Ltd. ("PPH"), a company
controlled and formed by Priestner. The Company holds no ownership interest in PPH or its subsidiaries.
The loans to associates have been structured as executed to satisfy the requirements of the
manufacturer.
10. OUTSTANDING SHARES
As at March 31, 2017, the Company had 27,459,683 common shares outstanding. Basic and diluted
weighted average number of shares outstanding for the three month period ended March 31, 2017 were
27,358,766 and 27,509,758, respectively. As at March 31, 2017, the value of the shares held in trust was
$2.1 million (2016 - $3.6 million) which was comprised of 95,123 (2016 - 133,093) shares. As at May 4,
2017, there were 27,459,683 shares issued and outstanding.
11. DIVIDENDS
Management reviews the Company’s financial results on a monthly basis. The Board of Directors reviews
the financial results periodically to determine whether a dividend shall be paid based on a number of
factors.
The following table summarizes the dividends declared by the Company in 2017:
Record date Payment date Per Share $ Total $
February 28, 2017 March 15, 2017 0.10 2,736
On May 4, 2017 the Board declared a quarterly eligible dividend of $0.10 per common share on
AutoCanada’s outstanding Class A shares, payable on June 15, 2017 to shareholders of record at the
close of business on May 31, 2017.
As per the terms of the HSBC facility, we are restricted from declaring dividends and distributing cash if
we are in breach of financial covenants or our available margin and facility limits or if such dividend
would result in a breach of our covenants or our available margin and facility limits. At this time, the
Company is within its covenants.

AutoCanada 2017 First Quarter Report Page M30
12. FREE CASH FLOW
The Company has defined free cash flow to be cash flows provided by operating activities (including
changes in non-cash operating working capital) less capital expenditures (excluding capital assets
acquired by acquisitions or purchases of real estate).
(in thousands of dollars, except unit and per unit amounts)
Q1 2017
Q4 2016
Q3 2016
Q2 2016
Q1 2016
Q4 2015
Q3 2015
Q2 2015
Cash provided by operating activities 2,967 24,930 32,594 40,374 6,831 12,420 20,139 21,004
Deduct:
Purchase of property and equipment (2,346) (1,506) (1,697) (2,452) (2,786) (3,354) (5,144) (3,228)
Free cash flow 1 621 23,424 30,897 37,922 4,045 9,066 14,995 17,776
Weighted average
shares outstanding at end of period 27,358,766 27,353,431 27,347,585 27,338,767 27,362,440 25,016,637 24,440,080 24,424,598
Free cash flow per share 0.02 0.86 1.13 1.39 0.15 0.36 0.61 0.73
Free cash flow 12 month trailing 92,864 96,288 81,930 66,028 45,882 38,675 69,431 60,695
(1) This financial measure is identified and defined under the section "NON-GAAP MEASURES”.
Management believes that free cash flow (see “NON-GAAP MEASURES”) can fluctuate significantly as a
result of historical fluctuations in our business operations that occur on a quarterly basis as well as the
resulting fluctuations in our trade receivables and inventory levels and the timing of the payments of
trade payables and revolving floorplan facilities.
Changes in non-cash working capital consist of fluctuations in the balances of trade and other
receivables, inventories, finance lease receivables, other current assets, trade and other payables, vehicle
repurchase obligations and revolving floorplan facilities. Factors that can affect these items include
seasonal sales trends, strategic decisions regarding inventory levels, the addition of new dealerships, and
the day of the week on which period end cutoffs occur.
The following table summarizes the net decrease in cash due to changes in non-cash working capital for
the three month periods ended March 31, 2017 and March 31, 2016.
(in thousands of dollars)
January 1, 2017 to
March 31, 2017
January 1, 2016 to
March 31, 2016
Trade and other receivables (28,101) (25,254)
Inventories (82,837) (32,601)
Finance lease receivables 663 (600)
Other current assets (1,090) (2,030)
Trade and other payables (6,522) 6,438
Vehicle repurchase obligations (345) (132)
Revolving floorplan facilities 105,478 52,256
(12,754) (1,923)

Page M31 AutoCanada 2017 First Quarter Report
Adjusted Free Cash Flow
The Company has defined adjusted free cash flow to be cash flows provided by operating activities
(before changes in non-cash operating working capital) less non-growth capital expenditures.
(in thousands of dollars, except unit and per unit amounts)
Q1 2017
Q4 2016
Q3 2016
Q2 2016
Q1 2016
Q4 2015
Q3 2015
Q2 2015
Cash provided by operating activities before changes in non-cash working capital
15,721 14,344 28,996 24,050 8,754 11,242 23,082 22,386
Deduct:
Purchase of non-growth property and equipment
(504) (1,211) (1,230) (2,418) (2,719) (3,164) (4,131) (3,199)
Adjusted free cash flow 1
15,217 13,133 27,766 21,632 6,035 8,078 18,951 19,187
Weighted average shares outstanding at end of period
27,358,766 27,353,431 27,347,585 27,338,767 27,362,440 25,016,637 24,440,080 24,424,598
Adjusted free cash flow per share
0.56 0.48 1.02 0.79 0.22 0.32 0.78 0.79
Adjusted free cash flow-12 month trailing
77,748 68,566 63,511 54,696 52,251 38,796 47,840 51,002
(1) This financial measure is identified and defined under the section "NON-GAAP MEASURES".
Management believes that non-growth property and equipment is necessary to maintain and sustain the
current productive capacity of the Company’s operations and cash available for growth. Management
believes that maintenance capital expenditures should be funded by cash flow provided by operating
activities. Capital spending for the expansion of sales and service capacity is expected to improve future
free cash and as such is not deducted from cash flow provided by operating activities before changes in
non-cash working capital in arriving at adjusted free cash flow. Adjusted free cash flow is a measure
used by Management in forecasting and determining the Company’s available resources for future
capital expenditure, repayment of debt, funding the future growth of the Company and dividends to
Shareholders.
In the three month period ended March 31, 2017, the Company paid approximately $2.8 million in 2017
tax installments (2016 - $6.3 million). Accordingly, this reduced our adjusted free cash flow by this
amount. The Company expects the payment of corporate income taxes to have a more significant
negative affect on free cash flow and adjusted free cash flow. See “RESULTS FROM OPERATIONS -
Income Taxes” for further detail regarding the impact of corporate income taxes on cash flow.

AutoCanada 2017 First Quarter Report Page M32
Adjusted Return on Capital Employed
The Company has defined Adjusted Return on Capital Employed to be EBIT (EBITDA, as defined in
(“NON-GAAP MEASURES”), less depreciation and amortization) divided by Average Capital Employed in
the Company (average of shareholders’ equity and interest bearing debt, excluding floorplan financing,
for the period, less the comparative adjustment defined below). Calculations below represent the results
on a quarterly basis, except for the adjusted return on capital employed - 12 month trailing which
incorporates the results based on the trailing 12 months for the periods presented.
(in thousands of dollars, except unit and per unit amounts)
Q1 2017
Q4 2016
Q3 2016
Q2 2016
Q1 2016
Q4 2015
Q3 2015
Q2 2015
EBITDA1,2 17,228 28,536 26,915 30,845 21,010 23,524 29,487 30,730
Deduct:
Depreciation of property and equipment
(4,852) (4,921) (4,860) (4,822) (4,954) (5,176) (5,063) (4,461)
EBIT1,2 12,376 23,615 22,055 26,023 16,056 18,348 24,424 26,269
Average long-term debt 351,986 333,310 315,678 310,281 300,520 312,471 314,443 277,571
Average shareholder's equity 498,732 491,026 503,163 516,513 510,595 481,112 447,774 439,711
Average capital employed1 850,718 824,336 818,841 826,794 811,115 793,583 762,217 717,282
Return on capital 1.5% 2.9% 2.7% 3.1% 2.0% 2.3% 3.2% 3.7%
Comparative adjustment3 25,959 25,959 (13,191) (13,191) (13,191) (13,191) (17,264) (17,264)
Adjusted average capital employed1
876,677 830,720 805,650 813,603 797,924 778,354 744,953 700,018
Adjusted return on capital employed1
1.4% 2.8% 2.7% 3.2% 2.0% 2.4% 3.3% 3.8%
Adjusted return on capital employed - 12 month trailing
9.9% 10.9% 10.6% 11.2% 11.7% 11.2% 12.7% 15.5%
(1) These financial measures are identified and defined under the section "NON-GAAP MEASURES". (2) EBITDA and EBIT used in the calculation of Adjusted Return on Capital Employed is calculated using the financial results including
non-controlling interests. (3) A comparative adjustment has been made to adjust for impairments and reversals of impairments of intangible assets. Due to the
increased frequency of impairments and reversals of impairments, Management has provided an adjustment to freeze intangible assets at the pre-IFRS amount of $43,700. As a result, all differences from January 1, 2010 forward under IFRS have been adjusted at the post-tax rate at the time the adjustment to the intangible asset carrying amount was made. Management believes that the adjusted return on capital employed provides more useful information about the return on capital employed.
Management believes that Adjusted Return on Capital Employed (see “NON-GAAP MEASURES”) is a
good measure to evaluate the profitability of our invested capital. As a corporation, Management of
AutoCanada may use this measure to compare potential acquisitions and other capital investments
against our internally computed cost of capital to determine whether the investment is expected to
create value for our shareholders. Management may also use this measure to look at past acquisitions,
capital investments and the Company as a whole to ensure shareholder value is being achieved by these
capital investments.

Page M33 AutoCanada 2017 First Quarter Report
13. CRITICAL ACCOUNTING ESTIMATES AND
ACCOUNTING POLICY DEVELOPMENTS
A complete listing of critical accounting policies, estimates, judgments and measurement uncertainty
can be found in Notes 3 and 5 of the annual consolidated financial statements for the year ended
December 31, 2016.
Certain new standards, interpretations, amendments and improvements to existing standards were
issued by the IASB or International Financial Reporting Interpretations Committee (“IFRIC”) that are not
yet effective for the period ended March 31, 2017. A listing of the standards issued which are applicable
to the Company can be found in Note 4 of the annual consolidated financial statements for the year
ended December 31, 2016. The Company adopted the amendments to IAS 7, Statement of Cash Flows,
effective for the interim and annual consolidated financial statements commencing January 1, 2017. The
amendment standard does not have a material impact on the financial statements.
14. DISCLOSURE CONTROLS AND INTERNAL
CONTROLS OVER FINANCIAL REPORTING
During the quarter ended March 31, 2017, there were no changes in the Company's disclosure controls or
internal controls over financial reporting that materially affected, or would be reasonable likely to
materially affect, such controls.
15. RISK FACTORS
We face a number of business risks that could cause our actual results to differ materially from those
disclosed in this MD&A (See “FORWARD LOOKING STATEMENTS”). Investors and the public should
carefully consider our business risks, other uncertainties and potential events as well as the inherent
uncertainty of forward looking statements when making investment decisions with respect to
AutoCanada. If any of the business risks identified by AutoCanada were to occur, our business, financial
condition, results of operations, cash flows or prospects could be materially adversely affected. In such
case, the trading price of our shares could decline. Additional risks and uncertainties not presently
known to us or that we currently deem immaterial may also adversely affect our business and
operations. A comprehensive discussion of the known risk factors of AutoCanada and additional
business risks is available in our 2016 Annual Information Form dated March 16, 2017 available on the
SEDAR website at www.sedar.com.
16. FORWARD LOOKING STATEMENTS
Certain statements contained in the MD&A are forward looking statements and information (collectively
"forward-looking statements"), within the meaning of the applicable Canadian securities legislation. We
hereby provide cautionary statements identifying important factors that could cause our actual results
to differ materially from those projected in these forward looking statements. Any statements that
express, or involve discussions as to, expectations, beliefs, plans, objectives, assumptions or future
events or performance (often, but not always, through the use of words or phrases such as "will likely
result", "are expected to", "will continue", "is anticipated", "projection", "vision", "goals", "objective",
"target", "schedules", "outlook", "anticipate", "expect", "estimate", "could", "should", "plan", "seek",
"may", "intend", "likely", "will", "believe", "shall" and similar expressions are not historical facts and are
forward-looking and may involve estimates and assumptions and are subject to risks, uncertainties and
other factors some of which are beyond our control and difficult to predict. Accordingly, these factors
could cause actual results or outcomes to differ materially from those expressed in the forward looking

AutoCanada 2017 First Quarter Report Page M34
statements. Therefore, any such forward looking statements are qualified in their entirety by reference to
the factors discussed throughout this document.
Details of the Company's material forward looking statements are included in the Company's most
recent Annual Information Form. The Company's most recent Annual Information Form and other
documents filed with securities regulatory authorities (accessible through the SEDAR website
www.sedar.com) describe the risks, material assumptions and other factors that could influence actual
results and which are incorporated herein by reference.
Further, any forward-looking statement speaks only as of the date on which such statement is made,
and, except as required by applicable law, we undertake no obligation to update any forward looking
statement to reflect events or circumstances after the date on which such statement is made or to
reflect the occurrence of unanticipated events. New factors emerge from time to time, and it is not
possible for Management to predict all of such factors and to assess in advance the impact of each such
factor on our business or the extent to which any factor, or combination of factors, may cause actual
results to differ materially from those contained in any forward looking statement.
17. NON-GAAP MEASURES
Our MD&A contains certain financial measures that do not have any standardized meaning prescribed by
Canadian GAAP. Therefore, these financial measures may not be comparable to similar measures
presented by other issuers. Investors are cautioned these measures should not be construed as an
alternative to net earnings (loss) or to cash provided by (used in) operating, investing, and financing
activities determined in accordance with Canadian GAAP, as indicators of our performance. We provide
these measures to assist investors in determining our ability to generate earnings and cash provided by
(used in) operating activities and to provide additional information on how these cash resources are
used. We list and define these “NON-GAAP MEASURES” below:
EBITDA
EBITDA is a measure commonly reported and widely used by investors as an indicator of a company’s
operating performance and ability to incur and service debt, and as a valuation metric. The Company
believes EBITDA assists investors in comparing a company’s performance on a consistent basis without
regard to depreciation and amortization and asset impairment charges which are non-cash in nature and
can vary significantly depending upon accounting methods or non-operating factors such as historical
cost. References to "EBITDA" are to earnings before interest expense (other than interest expense on
floorplan financing and other interest), income taxes, depreciation, amortization and asset impairment
charges. EBITDA attributable to AutoCanada shareholders refers to the parent portion of consolidated
financial results. Non-controlling interest (the portion of ownership not attributable to the parent) is
excluded.
Adjusted EBITDA
Adjusted EBITDA is an indicator of a company's operating performance and ability to incur and service
debt. The portion of share-based compensation related to changes in the share price and its impact on
the Company's cash-settled portions of its share-based compensation programs, the revaluation of
redemption liabilities, the unrealized gain or loss on embedded derivatives, gains or losses on dealership
divestitures and certain non-recurring items are added back to EBITDA to get to adjusted EBITDA. The
Company believes adjusted EBITDA provides a better representation of continuing operations and
improved continuity with respect to the comparison of our operating results over a period of time.
Adjusted EBITDA attributable to AutoCanada shareholders refers to the parent portion of consolidated
financial results. Non-controlling interest (the portion of ownership not attributable to the parent) is
excluded.

Page M35 AutoCanada 2017 First Quarter Report
Adjusted net earnings and Adjusted net earnings per share
Adjusted net earnings and adjusted net earnings per share are measures of our profitability. Adjusted
net earnings is calculated by adding back the after-tax effect of impairment or reversals of impairment
of intangible assets, impairments of goodwill, the revaluation of redemption liabilities, the unrealized
gain or loss on embedded derivatives, and the portion of share-based compensation related to changes
in the share price and its impact on the Company's cash-settled portions of its share-based
compensation programs, gains or losses on dealership divestitures and certain non-recurring items.
Adding back these amounts to net earnings allows Management to better assess the net earnings of the
Company from continuing operations. Adjusted net earnings per share is calculated by dividing adjusted
net earnings by the weighted-average number of shares outstanding.
EBIT
EBIT is a measure used by Management in the calculation of Return on capital employed (defined
below). Management’s calculation of EBIT is EBITDA (calculated above) less depreciation and
amortization.
Free Cash Flow
Free cash flow is a measure used by Management to evaluate its performance. While the closest
Canadian GAAP measure is cash provided by operating activities, free cash flow is considered relevant
because it provides an indication of how much cash generated by operations is available after capital
expenditures. It shall be noted that although we consider this measure to be free cash flow, financial and
non-financial covenants in our credit facilities and dealer agreements may restrict cash from being
available for distributions, re-investment in the Company, potential acquisitions, or other purposes.
Investors should be cautioned that free cash flow may not actually be available for growth or
distribution of the Company. References to "Free cash flow" are to cash provided by (used in) operating
activities (including the net change in non-cash working capital balances) less capital expenditure (not
including acquisitions of dealerships and dealership facilities).
Adjusted Free Cash Flow
Adjusted free cash flow is a measure used by Management to evaluate its performance. Adjusted free
cash flow is considered relevant because it provides an indication of how much cash generated by
operations before changes in non-cash working capital is available after deducting expenditures for
non-growth capital assets. It shall be noted that although we consider this measure to be adjusted free
cash flow, financial and non-financial covenants in our credit facilities and dealer agreements may
restrict cash from being available for distributions, re-investment in the Company, potential acquisitions,
or other purposes. Investors should be cautioned that adjusted free cash flow may not actually be
available for growth or distribution of the Company. References to “Adjusted free cash flow” are to cash
provided by (used in) operating activities (before changes in non-cash working capital balances) less
non-growth capital expenditures.

AutoCanada 2017 First Quarter Report Page M36
Absorption Rate
Absorption rate is an operating measure commonly used in the retail automotive industry as an indicator
of the performance of the parts, service and collision repair operations of a franchised automobile
dealership. Absorption rate is not a measure recognized by GAAP and does not have a standardized
meaning prescribed by GAAP. Therefore, absorption rate may not be comparable to similar measures
presented by other issuers that operate in the retail automotive industry. References to ‘‘absorption
rate’’ are to the extent to which the gross profits of a franchised automobile dealership from parts,
service and collision repair cover the costs of these departments plus the fixed costs of operating the
dealership, but does not include expenses pertaining to our head office. For this purpose, fixed operating
costs include fixed salaries and benefits, administration costs, occupancy costs, insurance expense,
utility expense and interest expense (other than interest expense relating to floor plan financing) of the
dealerships only.
Average Capital Employed
Average capital employed is a measure used by Management to determine the amount of capital
invested in AutoCanada and is used in the measure of Return on Capital Employed (described below).
Average capital employed is calculated as the average balance of interest bearing debt for the period
(including current portion of long-term debt, excluding revolving floorplan facilities) and the average
balance of shareholders equity for the period. Management does not include future income tax,
non-interest bearing debt, or revolving floorplan facilities in the calculation of average capital employed
as it does not consider these items to be capital, but rather debt incurred to finance the operating
activities of the Company.
Adjusted Average Capital Employed
Adjusted average capital employed is a measure used by Management to determine the amount of
capital invested in AutoCanada and is used in the measure of Adjusted Return on Capital Employed
(described below). Adjusted average capital employed is calculated as the average balance of interest
bearing debt for the period (including current portion of long-term debt, excluding revolving floorplan
facilities) and the average balance of shareholders equity for the period, adjusted for impairments of
intangible assets, net of deferred tax. Management does not include future income tax, non-interest
bearing debt, or revolving floorplan facilities in the calculation of adjusted average capital employed as it
does not consider these items to be capital, but rather debt incurred to finance the operating activities
of the Company.
Return on Capital Employed
Return on capital employed is a measure used by Management to evaluate the profitability of our
invested capital. As a corporation, Management of AutoCanada may use this measure to compare
potential acquisitions and other capital investments against our internally computed cost of capital to
determine whether the investment shall create value for our shareholders. Management may also use
this measure to look at past acquisitions, capital investments and the Company as a whole to ensure
shareholder value is being achieved by these capital investments. Return on capital employed is
calculated as EBIT (defined above) divided by Average Capital Employed (defined above).
Adjusted Return on Capital Employed
Adjusted return on capital employed is a measure used by Management to evaluate the profitability of
our invested capital. As a corporation, management of AutoCanada may use this measure to compare
potential acquisitions and other capital investments against our internally computed cost of capital to
determine whether the investment shall create value for our shareholders. Management may also use
this measure to look at past acquisitions, capital investments and the Company as a whole to ensure
shareholder value is being achieved by these capital investments. Adjusted return on capital employed is
calculated as EBIT (defined above) divided by Adjusted Average Capital Employed (defined above).

Page M37 AutoCanada 2017 First Quarter Report
Cautionary Note Regarding Non-GAAP Measures
EBITDA, EBIT, Free Cash Flow, Absorption Rate, Average Capital Employed, Return on Capital
Employed, Adjusted Average Capital Employed and Adjusted Return on Capital Employed are not
earnings measures recognized by GAAP and do not have standardized meanings prescribed by GAAP.
Investors are cautioned that these non-GAAP measures should not replace net earnings or loss (as
determined in accordance with GAAP) as an indicator of the Company's performance, of its cash flows
from operating, investing and financing activities or as a measure of its liquidity and cash flows. The
Company's methods of calculating EBITDA, EBIT, Free Cash Flow, Absorption Rate, Average Capital
Employed, Return on Capital Employed. Adjusted Average Capital Employed and Adjusted Return on
Capital Employed may differ from the methods used by other issuers. Therefore, the Company's EBITDA,
EBIT, Free Cash Flow, Absorption Rate, Average Capital Employed, Return on Capital Employed,
Adjusted Average Capital Employed and Adjusted Return on Capital Employed may not be comparable
to similar measures presented by other issuers.


AutoCanada Inc.
200 - 15511 123 Avenue NW
Edmonton, AB T5V 0C3
www.autocan.ca
Recommended