Maps
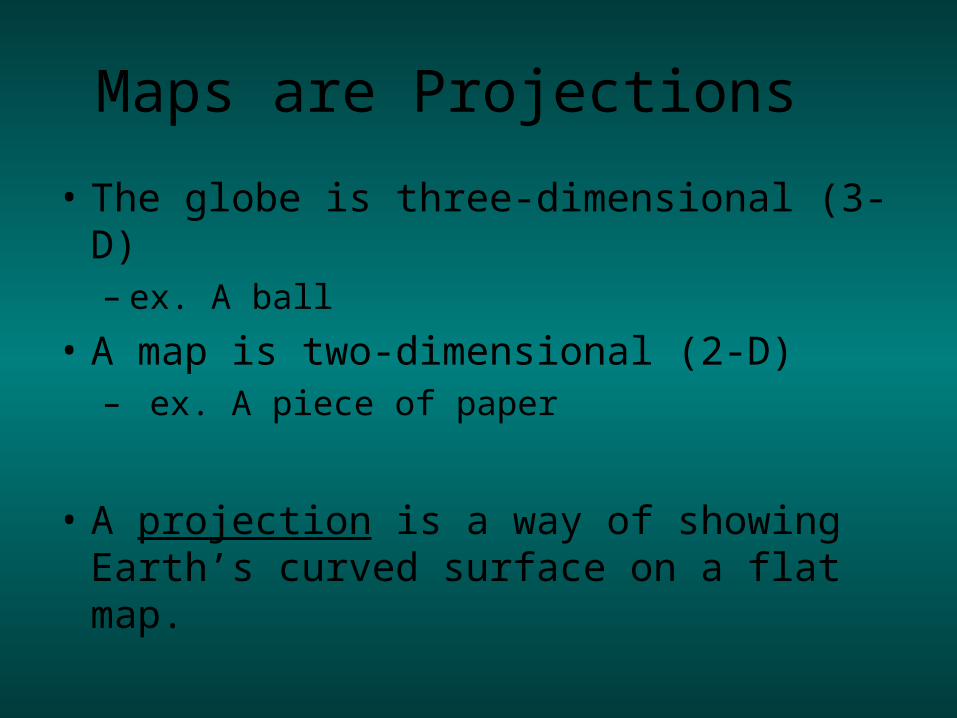
Maps are Projections
• The globe is three-dimensional (3-D) – ex. A ball
• A map is two-dimensional (2-D)– ex. A piece of paper
• A projection is a way of showing Earth’s curved surface on a flat map.
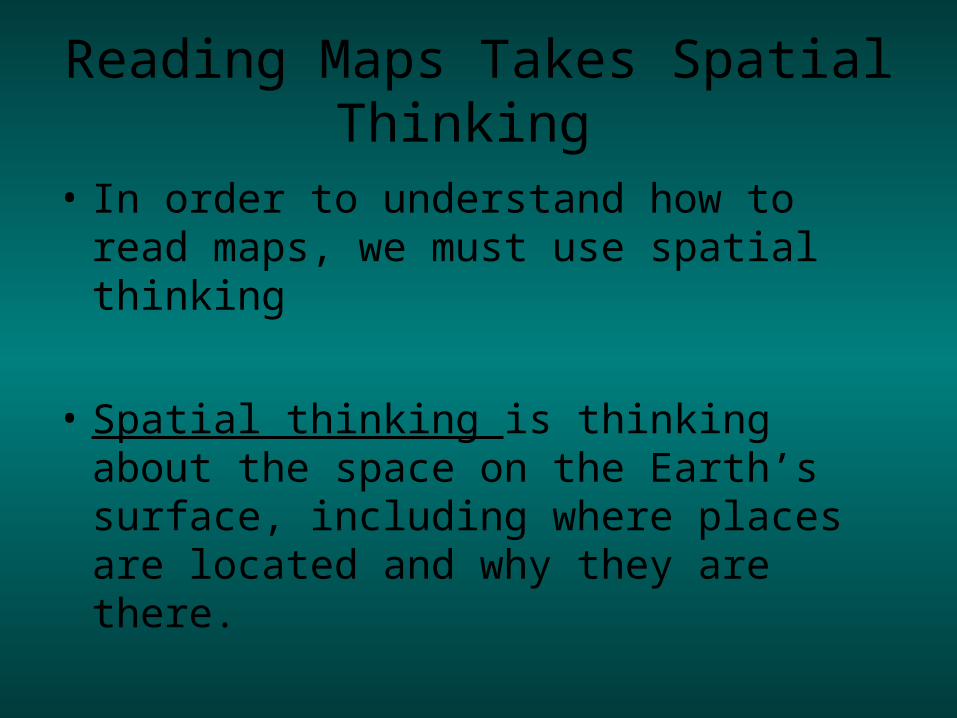
Reading Maps Takes Spatial Thinking
• In order to understand how to read maps, we must use spatial thinking
• Spatial thinking is thinking about the space on the Earth’s surface, including where places are located and why they are there.

Features of Maps• Title: Tells the subject of
the map or globe
• Orientation/Compass Rose: Shows the directions North, South, East, West.
• Symbols: represents information such as natural resources and economic activities

More Features of Maps
• Labels: the names of places
• Colors: represent different kinds of information
• Scale: shows how much distance on earth is represented by the distance on the map or globe
Features of Maps
• Legend: or a key, what the symbols and colors on the map or globe represent
• Locator globe: shows the specific area of the world that is shown on a map
• Lines of Latitude
• Lines of Longitude


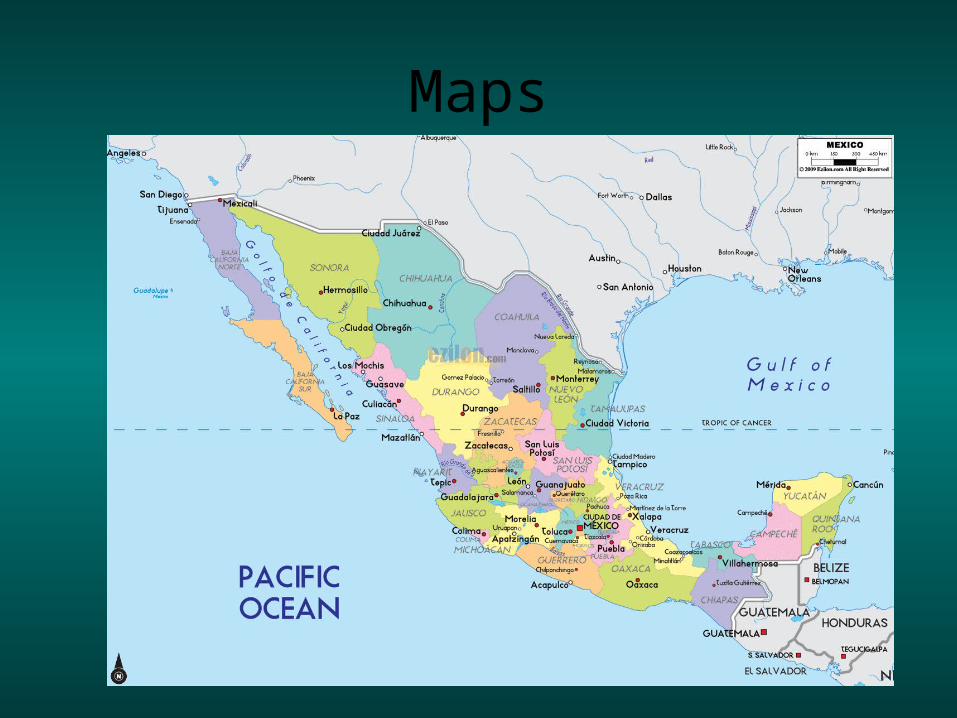
Analyzing the Map
What is the map missing?
• Compass Rose with Cardinal Directions
• A complete map name: It is actually a physical map of North America
• Locator globe
What does it contain? • Legend
• Scale
• Name
• Lines of latitude
• Labels
• Lines of longitude• Colors

3 Types of Maps
• Physical
• Political
• Special Purpose/Thematic
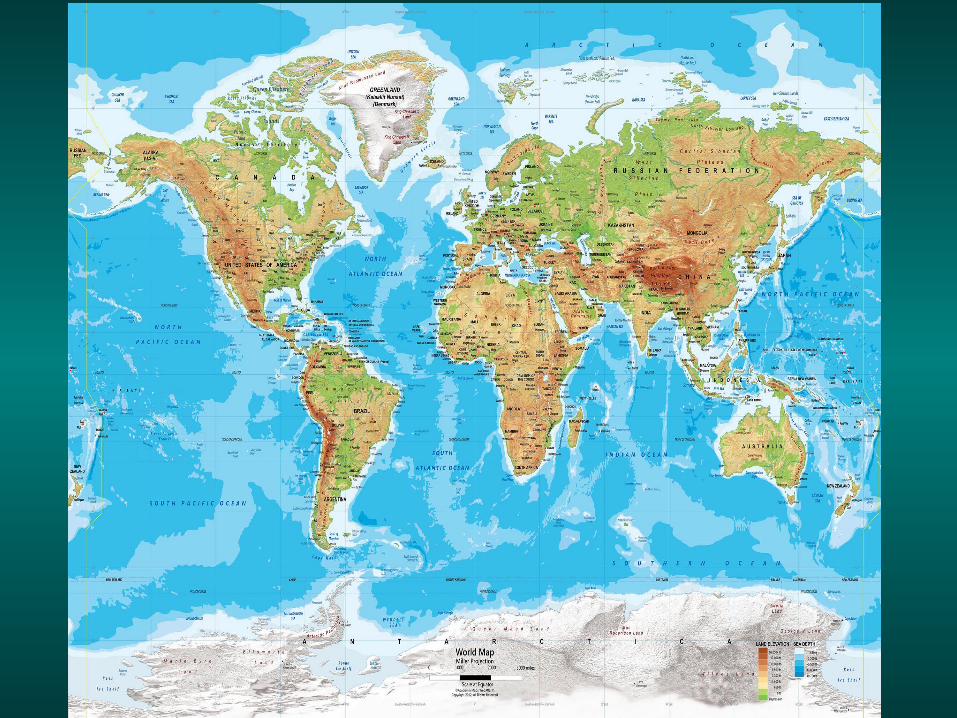
Physical Maps• Physical maps show what the surface of the Earth
looks like.
• A physical map highlights Earth’s natural features, such as mountains, forests, land elevation, sea depth.


Political Maps• Political maps show how people have divided
places on the Earth into countries, states, cities and other units for the purpose of governing them.
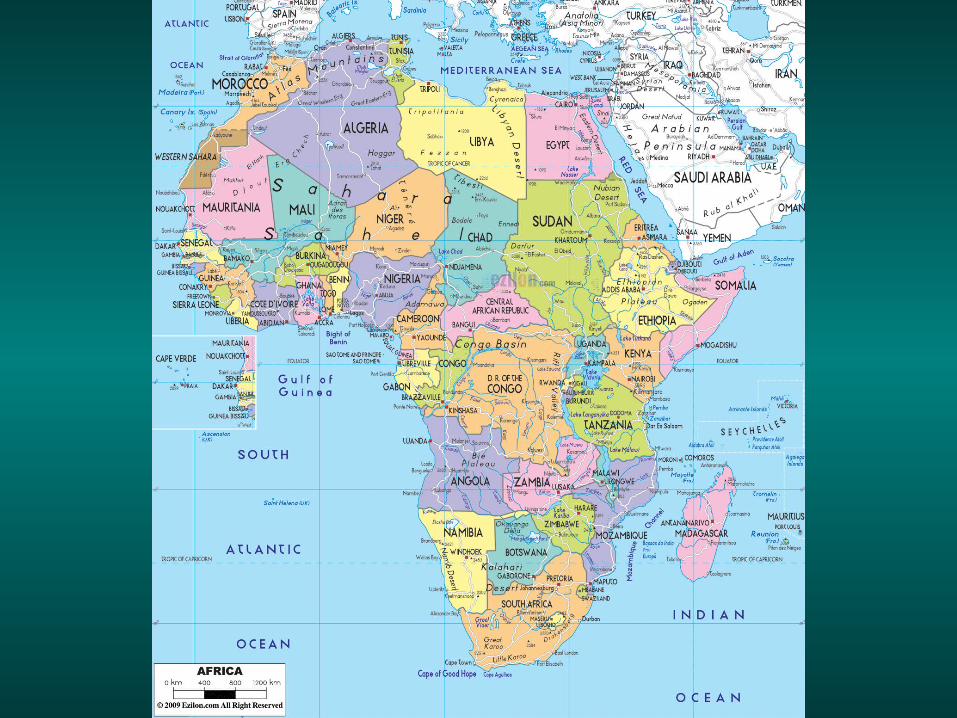

Political Maps A political map often uses colors to show the boundaries between states or countries.

Special Purpose/Thematic Maps A thematic map is a type of map especially designed to show a particular theme connected with a
specific geographical area.
These maps can portray physical, social, political, cultural, economic, sociological, agricultural and
other aspects of a city, state, region, nation or continent.
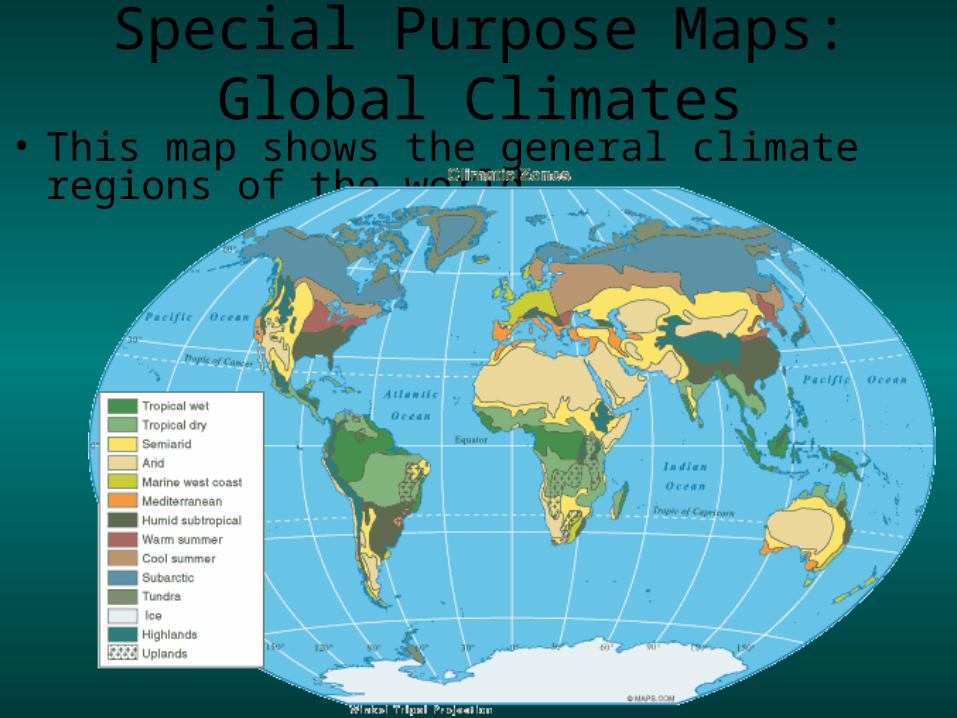
Special Purpose Maps: Global Climates
• This map shows the general climate regions of the world.
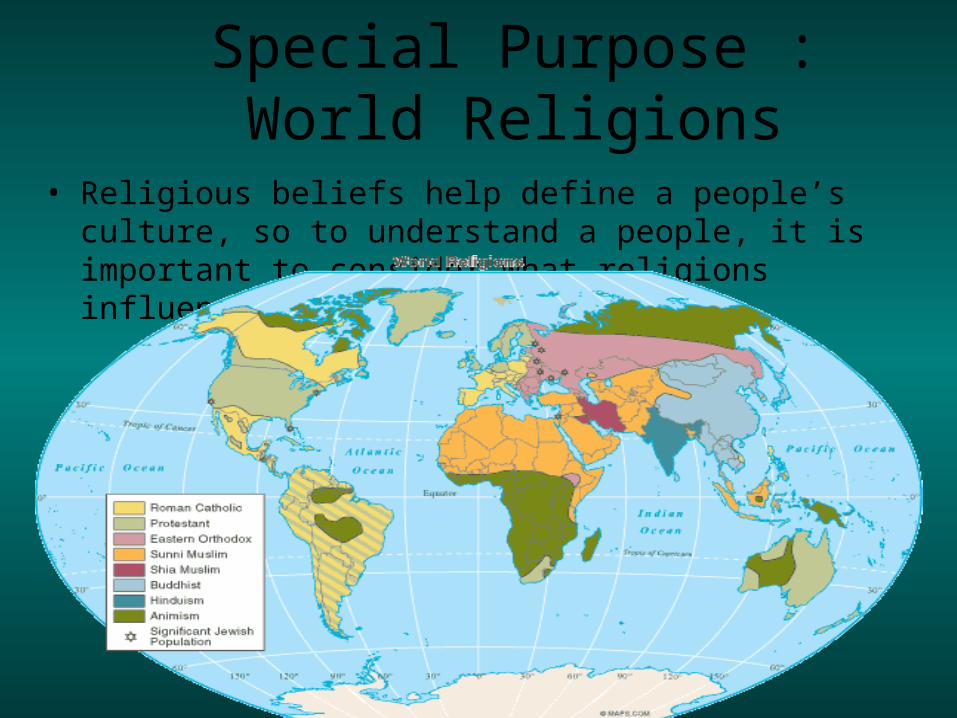
Special Purpose : World Religions
• Religious beliefs help define a people’s culture, so to understand a people, it is important to consider what religions influence that group.

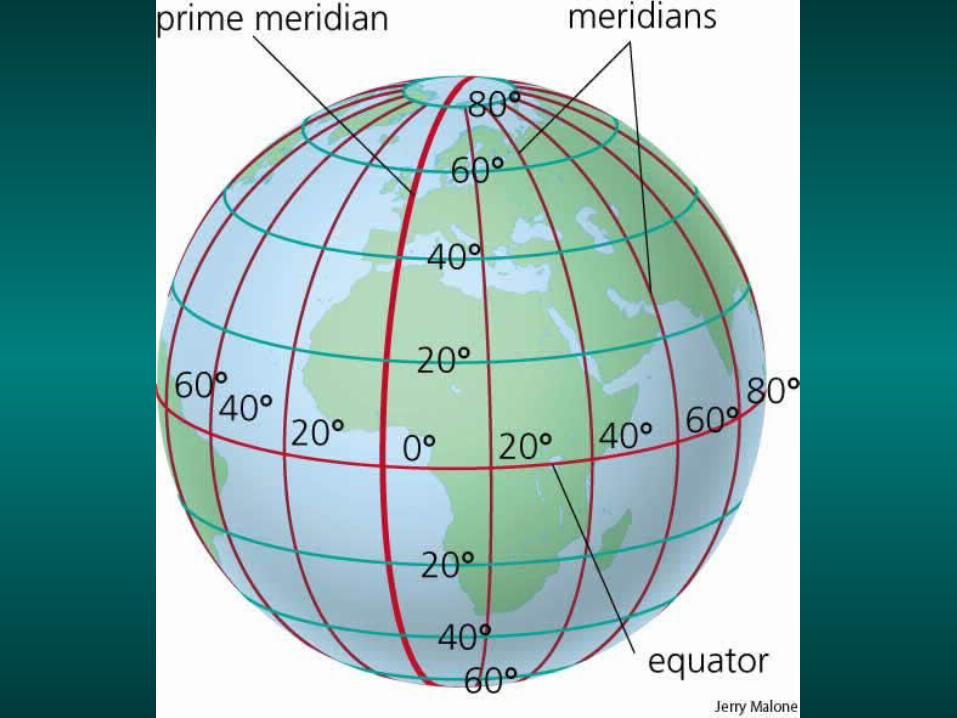
Latitude and Longitude• The earth is divided into lots of lines
called latitude and longitude.
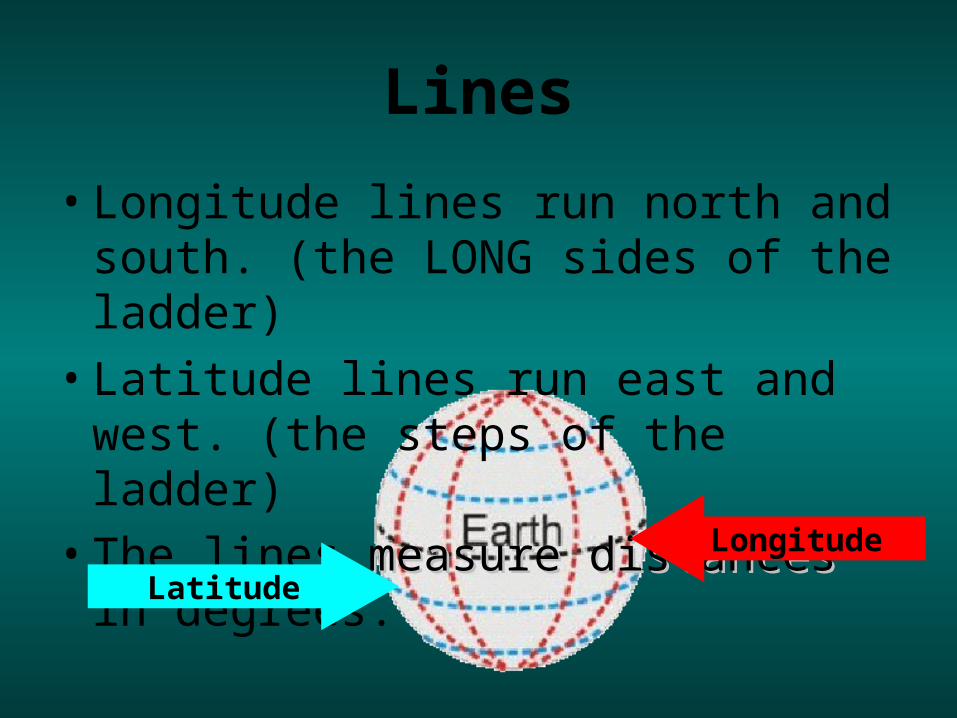
Lines
• Longitude lines run north and south. (the LONG sides of the ladder)
• Latitude lines run east and west. (the steps of the ladder)
• The lines measure distancesmeasure distances in degrees.
Longitude
Latitude
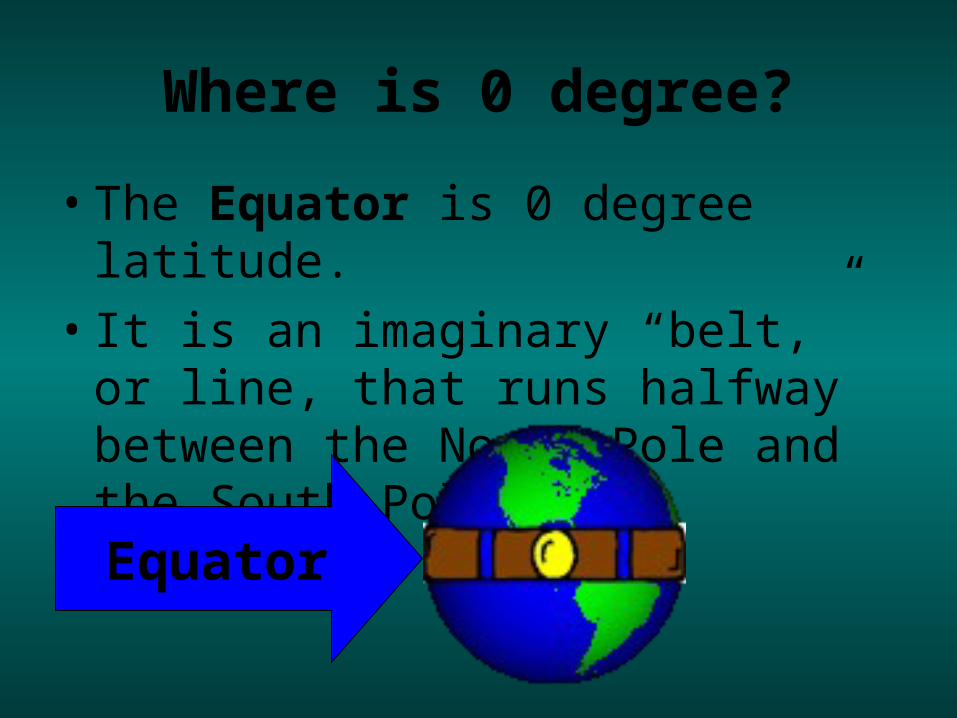
Where is 0 degree?
• The Equator is 0 degree latitude.
• It is an imaginary “belt,” or line, that runs halfway between the North Pole and the South Pole.
Equator

Where is 0 degree?
• The prime meridian is 0 degrees longitude. This imaginary line runs through England, France, Spain, western Africa, and Antarctica.
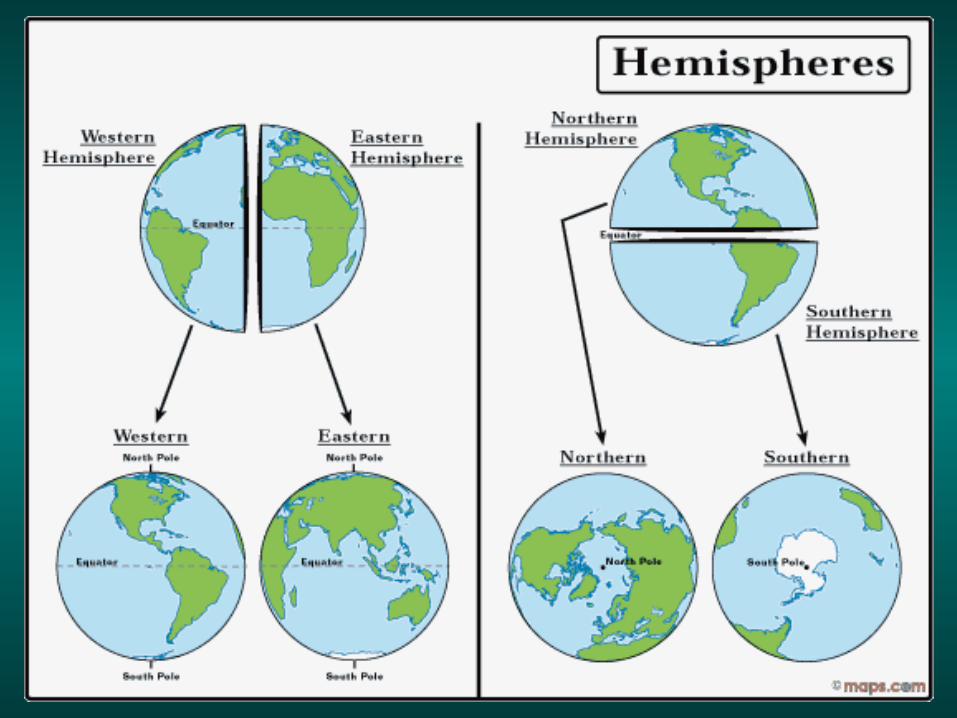
Hemispheres
• By using the Equator and Prime Meridian, we can divide the world into four hemispheres:
1. The Northern Hemisphere2. The Southern Hemisphere3. The Eastern Hemisphere4. The Western Hemisphere
Mapping Challenges

Topography
• The lay of the land.
• Shows relief using contour lines.– Relief- highs and lows of Earth’s surface.– Relief can be calculated
• Take the difference between the highest point and the lowest.
• Ex: Mountain peak 20 m. lake 10m– 20m- 10m= 10m– The relief of this area is 10m

Reading a topographic map- Contour Lines
• Lines on topographic maps.– Elevation- the distance something is above
sea level. Sea level= 0m or 0ft. – http://www.youtube.com/watch?v=
owwqUYx_o3k

Contiguous
• sharing a common border; touching.
• Ex: "the 48 contiguous states” of the US
The Problem of CartographyThe Problem of Cartography
Cartographers (Mapmakers)Cartographers (Mapmakers)•Gathering InformationGathering Information•Problem of DistortionProblem of Distortion
– Round world…flat paper– Distortion of…
• Area• Shape• Distance• Direction
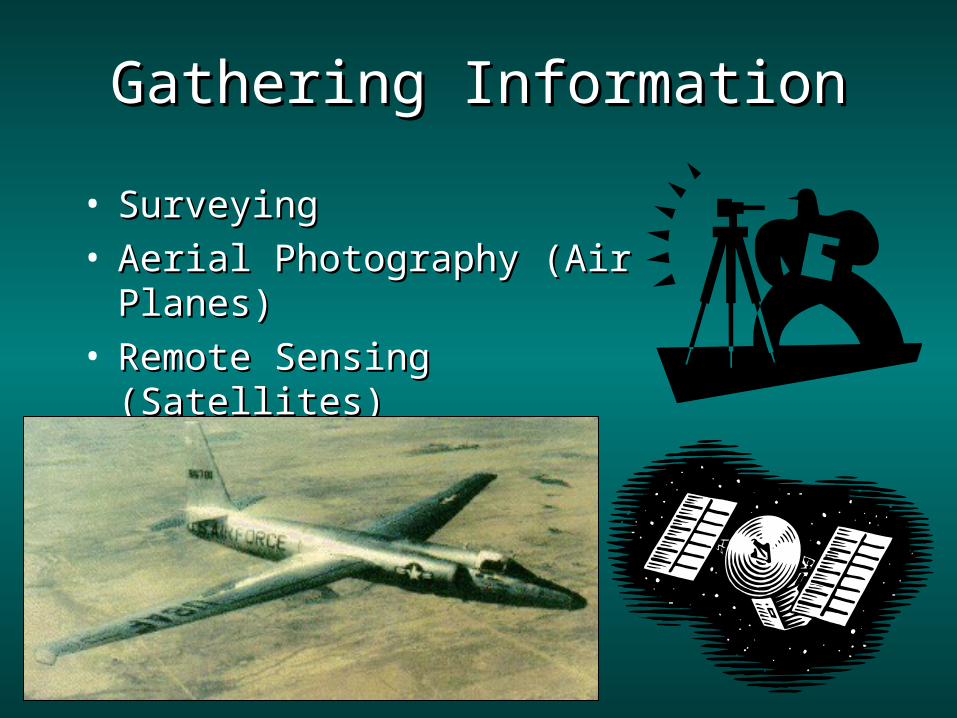
Gathering InformationGathering Information
• SurveyingSurveying• Aerial Photography (Air Planes)Aerial Photography (Air Planes)• Remote Sensing (Satellites)Remote Sensing (Satellites)
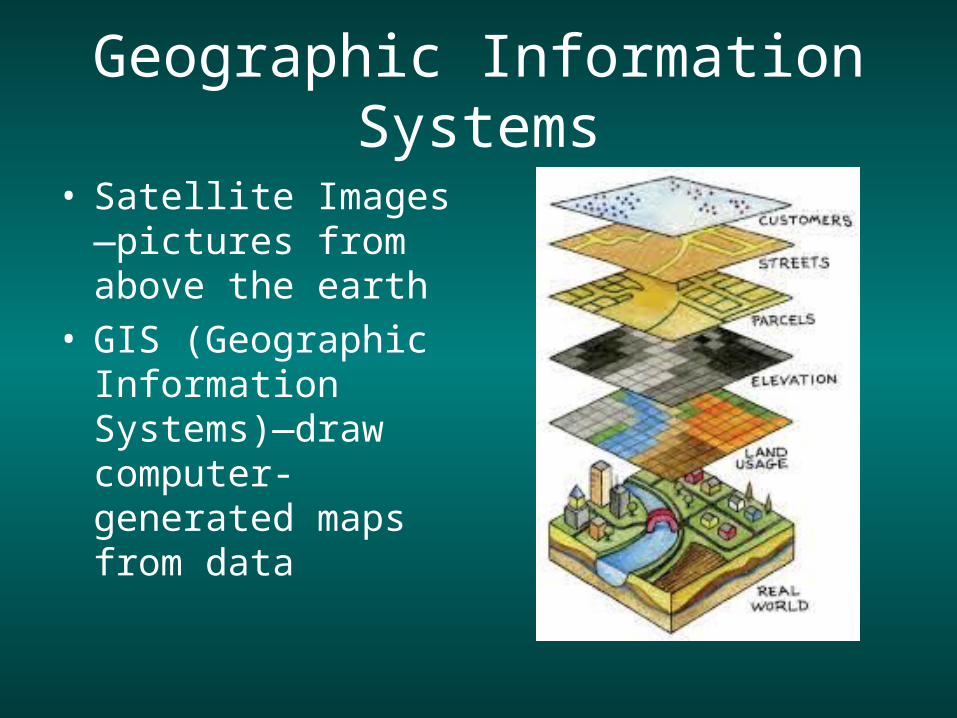
Geographic Information Systems
• Satellite Images—pictures from above the earth
• GIS (Geographic Information Systems)—draw computer-generated maps from data
Early Maps-No GIS
• Christopher Columbus’s Time—Americas had not been discovered, continents poorly shaped
• Today—satellite images aid in correcting shape, size, etc.
– GIS helps cartographers draw accurate maps
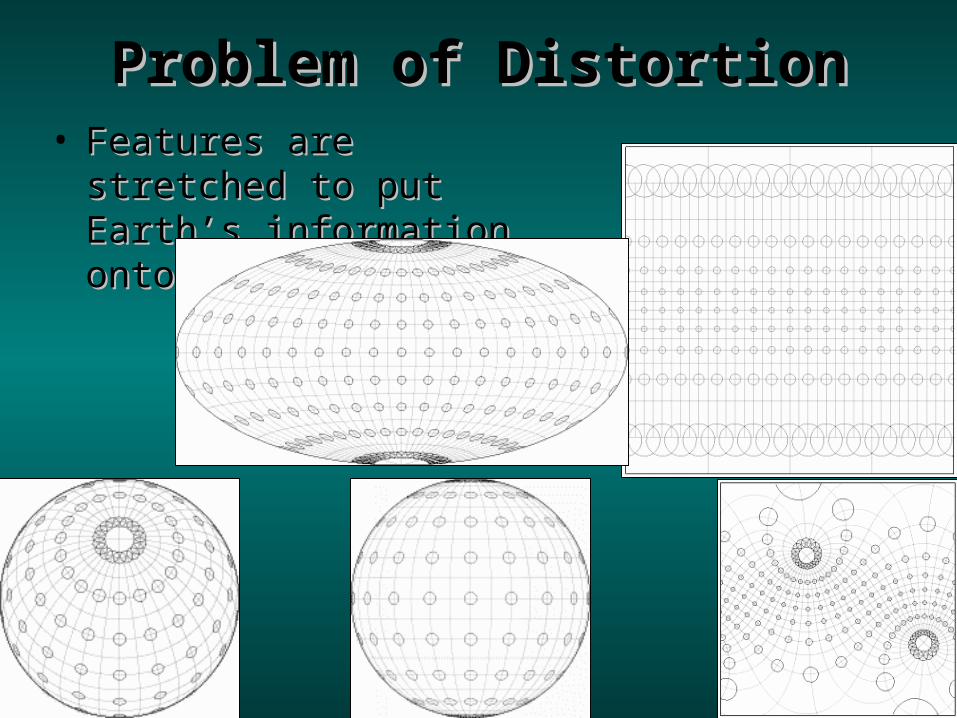
Problem of DistortionProblem of Distortion• Features are stretched to put Features are stretched to put
Earth’s information onto a Earth’s information onto a map.map.
Map PropertiesMap Properties
• No map can have all of the properties at No map can have all of the properties at onceonce
– Equal areasEqual areas
– ConformityConformity
– Consistent ScaleConsistent Scale
– True-Compass DirectionsTrue-Compass Directions
Points to RememberPoints to Remember
• The The projectionprojection one chooses to use one chooses to use depends depends on the on the informationinformation one wants. one wants.
• All Maps are projections All Maps are projections – they transfer – they transfer Earth’s features from the globe to a flat Earth’s features from the globe to a flat surface (map).surface (map).
• When When large areas large areas of Earth are mapped, of Earth are mapped, distortion is more seriousdistortion is more serious..
• When mapping When mapping small areas small areas like cities, like cities, distortion is not usually evidentdistortion is not usually evident..
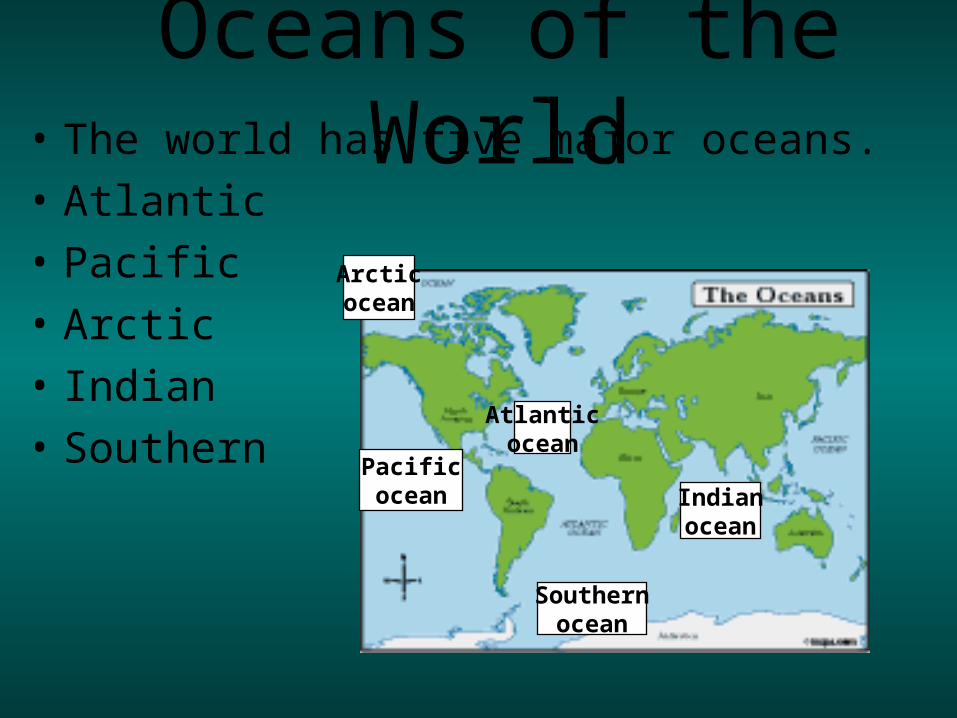
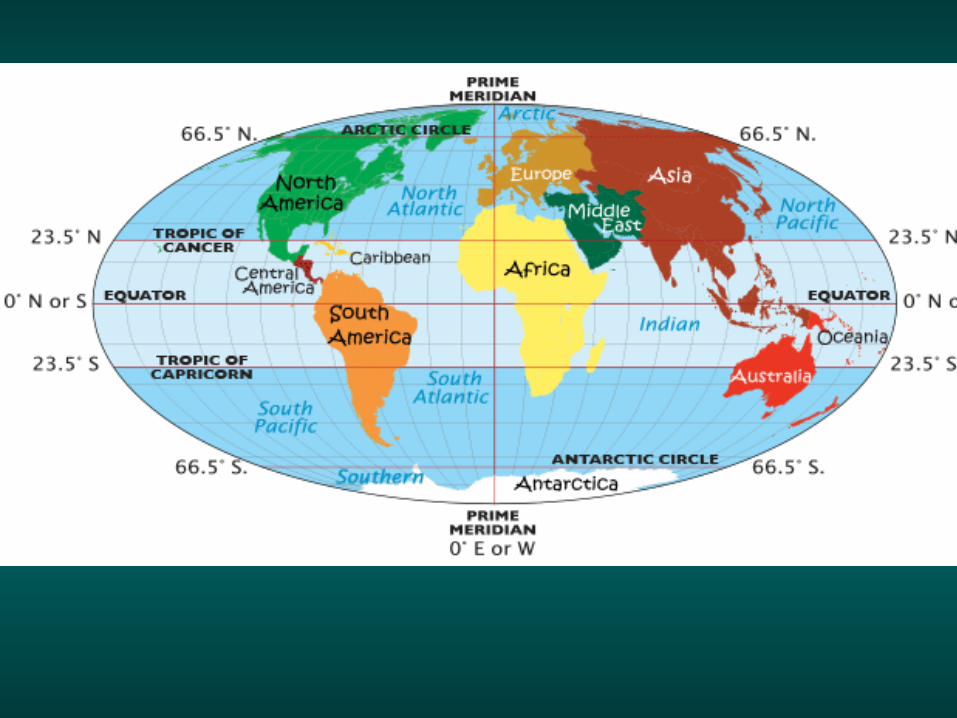
Oceans of the World• The world has five major oceans.
• Atlantic
• Pacific
• Arctic
• Indian
• Southern Pacificocean
Southernocean
Arcticocean
Indianocean
Atlanticocean

Southern Ocean
• Also known as the Antarctic Ocean
• Southernmost waters of the world ocean
• South of 60 degrees S Latitude
Recommended